Dell Precision 5690 iş istasyonu incelemesi: Yapay zeka devrimine hazır

Precision 5690, eski Raptor Lake-H CPU'ları entegre NPU'larla tamamlanan daha yeni Meteor Lake-H CPU'larla değiştirerek geçen yılki Precision 5680'in yerini alıyor. İki model de aynı ekran ve GPU seçenekleriyle birbirinin aynısıdır. Bizim kontrol etmenizi öneririz Precision 5680 hakkında inceleme serisinin XPS 16'dan ilham alan fiziksel özellikleri hakkında daha fazla bilgi edinmek için.
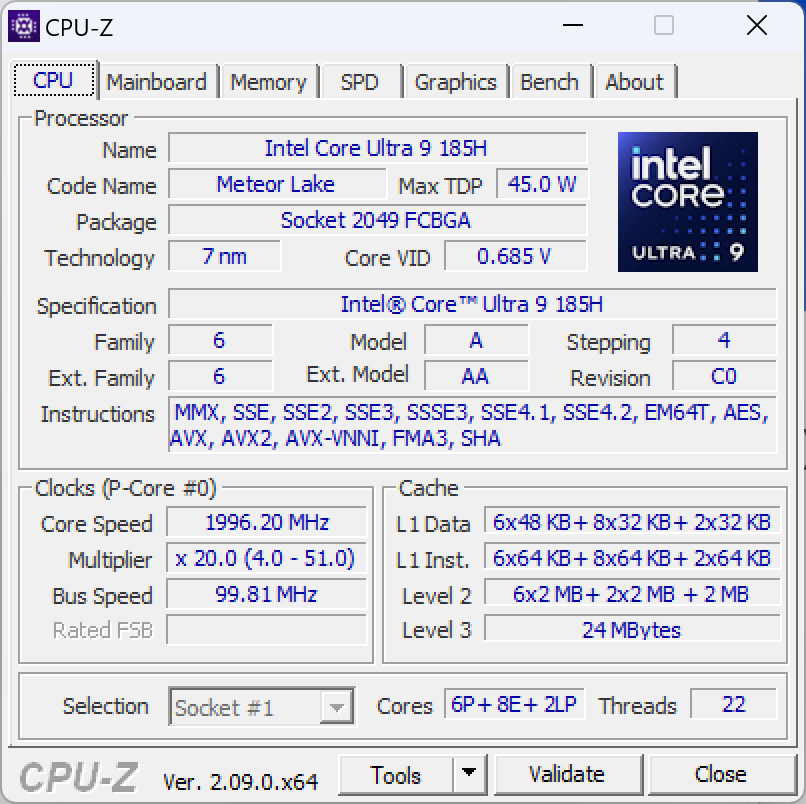
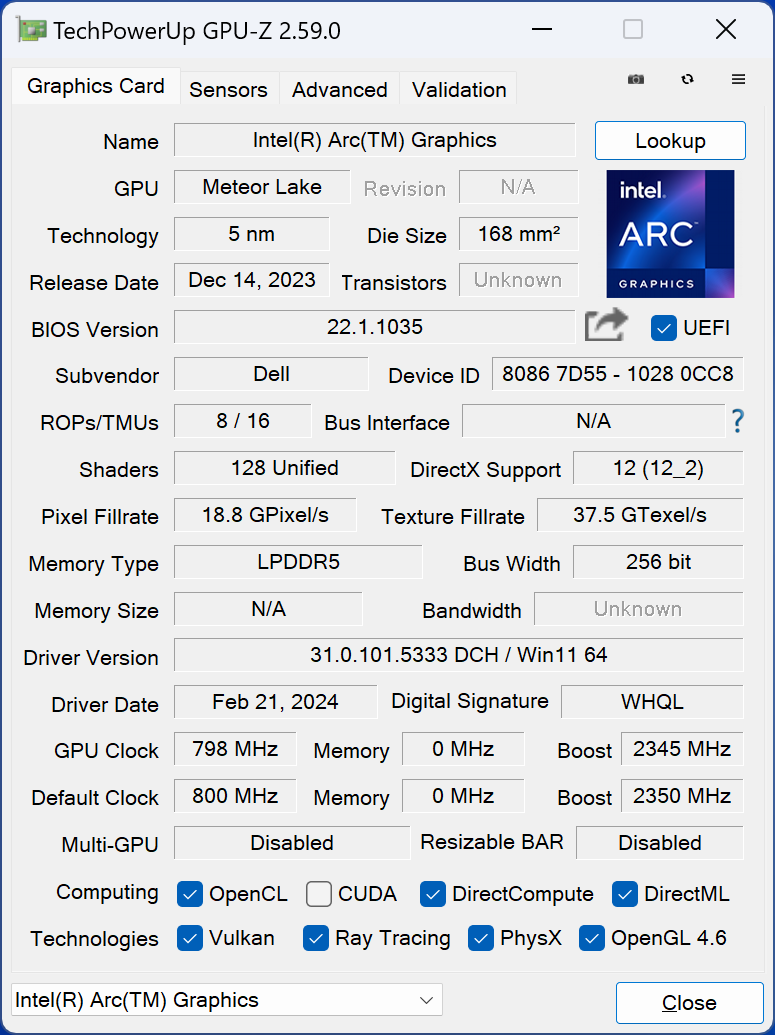
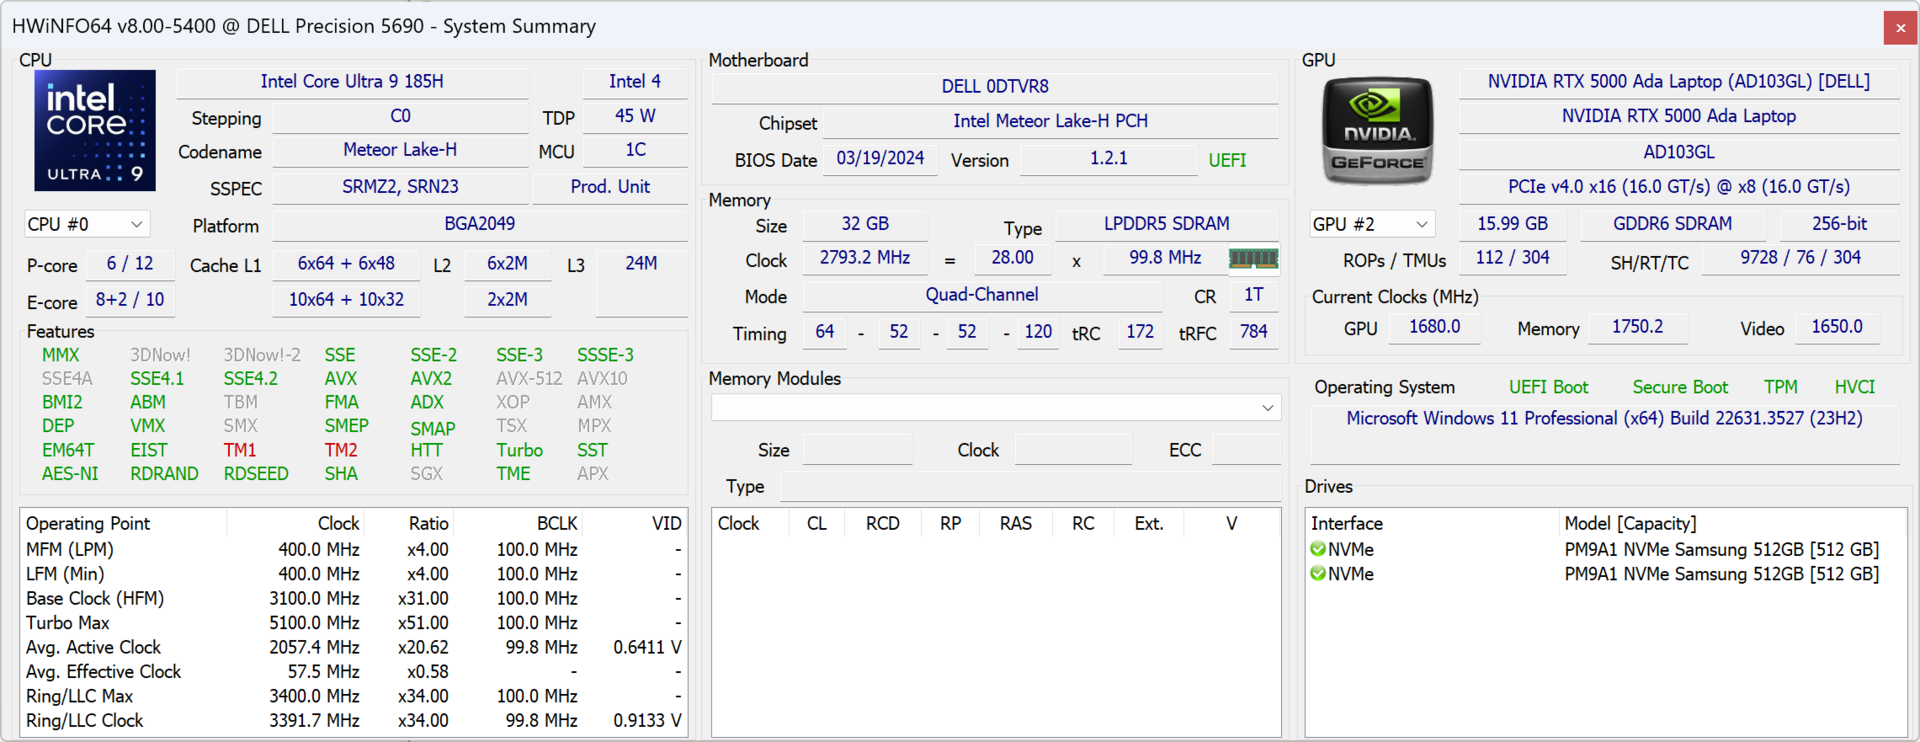
İnceleme birimimiz Core Ultra 9 185H vPro CPU, Nvidia 5000 Ada GPU ve 16 inç 2400p OLED dokunmatik ekrana sahip en üst düzey yapılandırma olup yaklaşık 5900 USD'dir. Daha düşük SKU'lar Core Ultra 5 135H vPro, yalnızca entegre Arc grafikler ve 1200p IPS ekran ile yalnızca 2300 $'a başlıyor.
Precision 5690'ın alternatifleri arasında aşağıdaki gibi diğer 16 inç iş istasyonları bulunmaktadır Lenovo ThinkPad P16 G2, HP ZBook Fury 16 G10veya MSI CreatorPro Z16P.
Daha fazla Dell yorumu:
Karşılaştırmalı olarak olası rakipler
Derecelendirme | Tarih | Modeli | Ağırlık | Yükseklik | Boyut | Çözünürlük | Fiyat |
|---|---|---|---|---|---|---|---|
| 88.3 % v7 (old) | 05/2024 | Dell Precision 5690 Ultra 9 185H, RTX 5000 Ada Generation Laptop | 2.3 kg | 22.17 mm | 16.00" | 3840x2400 | |
| 89 % v7 (old) | 09/2023 | Dell Precision 5000 5680 i9-13900H, RTX 5000 Ada Generation Laptop | 2.3 kg | 22.17 mm | 16.00" | 3840x2400 | |
| 90.2 % v7 (old) | 03/2024 | Lenovo ThinkPad P16 G2 21FA000FGE i7-13700HX, RTX 2000 Ada Generation Laptop | 3 kg | 30.23 mm | 16.00" | 2560x1600 | |
| 91.7 % v7 (old) | 10/2023 | Lenovo ThinkPad P1 G6-21FV000DGE i9-13900H, RTX 2000 Ada Generation Laptop | 1.9 kg | 17.5 mm | 16.00" | 2560x1600 | |
| 92.3 % v7 (old) | 09/2023 | HP ZBook Fury 16 G10 i9-13950HX, RTX 5000 Ada Generation Laptop | 2.6 kg | 28.5 mm | 16.00" | 3840x2400 | |
| 84.3 % v7 (old) | MSI CreatorPro Z16P B12UKST i7-12700H, RTX A3000 Laptop GPU | 2.4 kg | 19 mm | 16.00" | 2560x1600 |
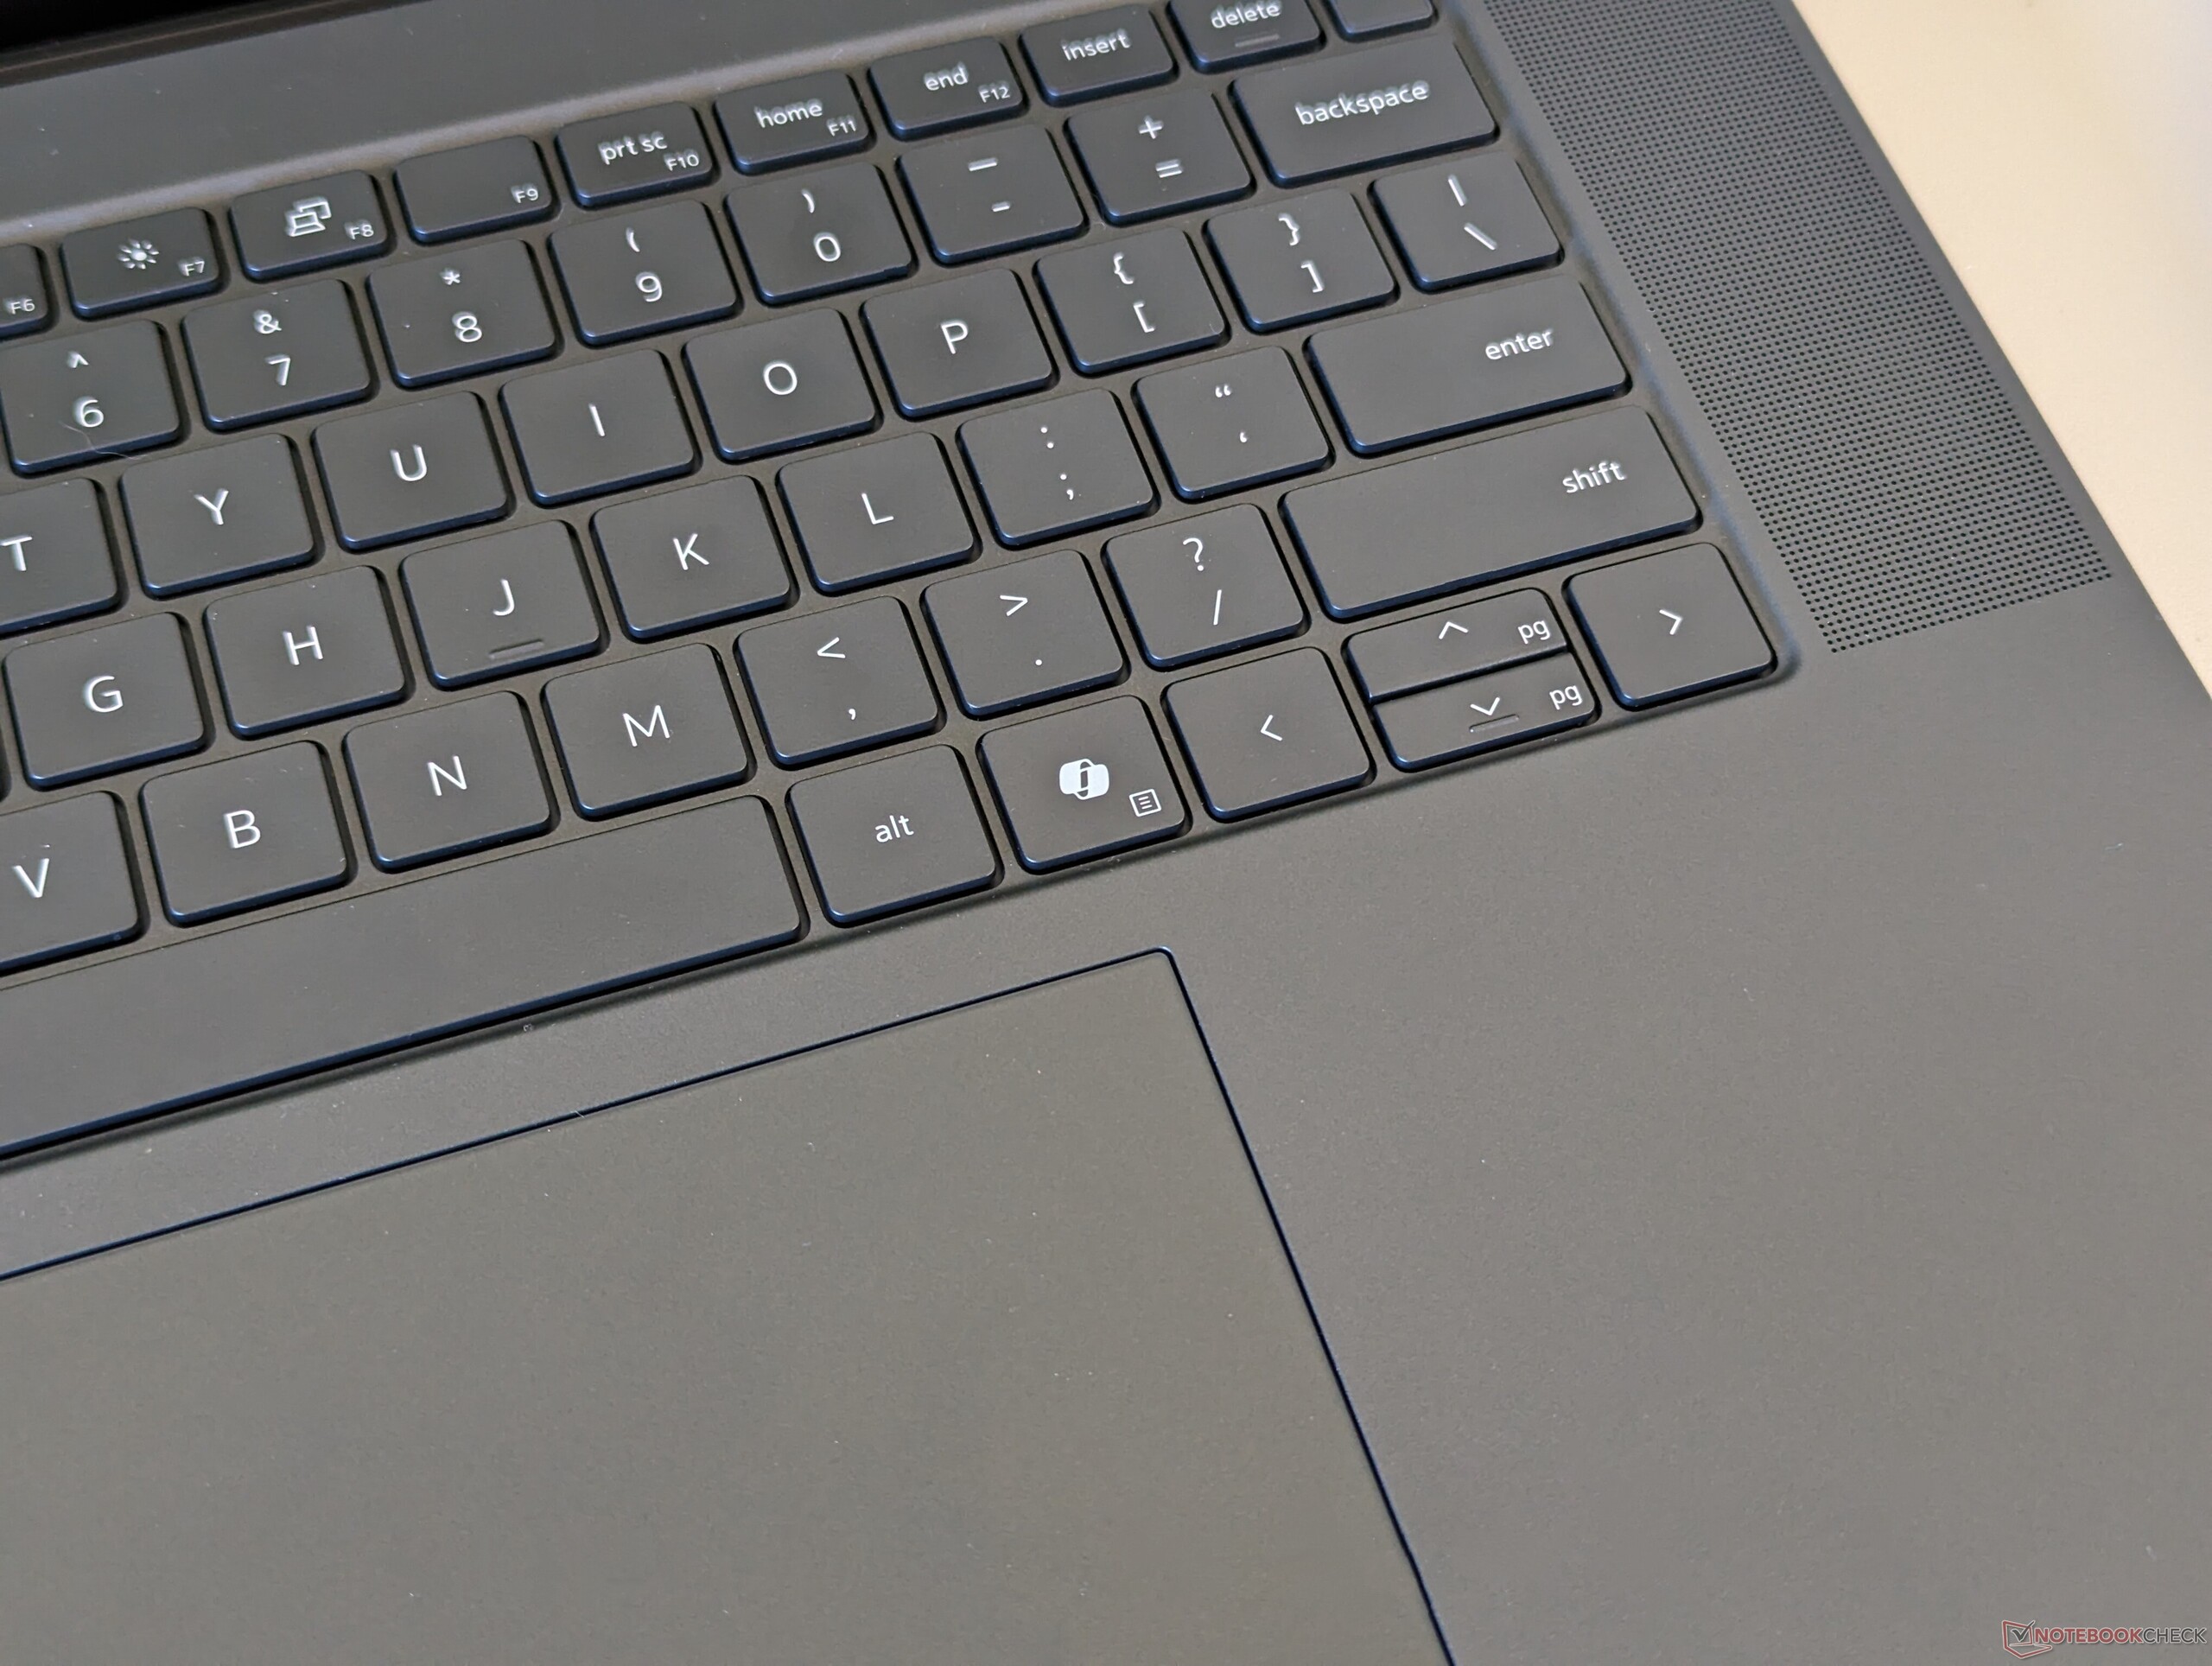
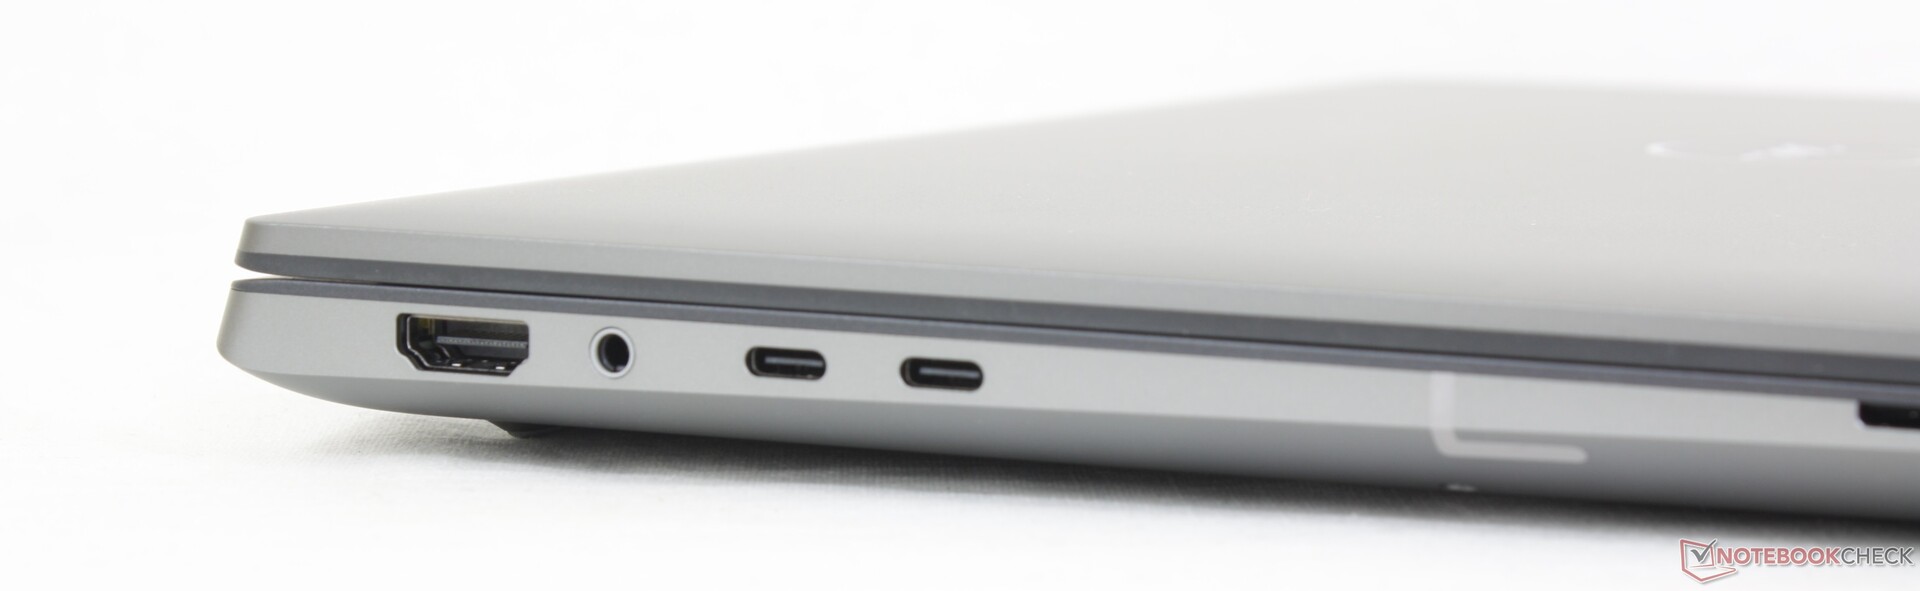
Kasa - XPS 16'dan Esinlenilmiştir
Klavye artık Precision 5690'ı 5680'den görsel olarak ayırmak için sağ Ctrl tuşunun yerine özel bir Microsoft Co-Pilot tuşu entegre ediyor.
Bağlanabilirlik
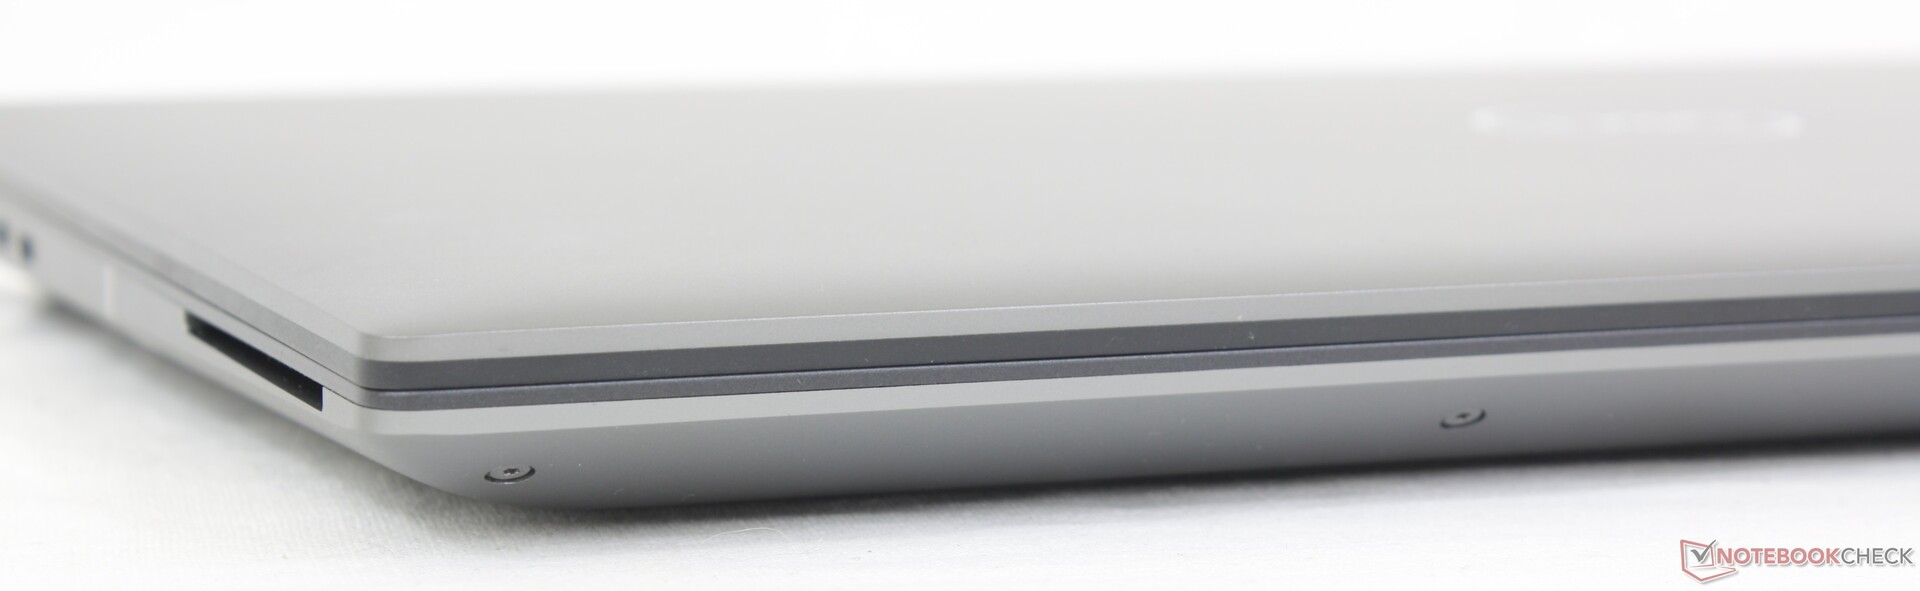
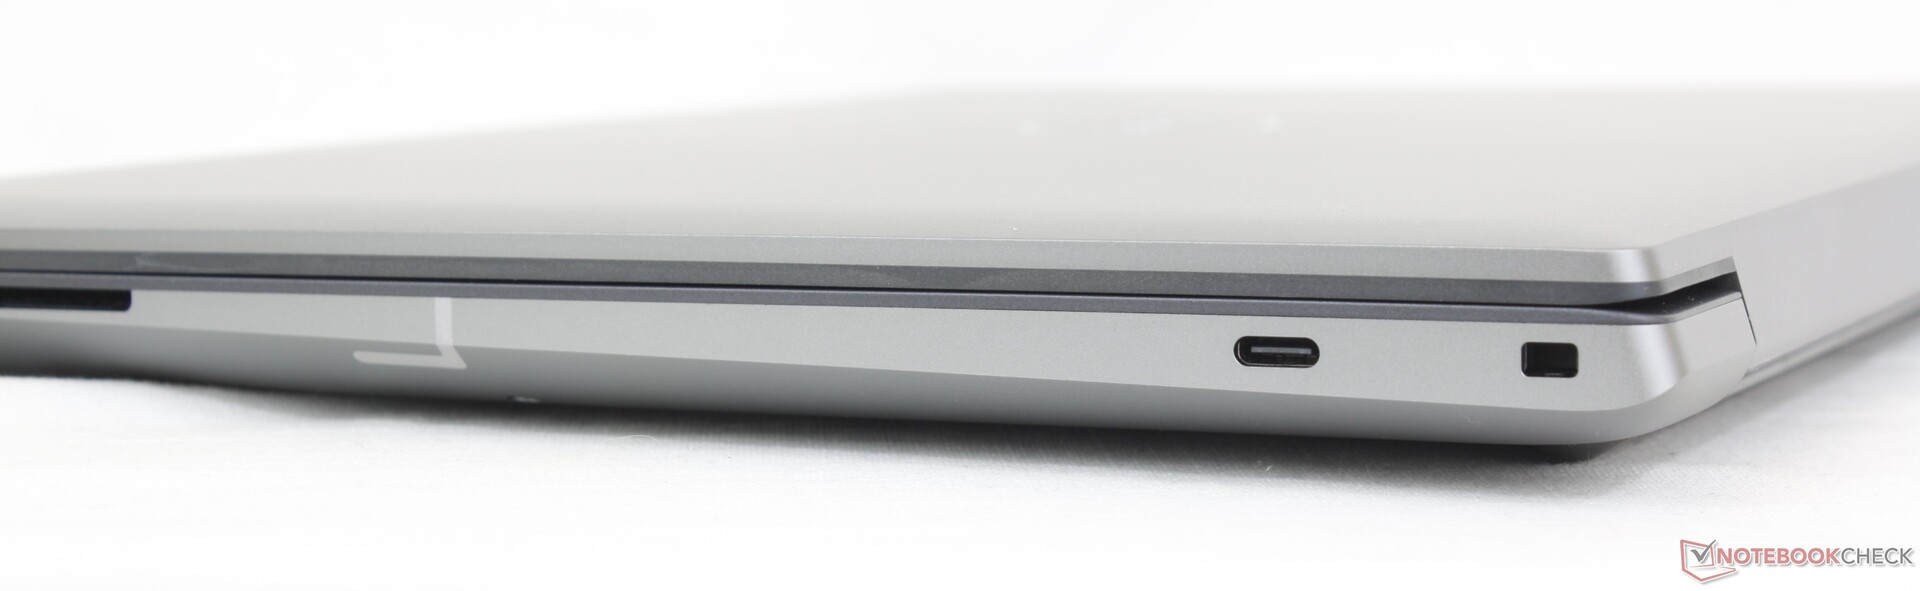
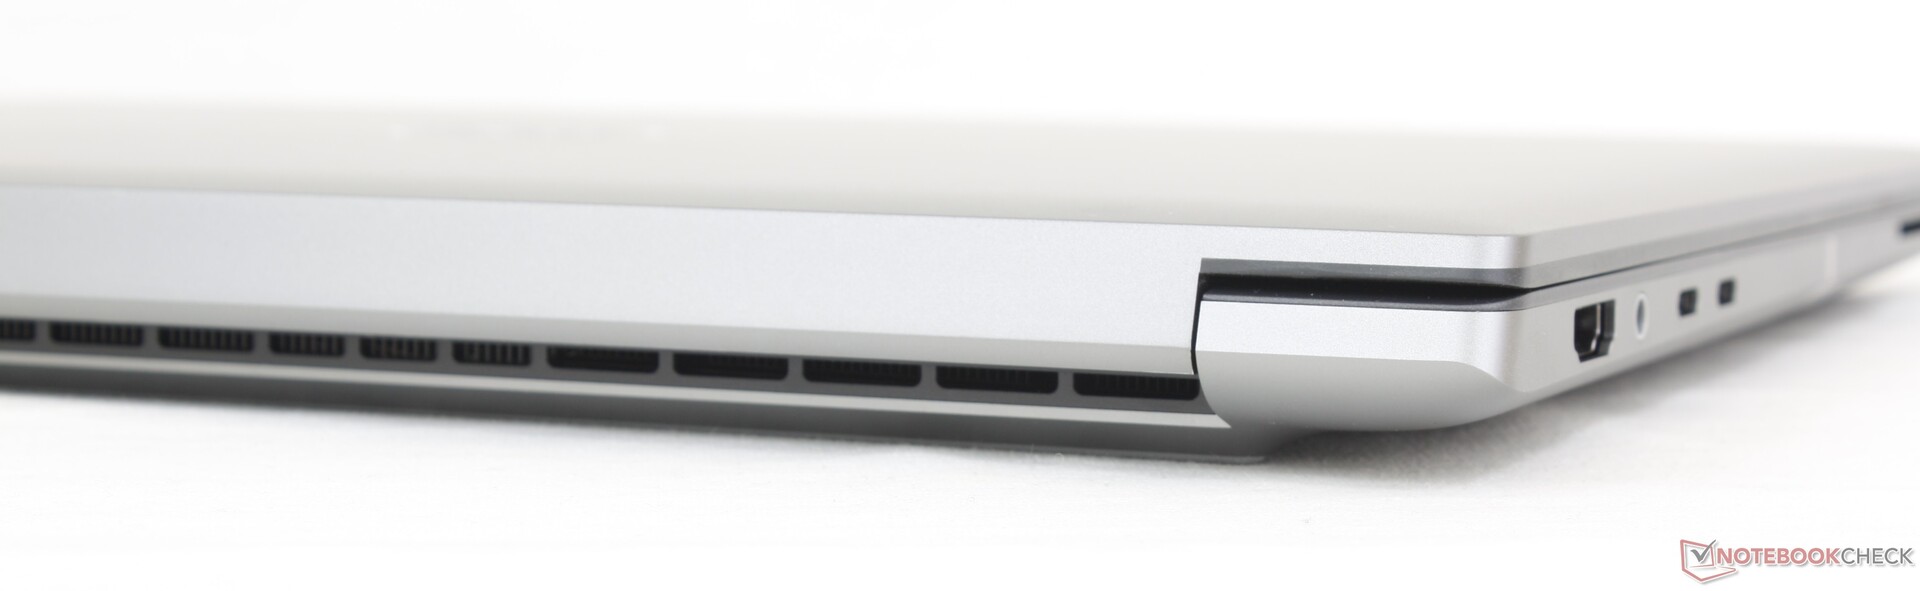
İletişim
WLAN, Wi-Fi 7 bağlantısını desteklemek için Intel AX211'den Intel BE200'e yükseltilmiştir. Bununla birlikte, kullanıcıların büyük çoğunluğu hala Wi-Fi 6E veya daha eski ağlarla sınırlıdır ve bu nedenle çoğu şimdilik herhangi bir performans avantajı fark etmeyecektir.
| Networking | |
| iperf3 transmit AXE11000 | |
| Lenovo ThinkPad P1 G6-21FV000DGE | |
| HP ZBook Fury 16 G10 | |
| Dell Precision 5000 5680 | |
| Dell Precision 5690 | |
| Lenovo ThinkPad P16 G2 21FA000FGE | |
| iperf3 receive AXE11000 | |
| Lenovo ThinkPad P1 G6-21FV000DGE | |
| Lenovo ThinkPad P16 G2 21FA000FGE | |
| Dell Precision 5690 | |
| HP ZBook Fury 16 G10 | |
| Dell Precision 5000 5680 | |
| iperf3 transmit AXE11000 6GHz | |
| MSI CreatorPro Z16P B12UKST | |
| HP ZBook Fury 16 G10 | |
| Dell Precision 5000 5680 | |
| Dell Precision 5690 | |
| Lenovo ThinkPad P16 G2 21FA000FGE | |
| iperf3 receive AXE11000 6GHz | |
| Lenovo ThinkPad P16 G2 21FA000FGE | |
| MSI CreatorPro Z16P B12UKST | |
| Dell Precision 5690 | |
| HP ZBook Fury 16 G10 | |
| Dell Precision 5000 5680 | |
Web kamerası

")
")
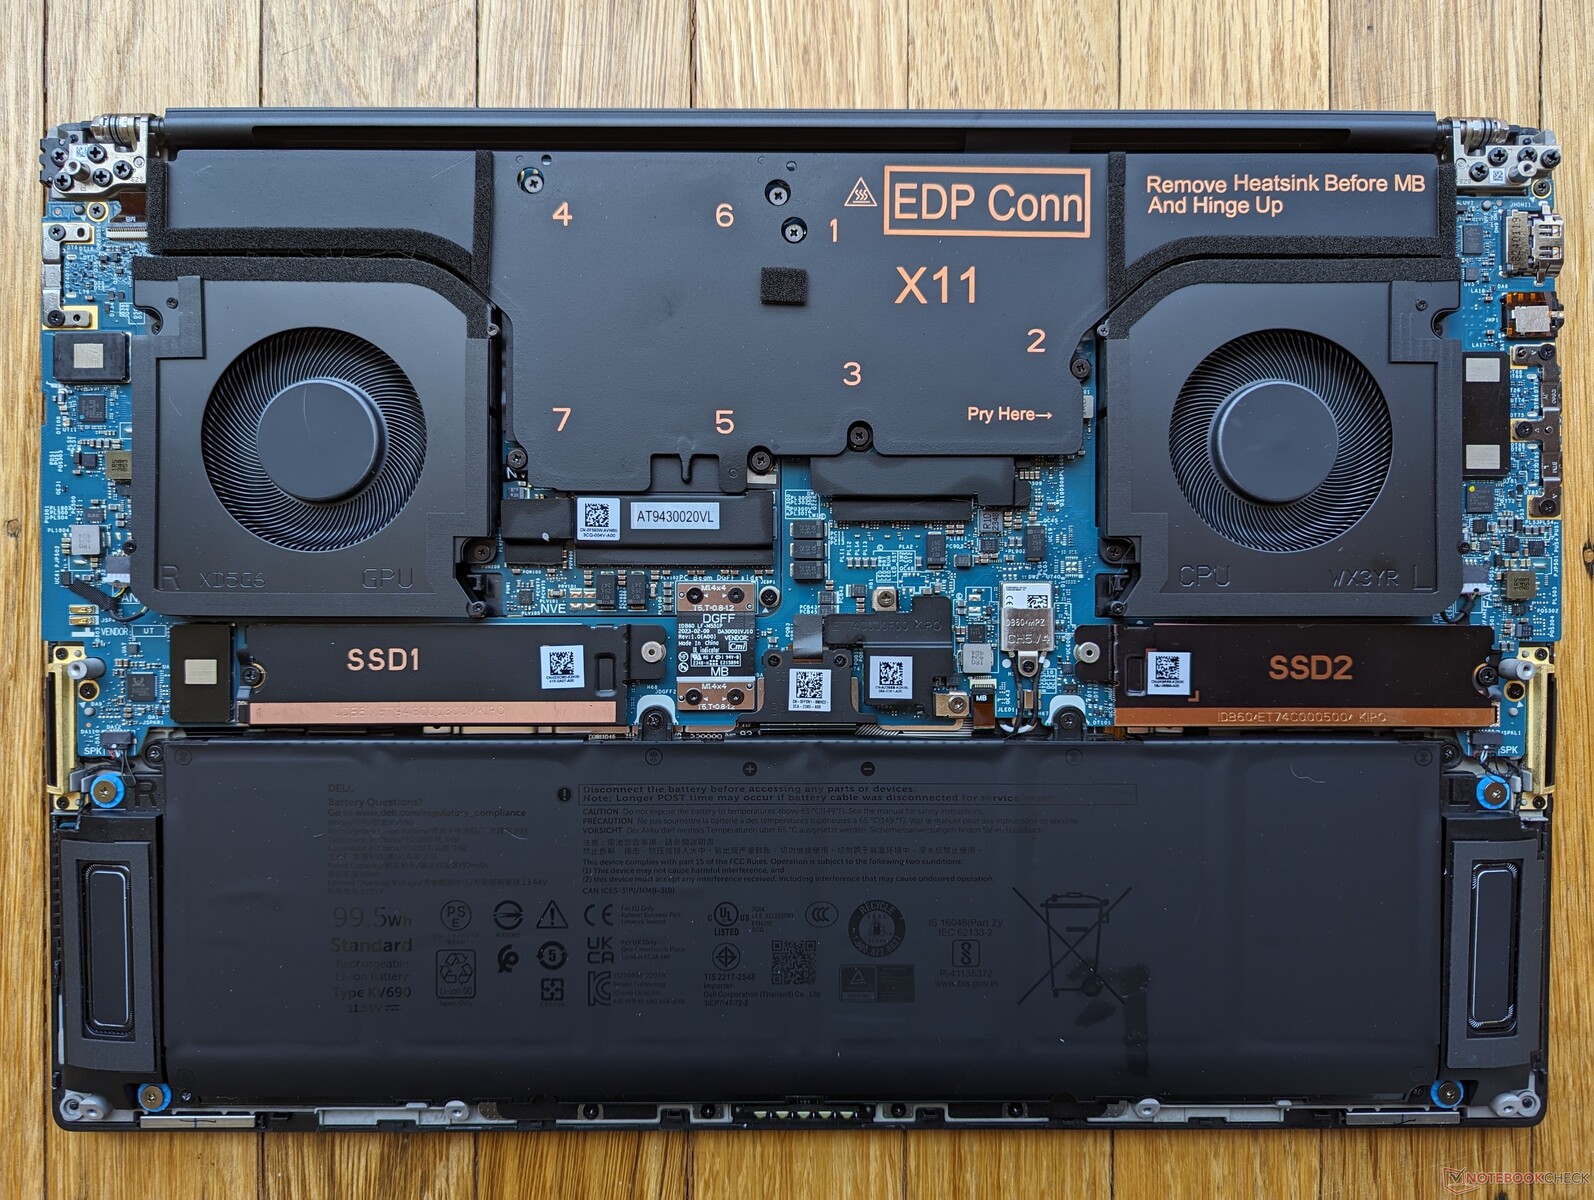
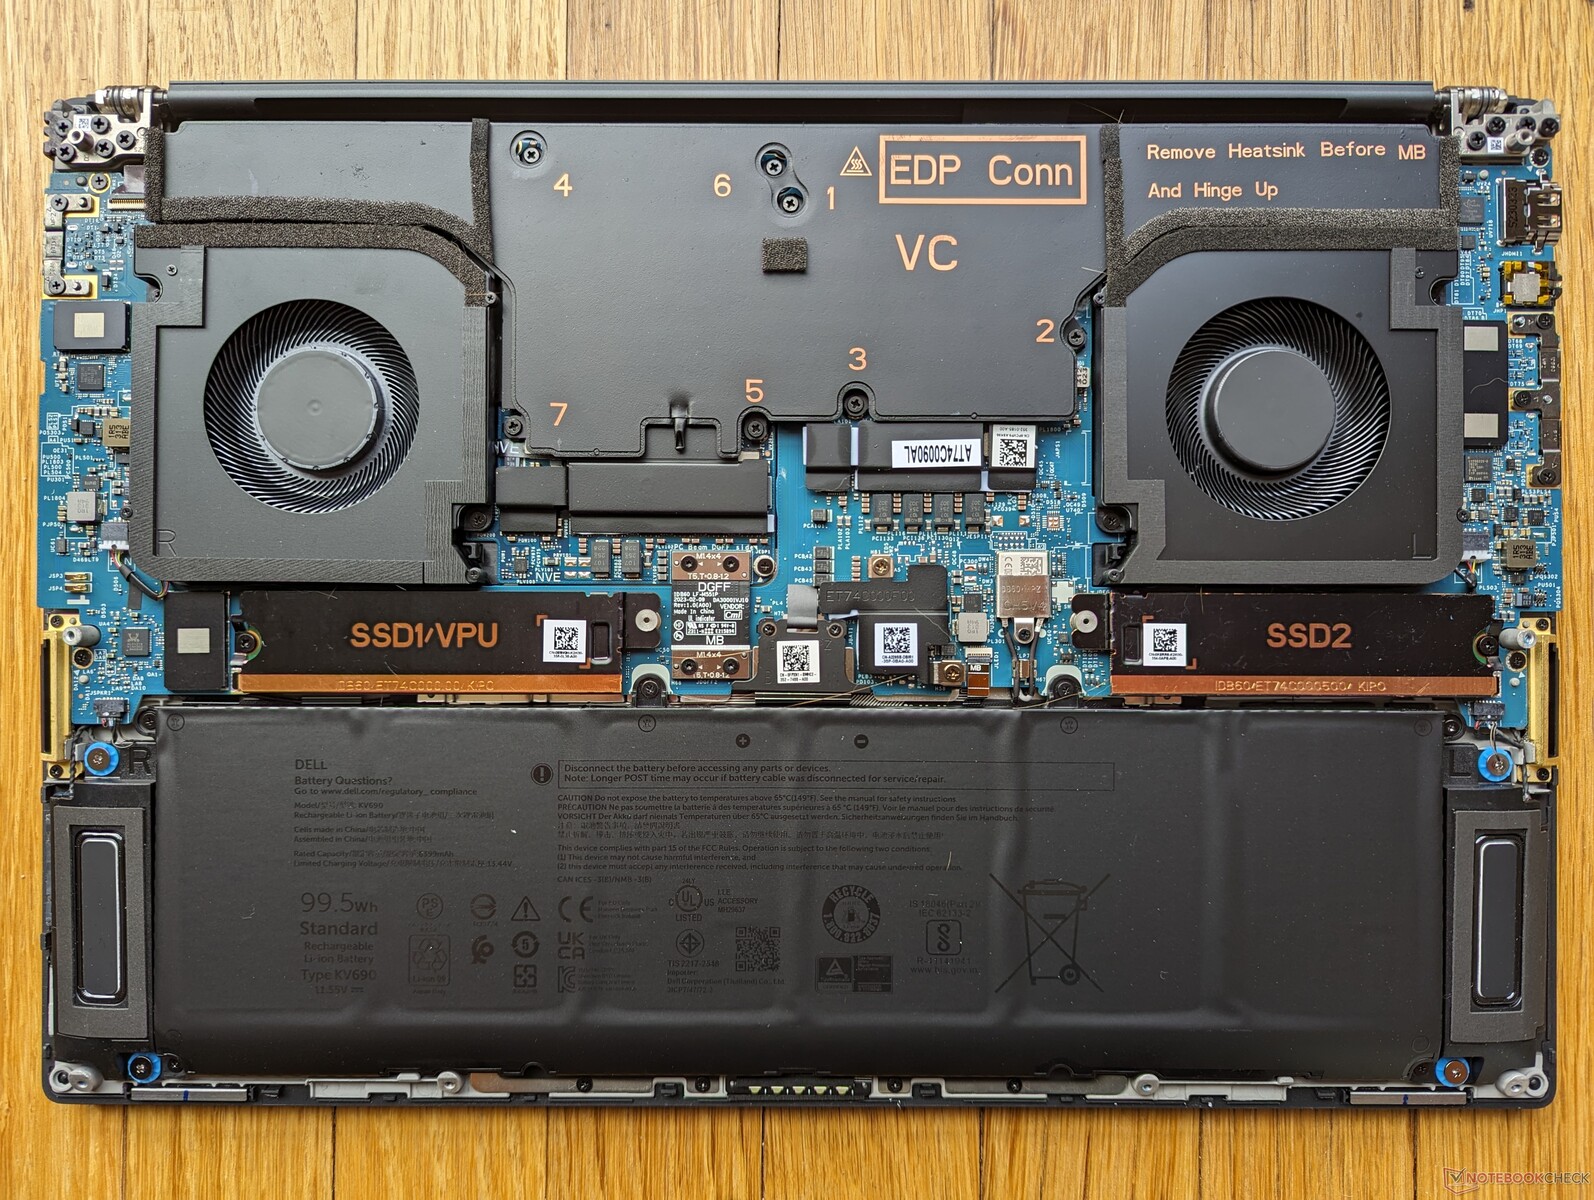
Bakım
Precision 5690 ile eski 5680 arasında kayda değer bir dahili fark yoktur.
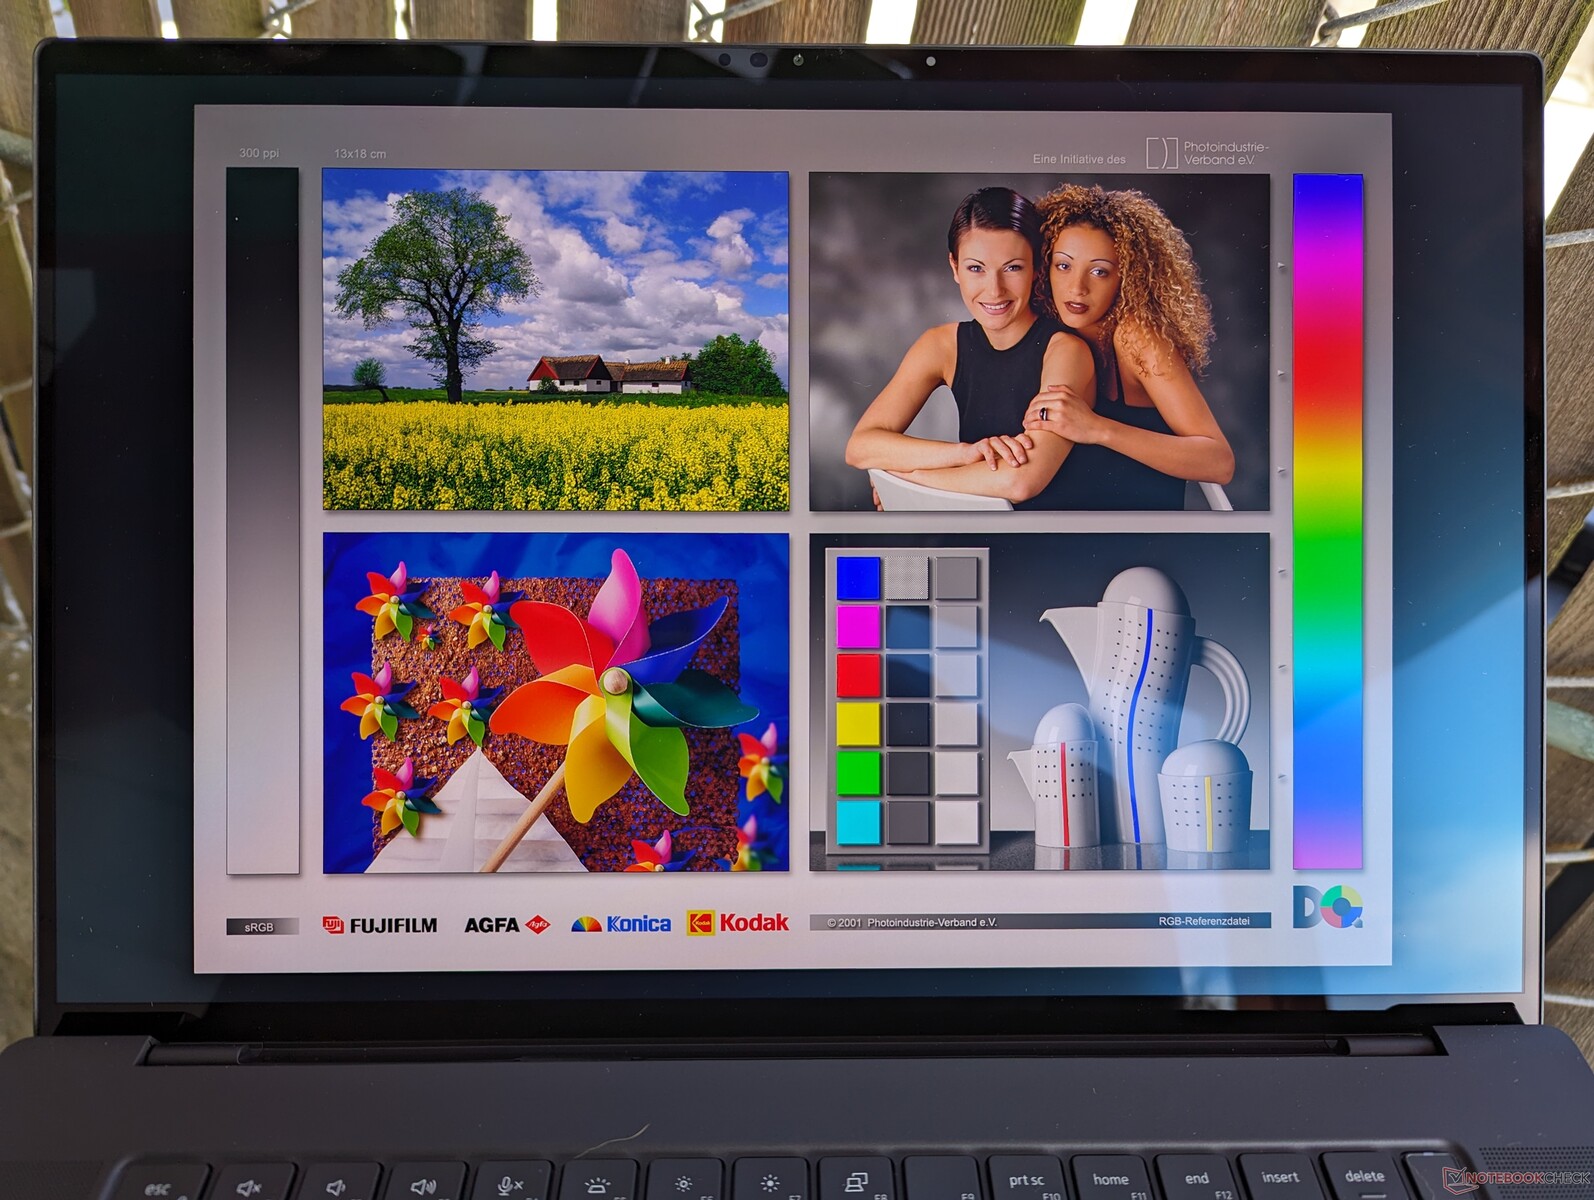
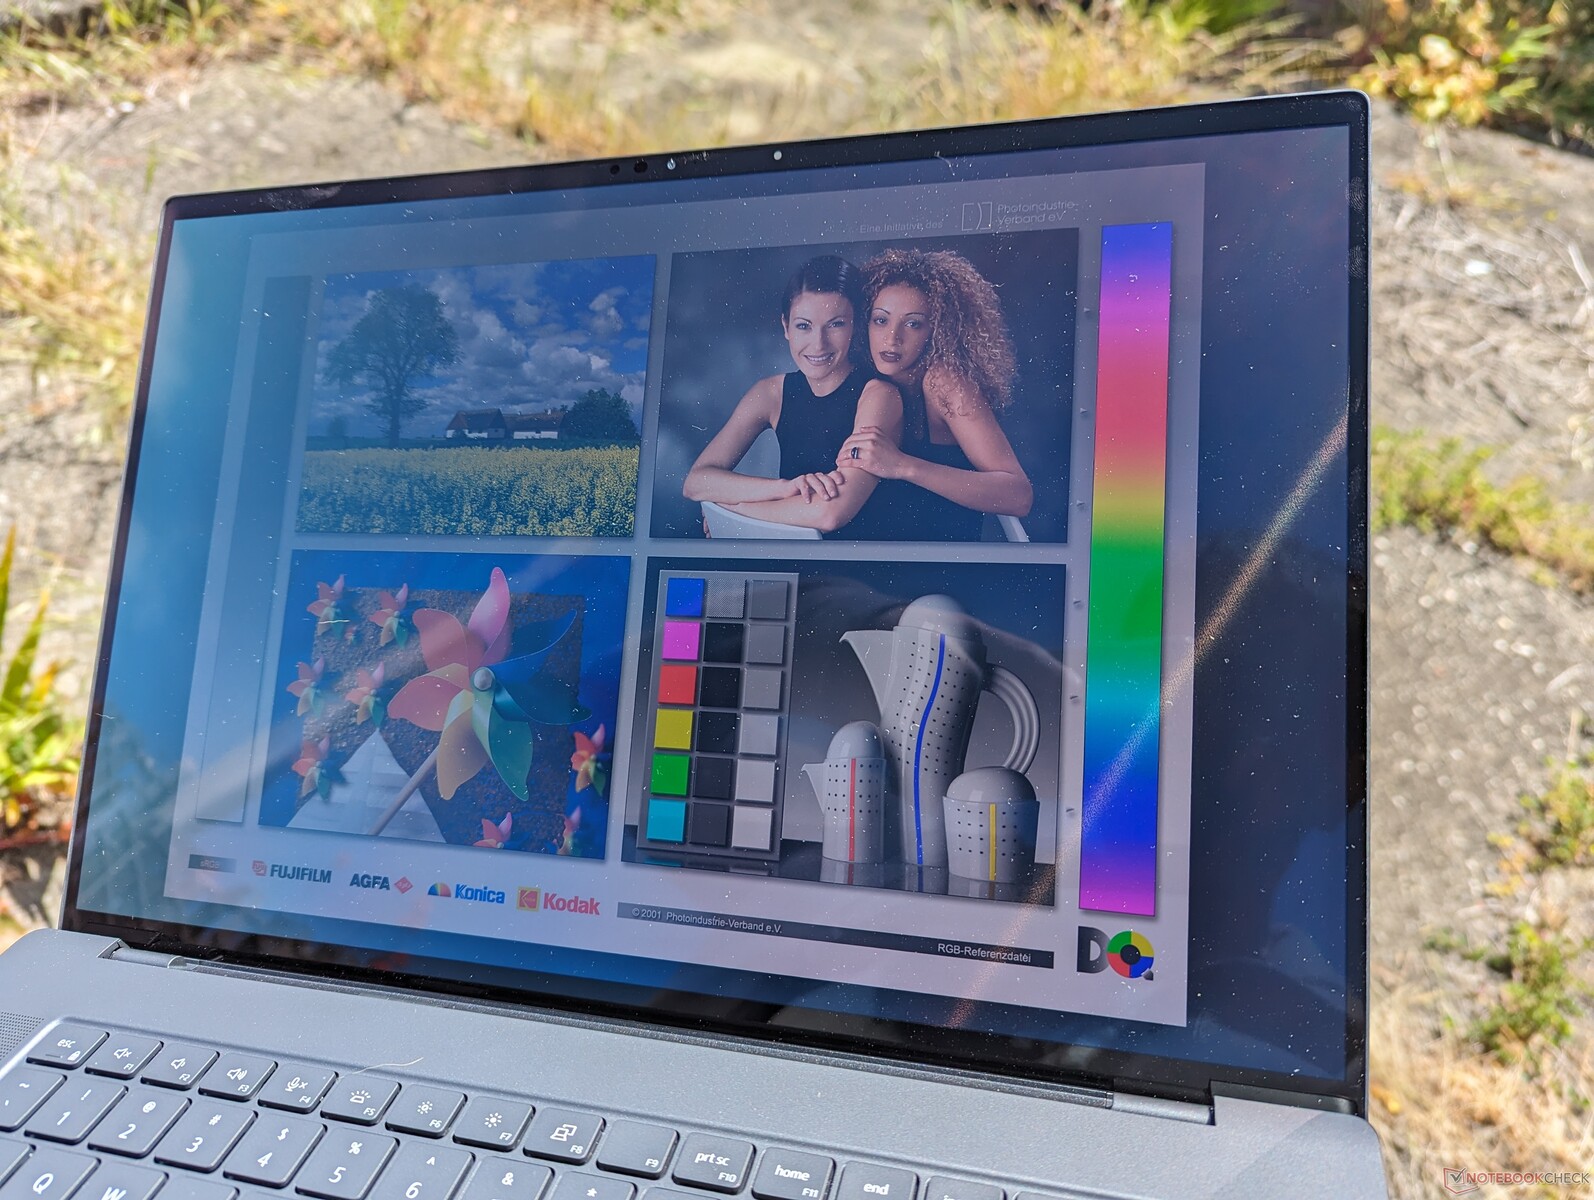
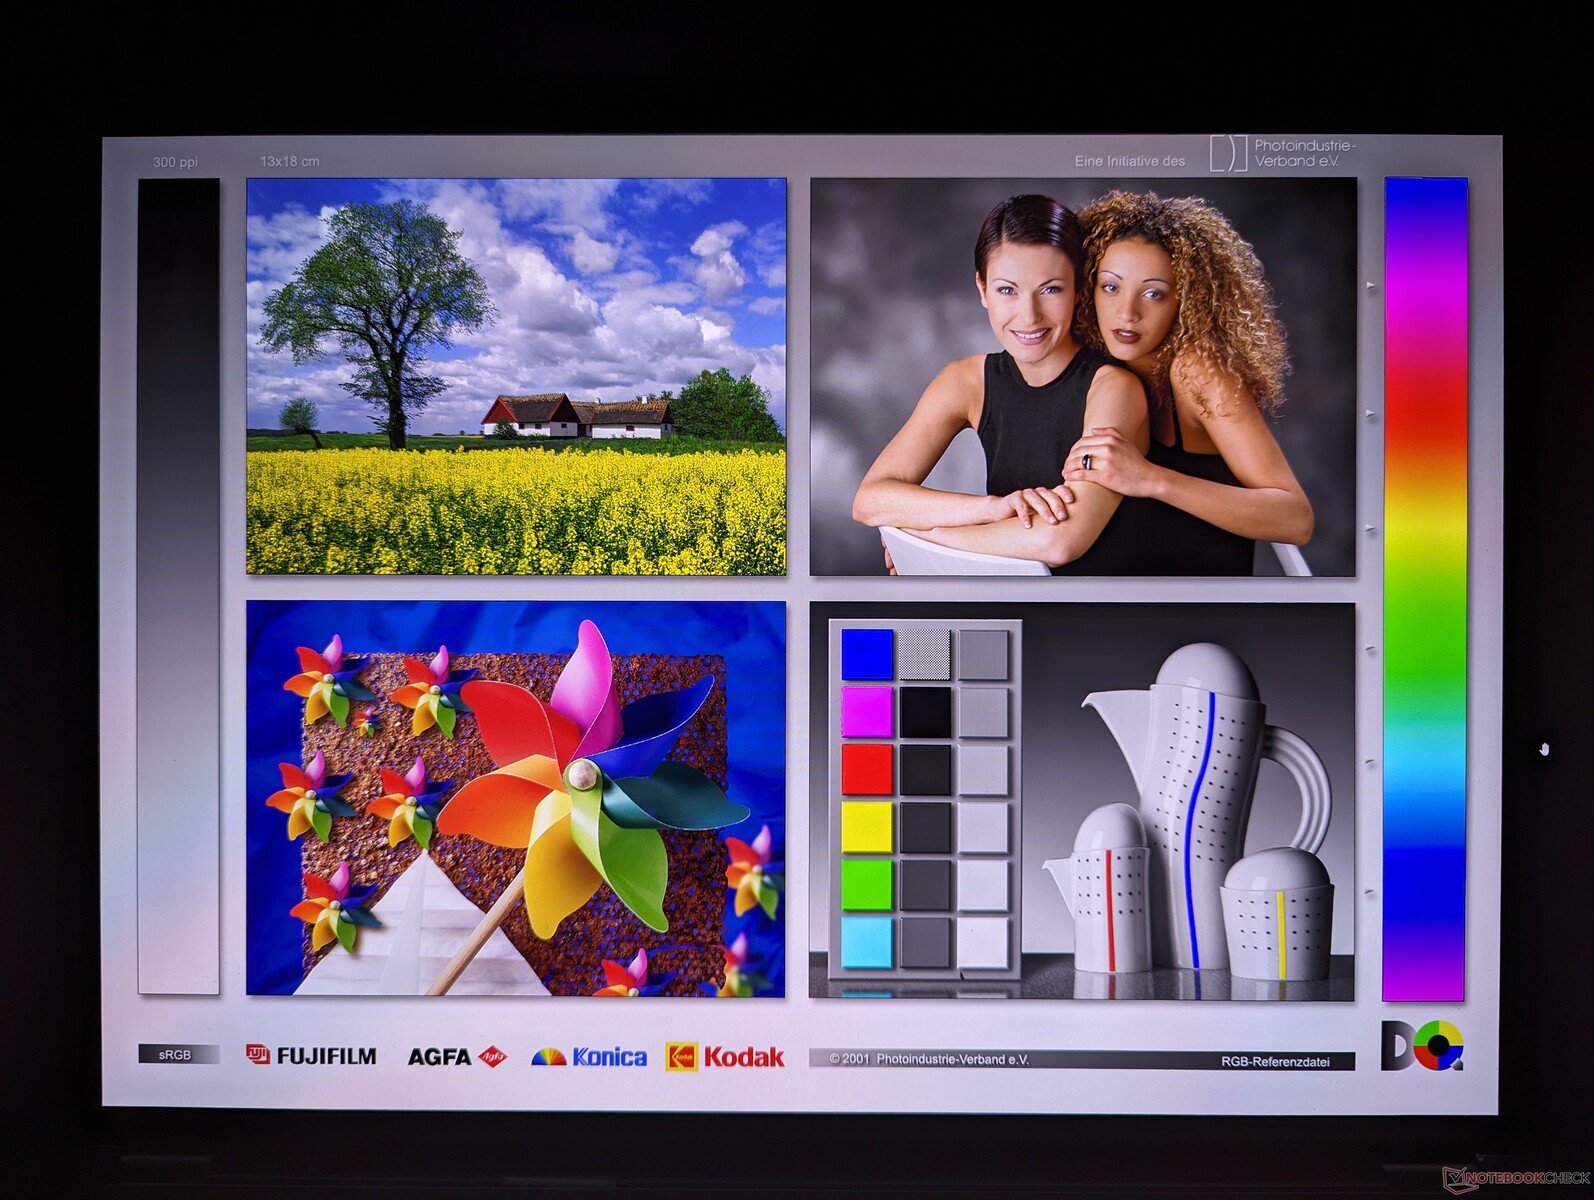
Ekran - 60 Hz'de HDR OLED
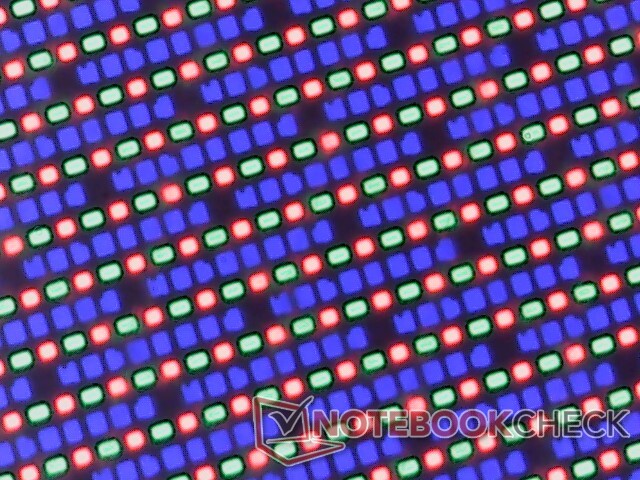
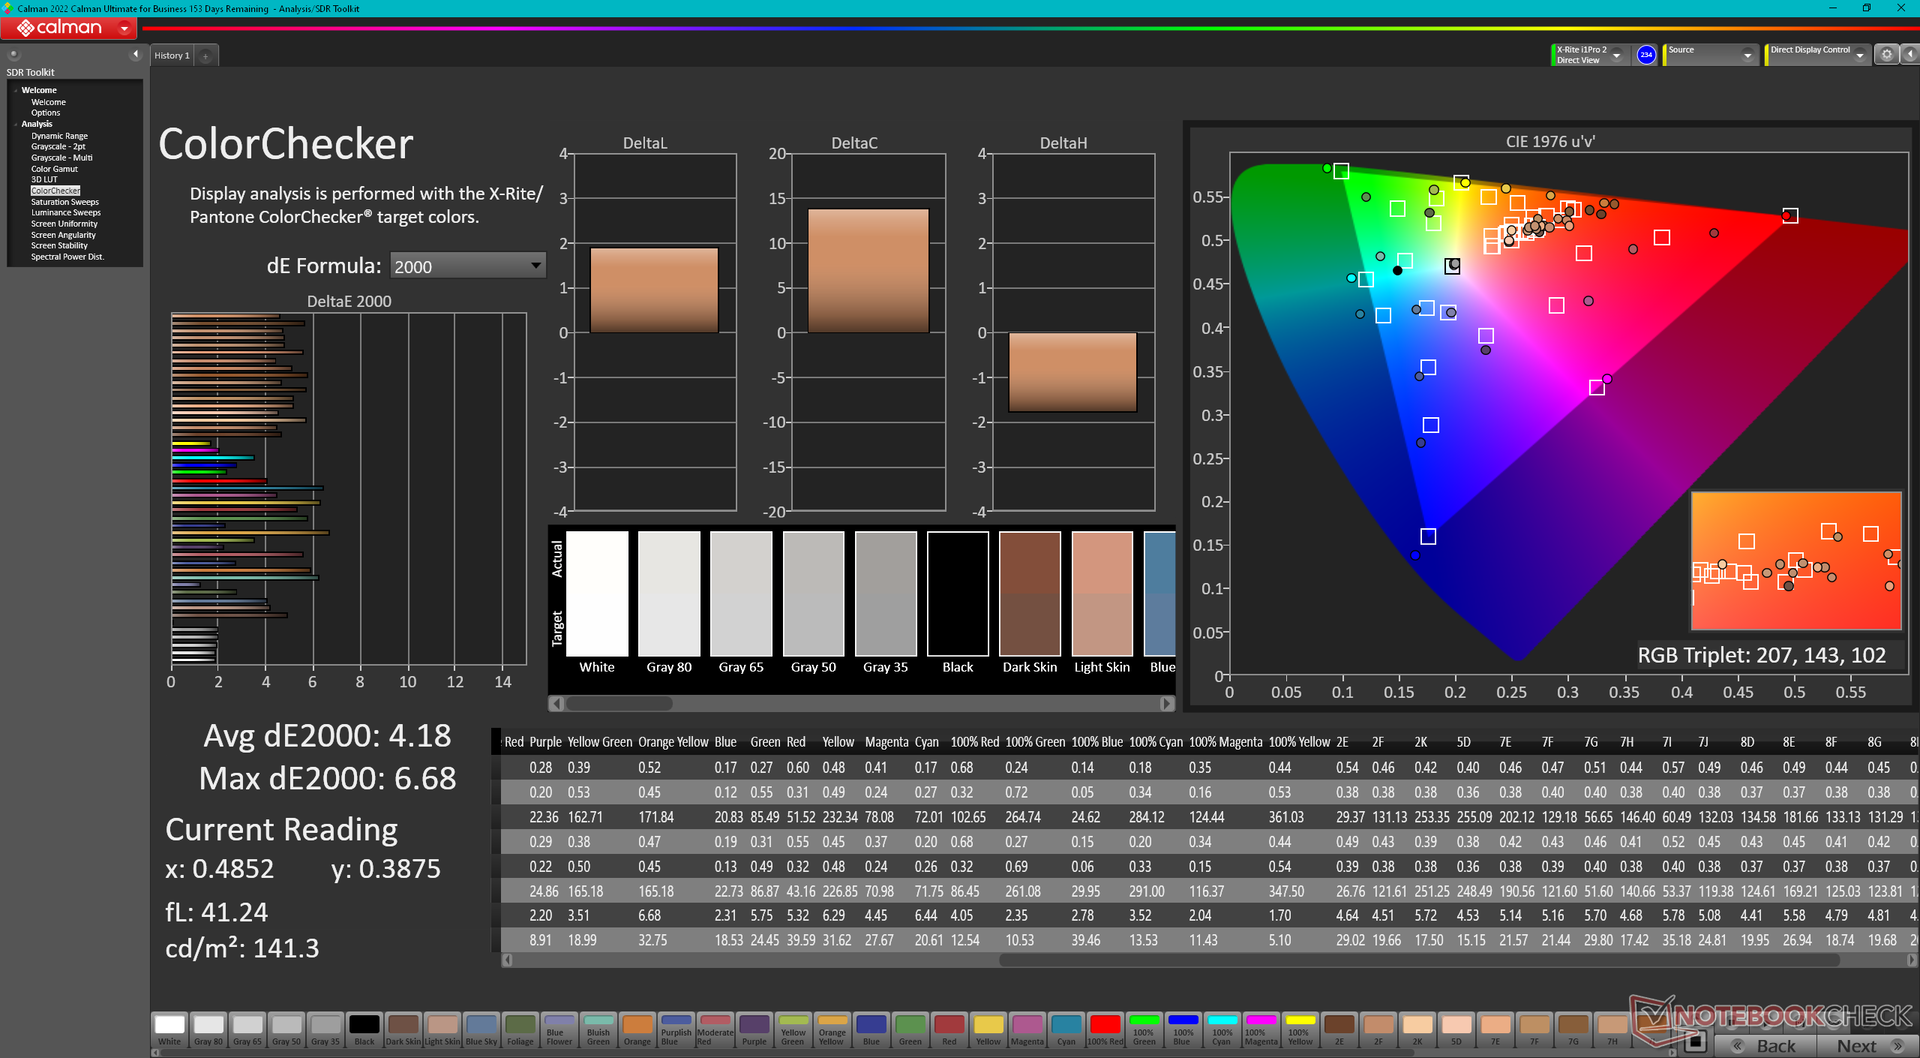
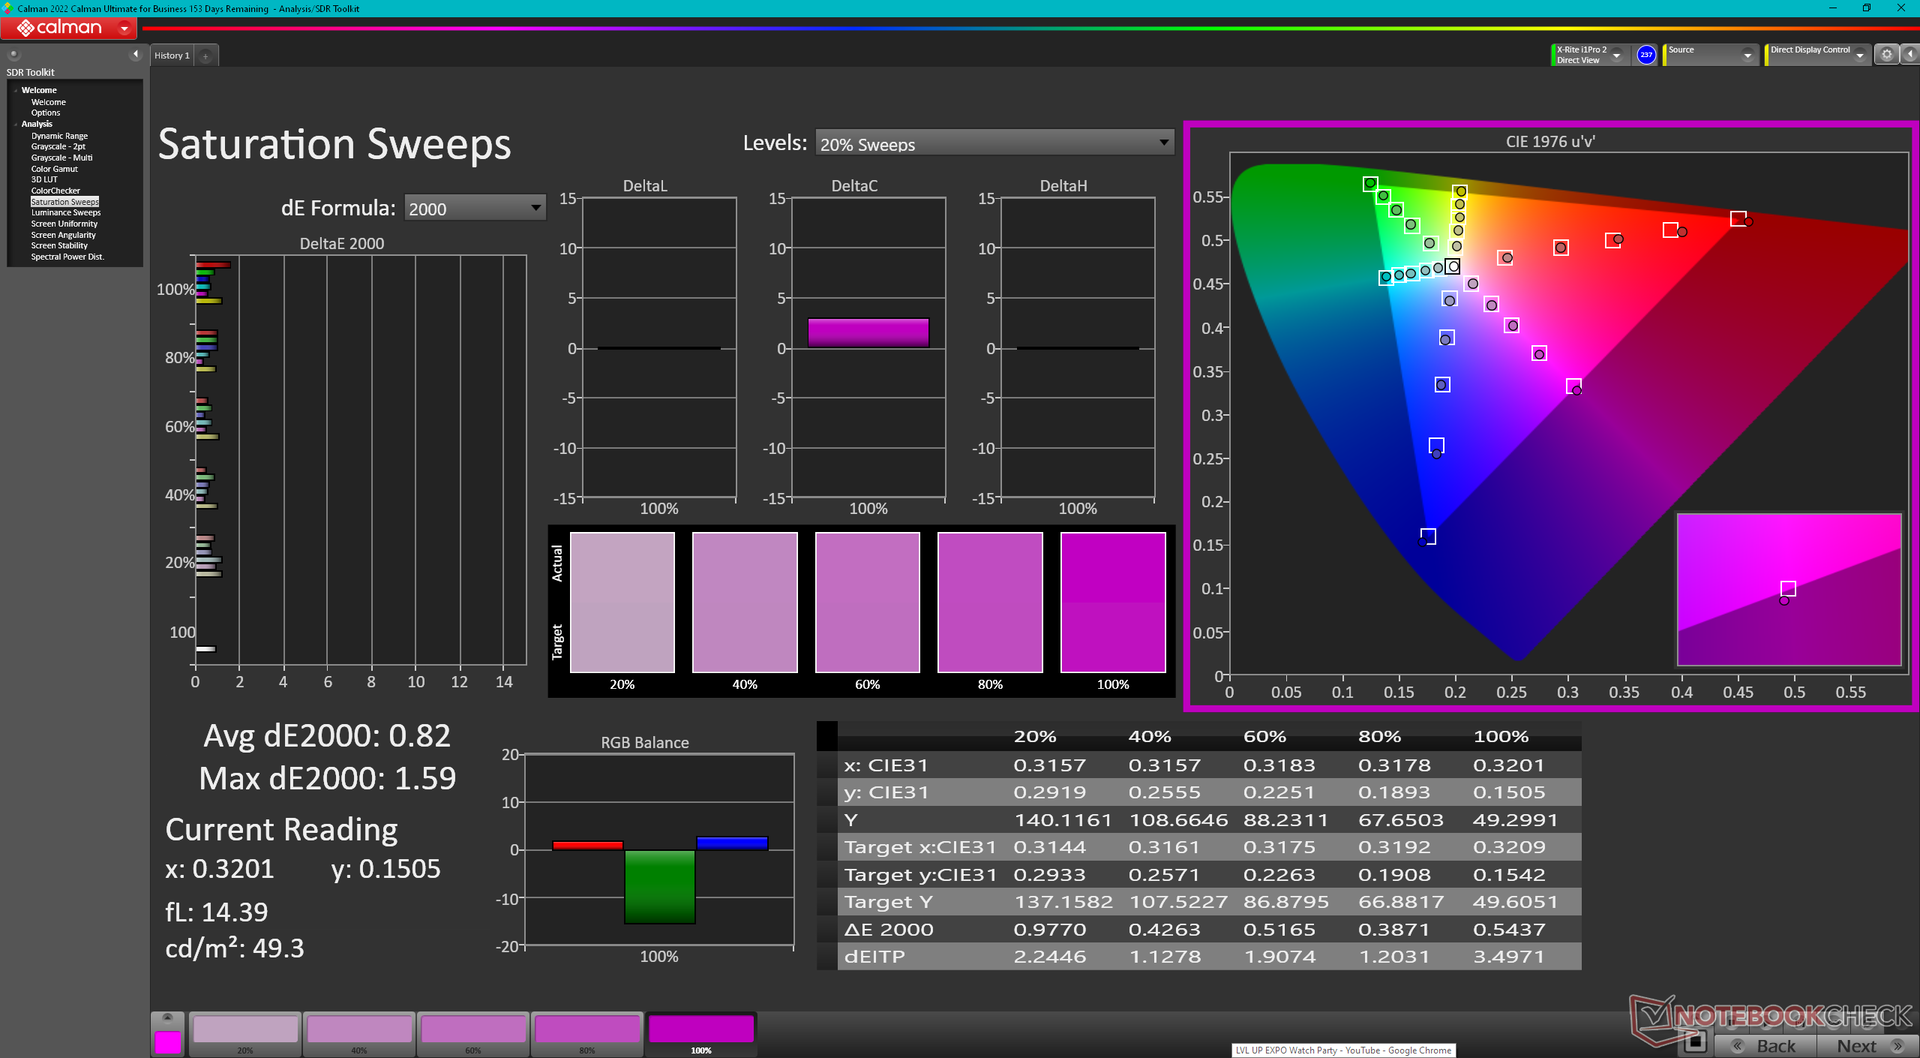
2024 modeli, görsel deneyimde hiçbir değişiklik olmaması için önceki yılla aynı 4K Samsung 160YV03 OLED paneli ve D3KJF parça numarasını kullanıyor. OLED panelin tam DCI-P3 renkleri ve dokunmatik desteği ile önceden kalibre edilmiş olarak gelmesi bir yandan mükemmel. Öte yandan, standart 60 Hz yenileme hızı eskimeye başladığı için uyarlanabilir seçeneklerle daha yüksek yenileme hızları görmek harika olurdu.
SDR ve HDR modlarında maksimum parlaklık sırasıyla 350 nit ve 600 nite ulaşabilir.
| |||||||||||||||||||||||||
Aydınlatma: 97 %
Batarya modunda parlaklık: 348.1 cd/m²
Kontrast: ∞:1 (Siyah: 0 cd/m²)
ΔE ColorChecker Calman: 4.18 | ∀{0.5-29.43 Ø4.72}
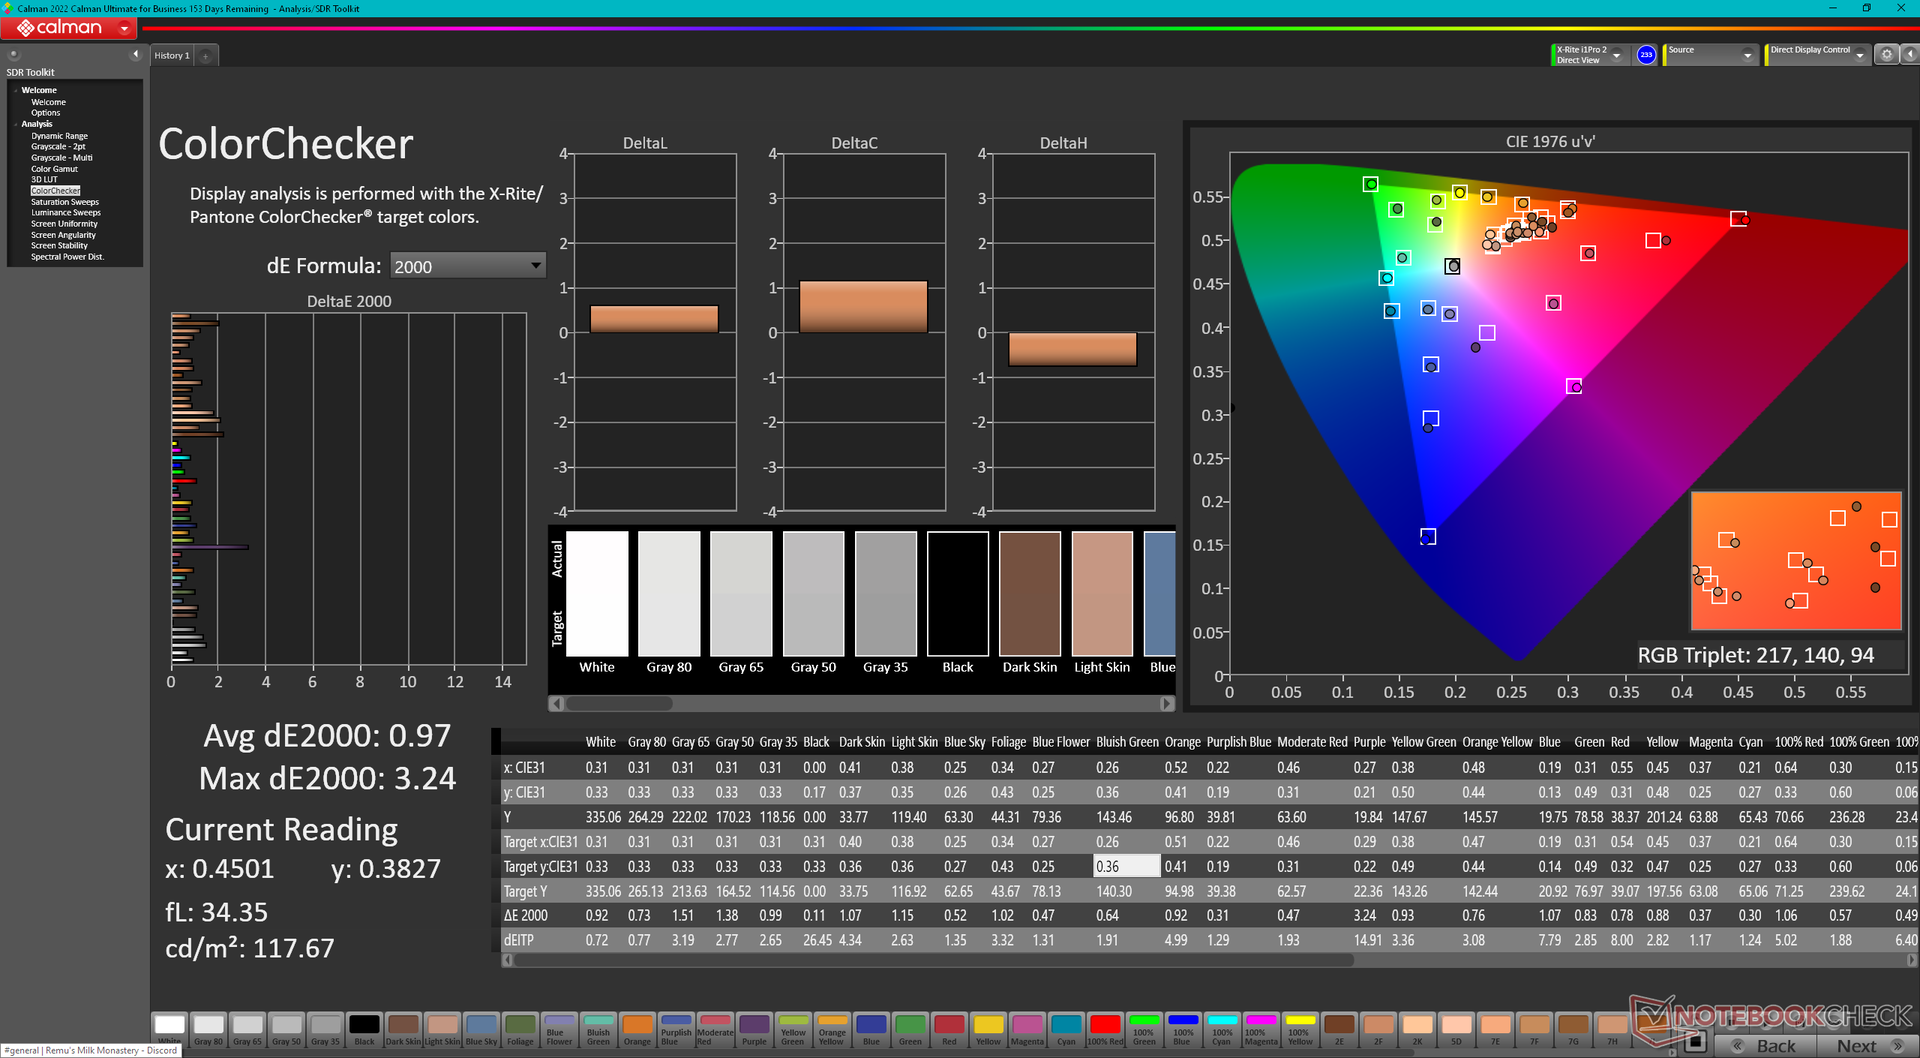
calibrated: 0.97
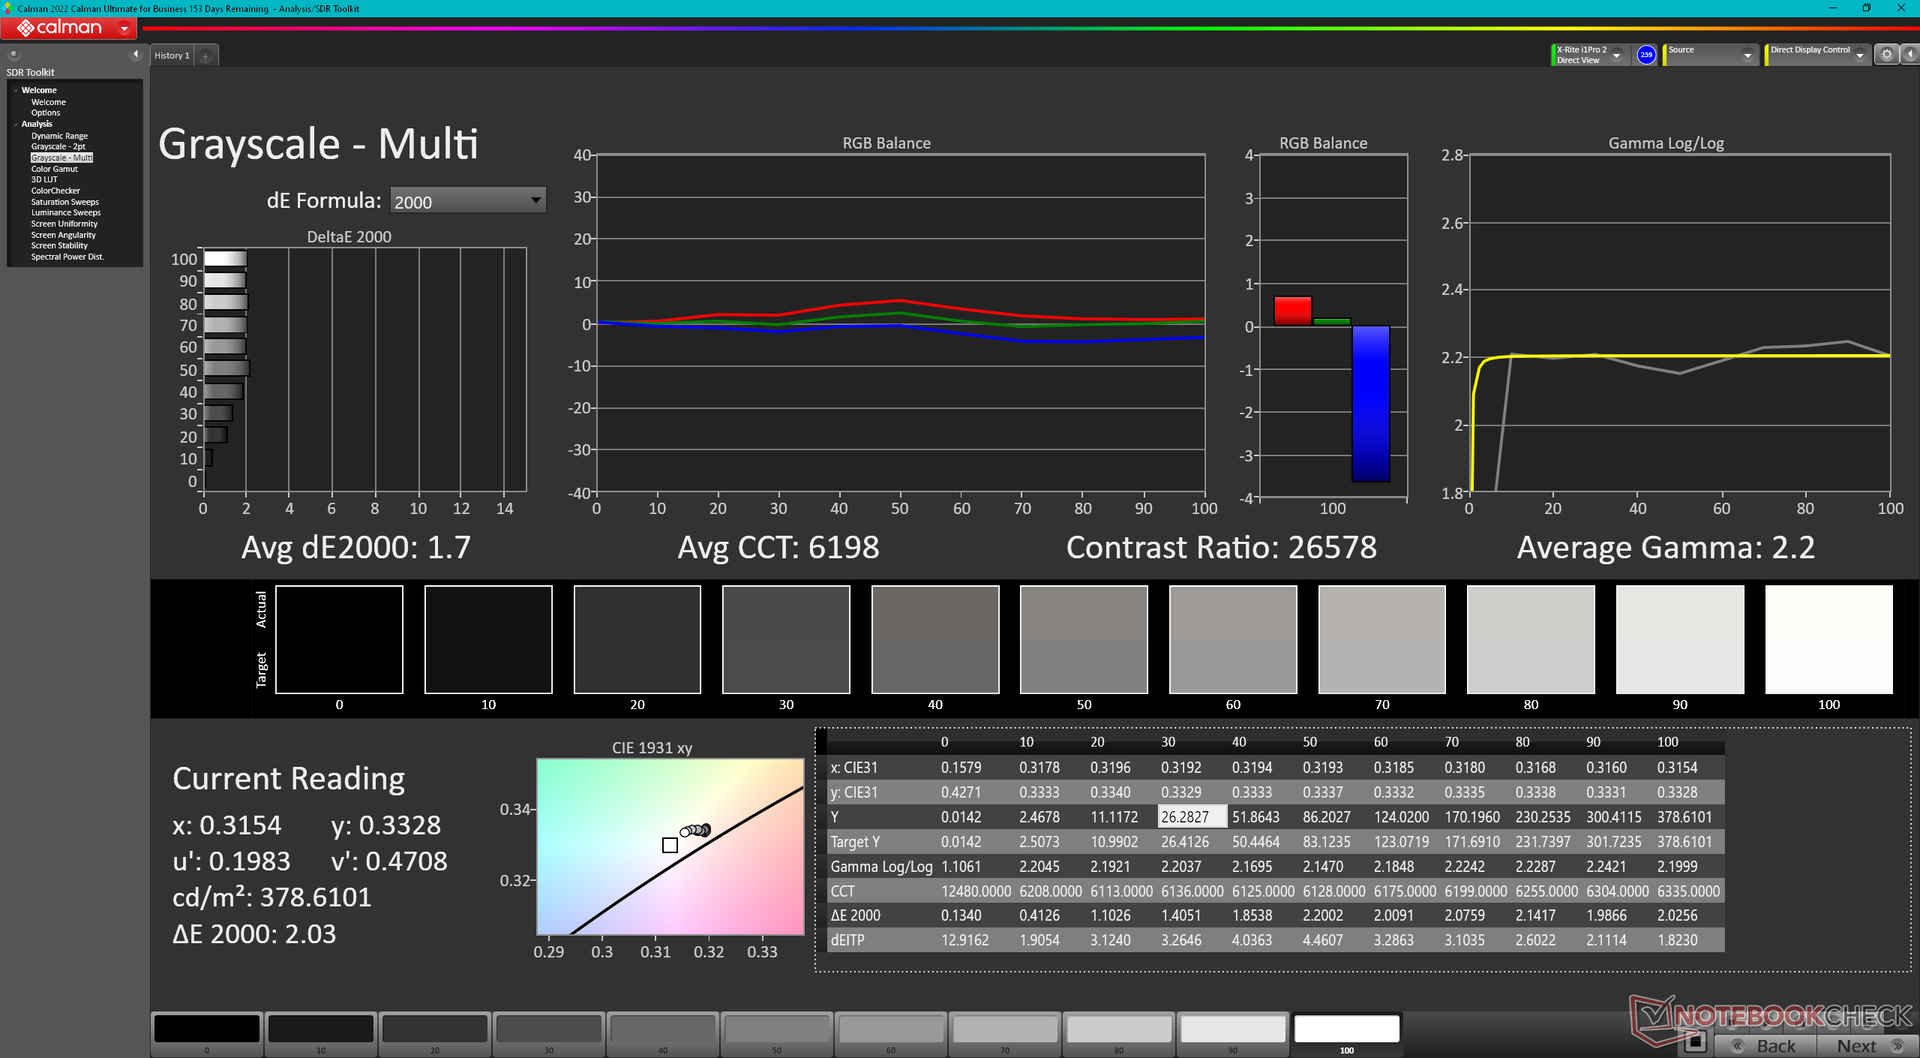
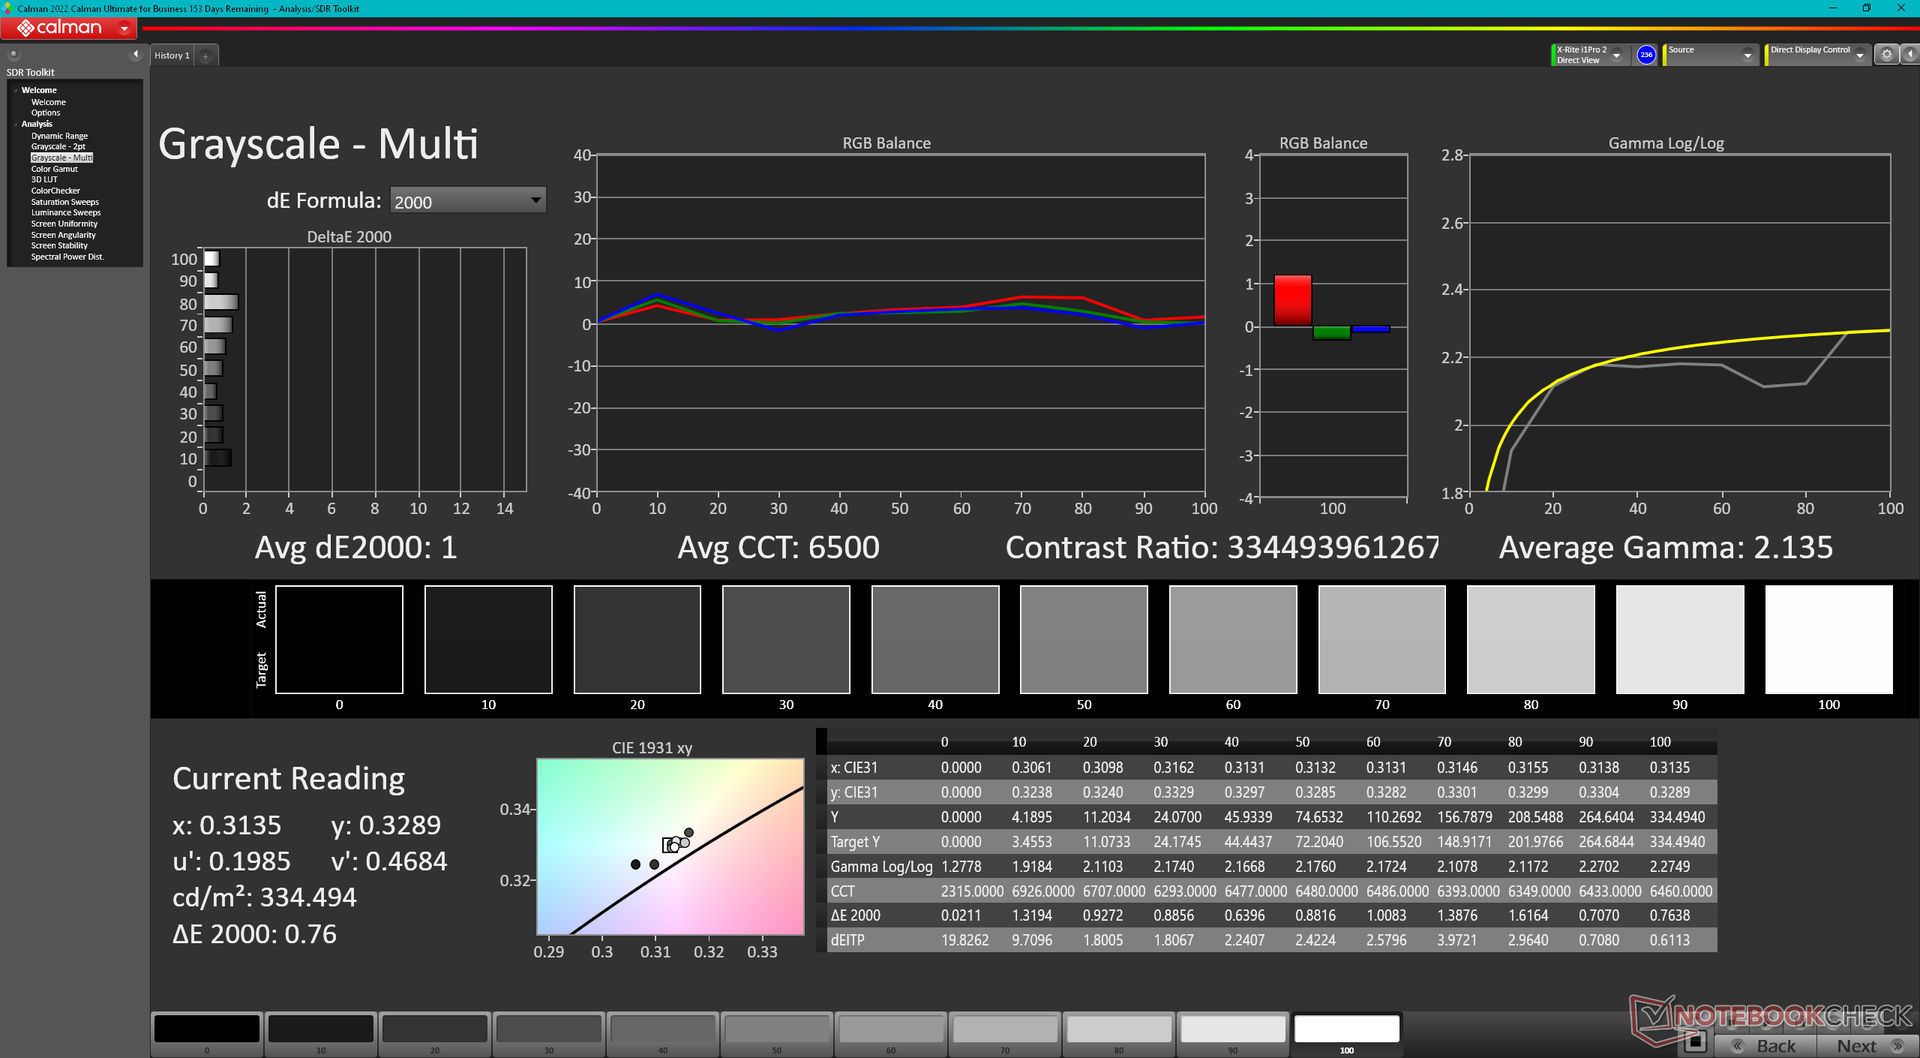
ΔE Greyscale Calman: 1.7 | ∀{0.09-98 Ø4.97}
96.6% AdobeRGB 1998 (Argyll 3D)
100% sRGB (Argyll 3D)
99.8% Display P3 (Argyll 3D)
Gamma: 2.2
CCT: 6198 K
| Dell Precision 5690 Samsung 160YV03, OLED, 3840x2400, 16" | Dell Precision 5000 5680 Samsung 160YV03, OLED, 3840x2400, 16" | Lenovo ThinkPad P16 G2 21FA000FGE MNG007DA1-9, IPS LED, 2560x1600, 16" | Lenovo ThinkPad P1 G6-21FV000DGE NE160QDM-NY1, IPS, 2560x1600, 16" | HP ZBook Fury 16 G10 AUO87A8, IPS, 3840x2400, 16" | MSI CreatorPro Z16P B12UKST B160QAN02.N, IPS, 2560x1600, 16" | |
|---|---|---|---|---|---|---|
| Display | 0% | -18% | -20% | -4% | -4% | |
| Display P3 Coverage (%) | 99.8 | 99.9 0% | 71 -29% | 68.1 -32% | 98 -2% | 97.6 -2% |
| sRGB Coverage (%) | 100 | 100 0% | 99.2 -1% | 97.5 -2% | 99.9 0% | 99.9 0% |
| AdobeRGB 1998 Coverage (%) | 96.6 | 97.5 1% | 73.2 -24% | 70.2 -27% | 86.2 -11% | 87.4 -10% |
| Response Times | -2% | -574% | -586% | -533% | -494% | |
| Response Time Grey 50% / Grey 80% * (ms) | 1.7 ? | 1.68 ? 1% | 12.8 ? -653% | 13.7 ? -706% | 11.9 ? -600% | 12.8 ? -653% |
| Response Time Black / White * (ms) | 1.7 ? | 1.77 ? -4% | 10.1 ? -494% | 9.6 ? -465% | 9.6 ? -465% | 7.4 ? -335% |
| PWM Frequency (Hz) | 60 ? | 60 ? | ||||
| Screen | -11% | -15% | 33% | 36% | 22% | |
| Brightness middle (cd/m²) | 348.1 | 345.7 -1% | 510 47% | 521 50% | 514.6 48% | 407 17% |
| Brightness (cd/m²) | 351 | 349 -1% | 517 47% | 484 38% | 495 41% | 388 11% |
| Brightness Distribution (%) | 97 | 98 1% | 89 -8% | 89 -8% | 90 -7% | 88 -9% |
| Black Level * (cd/m²) | 0.37 | 0.36 | 0.46 | 0.36 | ||
| Colorchecker dE 2000 * | 4.18 | 3.59 14% | 2.6 38% | 1.2 71% | 2.4 43% | 1.3 69% |
| Colorchecker dE 2000 max. * | 6.68 | 7.02 -5% | 5.2 22% | 2.5 63% | 4.86 27% | 2.5 63% |
| Colorchecker dE 2000 calibrated * | 0.97 | 0.99 -2% | 2.3 -137% | 1 -3% | 0.4 59% | 0.7 28% |
| Greyscale dE 2000 * | 1.7 | 3.1 -82% | 3.6 -112% | 1.4 18% | 1 41% | 2.1 -24% |
| Gamma | 2.2 100% | 2.13 103% | 2.26 97% | 2.25 98% | 2.3 96% | 2.26 97% |
| CCT | 6198 105% | 6448 101% | 5969 109% | 6682 97% | 6553 99% | 6437 101% |
| Contrast (:1) | 1378 | 1447 | 1119 | 1131 | ||
| Toplam Ortalama (Program / Ayarlar) | -4% /
-7% | -202% /
-109% | -191% /
-84% | -167% /
-69% | -159% /
-70% |
* ... daha küçük daha iyidir
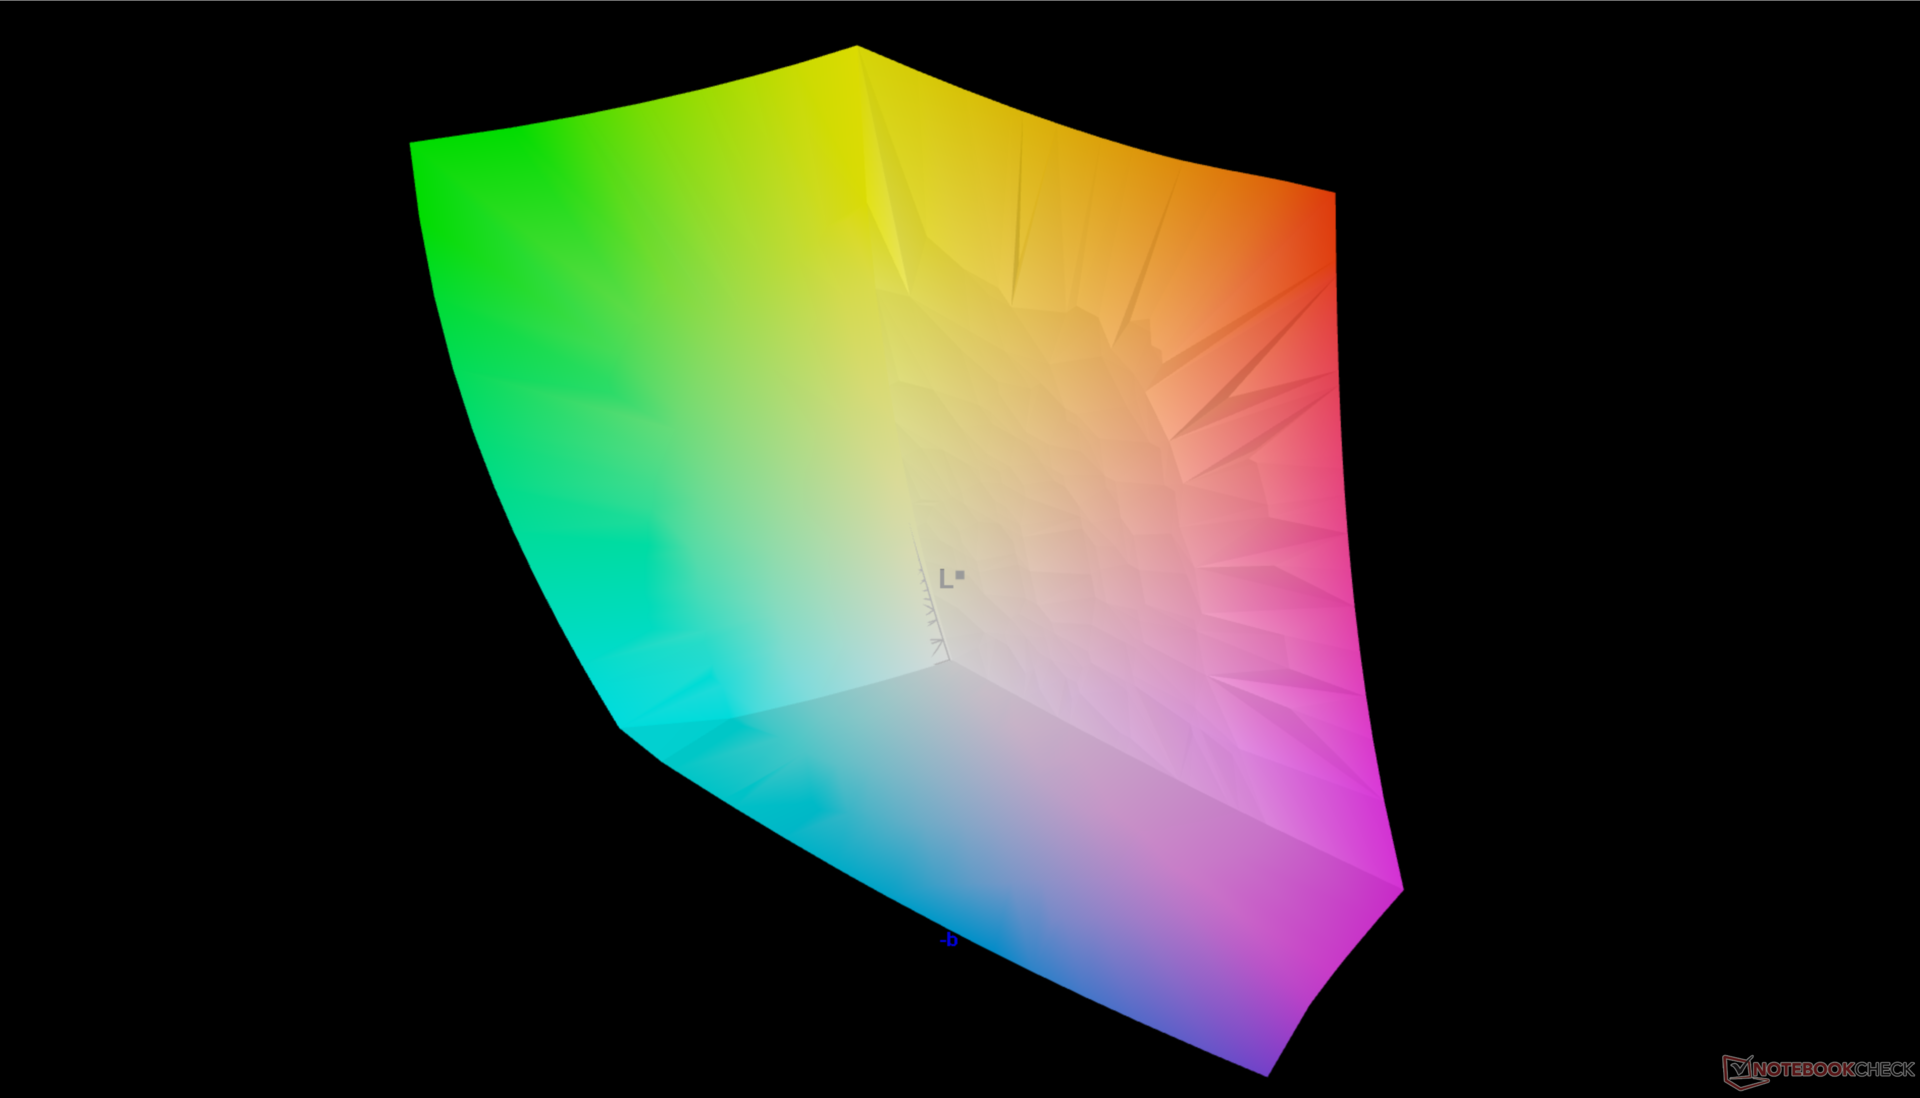
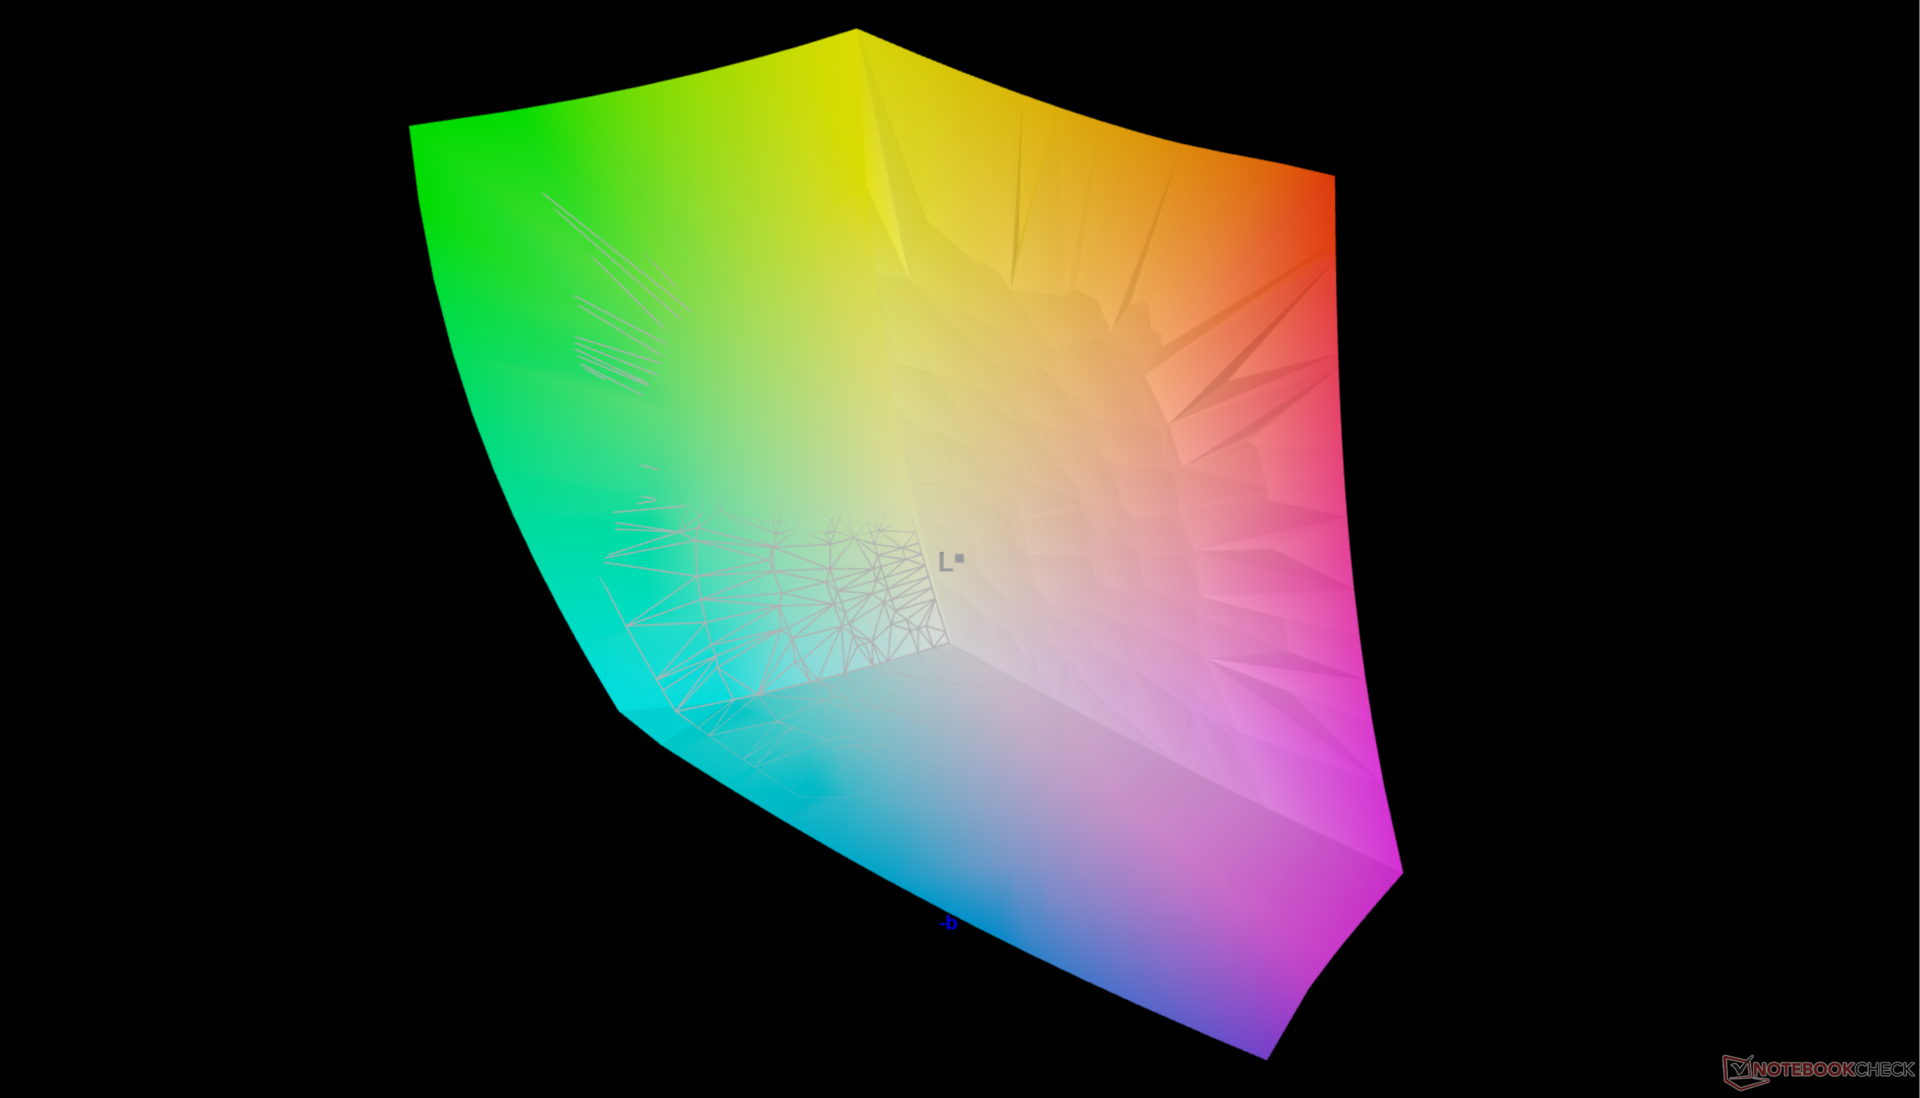
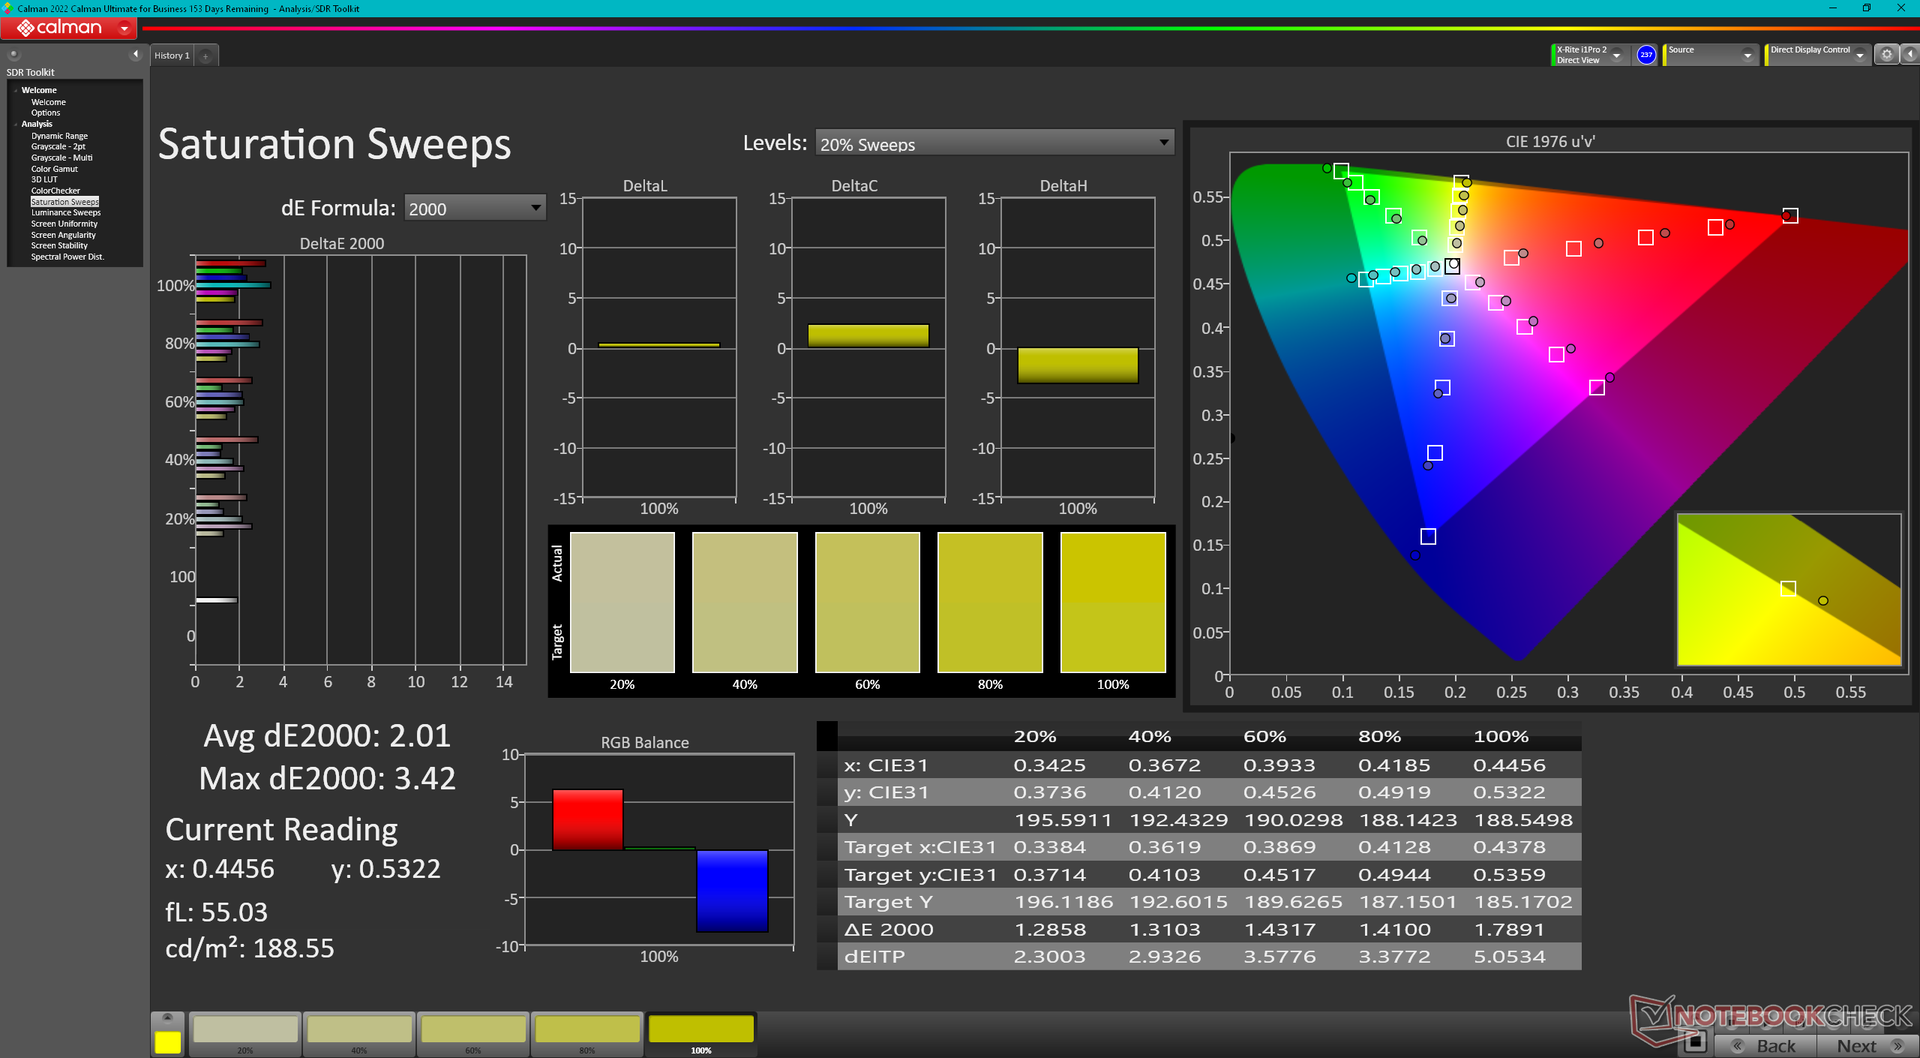
Ekran, sırasıyla sadece 1,7 ve 4,18 ortalama gri tonlama ve renk DeltaE değerleri ile P3 standardına göre iyi kalibre edilmiş olarak geliyor.
Yanıt Sürelerini Görüntüle
| ↔ Tepki Süresi Siyahtan Beyaza | ||
|---|---|---|
| 1.7 ms ... yükseliş ↗ ve sonbahar↘ birleşimi | ↗ 0.74 ms yükseliş | 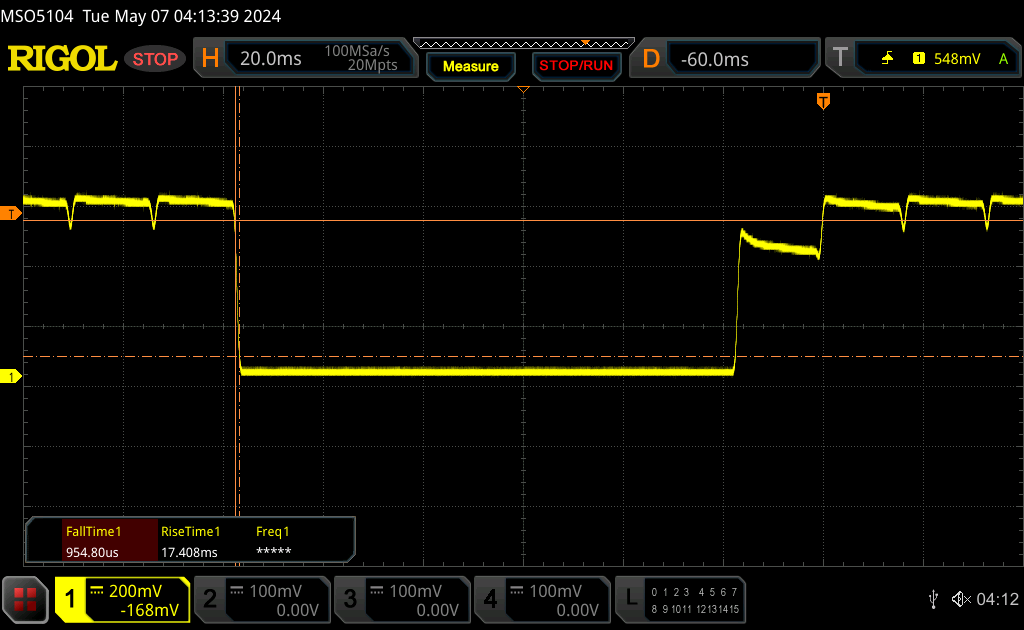 |
| ↘ 0.96 ms sonbahar | ||
| Ekran, testlerimizde çok hızlı yanıt oranları gösteriyor ve hızlı oyun oynamaya çok uygun olmalı. Karşılaştırıldığında, test edilen tüm cihazlar 0.1 (minimum) ile 240 (maksimum) ms arasında değişir. » Tüm cihazların 10 %'si daha iyi. Bu, ölçülen yanıt süresinin test edilen tüm cihazların ortalamasından (19.8 ms) daha iyi olduğu anlamına gelir. | ||
| ↔ Tepki Süresi %50 Griden %80 Griye | ||
| 1.7 ms ... yükseliş ↗ ve sonbahar↘ birleşimi | ↗ 0.88 ms yükseliş | 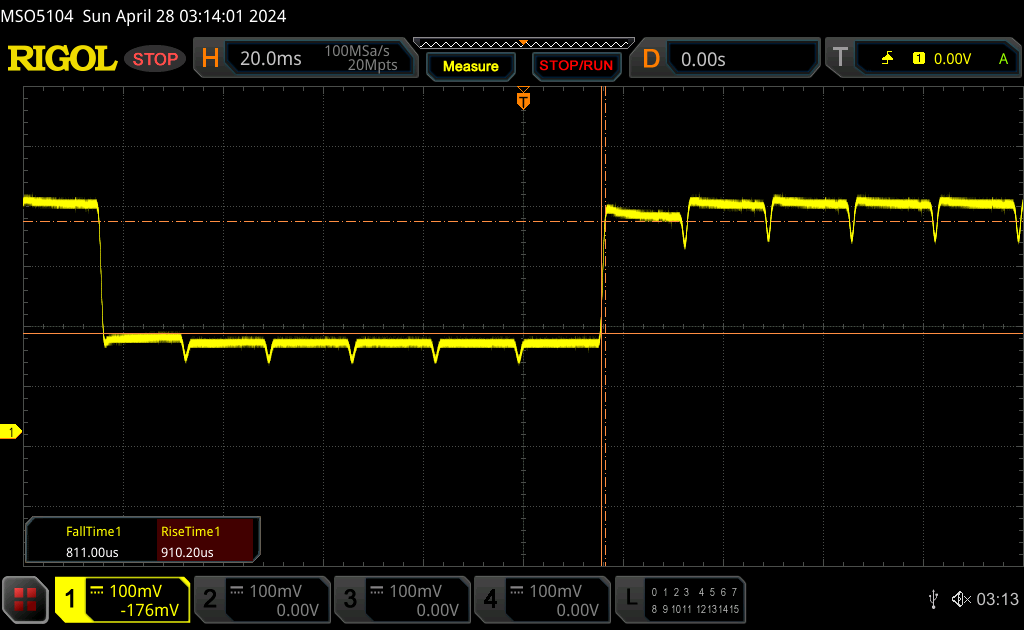 |
| ↘ 0.82 ms sonbahar | ||
| Ekran, testlerimizde çok hızlı yanıt oranları gösteriyor ve hızlı oyun oynamaya çok uygun olmalı. Karşılaştırıldığında, test edilen tüm cihazlar 0.165 (minimum) ile 636 (maksimum) ms arasında değişir. » Tüm cihazların 9 %'si daha iyi. Bu, ölçülen yanıt süresinin test edilen tüm cihazların ortalamasından (31 ms) daha iyi olduğu anlamına gelir. | ||
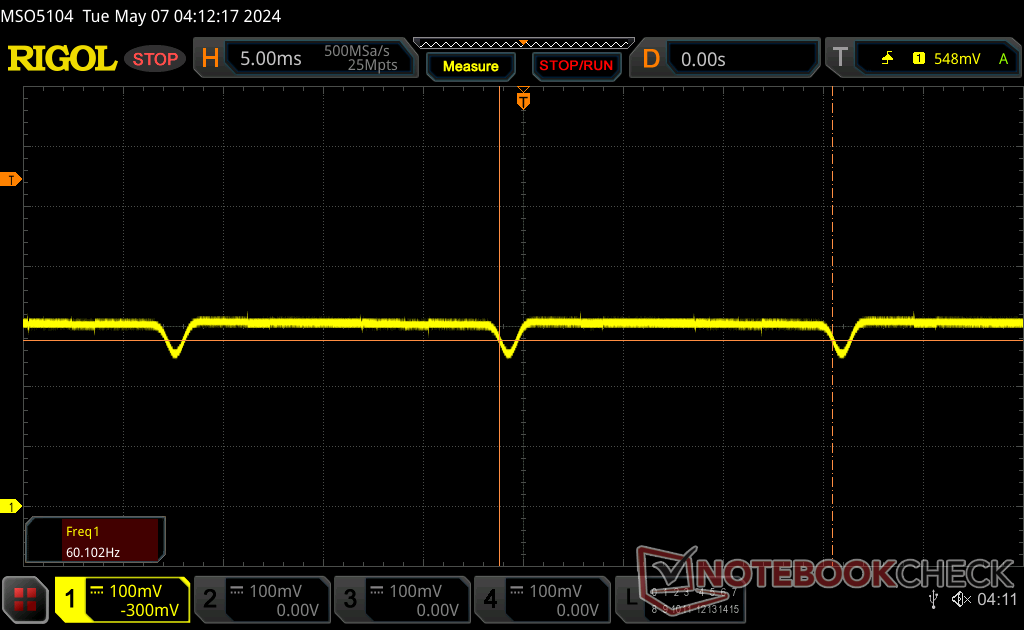
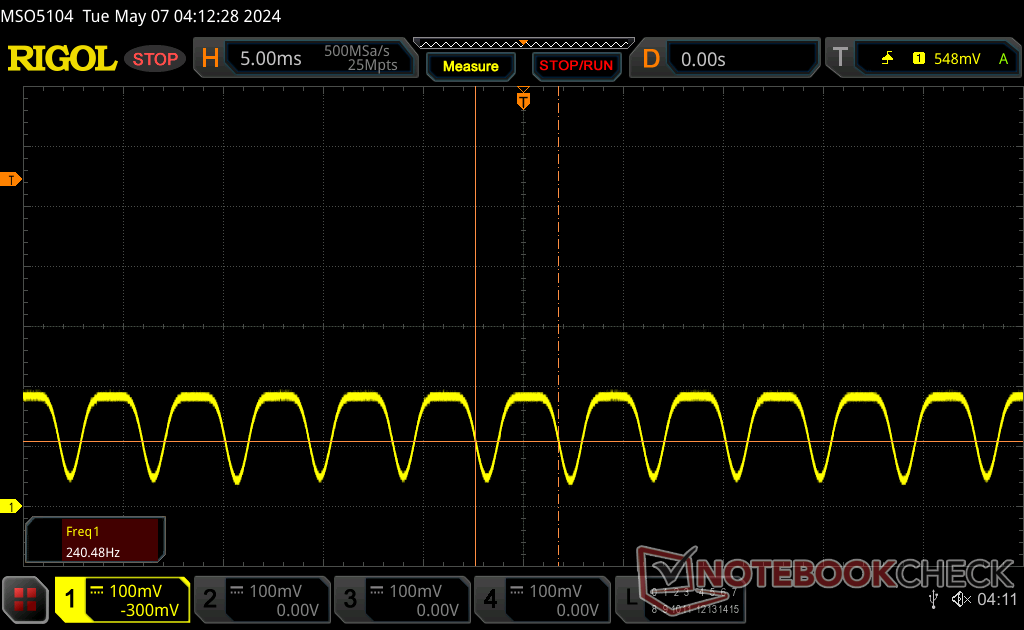
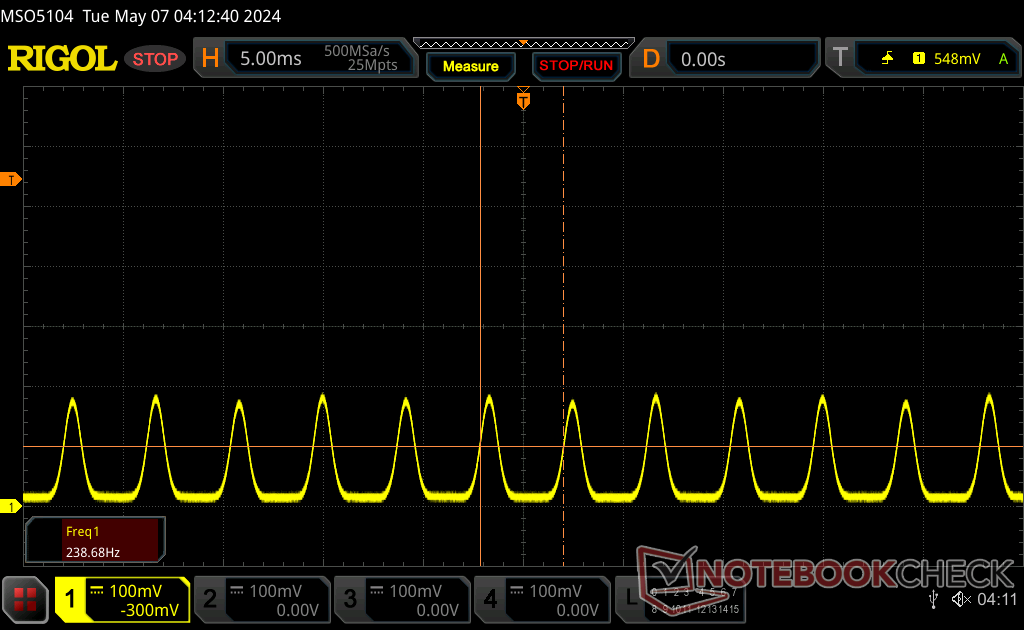
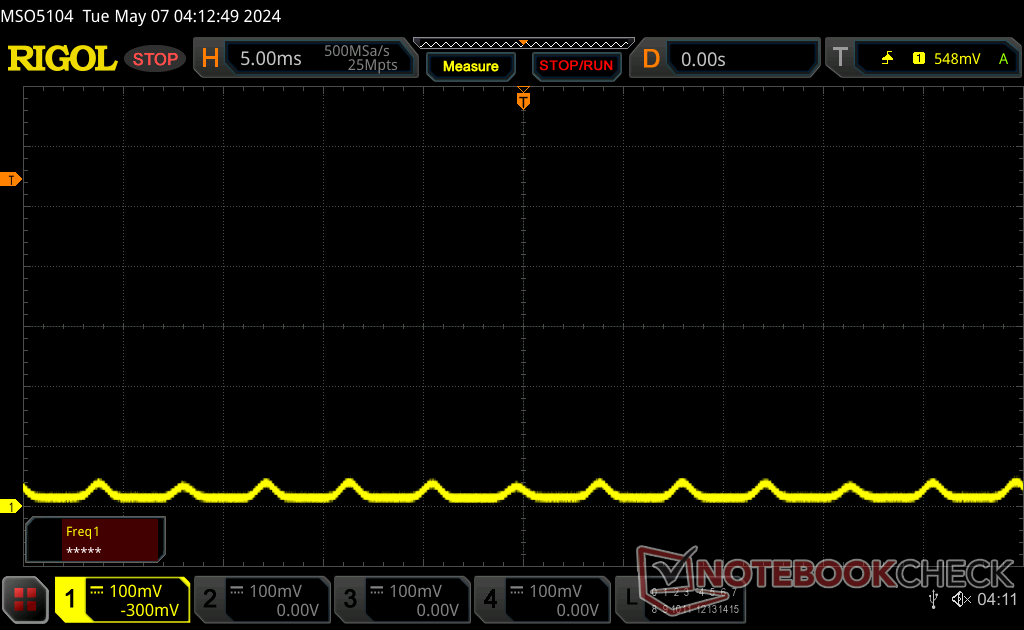
Ekran Titremesi / PWM (Darbe Genişliği Modülasyonu)
| Ekran titriyor / PWM algılandı | 60 Hz | ≤ 100 % parlaklık ayarı | 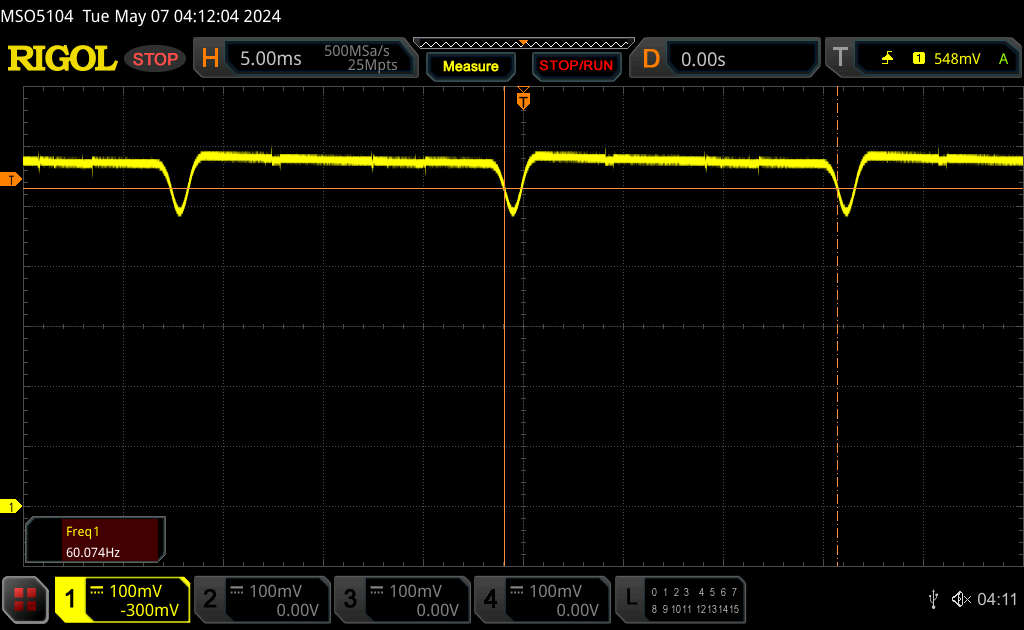 |
Ekran arka ışığı 60 Hz'de titriyor (en kötü durum, örneğin PWM kullanılması) 100 % ve altındaki parlaklık ayarında titreme algılandı. Bu parlaklık ayarının üzerinde titreme veya PWM olmamalıdır. 60 Hz frekansı çok düşüktür, bu nedenle titreme, uzun süreli kullanımdan sonra göz yorgunluğuna ve baş ağrısına neden olabilir. Karşılaştırıldığında: Test edilen tüm cihazların %52 %'si ekranı karartmak için PWM kullanmıyor. PWM tespit edilirse, ortalama 7763 (minimum: 5 - maksimum: 343500) Hz ölçüldü. | |||

Performans
Test Koşulları
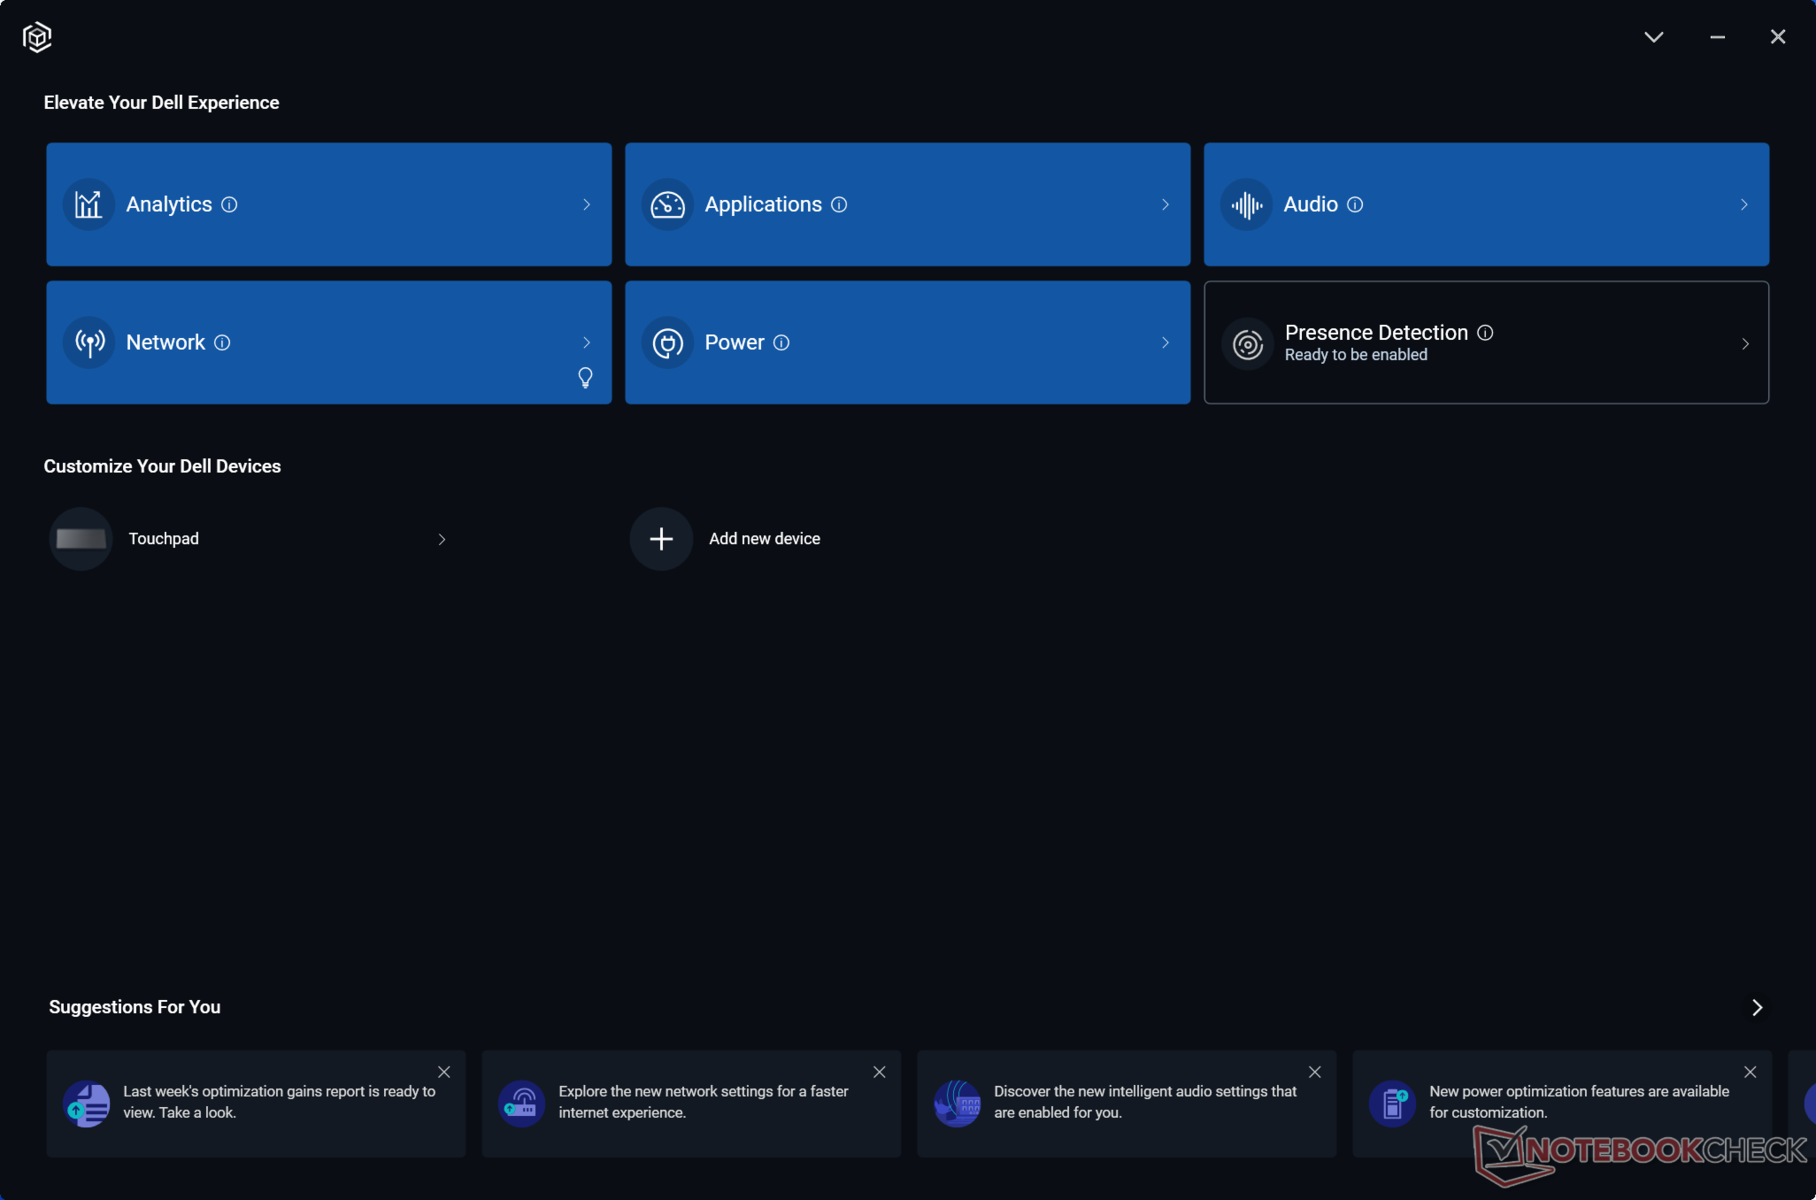
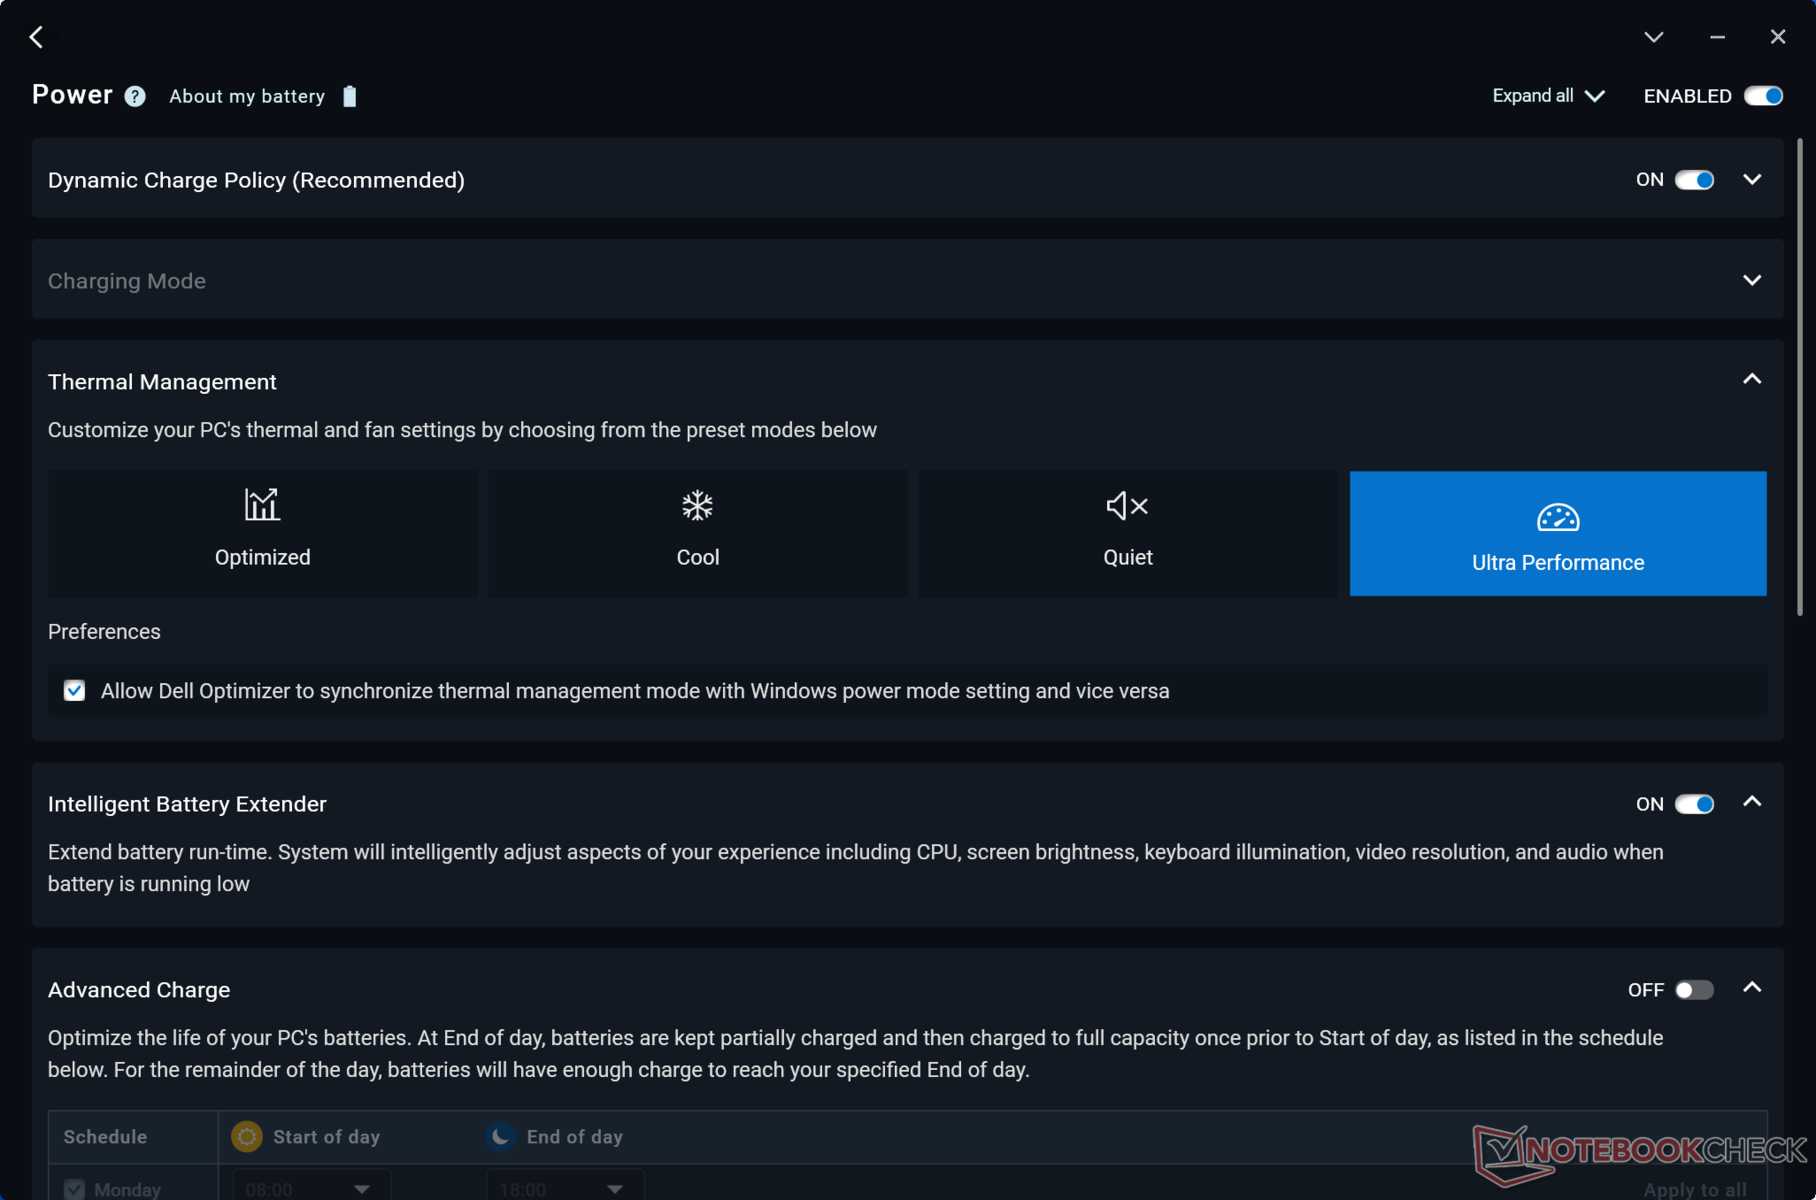
Aşağıdaki kıyaslamaları çalıştırmadan önce Dell Optimizer'ı Ultra Performans moduna ayarladık. Ayrıca Nvidia Kontrol Paneli üzerinden ECC VRAM'i kapattık. ECC VRAM'i etkinleştirmek erişilebilir belleği yaklaşık 1 GB azaltıyor.
İşlemci
Bu Core Ultra 9 185H ile neredeyse aynı performansı gösterir Core i9-13900H hem tek hem de çok iş parçacıklı iş yüklerinde. İlk hız patlaması için Turbo Boost'tan daha fazla yararlanır, ancak bu avantaj, aşağıdaki karşılaştırma grafiğinde gösterildiği gibi eski Core i9 Precision 5680 ile benzer performans seviyelerine yerleşmeden önce yalnızca geçicidir.
Aşağıya doğru Core Ultra 7 165H ve Ultra 5 135H işlemci performansını sırasıyla yüzde 5 ila 10 ve yüzde 40 ila 50 oranında etkilemesi beklenmektedir; bu da Core Ultra 5 ve Ultra 7 arasındaki performans deltasının Core Ultra 7 ve Ultra 9'a kıyasla önemli ölçüde daha geniş olduğu anlamına gelmektedir. Precision 5690, performansı Core Ultra 9 185H'den daha da hızlı artıracak olan 14. nesil Raptor Lake-HX CPU'ları içermemektedir. Buna karşılık Core Ultra CPU'lar, yakın gelecekte daha kolay kullanılabilir hale geldiklerinde yerel yapay zeka görevlerini hızlandırmak için entegre NPU'lar içeriyor.
Cinebench R15 Multi Loop
Cinebench R23: Multi Core | Single Core
Cinebench R20: CPU (Multi Core) | CPU (Single Core)
Cinebench R15: CPU Multi 64Bit | CPU Single 64Bit
Blender: v2.79 BMW27 CPU
7-Zip 18.03: 7z b 4 | 7z b 4 -mmt1
Geekbench 6.7: Multi-Core | Single-Core
Geekbench 5.5: Multi-Core | Single-Core
HWBOT x265 Benchmark v2.2: 4k Preset
LibreOffice : 20 Documents To PDF
R Benchmark 2.5: Overall mean
| CPU Performance rating | |
| Lenovo Legion Pro 7 RTX4090 -2! | |
| HP ZBook Fury 16 G10 | |
| Dell Precision 5000 5680 | |
| Lenovo ThinkPad P1 G6-21FV000DGE | |
| Lenovo ThinkPad P16 G2 21FA000FGE -2! | |
| Dell Precision 5690 | |
| Dell XPS 16 9640 | |
| HP ZBook Fury 16 G9 -2! | |
| Ortalama Intel Core Ultra 9 185H | |
| Lenovo ThinkPad P16 G1 21D6001DMB -2! | |
| MSI CreatorPro Z16P B12UKST -2! | |
| Lenovo ThinkPad P16v G1 AMD | |
| Lenovo ThinkPad P16s G2 21K9000CGE | |
| Samsung Galaxy Book4 Pro 360 -1! | |
| Asus ProArt StudioBook 16 W7600H5A-2BL2 -2! | |
| Lenovo ThinkPad P1 G4-20Y30017GE -2! | |
| Cinebench R23 / Multi Core | |
| Lenovo Legion Pro 7 RTX4090 | |
| HP ZBook Fury 16 G10 | |
| Lenovo ThinkPad P16 G2 21FA000FGE | |
| Dell Precision 5690 | |
| HP ZBook Fury 16 G9 | |
| Dell Precision 5000 5680 | |
| Lenovo ThinkPad P1 G6-21FV000DGE | |
| Dell XPS 16 9640 | |
| Lenovo ThinkPad P16 G1 21D6001DMB | |
| Ortalama Intel Core Ultra 9 185H (11072 - 19851, n=20) | |
| MSI CreatorPro Z16P B12UKST | |
| Lenovo ThinkPad P16s G2 21K9000CGE | |
| Lenovo ThinkPad P16v G1 AMD | |
| Asus ProArt StudioBook 16 W7600H5A-2BL2 | |
| Samsung Galaxy Book4 Pro 360 | |
| Lenovo ThinkPad P1 G4-20Y30017GE | |
| Cinebench R23 / Single Core | |
| HP ZBook Fury 16 G10 | |
| Lenovo Legion Pro 7 RTX4090 | |
| Lenovo ThinkPad P1 G6-21FV000DGE | |
| Dell Precision 5000 5680 | |
| HP ZBook Fury 16 G9 | |
| Lenovo ThinkPad P16 G2 21FA000FGE | |
| Dell Precision 5690 | |
| Lenovo ThinkPad P16 G1 21D6001DMB | |
| Dell XPS 16 9640 | |
| Ortalama Intel Core Ultra 9 185H (1166 - 1912, n=20) | |
| MSI CreatorPro Z16P B12UKST | |
| Lenovo ThinkPad P16s G2 21K9000CGE | |
| Samsung Galaxy Book4 Pro 360 | |
| Lenovo ThinkPad P16v G1 AMD | |
| Asus ProArt StudioBook 16 W7600H5A-2BL2 | |
| Lenovo ThinkPad P1 G4-20Y30017GE | |
| Cinebench R20 / CPU (Multi Core) | |
| Lenovo Legion Pro 7 RTX4090 | |
| HP ZBook Fury 16 G10 | |
| Lenovo ThinkPad P16 G2 21FA000FGE | |
| Dell Precision 5690 | |
| HP ZBook Fury 16 G9 | |
| Dell Precision 5000 5680 | |
| Dell XPS 16 9640 | |
| Lenovo ThinkPad P1 G6-21FV000DGE | |
| Lenovo ThinkPad P16 G1 21D6001DMB | |
| MSI CreatorPro Z16P B12UKST | |
| Ortalama Intel Core Ultra 9 185H (4198 - 7651, n=20) | |
| Lenovo ThinkPad P16s G2 21K9000CGE | |
| Lenovo ThinkPad P16v G1 AMD | |
| Asus ProArt StudioBook 16 W7600H5A-2BL2 | |
| Samsung Galaxy Book4 Pro 360 | |
| Lenovo ThinkPad P1 G4-20Y30017GE | |
| Cinebench R20 / CPU (Single Core) | |
| HP ZBook Fury 16 G10 | |
| Lenovo ThinkPad P1 G6-21FV000DGE | |
| Dell Precision 5000 5680 | |
| Lenovo Legion Pro 7 RTX4090 | |
| HP ZBook Fury 16 G9 | |
| Lenovo ThinkPad P16 G2 21FA000FGE | |
| Lenovo ThinkPad P16 G1 21D6001DMB | |
| Dell Precision 5690 | |
| Ortalama Intel Core Ultra 9 185H (442 - 735, n=20) | |
| MSI CreatorPro Z16P B12UKST | |
| Dell XPS 16 9640 | |
| Lenovo ThinkPad P16s G2 21K9000CGE | |
| Samsung Galaxy Book4 Pro 360 | |
| Lenovo ThinkPad P16v G1 AMD | |
| Asus ProArt StudioBook 16 W7600H5A-2BL2 | |
| Lenovo ThinkPad P1 G4-20Y30017GE | |
| Cinebench R15 / CPU Multi 64Bit | |
| Lenovo Legion Pro 7 RTX4090 | |
| HP ZBook Fury 16 G10 | |
| Dell Precision 5690 | |
| Lenovo ThinkPad P16 G2 21FA000FGE | |
| Lenovo ThinkPad P16 G1 21D6001DMB | |
| Dell XPS 16 9640 | |
| Ortalama Intel Core Ultra 9 185H (1582 - 3165, n=22) | |
| Lenovo ThinkPad P1 G6-21FV000DGE | |
| HP ZBook Fury 16 G9 | |
| Lenovo ThinkPad P16s G2 21K9000CGE | |
| Lenovo ThinkPad P16v G1 AMD | |
| Dell Precision 5000 5680 | |
| MSI CreatorPro Z16P B12UKST | |
| Asus ProArt StudioBook 16 W7600H5A-2BL2 | |
| Samsung Galaxy Book4 Pro 360 | |
| Lenovo ThinkPad P1 G4-20Y30017GE | |
| Cinebench R15 / CPU Single 64Bit | |
| HP ZBook Fury 16 G10 | |
| Lenovo Legion Pro 7 RTX4090 | |
| Dell Precision 5000 5680 | |
| Lenovo ThinkPad P1 G6-21FV000DGE | |
| Lenovo ThinkPad P16 G2 21FA000FGE | |
| Dell Precision 5690 | |
| Lenovo ThinkPad P16 G1 21D6001DMB | |
| Lenovo ThinkPad P16s G2 21K9000CGE | |
| Lenovo ThinkPad P16v G1 AMD | |
| Ortalama Intel Core Ultra 9 185H (191.9 - 281, n=20) | |
| Dell XPS 16 9640 | |
| Samsung Galaxy Book4 Pro 360 | |
| MSI CreatorPro Z16P B12UKST | |
| Asus ProArt StudioBook 16 W7600H5A-2BL2 | |
| Lenovo ThinkPad P1 G4-20Y30017GE | |
| HP ZBook Fury 16 G9 | |
| Blender / v2.79 BMW27 CPU | |
| Samsung Galaxy Book4 Pro 360 | |
| Lenovo ThinkPad P1 G4-20Y30017GE | |
| Asus ProArt StudioBook 16 W7600H5A-2BL2 | |
| Lenovo ThinkPad P16s G2 21K9000CGE | |
| Dell Precision 5690 | |
| Lenovo ThinkPad P16v G1 AMD | |
| MSI CreatorPro Z16P B12UKST | |
| Dell Precision 5000 5680 | |
| Ortalama Intel Core Ultra 9 185H (163 - 285, n=20) | |
| Lenovo ThinkPad P1 G6-21FV000DGE | |
| Lenovo ThinkPad P16 G1 21D6001DMB | |
| Dell XPS 16 9640 | |
| HP ZBook Fury 16 G9 | |
| Lenovo ThinkPad P16 G2 21FA000FGE | |
| HP ZBook Fury 16 G10 | |
| Lenovo Legion Pro 7 RTX4090 | |
| 7-Zip 18.03 / 7z b 4 | |
| Lenovo Legion Pro 7 RTX4090 | |
| HP ZBook Fury 16 G10 | |
| Lenovo ThinkPad P16 G2 21FA000FGE | |
| HP ZBook Fury 16 G9 | |
| Dell Precision 5690 | |
| Lenovo ThinkPad P1 G6-21FV000DGE | |
| Dell Precision 5000 5680 | |
| Dell XPS 16 9640 | |
| Lenovo ThinkPad P16 G1 21D6001DMB | |
| Ortalama Intel Core Ultra 9 185H (51289 - 76331, n=20) | |
| MSI CreatorPro Z16P B12UKST | |
| Lenovo ThinkPad P16v G1 AMD | |
| Lenovo ThinkPad P16s G2 21K9000CGE | |
| Asus ProArt StudioBook 16 W7600H5A-2BL2 | |
| Lenovo ThinkPad P1 G4-20Y30017GE | |
| 7-Zip 18.03 / 7z b 4 -mmt1 | |
| Lenovo Legion Pro 7 RTX4090 | |
| HP ZBook Fury 16 G10 | |
| Lenovo ThinkPad P1 G6-21FV000DGE | |
| Lenovo ThinkPad P16v G1 AMD | |
| Lenovo ThinkPad P16 G2 21FA000FGE | |
| Dell Precision 5000 5680 | |
| HP ZBook Fury 16 G9 | |
| Lenovo ThinkPad P16 G1 21D6001DMB | |
| Lenovo ThinkPad P16s G2 21K9000CGE | |
| MSI CreatorPro Z16P B12UKST | |
| Lenovo ThinkPad P1 G4-20Y30017GE | |
| Dell XPS 16 9640 | |
| Ortalama Intel Core Ultra 9 185H (4199 - 5781, n=20) | |
| Asus ProArt StudioBook 16 W7600H5A-2BL2 | |
| Samsung Galaxy Book4 Pro 360 | |
| Dell Precision 5690 | |
| Geekbench 6.7 / Multi-Core | |
| HP ZBook Fury 16 G10 | |
| Dell Precision 5000 5680 | |
| Dell Precision 5690 | |
| Dell XPS 16 9640 | |
| Ortalama Intel Core Ultra 9 185H (9140 - 14540, n=20) | |
| Lenovo ThinkPad P1 G6-21FV000DGE | |
| Lenovo ThinkPad P16s G2 21K9000CGE | |
| Samsung Galaxy Book4 Pro 360 | |
| Lenovo ThinkPad P16v G1 AMD | |
| Geekbench 6.7 / Single-Core | |
| HP ZBook Fury 16 G10 | |
| Lenovo ThinkPad P1 G6-21FV000DGE | |
| Dell Precision 5000 5680 | |
| Lenovo ThinkPad P16v G1 AMD | |
| Dell Precision 5690 | |
| Lenovo ThinkPad P16s G2 21K9000CGE | |
| Dell XPS 16 9640 | |
| Ortalama Intel Core Ultra 9 185H (1490 - 2573, n=20) | |
| Samsung Galaxy Book4 Pro 360 | |
| Geekbench 5.5 / Multi-Core | |
| Lenovo Legion Pro 7 RTX4090 | |
| HP ZBook Fury 16 G10 | |
| Dell Precision 5000 5680 | |
| Lenovo ThinkPad P16 G2 21FA000FGE | |
| Dell Precision 5690 | |
| HP ZBook Fury 16 G9 | |
| Dell XPS 16 9640 | |
| Ortalama Intel Core Ultra 9 185H (9330 - 14230, n=20) | |
| Lenovo ThinkPad P16 G1 21D6001DMB | |
| MSI CreatorPro Z16P B12UKST | |
| Lenovo ThinkPad P1 G6-21FV000DGE | |
| Lenovo ThinkPad P16s G2 21K9000CGE | |
| Lenovo ThinkPad P16v G1 AMD | |
| Samsung Galaxy Book4 Pro 360 | |
| Asus ProArt StudioBook 16 W7600H5A-2BL2 | |
| Lenovo ThinkPad P1 G4-20Y30017GE | |
| Geekbench 5.5 / Single-Core | |
| HP ZBook Fury 16 G10 | |
| Dell Precision 5000 5680 | |
| Lenovo Legion Pro 7 RTX4090 | |
| Lenovo ThinkPad P1 G6-21FV000DGE | |
| HP ZBook Fury 16 G9 | |
| Lenovo ThinkPad P16 G2 21FA000FGE | |
| Dell Precision 5690 | |
| Lenovo ThinkPad P16v G1 AMD | |
| MSI CreatorPro Z16P B12UKST | |
| Lenovo ThinkPad P16 G1 21D6001DMB | |
| Dell XPS 16 9640 | |
| Ortalama Intel Core Ultra 9 185H (986 - 1902, n=20) | |
| Lenovo ThinkPad P16s G2 21K9000CGE | |
| Samsung Galaxy Book4 Pro 360 | |
| Lenovo ThinkPad P1 G4-20Y30017GE | |
| Asus ProArt StudioBook 16 W7600H5A-2BL2 | |
| HWBOT x265 Benchmark v2.2 / 4k Preset | |
| Lenovo Legion Pro 7 RTX4090 | |
| HP ZBook Fury 16 G10 | |
| Lenovo ThinkPad P16 G2 21FA000FGE | |
| Dell Precision 5690 | |
| Dell XPS 16 9640 | |
| Dell Precision 5000 5680 | |
| HP ZBook Fury 16 G9 | |
| Ortalama Intel Core Ultra 9 185H (13.7 - 22.7, n=20) | |
| MSI CreatorPro Z16P B12UKST | |
| Lenovo ThinkPad P1 G6-21FV000DGE | |
| Lenovo ThinkPad P16v G1 AMD | |
| Lenovo ThinkPad P16s G2 21K9000CGE | |
| Lenovo ThinkPad P16 G1 21D6001DMB | |
| Asus ProArt StudioBook 16 W7600H5A-2BL2 | |
| Lenovo ThinkPad P1 G4-20Y30017GE | |
| Samsung Galaxy Book4 Pro 360 | |
| LibreOffice / 20 Documents To PDF | |
| Lenovo ThinkPad P16s G2 21K9000CGE | |
| Lenovo ThinkPad P1 G4-20Y30017GE | |
| Lenovo ThinkPad P16 G2 21FA000FGE | |
| Lenovo ThinkPad P1 G6-21FV000DGE | |
| Lenovo ThinkPad P16 G1 21D6001DMB | |
| Ortalama Intel Core Ultra 9 185H (34.5 - 73.5, n=20) | |
| Lenovo ThinkPad P16v G1 AMD | |
| Dell XPS 16 9640 | |
| HP ZBook Fury 16 G10 | |
| Samsung Galaxy Book4 Pro 360 | |
| Dell Precision 5690 | |
| Lenovo Legion Pro 7 RTX4090 | |
| Dell Precision 5000 5680 | |
| MSI CreatorPro Z16P B12UKST | |
| HP ZBook Fury 16 G9 | |
| Asus ProArt StudioBook 16 W7600H5A-2BL2 | |
| R Benchmark 2.5 / Overall mean | |
| Lenovo ThinkPad P1 G4-20Y30017GE | |
| Asus ProArt StudioBook 16 W7600H5A-2BL2 | |
| Samsung Galaxy Book4 Pro 360 | |
| Dell XPS 16 9640 | |
| Ortalama Intel Core Ultra 9 185H (0.4313 - 0.759, n=21) | |
| Lenovo ThinkPad P16s G2 21K9000CGE | |
| Dell Precision 5690 | |
| MSI CreatorPro Z16P B12UKST | |
| Lenovo ThinkPad P16 G1 21D6001DMB | |
| Lenovo ThinkPad P16 G2 21FA000FGE | |
| Lenovo ThinkPad P16v G1 AMD | |
| HP ZBook Fury 16 G9 | |
| Lenovo ThinkPad P1 G6-21FV000DGE | |
| Dell Precision 5000 5680 | |
| Lenovo Legion Pro 7 RTX4090 | |
| HP ZBook Fury 16 G10 | |
Cinebench R23: Multi Core | Single Core
Cinebench R20: CPU (Multi Core) | CPU (Single Core)
Cinebench R15: CPU Multi 64Bit | CPU Single 64Bit
Blender: v2.79 BMW27 CPU
7-Zip 18.03: 7z b 4 | 7z b 4 -mmt1
Geekbench 6.7: Multi-Core | Single-Core
Geekbench 5.5: Multi-Core | Single-Core
HWBOT x265 Benchmark v2.2: 4k Preset
LibreOffice : 20 Documents To PDF
R Benchmark 2.5: Overall mean
* ... daha küçük daha iyidir
AIDA64: FP32 Ray-Trace | FPU Julia | CPU SHA3 | CPU Queen | FPU SinJulia | FPU Mandel | CPU AES | CPU ZLib | FP64 Ray-Trace | CPU PhotoWorxx
| Performance rating | |
| HP ZBook Fury 16 G10 | |
| Dell Precision 5690 | |
| Lenovo ThinkPad P16 G2 21FA000FGE | |
| Ortalama Intel Core Ultra 9 185H | |
| Dell Precision 5000 5680 | |
| MSI CreatorPro Z16P B12UKST | |
| Lenovo ThinkPad P1 G6-21FV000DGE | |
| AIDA64 / FP32 Ray-Trace | |
| HP ZBook Fury 16 G10 | |
| Dell Precision 5690 | |
| Lenovo ThinkPad P16 G2 21FA000FGE | |
| Lenovo ThinkPad P1 G6-21FV000DGE | |
| Ortalama Intel Core Ultra 9 185H (9220 - 18676, n=20) | |
| Dell Precision 5000 5680 | |
| MSI CreatorPro Z16P B12UKST | |
| AIDA64 / FPU Julia | |
| HP ZBook Fury 16 G10 | |
| Dell Precision 5690 | |
| Lenovo ThinkPad P16 G2 21FA000FGE | |
| Lenovo ThinkPad P1 G6-21FV000DGE | |
| Ortalama Intel Core Ultra 9 185H (48865 - 96463, n=20) | |
| Dell Precision 5000 5680 | |
| MSI CreatorPro Z16P B12UKST | |
| AIDA64 / CPU SHA3 | |
| HP ZBook Fury 16 G10 | |
| Dell Precision 5690 | |
| Lenovo ThinkPad P16 G2 21FA000FGE | |
| Ortalama Intel Core Ultra 9 185H (2394 - 4534, n=20) | |
| Lenovo ThinkPad P1 G6-21FV000DGE | |
| MSI CreatorPro Z16P B12UKST | |
| Dell Precision 5000 5680 | |
| AIDA64 / CPU Queen | |
| HP ZBook Fury 16 G10 | |
| Dell Precision 5000 5680 | |
| Lenovo ThinkPad P1 G6-21FV000DGE | |
| Lenovo ThinkPad P16 G2 21FA000FGE | |
| MSI CreatorPro Z16P B12UKST | |
| Dell Precision 5690 | |
| Ortalama Intel Core Ultra 9 185H (66785 - 95241, n=20) | |
| AIDA64 / FPU SinJulia | |
| HP ZBook Fury 16 G10 | |
| Lenovo ThinkPad P16 G2 21FA000FGE | |
| Dell Precision 5690 | |
| Ortalama Intel Core Ultra 9 185H (7255 - 11392, n=20) | |
| Lenovo ThinkPad P1 G6-21FV000DGE | |
| Dell Precision 5000 5680 | |
| MSI CreatorPro Z16P B12UKST | |
| AIDA64 / FPU Mandel | |
| HP ZBook Fury 16 G10 | |
| Dell Precision 5690 | |
| Lenovo ThinkPad P16 G2 21FA000FGE | |
| Ortalama Intel Core Ultra 9 185H (24004 - 48020, n=20) | |
| Lenovo ThinkPad P1 G6-21FV000DGE | |
| Dell Precision 5000 5680 | |
| MSI CreatorPro Z16P B12UKST | |
| AIDA64 / CPU AES | |
| MSI CreatorPro Z16P B12UKST | |
| HP ZBook Fury 16 G10 | |
| Ortalama Intel Core Ultra 9 185H (53116 - 154066, n=20) | |
| Dell Precision 5690 | |
| Lenovo ThinkPad P16 G2 21FA000FGE | |
| Lenovo ThinkPad P1 G6-21FV000DGE | |
| Dell Precision 5000 5680 | |
| AIDA64 / CPU ZLib | |
| HP ZBook Fury 16 G10 | |
| Dell Precision 5690 | |
| Ortalama Intel Core Ultra 9 185H (678 - 1341, n=20) | |
| Lenovo ThinkPad P16 G2 21FA000FGE | |
| Lenovo ThinkPad P1 G6-21FV000DGE | |
| MSI CreatorPro Z16P B12UKST | |
| Dell Precision 5000 5680 | |
| AIDA64 / FP64 Ray-Trace | |
| HP ZBook Fury 16 G10 | |
| Lenovo ThinkPad P16 G2 21FA000FGE | |
| Dell Precision 5690 | |
| Lenovo ThinkPad P1 G6-21FV000DGE | |
| Dell Precision 5000 5680 | |
| Ortalama Intel Core Ultra 9 185H (4428 - 10078, n=20) | |
| MSI CreatorPro Z16P B12UKST | |
| AIDA64 / CPU PhotoWorxx | |
| Dell Precision 5690 | |
| Ortalama Intel Core Ultra 9 185H (44547 - 53918, n=20) | |
| Dell Precision 5000 5680 | |
| MSI CreatorPro Z16P B12UKST | |
| HP ZBook Fury 16 G10 | |
| Lenovo ThinkPad P16 G2 21FA000FGE | |
| Lenovo ThinkPad P1 G6-21FV000DGE | |
Stres Testi
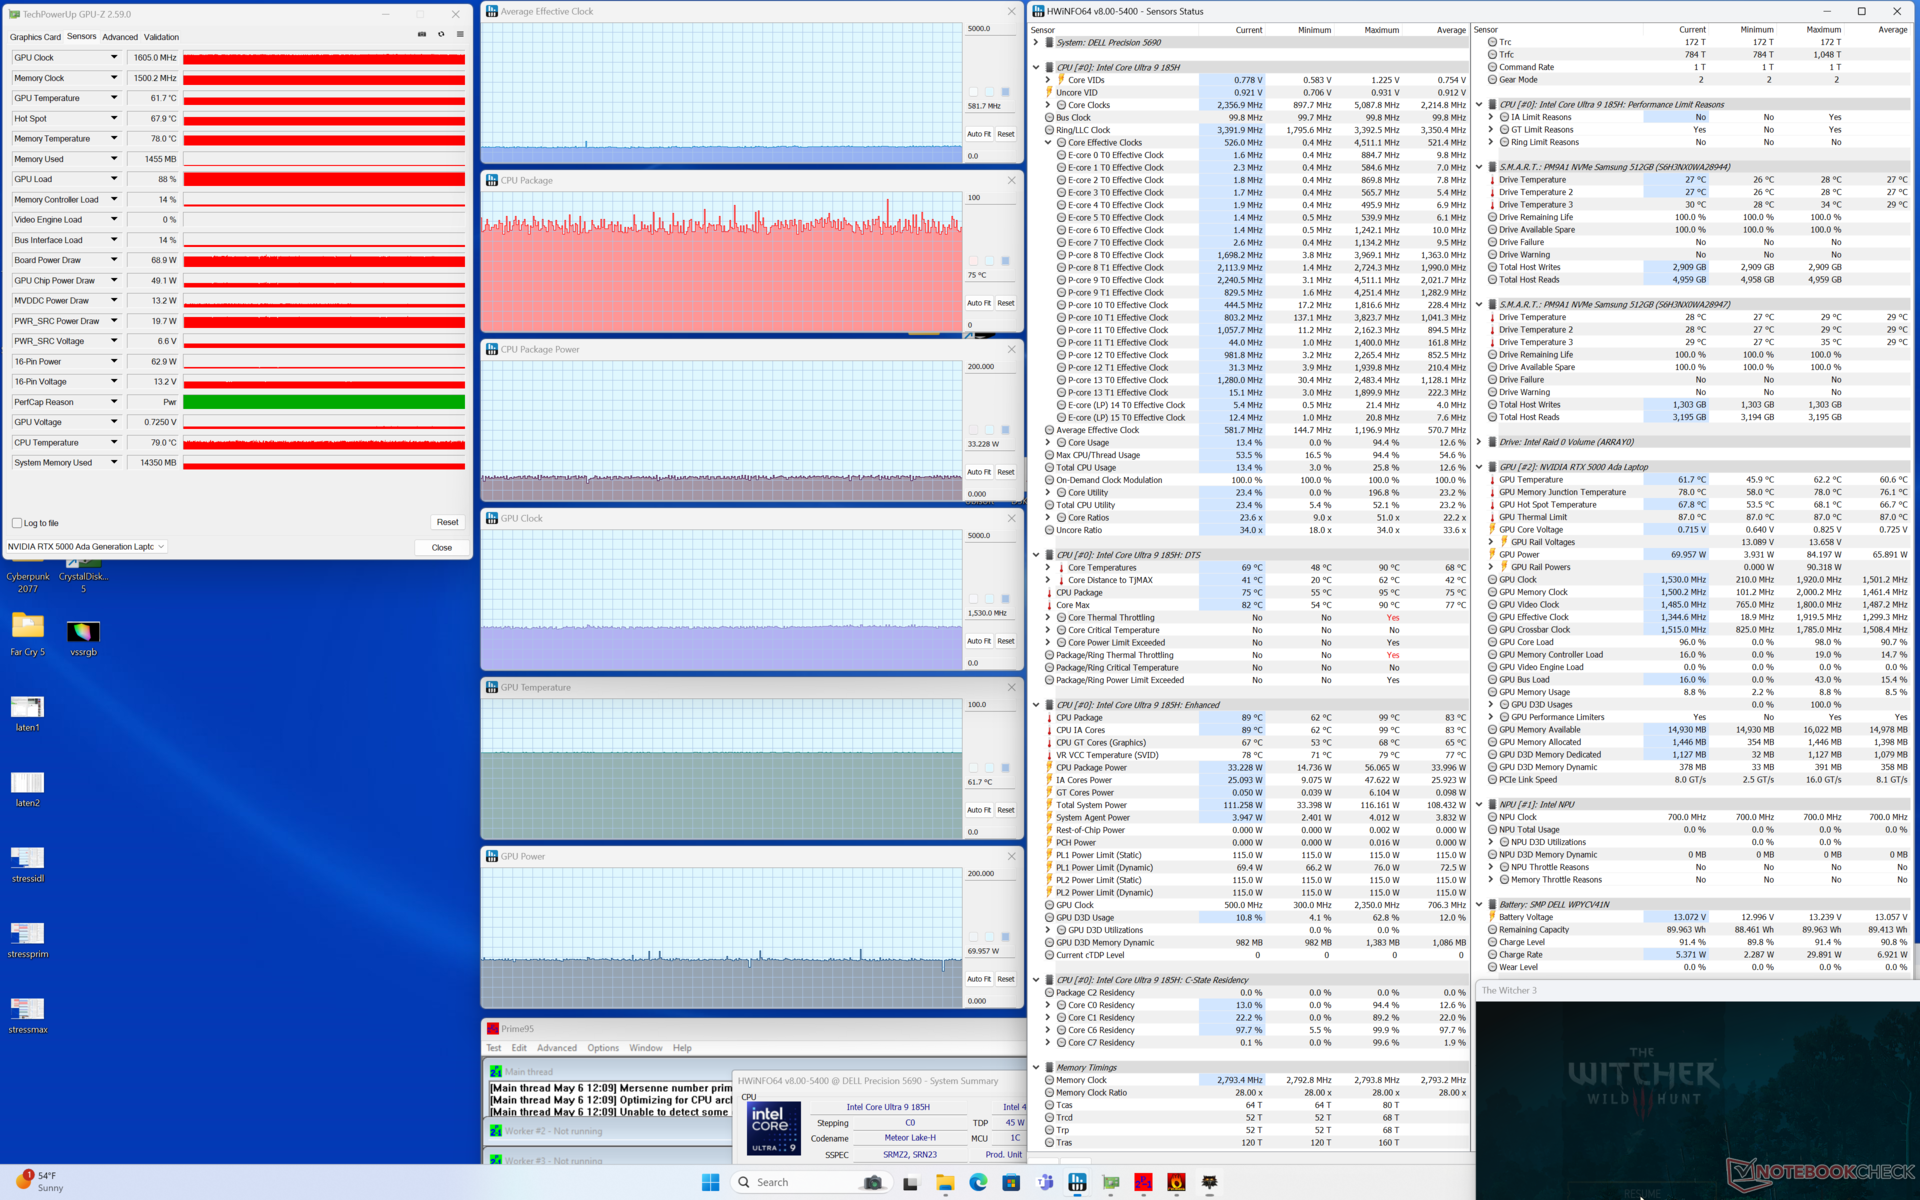
Prime95 stresini başlatırken, CPU sadece birkaç saniye sonra 100 C çekirdek sıcaklığına ulaşana kadar 3,7 GHz ve 120 W'a yükselir. Daha sonra 3 GHz'e ve 73 W'a düşer ve işlem boyunca nispeten sabit kalır. Hem çekirdek sıcaklığı hem de paket güç çekişi Precision 5680'de kaydettiğimizden biraz daha yüksek olacaktır.
Çalışırken GPU kartı güç çekişi Witcher 3 gPU Nvidia Control Center'da 90 W olarak listelenmesine rağmen 72 W'da kararlı olacaktır. Sonuçlar geçen yılki modelde kaydettiklerimize benzer.
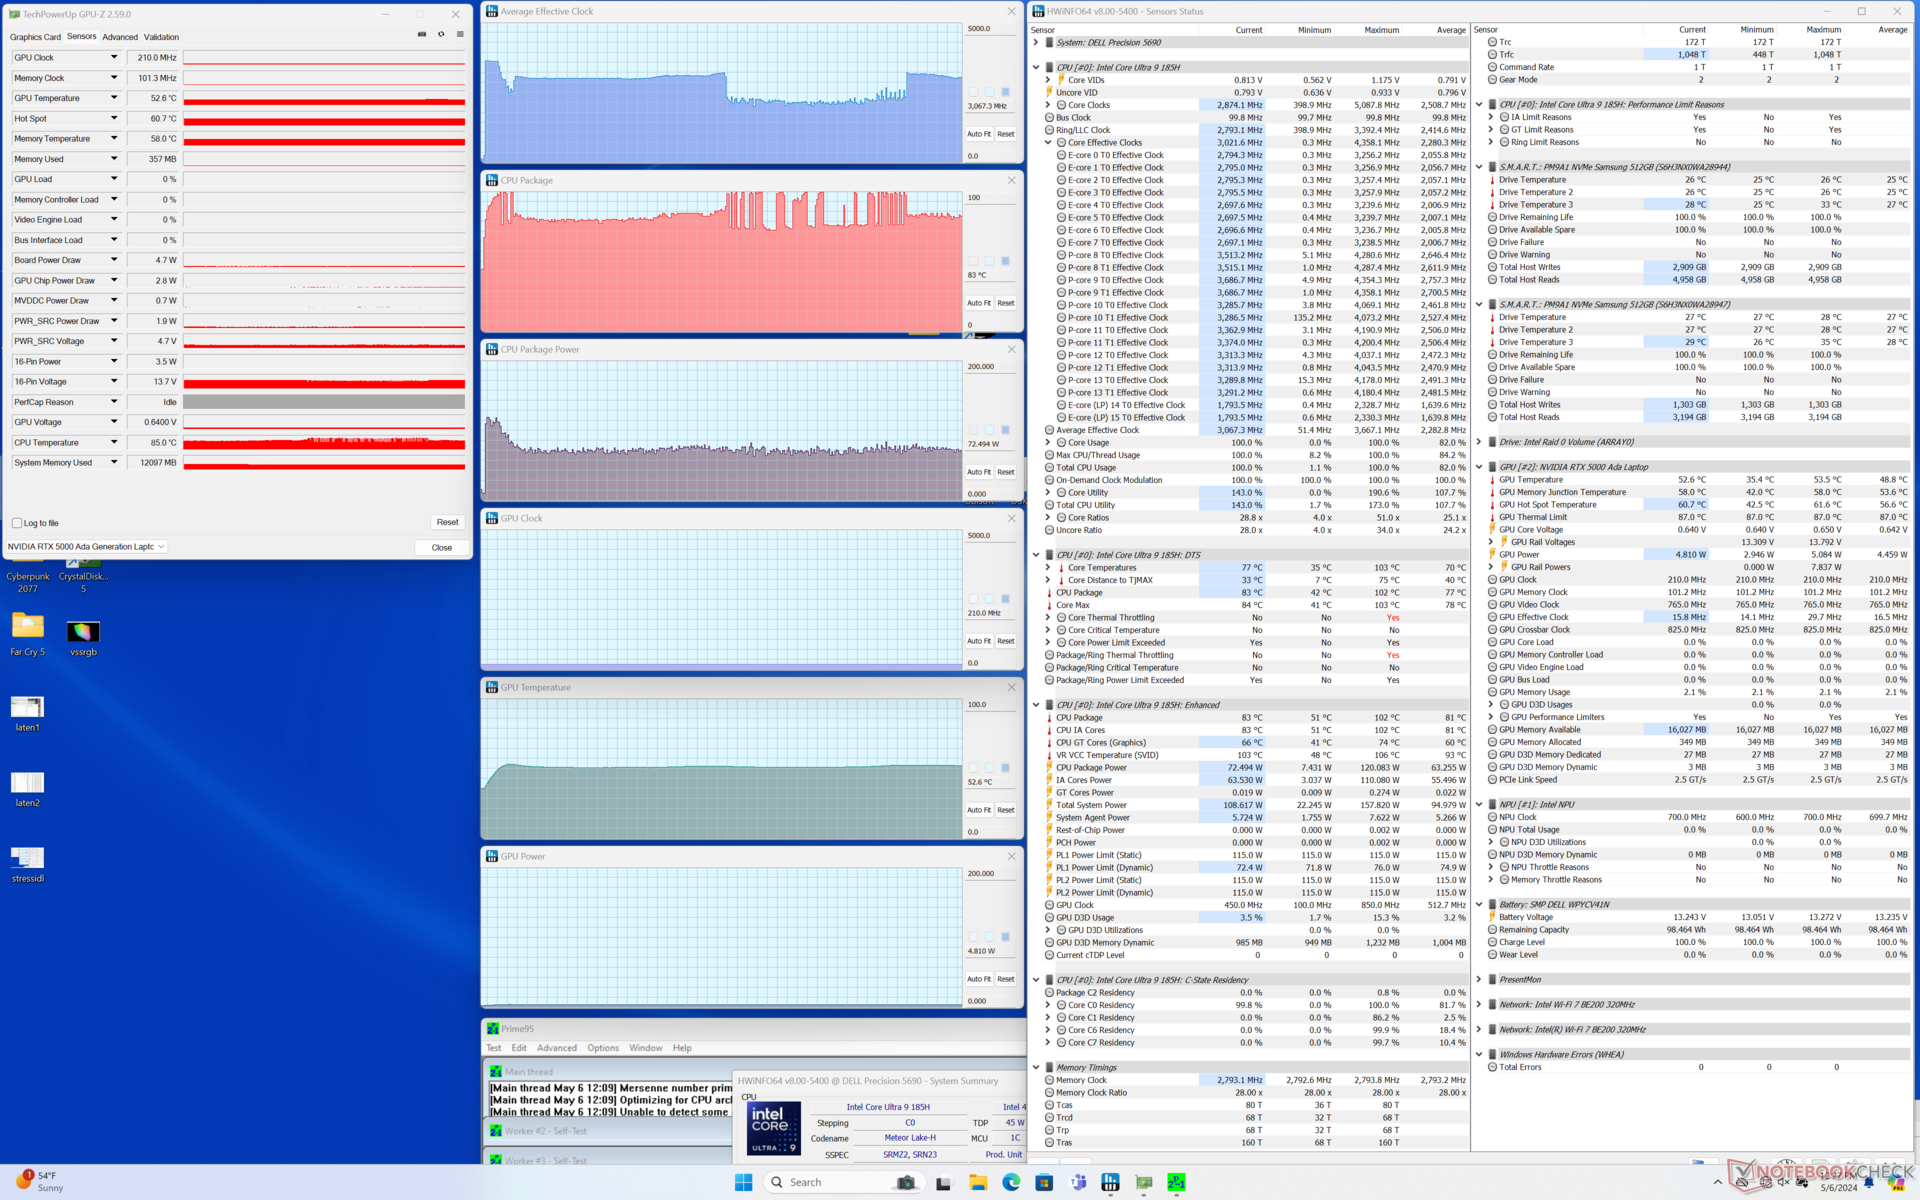
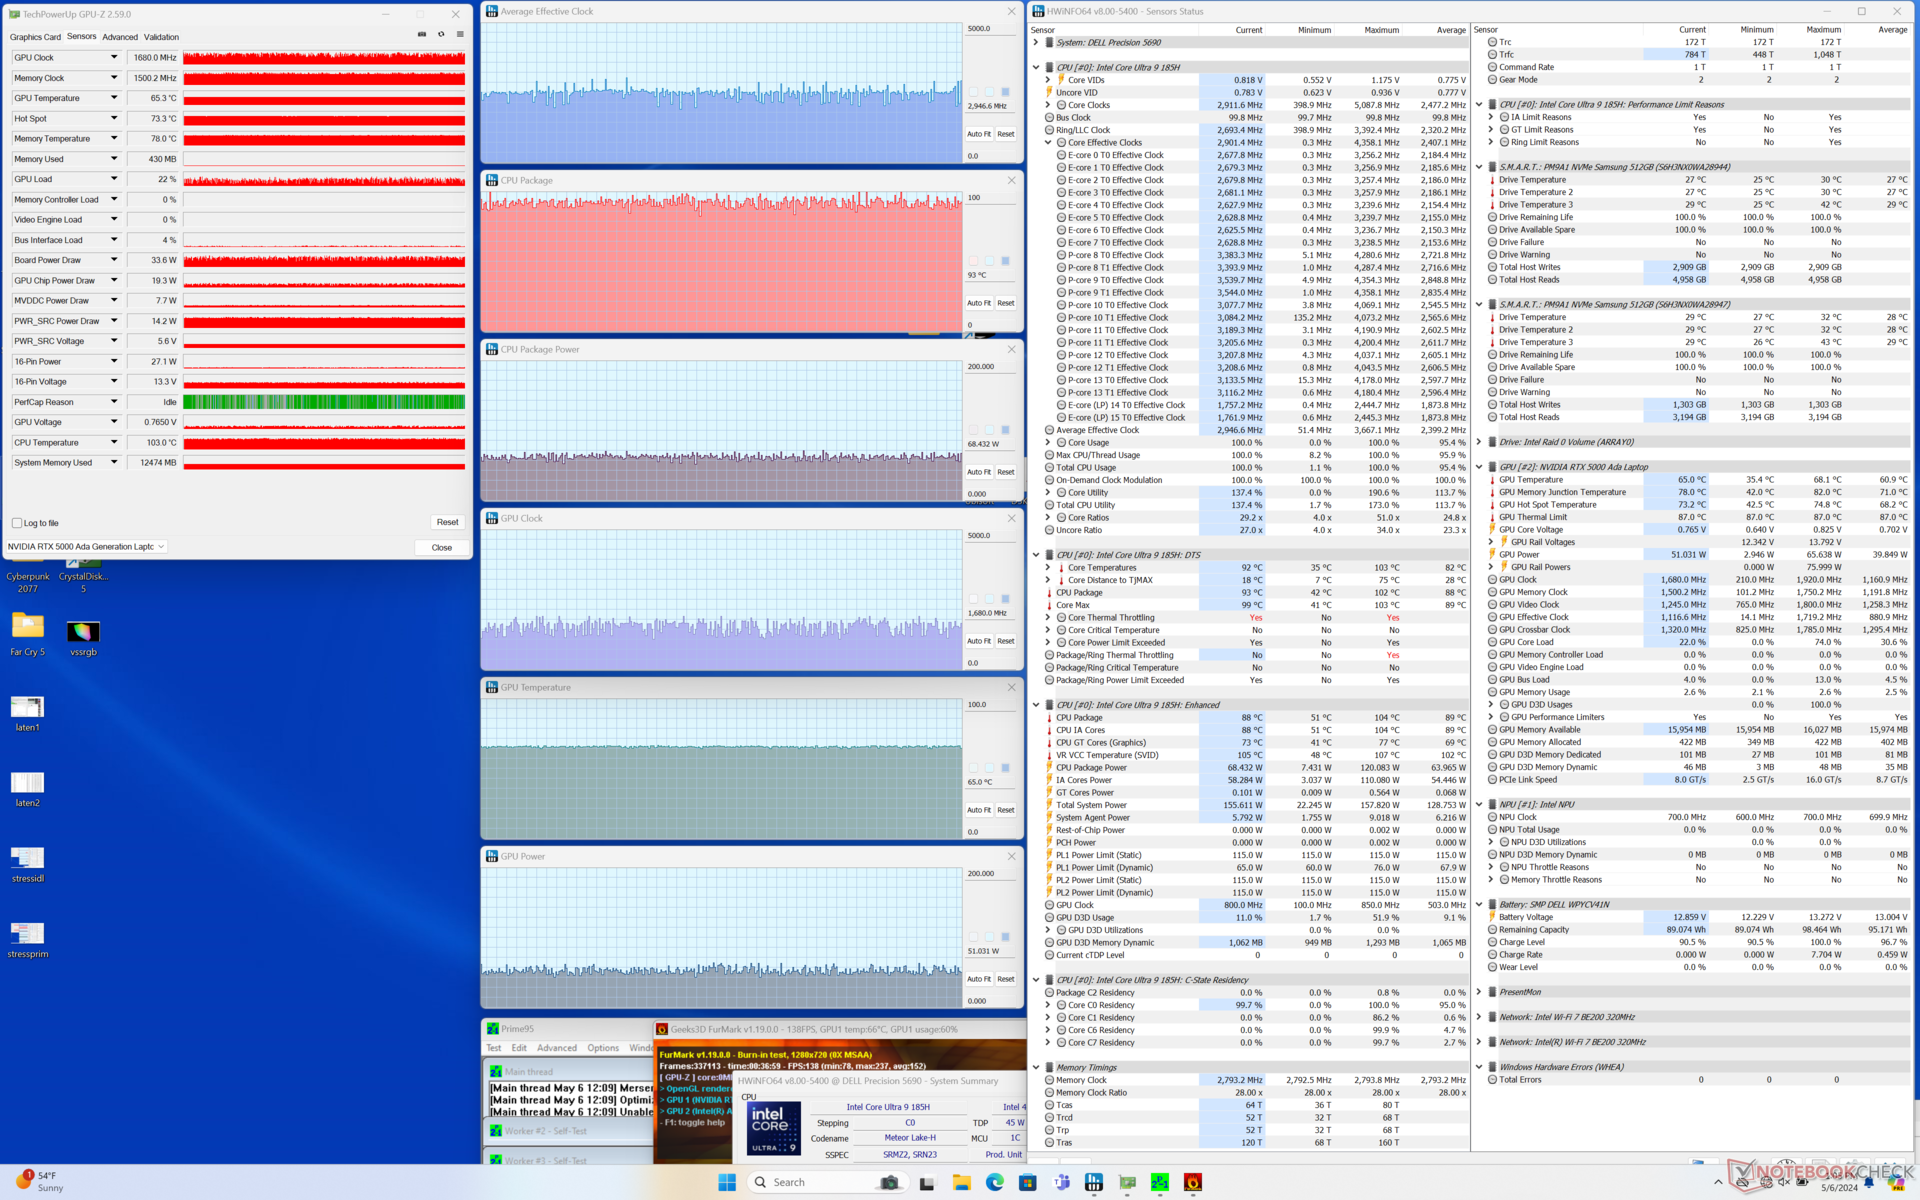
| CPU Saati (GHz) | GPU Saati (MHz) | Ortalama CPU Sıcaklığı (°C) | Ortalama GPU Sıcaklığı (°C) | |
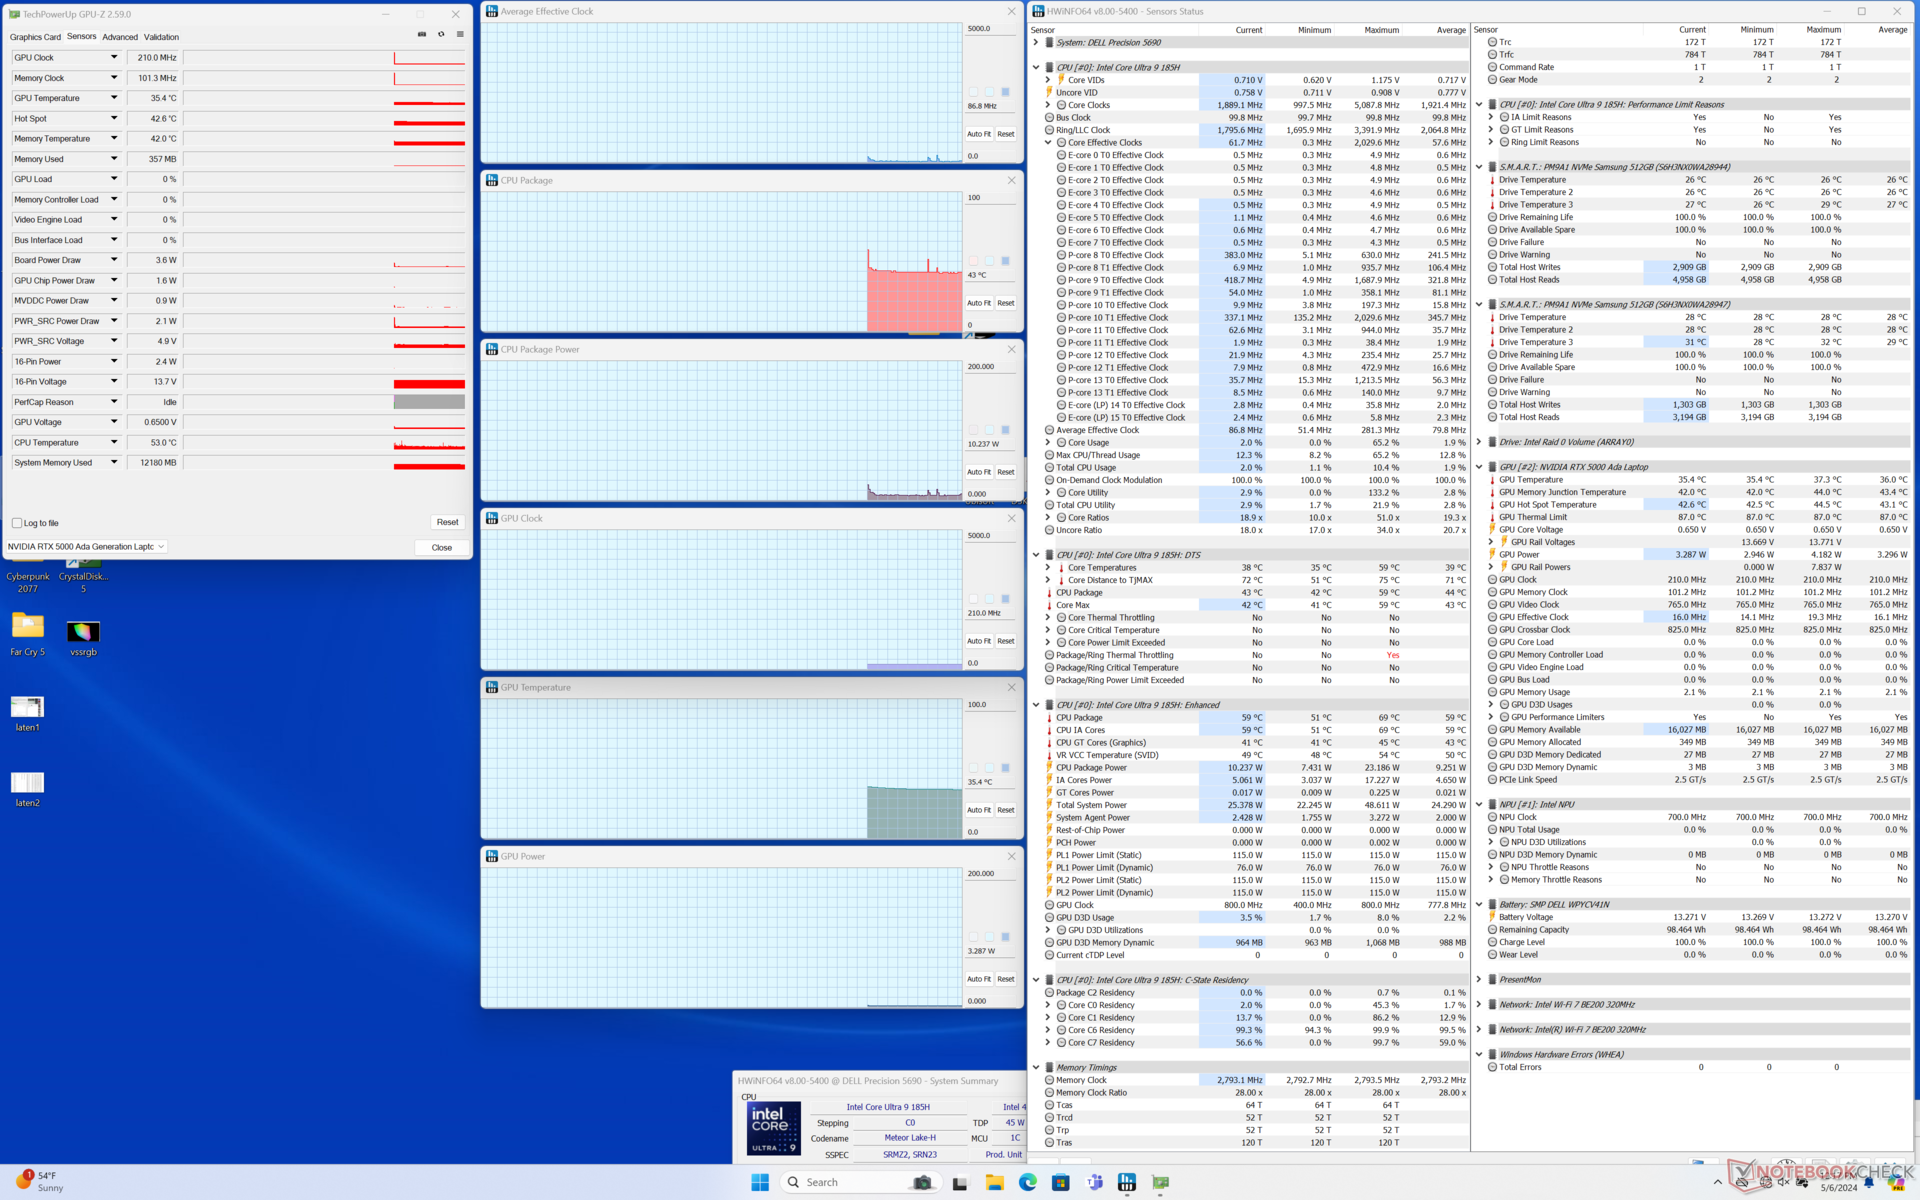
| Sistem Boşta | -- | -- | 43 | 35 |
| Prime95 Stres | 3.0 | -- | 83 | 53 |
| Prime95 + FurMark Stres | ~3.0 | ~1680 | 93 | 65 |
| Witcher 3 Stres | ~0,6 | 1530 | 75 | 62 |
Sistem Performansı
PCMark 10 skorları Precision 5680'de kaydettiklerimizle aynıdır ve geleneksel görevler söz konusu olduğunda iki model arasında önemli bir performans farkı olmadığını göstermektedir.
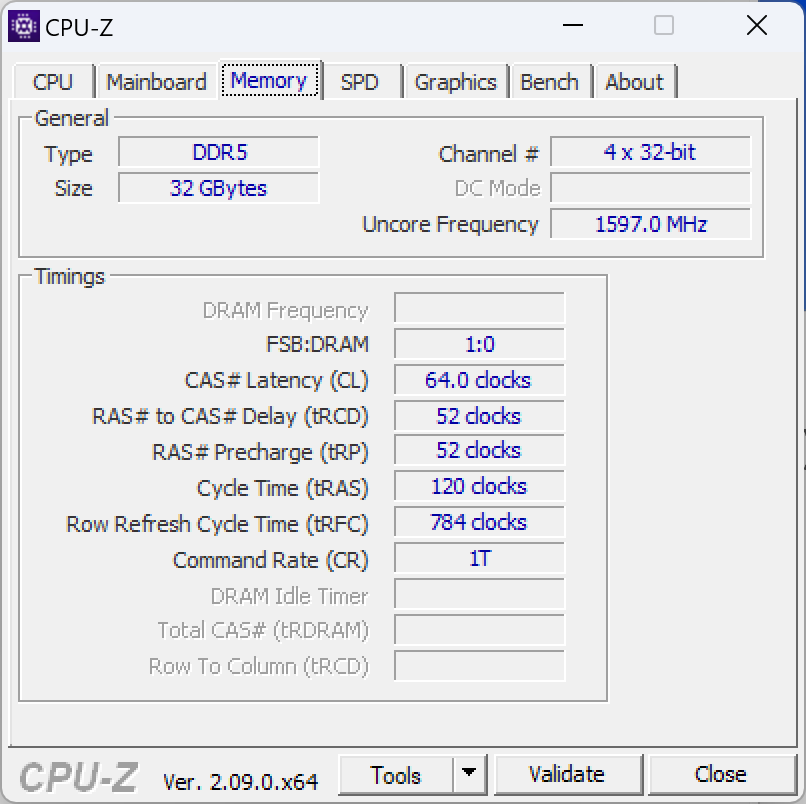
Sistem RAM'i bu yıl biraz daha hızlı (7467'ye karşı 6000 MT/s) ve bu da iyileştirilmiş AIDA64 kıyaslama sonuçlarına yansıyor.

CrossMark: Overall | Productivity | Creativity | Responsiveness
WebXPRT 3: Overall
WebXPRT 4: Overall
Mozilla Kraken 1.1: Total
| PCMark 10 / Score | |
| Dell Precision 5000 5680 | |
| HP ZBook Fury 16 G10 | |
| Dell Precision 5690 | |
| Ortalama Intel Core Ultra 9 185H, NVIDIA RTX 5000 Ada Generation Laptop (n=1) | |
| Lenovo ThinkPad P1 G6-21FV000DGE | |
| Lenovo ThinkPad P16 G2 21FA000FGE | |
| MSI CreatorPro Z16P B12UKST | |
| PCMark 10 / Essentials | |
| Dell Precision 5000 5680 | |
| Lenovo ThinkPad P1 G6-21FV000DGE | |
| HP ZBook Fury 16 G10 | |
| Dell Precision 5690 | |
| Ortalama Intel Core Ultra 9 185H, NVIDIA RTX 5000 Ada Generation Laptop (n=1) | |
| Lenovo ThinkPad P16 G2 21FA000FGE | |
| MSI CreatorPro Z16P B12UKST | |
| PCMark 10 / Productivity | |
| Dell Precision 5000 5680 | |
| Dell Precision 5690 | |
| Ortalama Intel Core Ultra 9 185H, NVIDIA RTX 5000 Ada Generation Laptop (n=1) | |
| Lenovo ThinkPad P1 G6-21FV000DGE | |
| Lenovo ThinkPad P16 G2 21FA000FGE | |
| MSI CreatorPro Z16P B12UKST | |
| HP ZBook Fury 16 G10 | |
| PCMark 10 / Digital Content Creation | |
| HP ZBook Fury 16 G10 | |
| Dell Precision 5000 5680 | |
| Dell Precision 5690 | |
| Ortalama Intel Core Ultra 9 185H, NVIDIA RTX 5000 Ada Generation Laptop (n=1) | |
| Lenovo ThinkPad P1 G6-21FV000DGE | |
| MSI CreatorPro Z16P B12UKST | |
| Lenovo ThinkPad P16 G2 21FA000FGE | |
| CrossMark / Overall | |
| MSI CreatorPro Z16P B12UKST | |
| Dell Precision 5000 5680 | |
| HP ZBook Fury 16 G10 | |
| Lenovo ThinkPad P1 G6-21FV000DGE | |
| Lenovo ThinkPad P16 G2 21FA000FGE | |
| Dell Precision 5690 | |
| Ortalama Intel Core Ultra 9 185H, NVIDIA RTX 5000 Ada Generation Laptop (n=1) | |
| CrossMark / Productivity | |
| HP ZBook Fury 16 G10 | |
| MSI CreatorPro Z16P B12UKST | |
| Dell Precision 5000 5680 | |
| Lenovo ThinkPad P1 G6-21FV000DGE | |
| Dell Precision 5690 | |
| Ortalama Intel Core Ultra 9 185H, NVIDIA RTX 5000 Ada Generation Laptop (n=1) | |
| Lenovo ThinkPad P16 G2 21FA000FGE | |
| CrossMark / Creativity | |
| Dell Precision 5000 5680 | |
| Lenovo ThinkPad P16 G2 21FA000FGE | |
| HP ZBook Fury 16 G10 | |
| MSI CreatorPro Z16P B12UKST | |
| Lenovo ThinkPad P1 G6-21FV000DGE | |
| Dell Precision 5690 | |
| Ortalama Intel Core Ultra 9 185H, NVIDIA RTX 5000 Ada Generation Laptop (n=1) | |
| CrossMark / Responsiveness | |
| MSI CreatorPro Z16P B12UKST | |
| HP ZBook Fury 16 G10 | |
| Lenovo ThinkPad P1 G6-21FV000DGE | |
| Dell Precision 5000 5680 | |
| Dell Precision 5690 | |
| Ortalama Intel Core Ultra 9 185H, NVIDIA RTX 5000 Ada Generation Laptop (n=1) | |
| Lenovo ThinkPad P16 G2 21FA000FGE | |
| WebXPRT 3 / Overall | |
| Dell Precision 5000 5680 | |
| HP ZBook Fury 16 G10 | |
| Lenovo ThinkPad P16 G2 21FA000FGE | |
| Lenovo ThinkPad P1 G6-21FV000DGE | |
| MSI CreatorPro Z16P B12UKST | |
| Dell Precision 5690 | |
| Ortalama Intel Core Ultra 9 185H, NVIDIA RTX 5000 Ada Generation Laptop (n=1) | |
| WebXPRT 4 / Overall | |
| Lenovo ThinkPad P1 G6-21FV000DGE | |
| HP ZBook Fury 16 G10 | |
| Dell Precision 5000 5680 | |
| Dell Precision 5690 | |
| Ortalama Intel Core Ultra 9 185H, NVIDIA RTX 5000 Ada Generation Laptop (n=1) | |
| MSI CreatorPro Z16P B12UKST | |
| Mozilla Kraken 1.1 / Total | |
| MSI CreatorPro Z16P B12UKST | |
| Dell Precision 5690 | |
| Ortalama Intel Core Ultra 9 185H, NVIDIA RTX 5000 Ada Generation Laptop (n=1) | |
| Lenovo ThinkPad P16 G2 21FA000FGE | |
| Dell Precision 5000 5680 | |
| Lenovo ThinkPad P1 G6-21FV000DGE | |
| HP ZBook Fury 16 G10 | |
* ... daha küçük daha iyidir
| PCMark 10 Score | 8065 puan | |
Yardım | ||
| AIDA64 / Memory Copy | |
| Dell Precision 5690 | |
| Ortalama Intel Core Ultra 9 185H (69929 - 95718, n=20) | |
| Dell Precision 5000 5680 | |
| MSI CreatorPro Z16P B12UKST | |
| HP ZBook Fury 16 G10 | |
| Lenovo ThinkPad P16 G2 21FA000FGE | |
| Lenovo ThinkPad P1 G6-21FV000DGE | |
| AIDA64 / Memory Read | |
| Dell Precision 5690 | |
| Ortalama Intel Core Ultra 9 185H (64619 - 87768, n=20) | |
| Dell Precision 5000 5680 | |
| MSI CreatorPro Z16P B12UKST | |
| HP ZBook Fury 16 G10 | |
| Lenovo ThinkPad P16 G2 21FA000FGE | |
| Lenovo ThinkPad P1 G6-21FV000DGE | |
| AIDA64 / Memory Write | |
| Dell Precision 5000 5680 | |
| Dell Precision 5690 | |
| Ortalama Intel Core Ultra 9 185H (51114 - 93871, n=20) | |
| MSI CreatorPro Z16P B12UKST | |
| HP ZBook Fury 16 G10 | |
| Lenovo ThinkPad P16 G2 21FA000FGE | |
| Lenovo ThinkPad P1 G6-21FV000DGE | |
| AIDA64 / Memory Latency | |
| Ortalama Intel Core Ultra 9 185H (121.4 - 259, n=20) | |
| Dell Precision 5690 | |
| HP ZBook Fury 16 G10 | |
| Lenovo ThinkPad P16 G2 21FA000FGE | |
| MSI CreatorPro Z16P B12UKST | |
| Dell Precision 5000 5680 | |
| Lenovo ThinkPad P1 G6-21FV000DGE | |
* ... daha küçük daha iyidir
DPC Gecikme Süresi
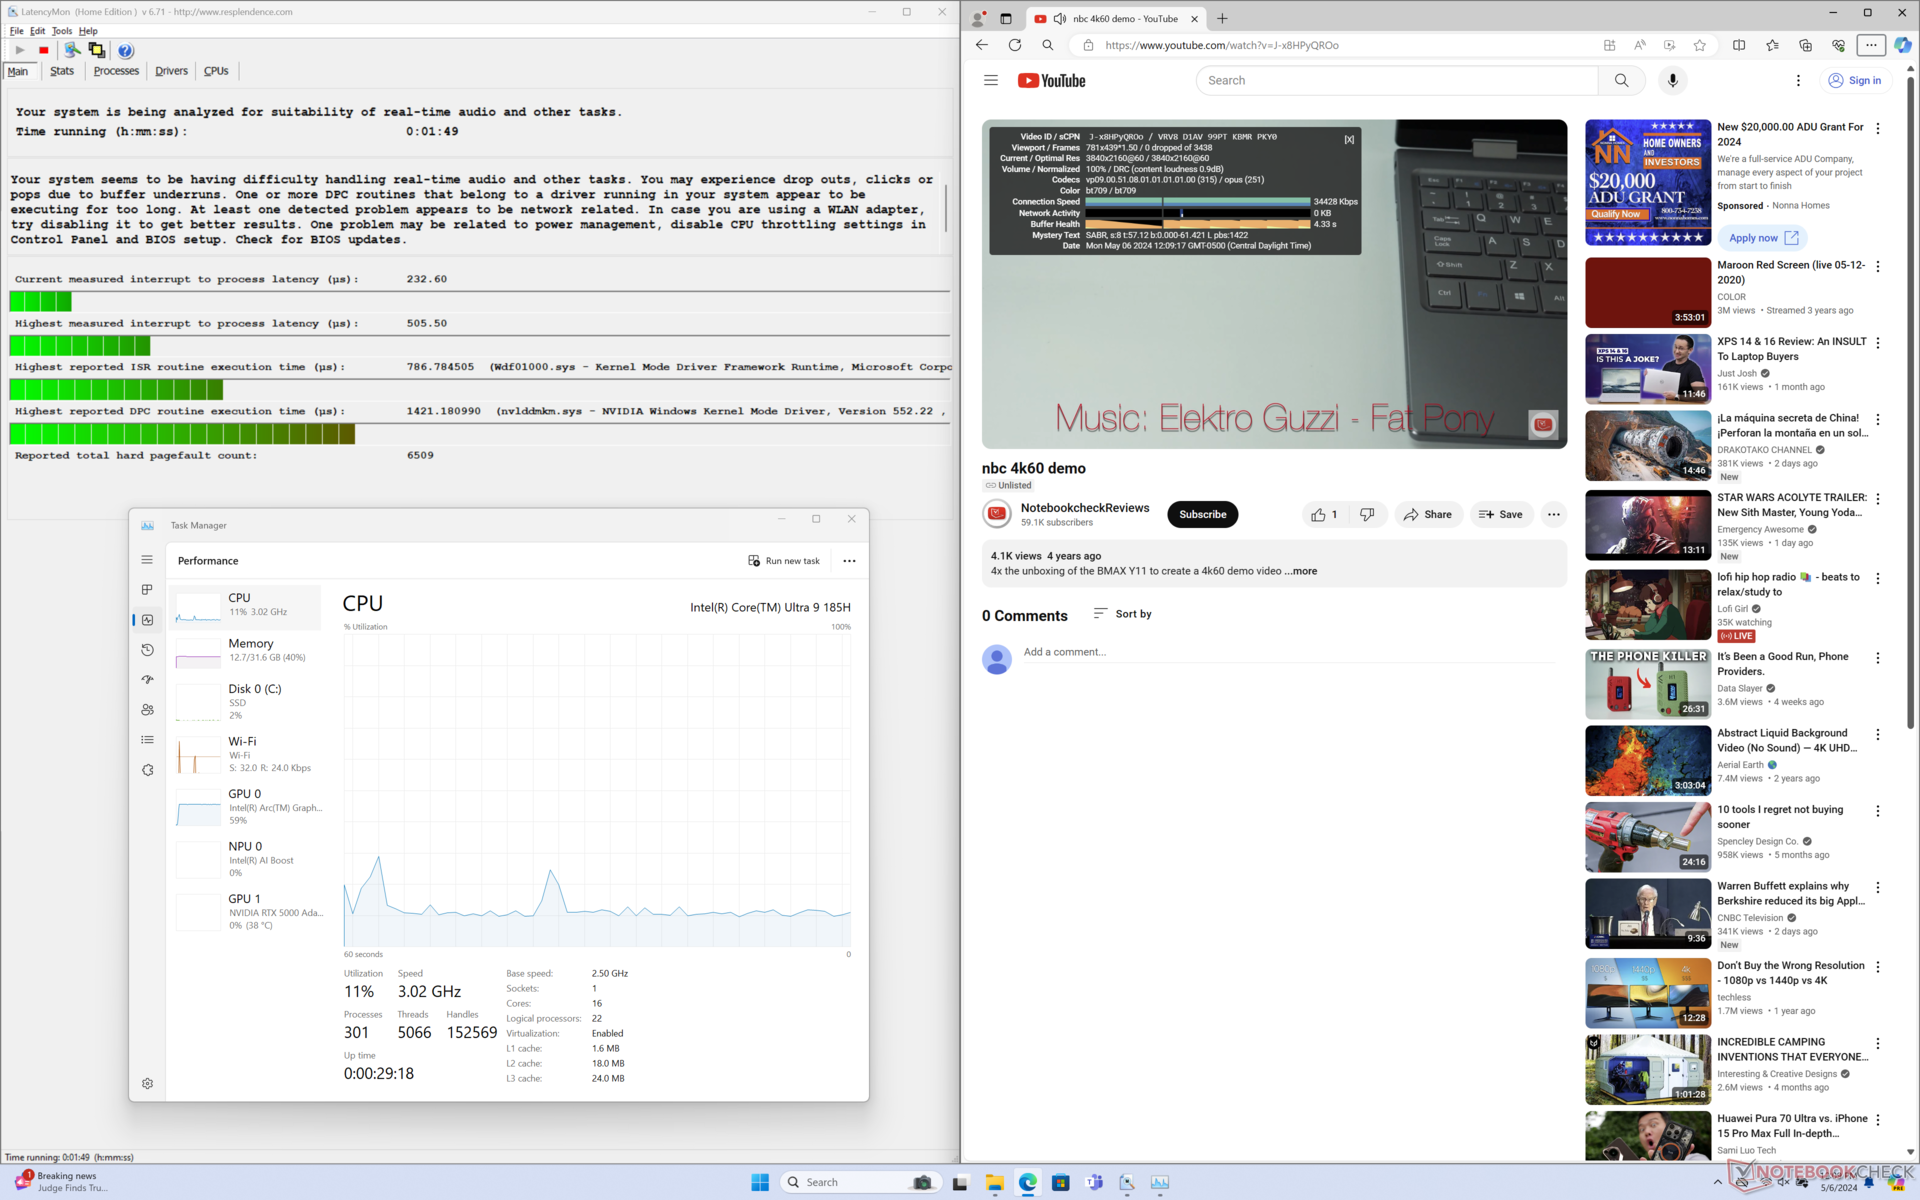
LatencyMon, ana sayfamızın birden fazla tarayıcı sekmesini açarken yalnızca küçük DPC sorunlarını ortaya çıkarır. 60 FPS'de 4K video oynatma, kaydedilen hiçbir kare düşmesi olmadan mükemmeldir.

| DPC Latencies / LatencyMon - interrupt to process latency (max), Web, Youtube, Prime95 | |
| HP ZBook Fury 16 G10 | |
| Lenovo ThinkPad P1 G6-21FV000DGE | |
| Dell Precision 5000 5680 | |
| Lenovo ThinkPad P16 G2 21FA000FGE | |
| MSI CreatorPro Z16P B12UKST | |
| Dell Precision 5690 | |
* ... daha küçük daha iyidir
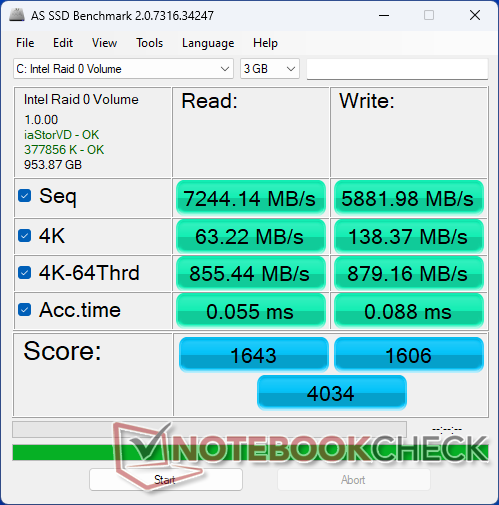
Depolama Cihazları
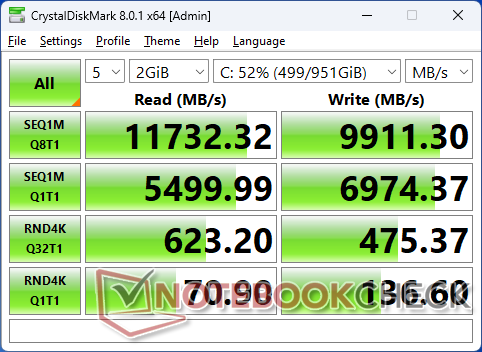
Test ünitemiz iki adet Samsung PM9A1 PCIe4 x4 NVMe SSD'ler RAID 0 yapılandırmasında sırasıyla 12000 MB/sn ve 9000 MB/sn'yi aşan okuma ve yazma hızları için. DiskSpd'yi bir döngü içinde çalıştırırken kaydedilen hiçbir kısıtlama olmadan performans sabittir.

| Drive Performance rating - Percent | |
| MSI CreatorPro Z16P B12UKST -8! | |
| Lenovo ThinkPad P1 G6-21FV000DGE | |
| Dell Precision 5690 | |
| HP ZBook Fury 16 G10 | |
| Dell Precision 5000 5680 | |
| Lenovo ThinkPad P16 G2 21FA000FGE | |
* ... daha küçük daha iyidir
Disk Throttling: DiskSpd Read Loop, Queue Depth 8
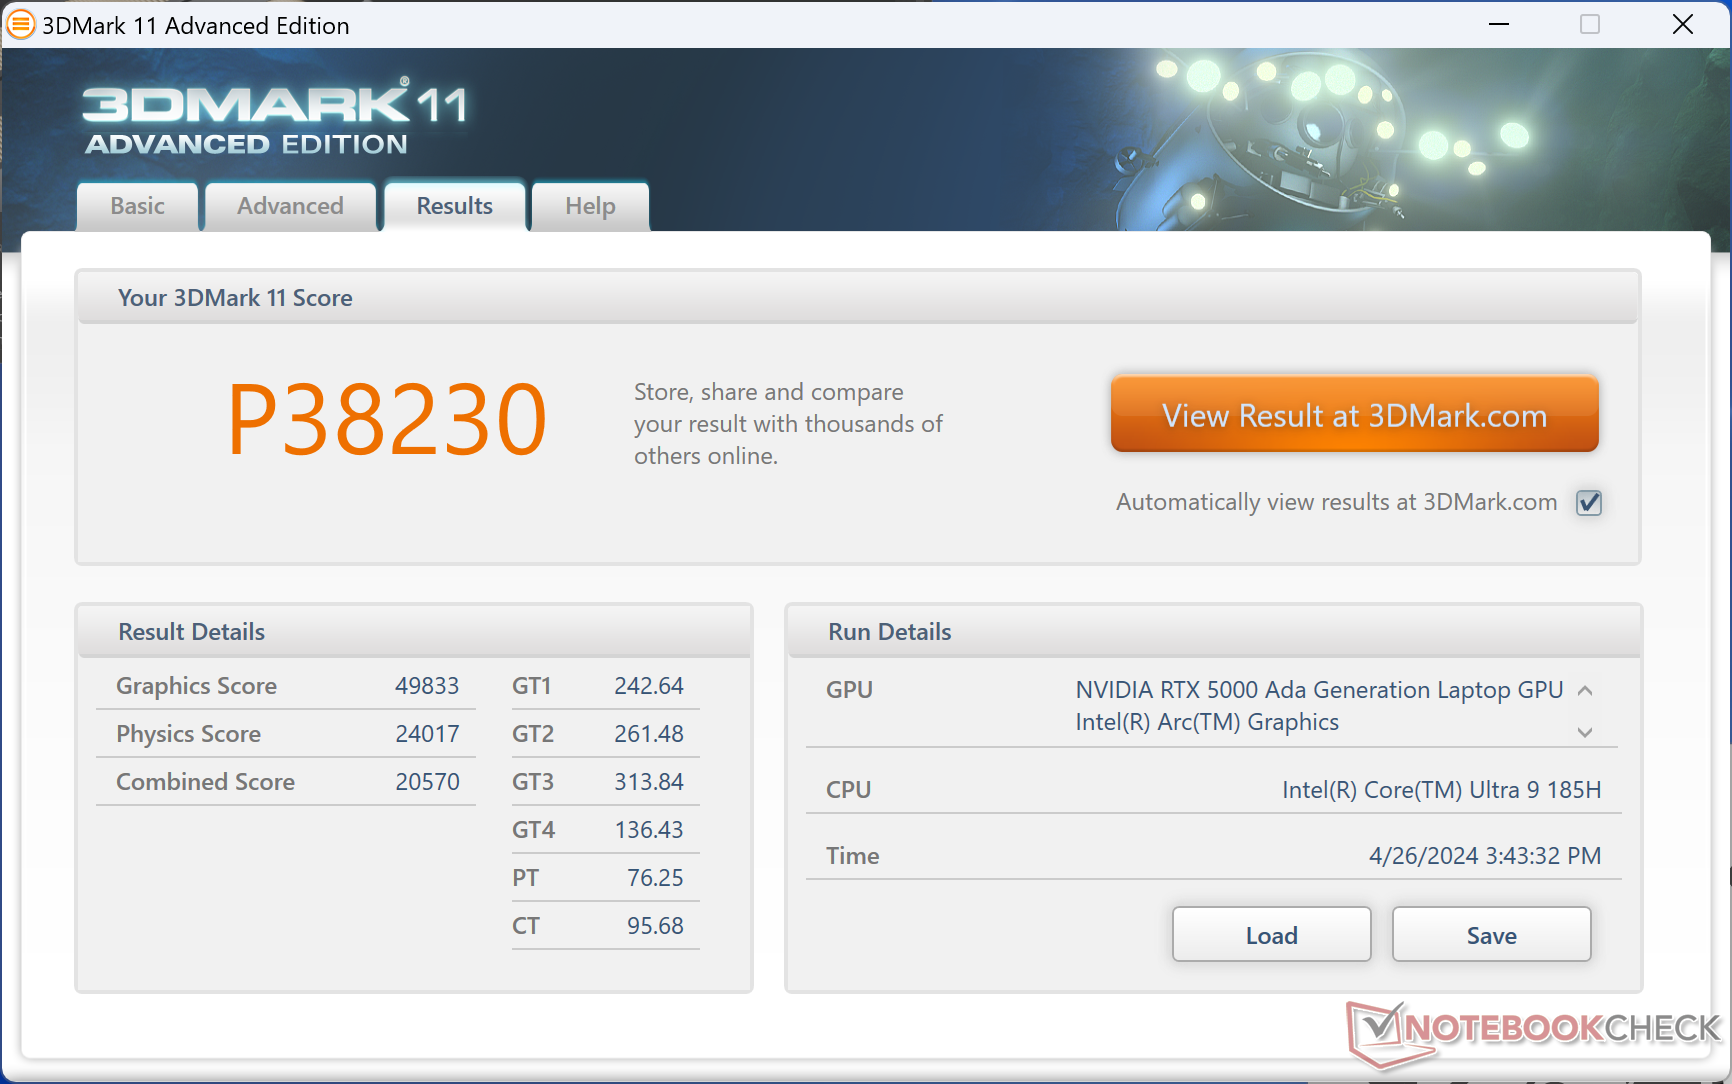
GPU Performansı - RTX 5000 Ada'ya Kadar
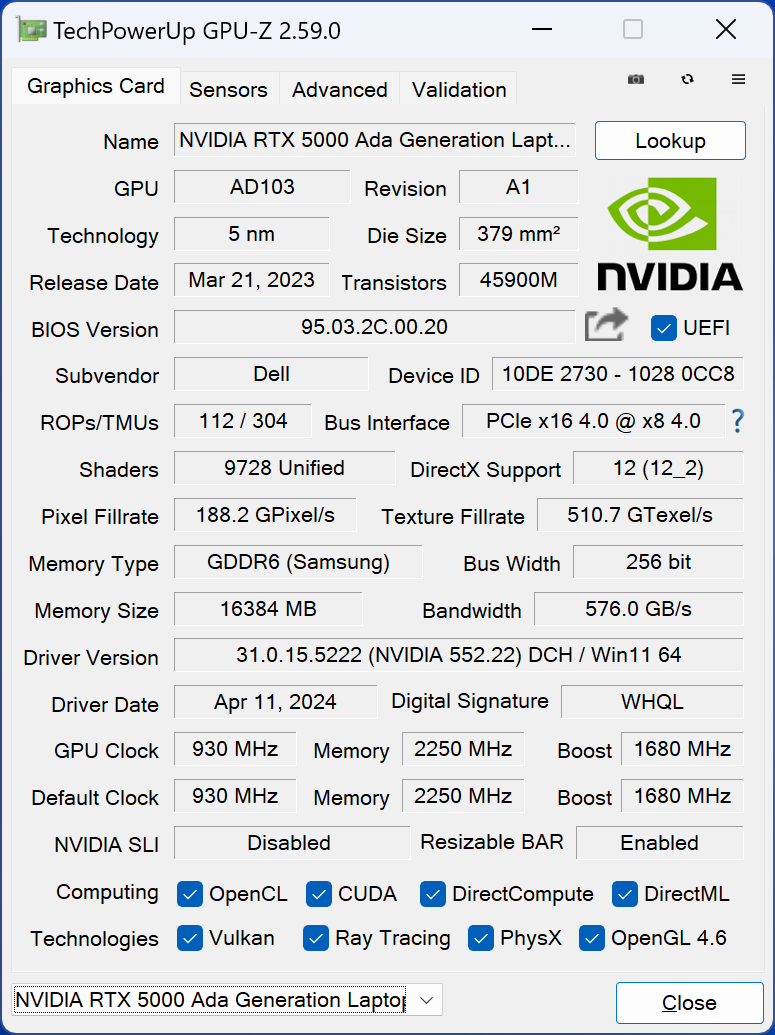
Nvidia GPU seçenekleri geçen yıldan bu yana değişmedi ve bu nedenle RTX 5000 Ada en üst düzey seçenek olmaya devam ediyor. Bu GPU GeForce RTX 4090 'dan türetilmiştir ve bu nedenle daha yavaş RTX 4000 Ada veya 3500 Ada ile yapılandırıldığında 12 GB yerine özellikle 16 GB VRAM içerir. Kullanıcılar RTX 1000 Ada'dan RTX 5000 Ada konfigürasyonumuza kadar geniş bir RTX Ada GPU yelpazesine sahiptir.
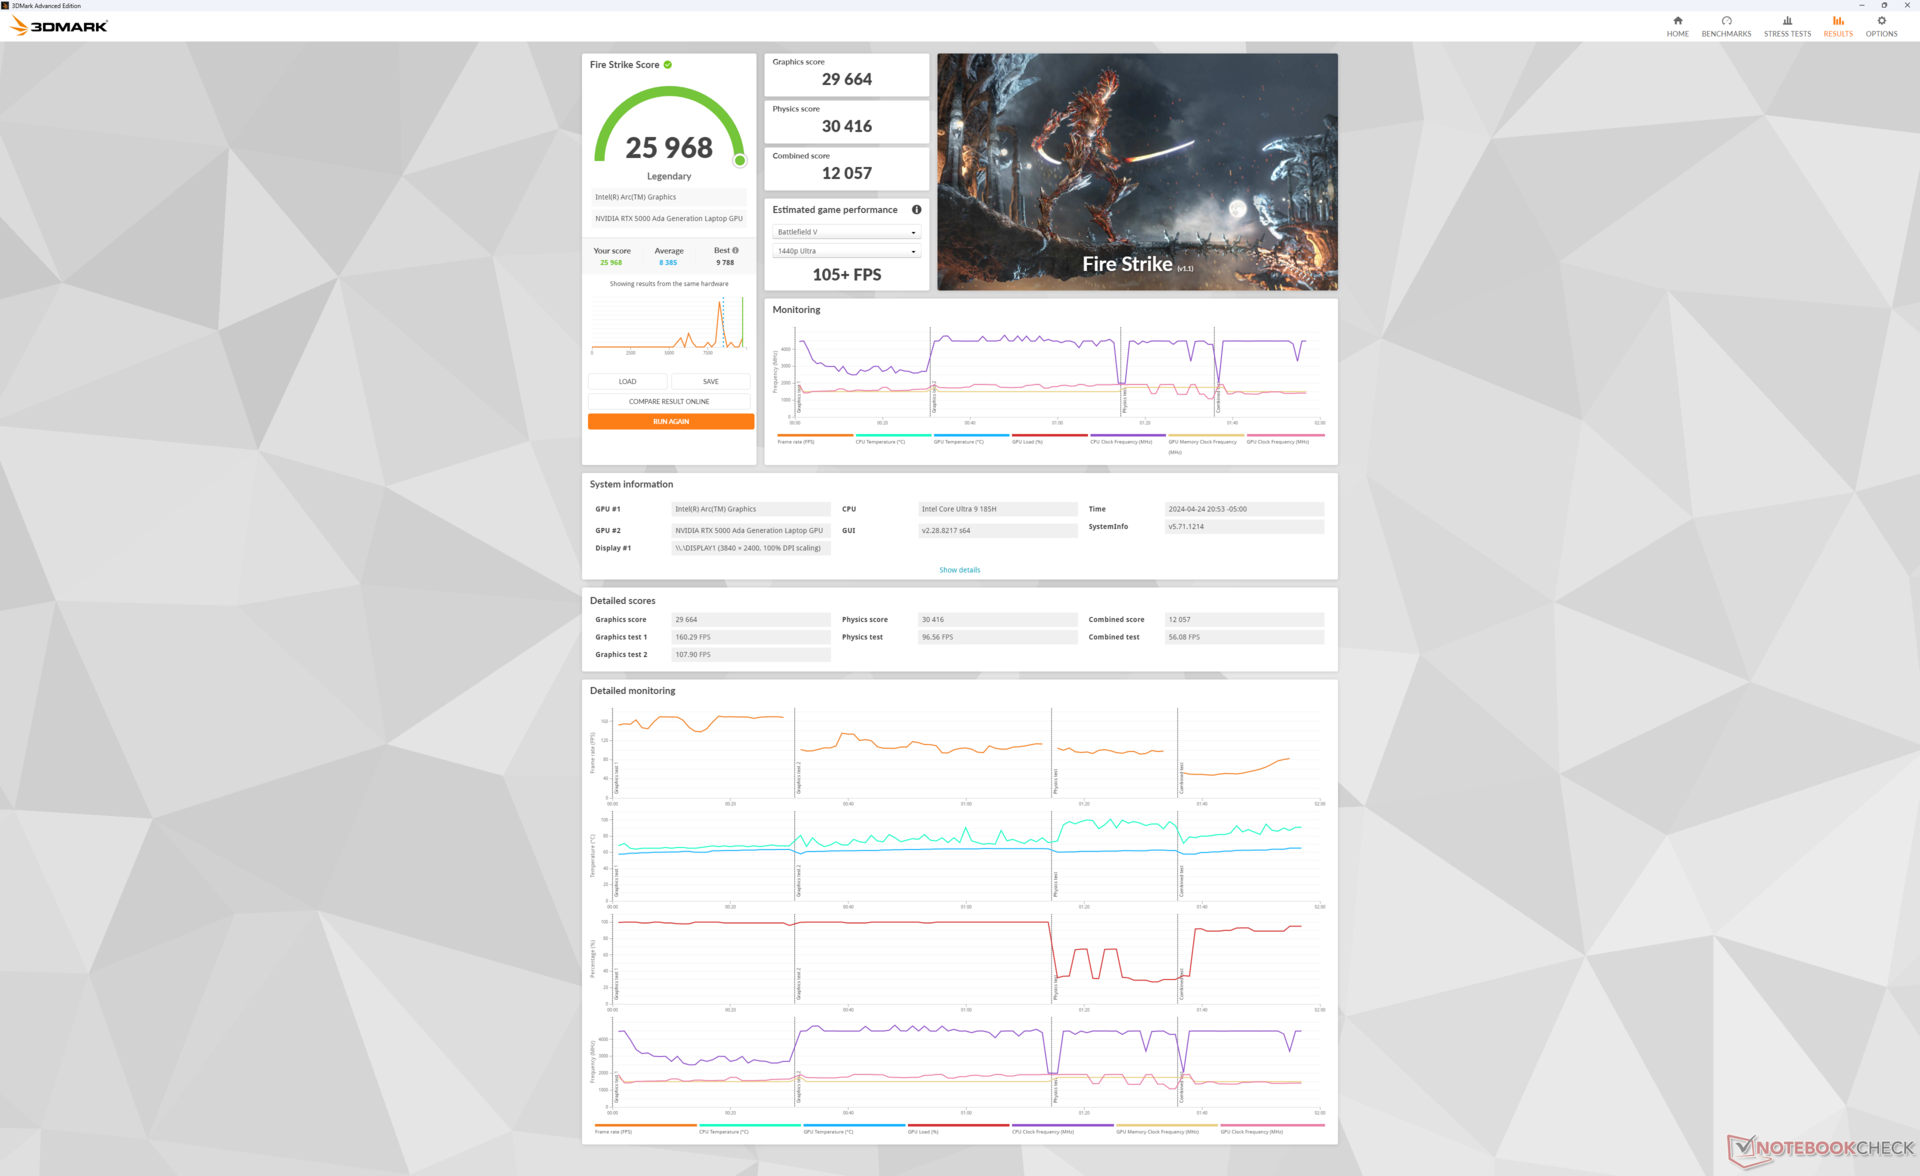
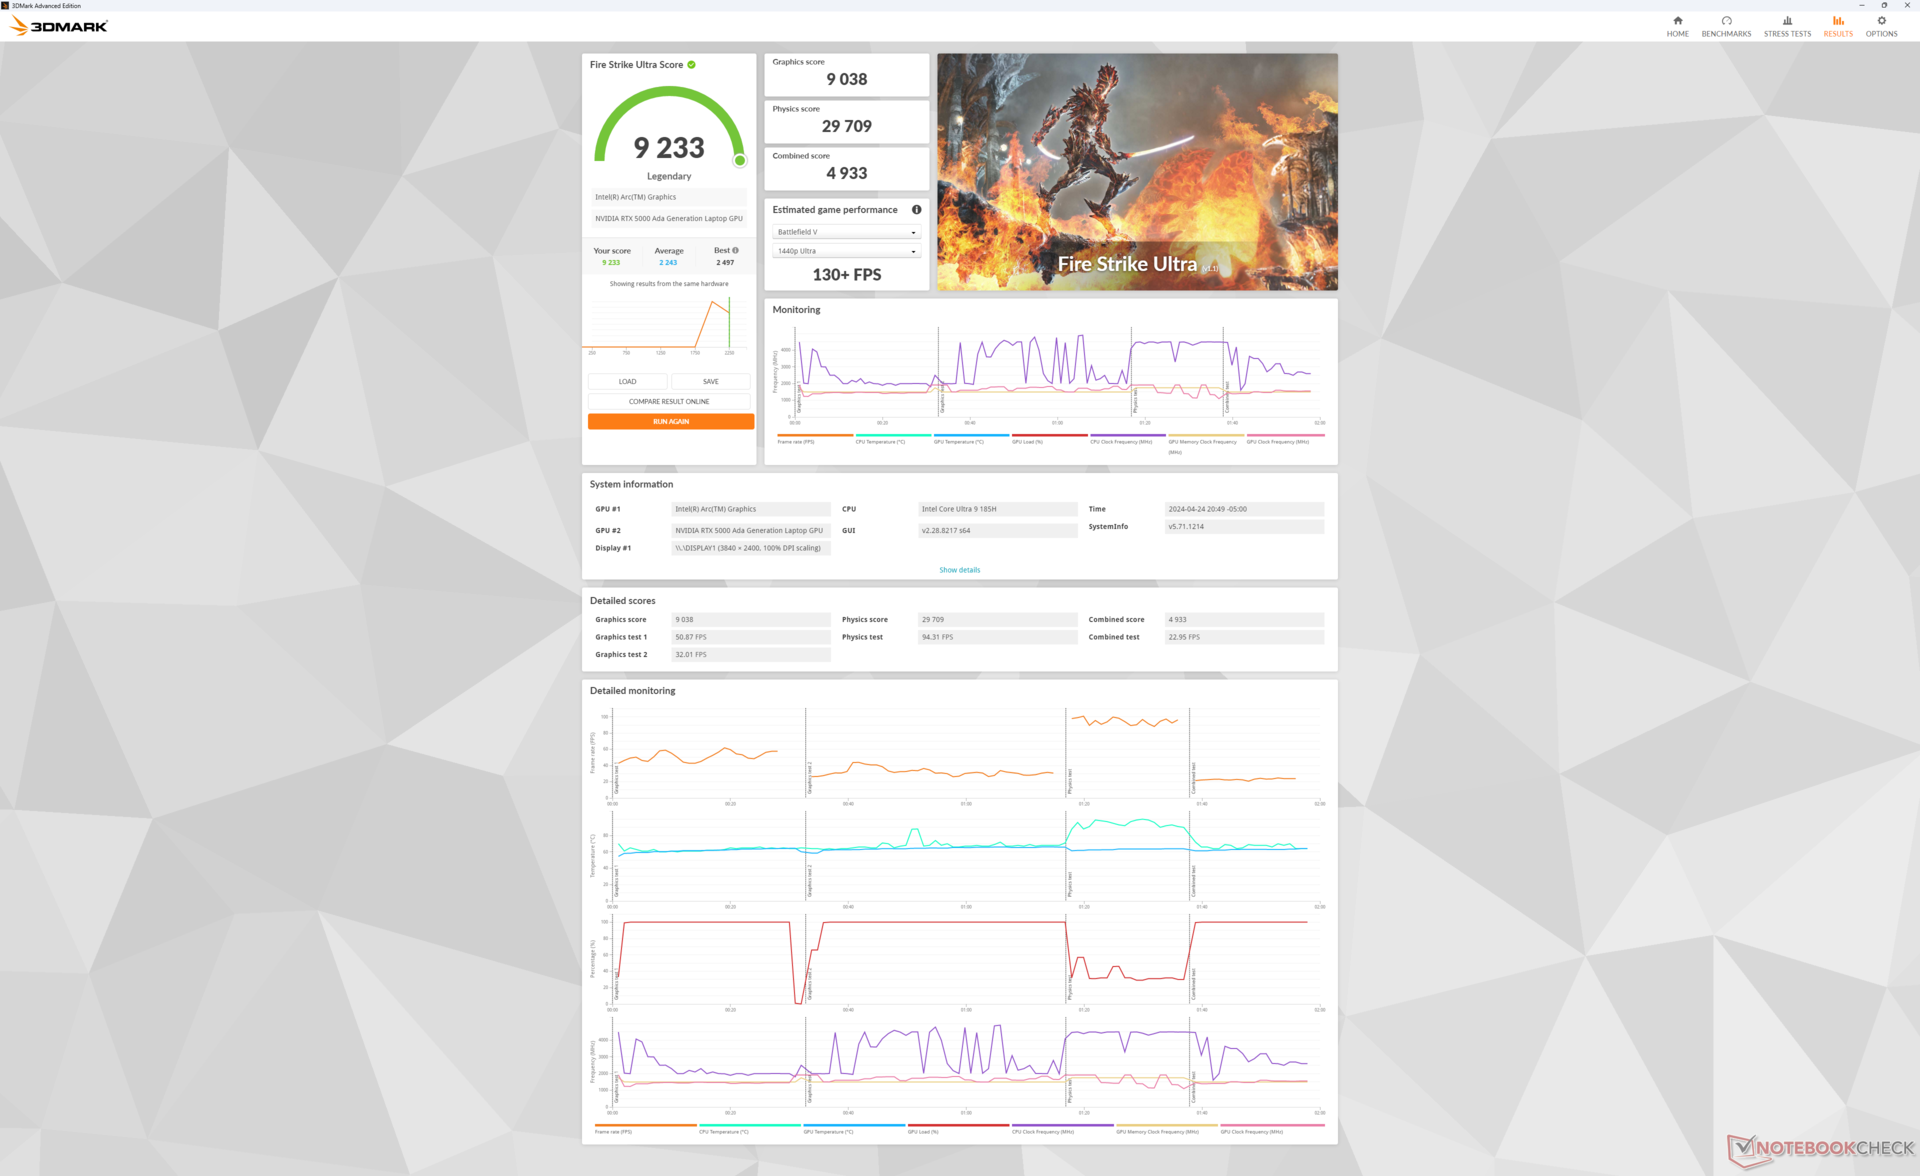
| Güç Profili | Grafik Puanı | Fizik Puanı | Birleşik Puan |
| Performans Modu | 29664 | 30416 | 12057 |
| Dengeli Mod | 29771 (-0%) | 27199 (-11%) | 11770 (-2%) |
| Akü Gücü | 26674 (-10%) | 20268 (-33%) | 9539 (-21%) |
Dengeli modda çalıştırmak işlemci performansını etkilerken, grafik performansı yukarıdaki Fire Strike sonuçlarımızda gösterildiği gibi aynı kalacaktır.
| 3DMark Performance rating - Percent | |
| HP ZBook Fury 16 G10 -2! | |
| Ortalama NVIDIA RTX 5000 Ada Generation Laptop | |
| Dell Precision 5690 -2! | |
| Dell Precision 5000 5680 -2! | |
| Asus ProArt StudioBook 16 W7600H5A-2BL2 -20! | |
| HP ZBook Fury 16 G9 -2! | |
| Dell XPS 16 9640 -35! | |
| Lenovo ThinkPad P1 G6-21FV000DGE -16! | |
| Lenovo ThinkPad P16 G2 21FA000FGE -18! | |
| MSI CreatorPro Z16P B12UKST -17! | |
| Lenovo ThinkPad P16v G1 AMD -16! | |
| Lenovo ThinkPad P16 G1 21D6001DMB -18! | |
| Lenovo ThinkPad P1 G4-20Y30017GE -18! | |
| Lenovo ThinkPad P16s G2 21K9000CGE -18! | |
| 3DMark 11 - 1280x720 Performance GPU | |
| HP ZBook Fury 16 G10 | |
| Ortalama NVIDIA RTX 5000 Ada Generation Laptop (49833 - 54334, n=3) | |
| Dell Precision 5000 5680 | |
| Dell Precision 5690 | |
| HP ZBook Fury 16 G9 | |
| Dell XPS 16 9640 | |
| Lenovo ThinkPad P16 G2 21FA000FGE | |
| Lenovo ThinkPad P1 G6-21FV000DGE | |
| MSI CreatorPro Z16P B12UKST | |
| Lenovo ThinkPad P16v G1 AMD | |
| Lenovo ThinkPad P16 G1 21D6001DMB | |
| Lenovo ThinkPad P1 G4-20Y30017GE | |
| Lenovo ThinkPad P16s G2 21K9000CGE | |
| 3DMark 11 Performance | 38230 puan | |
| 3DMark Fire Strike Score | 25968 puan | |
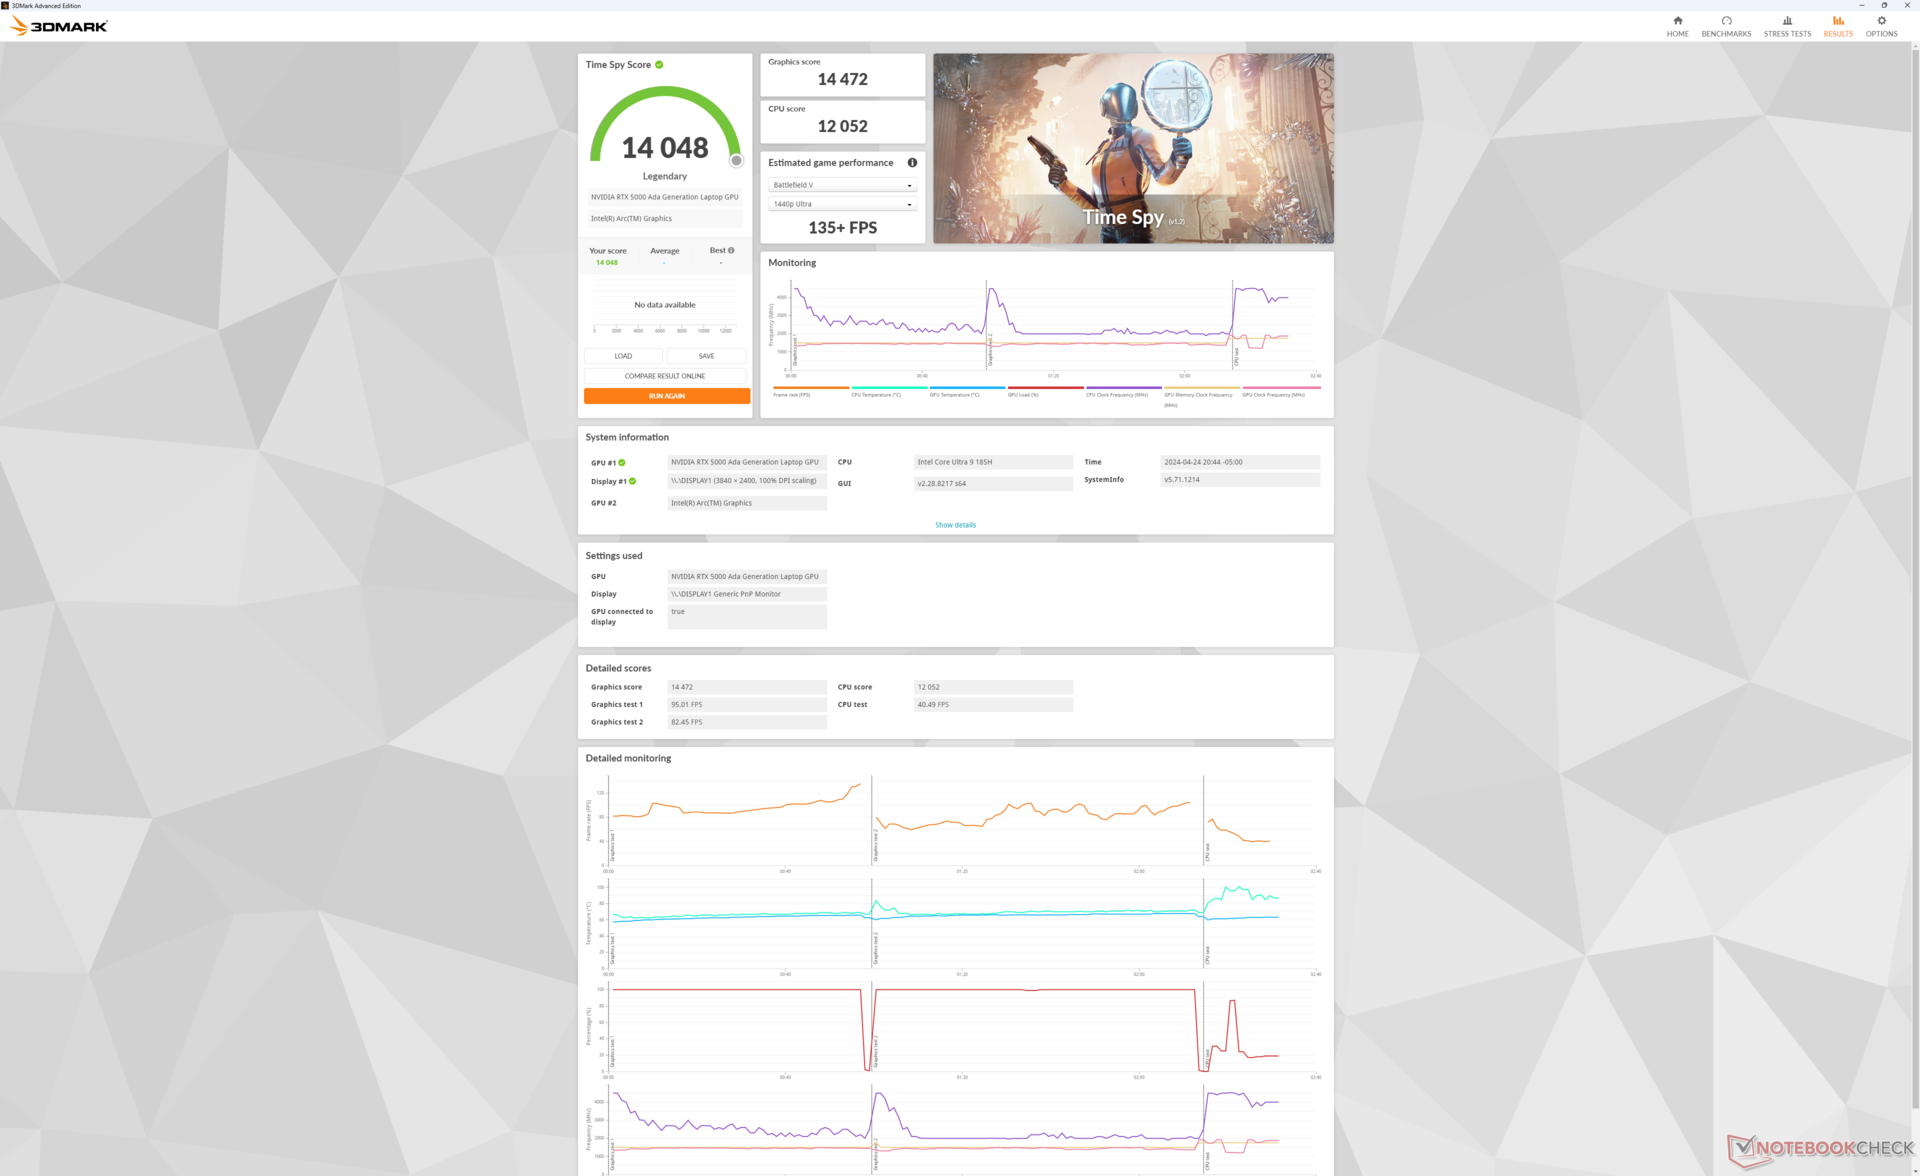
| 3DMark Time Spy Score | 14048 puan | |
Yardım | ||
* ... daha küçük daha iyidir
| Performance rating - Percent | |
| HP ZBook Fury 16 G10 | |
| Dell Precision 5000 5680 -1! | |
| Dell Precision 5690 | |
| Lenovo ThinkPad P16 G2 21FA000FGE | |
| Lenovo ThinkPad P1 G6-21FV000DGE | |
| MSI CreatorPro Z16P B12UKST | |
| The Witcher 3 - 1920x1080 Ultra Graphics & Postprocessing (HBAO+) | |
| HP ZBook Fury 16 G10 | |
| Dell Precision 5690 | |
| Dell Precision 5000 5680 | |
| Lenovo ThinkPad P16 G2 21FA000FGE | |
| Lenovo ThinkPad P1 G6-21FV000DGE | |
| MSI CreatorPro Z16P B12UKST | |
| Final Fantasy XV Benchmark - 1920x1080 High Quality | |
| HP ZBook Fury 16 G10 | |
| Dell Precision 5690 | |
| Dell Precision 5000 5680 | |
| Lenovo ThinkPad P16 G2 21FA000FGE | |
| Lenovo ThinkPad P1 G6-21FV000DGE | |
| MSI CreatorPro Z16P B12UKST | |
| Strange Brigade - 1920x1080 ultra AA:ultra AF:16 | |
| HP ZBook Fury 16 G10 | |
| Dell Precision 5690 | |
| Lenovo ThinkPad P16 G2 21FA000FGE | |
| Lenovo ThinkPad P1 G6-21FV000DGE | |
| MSI CreatorPro Z16P B12UKST | |
| Dota 2 Reborn - 1920x1080 ultra (3/3) best looking | |
| HP ZBook Fury 16 G10 | |
| Lenovo ThinkPad P16 G2 21FA000FGE | |
| MSI CreatorPro Z16P B12UKST | |
| Dell Precision 5000 5680 | |
| Dell Precision 5690 | |
| Lenovo ThinkPad P1 G6-21FV000DGE | |
| X-Plane 11.11 - 1920x1080 high (fps_test=3) | |
| HP ZBook Fury 16 G10 | |
| Lenovo ThinkPad P1 G6-21FV000DGE | |
| Lenovo ThinkPad P16 G2 21FA000FGE | |
| Dell Precision 5000 5680 | |
| MSI CreatorPro Z16P B12UKST | |
| Dell Precision 5690 | |
| Baldur's Gate 3 | |
| 1920x1080 High Preset AA:T | |
| Dell Precision 5690 | |
| Ortalama NVIDIA RTX 5000 Ada Generation Laptop (n=1) | |
| Dell XPS 16 9640 | |
| 1920x1080 Ultra Preset AA:T | |
| Dell Precision 5690 | |
| Ortalama NVIDIA RTX 5000 Ada Generation Laptop (n=1) | |
| Dell XPS 16 9640 | |
| 2560x1440 Ultra Preset AA:T | |
| Dell Precision 5690 | |
| Ortalama NVIDIA RTX 5000 Ada Generation Laptop (n=1) | |
| Dell XPS 16 9640 | |
| 3840x2160 Ultra Preset AA:T | |
| Dell Precision 5690 | |
| Ortalama NVIDIA RTX 5000 Ada Generation Laptop (n=1) | |
| 3840x2160 Ultra Preset + Quality DLSS | |
| Dell Precision 5690 | |
| Ortalama NVIDIA RTX 5000 Ada Generation Laptop (n=1) | |
| Cyberpunk 2077 | |
| 1920x1080 High Preset (FSR off) | |
| Dell Precision 5690 | |
| Ortalama NVIDIA RTX 5000 Ada Generation Laptop (n=1) | |
| Dell XPS 16 9640 | |
| Lenovo ThinkPad P16v G1 AMD | |
| 1920x1080 Ultra Preset (FSR off) | |
| Dell Precision 5690 | |
| Ortalama NVIDIA RTX 5000 Ada Generation Laptop (n=1) | |
| Dell XPS 16 9640 | |
| Lenovo ThinkPad P16v G1 AMD | |
| 2560x1440 Ultra Preset (FSR off) | |
| Dell Precision 5690 | |
| Ortalama NVIDIA RTX 5000 Ada Generation Laptop (n=1) | |
| Dell XPS 16 9640 | |
| 3840x2160 Ultra Preset (FSR off) | |
| Dell Precision 5690 | |
| Ortalama NVIDIA RTX 5000 Ada Generation Laptop (n=1) | |
| 1920x1080 Ray Tracing Ultra Preset (DLSS off) | |
| Dell Precision 5690 | |
| Ortalama NVIDIA RTX 5000 Ada Generation Laptop (n=1) | |
| F1 22 | |
| 1920x1080 High Preset AA:T AF:16x | |
| Dell Precision 5690 | |
| HP ZBook Fury 16 G10 | |
| Ortalama NVIDIA RTX 5000 Ada Generation Laptop (202 - 217, n=3) | |
| Dell Precision 5000 5680 | |
| HP ZBook Fury 16 G9 | |
| Lenovo ThinkPad P1 G6-21FV000DGE | |
| MSI CreatorPro Z16P B12UKST | |
| Lenovo ThinkPad P16v G1 AMD | |
| 1920x1080 Ultra High Preset AA:T AF:16x | |
| Dell Precision 5690 | |
| Ortalama NVIDIA RTX 5000 Ada Generation Laptop (84.5 - 91.1, n=3) | |
| HP ZBook Fury 16 G10 | |
| Dell Precision 5000 5680 | |
| HP ZBook Fury 16 G9 | |
| Lenovo ThinkPad P1 G6-21FV000DGE | |
| MSI CreatorPro Z16P B12UKST | |
| Lenovo ThinkPad P16v G1 AMD | |
| 2560x1440 Ultra High Preset AA:T AF:16x | |
| HP ZBook Fury 16 G10 | |
| Ortalama NVIDIA RTX 5000 Ada Generation Laptop (56.1 - 64.4, n=3) | |
| Dell Precision 5690 | |
| Dell Precision 5000 5680 | |
| HP ZBook Fury 16 G9 | |
| Lenovo ThinkPad P1 G6-21FV000DGE | |
| MSI CreatorPro Z16P B12UKST | |
| 3840x2160 Ultra High Preset AA:T AF:16x | |
| HP ZBook Fury 16 G10 | |
| Ortalama NVIDIA RTX 5000 Ada Generation Laptop (28.8 - 33.4, n=3) | |
| Dell Precision 5690 | |
| Dell Precision 5000 5680 | |
| HP ZBook Fury 16 G9 | |
| Tiny Tina's Wonderlands | |
| 1920x1080 High Preset (DX12) | |
| HP ZBook Fury 16 G10 | |
| Ortalama NVIDIA RTX 5000 Ada Generation Laptop (145.5 - 171.7, n=3) | |
| Dell Precision 5000 5680 | |
| Dell Precision 5690 | |
| HP ZBook Fury 16 G9 | |
| 1920x1080 Badass Preset (DX12) | |
| HP ZBook Fury 16 G10 | |
| Ortalama NVIDIA RTX 5000 Ada Generation Laptop (124 - 139.4, n=3) | |
| Dell Precision 5000 5680 | |
| Dell Precision 5690 | |
| HP ZBook Fury 16 G9 | |
| 2560x1440 Badass Preset (DX12) | |
| HP ZBook Fury 16 G10 | |
| Ortalama NVIDIA RTX 5000 Ada Generation Laptop (87.1 - 99.4, n=3) | |
| Dell Precision 5000 5680 | |
| Dell Precision 5690 | |
| HP ZBook Fury 16 G9 | |
| 3840x2160 Badass Preset (DX12) | |
| HP ZBook Fury 16 G10 | |
| Ortalama NVIDIA RTX 5000 Ada Generation Laptop (48.4 - 53.9, n=3) | |
| Dell Precision 5000 5680 | |
| Dell Precision 5690 | |
| HP ZBook Fury 16 G9 | |
| X-Plane 11.11 | |
| 1920x1080 high (fps_test=3) | |
| HP ZBook Fury 16 G10 | |
| Lenovo ThinkPad P1 G6-21FV000DGE | |
| Ortalama NVIDIA RTX 5000 Ada Generation Laptop (88.7 - 122.4, n=3) | |
| HP ZBook Fury 16 G9 | |
| Lenovo ThinkPad P16 G2 21FA000FGE | |
| Dell Precision 5000 5680 | |
| MSI CreatorPro Z16P B12UKST | |
| Lenovo ThinkPad P16 G1 21D6001DMB | |
| Dell Precision 5690 | |
| Dell XPS 16 9640 | |
| Dell XPS 16 9640 | |
| Asus ProArt StudioBook 16 W7600H5A-2BL2 | |
| Lenovo ThinkPad P16v G1 AMD | |
| Lenovo ThinkPad P1 G4-20Y30017GE | |
| Lenovo ThinkPad P16s G2 21K9000CGE | |
| Lenovo ThinkPad P16s G2 21K9000CGE | |
| 3840x2160 high (fps_test=3) | |
| HP ZBook Fury 16 G10 | |
| Ortalama NVIDIA RTX 5000 Ada Generation Laptop (74.8 - 102.6, n=3) | |
| Dell Precision 5000 5680 | |
| HP ZBook Fury 16 G9 | |
| Dell Precision 5690 | |
| Dell XPS 16 9640 | |
| Lenovo ThinkPad P1 G4-20Y30017GE | |
| Asus ProArt StudioBook 16 W7600H5A-2BL2 | |
| Lenovo ThinkPad P16s G2 21K9000CGE | |
Witcher 3 FPS Chart
| düşük | orta | yüksek | ultra | QHD | 4K DLSS | 4K | |
|---|---|---|---|---|---|---|---|
| The Witcher 3 (2015) | 411.3 | 351.2 | 258.7 | 137.6 | 103.9 | ||
| Dota 2 Reborn (2015) | 169.4 | 149.2 | 150.1 | 139.9 | 130 | ||
| Final Fantasy XV Benchmark (2018) | 196.6 | 165.4 | 132.5 | 103.8 | 63.2 | ||
| X-Plane 11.11 (2018) | 132.8 | 113.9 | 88.7 | 74.8 | |||
| Far Cry 5 (2018) | 144 | 134 | 127 | 119 | 113 | 72 | |
| Strange Brigade (2018) | 405 | 314 | 276 | 252 | 190.6 | 105.3 | |
| Tiny Tina's Wonderlands (2022) | 196.5 | 179.4 | 145.5 | 124 | 87.1 | 48.4 | |
| F1 22 (2022) | 228 | 224 | 217 | 91.1 | 60.1 | 29.6 | |
| Baldur's Gate 3 (2023) | 172.3 | 155.2 | 139.2 | 134.6 | 100.5 | 87.8 | 53.3 |
| Cyberpunk 2077 (2023) | 125 | 116.6 | 94.6 | 108.5 | 63.7 | 28.8 |
Emisyonlar
Sistem Gürültüsü - Gürültülü ve Yetkili
Fan gürültüsü seçilen güç profiline duyarlıdır. Örneğin Sessiz modda fan gürültüsü, 23,4 dB(A)'lık sessiz bir arka plana karşı 25 dB(A)'nın altında kalma eğilimindedir. Tersine, fanlar Dengeli veya Performans modlarına ayarlandığında, web'de gezinme gibi sıradan görevler sırasında bile 30 dB(A)'ya kadar daha kolay atma eğilimindedir.
Fan gürültüsü tavanı, Precision 5680'de kaydettiğimiz 51 dB(A) ile aynıdır ve birçok oyun dizüstü bilgisayarı kadar yüksektir. GPU gerektiren yükler birkaç dakikadan fazla çalıştırıldığında bu maksimum değere ulaşılabiliyor.
Ses yüksekliği
| Boşta |
| 23.6 / 24.9 / 30.9 dB |
| Çalışırken |
| 40.4 / 51.9 dB |
 | ||
30 dB sessiz 40 dB(A) duyulabilirlik 50 dB(A) gürültülü |
||
min: | ||
| Dell Precision 5690 RTX 5000 Ada Generation Laptop, Ultra 9 185H, 2x Samsung PM9A1 1TB (RAID 0) | Dell Precision 5000 5680 RTX 5000 Ada Generation Laptop, i9-13900H, 2x SK hynix PC801 HFS512GEJ9X101N RAID 0 | Lenovo ThinkPad P16 G2 21FA000FGE RTX 2000 Ada Generation Laptop, i7-13700HX, SK hynix PC801 HFS001TEJ9X162N | Lenovo ThinkPad P1 G6-21FV000DGE RTX 2000 Ada Generation Laptop, i9-13900H, SK Hynix PC711 1TB HFS001TDE9X084N | HP ZBook Fury 16 G10 RTX 5000 Ada Generation Laptop, i9-13950HX, SK hynix PC801 HFS001TEJ9X101N | MSI CreatorPro Z16P B12UKST RTX A3000 Laptop GPU, i7-12700H, Samsung PM9A1 MZVL21T0HCLR | |
|---|---|---|---|---|---|---|
| Noise | 6% | -1% | 3% | 6% | -0% | |
| kapalı / ortam * (dB) | 23.4 | 22.8 3% | 23.5 -0% | 24.5 -5% | 22.9 2% | 24.1 -3% |
| Idle Minimum * (dB) | 23.6 | 23 3% | 23.5 -0% | 24.5 -4% | 22.9 3% | 27.1 -15% |
| Idle Average * (dB) | 24.9 | 23 8% | 29.2 -17% | 24.5 2% | 22.9 8% | 27.1 -9% |
| Idle Maximum * (dB) | 30.9 | 23 26% | 29.5 5% | 24.5 21% | 28.5 8% | 27.1 12% |
| Load Average * (dB) | 40.4 | 37.2 8% | 32.7 19% | 48 -19% | 40.6 -0% | 42.9 -6% |
| Witcher 3 ultra * (dB) | 48.3 | 51 -6% | 50.6 -5% | 40.7 16% | 44.1 9% | 44 9% |
| Load Maximum * (dB) | 51.9 | 51 2% | 56.6 -9% | 48 8% | 45.8 12% | 47 9% |
* ... daha küçük daha iyidir
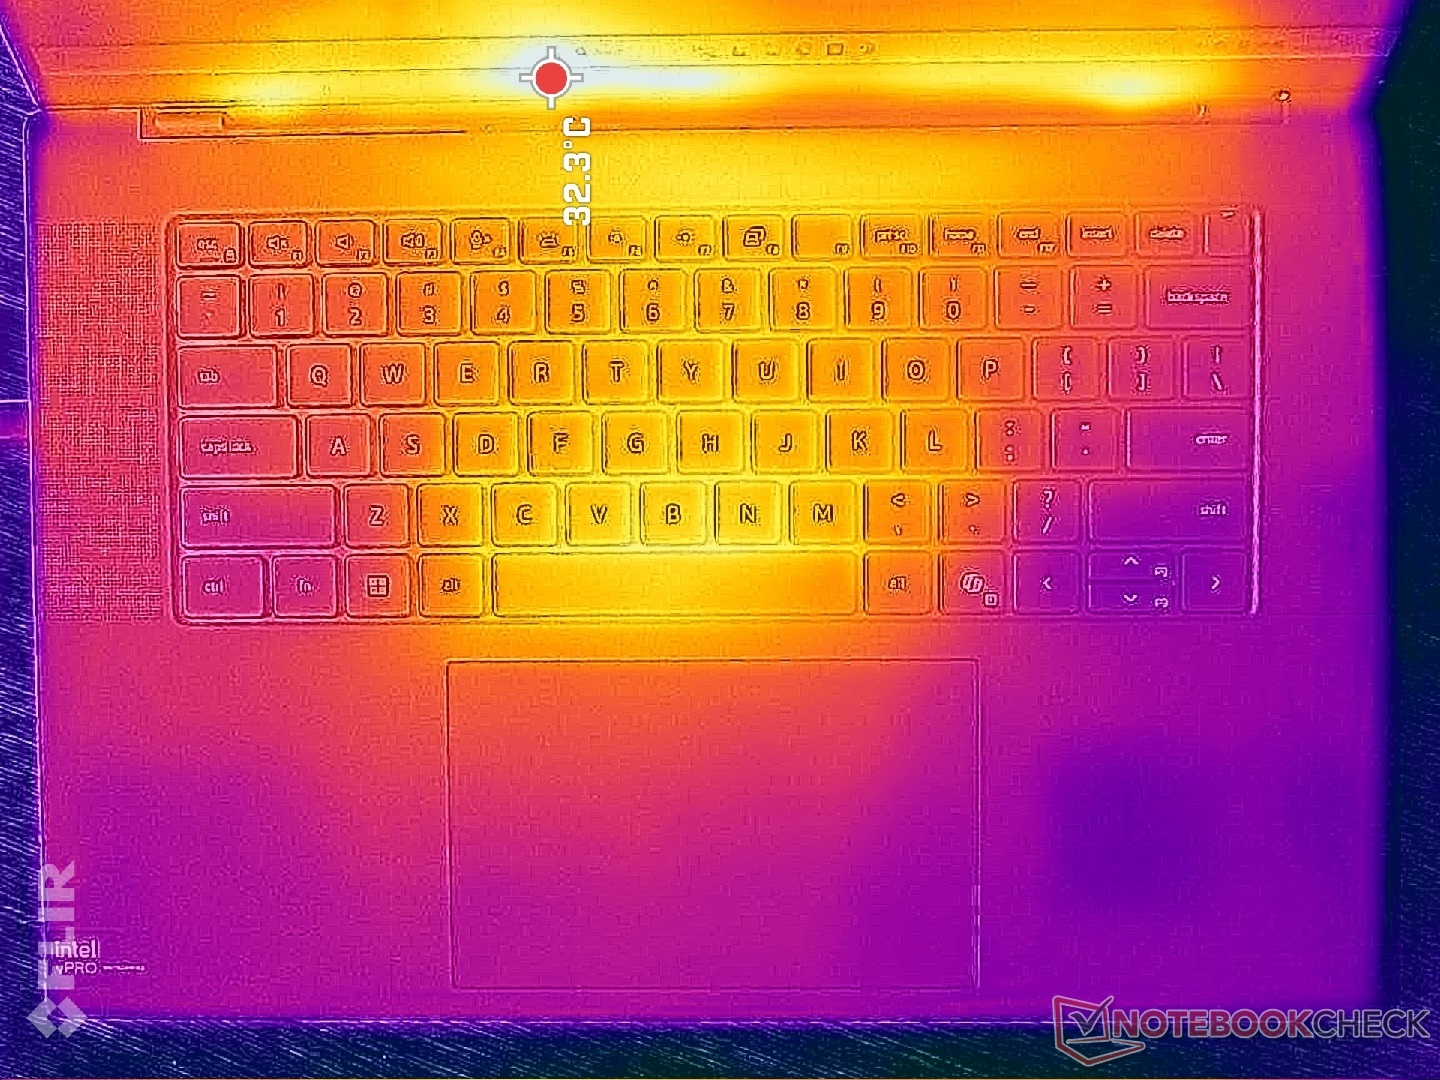
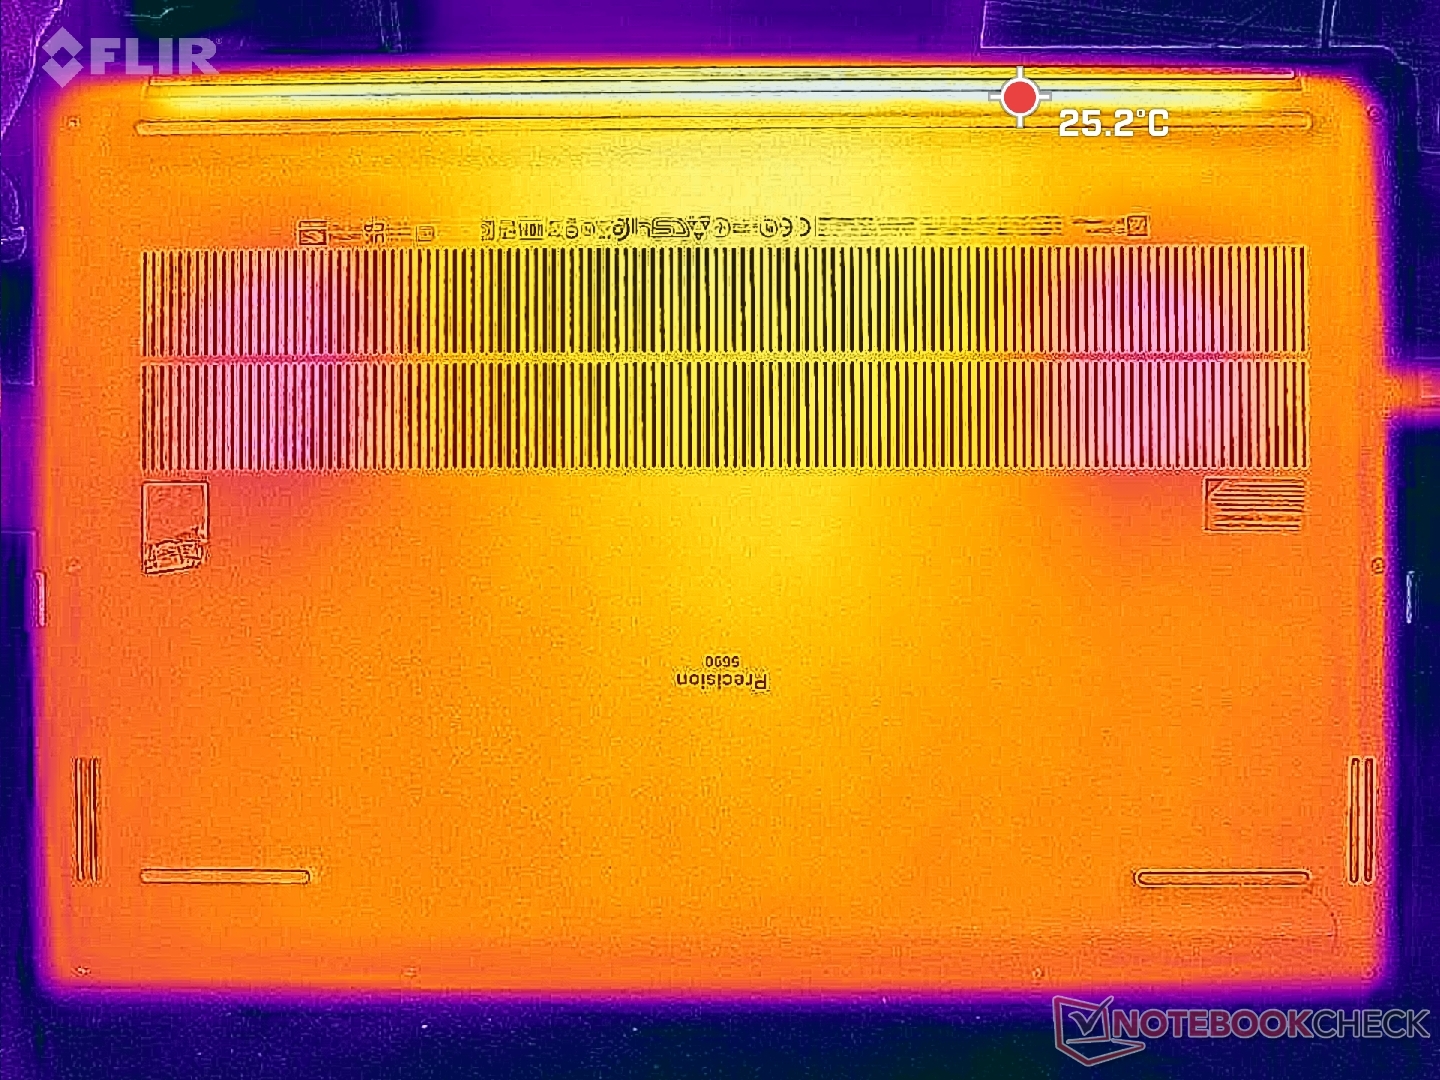
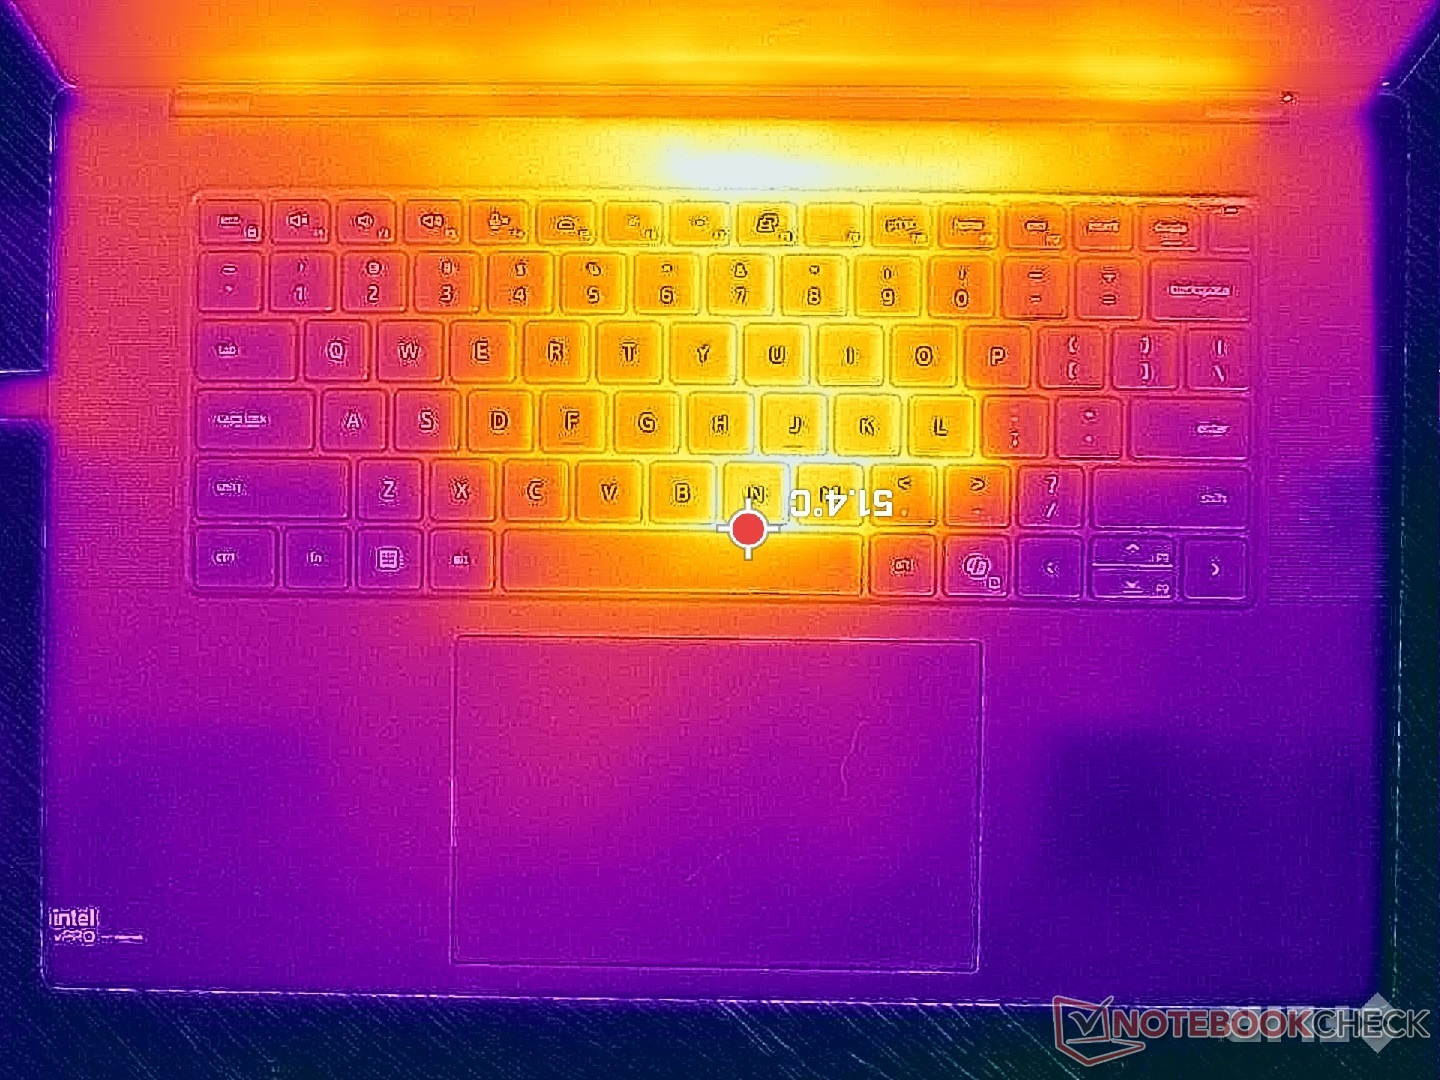
Sıcaklık
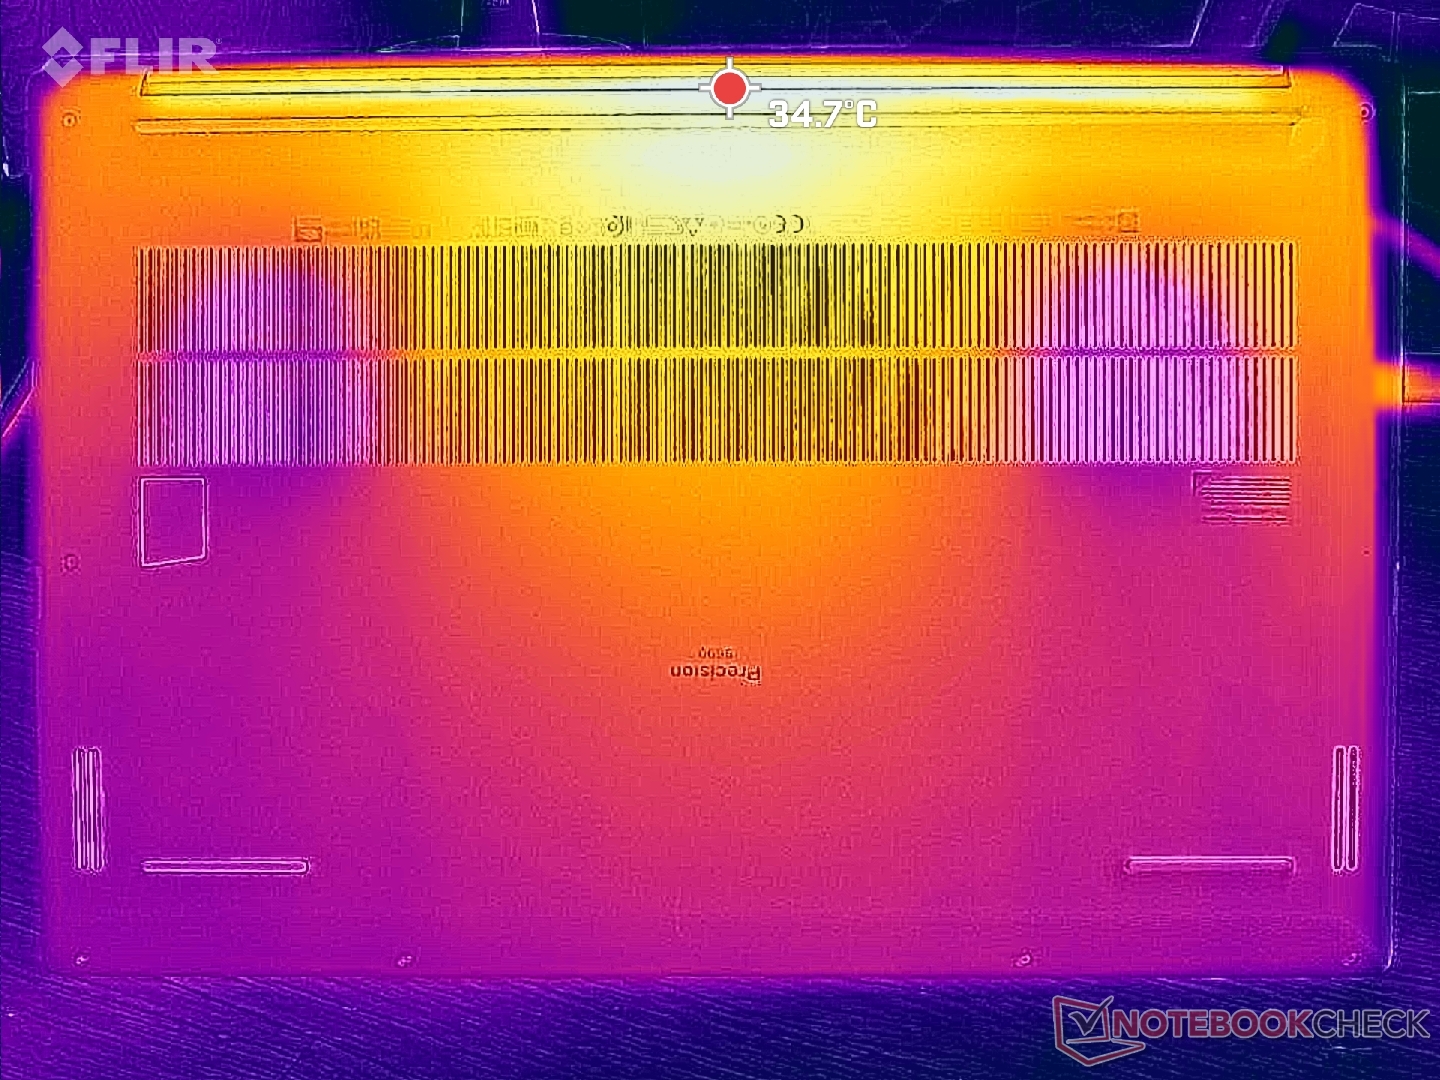
Yüzey sıcaklığı gelişimi simetriktir ve sıcak noktalar klavye merkezinin yakınında 43 C ila 47 C kadar sıcaktır. Kasanın alt tarafı, zorlu yükleri çalıştırırken bile klavye güvertesinden belirgin şekilde daha soğuk kalacaktır.
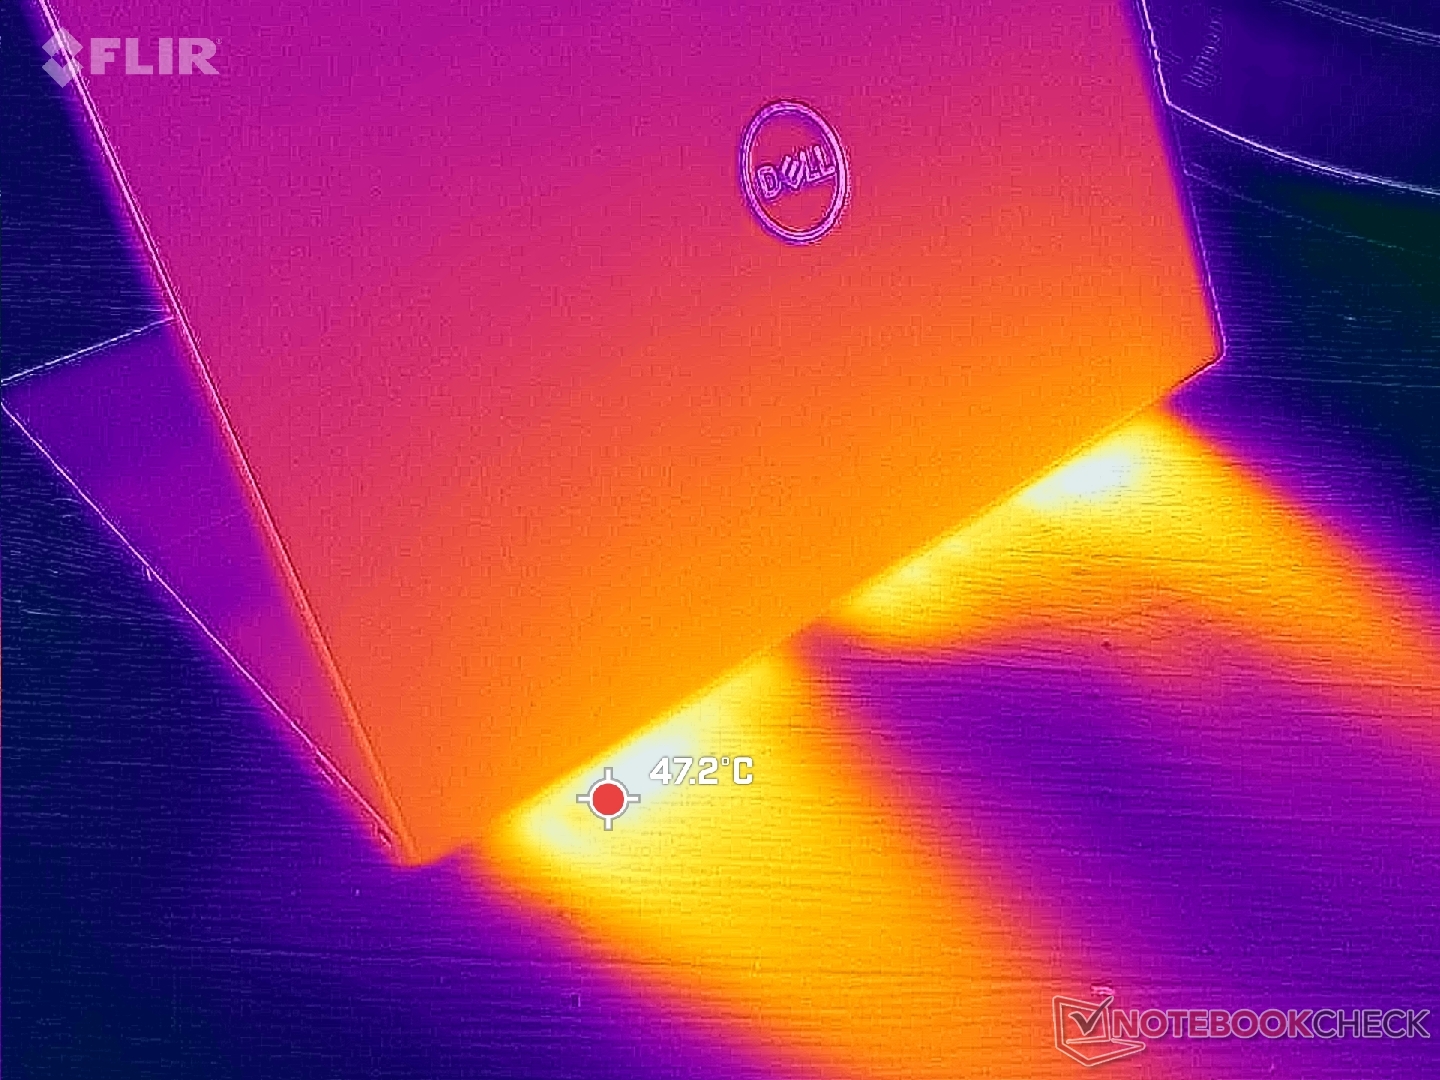
(-) Üst taraftaki maksimum sıcaklık, 38.2 °C / 101 F ortalamasına kıyasla 46.6 °C / 116 F'dir. , Workstation sınıfı için 22.2 ile 69.8 °C arasında değişir.
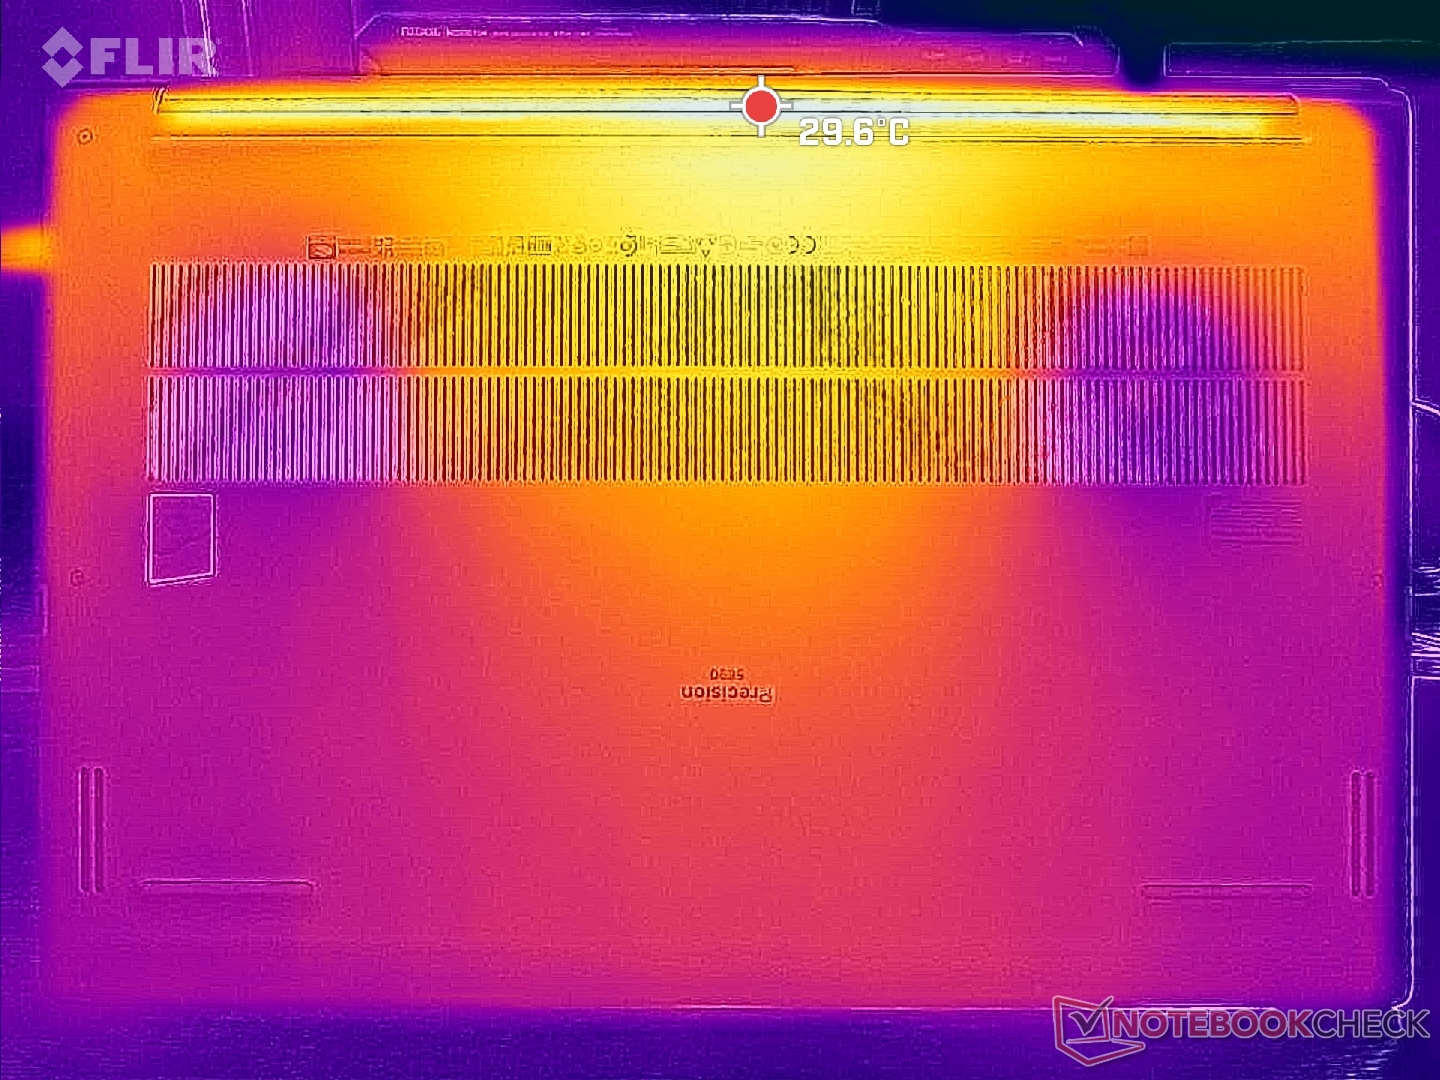
(+) Alt kısım, 41.1 °C / 106 F ortalamasına kıyasla maksimum 33 °C / 91 F'ye kadar ısınır
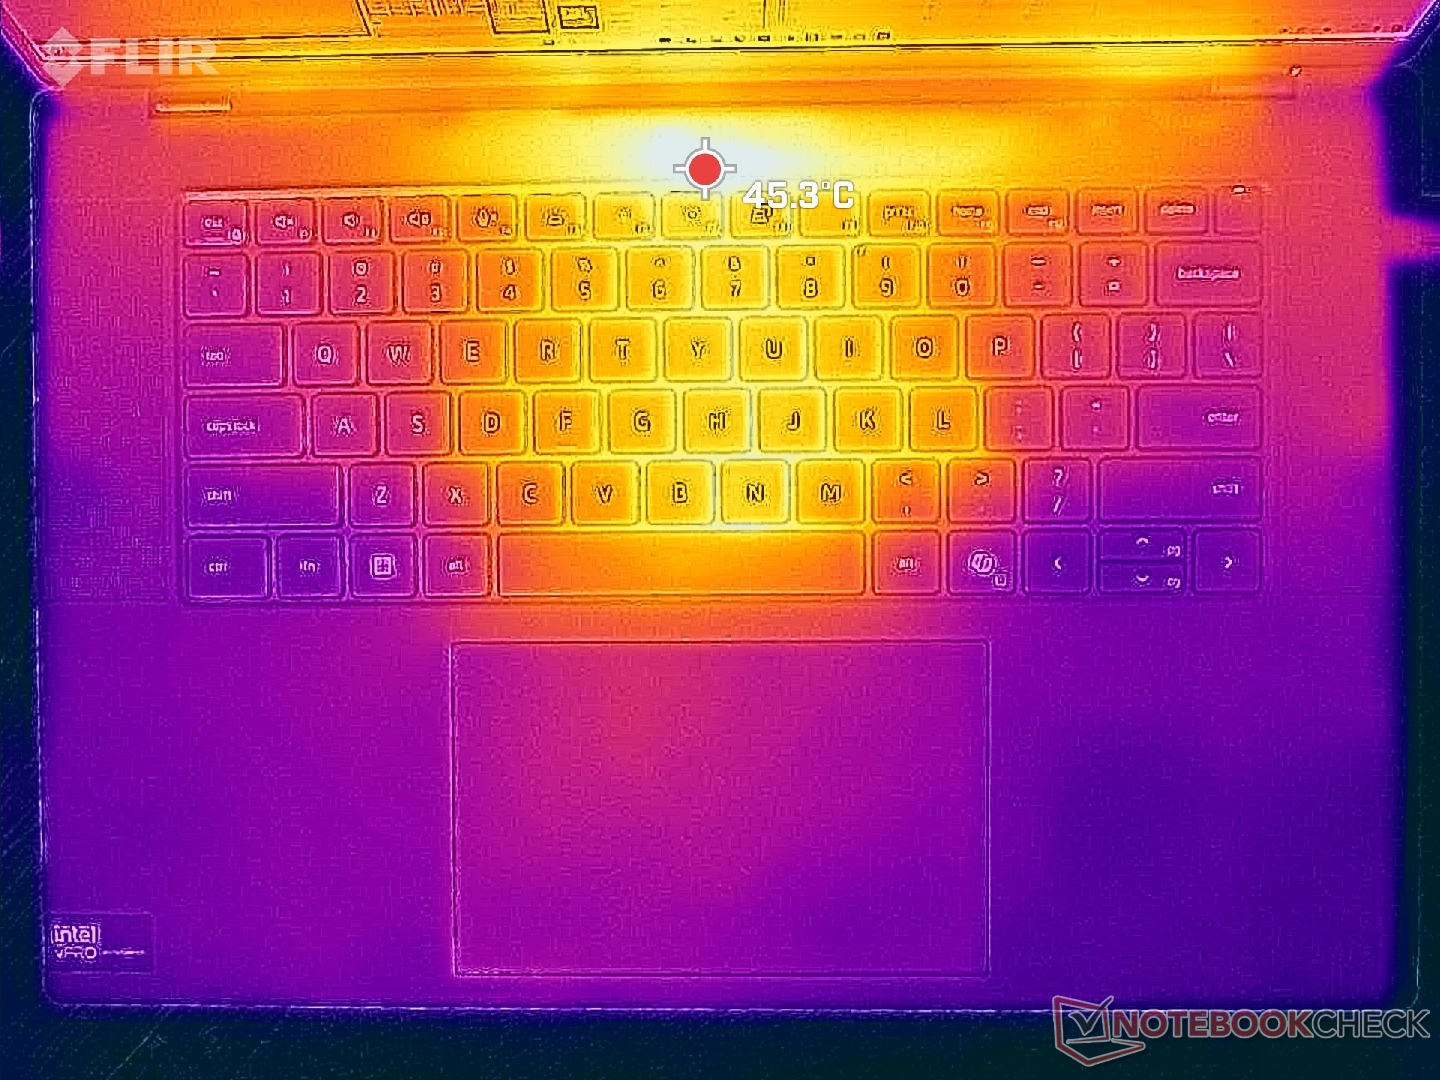
(+) Boşta kullanımda, üst tarafın ortalama sıcaklığı 29.2 °C / 85 F olup, cihazın 32 °C / 90 F.
(±) The Witcher 3 oynarken, üst tarafın ortalama sıcaklığı 34 °C / 93 F olup, cihazın 32 °C / 90 F.
(+) Avuç içi dayanakları ve dokunmatik yüzey, maksimum 27.6 °C / 81.7 F ile cilt sıcaklığından daha soğuktur ve bu nedenle dokunulduğunda soğuktur.
(±) Benzer cihazların avuç içi dayanağı alanının ortalama sıcaklığı 27.8 °C / 82 F (+0.2 °C / 0.3 F) idi.
| Dell Precision 5690 Intel Core Ultra 9 185H, NVIDIA RTX 5000 Ada Generation Laptop | Dell Precision 5000 5680 Intel Core i9-13900H, NVIDIA RTX 5000 Ada Generation Laptop | Lenovo ThinkPad P16 G2 21FA000FGE Intel Core i7-13700HX, NVIDIA RTX 2000 Ada Generation Laptop | Lenovo ThinkPad P1 G6-21FV000DGE Intel Core i9-13900H, NVIDIA RTX 2000 Ada Generation Laptop | HP ZBook Fury 16 G10 Intel Core i9-13950HX, NVIDIA RTX 5000 Ada Generation Laptop | MSI CreatorPro Z16P B12UKST Intel Core i7-12700H, NVIDIA RTX A3000 Laptop GPU | |
|---|---|---|---|---|---|---|
| Heat | -7% | 2% | -13% | -16% | -24% | |
| Maximum Upper Side * (°C) | 46.6 | 50.2 -8% | 47.2 -1% | 47.1 -1% | 44.8 4% | 56.3 -21% |
| Maximum Bottom * (°C) | 33 | 32 3% | 39.5 -20% | 56.5 -71% | 50 -52% | 68.3 -107% |
| Idle Upper Side * (°C) | 32.4 | 37.4 -15% | 28.1 13% | 28.1 13% | 34.4 -6% | 25.2 22% |
| Idle Bottom * (°C) | 29.4 | 31.2 -6% | 25.3 14% | 27.6 6% | 31.8 -8% | 25.9 12% |
* ... daha küçük daha iyidir
Konuşmacılar
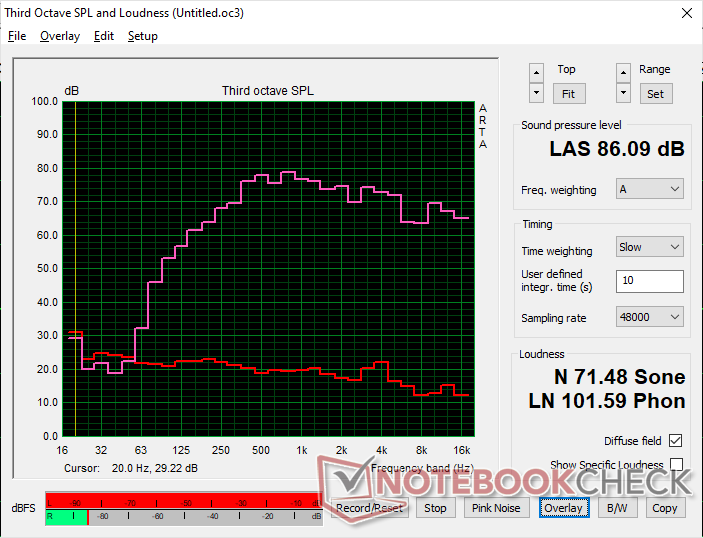
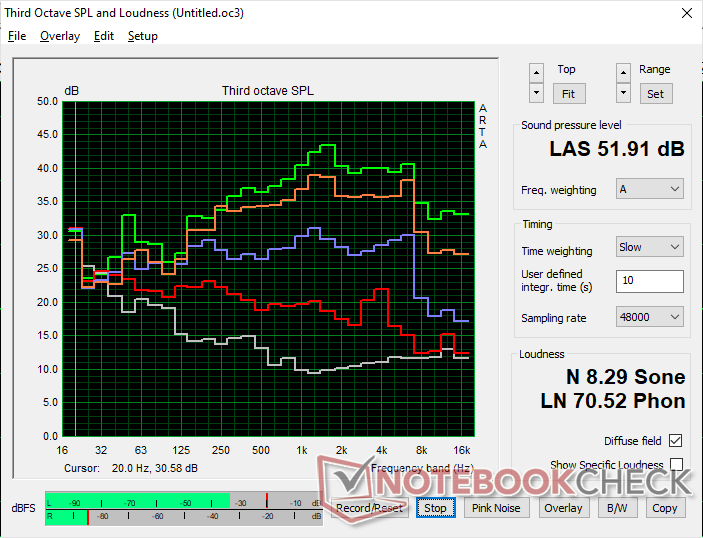
Dell Precision 5690 ses analizi
(+) | hoparlörler nispeten yüksek sesle çalabilir (86.1 dB)
Bas 100 - 315Hz
(±) | azaltılmış bas - ortalama olarak medyandan 9.4% daha düşük
(±) | Bas doğrusallığı ortalamadır (7.6% delta - önceki frekans)
Ortalar 400 - 2000 Hz
(+) | dengeli ortalar - medyandan yalnızca 4.7% uzakta
(+) | orta frekanslar doğrusaldır (4.8% deltadan önceki frekansa)
Yüksekler 2 - 16 kHz
(+) | dengeli yüksekler - medyandan yalnızca 3.4% uzakta
(±) | Yükseklerin doğrusallığı ortalamadır (7.3% delta - önceki frekans)
Toplam 100 - 16.000 Hz
(+) | genel ses doğrusaldır (11.1% ortancaya göre fark)
Aynı sınıfla karşılaştırıldığında
» Bu sınıftaki tüm test edilen cihazların %12%'si daha iyi, 4% benzer, 84% daha kötüydü
» En iyisinin deltası 7% idi, ortalama 17% idi, en kötüsü 35% idi
Test edilen tüm cihazlarla karşılaştırıldığında
» Test edilen tüm cihazların %7'si daha iyi, 2 benzer, % 92 daha kötüydü
» En iyisinin deltası 4% idi, ortalama 23% idi, en kötüsü 134% idi
Apple MacBook Pro 16 2021 M1 Pro ses analizi
(+) | hoparlörler nispeten yüksek sesle çalabilir (84.7 dB)
Bas 100 - 315Hz
(+) | iyi bas - medyandan yalnızca 3.8% uzakta
(+) | bas doğrusaldır (5.2% delta ile önceki frekans)
Ortalar 400 - 2000 Hz
(+) | dengeli ortalar - medyandan yalnızca 1.3% uzakta
(+) | orta frekanslar doğrusaldır (2.1% deltadan önceki frekansa)
Yüksekler 2 - 16 kHz
(+) | dengeli yüksekler - medyandan yalnızca 1.9% uzakta
(+) | yüksekler doğrusaldır (2.7% deltadan önceki frekansa)
Toplam 100 - 16.000 Hz
(+) | genel ses doğrusaldır (4.6% ortancaya göre fark)
Aynı sınıfla karşılaştırıldığında
» Bu sınıftaki tüm test edilen cihazların %0%'si daha iyi, 0% benzer, 100% daha kötüydü
» En iyisinin deltası 5% idi, ortalama 17% idi, en kötüsü 45% idi
Test edilen tüm cihazlarla karşılaştırıldığında
» Test edilen tüm cihazların %0'si daha iyi, 0 benzer, % 100 daha kötüydü
» En iyisinin deltası 4% idi, ortalama 23% idi, en kötüsü 134% idi
Enerji Yönetimi
Güç Tüketimi
Masaüstünde rölantide çalışma, minimum parlaklık ayarında 8 W kadar düşük bir değerden, tamamen beyaz bir arka planla maksimum parlaklık ayarında 29 W'a kadar çıkabilir. OLED'in çalışma şekli nedeniyle bu aralık çoğu IPS dizüstü bilgisayardan daha geniştir. Web'de gezinme, kelime işleme veya elektronik tablo girdileri gibi görevler, bu pencereler çoğunlukla beyaz renkli olduğundan pili beklenenden daha hızlı tüketebilir. Parlaklığı düşürmek veya daha koyu renkler seçmek, pil ömrünü bir IPS alternatifine göre daha fazla uzatmaya yardımcı olabilir.
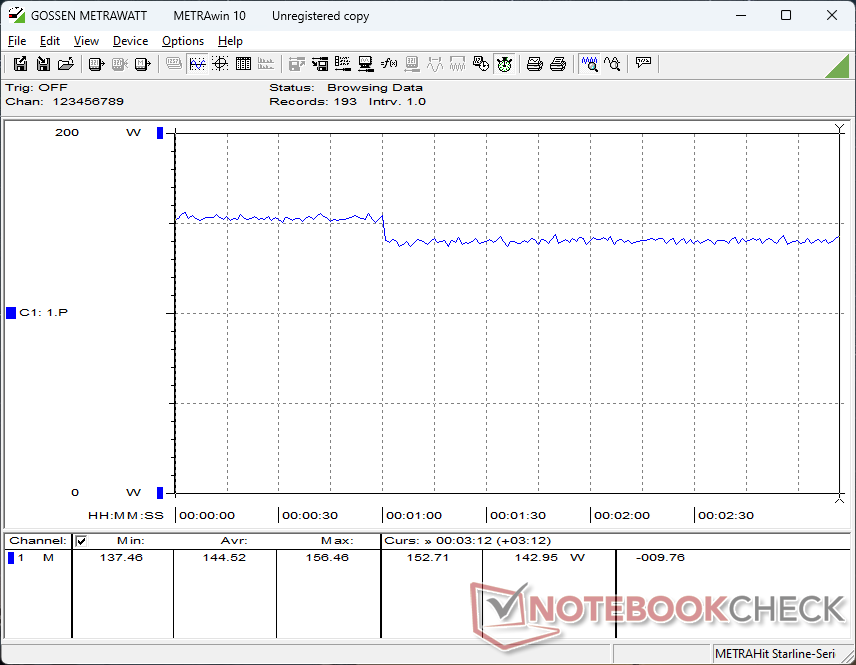
Aşağıdakiler gibi daha yüksek yükleri çalıştırırken güç tüketimi Witcher 3 eski Precision 5680'de kaydettiğimizle neredeyse aynı olacaktır. Bu, iki model arasında en iyi ihtimalle yalnızca marjinal performans farklılıkları gösteren yukarıdaki kıyaslama verilerimizi de doğrulamaktadır.
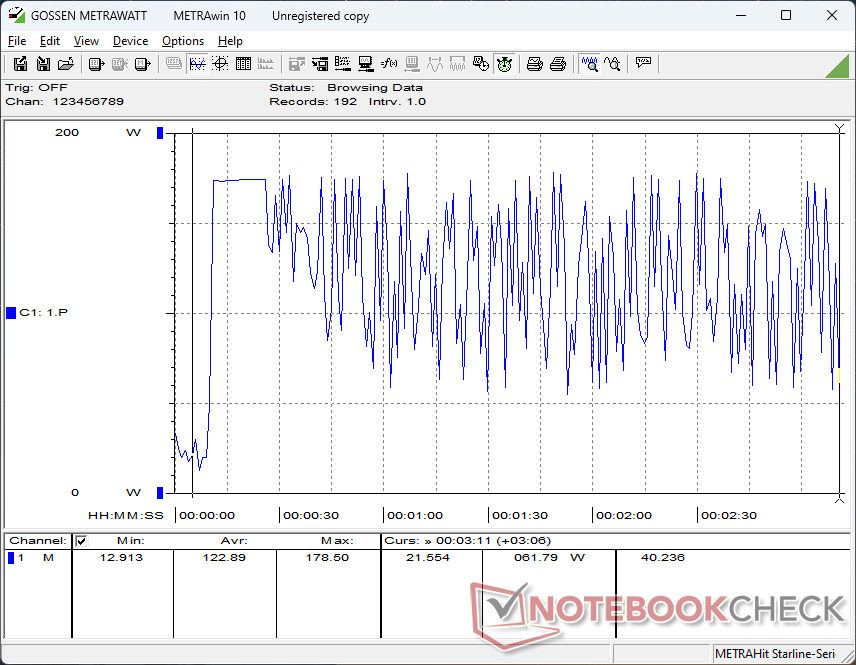
Garip bir şekilde, Prime95 stresini çalıştırırken birden fazla tekrar testten sonra bile tüketim çılgınca dalgalanıyordu. Bunun dışında performans sabit görünüyor.
| Kapalı / Bekleme modu | |
| Boşta | |
| Çalışırken |
|
Key:
min: | |
| Dell Precision 5690 Ultra 9 185H, RTX 5000 Ada Generation Laptop, 2x Samsung PM9A1 1TB (RAID 0), OLED, 3840x2400, 16" | Dell Precision 5000 5680 i9-13900H, RTX 5000 Ada Generation Laptop, 2x SK hynix PC801 HFS512GEJ9X101N RAID 0, OLED, 3840x2400, 16" | Lenovo ThinkPad P16 G2 21FA000FGE i7-13700HX, RTX 2000 Ada Generation Laptop, SK hynix PC801 HFS001TEJ9X162N, IPS LED, 2560x1600, 16" | Lenovo ThinkPad P1 G6-21FV000DGE i9-13900H, RTX 2000 Ada Generation Laptop, SK Hynix PC711 1TB HFS001TDE9X084N, IPS, 2560x1600, 16" | HP ZBook Fury 16 G10 i9-13950HX, RTX 5000 Ada Generation Laptop, SK hynix PC801 HFS001TEJ9X101N, IPS, 3840x2400, 16" | MSI CreatorPro Z16P B12UKST i7-12700H, RTX A3000 Laptop GPU, Samsung PM9A1 MZVL21T0HCLR, IPS, 2560x1600, 16" | |
|---|---|---|---|---|---|---|
| Power Consumption | 6% | -5% | 10% | -39% | -9% | |
| Idle Minimum * (Watt) | 7.9 | 8 -1% | 9.3 -18% | 8.3 -5% | 15.3 -94% | 10.8 -37% |
| Idle Average * (Watt) | 12 | 10.4 13% | 14.1 -18% | 14.5 -21% | 18.2 -52% | 16.3 -36% |
| Idle Maximum * (Watt) | 28.6 | 30.5 -7% | 15.5 46% | 15.3 47% | 28 2% | 16.9 41% |
| Load Average * (Watt) | 98.8 | 75.4 24% | 133.6 -35% | 91.8 7% | 137.9 -40% | 111.7 -13% |
| Witcher 3 ultra * (Watt) | 144.5 | 134 7% | 144.9 -0% | 104.7 28% | 189.4 -31% | 152.1 -5% |
| Load Maximum * (Watt) | 174.8 | 175 -0% | 179.6 -3% | 164.5 6% | 202 -16% | 177.4 -1% |
* ... daha küçük daha iyidir
Power Consumption Witcher 3 / Stresstest
Power Consumption external Monitor
Pil Ömrü
Çalışma süreleri biraz daha kısa olmasa da öncekiyle hemen hemen aynı. WLAN testimiz 9 saatin biraz üzerinde sürerken, Precision 5680 benzer koşullar altında 10 saate yaklaşıyor.
| Dell Precision 5690 Ultra 9 185H, RTX 5000 Ada Generation Laptop, 98 Wh | Dell Precision 5000 5680 i9-13900H, RTX 5000 Ada Generation Laptop, 98 Wh | Lenovo ThinkPad P16 G2 21FA000FGE i7-13700HX, RTX 2000 Ada Generation Laptop, 94 Wh | Lenovo ThinkPad P1 G6-21FV000DGE i9-13900H, RTX 2000 Ada Generation Laptop, 90 Wh | HP ZBook Fury 16 G10 i9-13950HX, RTX 5000 Ada Generation Laptop, 95 Wh | MSI CreatorPro Z16P B12UKST i7-12700H, RTX A3000 Laptop GPU, 90 Wh | |
|---|---|---|---|---|---|---|
| Pil Çalışma Süresi | 8% | -7% | 3% | -21% | -37% | |
| WiFi v1.3 (h) | 9.2 | 9.9 8% | 8.6 -7% | 9.5 3% | 7.3 -21% | 5.8 -37% |
| Reader / Idle (h) | 17.9 | |||||
| Load (h) | 1.7 | 1.1 | ||||
| H.264 (h) | 11.2 |
Artılar
Eksiler
Karar - Yapay Zeka Devrimine Hazır
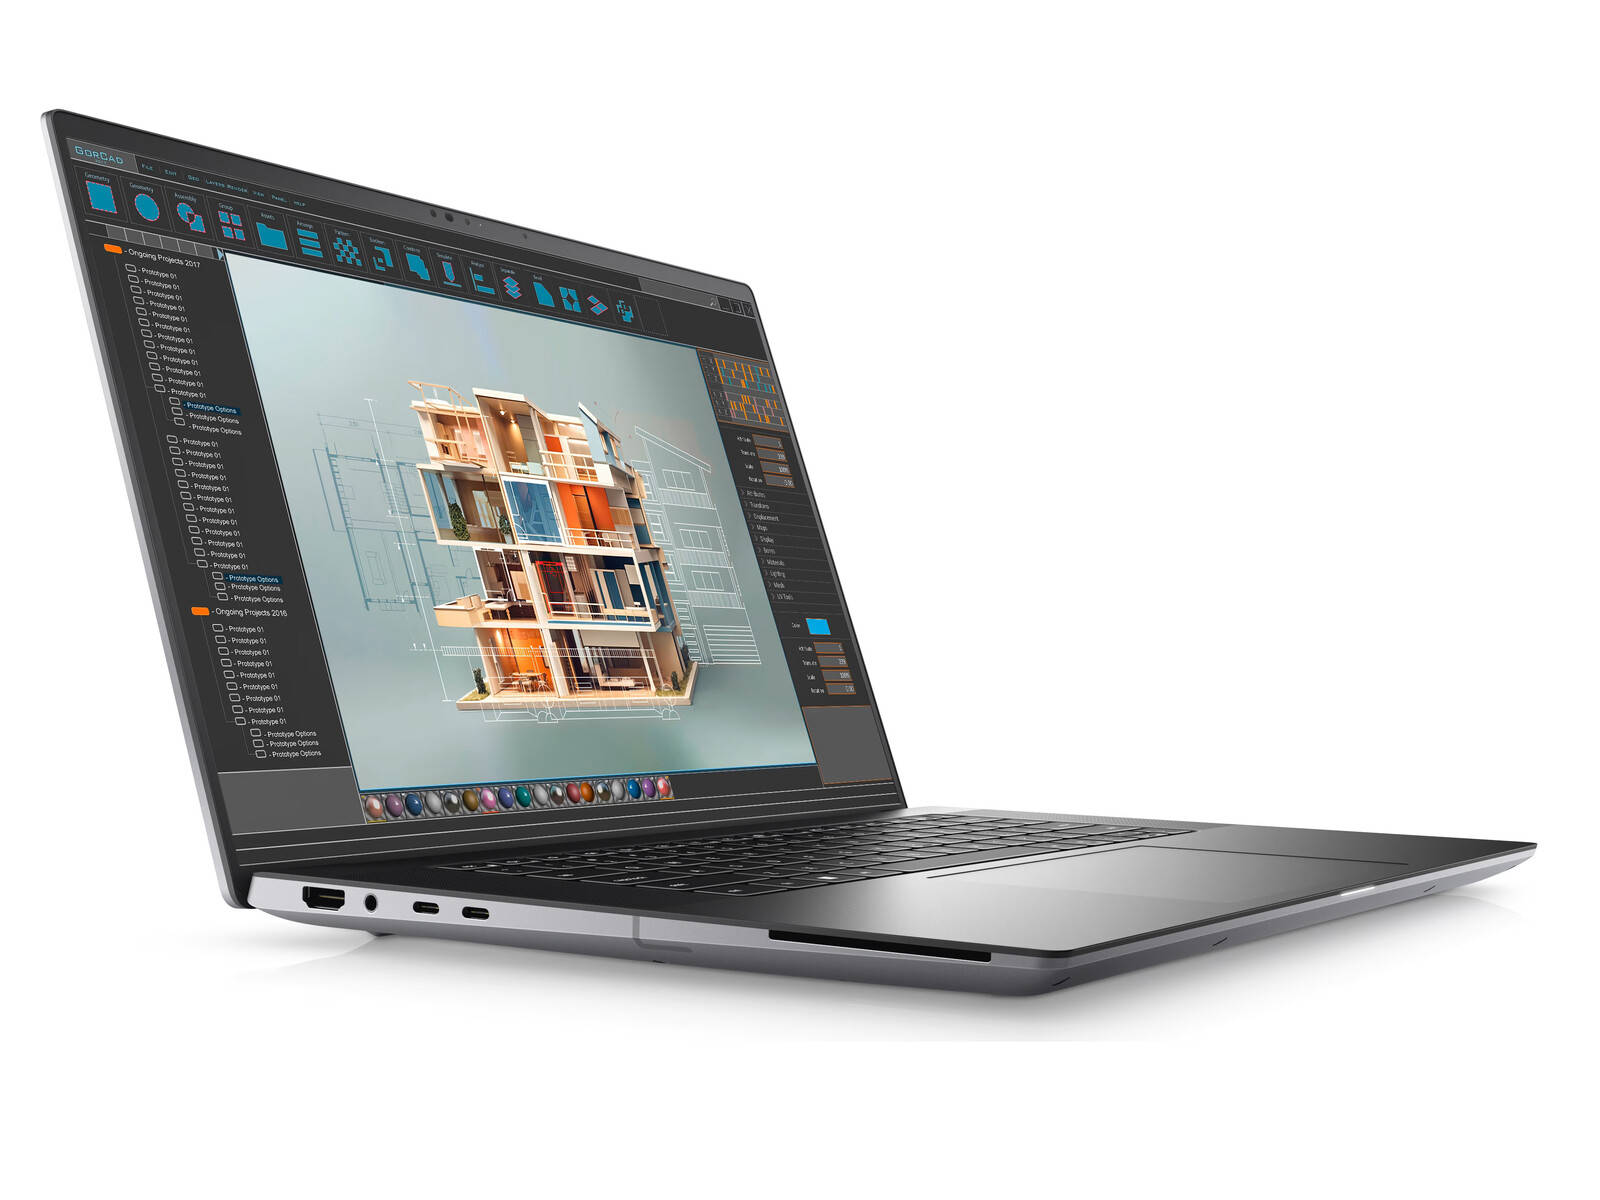
Precision 5680, aşağıdakilerden türetilen şık ve yeni bir tasarımla piyasaya çıktı XPS 16 vPro CPU'lar ve üst düzey Nvidia RTX Ada grafikleriyle tamamlandı. Daha sonra boyutuna ve ağırlığına göre mevcut en hızlı 16 inç iş istasyonlarından biri haline gelecektir. Buradaki sorun şu ki Precision 5680 neredeyse yarım yaşında ve hala oldukça taze. Daha yeni olan Precision 5690, Precision 5680 ile aynı kasayı, GPU'yu, ekranı, güç tüketim seviyelerini, pil ömrünü ve işlemci performansını sunuyor. Biraz tasarruf etmek istiyorsanız, geçen yılki Precision 5680 esasen aynı kullanıcı deneyimini ve performansı daha ucuza sunabilir.
)(()()
2024 Precision 5690'ı 2023 Precision 5680'den ayıran en önemli faktör Meteor Lake-H serisi CPU'lardaki entegre NPU'dur. Bu nedenle daha yeni Dell modeli, Windows yerel yapay zeka görevleri için optimize edildiğinde "yapay zekaya hazır" hale geliyor. Örneğin, Co-Pilot'u zaten kullanıyorsanız veya yakın gelecekte daha fazla yapay zeka ile geliştirilmiş uygulama çalıştırmayı bekliyorsanız, Precision 5690, NPU hızlandırması nedeniyle kayda değer bir avantaja sahip olmalıdır. Aksi takdirde, çoğu "geleneksel" görev en son modelde fark edilir derecede daha hızlı çalışmayacaktır.
Fiyat ve Bulunabilirlik
Dell şu anda Core Ultra 5 135H CPU, yalnızca entegre grafikler ve 1200p IPS ekran için 2290 dolardan başlayan fiyatlarla Precision 5690'ı Core Ultra 9 185H, RTX 5000 Ada ve 2400p OLED dokunmatik ekranla yapılandırılmışsa 5000 doların çok üzerinde bir fiyata gönderiyor.
Dell Precision 5690
- 05/08/2024 v7 (old)
Allen Ngo
Şeffaflık
İncelenecek cihazların seçimi editör ekibimiz tarafından yapılır. Test örneği, bu incelemenin amacı doğrultusunda üretici veya perakendeci tarafından yazara ödünç olarak sağlanmıştır. Borç verenin bu inceleme üzerinde herhangi bir etkisi olmadığı gibi, üretici de yayınlanmadan önce bu incelemenin bir kopyasını almamıştır. Bu incelemeyi yayınlama zorunluluğu yoktu. Bağımsız bir medya şirketi olarak Notebookcheck, üreticilerin, perakendecilerin veya yayıncıların otoritesine tabi değildir.
Notebookcheck bu şekilde test yapıyor
Notebookcheck, tüm sonuçların karşılaştırılabilir olmasını sağlamak için her yıl yüzlerce dizüstü bilgisayarı ve akıllı telefonu standart prosedürler kullanarak bağımsız olarak inceliyor. Yaklaşık 20 yıldır test yöntemlerimizi sürekli olarak geliştirdik ve bu süreçte endüstri standartlarını belirledik. Test laboratuvarlarımızda deneyimli teknisyenler ve editörler tarafından yüksek kaliteli ölçüm ekipmanları kullanılmaktadır. Bu testler çok aşamalı bir doğrulama sürecini içerir. Karmaşık derecelendirme sistemimiz, nesnelliği koruyan yüzlerce sağlam temellere dayanan ölçüm ve kıyaslamaya dayanmaktadır.Price comparison

