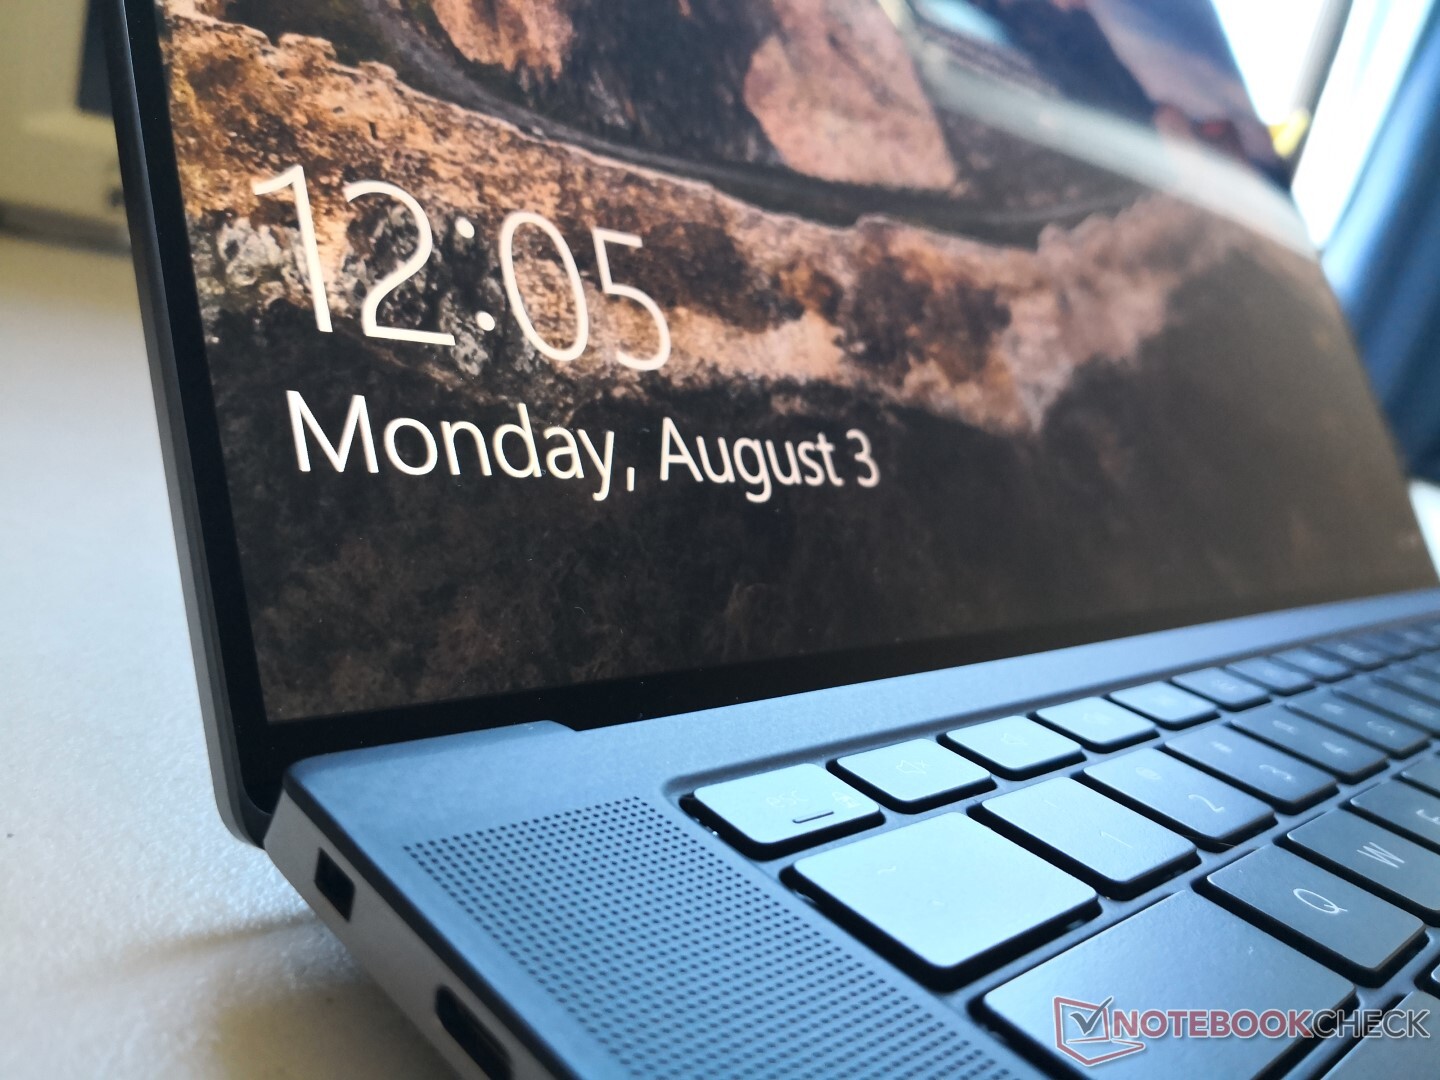
Dell Precision 5550 İş İstasyonu İncelemesi: Profesyoneller İçin XPS 15
Precision 5540'ın tüketici XPS 15 7590'ın iş istasyonu sürümü olmasına çok benzer şekilde, yeni Precision 5550, XPS 15 9500'ün iş istasyonu sürümüdür. En son model, temelde aynı görsele sahip son nesil Precision 5540'a göre tam bir kasa güncellemesidir. tasarım ve XPS 15 9500 gibi özellikler. Bu nedenle, Precision 5550'nin fiziksel özellikleri hakkında daha fazla bilgi edinmek için XPS 15 9500'deki incelememize göz atmanızı öneririz. Precision 5550'nin benzersiz özellikleri, Core i9'u içerdiğinden büyük ölçüde dahilidir. 10885H vPro, Xeon W-10855M ve Nvidia Quadro T1000 ve T2000 Max-Q seçenekleri hiçbir XPS sisteminde bulunmaz. Yapılandırılmış birimimiz Core i7-10875H ve Quadro T2000 Max-Q ile yaklaşık 3000 ABD doları perakende satış fiyatıyla gelir.Bu alandaki rakipler arasında MSI WS serisi, Acer ConceptD 3 Pro, Razer Blade Studio veya HP gibi diğer ultra ince iş istasyonları yer alır. ZBook 15u serisi. Piyasada daha geleneksel iş istasyonları arayan kullanıcılar bunun yerine üst düzey Precision 7000 serisine bakmalıdır.Daha fazla Dell incelemesi: Alienware m15 R3XPS 17 9700Latitude 9510 2'si 1 aradaG5 15 SEInspiron 14
Derecelendirme | Tarih | Modeli | Ağırlık | Yükseklik | Boyut | Çözünürlük | Fiyat |
|---|---|---|---|---|---|---|---|
| 86.3 % v7 (old) | 08/2020 | Dell Precision 5550 P91F i7-10875H, Quadro T2000 Max-Q | 2 kg | 18 mm | 15.60" | 3840x2400 | |
| 86.9 % v7 (old) | 03/2020 | Dell Precision 5540 i9-9980HK, Quadro T2000 Max-Q | 2 kg | 17 mm | 15.60" | 3840x2160 | |
| 87 % v7 (old) | 08/2020 | Razer Blade 15 Studio Edition 2020 i7-10875H, Quadro RTX 5000 Max-Q | 2.2 kg | 13.98 mm | 15.60" | 3840x2160 | |
| 82.1 % v7 (old) | 03/2020 | Acer ConceptD 3 Pro CN315-71P-73W1 i7-9750H, Quadro T1000 (Laptop) | 2.4 kg | 23.4 mm | 15.60" | 1920x1080 | |
| 89.8 % v7 (old) | 12/2019 | Lenovo ThinkPad P53-20QN000YGE i7-9850H, Quadro RTX 5000 Max-Q | 2.7 kg | 29.4 mm | 15.60" | 1920x1080 | |
| 76 % v7 (old) | MSI WP65 i7-9750H, Quadro P620 | 1.9 kg | 21.7 mm | 15.60" | 1920x1080 |
Durum
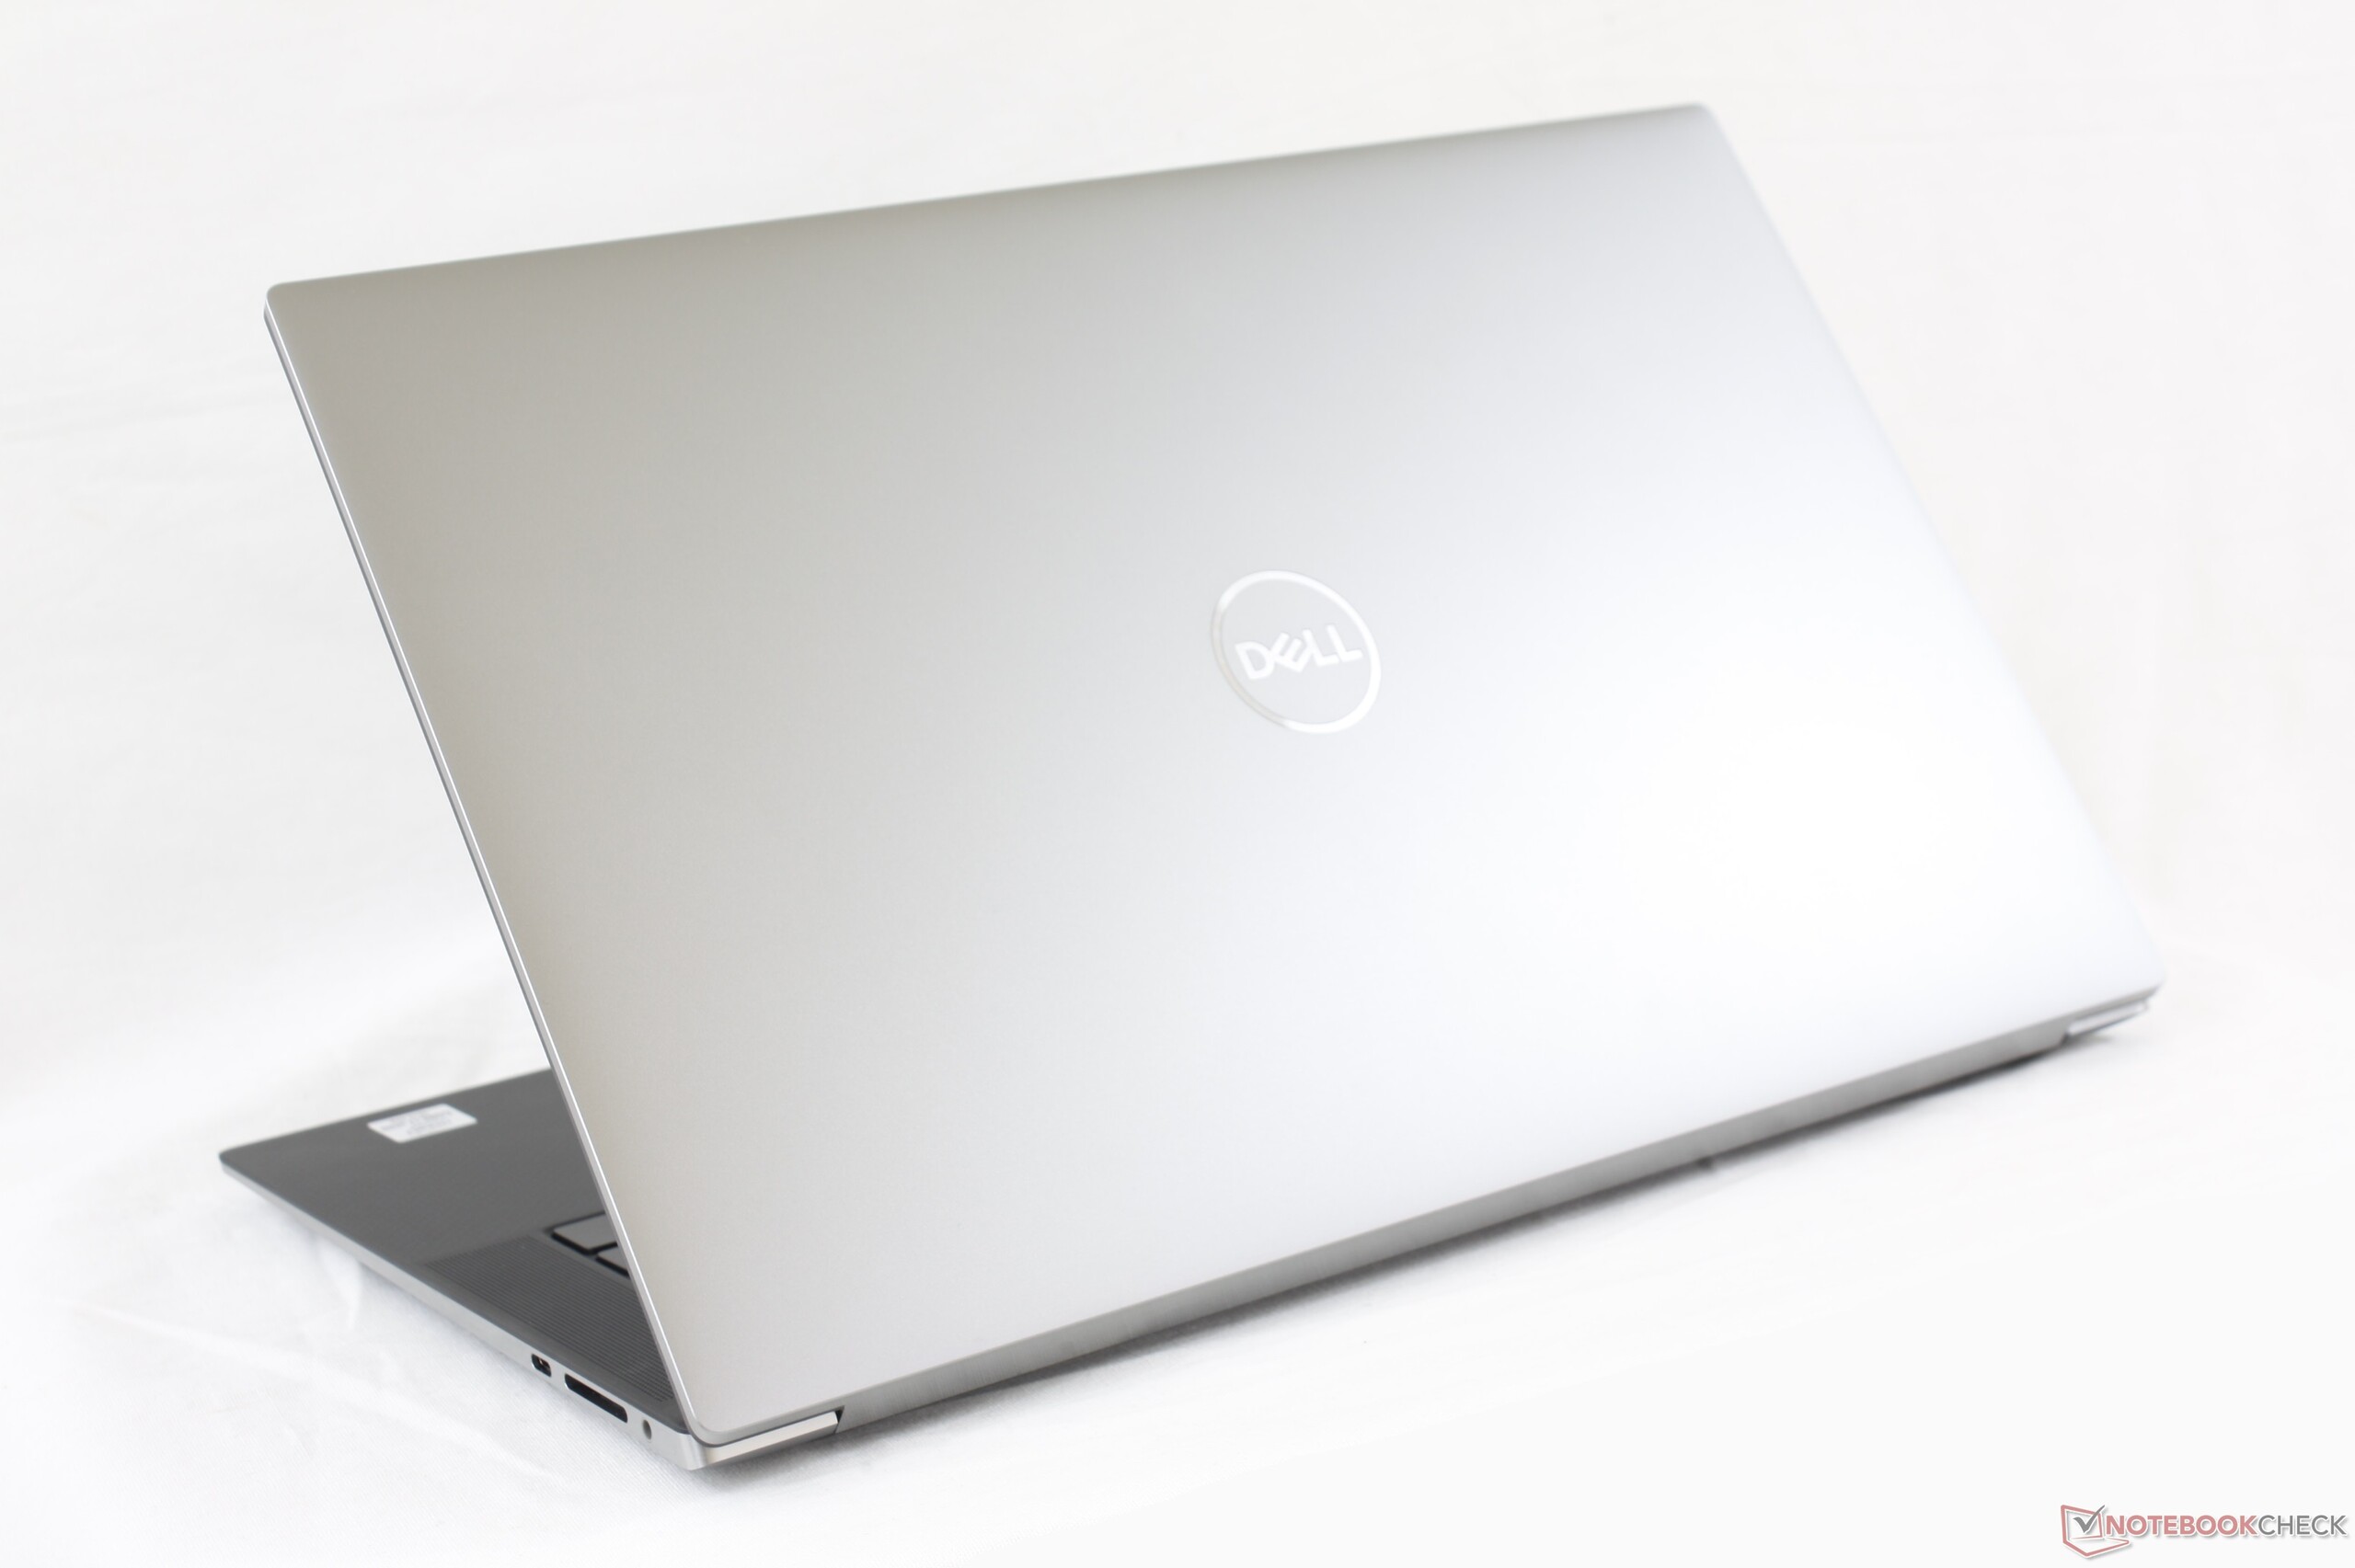
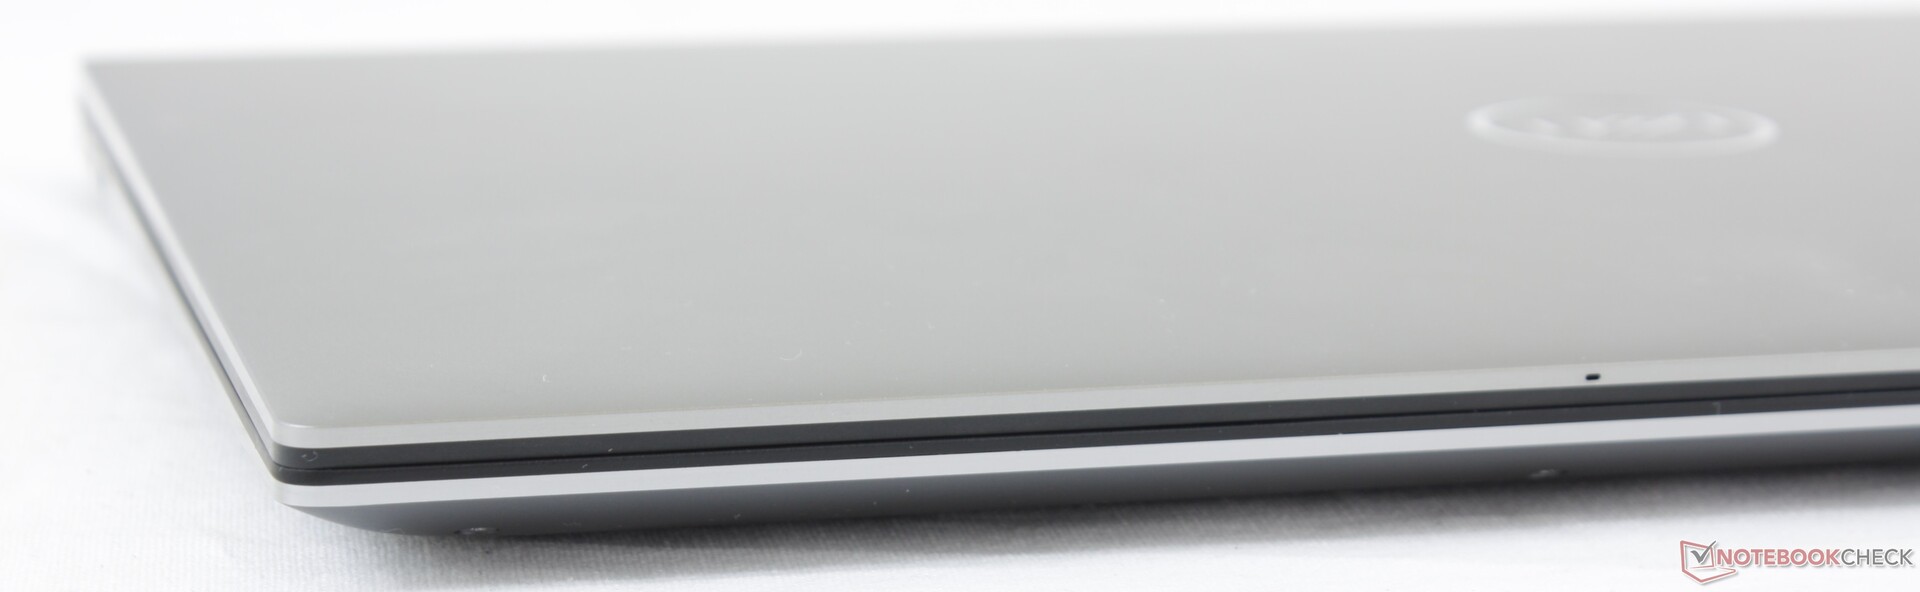
Kasa, XPS 15 9500 ile aynıdır ancak gümüş yerine daha koyu mat gri tondadır. Bu aynı renk seçeneğini normal XPS için de görmek güzel olurdu.
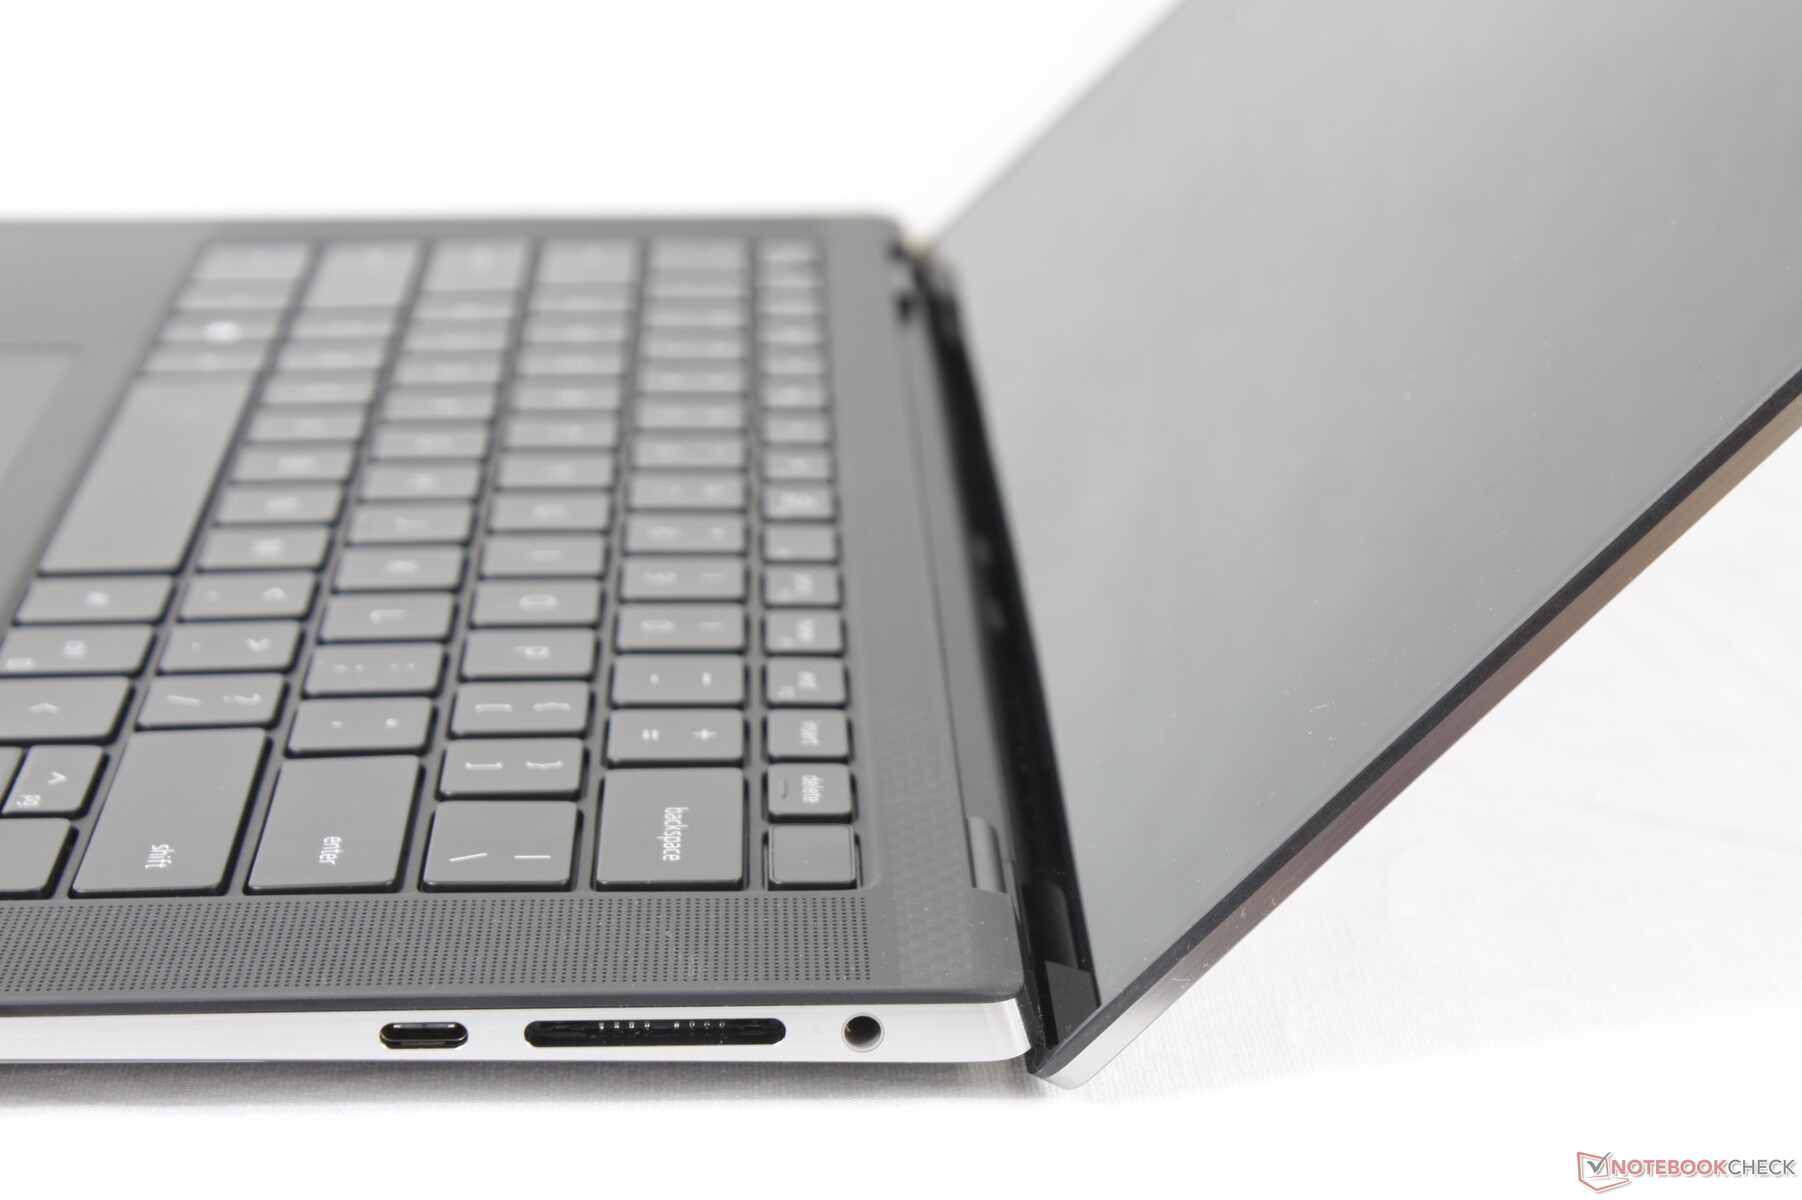
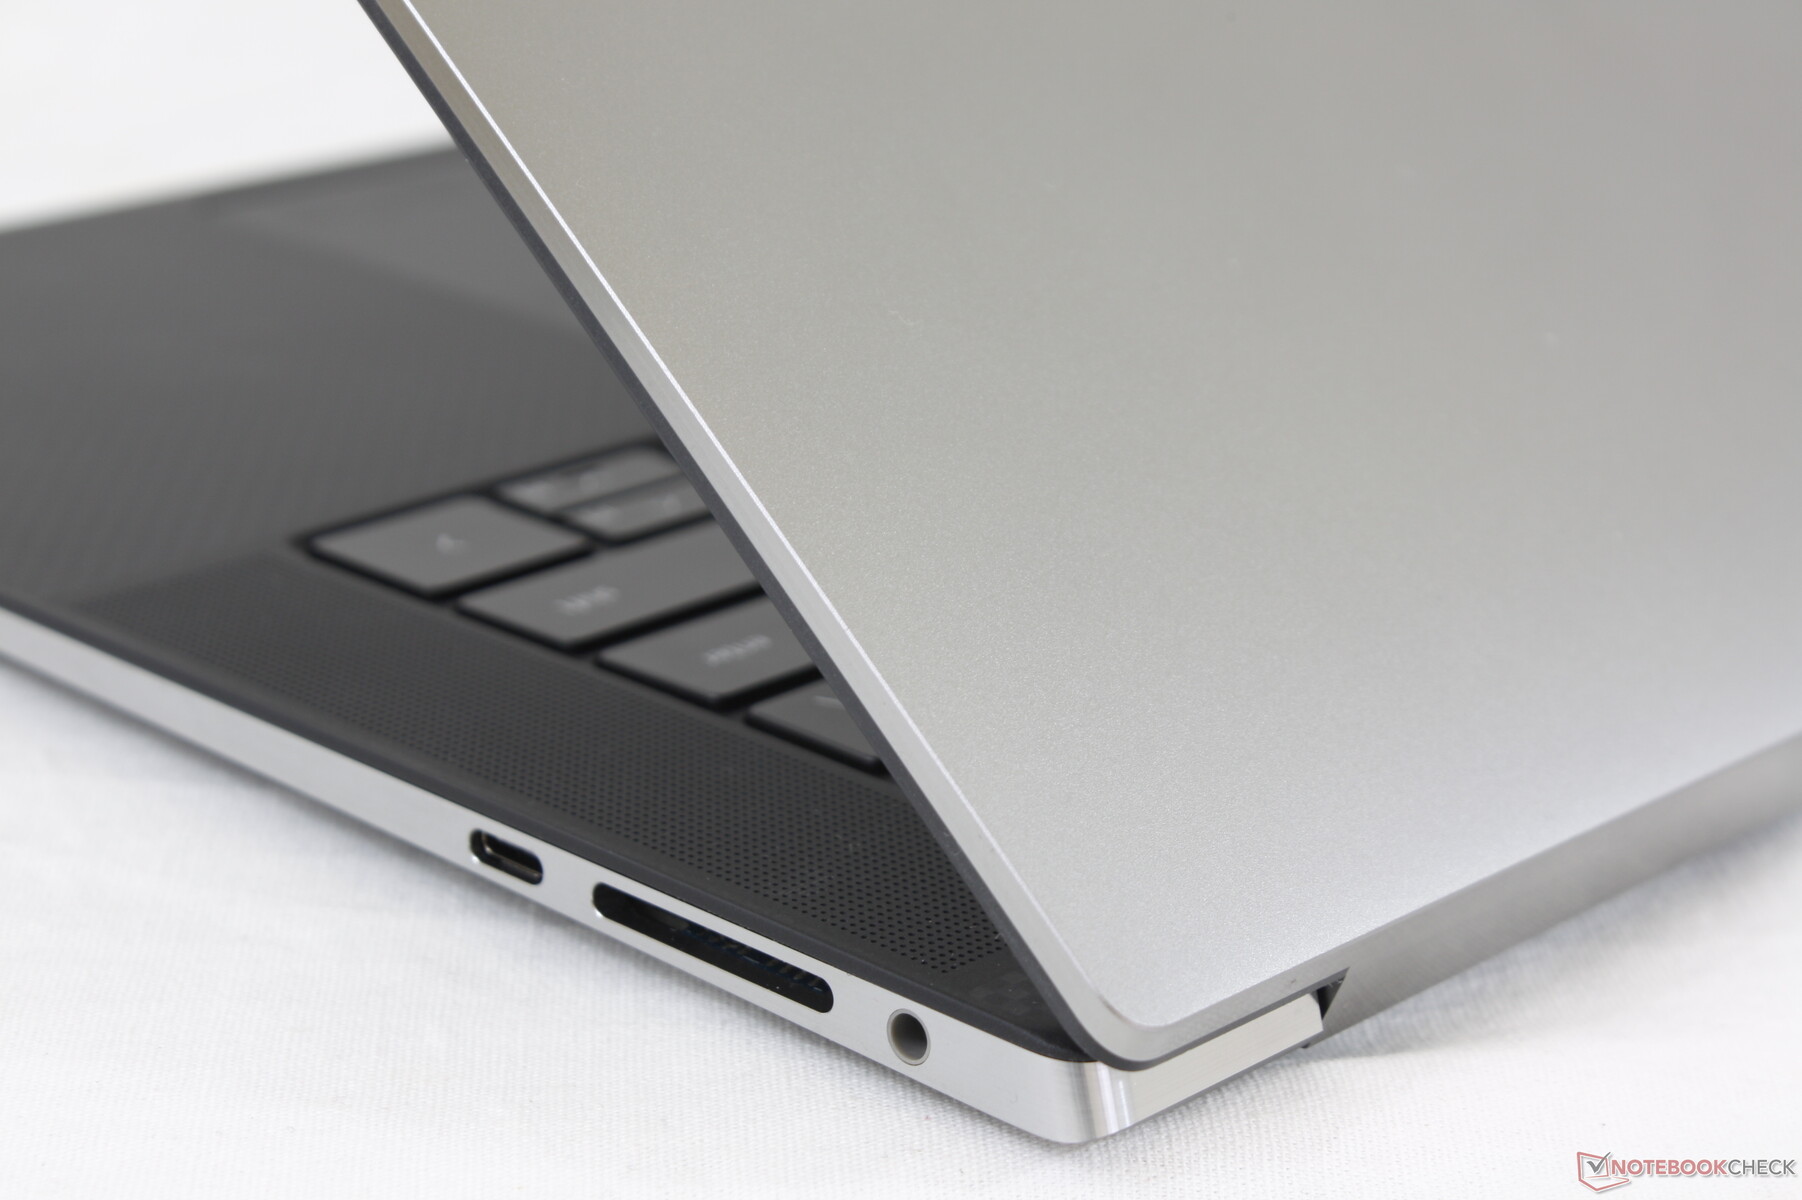
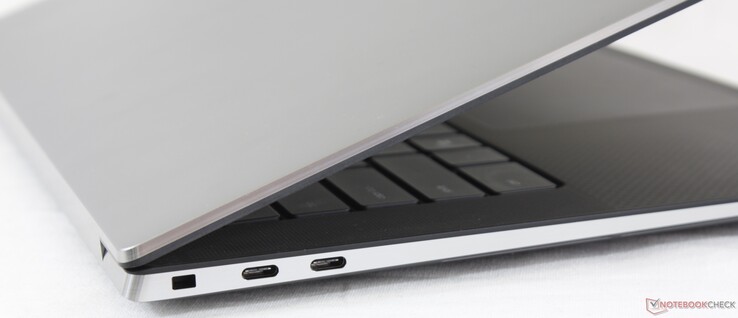
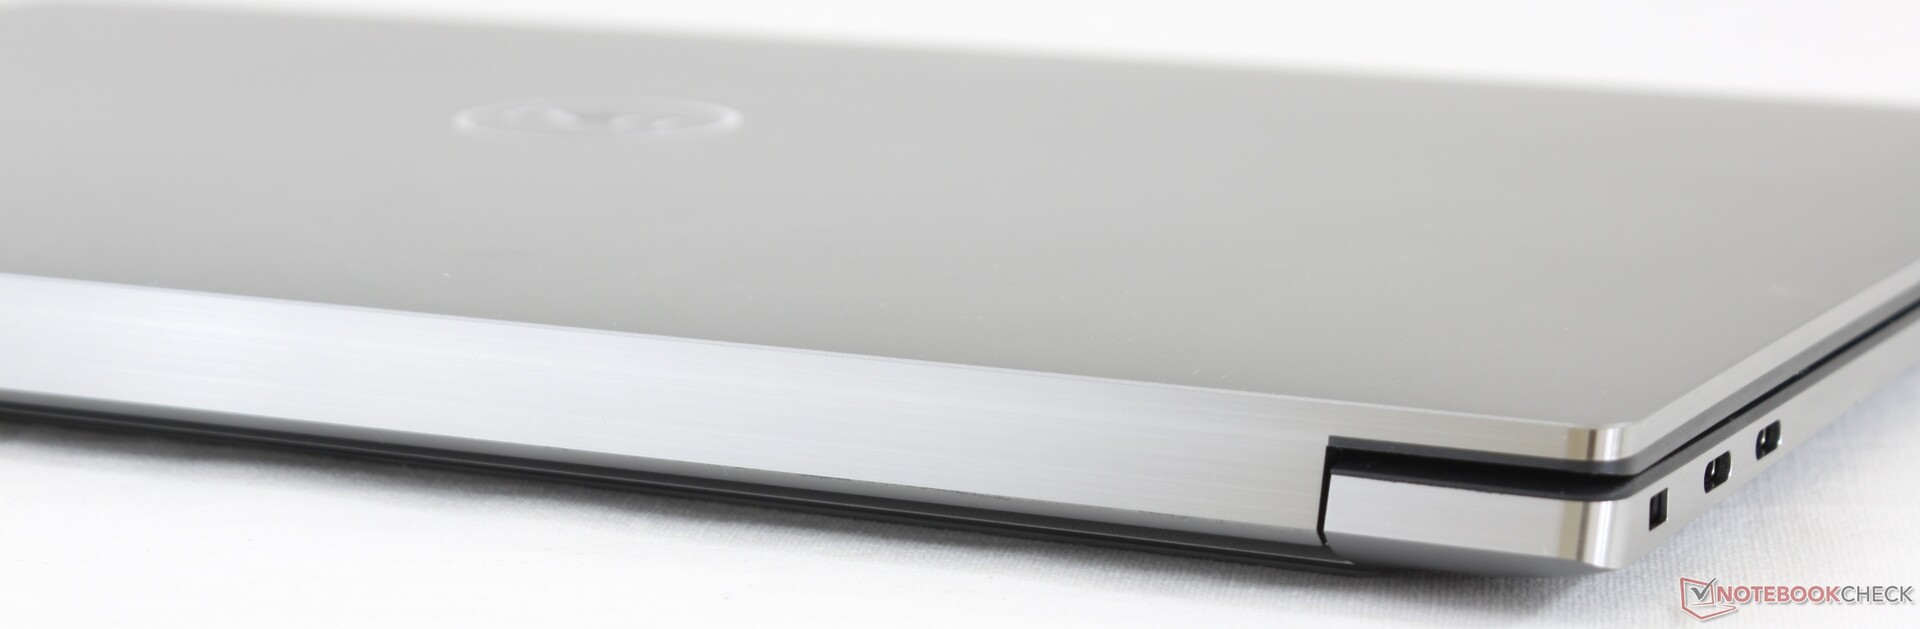
Bağlantı
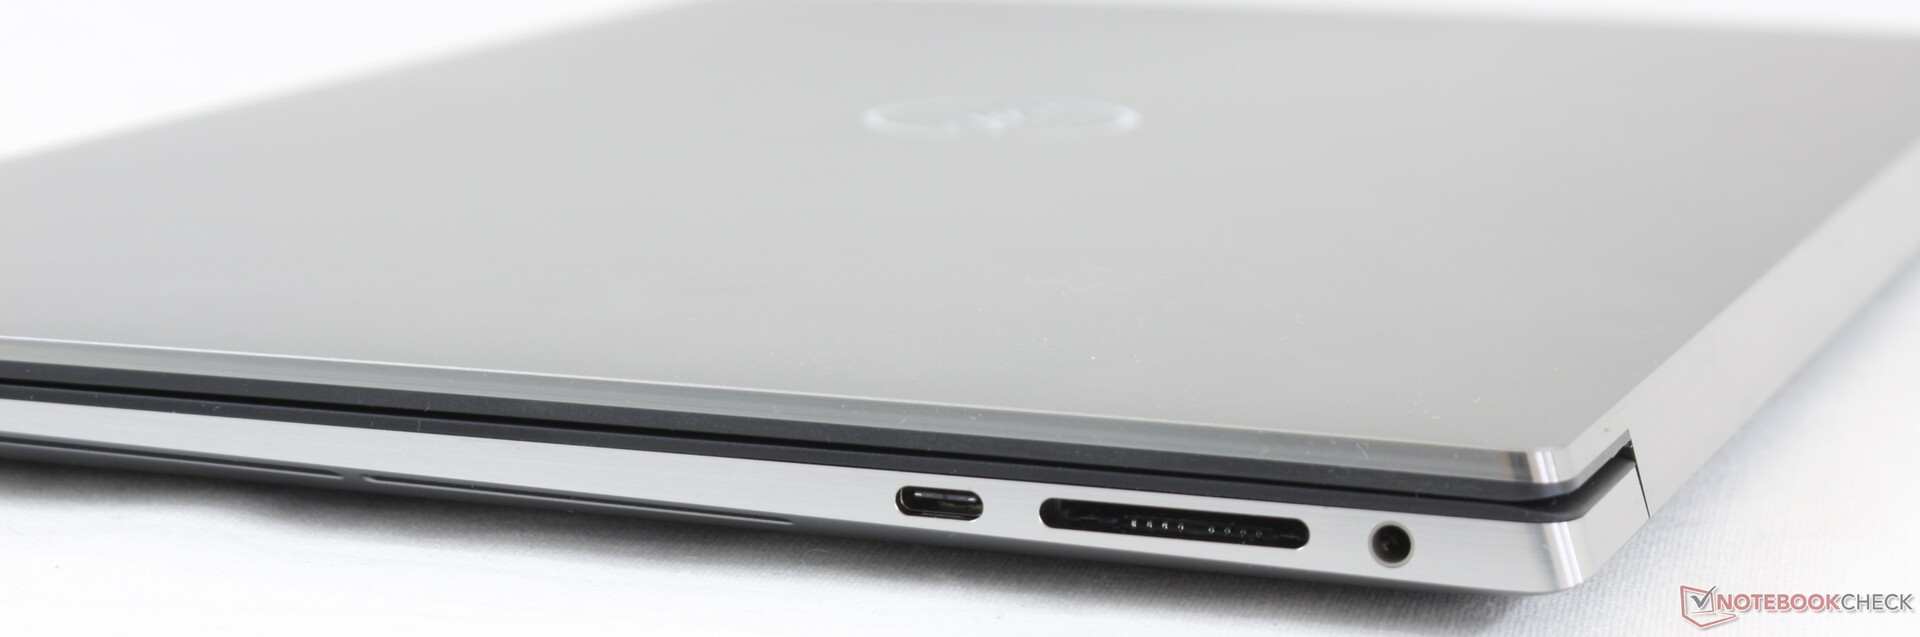
SD Kart Okuyucu
SD kart okuyucusundan aktarım hızları XPS 15'teki gibi son derece hızlıdır. 1 GB'lık resmi UHS-II test kartımızdan masaüstüne taşımak yalnızca 5 ila 6 saniye sürer.
| SD Card Reader - average JPG Copy Test (av. of 3 runs) | |
| Dell Precision 5550 P91F (Toshiba Exceria Pro SDXC 64 GB UHS-II) | |
| Lenovo ThinkPad P53-20QN000YGE (Toshiba Exceria Pro SDXC 64 GB UHS-II) | |
| Dell Precision 5540 (Toshiba Exceria Pro SDXC 64 GB UHS-II) | |
| Razer Blade 15 Studio Edition (Toshiba Exceria Pro SDXC 64 GB UHS-II) | |
İletişim
Intel AX201, Wi-Fi 6 ve Bluetooth 5.1 bağlantısı için standart olarak gelir. Netgear RAX200 test yönlendiricimizle eşleştirildiğinde hiçbir sorun yaşamadık.
Web kamerası


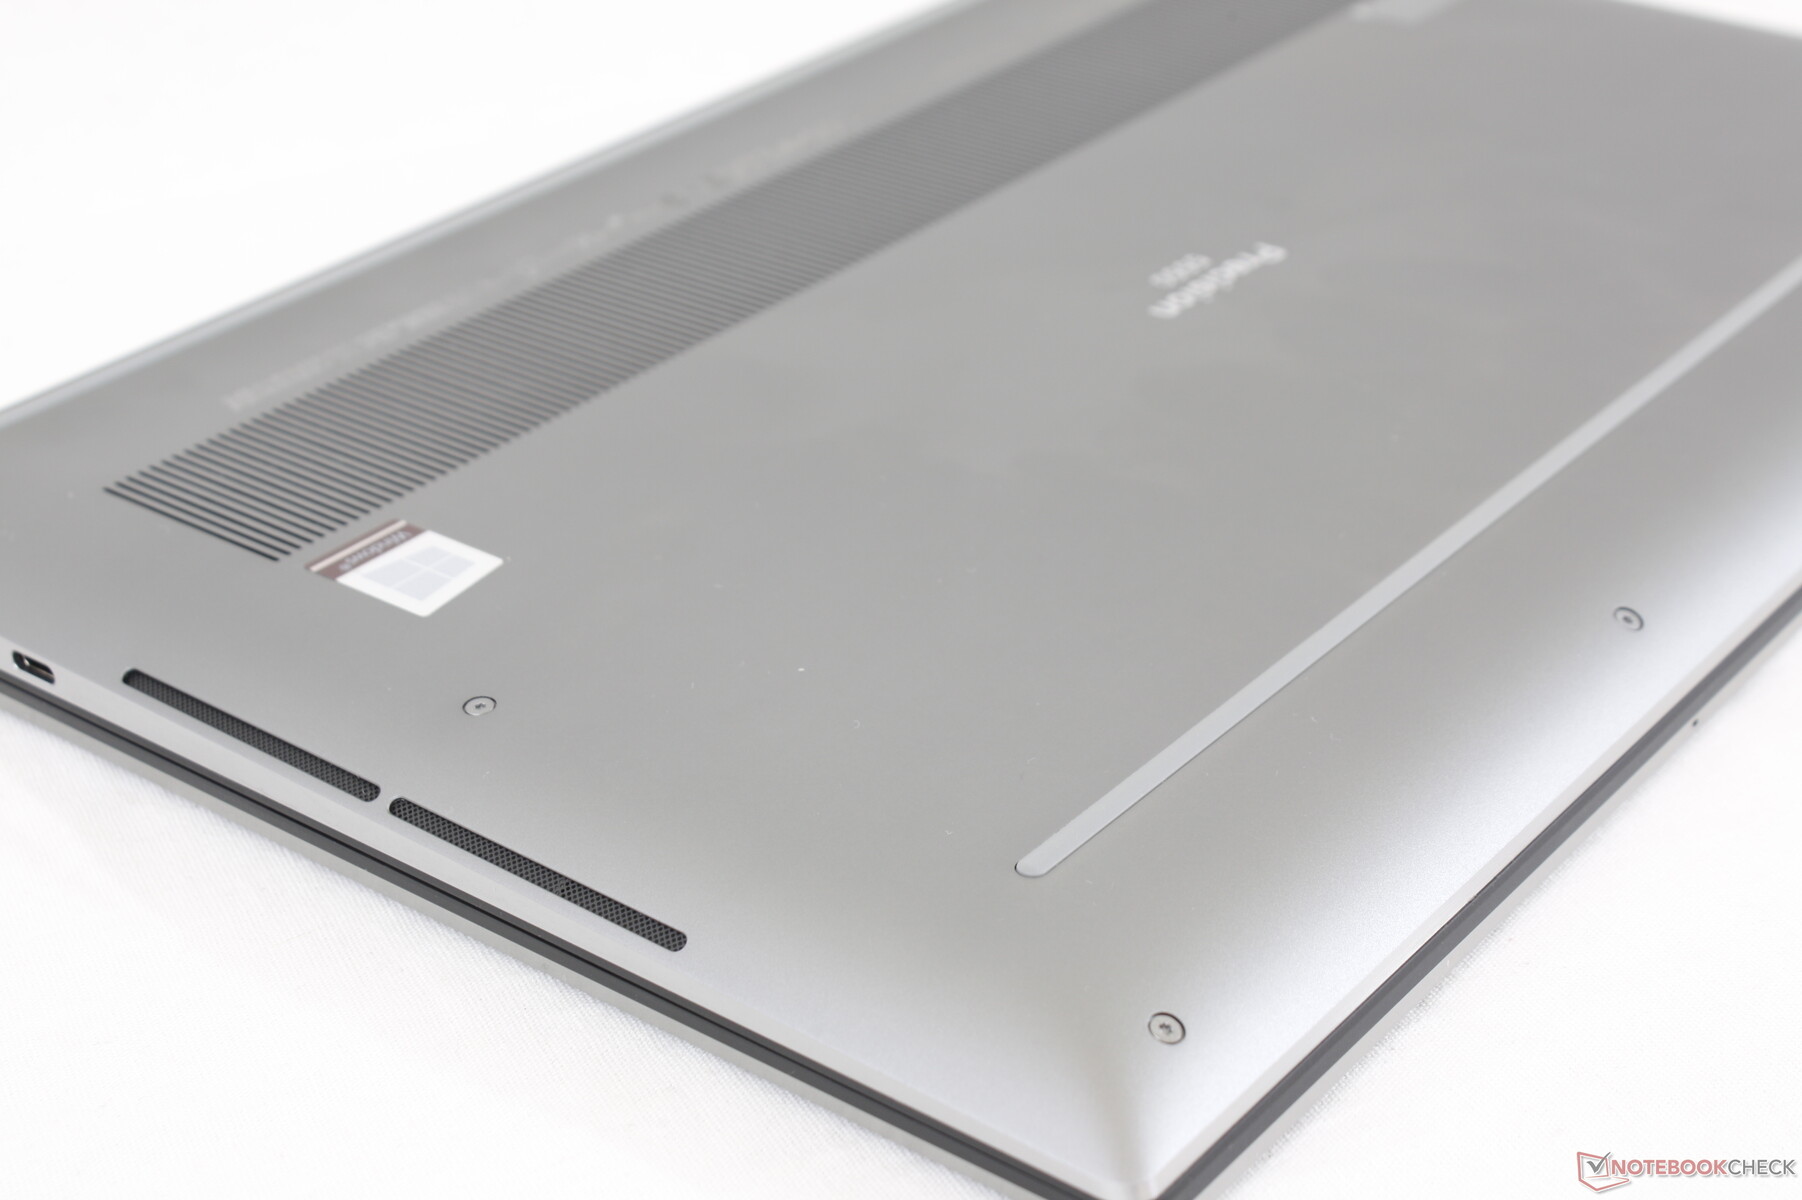
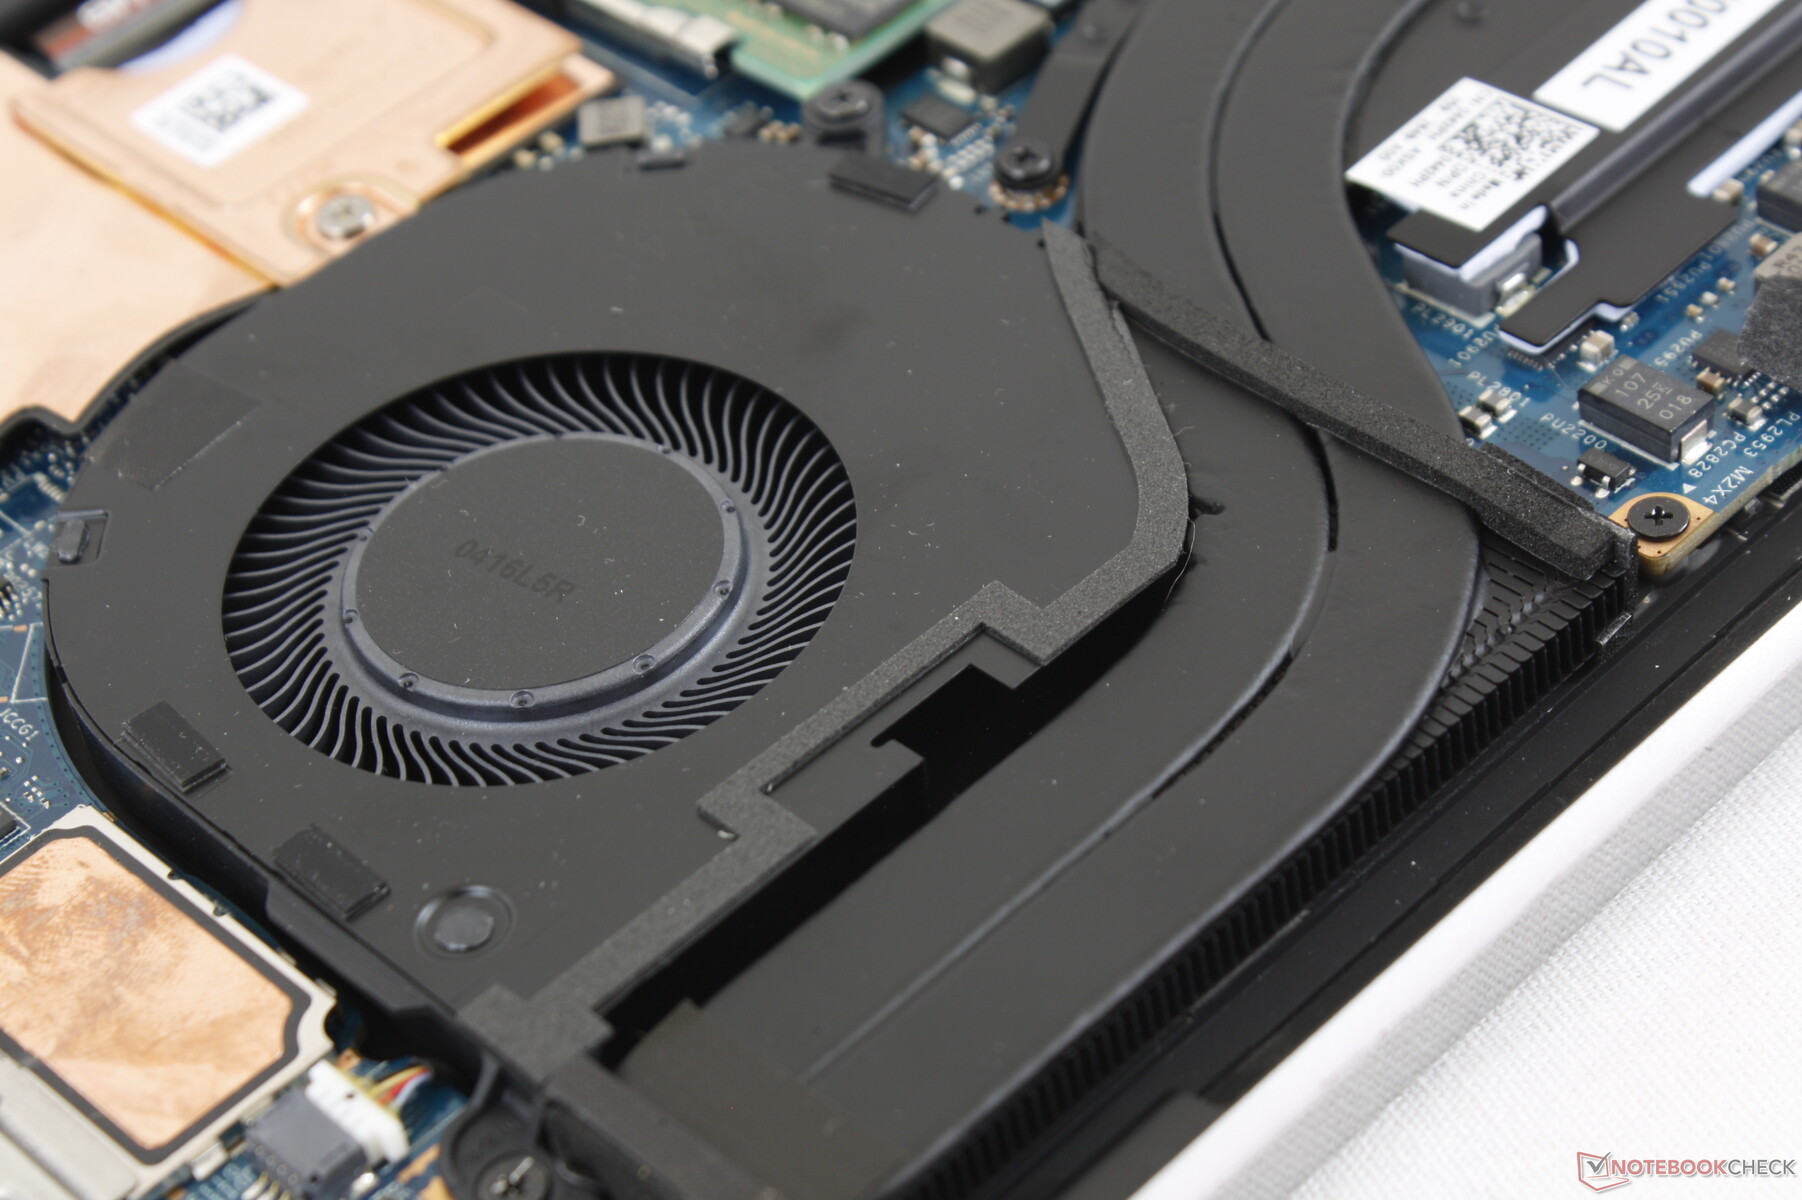
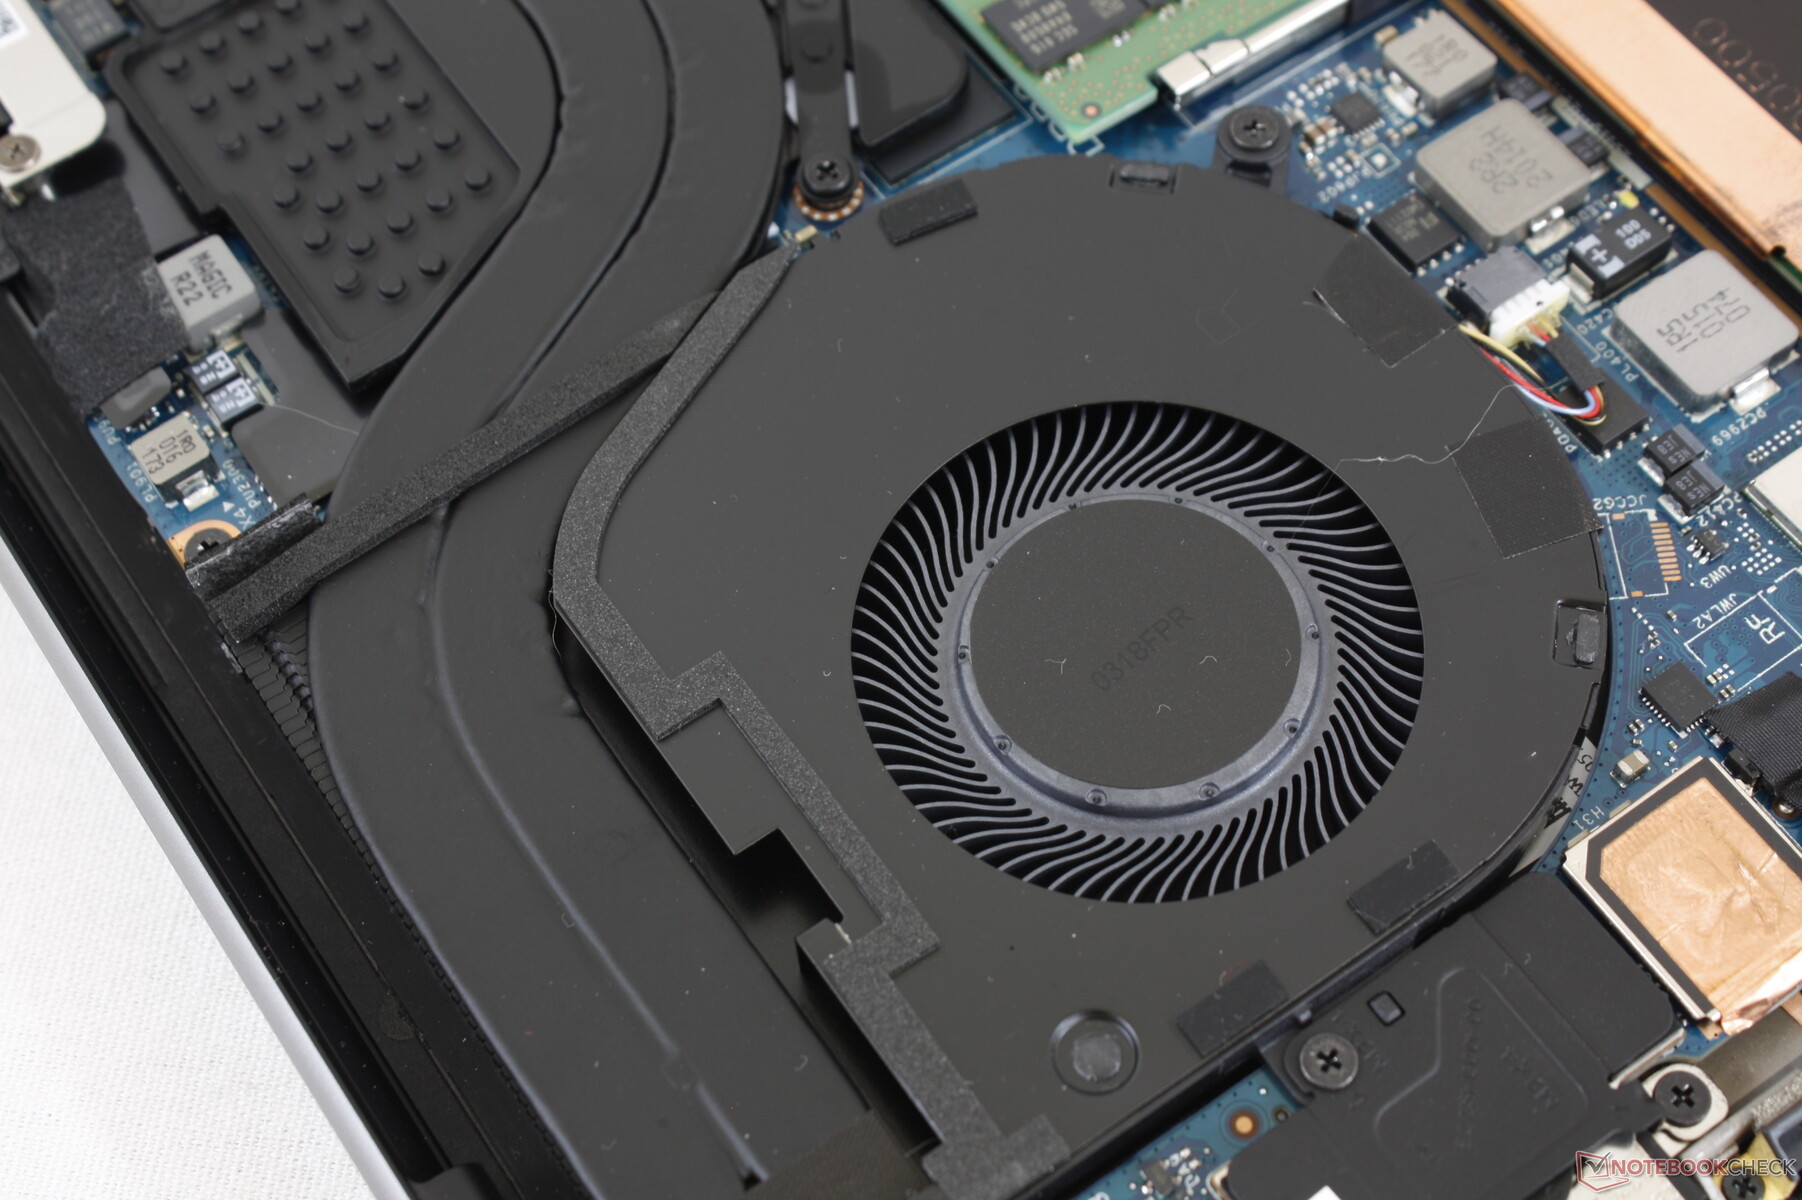
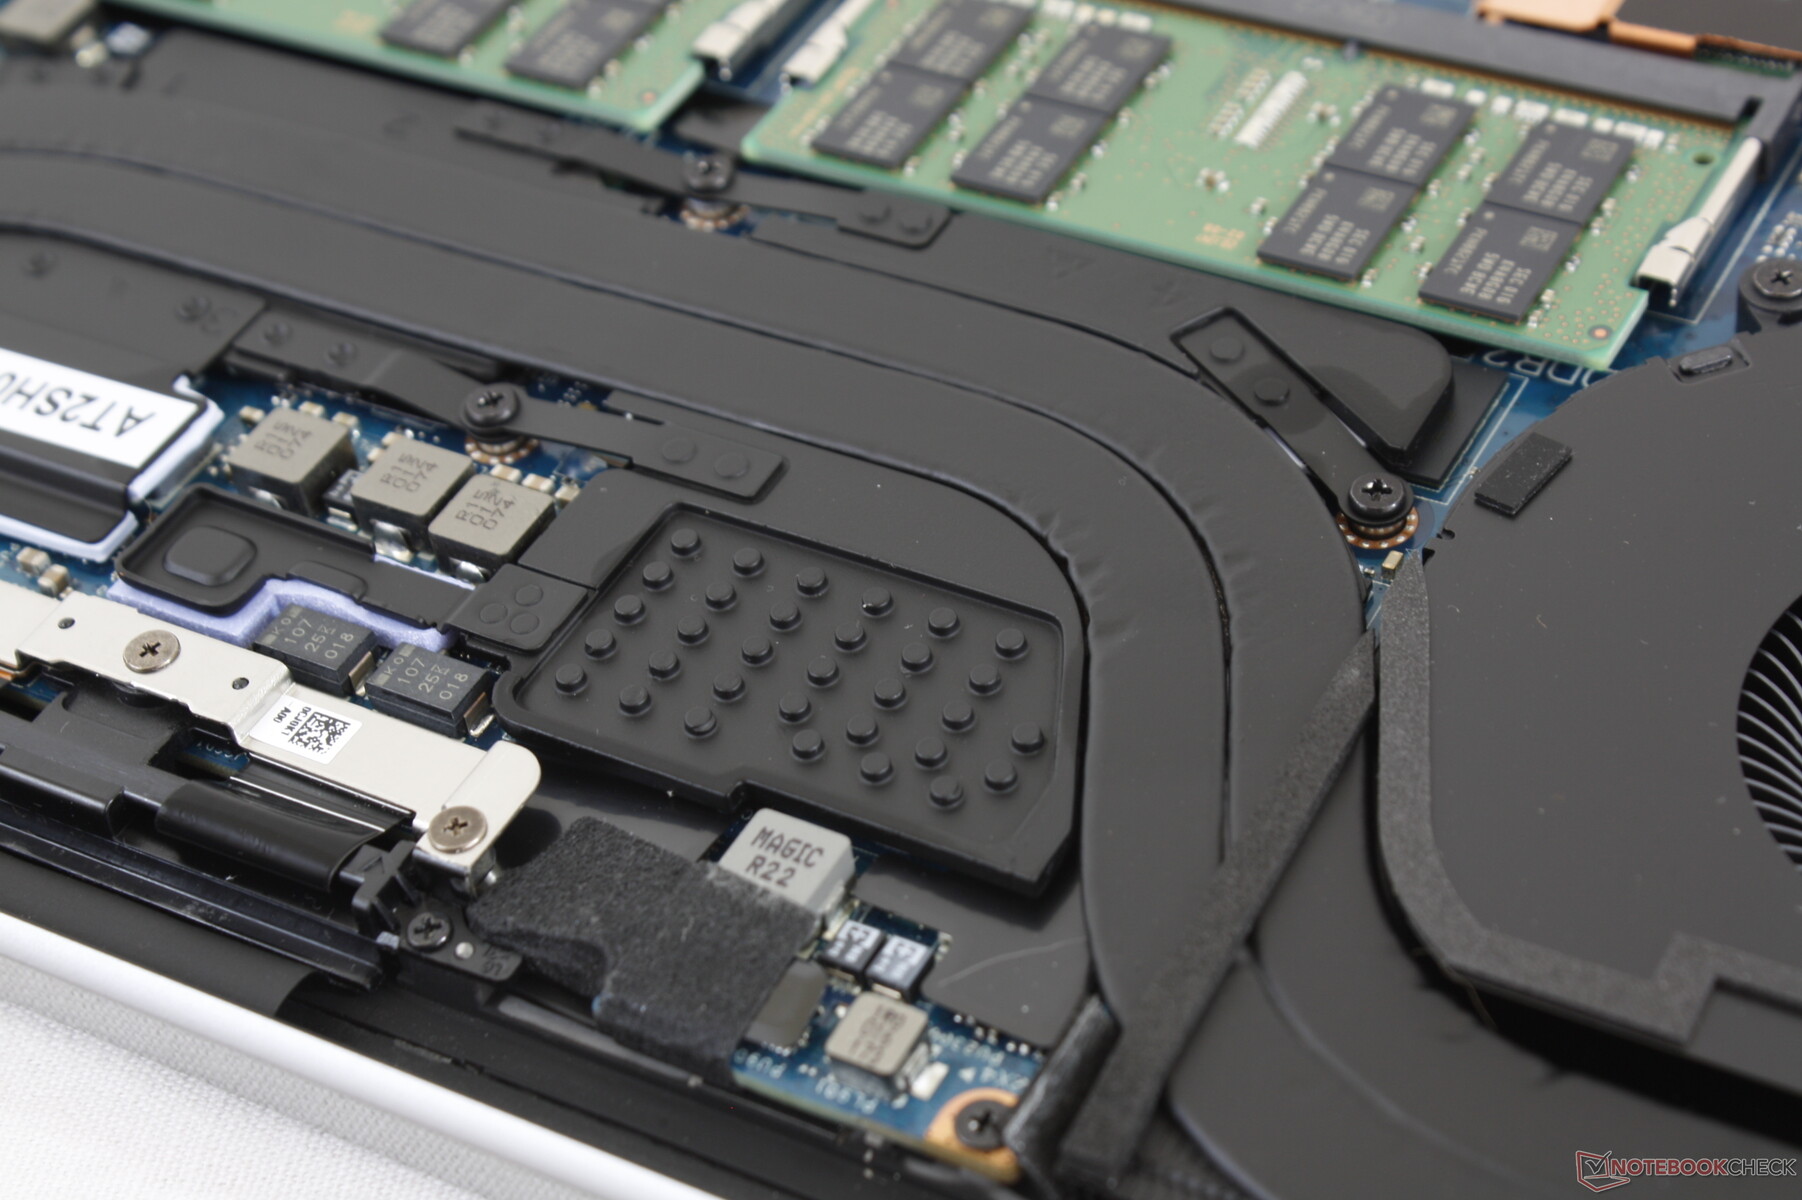
Bakım
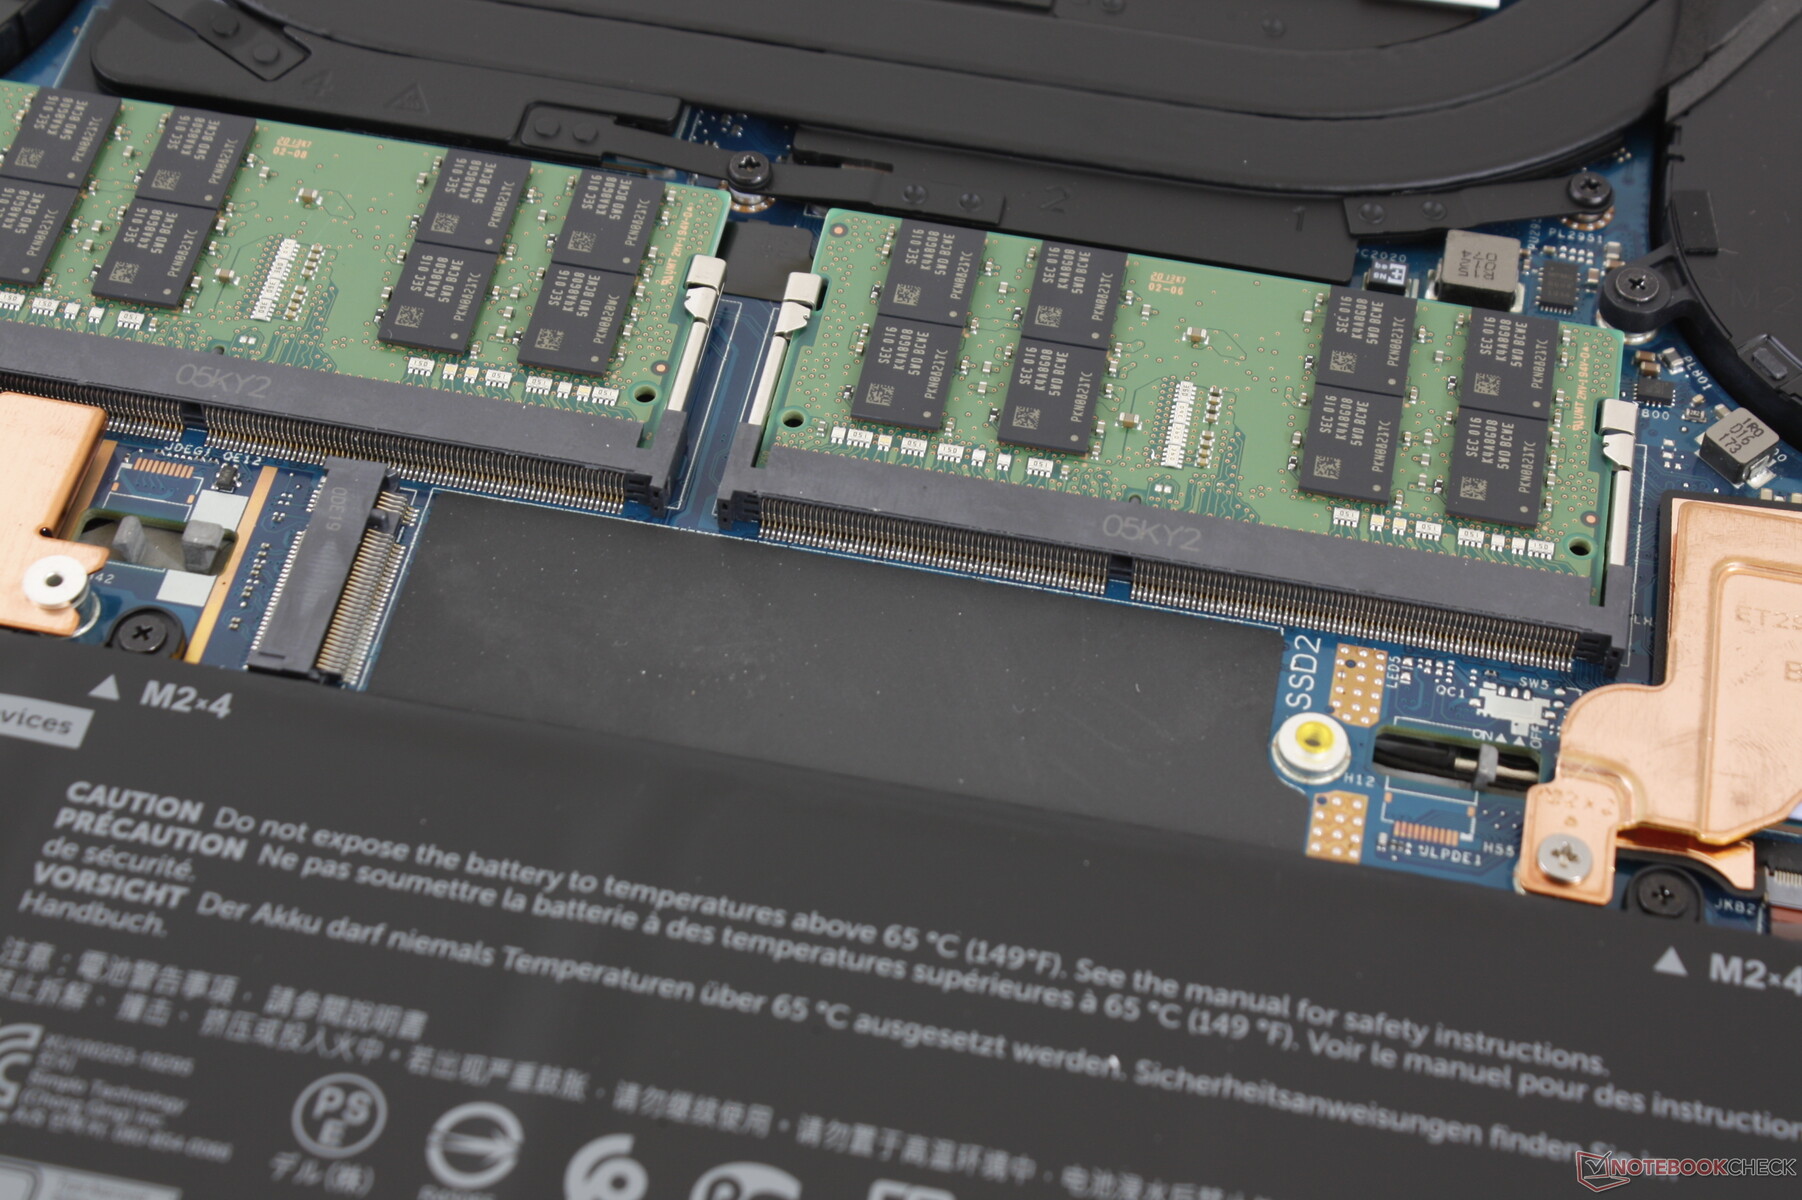
Metal alt panelin çıkarılması geçen yılki Precision 5540'a göre biraz daha zordur çünkü kenarlar ve köşeler daha keskin ve daha sıkıdır. Kullanıcılar artık lehimlendiği için WLAN modülüne hizmet veremezler.
Aksesuarlar ve Garanti
Tüm SKU'lar, her XPS 15 9500 siparişiyle birlikte gelen aynı USB-C - USB-A ve HDMI adaptörüyle gönderilir. Üç yıllık sınırlı garanti standart olarak gelir.
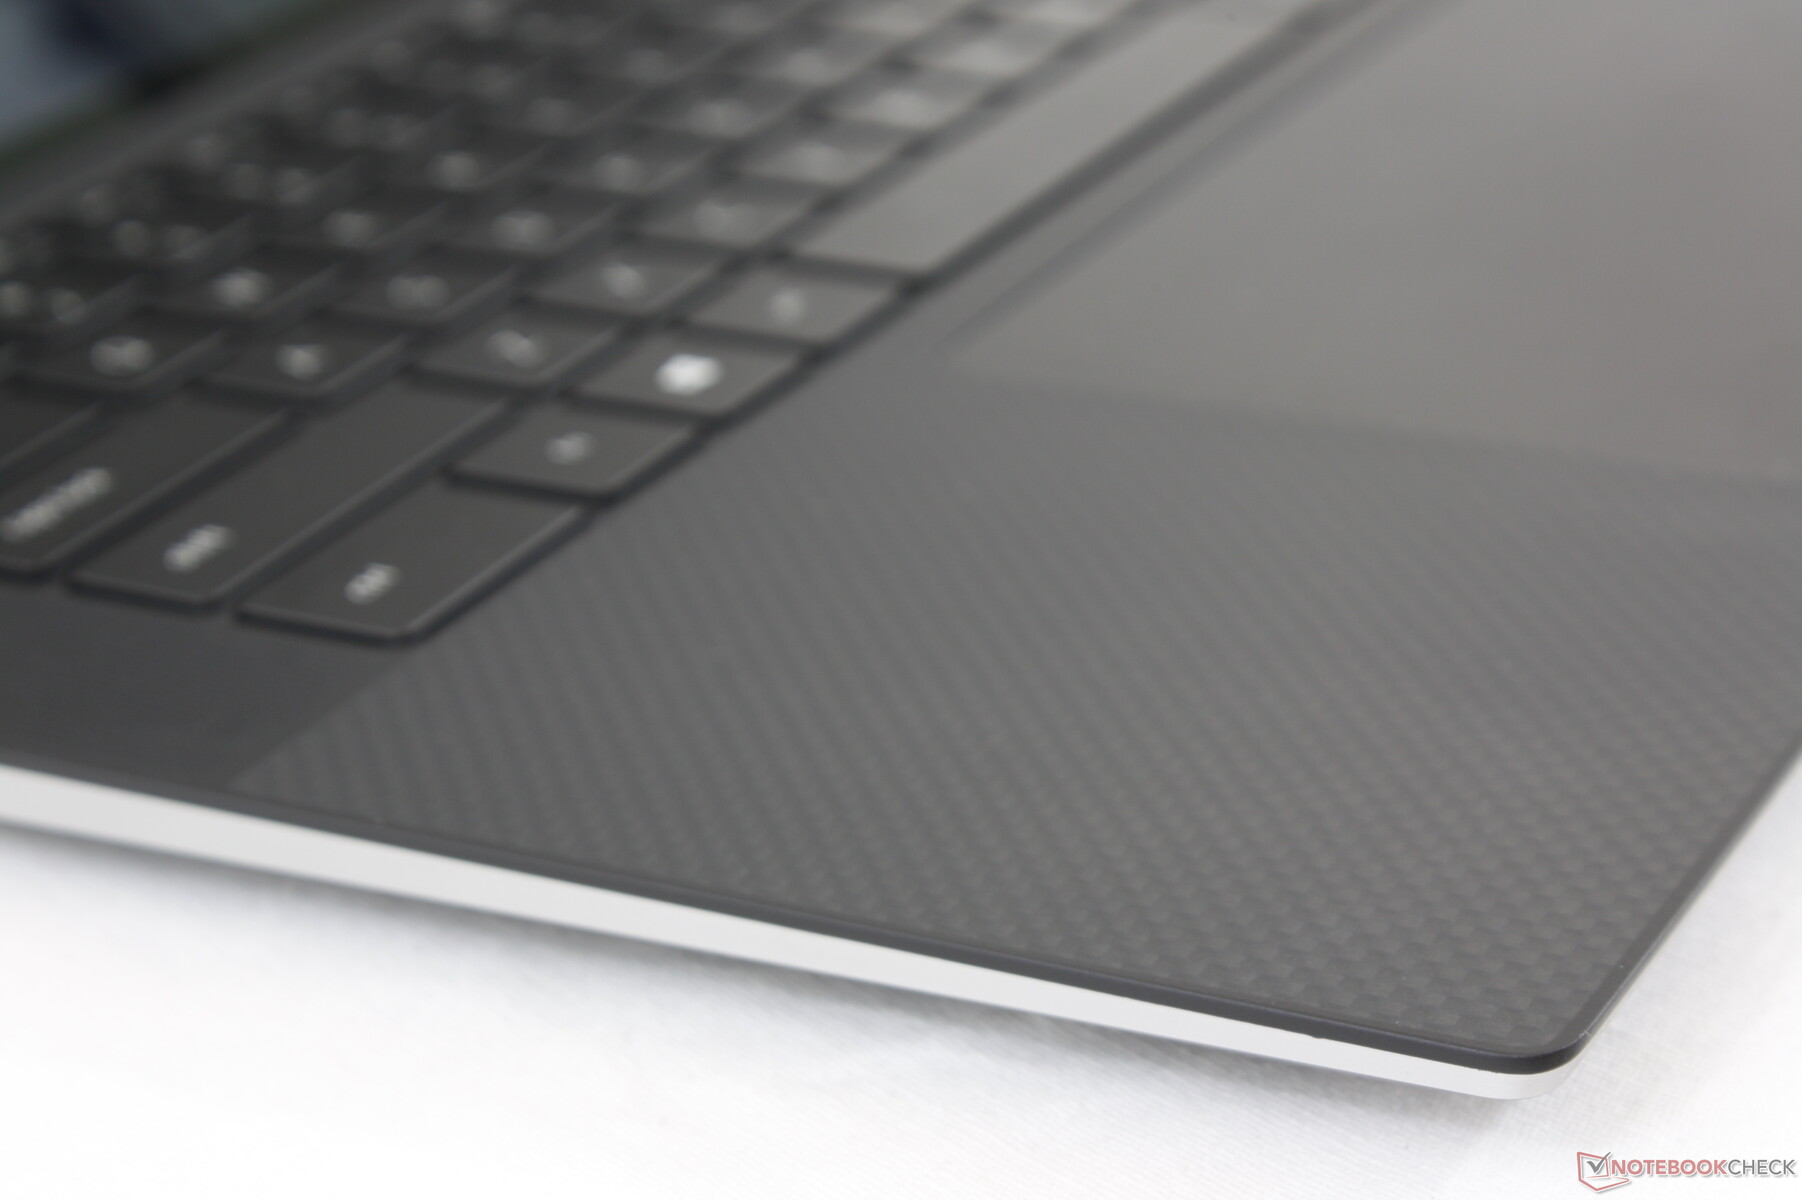
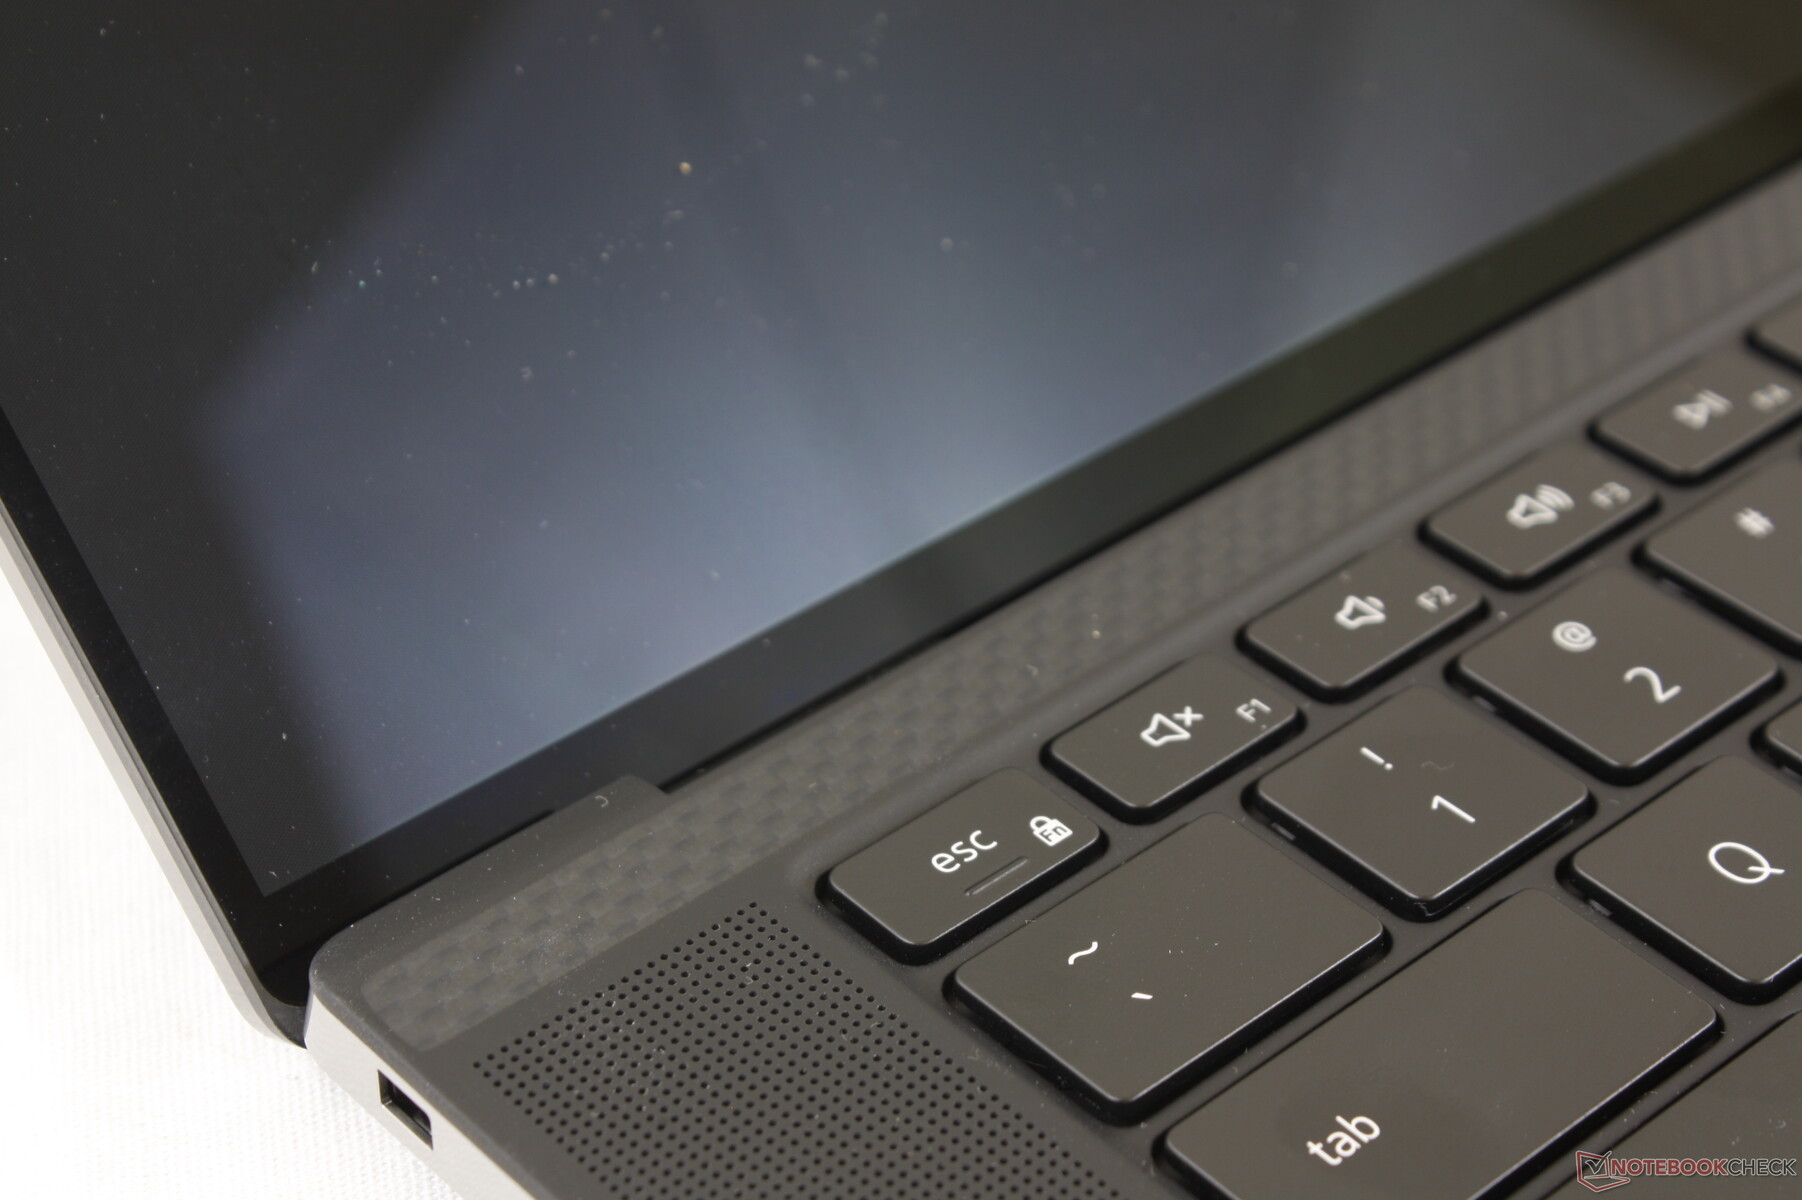
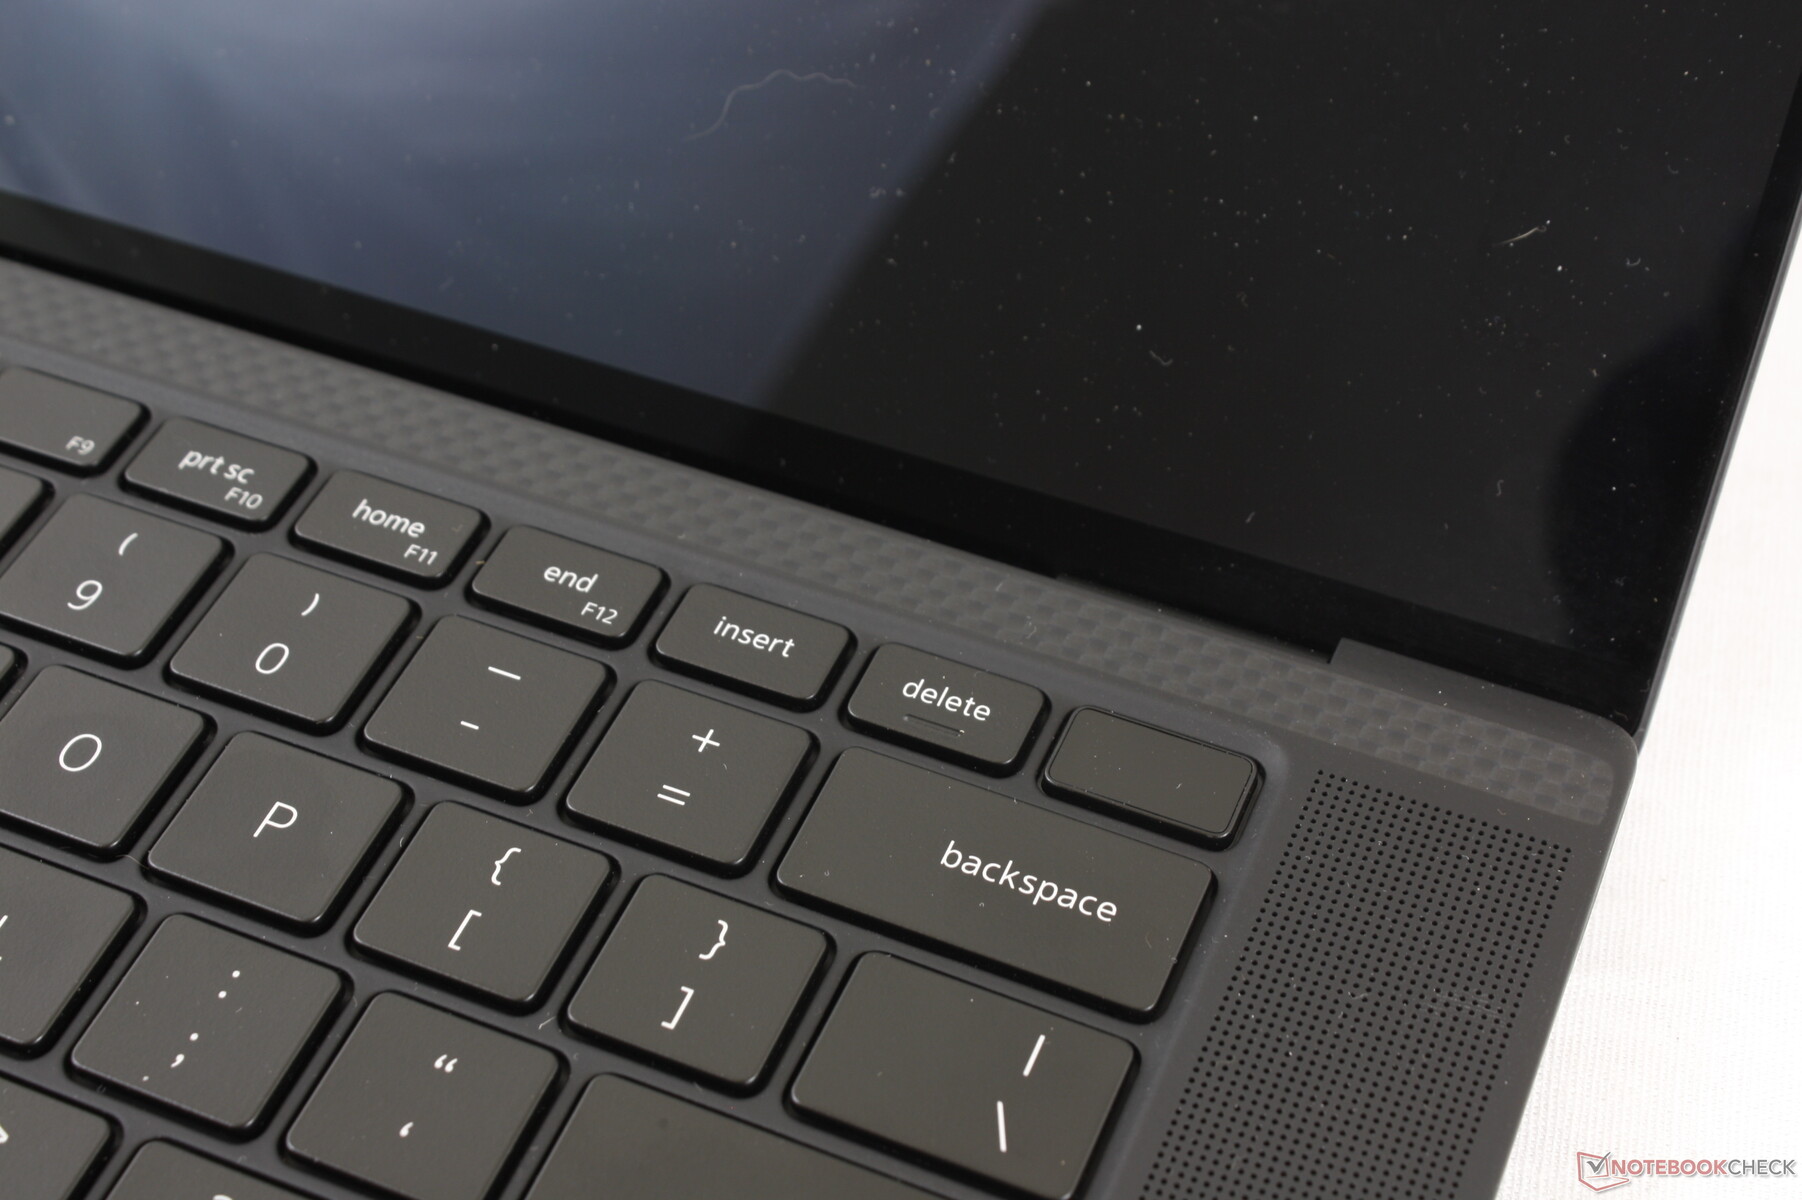
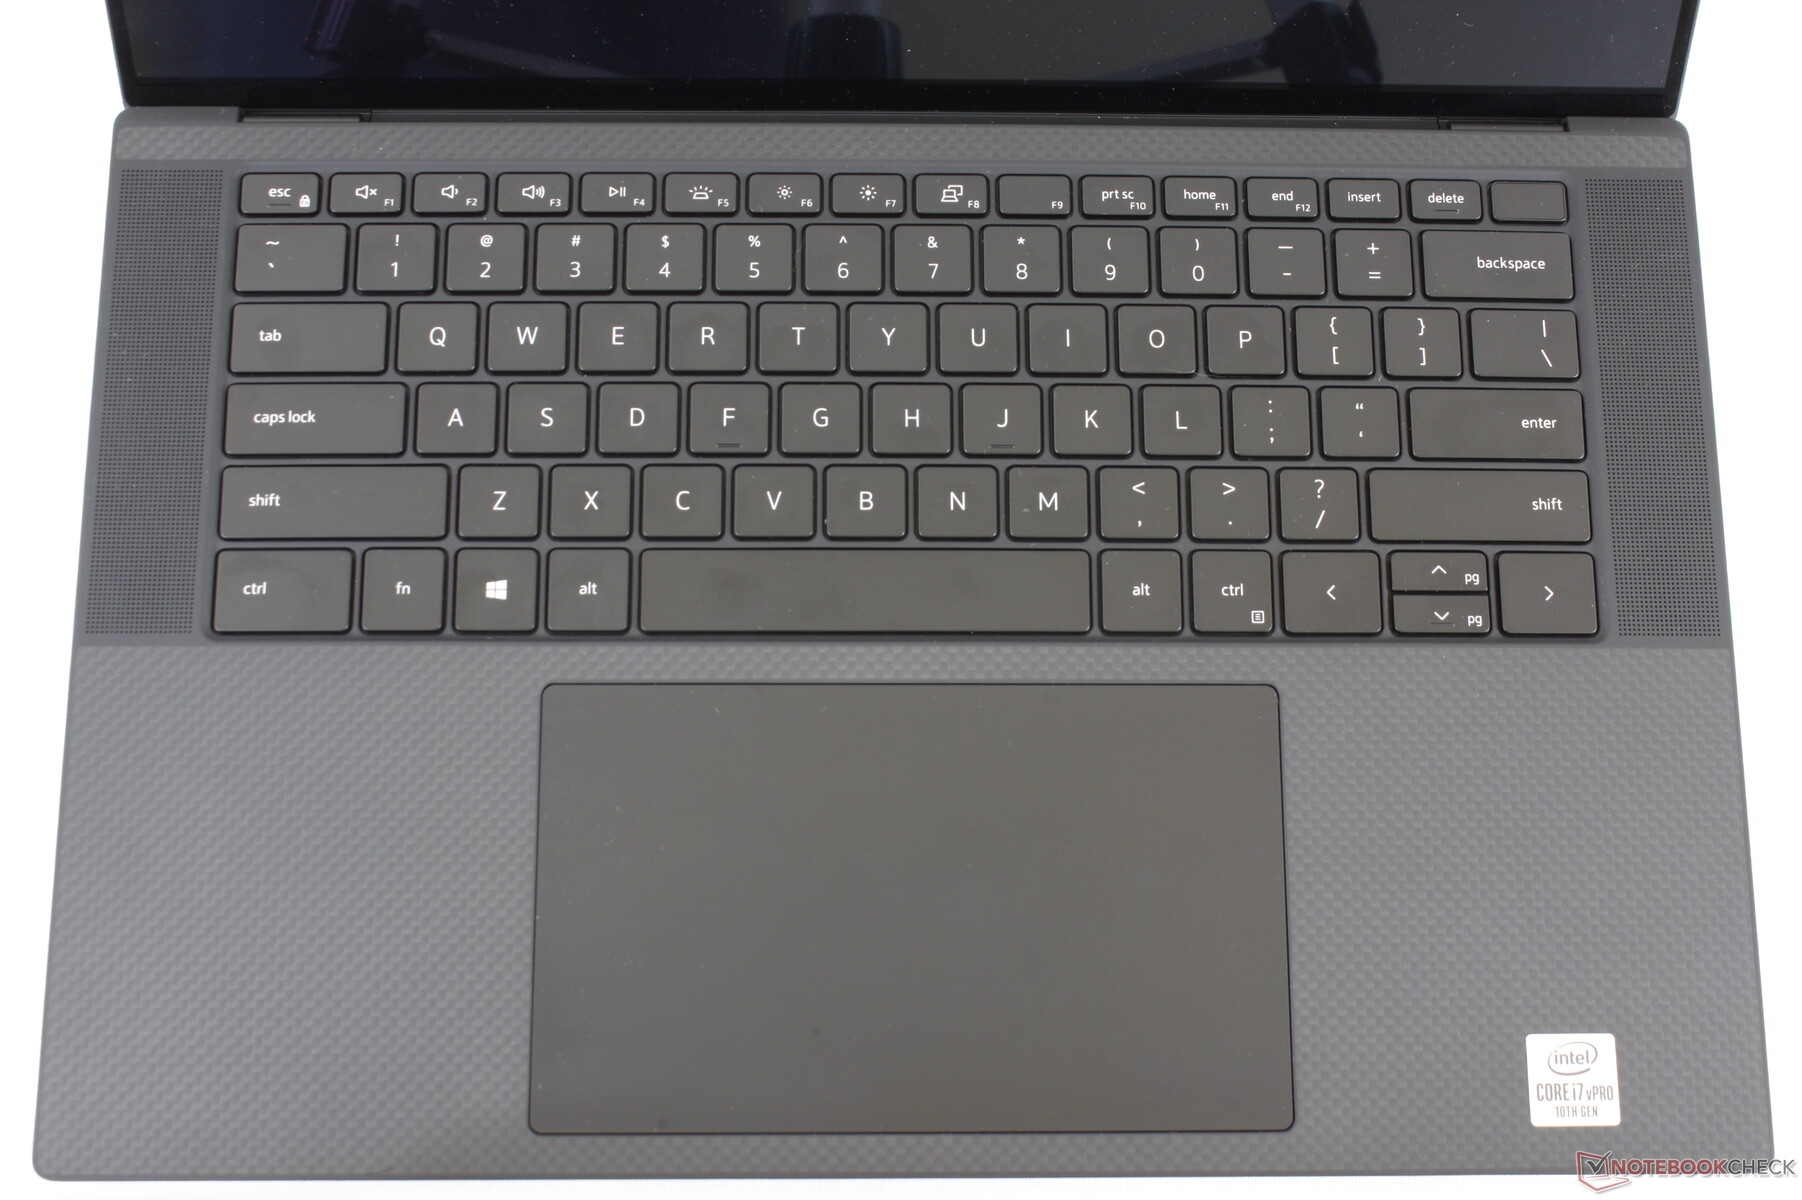
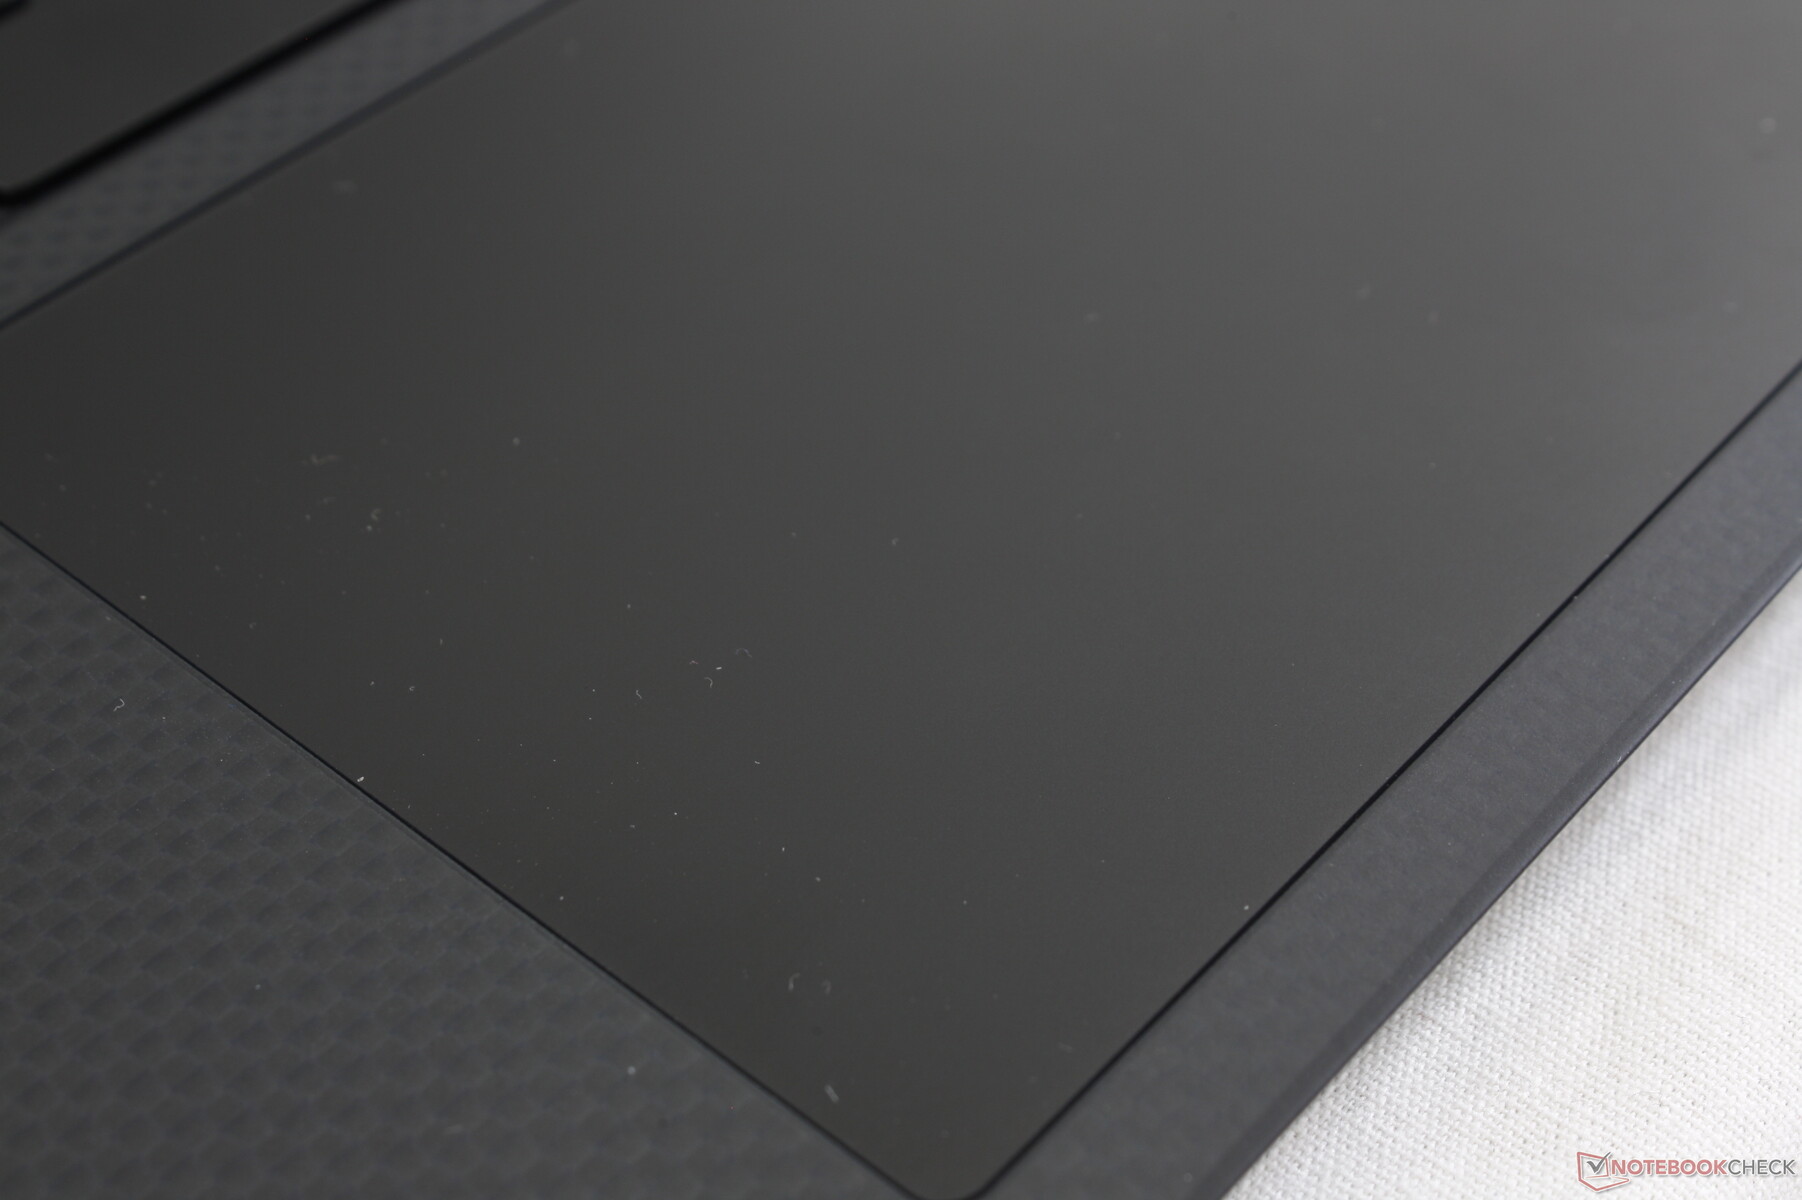
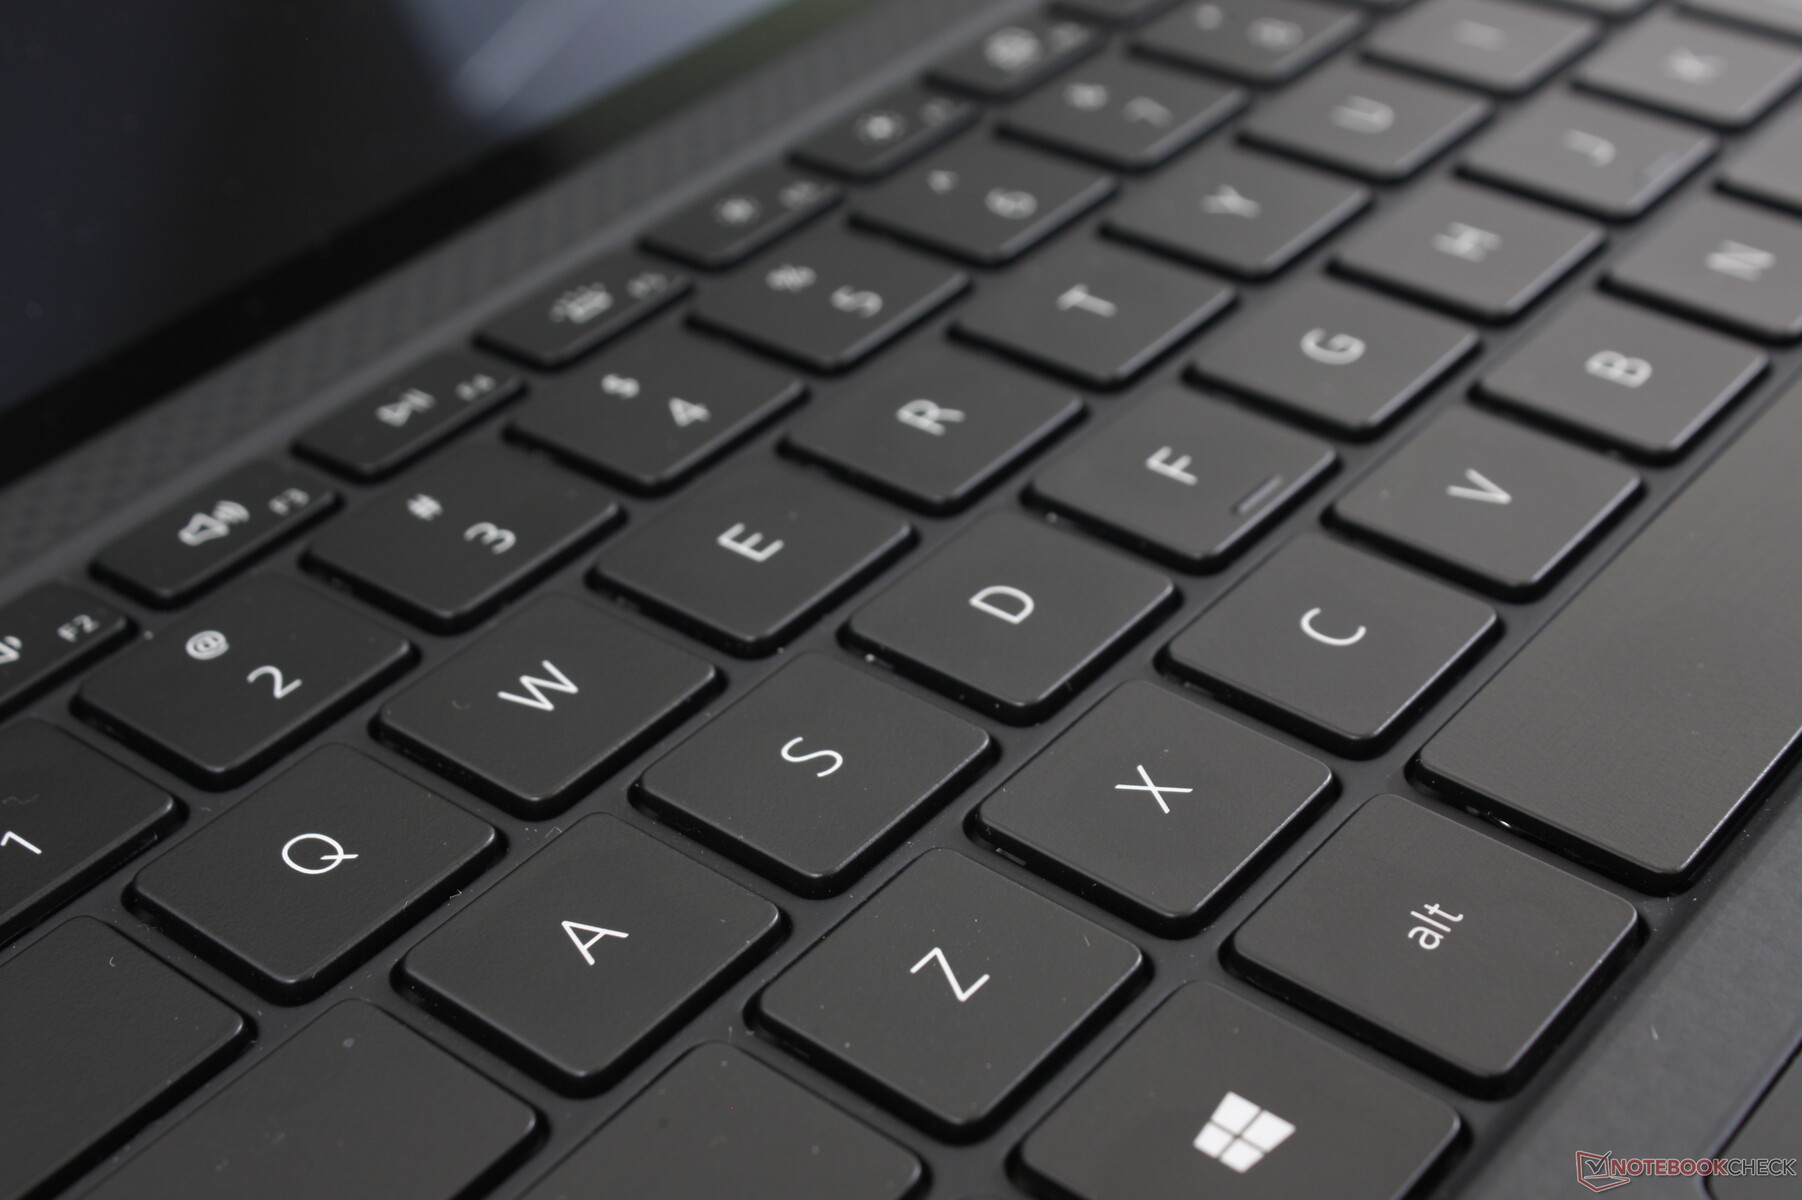
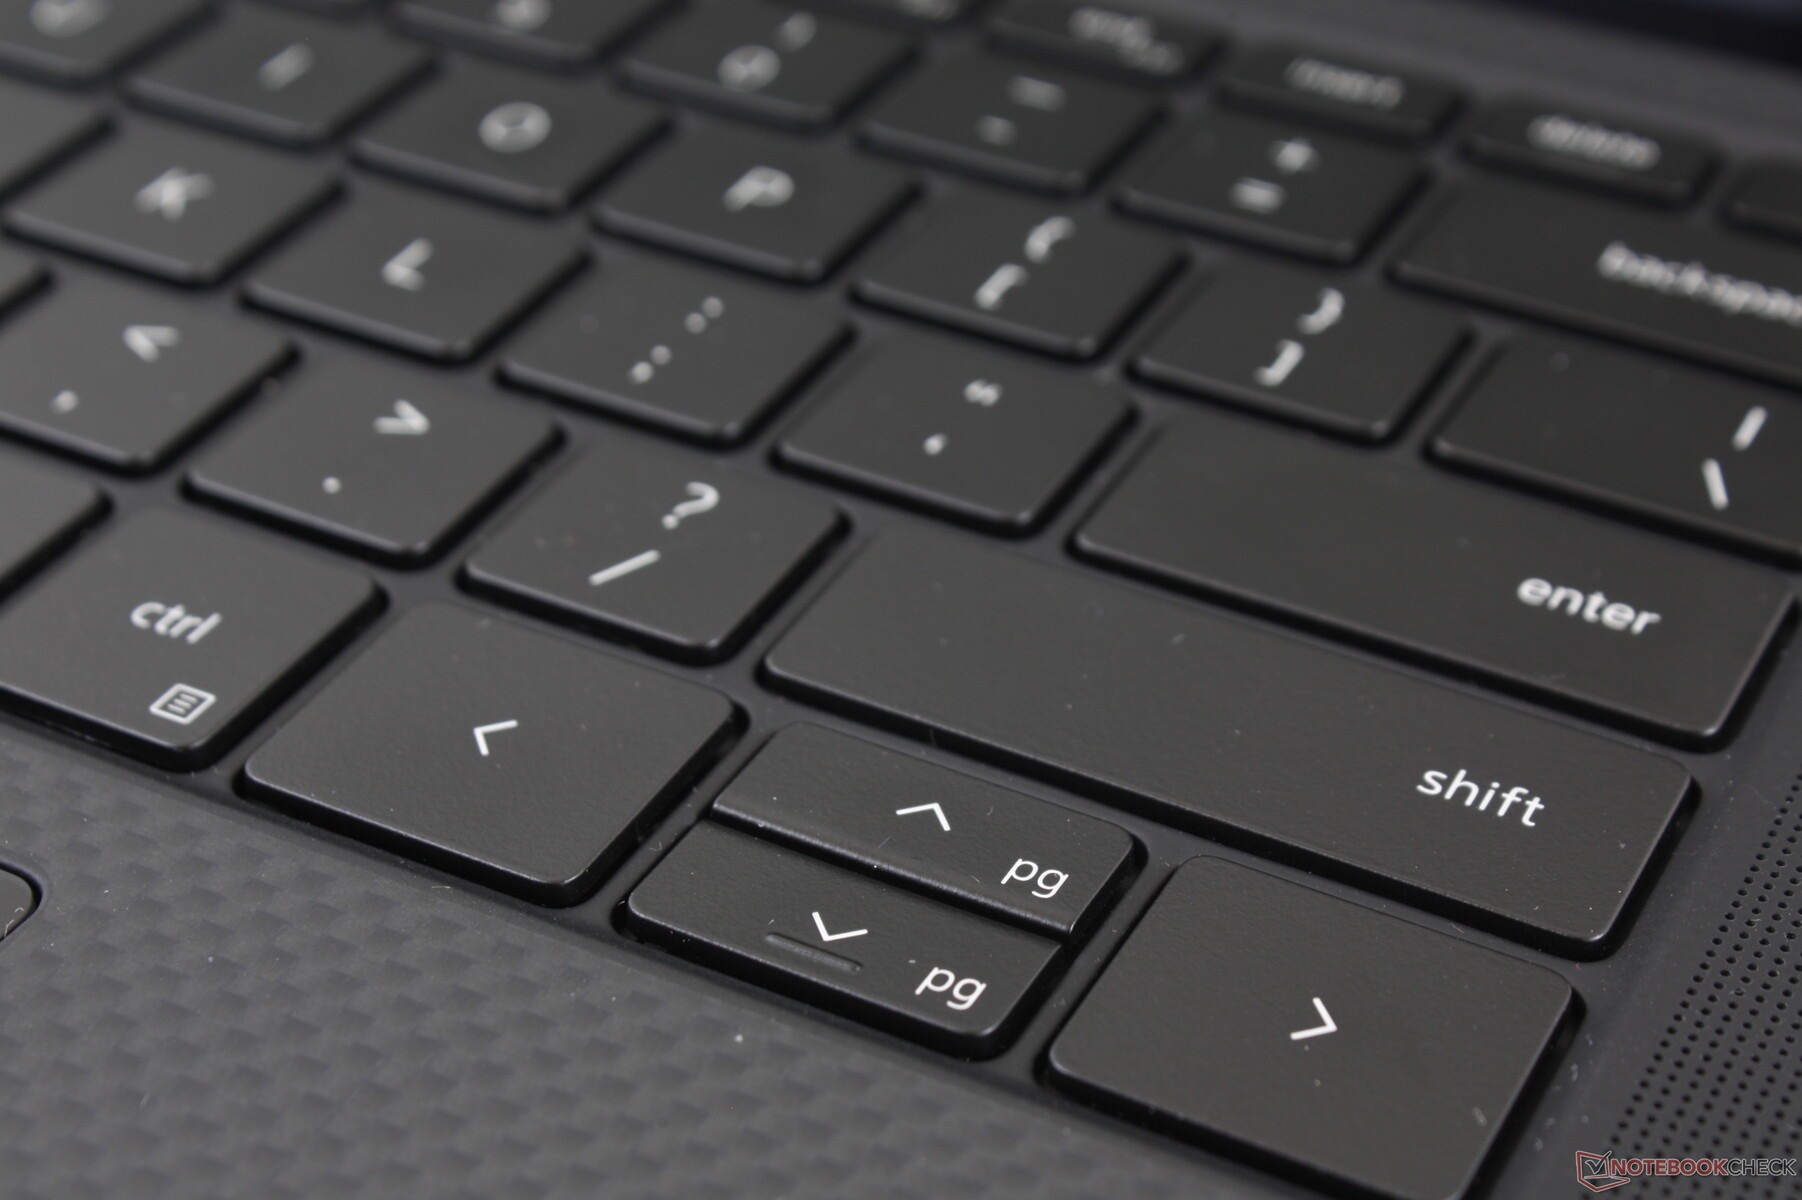
Giriş cihazları
Klavye ve Dokunmatik Yüzey
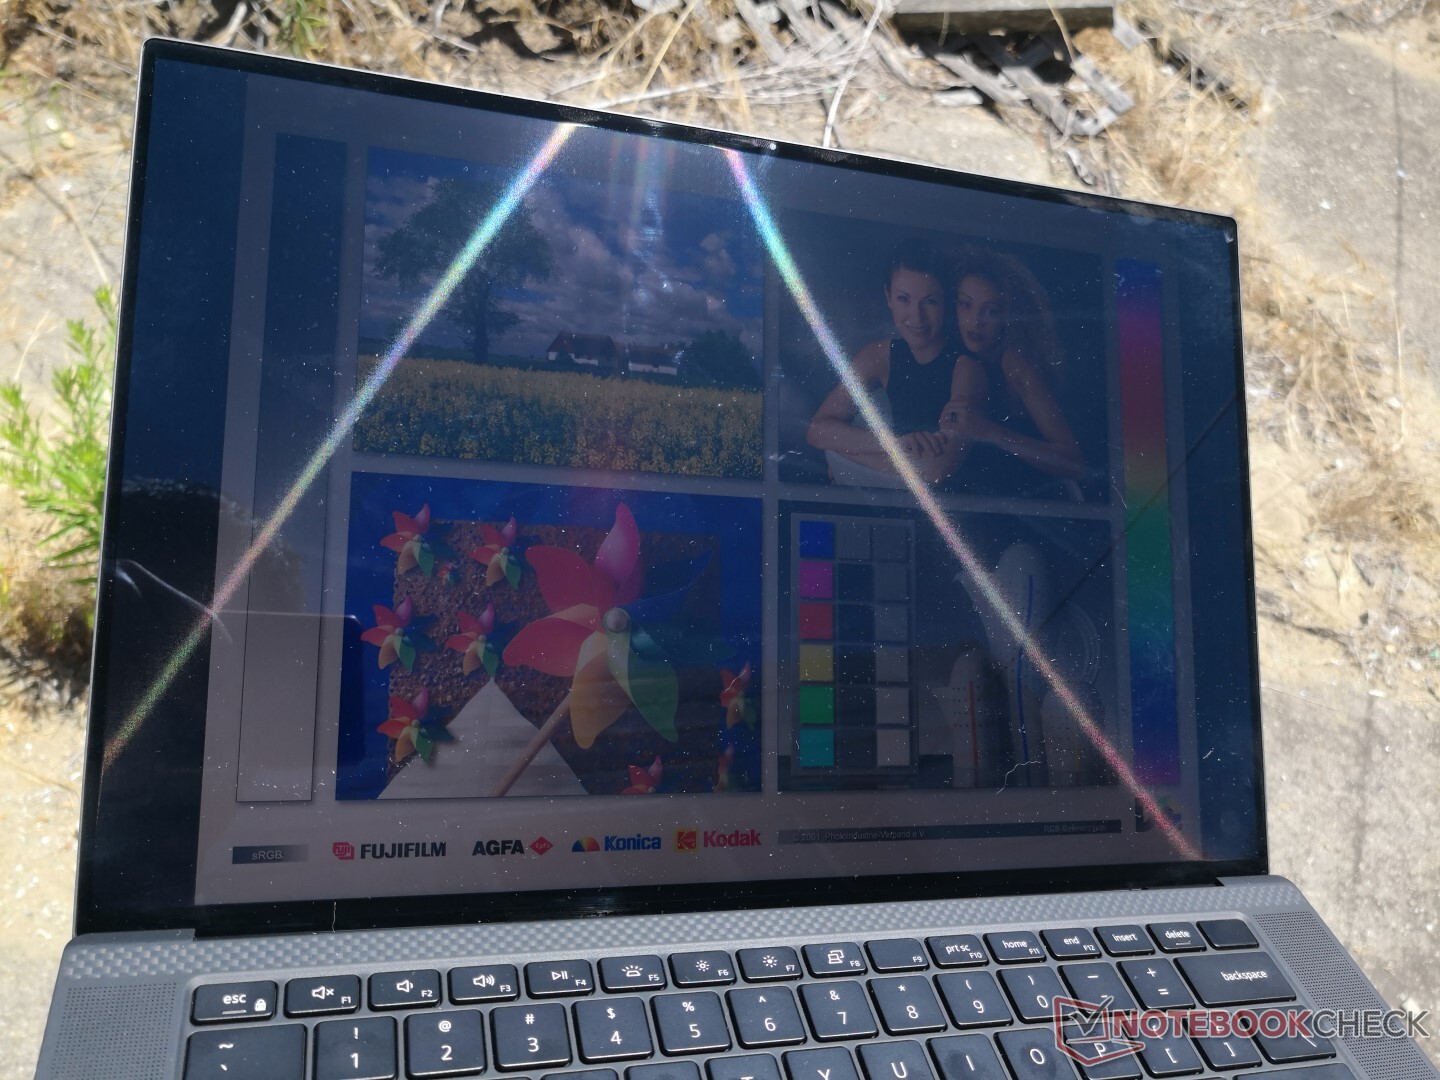
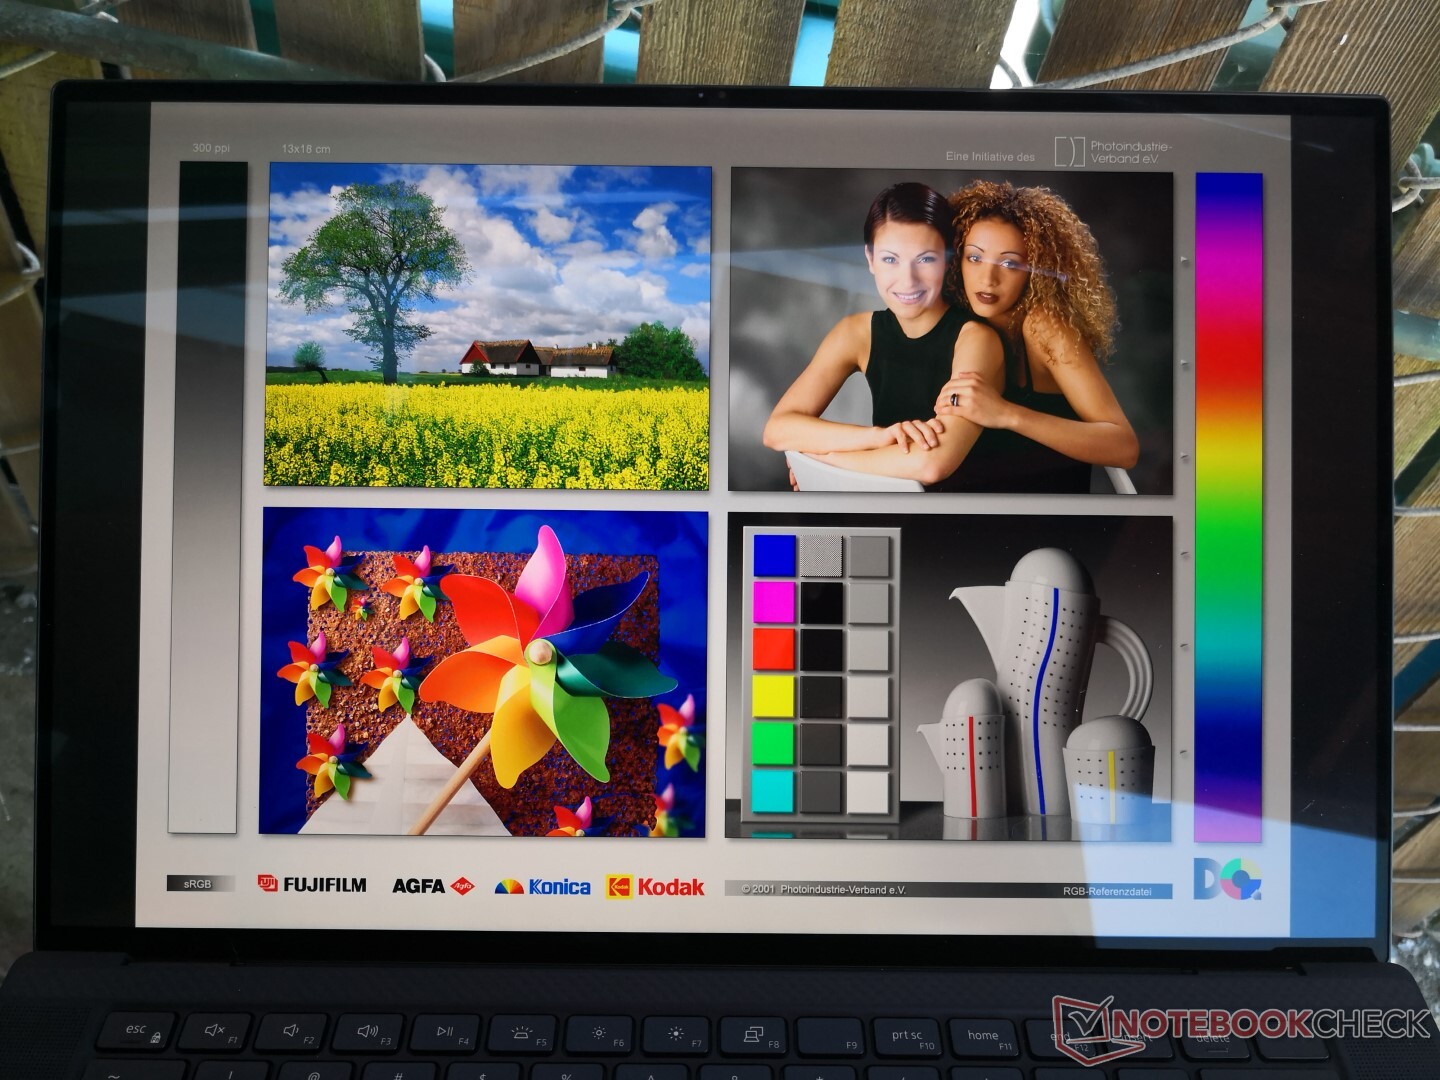
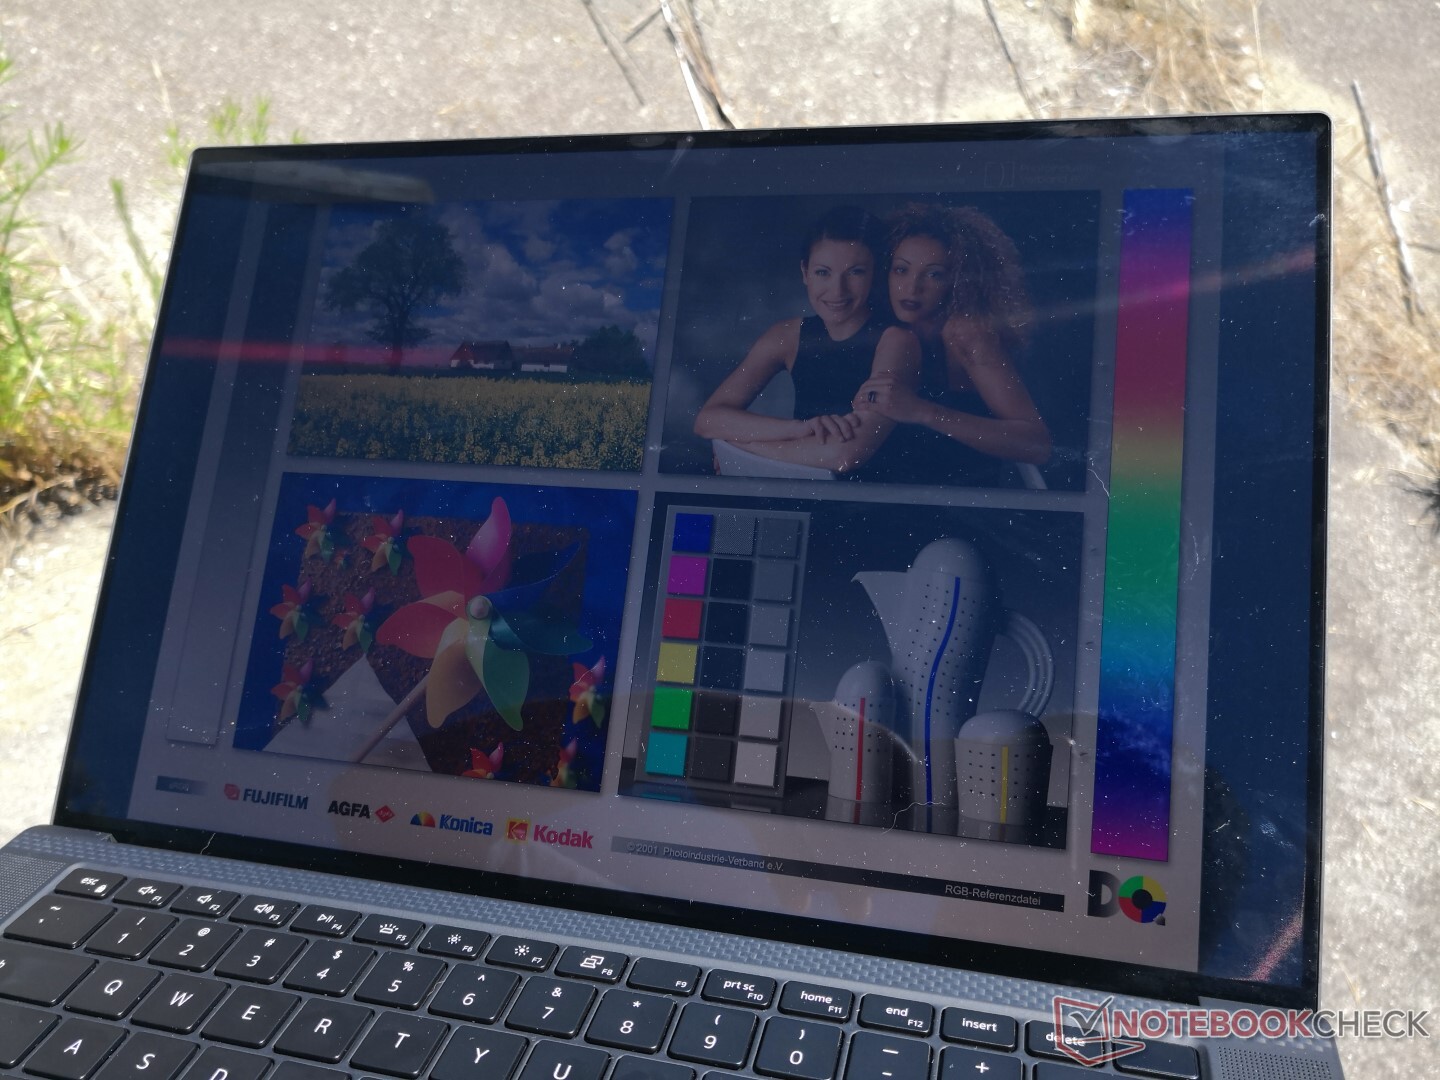
Görüntüle
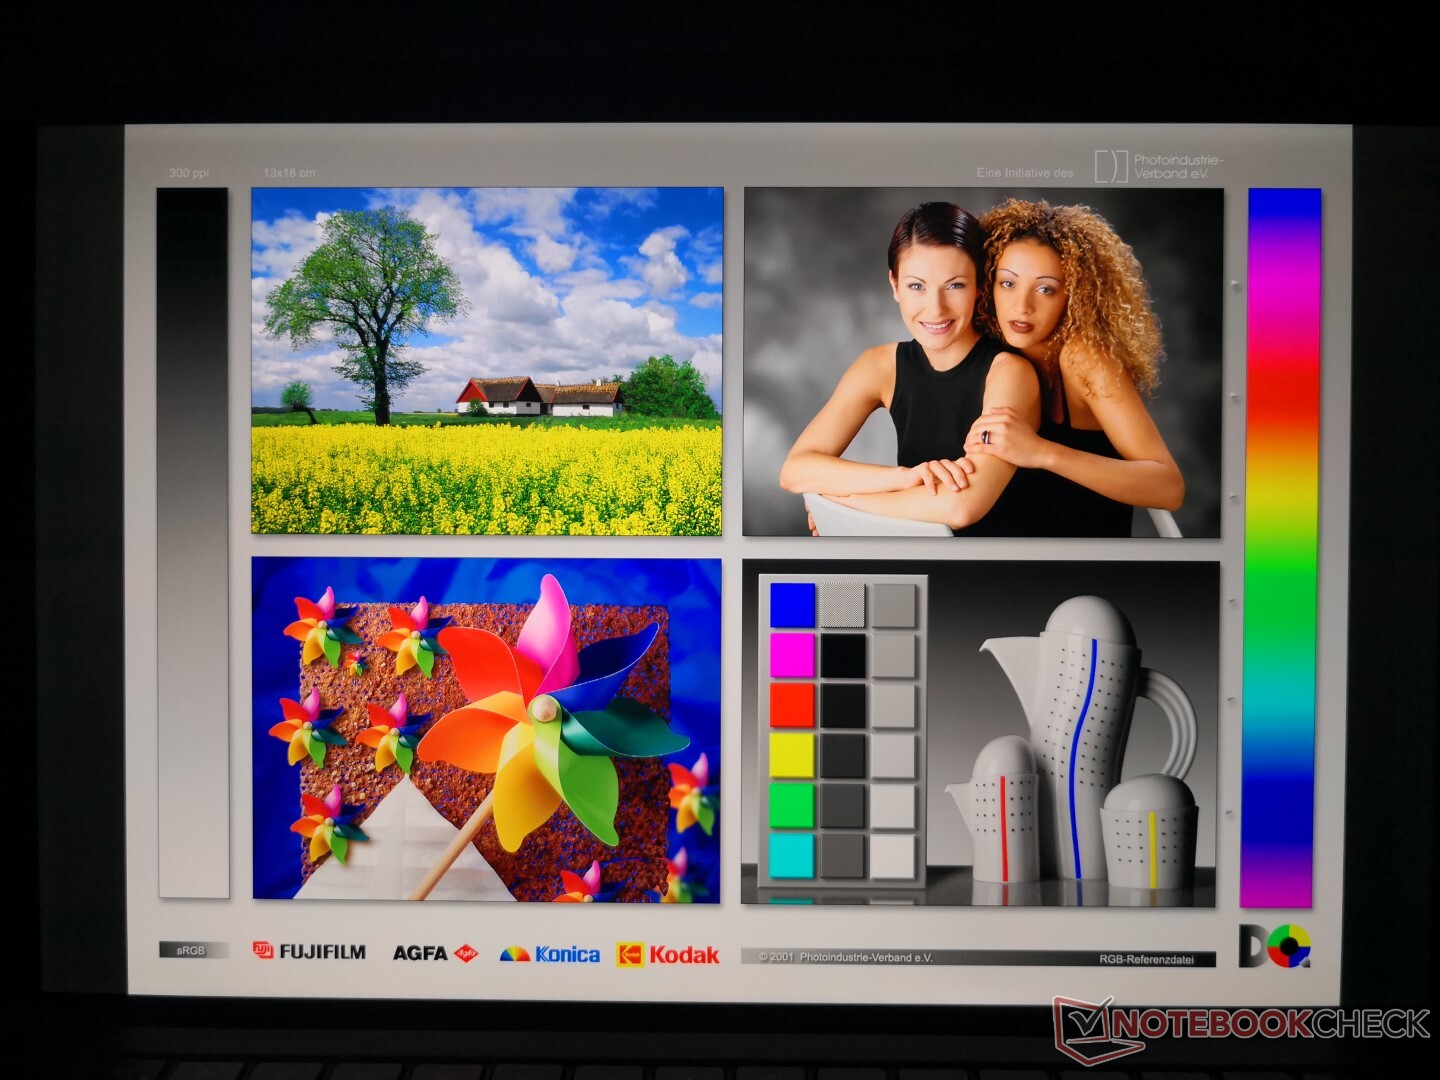
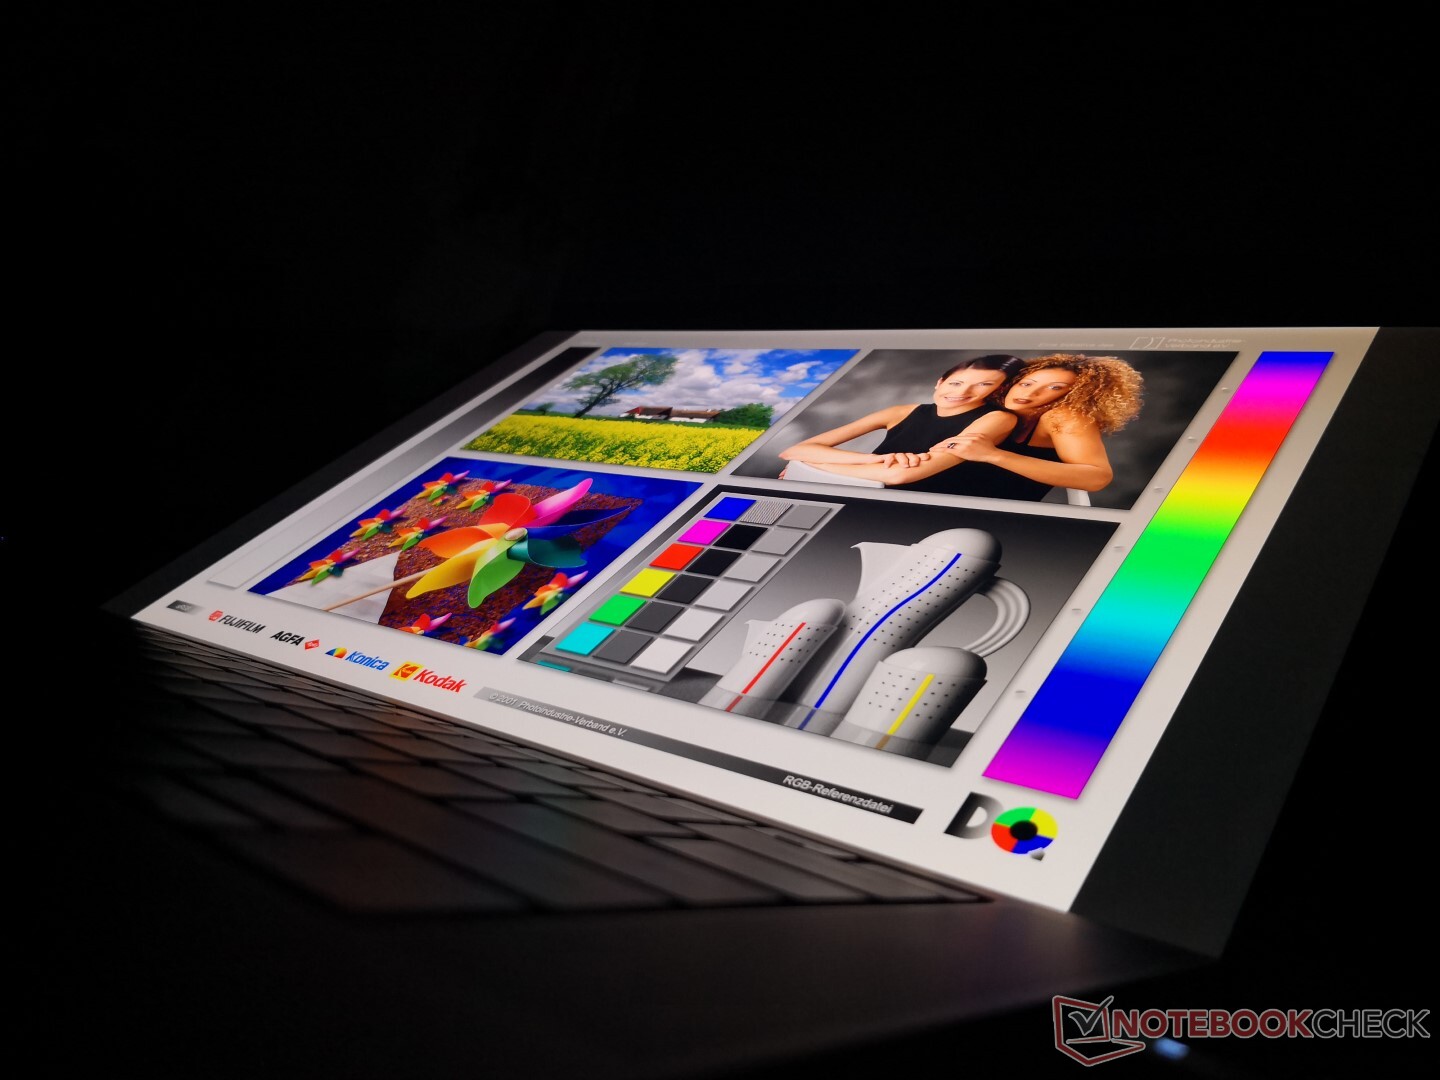
XPS 15 9500'deki aynı 4K UHD Sharp LQ156R1 IPS dokunmatik ekran burada Precision 5550'de bulunabilir. Bu muhtemelen bulabileceğiniz herhangi bir mobil iş istasyonunda bulunan en parlak parlak ekran olacak. Bununla birlikte, benzersiz 16:10 en-boy oranı, Precision 5550'nin şu anda herhangi bir OLED seçeneği taşımasını engeller. Böyle bir özellik sizin için önemliyse, eski Precision 5540'a bağlı kalmanız gerekir.
| |||||||||||||||||||||||||
Aydınlatma: 85 %
Batarya modunda parlaklık: 469.8 cd/m²
Kontrast: 1119:1 (Siyah: 0.42 cd/m²)
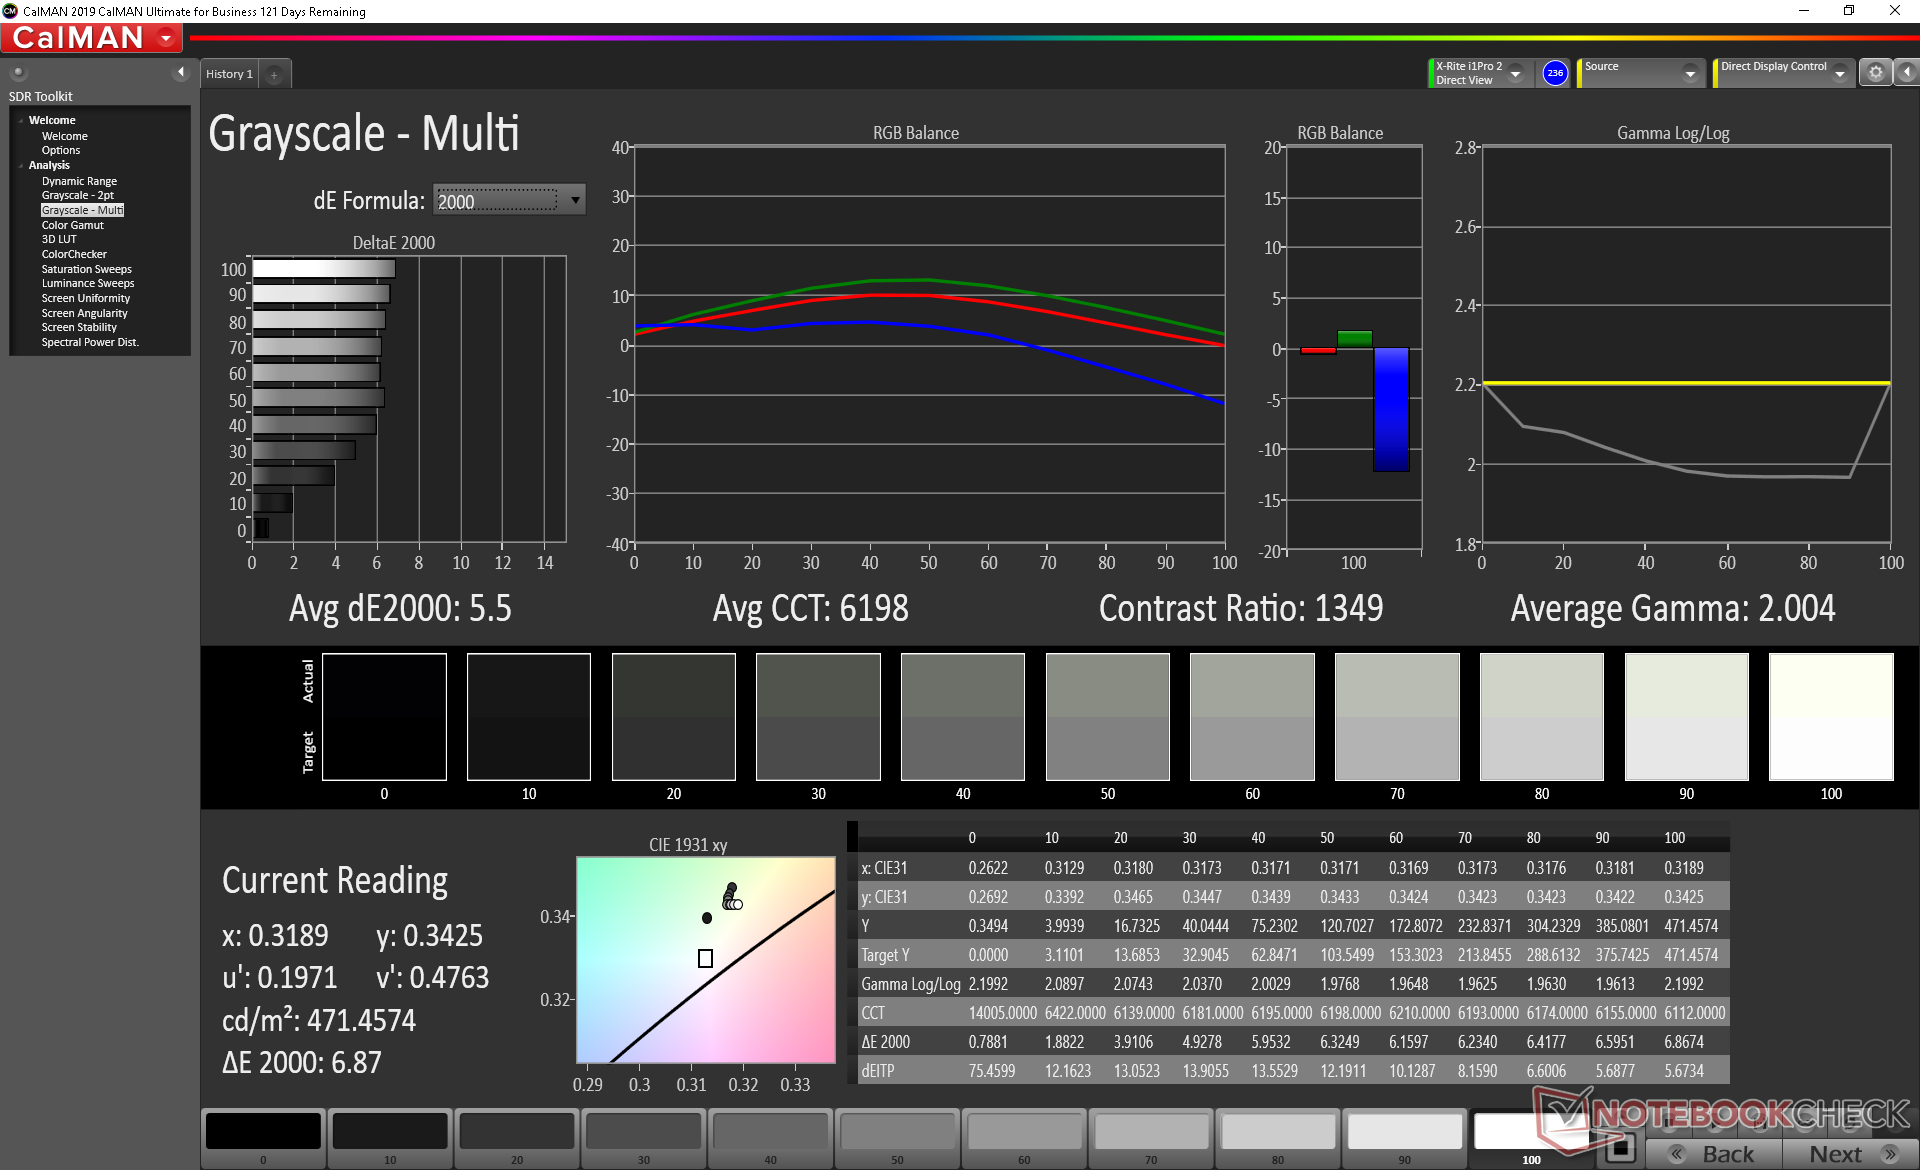
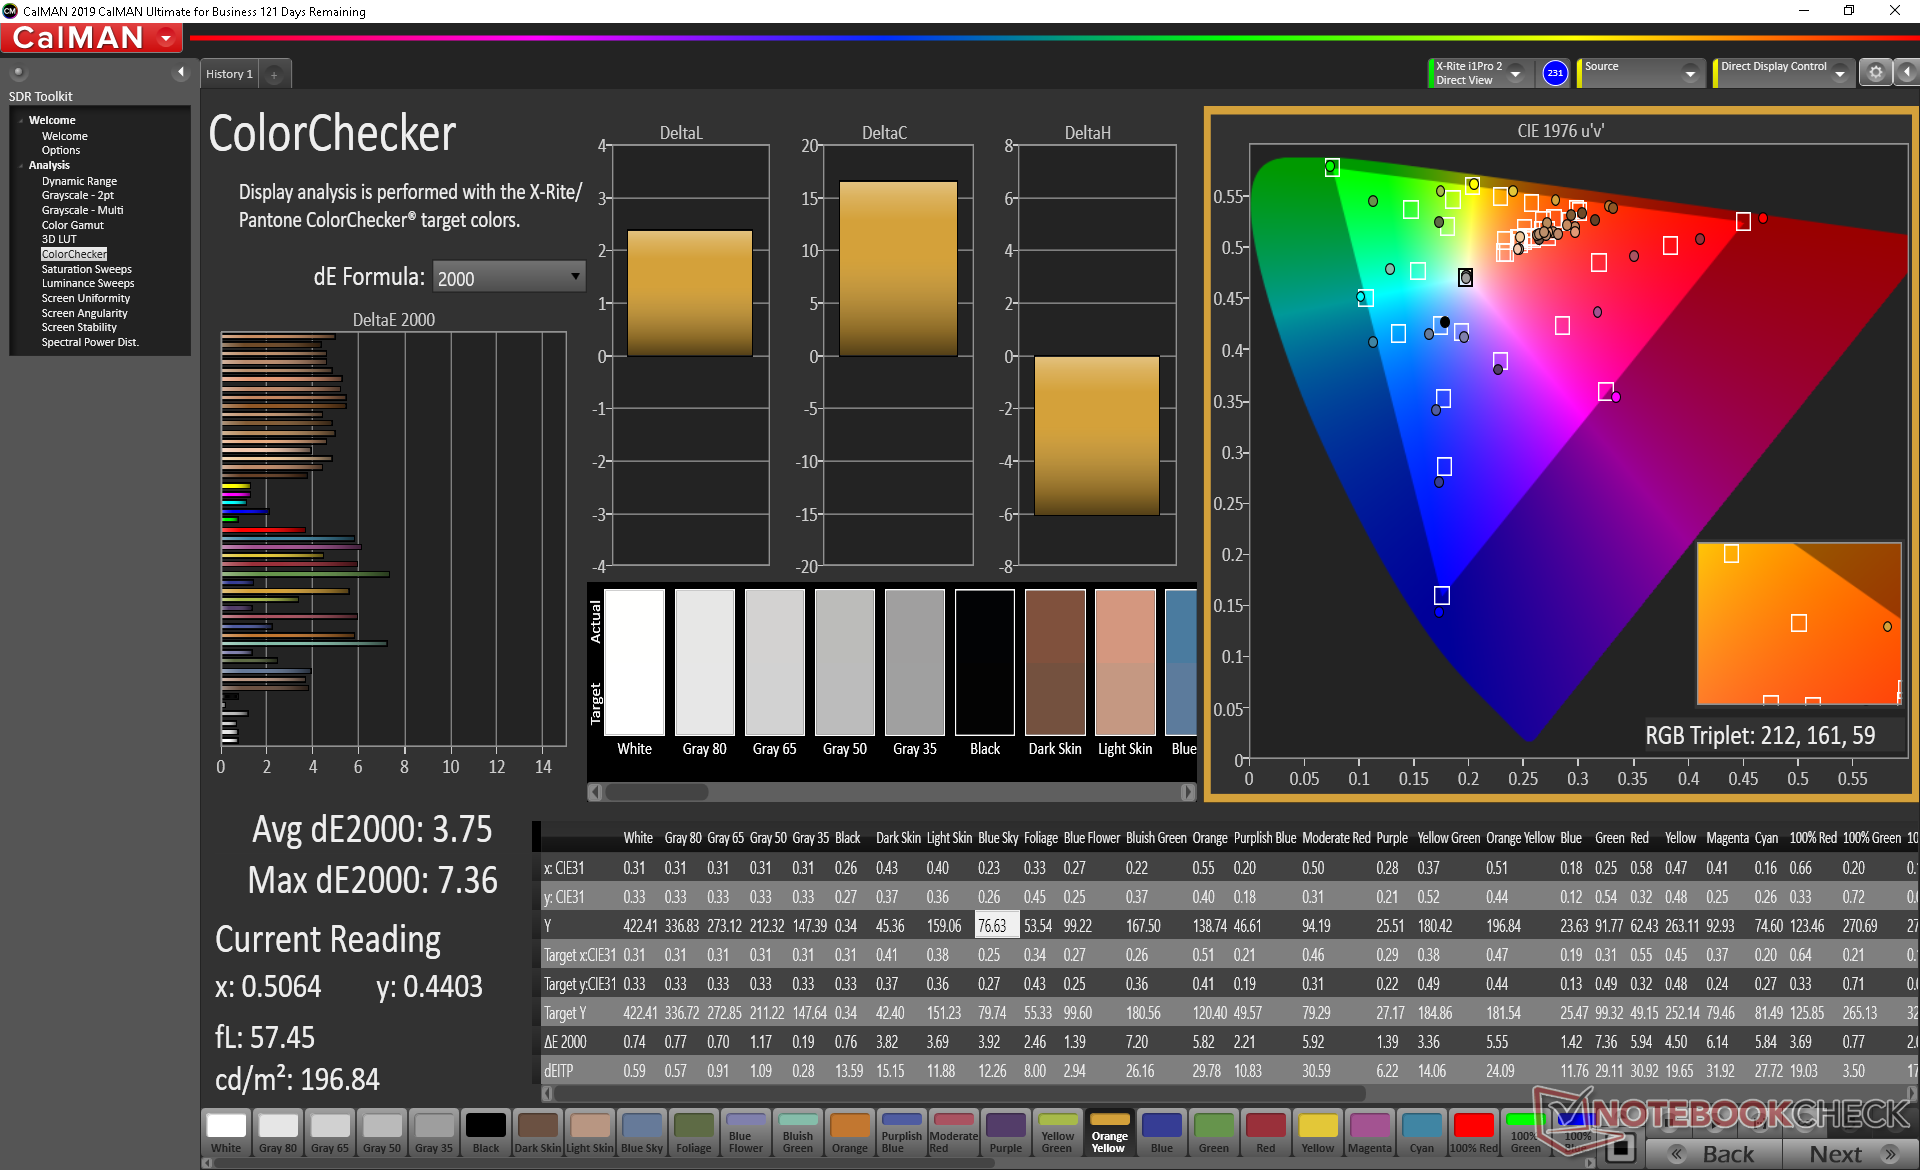
ΔE ColorChecker Calman: 5.16 | ∀{0.5-29.43 Ø4.73}
calibrated: 3.75
ΔE Greyscale Calman: 5.5 | ∀{0.09-98 Ø4.97}
100% sRGB (Argyll 1.6.3 3D)
89.2% AdobeRGB 1998 (Argyll 1.6.3 3D)
99.9% AdobeRGB 1998 (Argyll 3D)
100% sRGB (Argyll 3D)
89.9% Display P3 (Argyll 3D)
Gamma: 2
CCT: 6198 K
| Dell Precision 5550 P91F Sharp LQ156R1, IPS, 15.6", 3840x2400 | Dell Precision 5540 SDCA029, OLED, 15.6", 3840x2160 | Razer Blade 15 Studio Edition 2020 Samsung SDCA029, OLED, 15.6", 3840x2160 | Acer ConceptD 3 Pro CN315-71P-73W1 Chi Mei N156HCE-EN2, IPS, 15.6", 1920x1080 | Lenovo ThinkPad P53-20QN000YGE N156HCE-GN1, IPS, 15.6", 1920x1080 | MSI WP65 AU Optronics B156HAN02.1, IPS, 15.6", 1920x1080 | |
|---|---|---|---|---|---|---|
| Display | 3% | 3% | -1% | -24% | -52% | |
| Display P3 Coverage (%) | 89.9 | 99.9 11% | 99.9 11% | 97.9 9% | 63.2 -30% | 39.46 -56% |
| sRGB Coverage (%) | 100 | 100 0% | 100 0% | 99.9 0% | 92.9 -7% | 58.8 -41% |
| AdobeRGB 1998 Coverage (%) | 99.9 | 97.3 -3% | 97.3 -3% | 87.2 -13% | 64.3 -36% | 40.69 -59% |
| Response Times | 93% | 90% | 32% | 22% | 19% | |
| Response Time Grey 50% / Grey 80% * (ms) | 46 ? | 2.8 ? 94% | 4 ? 91% | 33 ? 28% | 38.4 ? 17% | 37.6 ? 18% |
| Response Time Black / White * (ms) | 34 ? | 3.2 ? 91% | 4 ? 88% | 22 ? 35% | 25.2 ? 26% | 27.6 ? 19% |
| PWM Frequency (Hz) | 240.9 ? | 26040 ? | ||||
| Screen | 14% | 171% | 14% | 20% | -25% | |
| Brightness middle (cd/m²) | 469.8 | 427 -9% | 380 -19% | 343 -27% | 510 9% | 267.4 -43% |
| Brightness (cd/m²) | 464 | 411 -11% | 388 -16% | 309 -33% | 468 1% | 259 -44% |
| Brightness Distribution (%) | 85 | 89 5% | 93 9% | 85 0% | 89 5% | 86 1% |
| Black Level * (cd/m²) | 0.42 | 0.018 96% | 0.22 48% | 0.36 14% | 0.37 12% | |
| Contrast (:1) | 1119 | 21111 1787% | 1559 39% | 1417 27% | 723 -35% | |
| Colorchecker dE 2000 * | 5.16 | 3.2 38% | 5.47 -6% | 3.73 28% | 2.3 55% | 4.21 18% |
| Colorchecker dE 2000 max. * | 9.33 | 8.4 10% | 8.19 12% | 6.51 30% | 5.5 41% | 21.1 -126% |
| Colorchecker dE 2000 calibrated * | 3.75 | 2.8 25% | 3.04 19% | 1.43 62% | 1.2 68% | 4.27 -14% |
| Greyscale dE 2000 * | 5.5 | 1.8 67% | 5.3 4% | 4.24 23% | 3.2 42% | 2.3 58% |
| Gamma | 2 110% | 2.15 102% | 2.15 102% | 2.2 100% | 2.34 94% | 2.2 100% |
| CCT | 6198 105% | 6176 105% | 6128 106% | 6329 103% | 7036 92% | 6578 99% |
| Color Space (Percent of AdobeRGB 1998) (%) | 89.2 | 86.8 -3% | 86 -4% | 78 -13% | 59.4 -33% | 37.2 -58% |
| Color Space (Percent of sRGB) (%) | 100 | 100 0% | 100 0% | 100 0% | 93.1 -7% | 58.5 -41% |
| Toplam Ortalama (Program / Ayarlar) | 37% /
23% | 88% /
129% | 15% /
14% | 6% /
12% | -19% /
-24% |
* ... daha küçük daha iyidir
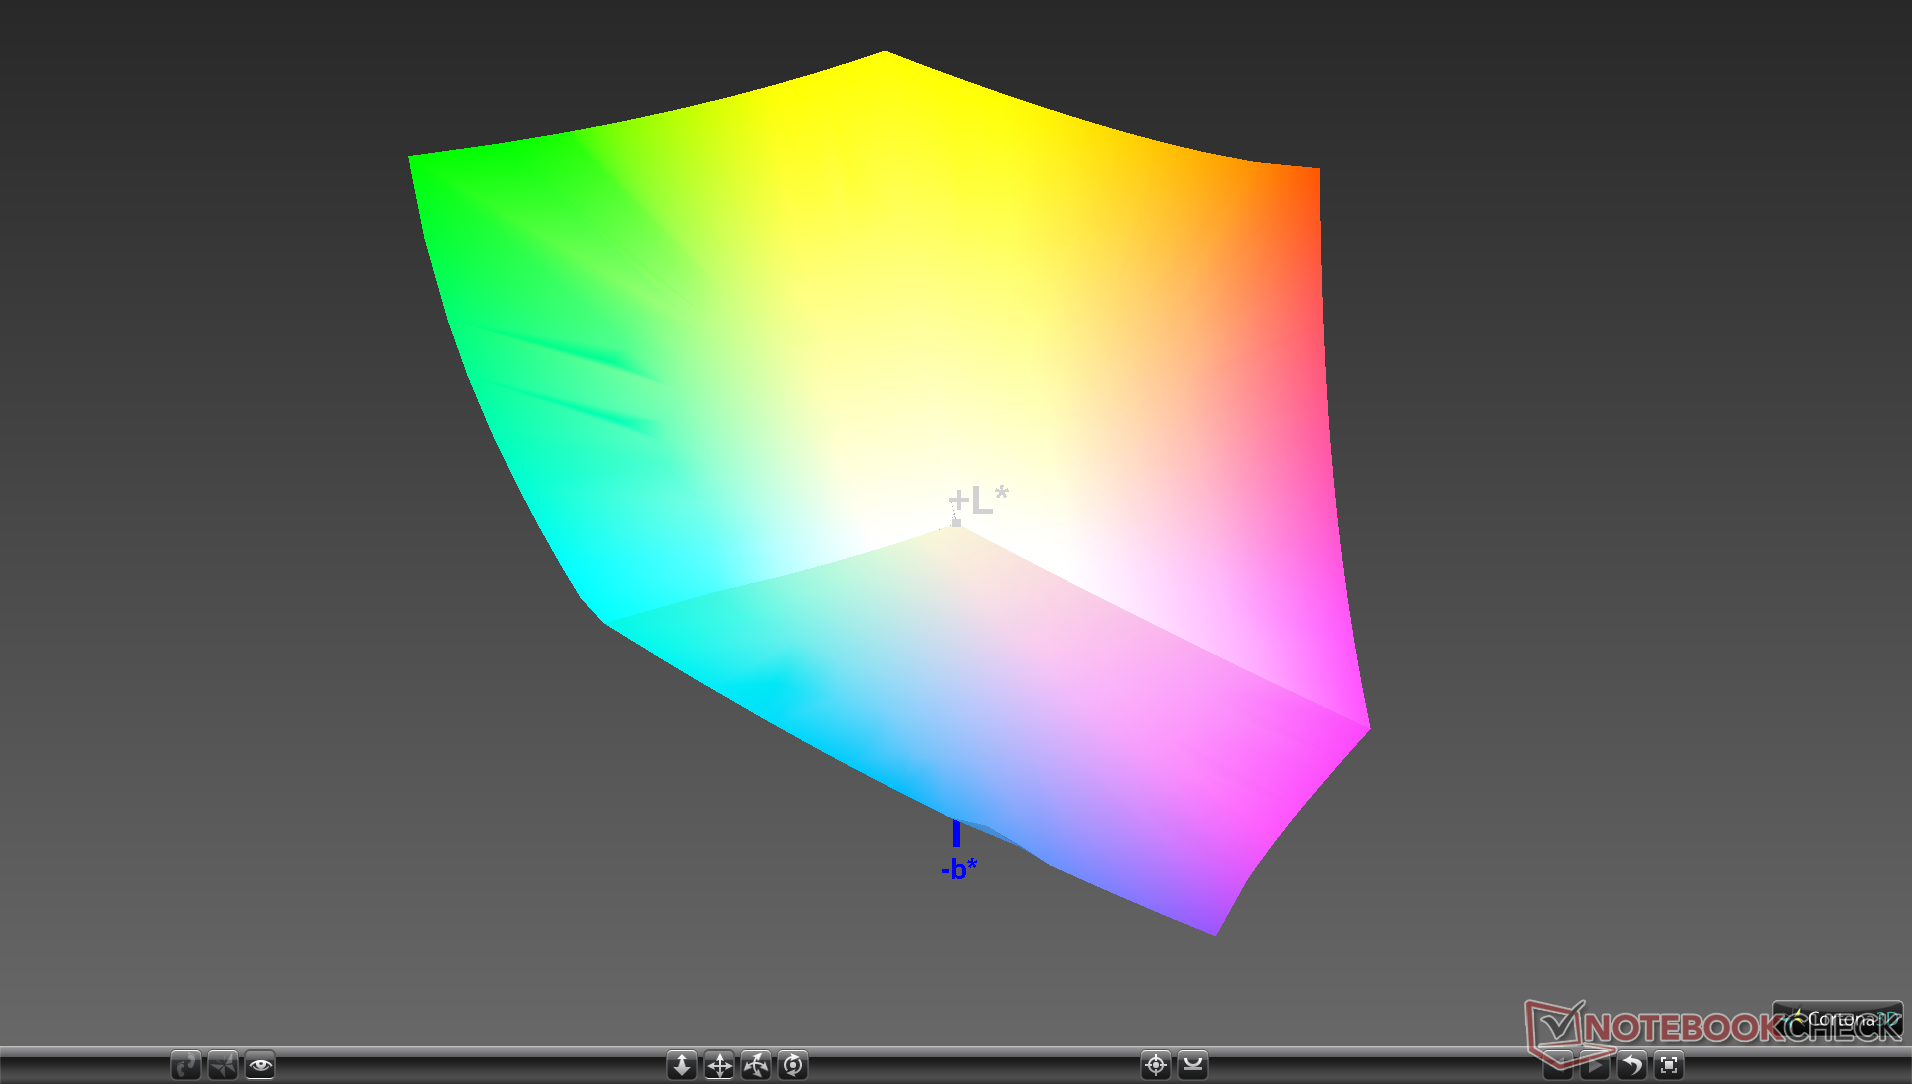
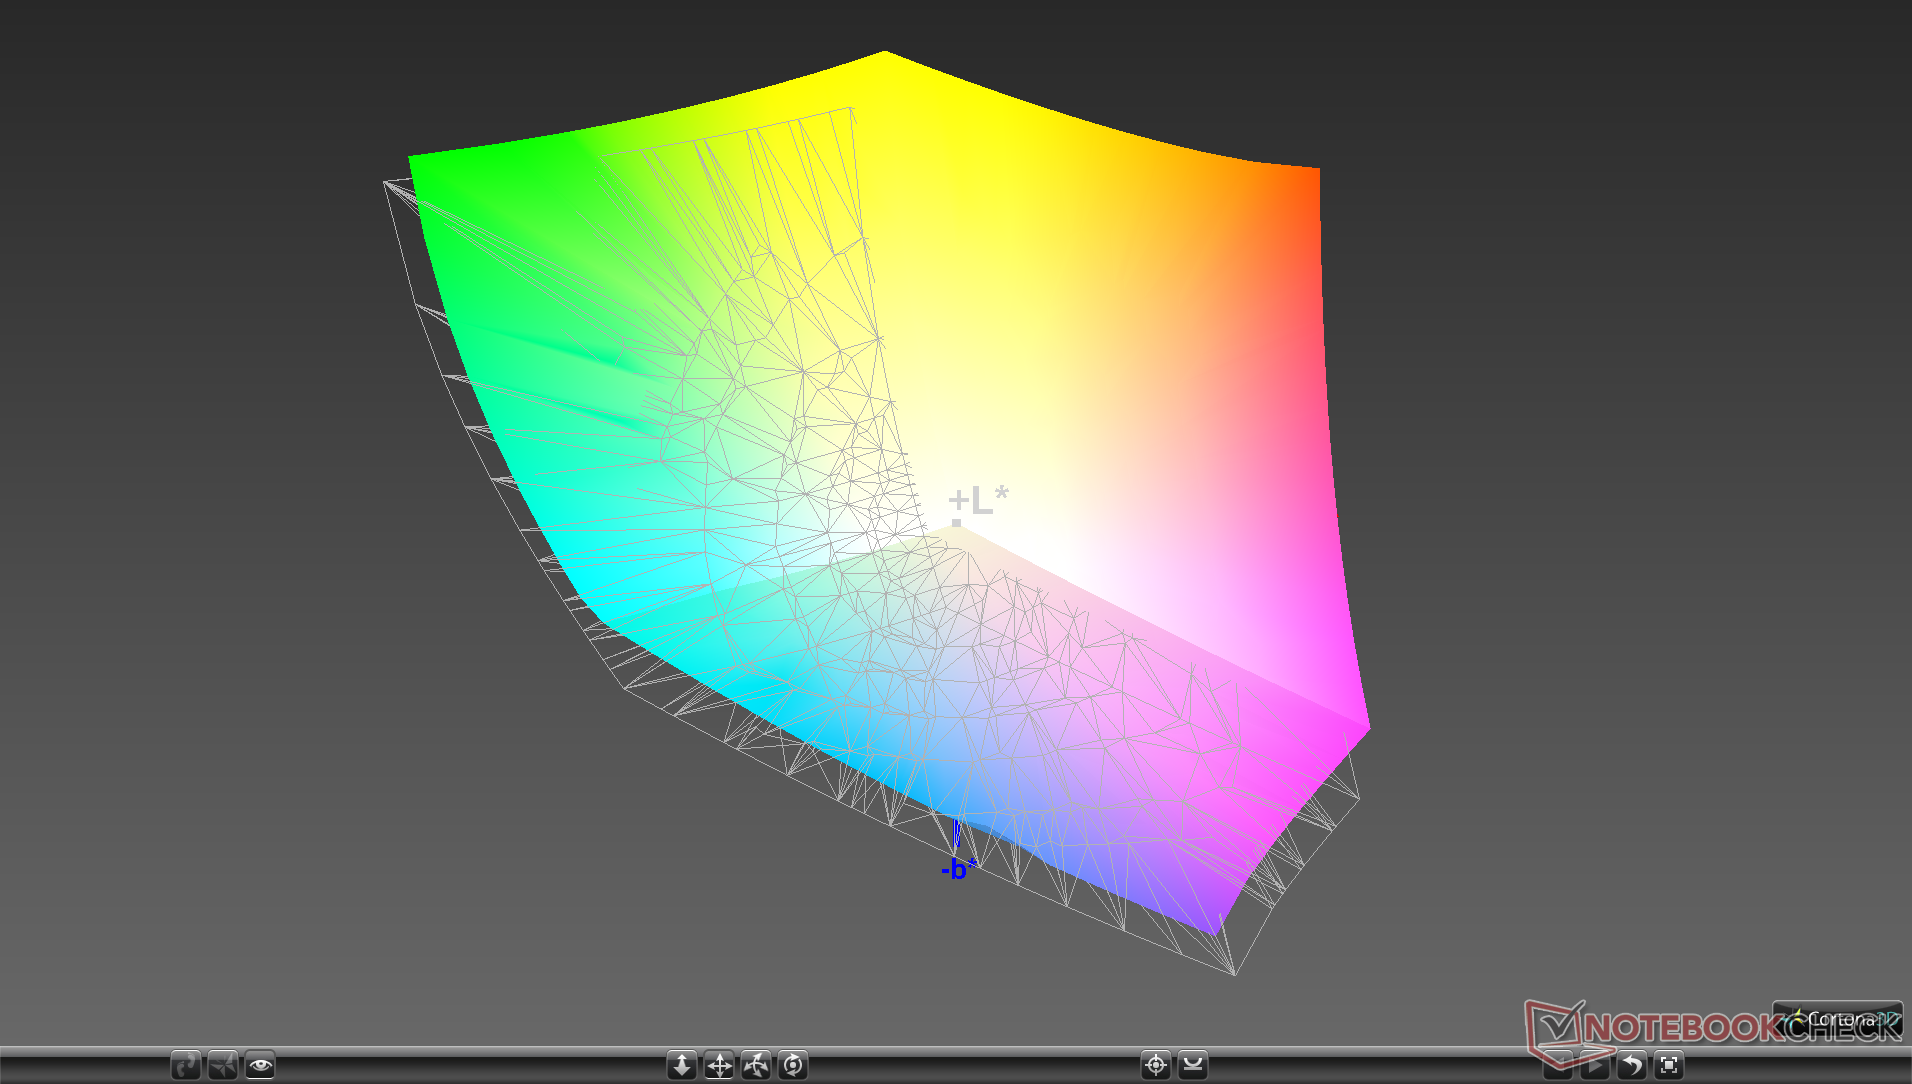
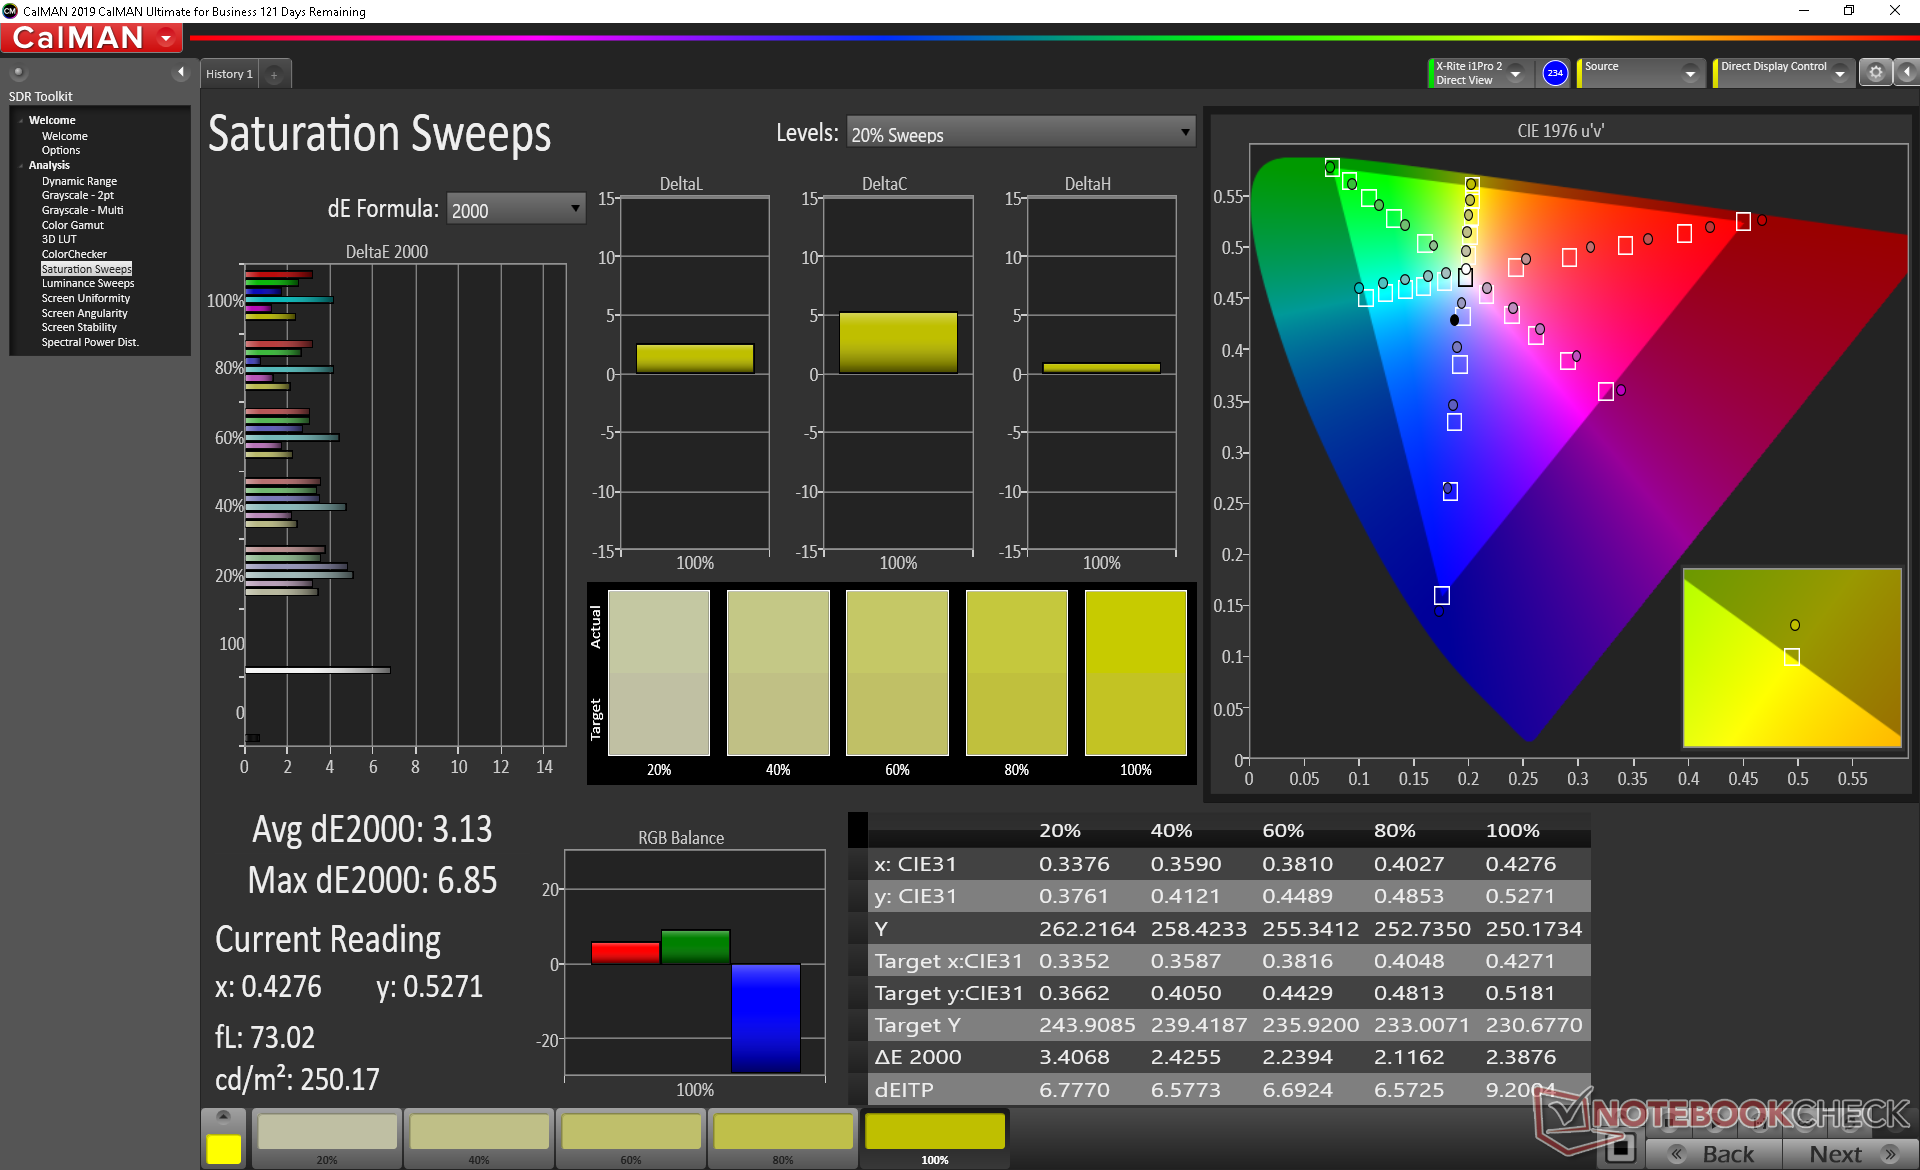
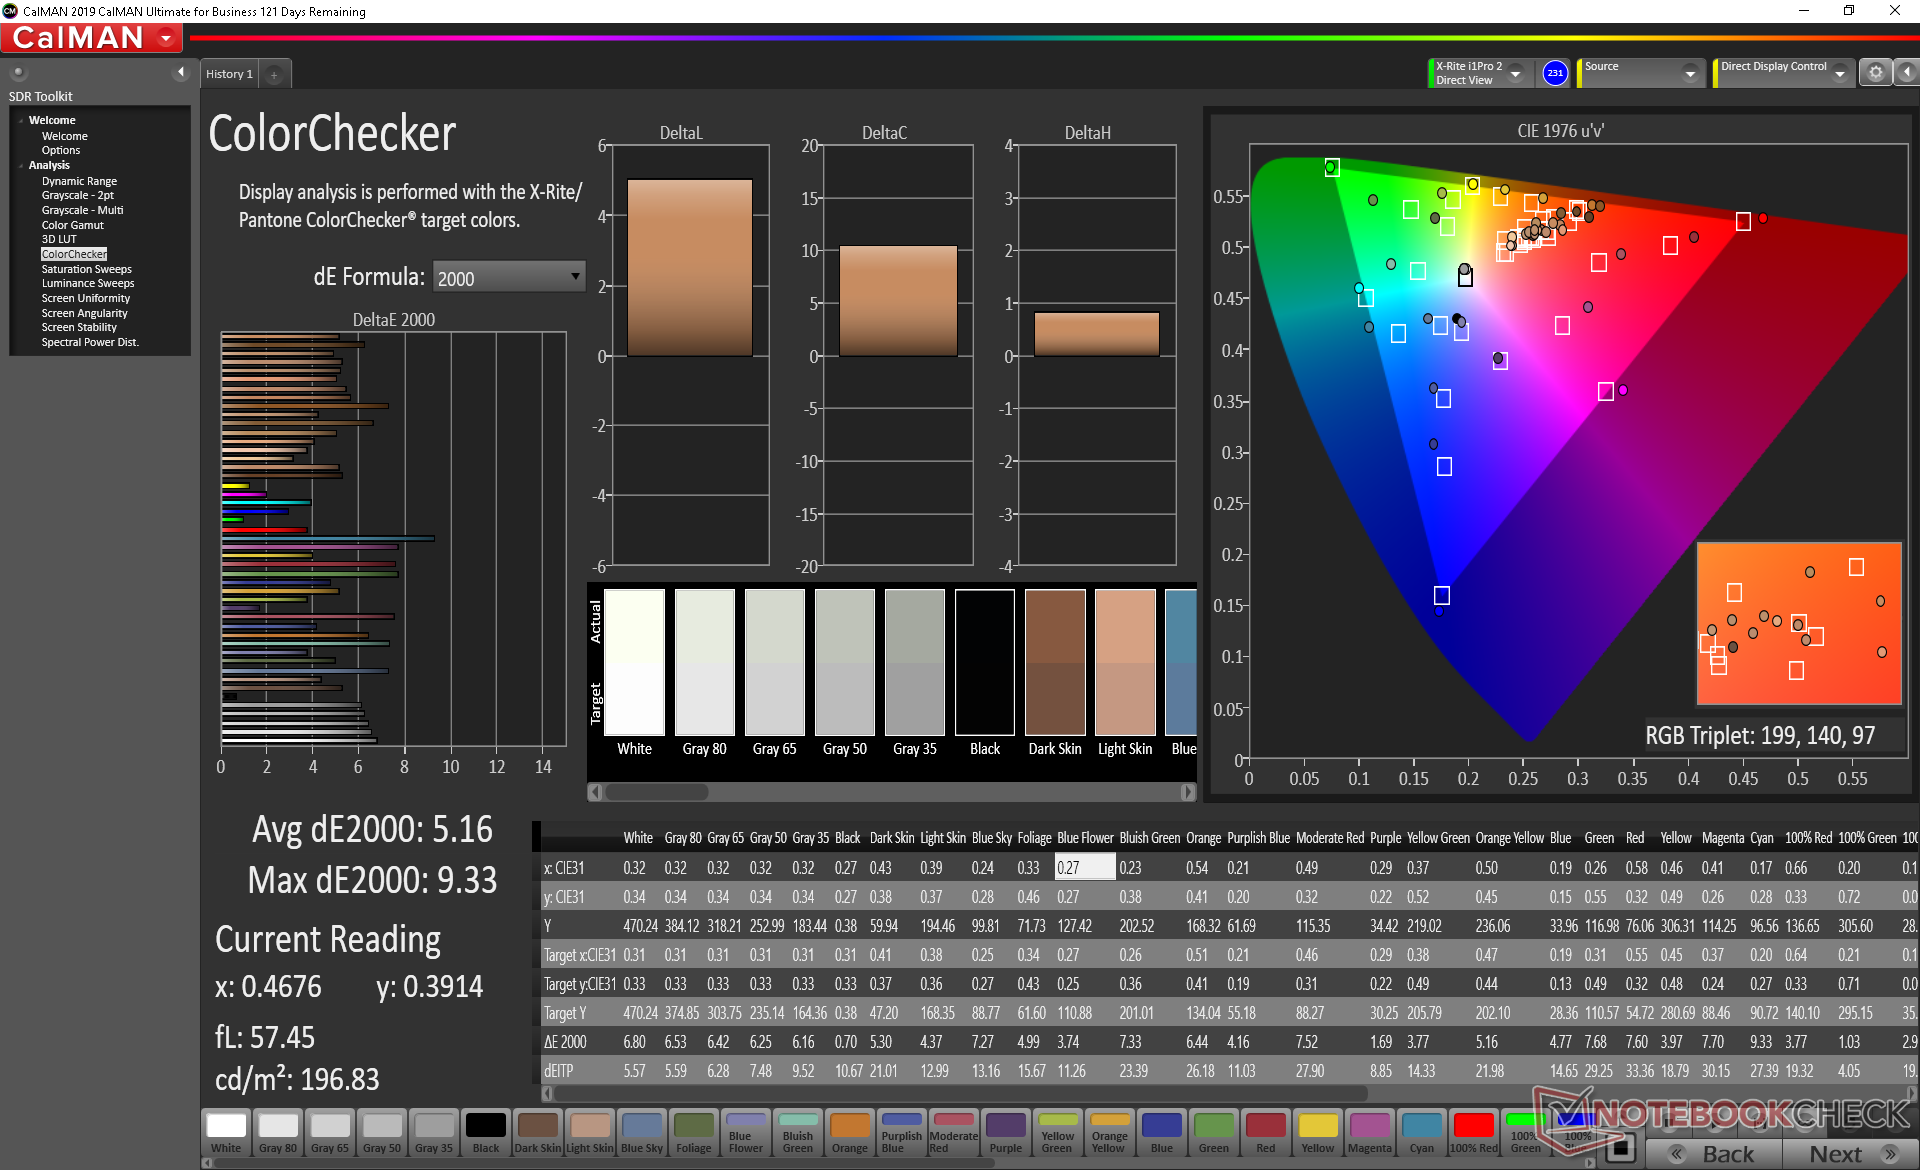
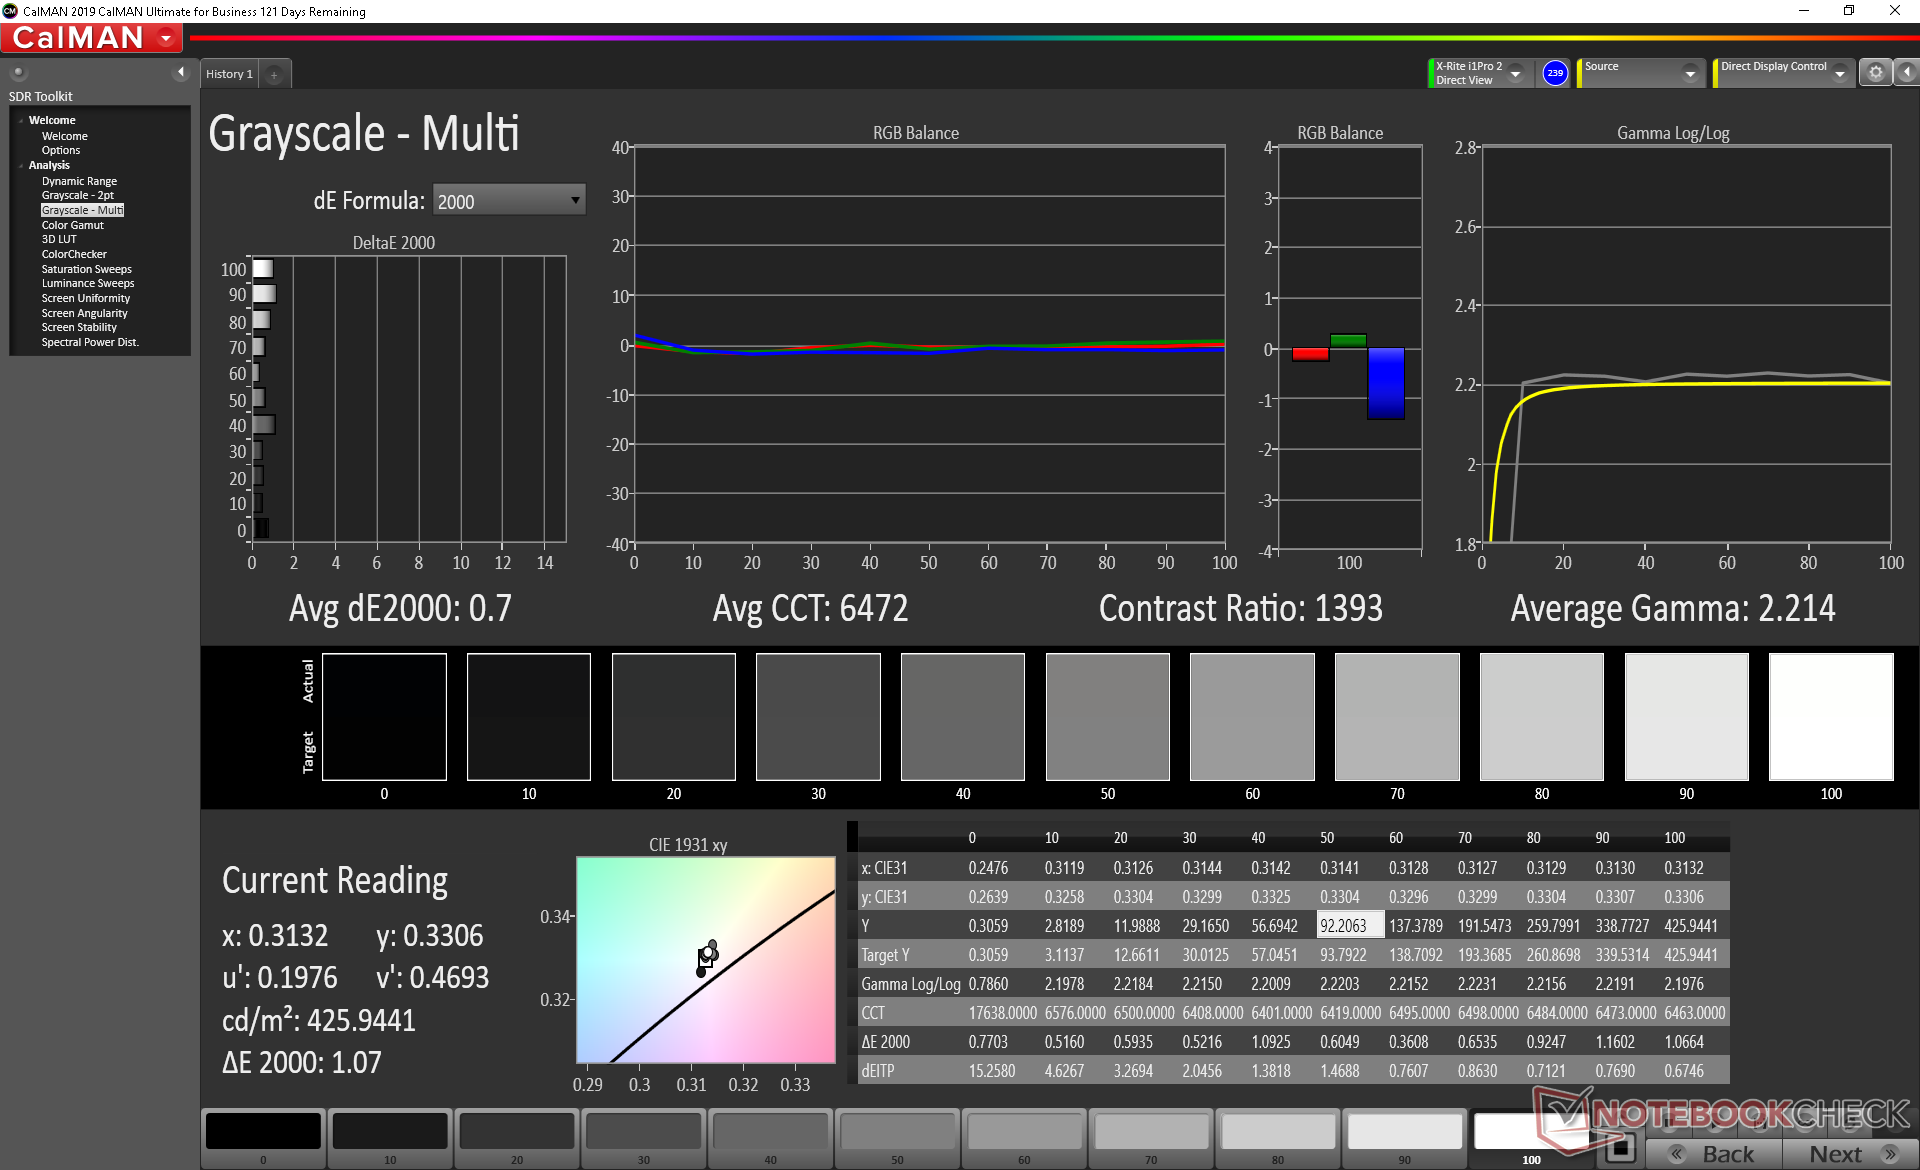
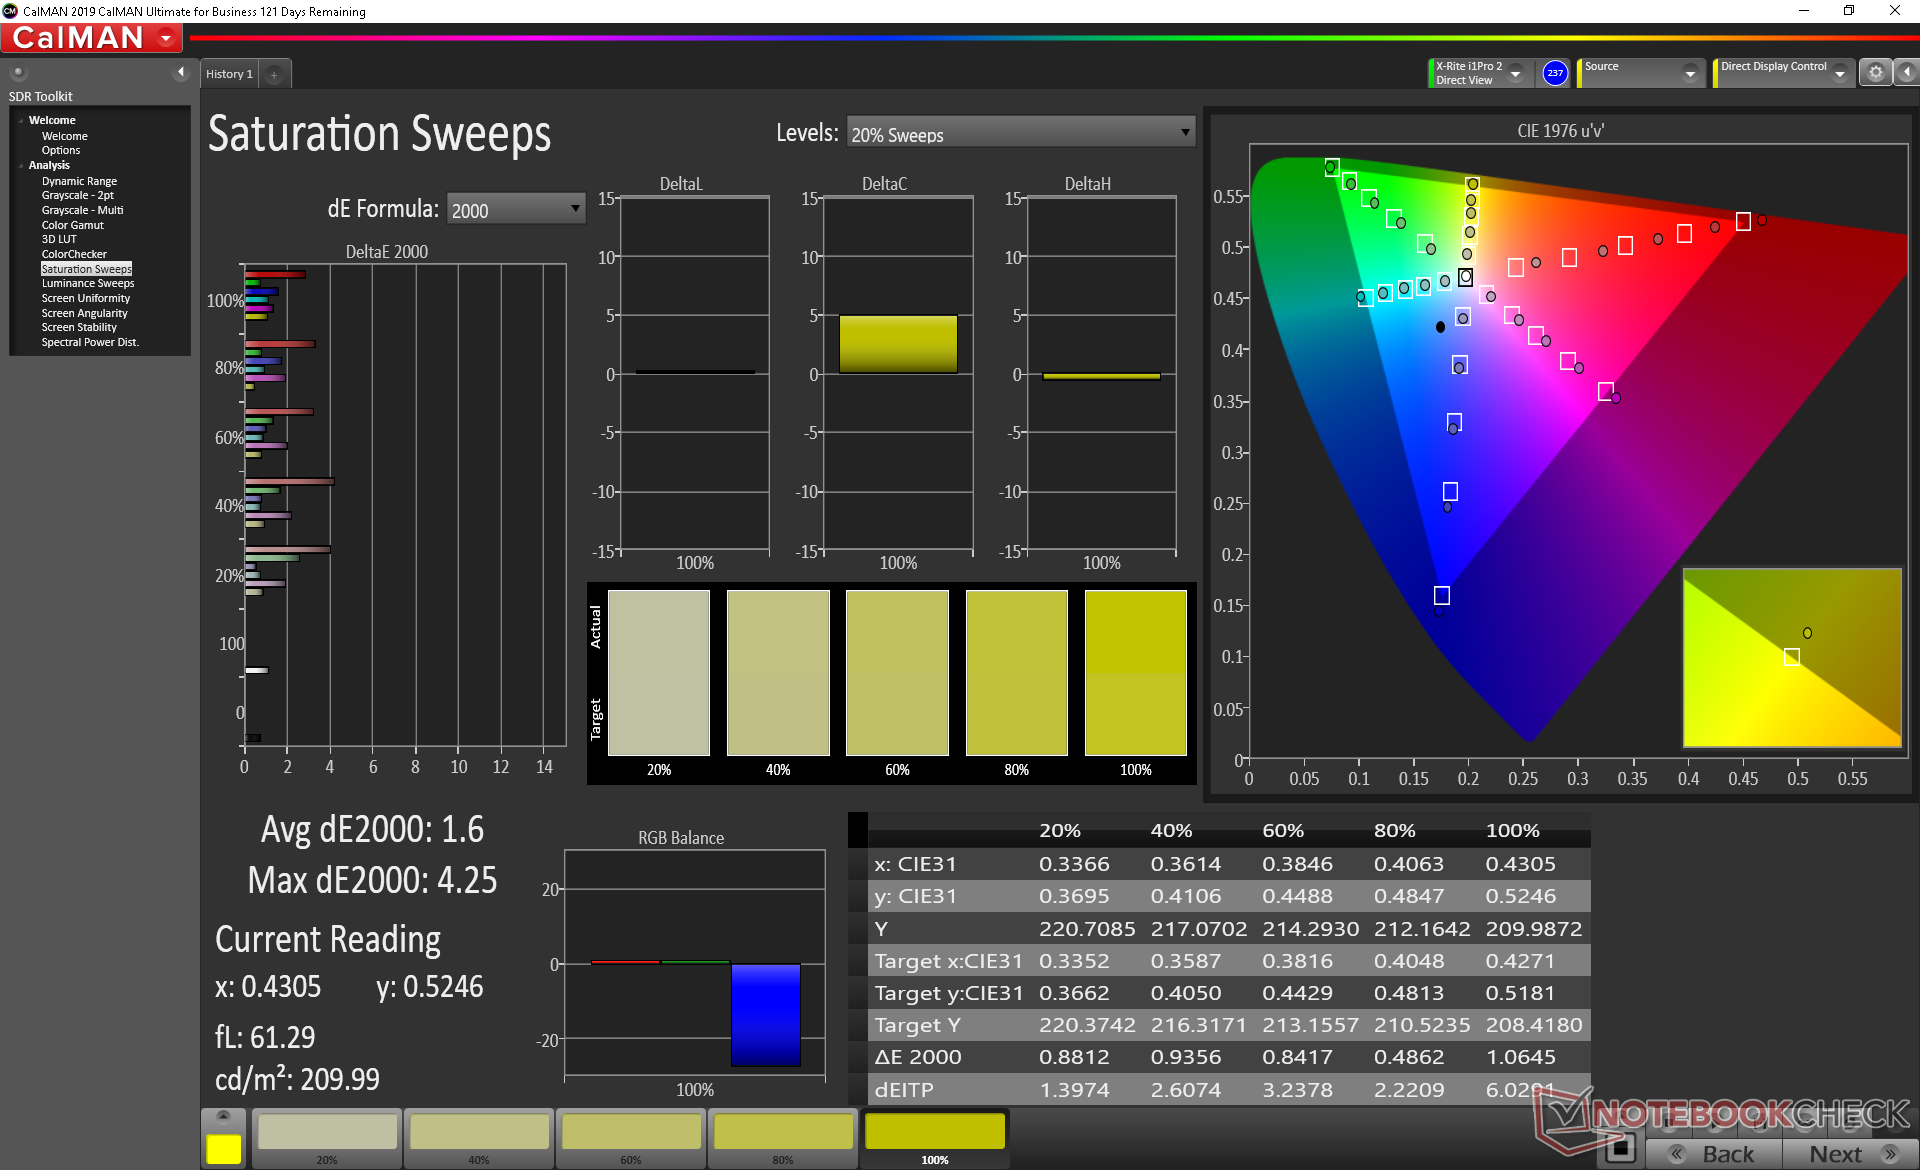
Renk alanı tüm sRGB'yi ve AdobeRGB'nin yaklaşık yüzde 90'ını, diğer birçok ileri teknoloji iş istasyonu veya multimedya dizüstü bilgisayarda olduğu gibi kapsar.
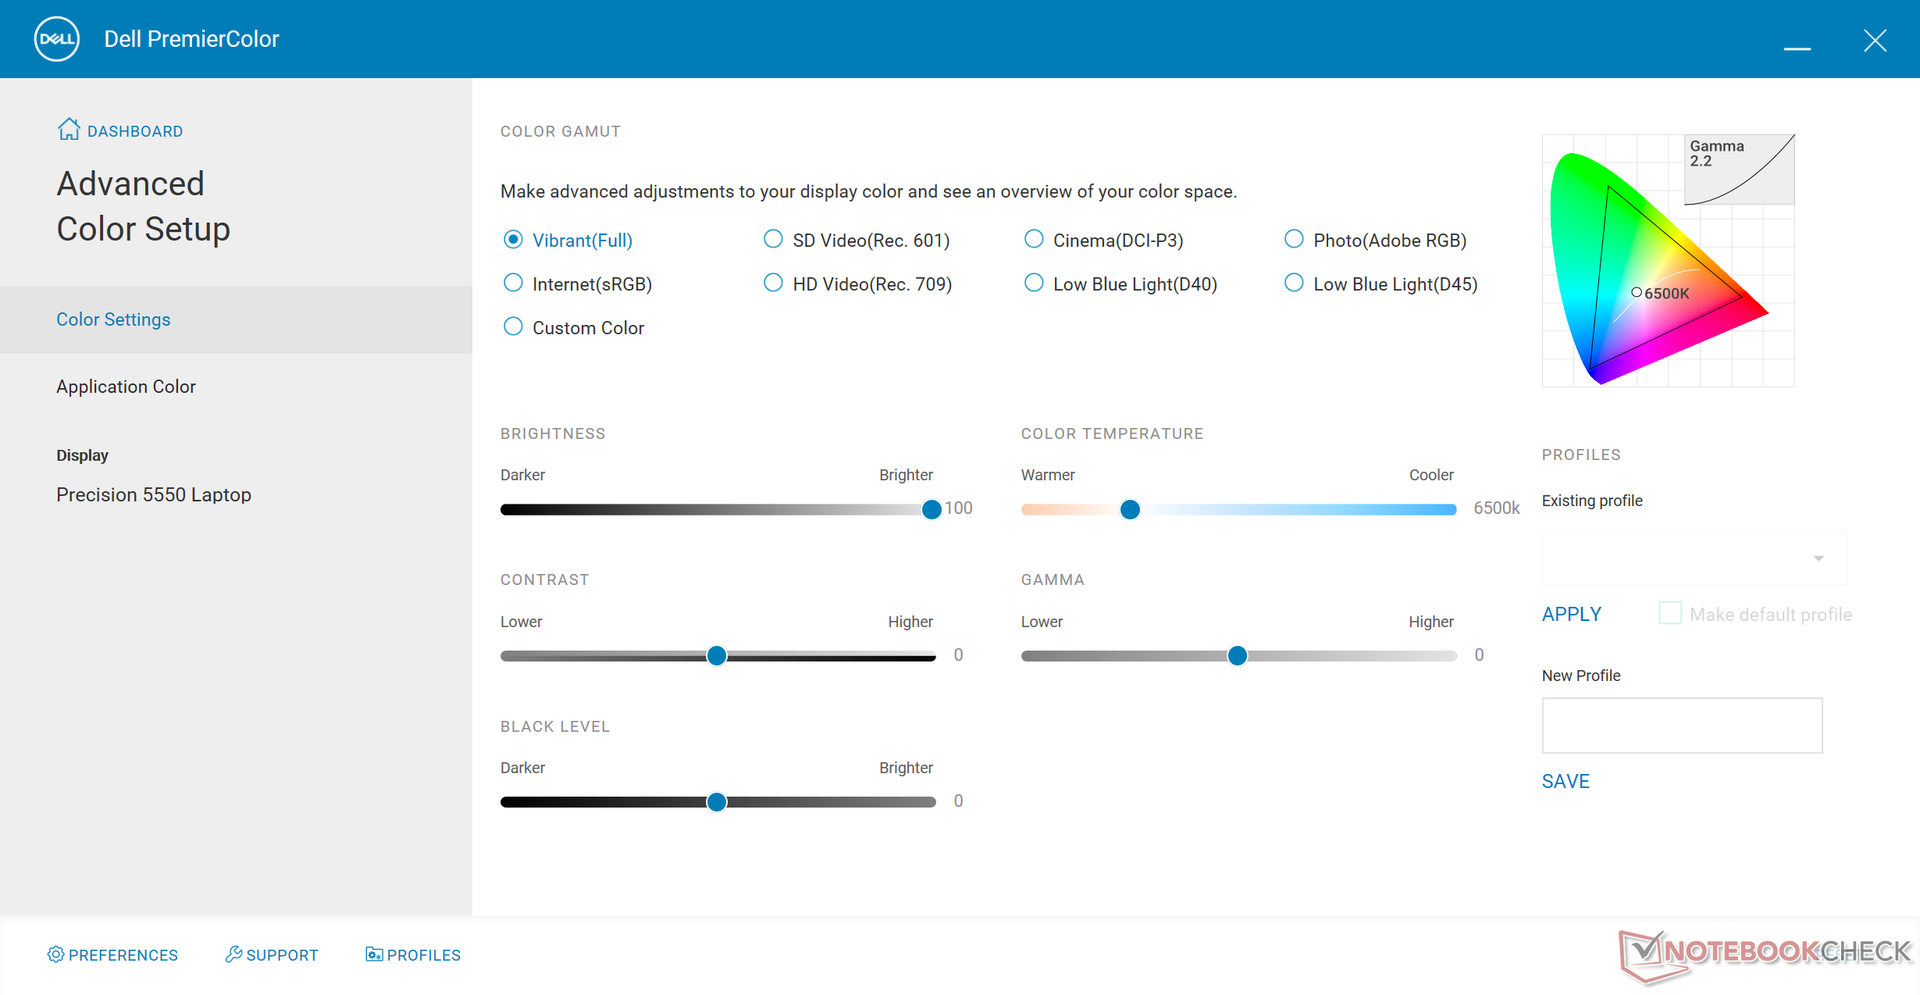
Bir X-Rite renk ölçer ile yapılan diğer ölçümler, kutudan çıkar çıkmaz aşırı sıcak renk sıcaklığını ortaya çıkarır. Paneli kendimiz kalibre etmek, ortalama gri tonlamalı DeltaE'yi 5,5'ten 0,7'ye düşürürken, işlem sırasında renk doğruluğunu biraz iyileştirir. Kullanıcılar ayrıca renkleri manuel olarak ayarlamak veya farklı profilleri kaydetmek için Dell PremierColor'u kullanabilir.
Yanıt Sürelerini Görüntüle
| ↔ Tepki Süresi Siyahtan Beyaza | ||
|---|---|---|
| 34 ms ... yükseliş ↗ ve sonbahar↘ birleşimi | ↗ 17.6 ms yükseliş | 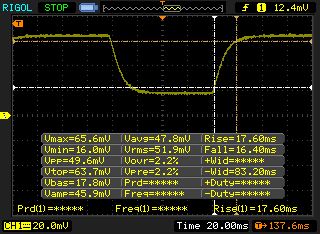 |
| ↘ 16.4 ms sonbahar | ||
| Ekran, testlerimizde yavaş yanıt oranları gösteriyor ve oyuncular için yetersiz olacaktır. Karşılaştırıldığında, test edilen tüm cihazlar 0.1 (minimum) ile 240 (maksimum) ms arasında değişir. » Tüm cihazların 91 %'si daha iyi. Bu, ölçülen yanıt süresinin test edilen tüm cihazların ortalamasından (19.9 ms) daha kötü olduğu anlamına gelir. | ||
| ↔ Tepki Süresi %50 Griden %80 Griye | ||
| 46 ms ... yükseliş ↗ ve sonbahar↘ birleşimi | ↗ 24 ms yükseliş | 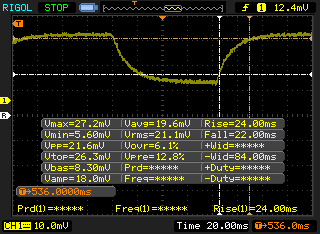 |
| ↘ 22 ms sonbahar | ||
| Ekran, testlerimizde yavaş yanıt oranları gösteriyor ve oyuncular için yetersiz olacaktır. Karşılaştırıldığında, test edilen tüm cihazlar 0.165 (minimum) ile 636 (maksimum) ms arasında değişir. » Tüm cihazların 79 %'si daha iyi. Bu, ölçülen yanıt süresinin test edilen tüm cihazların ortalamasından (31.1 ms) daha kötü olduğu anlamına gelir. | ||
Ekran Titremesi / PWM (Darbe Genişliği Modülasyonu)
| Ekran titriyor / PWM algılanmadı | 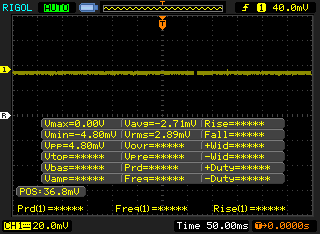 | ||
Karşılaştırıldığında: Test edilen tüm cihazların %52 %'si ekranı karartmak için PWM kullanmıyor. PWM tespit edilirse, ortalama 7794 (minimum: 5 - maksimum: 343500) Hz ölçüldü. | |||
Ekran diğer mobil iş istasyonlarının çoğundan daha parlak olmasına rağmen, parlak kaplama normalden daha fazla parlamaya katkıda bulunur. Görüntülenebilirliği en üst düzeye çıkarmak için parlaklığı artırmak ve mümkün olduğunda gölgede kalmak isteyeceksiniz.
Verim
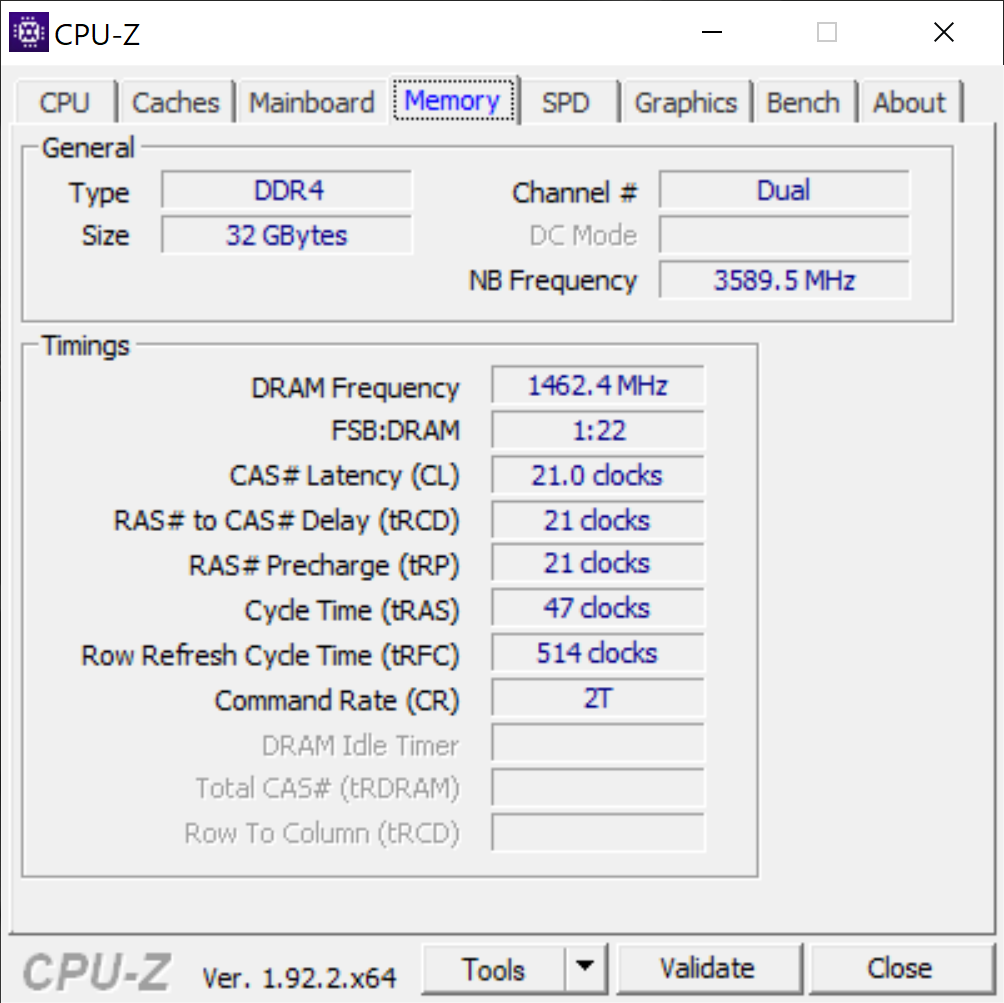
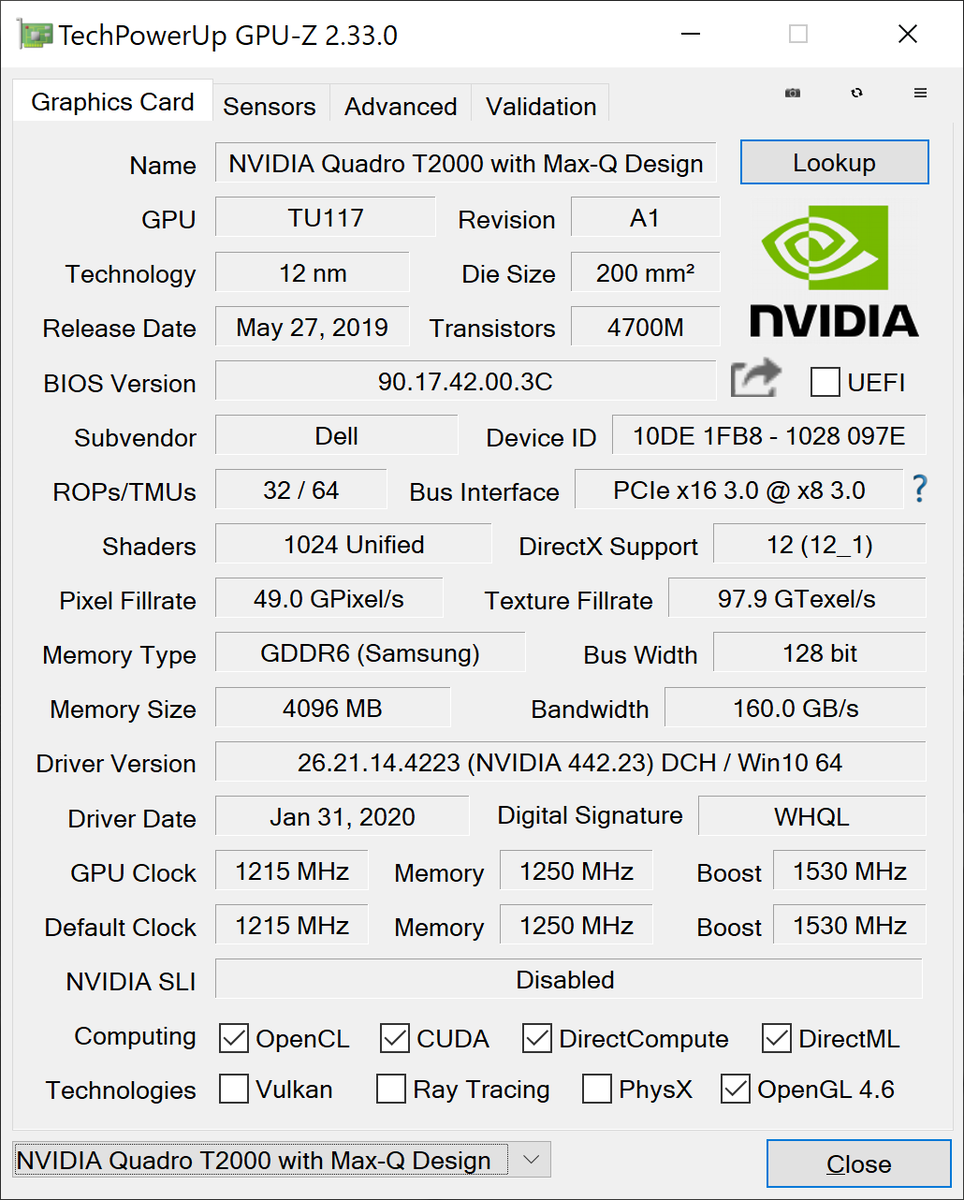
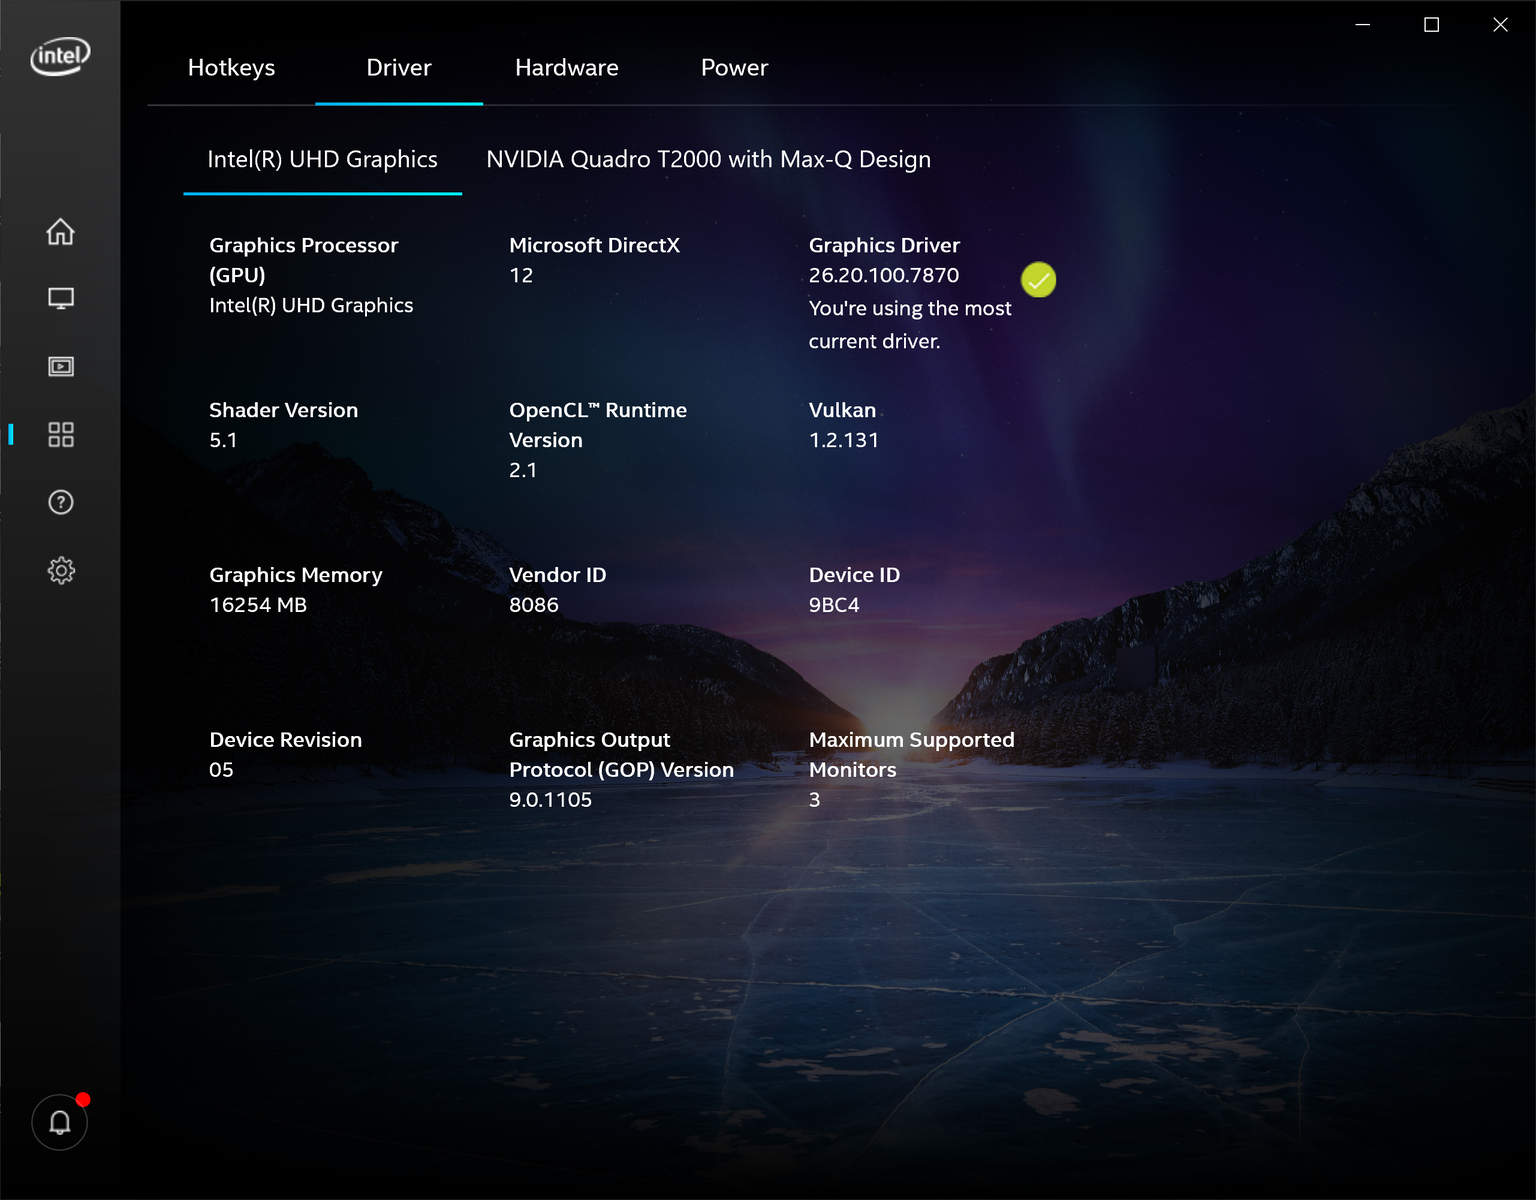
Yapılandırmamız, orijinal XPS 15 9500 üzerindeki GeForce GTX 1650 Ti Max-Q'dan türetilen Quadro T2000 Max-Q'yu kullanır. Bir Quadro T1000 seçeneği de mevcuttur, ancak bunun standart T1000 mi yoksa T1000 Max mı olduğunu kesin olarak söyleyemeyiz. Q. Quadro T3000 Max-Q ve üstü gibi daha hızlı GPU'lar, Dell'in daha kalın ve daha yüksek kaliteli Precision 7550 serisi için ayrılmıştır. RAM, Xeon CPU ile yapılandırılırsa ECC desteğiyle 64 GB'a kadar yükseltilebilir. Nvidia Optimus, otomatik grafik değiştirme için Quadro SKU'larda standart olarak gelir.
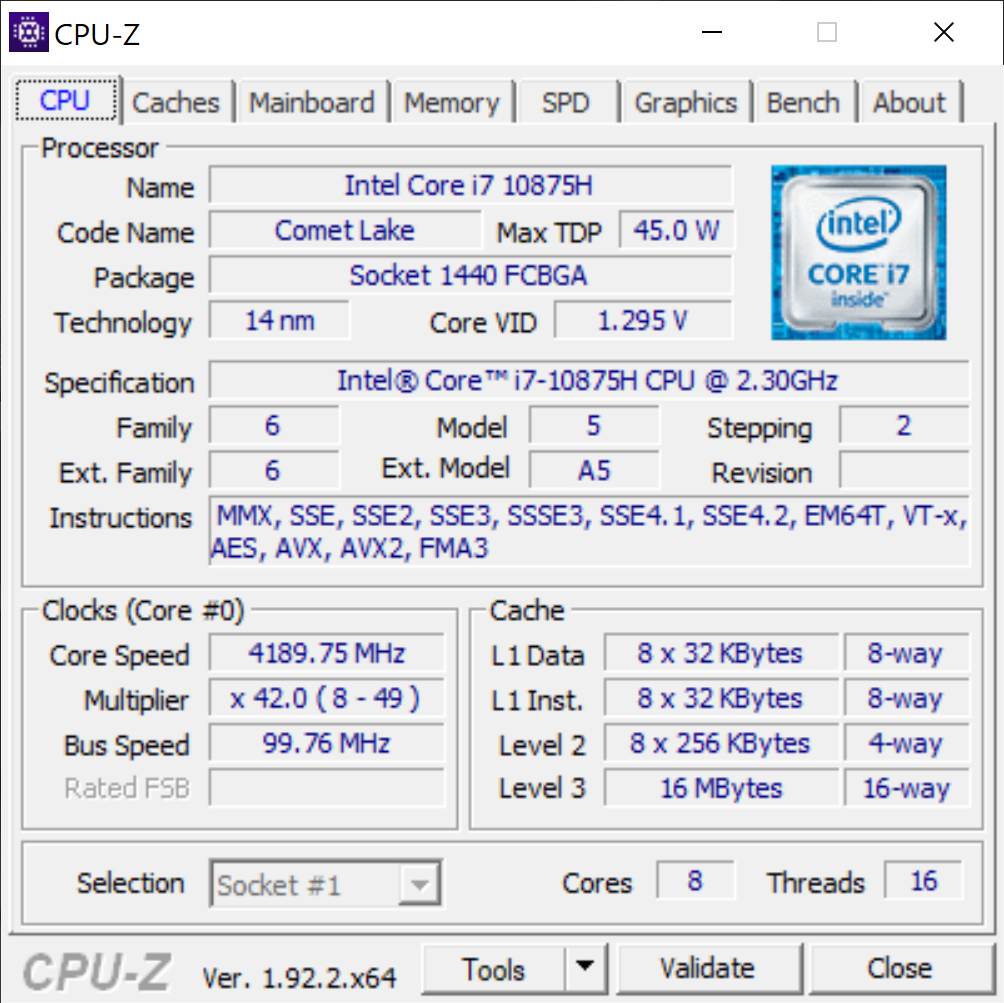
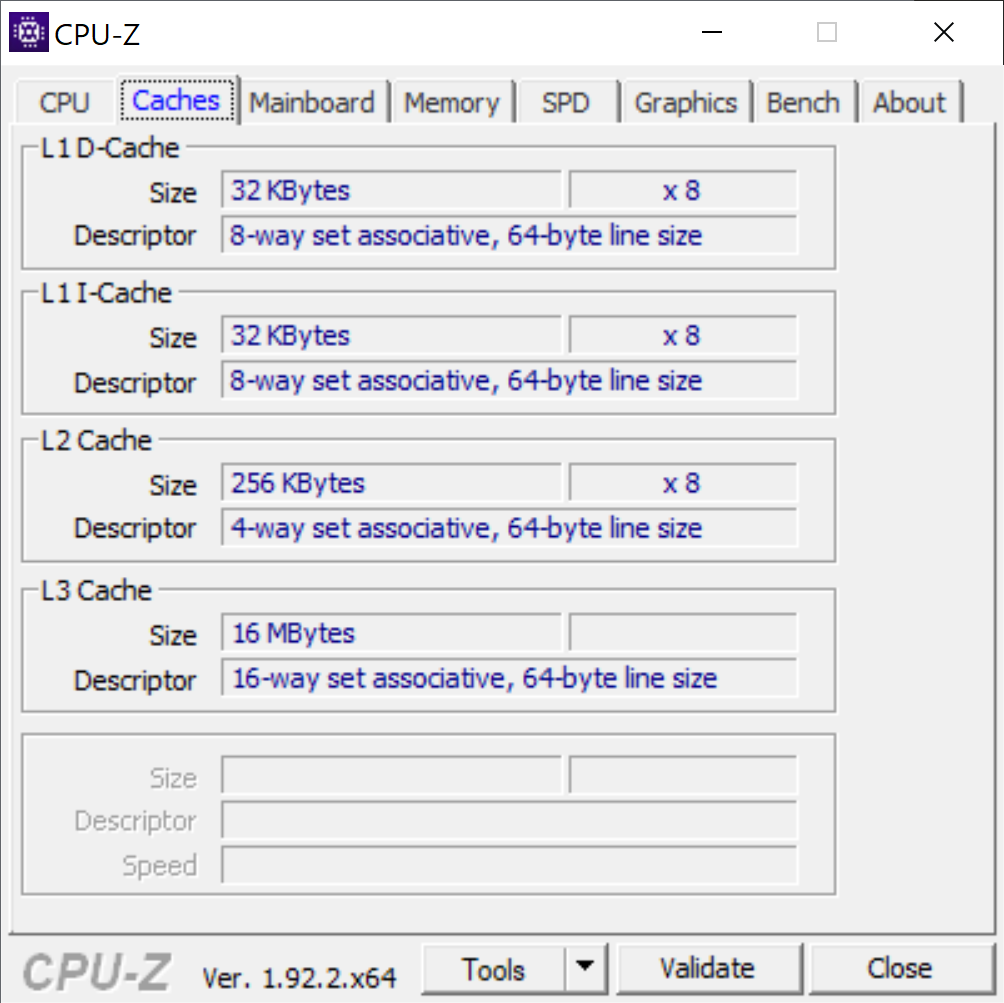
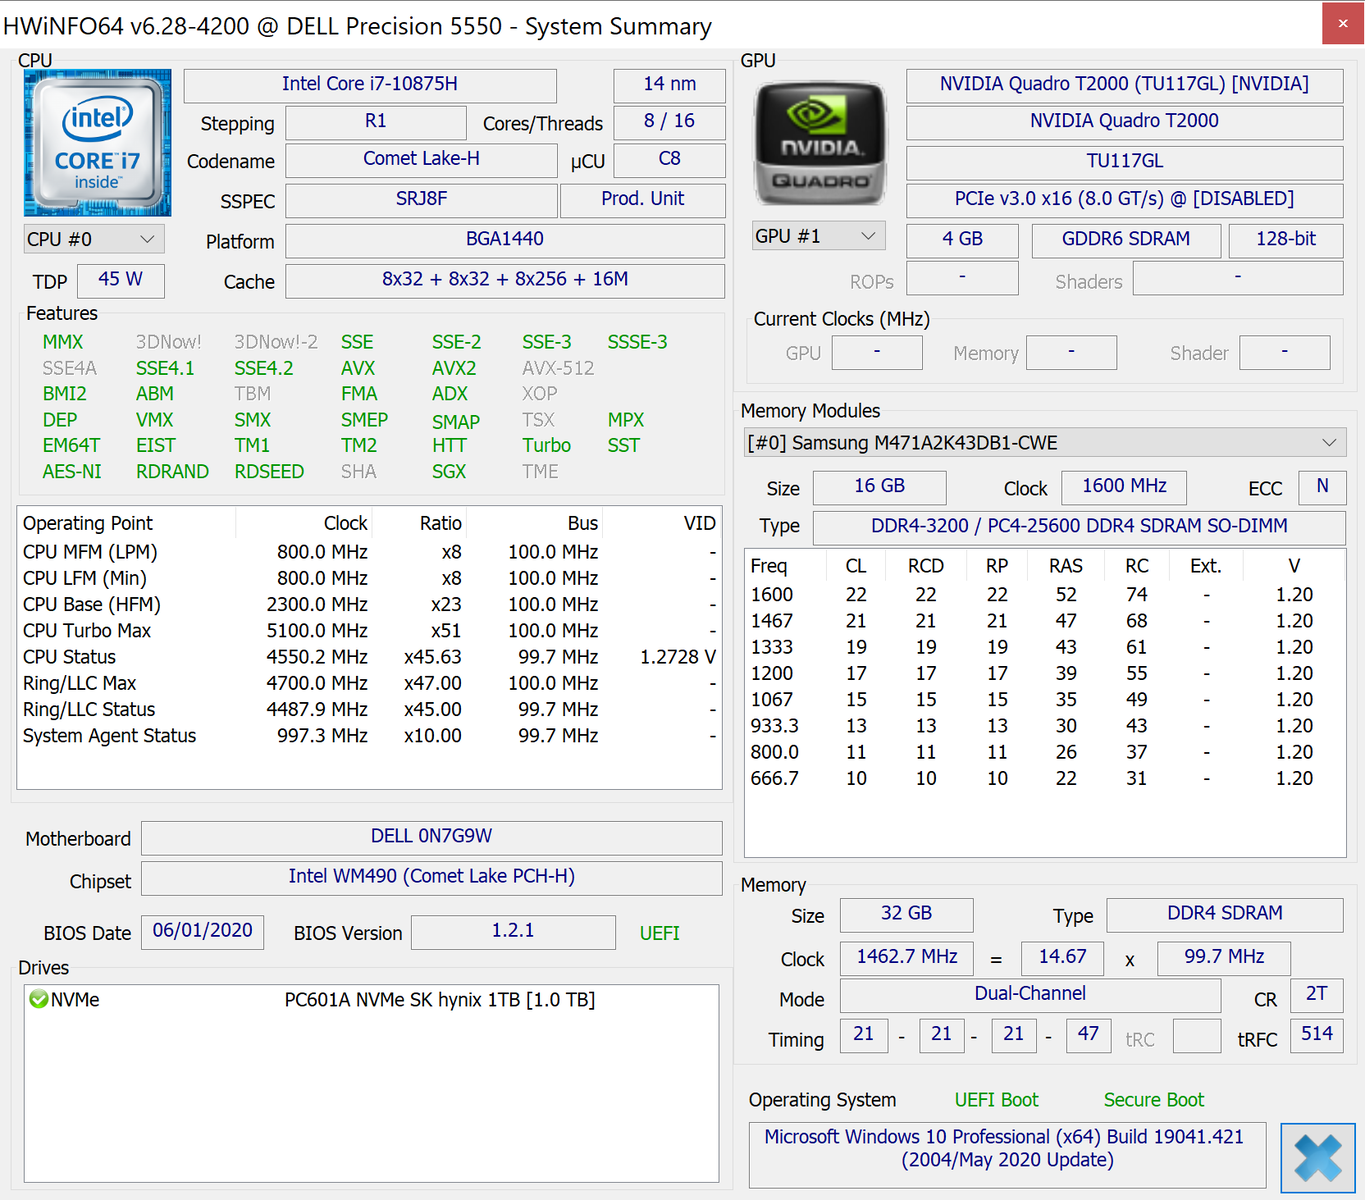
İşlemci
Belki de şaşırtıcı olmayan bir şekilde, CPU performansı, XPS 15 9500'de kaydettiğimize en çok benziyor. Razer Blade 15 Studio Edition'da bulunanla aynı CPU, Dell Precision'ımızdan neredeyse yüzde 20 daha yavaş çalışıyor. Dört çekirdekli Core i5-10400H'den veya hexa-core Core i7-10750H'den sekiz çekirdekli Core i7-10875H'ye yükseltme yapan kullanıcılar, sırasıyla yaklaşık yüzde 60 ve yüzde 20 daha hızlı işlemci performansı görecek.
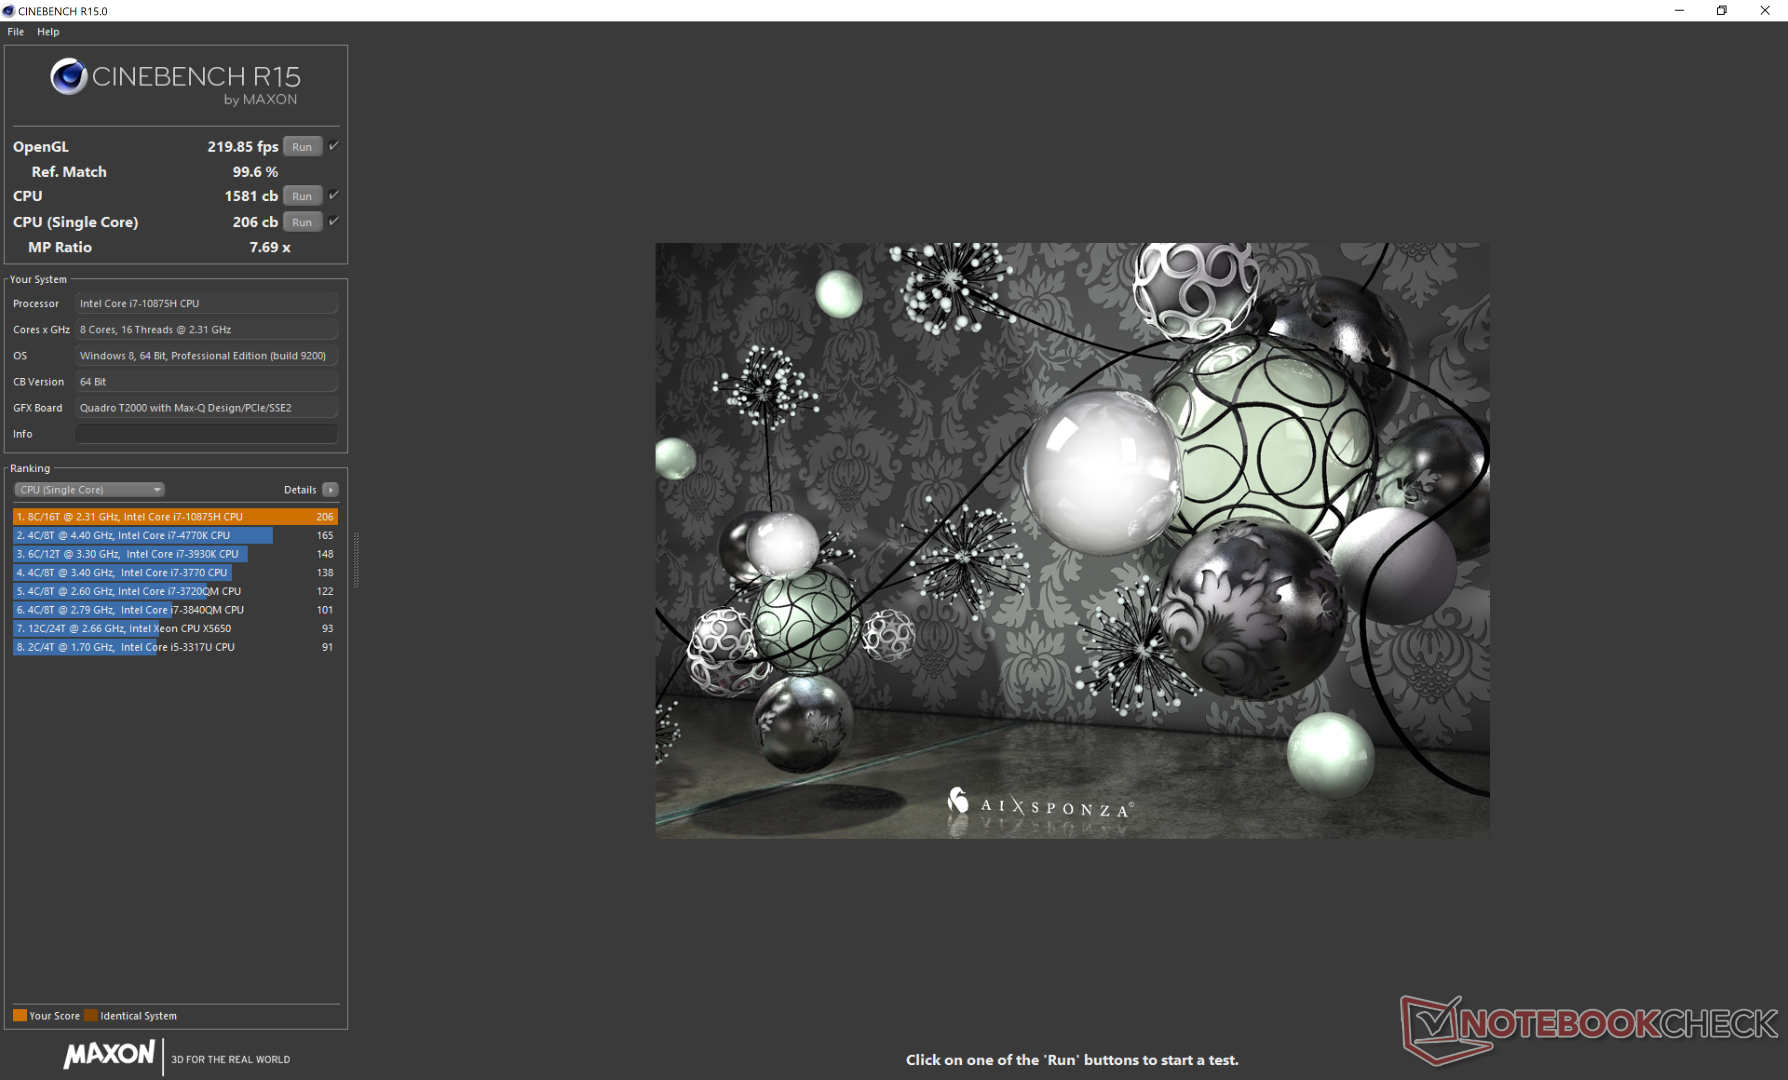
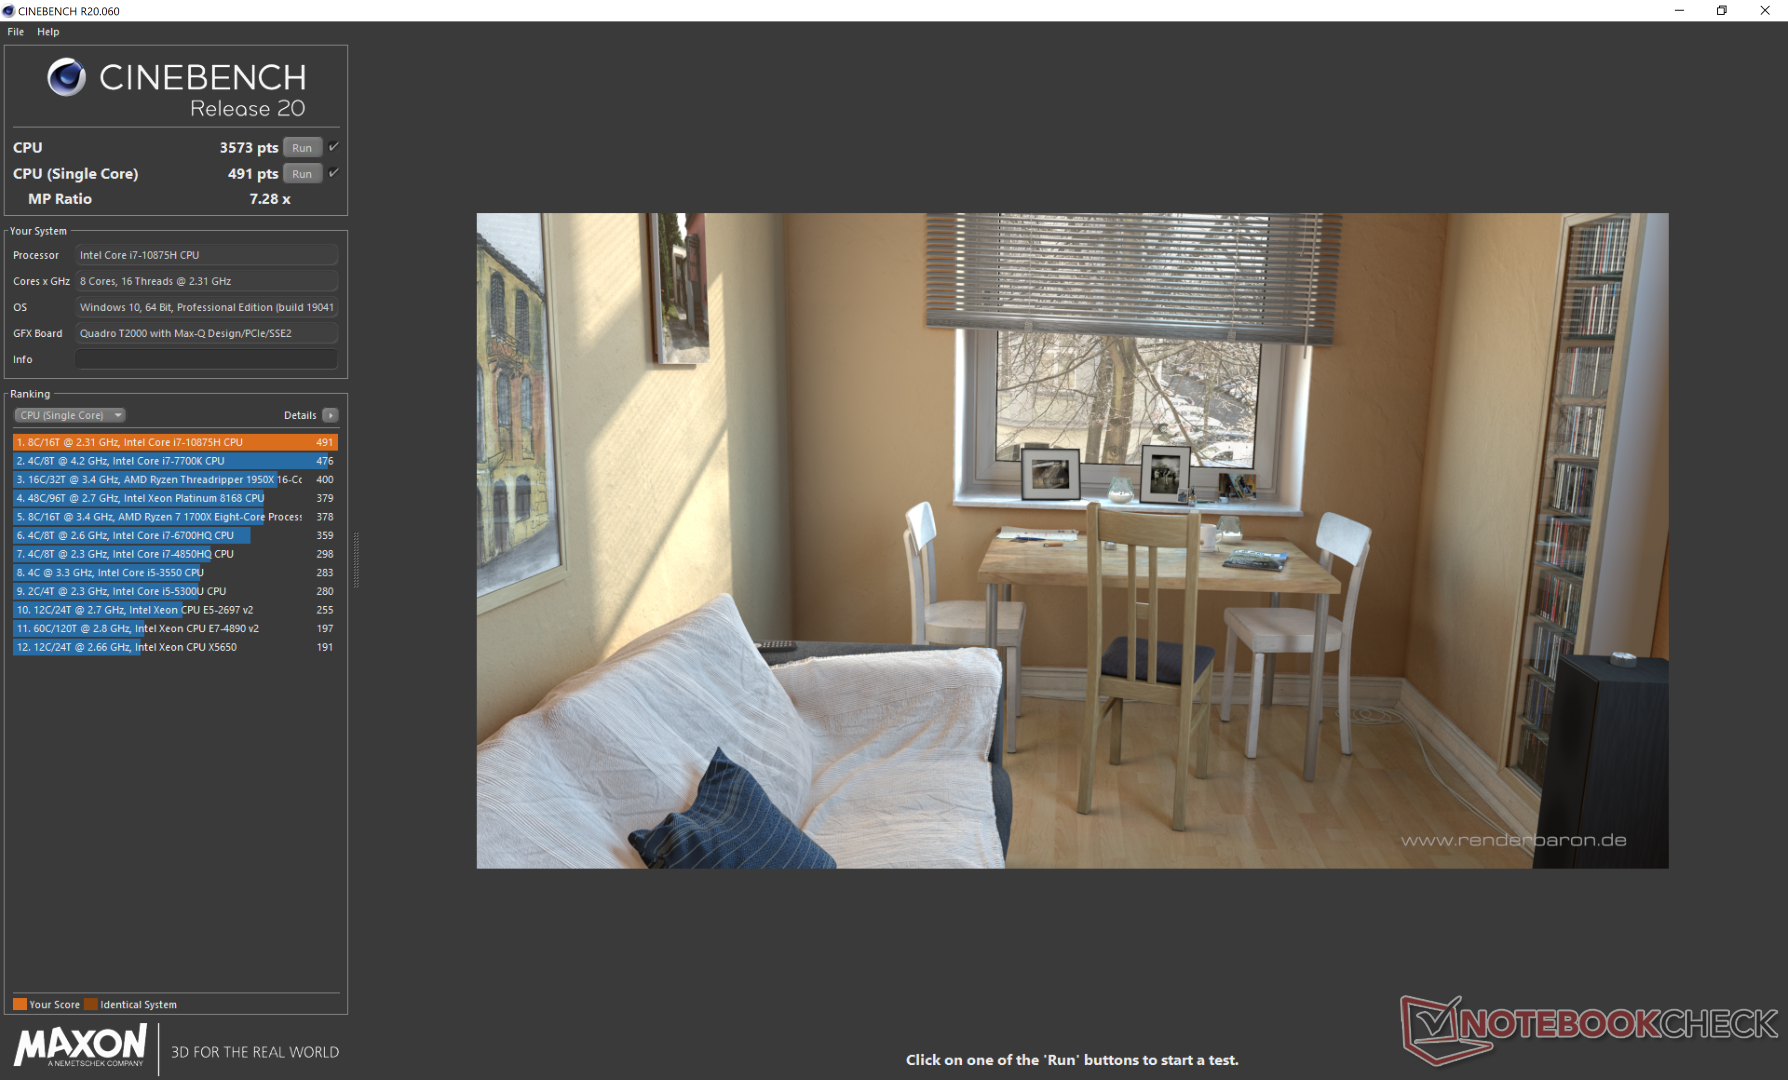
Cinebench R15: CPU Multi 64Bit | CPU Single 64Bit
Blender: v2.79 BMW27 CPU
7-Zip 18.03: 7z b 4 -mmt1 | 7z b 4
Geekbench 5.5: Single-Core | Multi-Core
HWBOT x265 Benchmark v2.2: 4k Preset
LibreOffice : 20 Documents To PDF
R Benchmark 2.5: Overall mean
| Cinebench R20 / CPU (Multi Core) | |
| Eluktronics RP-15 | |
| Asus ROG Zephyrus Duo 15 GX550LXS | |
| Ortalama Intel Core i7-10875H (1986 - 4176, n=32) | |
| Dell Precision 5550 P91F | |
| Apple MacBook Pro 15 2019 i9 Vega 16 | |
| MSI GS66 Stealth 10SE-045 | |
| Razer Blade 15 Studio Edition 2020 | |
| Schenker Work 15 | |
| Dell XPS 15 9500 Core i5 | |
| Razer Blade 15 Studio Edition | |
| Cinebench R20 / CPU (Single Core) | |
| Asus ROG Zephyrus Duo 15 GX550LXS | |
| Dell Precision 5550 P91F | |
| Eluktronics RP-15 | |
| Ortalama Intel Core i7-10875H (430 - 524, n=32) | |
| Razer Blade 15 Studio Edition 2020 | |
| Apple MacBook Pro 15 2019 i9 Vega 16 | |
| MSI GS66 Stealth 10SE-045 | |
| Dell XPS 15 9500 Core i5 | |
| Razer Blade 15 Studio Edition | |
| Schenker Work 15 | |
| Cinebench R15 / CPU Multi 64Bit | |
| Eluktronics RP-15 | |
| Asus ROG Zephyrus Duo 15 GX550LXS | |
| Ortalama Intel Core i7-10875H (1003 - 1833, n=38) | |
| Dell Precision 5550 P91F | |
| Dell Precision 5540 | |
| Apple MacBook Pro 15 2019 i9 Vega 16 | |
| Lenovo ThinkPad P53-20QN000YGE | |
| MSI GS66 Stealth 10SE-045 | |
| Razer Blade 15 Studio Edition 2020 | |
| Razer Blade 15 Studio Edition | |
| Schenker Work 15 | |
| Dell XPS 15 9500 Core i5 | |
| Cinebench R15 / CPU Single 64Bit | |
| Asus ROG Zephyrus Duo 15 GX550LXS | |
| Ortalama Intel Core i7-10875H (190 - 220, n=37) | |
| Dell Precision 5550 P91F | |
| Lenovo ThinkPad P53-20QN000YGE | |
| Dell Precision 5540 | |
| Razer Blade 15 Studio Edition 2020 | |
| Eluktronics RP-15 | |
| MSI GS66 Stealth 10SE-045 | |
| Dell XPS 15 9500 Core i5 | |
| Apple MacBook Pro 15 2019 i9 Vega 16 | |
| Razer Blade 15 Studio Edition | |
| Schenker Work 15 | |
| Blender / v2.79 BMW27 CPU | |
| Dell XPS 15 9500 Core i5 | |
| Schenker Work 15 | |
| Schenker Work 15 | |
| Lenovo ThinkPad P53-20QN000YGE | |
| MSI GS66 Stealth 10SE-045 | |
| Razer Blade 15 Studio Edition 2020 | |
| Apple MacBook Pro 15 2019 i9 Vega 16 | |
| Dell Precision 5550 P91F | |
| Dell Precision 5540 | |
| Ortalama Intel Core i7-10875H (259 - 535, n=30) | |
| Asus ROG Zephyrus Duo 15 GX550LXS | |
| Eluktronics RP-15 | |
| 7-Zip 18.03 / 7z b 4 -mmt1 | |
| Dell Precision 5550 P91F | |
| Asus ROG Zephyrus Duo 15 GX550LXS | |
| Ortalama Intel Core i7-10875H (5071 - 5780, n=31) | |
| Razer Blade 15 Studio Edition 2020 | |
| Dell Precision 5540 | |
| Lenovo ThinkPad P53-20QN000YGE | |
| Dell XPS 15 9500 Core i5 | |
| MSI GS66 Stealth 10SE-045 | |
| Eluktronics RP-15 | |
| Schenker Work 15 | |
| Schenker Work 15 | |
| 7-Zip 18.03 / 7z b 4 | |
| Eluktronics RP-15 | |
| Asus ROG Zephyrus Duo 15 GX550LXS | |
| Ortalama Intel Core i7-10875H (29844 - 49562, n=31) | |
| Dell Precision 5550 P91F | |
| Dell Precision 5540 | |
| Razer Blade 15 Studio Edition 2020 | |
| MSI GS66 Stealth 10SE-045 | |
| Lenovo ThinkPad P53-20QN000YGE | |
| Schenker Work 15 | |
| Schenker Work 15 | |
| Dell XPS 15 9500 Core i5 | |
| Geekbench 5.5 / Single-Core | |
| Asus ROG Zephyrus Duo 15 GX550LXS | |
| Dell Precision 5550 P91F | |
| Ortalama Intel Core i7-10875H (1233 - 1371, n=29) | |
| Razer Blade 15 Studio Edition 2020 | |
| Eluktronics RP-15 | |
| MSI GS66 Stealth 10SE-045 | |
| Dell XPS 15 9500 Core i5 | |
| Geekbench 5.5 / Multi-Core | |
| Eluktronics RP-15 | |
| Asus ROG Zephyrus Duo 15 GX550LXS | |
| Dell Precision 5550 P91F | |
| Ortalama Intel Core i7-10875H (5715 - 8620, n=29) | |
| Razer Blade 15 Studio Edition 2020 | |
| MSI GS66 Stealth 10SE-045 | |
| Dell XPS 15 9500 Core i5 | |
| HWBOT x265 Benchmark v2.2 / 4k Preset | |
| Eluktronics RP-15 | |
| Asus ROG Zephyrus Duo 15 GX550LXS | |
| Ortalama Intel Core i7-10875H (7.27 - 14.1, n=27) | |
| Dell Precision 5540 | |
| Dell Precision 5550 P91F | |
| Razer Blade 15 Studio Edition 2020 | |
| MSI GS66 Stealth 10SE-045 | |
| Lenovo ThinkPad P53-20QN000YGE | |
| Schenker Work 15 | |
| Schenker Work 15 | |
| Dell XPS 15 9500 Core i5 | |
| LibreOffice / 20 Documents To PDF | |
| Dell XPS 15 9500 Core i5 | |
| Eluktronics RP-15 | |
| MSI GS66 Stealth 10SE-045 | |
| Asus ROG Zephyrus Duo 15 GX550LXS | |
| Ortalama Intel Core i7-10875H (30.2 - 84.3, n=30) | |
| Razer Blade 15 Studio Edition 2020 | |
| Dell Precision 5550 P91F | |
| R Benchmark 2.5 / Overall mean | |
| Dell XPS 15 9500 Core i5 | |
| MSI GS66 Stealth 10SE-045 | |
| Dell Precision 5550 P91F | |
| Razer Blade 15 Studio Edition 2020 | |
| Asus ROG Zephyrus Duo 15 GX550LXS | |
| Ortalama Intel Core i7-10875H (0.546 - 0.662, n=29) | |
| Eluktronics RP-15 | |
* ... daha küçük daha iyidir
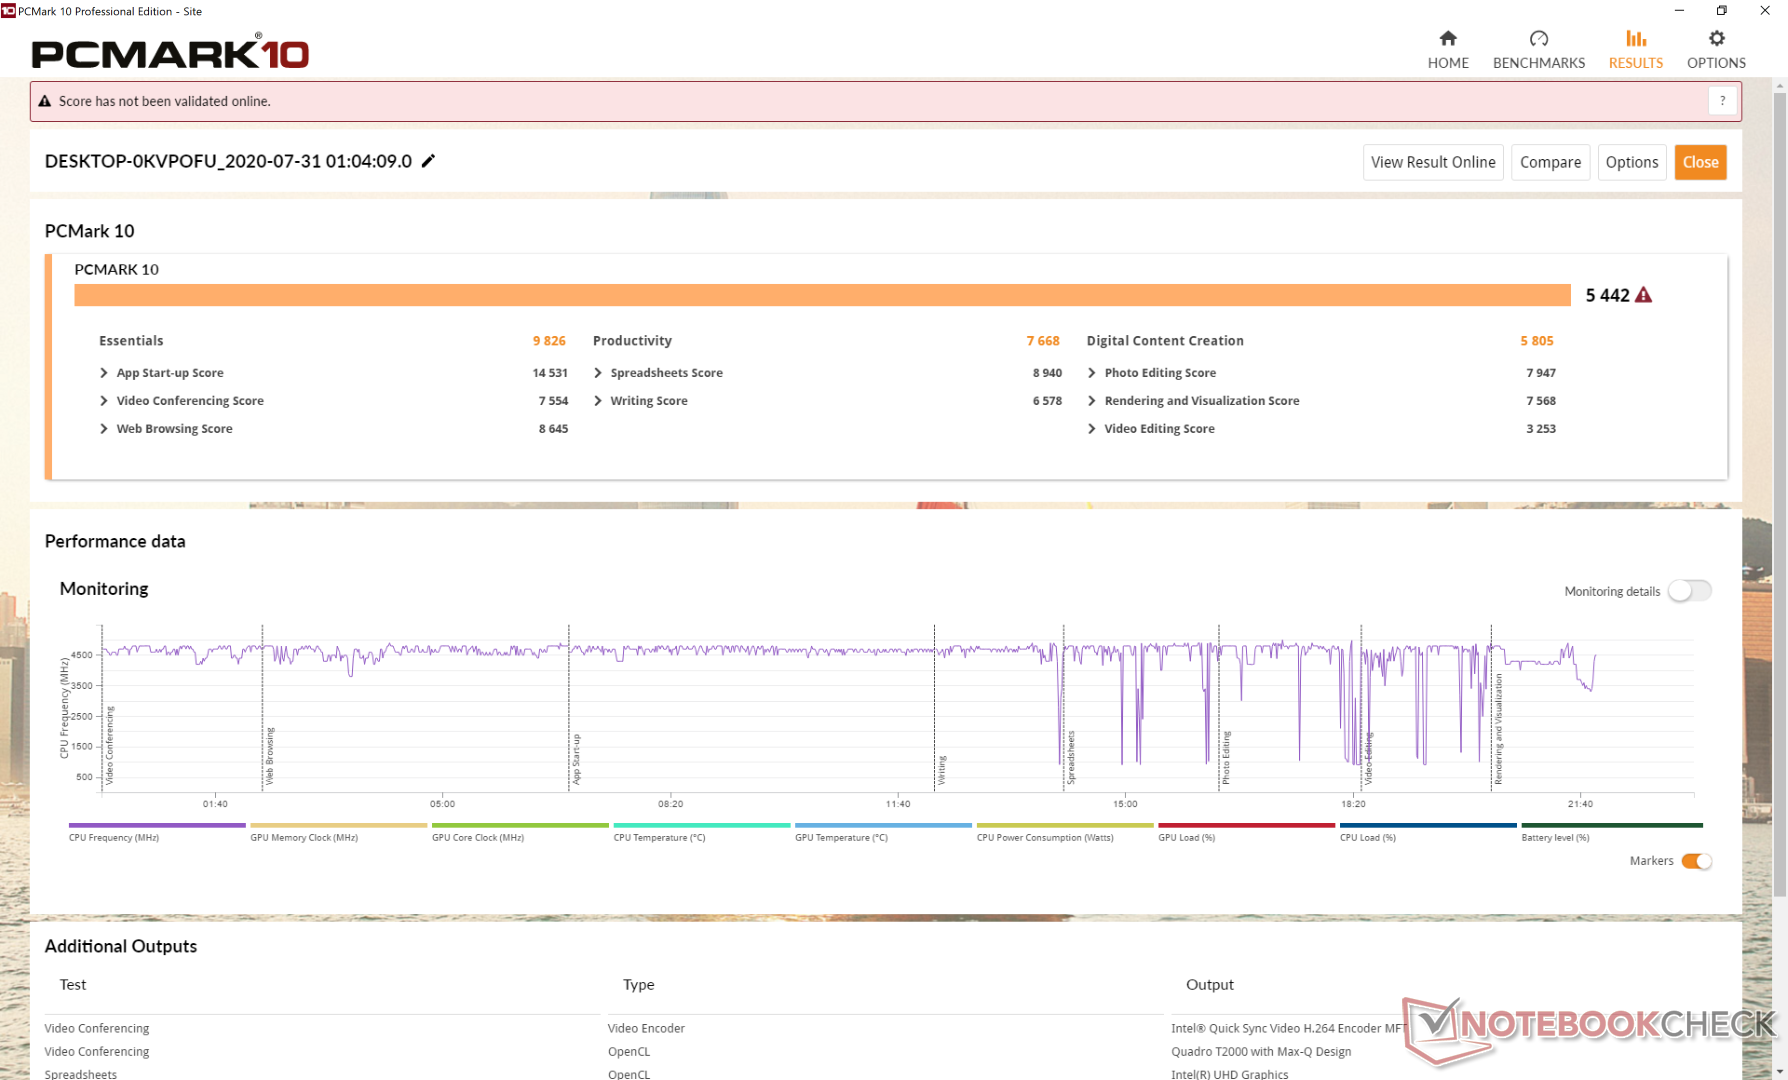
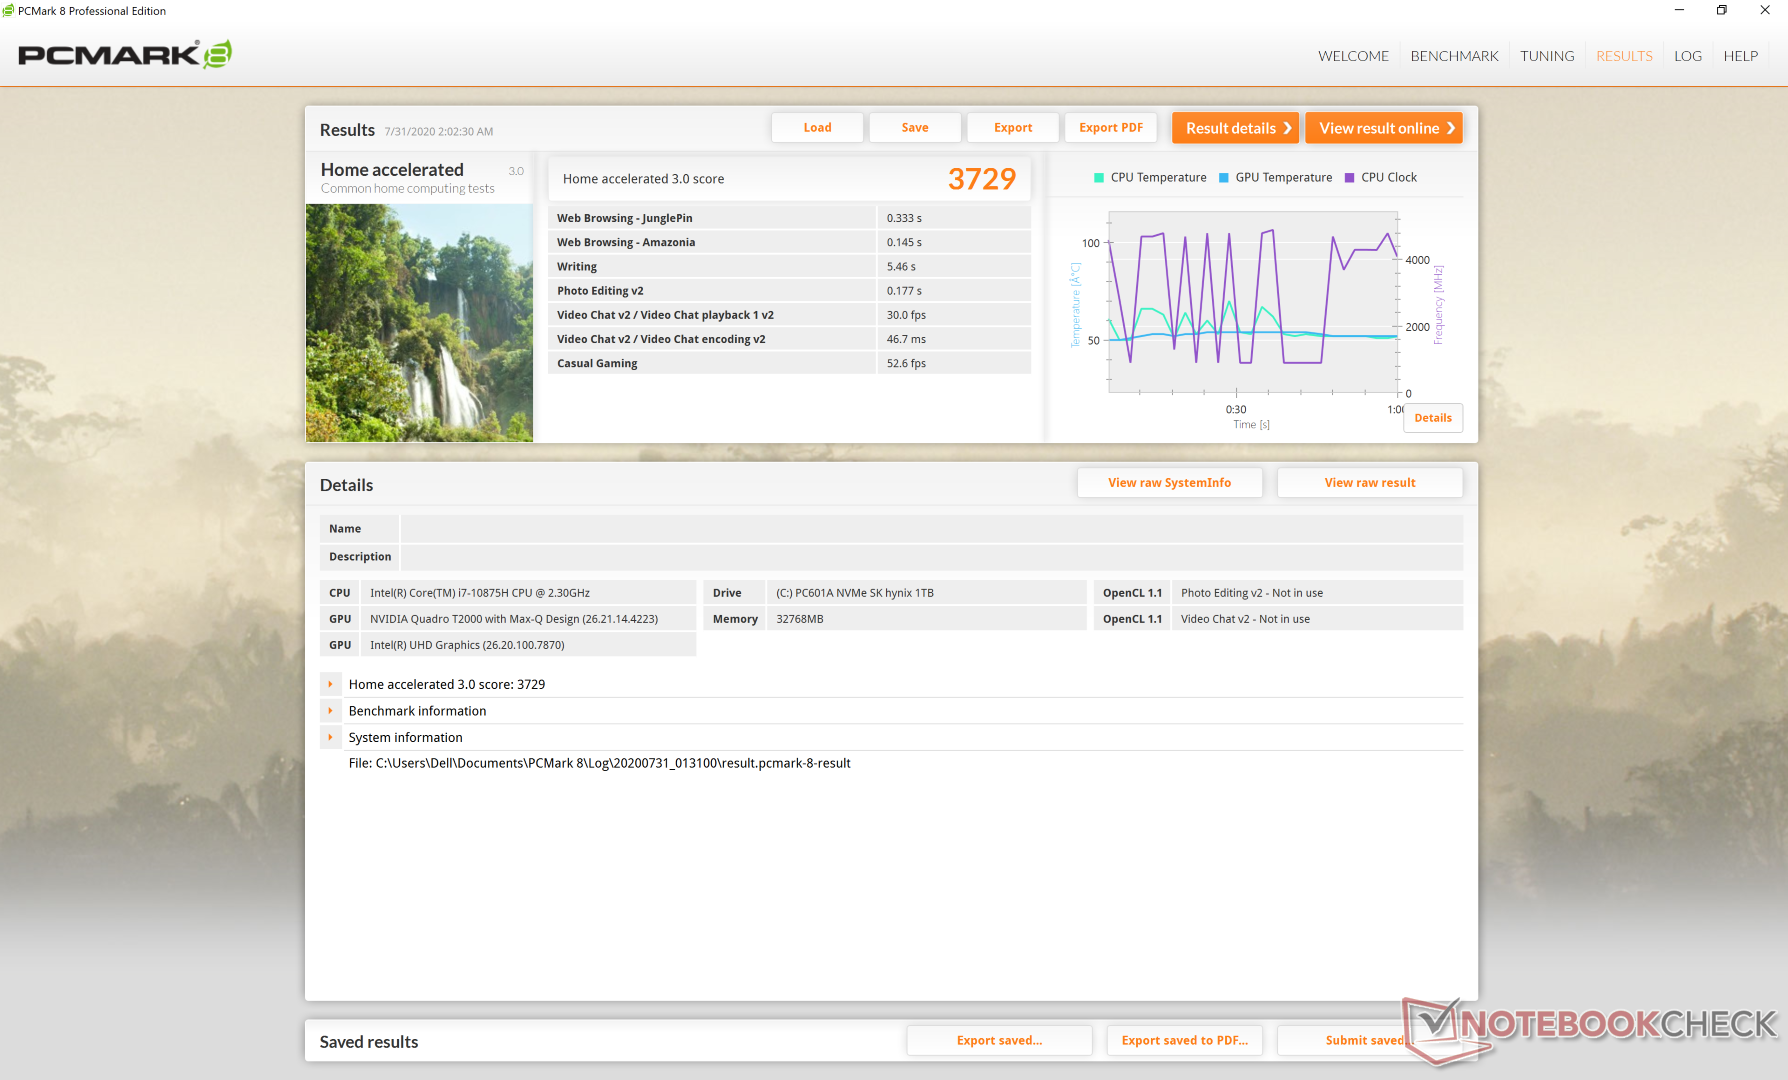
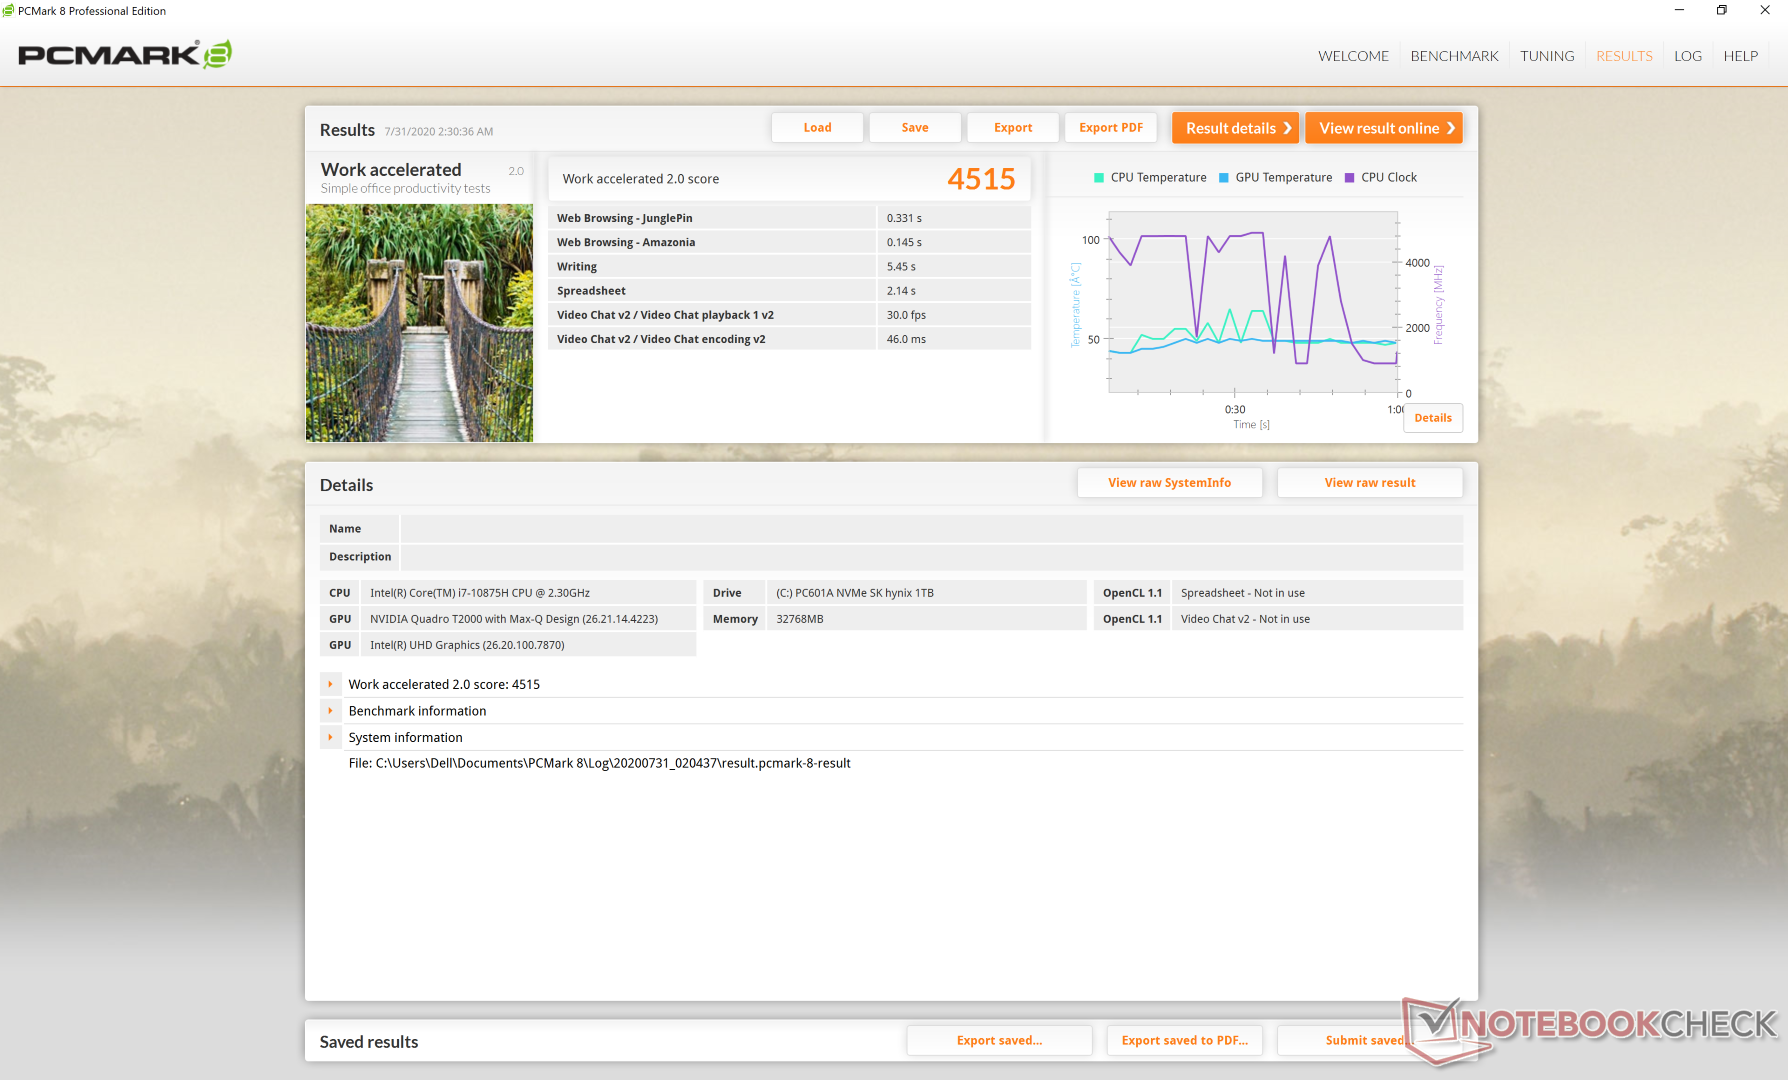
Sistem performansı
PCMark kıyaslamaları, geçen yılki Precision 5540'ın sadece birkaç yüzde puanı dahilinde, günlük yüklerde benzer şekilde performans gösterdiklerini gösteriyor.
| PCMark 8 | |
| Home Score Accelerated v2 | |
| MSI WP65 | |
| Acer ConceptD 3 Pro CN315-71P-73W1 | |
| Dell Precision 5550 P91F | |
| Dell Precision 5540 | |
| Razer Blade 15 Studio Edition 2020 | |
| Work Score Accelerated v2 | |
| Acer ConceptD 3 Pro CN315-71P-73W1 | |
| MSI WP65 | |
| Razer Blade 15 Studio Edition 2020 | |
| Dell Precision 5540 | |
| Dell Precision 5550 P91F | |
| PCMark 8 Home Score Accelerated v2 | 3729 puan | |
| PCMark 8 Work Score Accelerated v2 | 4515 puan | |
| PCMark 10 Score | 5442 puan | |
Yardım | ||
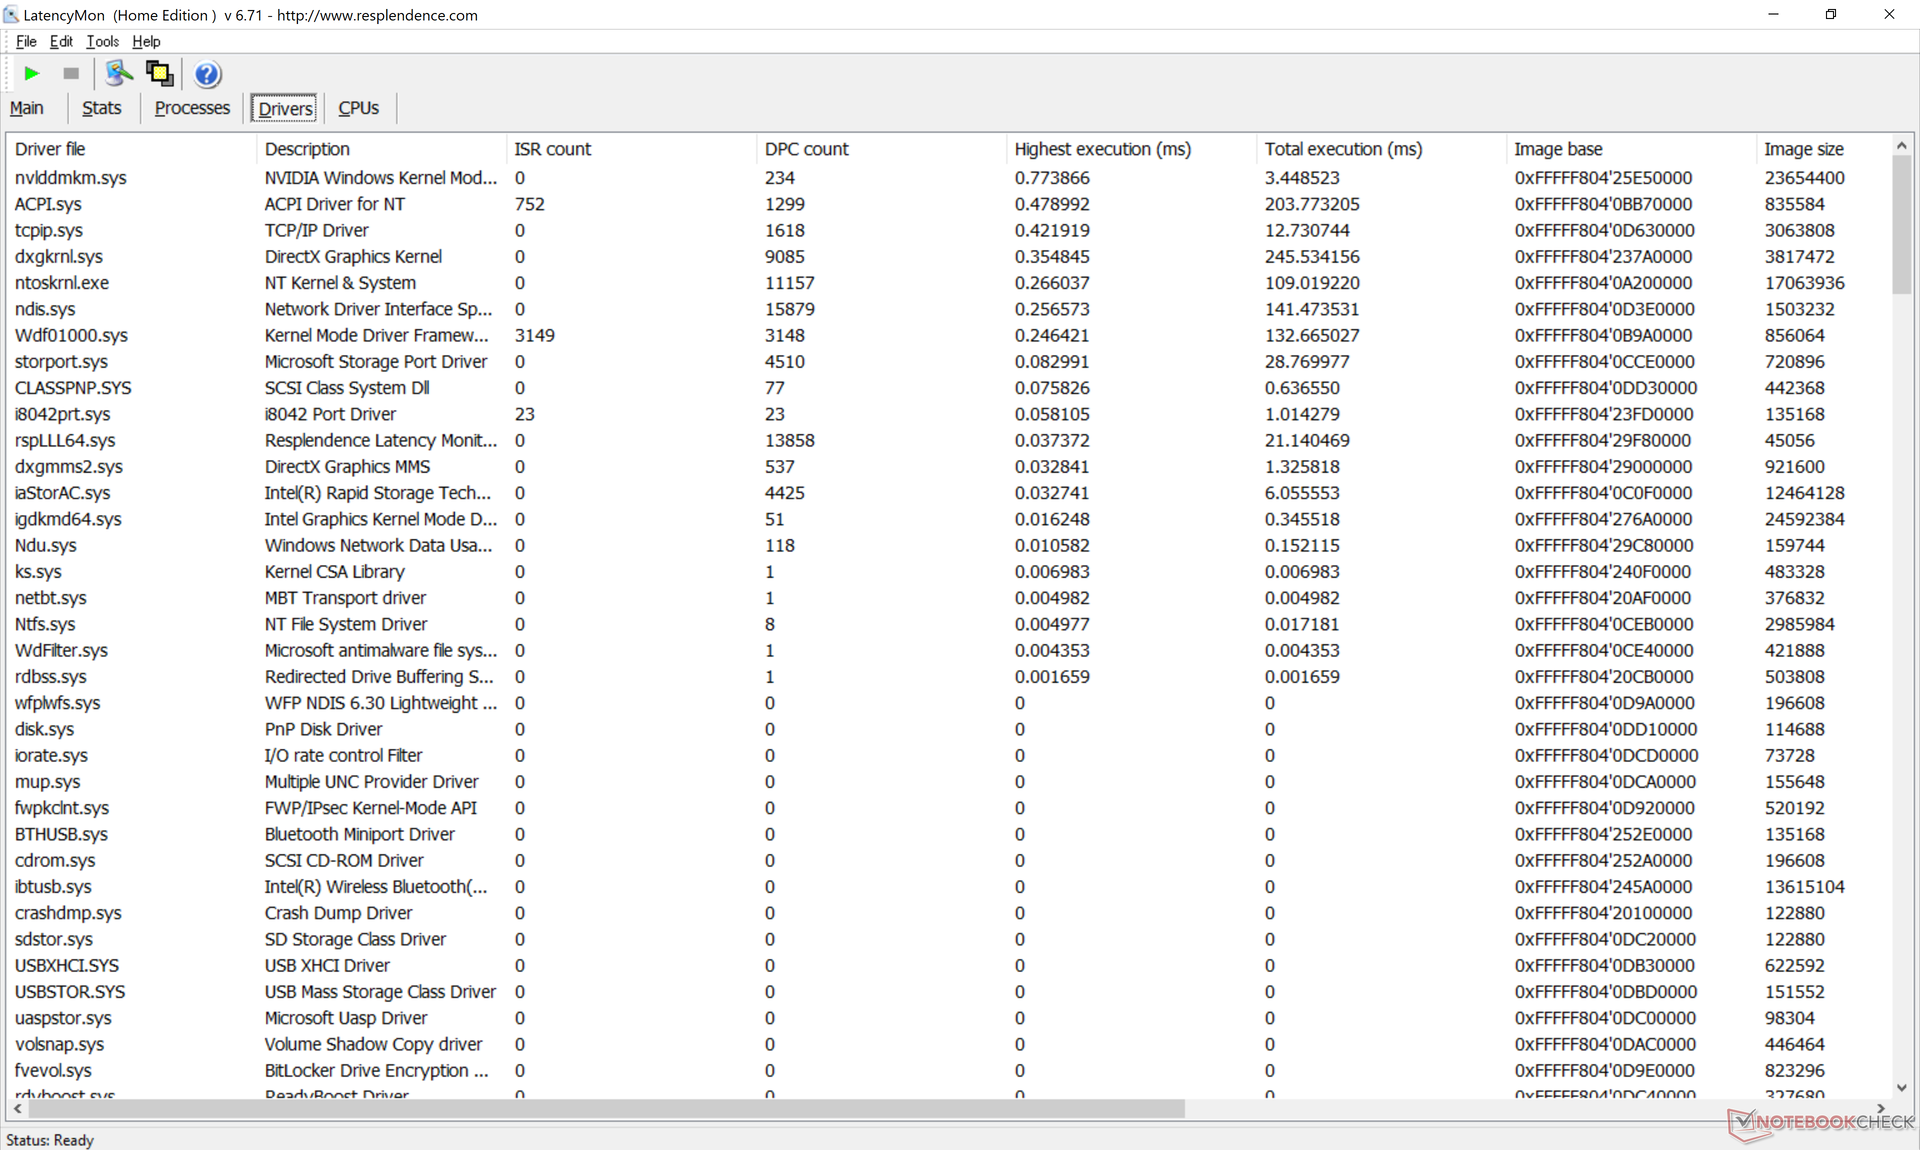
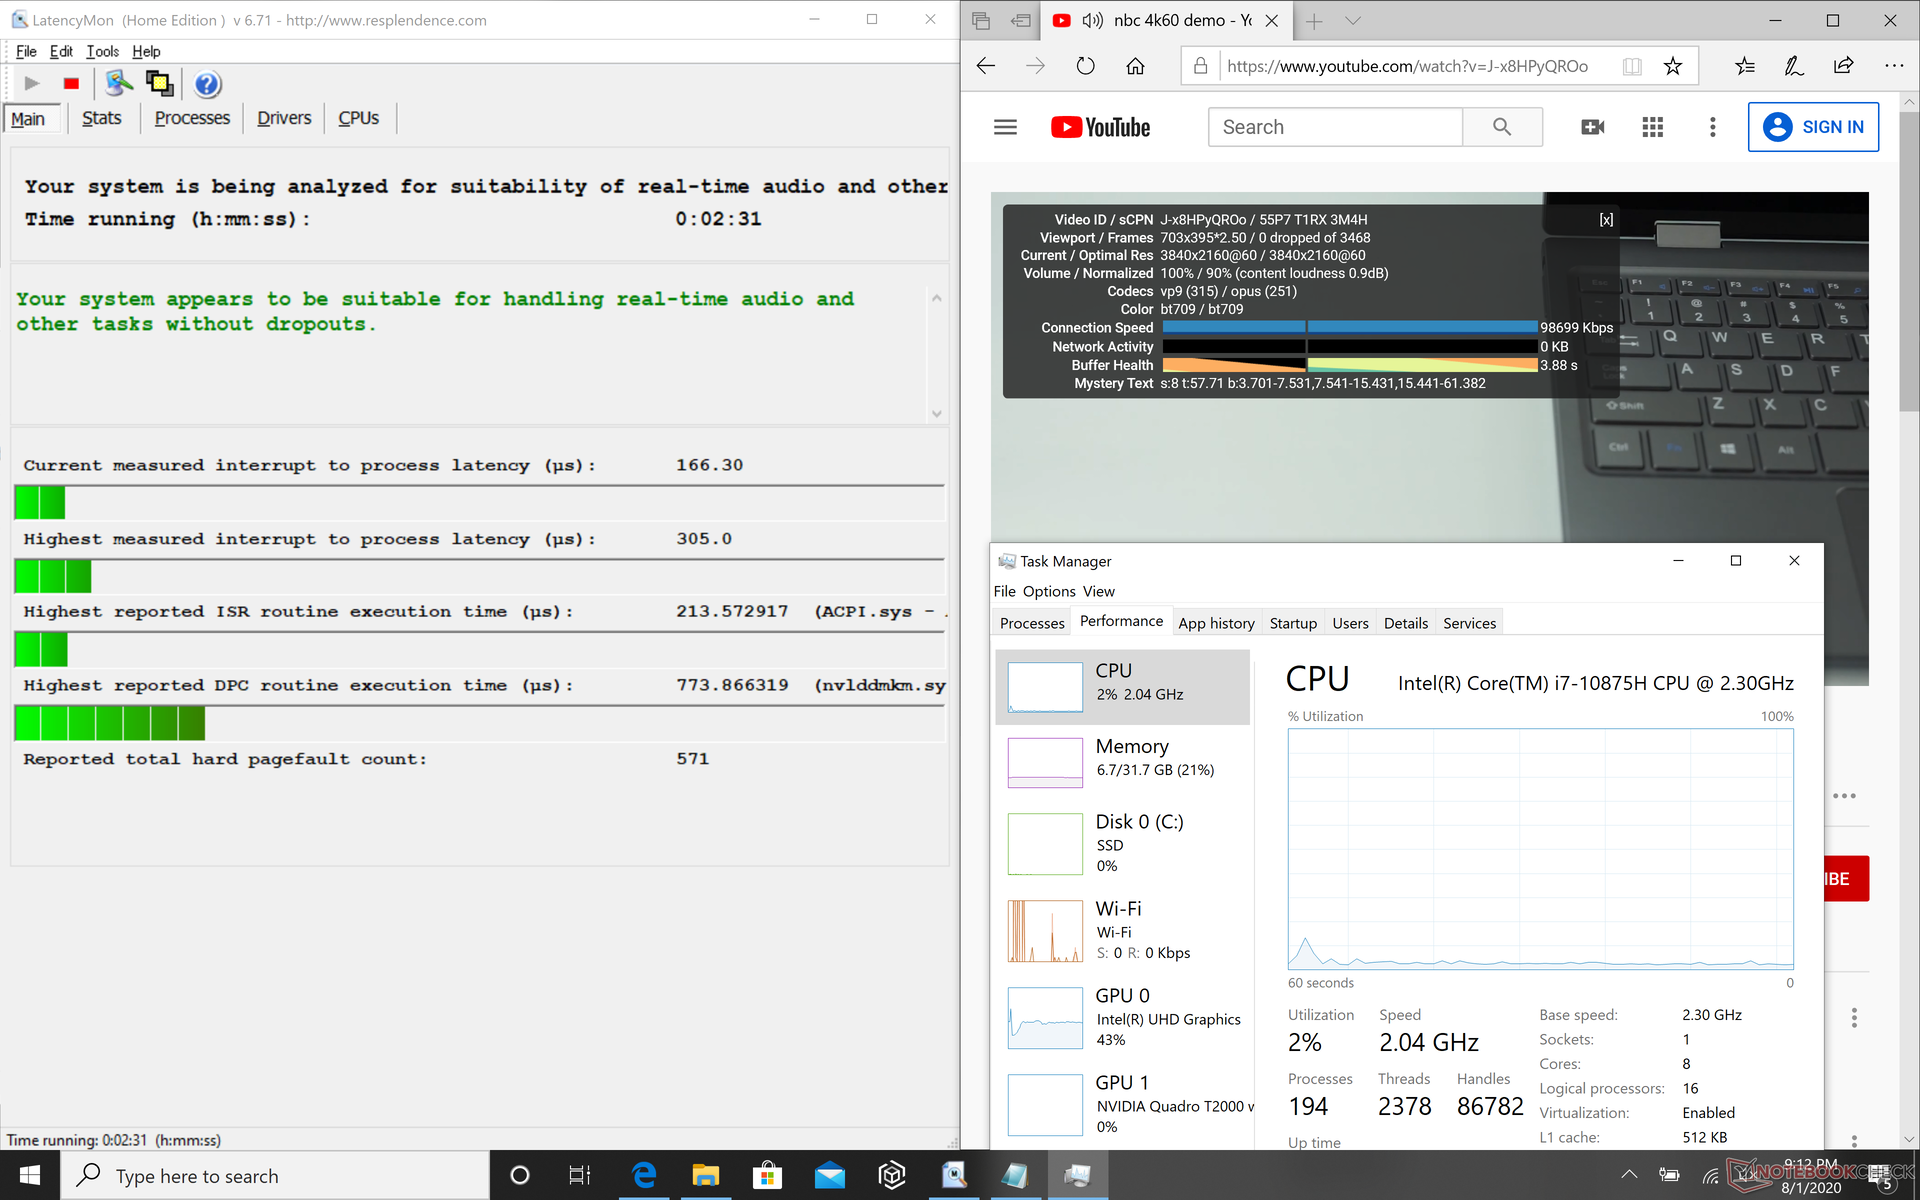
DPC Gecikmesi
LatencyMon, test birimimizde DPC gecikme sorunu olmadığını ve YouTube'da 4K UHD video oynatma işleminin test sırasında kare atlamadan sorunsuz olduğunu ortaya koyuyor.
| DPC Latencies / LatencyMon - interrupt to process latency (max), Web, Youtube, Prime95 | |
| Dell XPS 15 9500 Core i7 4K UHD | |
| Asus ROG Zephyrus Duo 15 GX550LXS | |
| Dell XPS 15 9500 Core i5 | |
| Acer ConceptD 3 Pro CN315-71P-73W1 | |
| Razer Blade 15 Studio Edition 2020 | |
| Eluktronics RP-15 | |
| Dell Precision 5550 P91F | |
* ... daha küçük daha iyidir
Depolama aygıtları
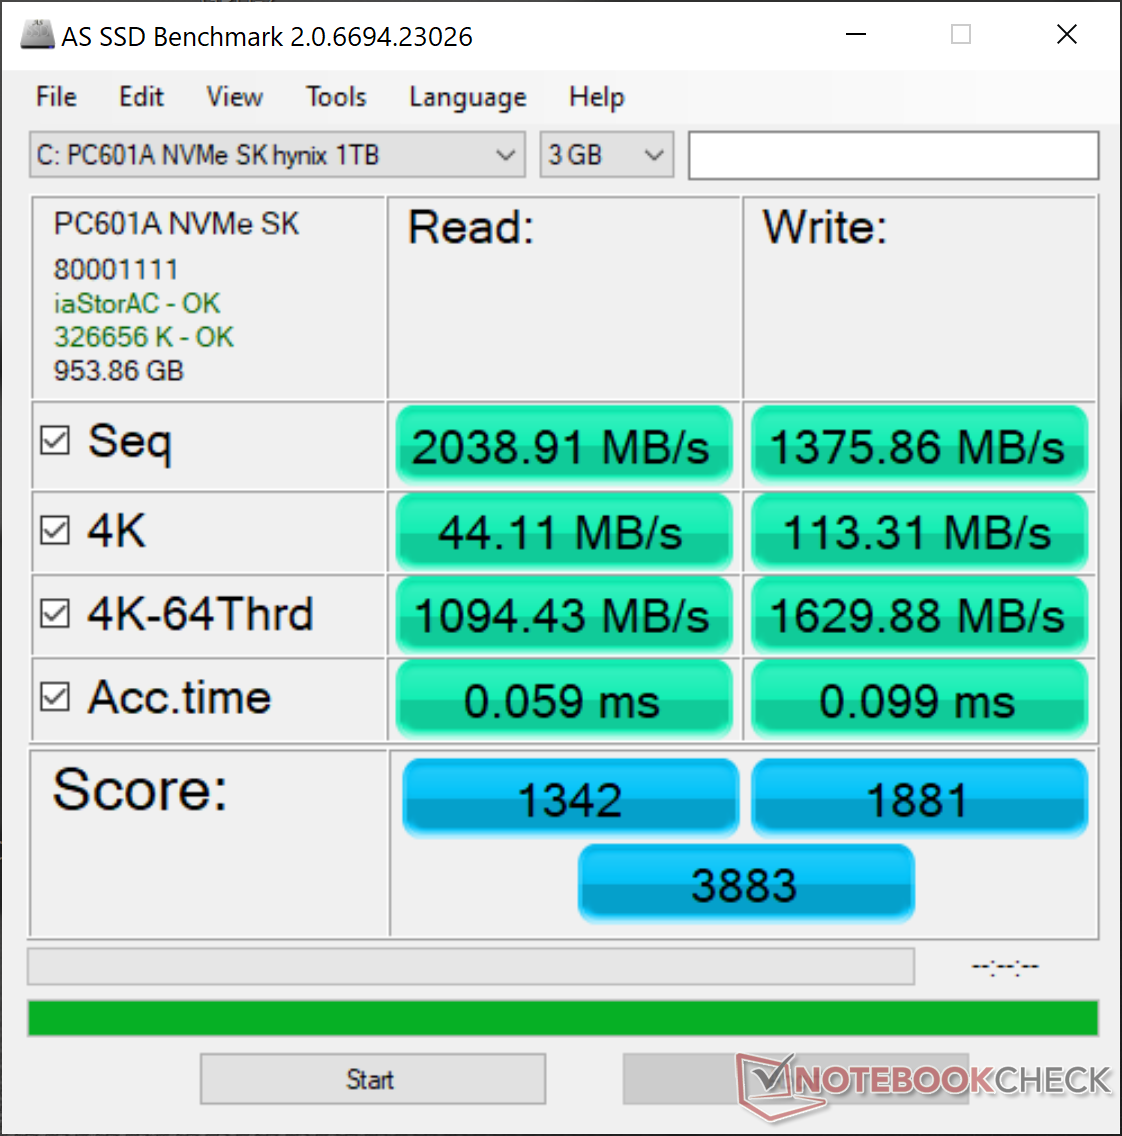
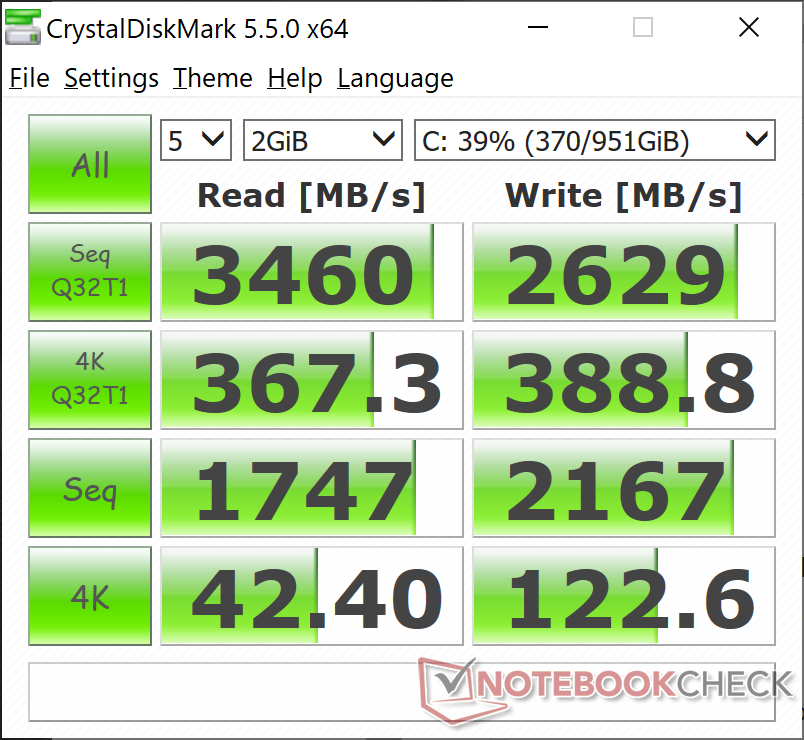
Ünitemiz, daha yaygın olan PC601'in aksine 1 TB SK Hynix PC601A NVMe SSD ile birlikte gelir. CrystalDiskMark sonuçları, geçen yılki Alienware m15 R2'de bulunan RAID 0'da 512 GB PC601'de kaydettiklerimize yakın. Optimum koşullar altında maksimum 3400 MB / sn disk okumasına ulaşabiliyoruz.
| Dell Precision 5550 P91F SK Hynix PC601A NVMe 1TB | Dell Precision 5540 SK hynix PC400 512 GB | Razer Blade 15 Studio Edition 2020 Samsung PM981a MZVLB1T0HBLR | Acer ConceptD 3 Pro CN315-71P-73W1 WDC PC SN720 SDAPNTW-512G | MSI WP65 Samsung SSD PM981 MZVLB512HAJQ | |
|---|---|---|---|---|---|
| AS SSD | -14% | 10% | 4% | 8% | |
| Seq Read (MB/s) | 2039 | 1743 -15% | 1982 -3% | 2973 46% | 1097 -46% |
| Seq Write (MB/s) | 1376 | 930 -32% | 2252 64% | 2429 77% | 1838 34% |
| 4K Read (MB/s) | 44.11 | 39.1 -11% | 47.13 7% | 24.7 -44% | 52.9 20% |
| 4K Write (MB/s) | 113.3 | 92.1 -19% | 88.2 -22% | 115.3 2% | 108.4 -4% |
| 4K-64 Read (MB/s) | 1094 | 956 -13% | 1481 35% | 1243 14% | 1509 38% |
| 4K-64 Write (MB/s) | 1630 | 863 -47% | 1842 13% | 835 -49% | 1695 4% |
| Access Time Read * (ms) | 0.059 | 0.074 -25% | 0.087 -47% | 0.067 -14% | |
| Access Time Write * (ms) | 0.99 | 0.053 95% | 0.04 96% | 0.034 97% | 0.103 90% |
| Score Read (Points) | 1342 | 1170 -13% | 1726 29% | 1565 17% | 1671 25% |
| Score Write (Points) | 1881 | 1048 -44% | 2155 15% | 1193 -37% | 1988 6% |
| Score Total (Points) | 3883 | 2781 -28% | 4781 23% | 3525 -9% | 4558 17% |
| Copy ISO MB/s (MB/s) | 2489 | 1982 -20% | 2136 -14% | 1800 -28% | |
| Copy Program MB/s (MB/s) | 682 | 501 -27% | 489.6 -28% | 569 -17% | |
| Copy Game MB/s (MB/s) | 1515 | 1140 -25% | 1163 -23% | 1409 -7% | |
| CrystalDiskMark 5.2 / 6 | -18% | 14% | -3% | 5% | |
| Write 4K (MB/s) | 122.6 | 98 -20% | 132.9 8% | 113.2 -8% | 126.9 4% |
| Read 4K (MB/s) | 42.4 | 41.25 -3% | 46.73 10% | 31.1 -27% | 44.91 6% |
| Write Seq (MB/s) | 2167 | 1295 -40% | 2214 2% | 2540 17% | 1944 -10% |
| Read Seq (MB/s) | 1747 | 1441 -18% | 2018 16% | 2005 15% | 1449 -17% |
| Write 4K Q32T1 (MB/s) | 388.8 | 429.2 10% | 478.9 23% | 331.4 -15% | 531 37% |
| Read 4K Q32T1 (MB/s) | 367.3 | 400.1 9% | 540 47% | 368.3 0% | 579 58% |
| Write Seq Q32T1 (MB/s) | 2629 | 1366 -48% | 2975 13% | 2535 -4% | 1970 -25% |
| Read Seq Q32T1 (MB/s) | 3460 | 2201 -36% | 3195 -8% | 3427 -1% | 2990 -14% |
| Toplam Ortalama (Program / Ayarlar) | -16% /
-16% | 12% /
11% | 1% /
1% | 7% /
7% |
* ... daha küçük daha iyidir

Disk Throttling: DiskSpd Read Loop, Queue Depth 8
GPU Performansı
Quadro T2000 Max-Q, 3DMark'tan SpecViewPerf'e kadar neredeyse tüm kıyaslamalarda normal Quadro T1000 ile neredeyse aynı şekilde performans gösterir. İlginç bir şekilde, performans söz konusu iş yüküne bağlı olarak eski Quadro P2000'den daha hızlı veya daha yavaş olacaktır.
| 3DMark | |
| 1280x720 Cloud Gate Standard Graphics | |
| Lenovo ThinkPad P53-20QN000YGE | |
| Razer Blade 15 Studio Edition 2020 | |
| Razer Blade 15 Studio Edition | |
| Eluktronics RP-15 | |
| Dell Precision 7540 | |
| Acer ConceptD 3 Pro CN315-71P-73W1 | |
| Apple MacBook Pro 15 2019 i9 Vega 16 | |
| Dell Precision 5540 | |
| Dell Precision 5550 P91F | |
| Dell XPS 15 9500 Core i7 4K UHD | |
| MSI WP65 | |
| Schenker Work 15 | |
| 1920x1080 Fire Strike Graphics | |
| Razer Blade 15 Studio Edition 2020 | |
| Razer Blade 15 Studio Edition | |
| Lenovo ThinkPad P53-20QN000YGE | |
| Eluktronics RP-15 | |
| Dell XPS 15 9500 Core i7 4K UHD | |
| Acer ConceptD 3 Pro CN315-71P-73W1 | |
| Dell Precision 5550 P91F | |
| Dell Precision 5540 | |
| Apple MacBook Pro 15 2019 i9 Vega 16 | |
| MSI WP65 | |
| Schenker Work 15 | |
| 2560x1440 Time Spy Graphics | |
| Razer Blade 15 Studio Edition 2020 | |
| Razer Blade 15 Studio Edition | |
| Lenovo ThinkPad P53-20QN000YGE | |
| Eluktronics RP-15 | |
| Dell Precision 7540 | |
| Dell XPS 15 9500 Core i7 4K UHD | |
| Acer ConceptD 3 Pro CN315-71P-73W1 | |
| Dell Precision 5550 P91F | |
| Dell Precision 5540 | |
| Apple MacBook Pro 15 2019 i9 Vega 16 | |
| MSI WP65 | |
| Schenker Work 15 | |
| 3DMark 11 | |
| 1280x720 Performance GPU | |
| Razer Blade 15 Studio Edition 2020 | |
| Razer Blade 15 Studio Edition | |
| Lenovo ThinkPad P53-20QN000YGE | |
| Eluktronics RP-15 | |
| Dell XPS 15 9500 Core i7 4K UHD | |
| Acer ConceptD 3 Pro CN315-71P-73W1 | |
| Dell Precision 5540 | |
| Dell Precision 5550 P91F | |
| Apple MacBook Pro 15 2019 i9 Vega 16 | |
| MSI WP65 | |
| Schenker Work 15 | |
| 1280x720 Performance Combined | |
| Eluktronics RP-15 | |
| Dell XPS 15 9500 Core i7 4K UHD | |
| Lenovo ThinkPad P53-20QN000YGE | |
| Razer Blade 15 Studio Edition 2020 | |
| Dell Precision 5550 P91F | |
| Razer Blade 15 Studio Edition | |
| Acer ConceptD 3 Pro CN315-71P-73W1 | |
| Dell Precision 5540 | |
| Apple MacBook Pro 15 2019 i9 Vega 16 | |
| MSI WP65 | |
| Schenker Work 15 | |
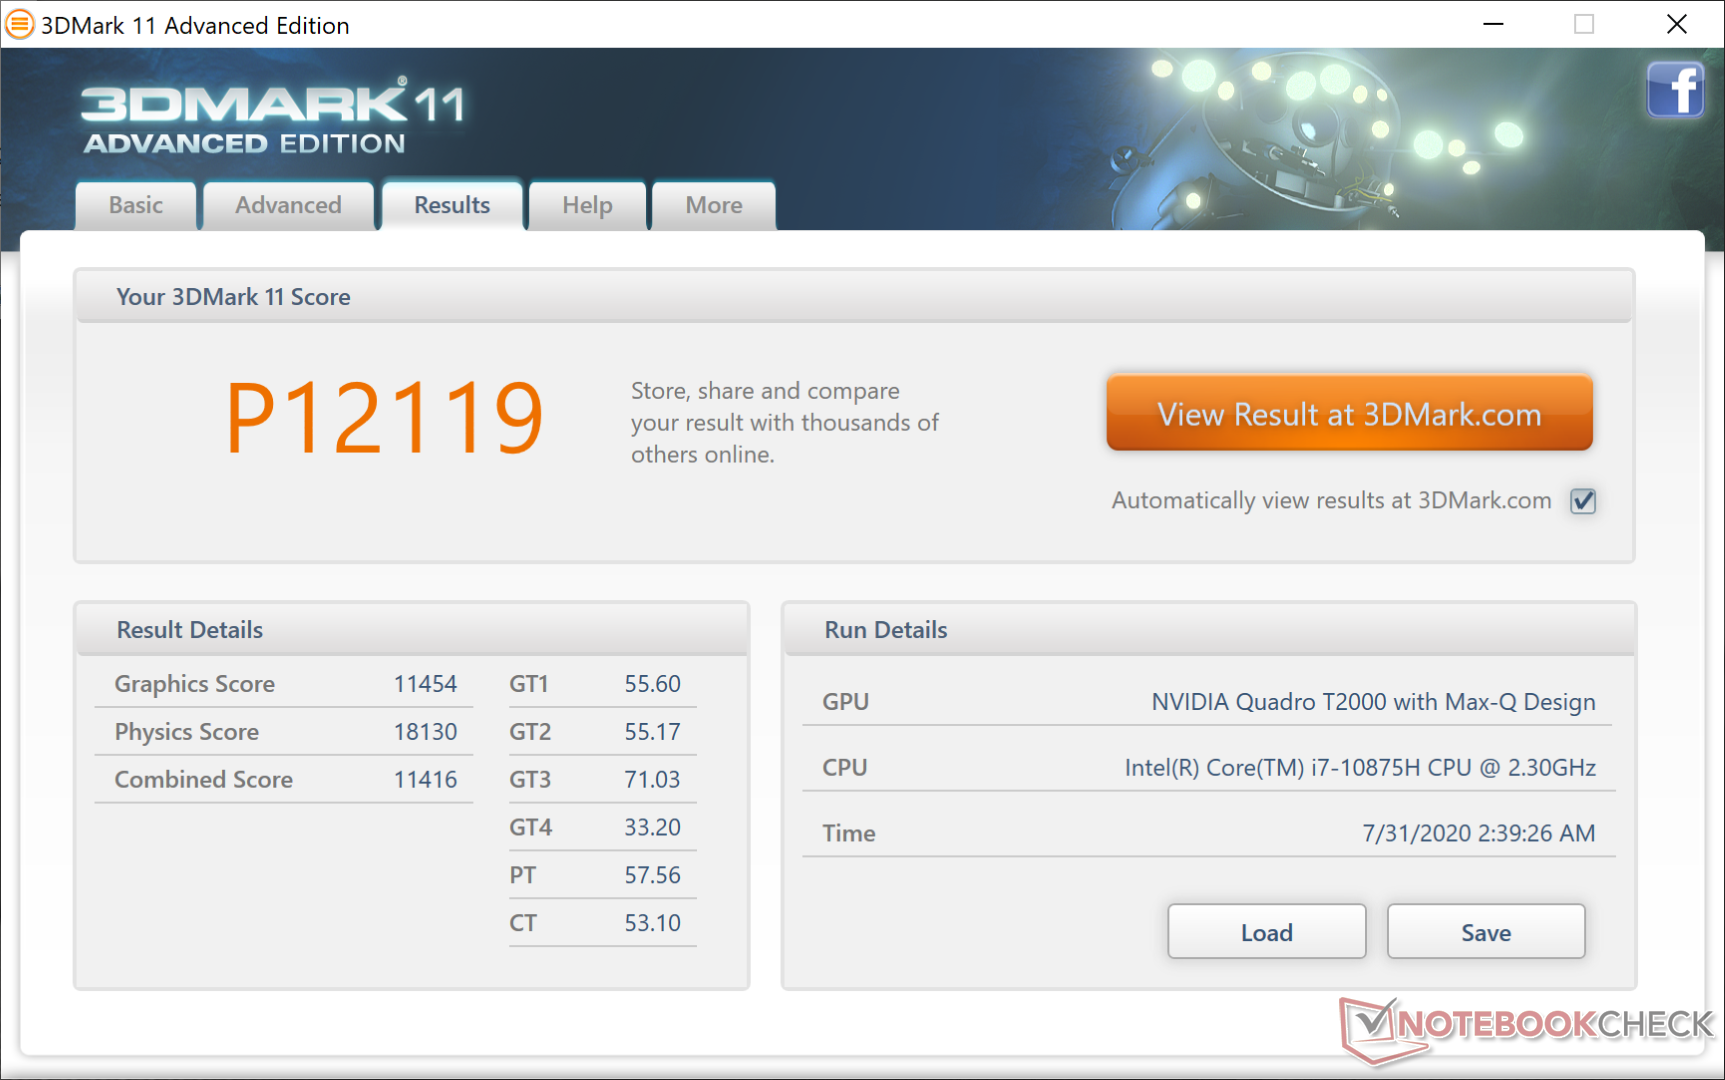
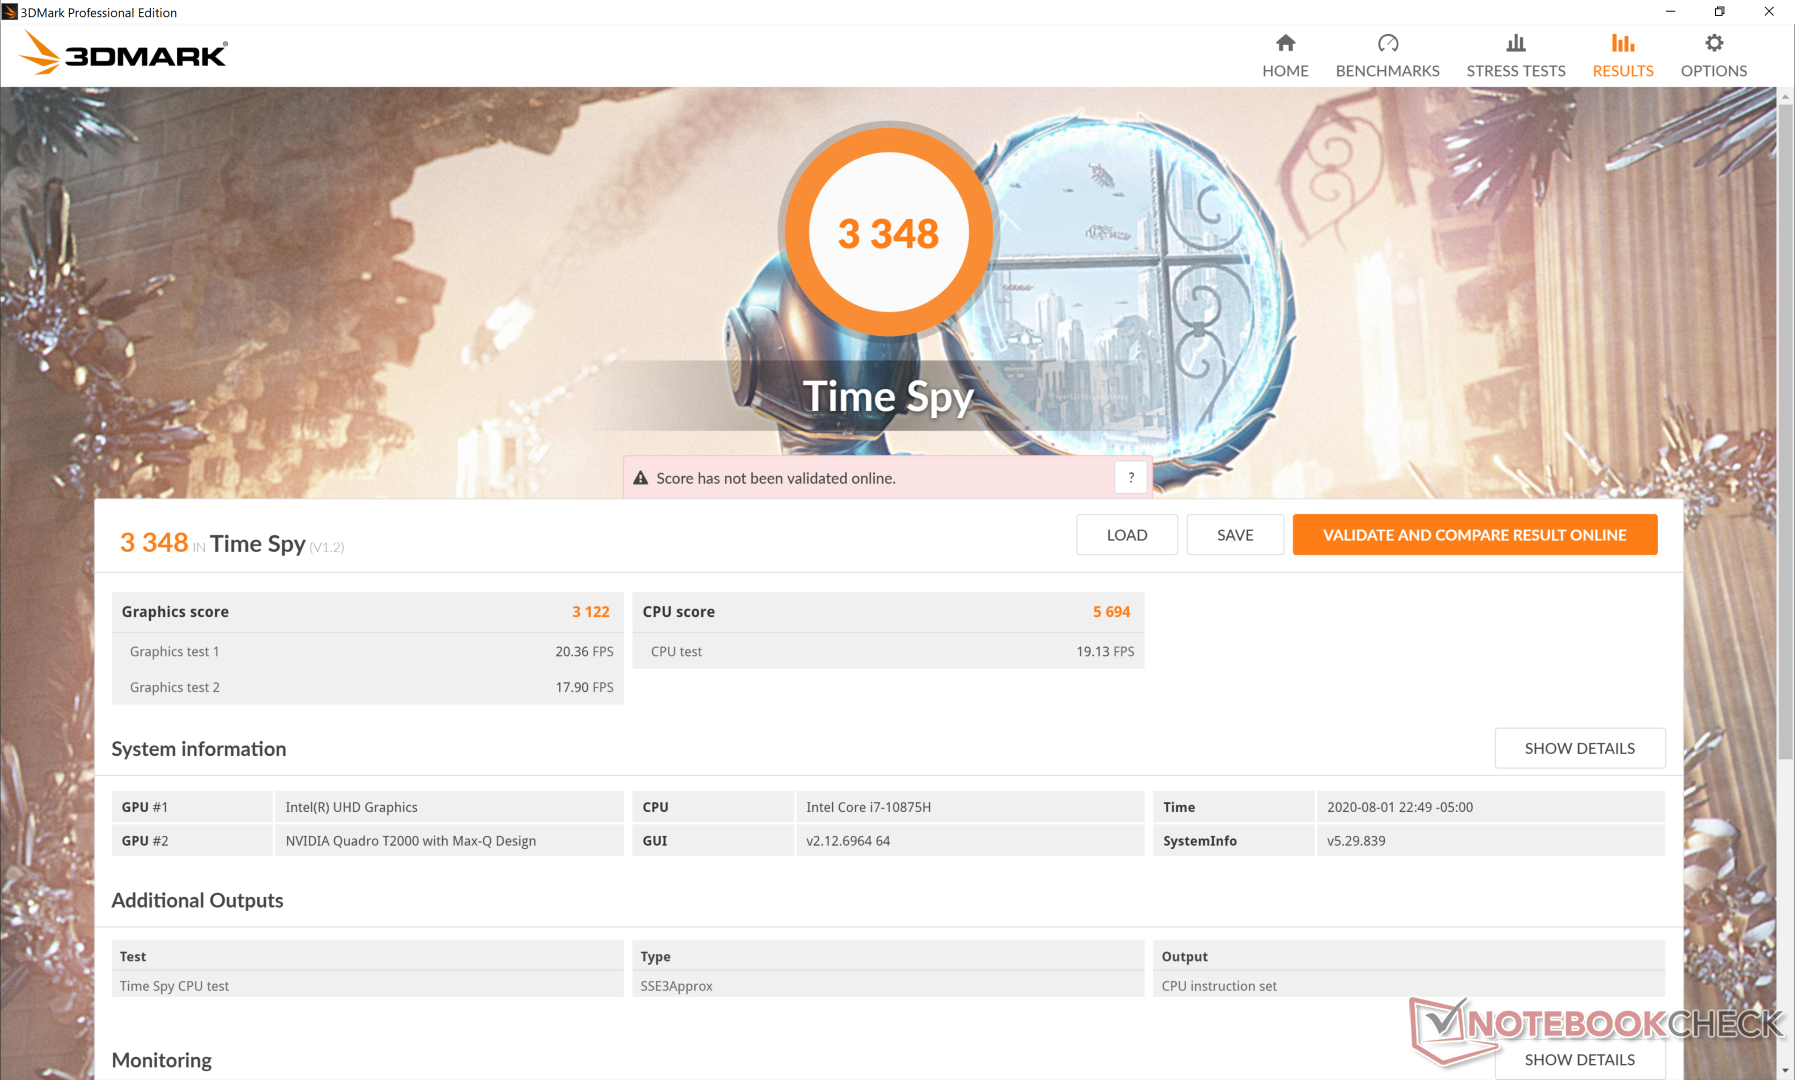
| 3DMark 11 Performance | 12119 puan | |
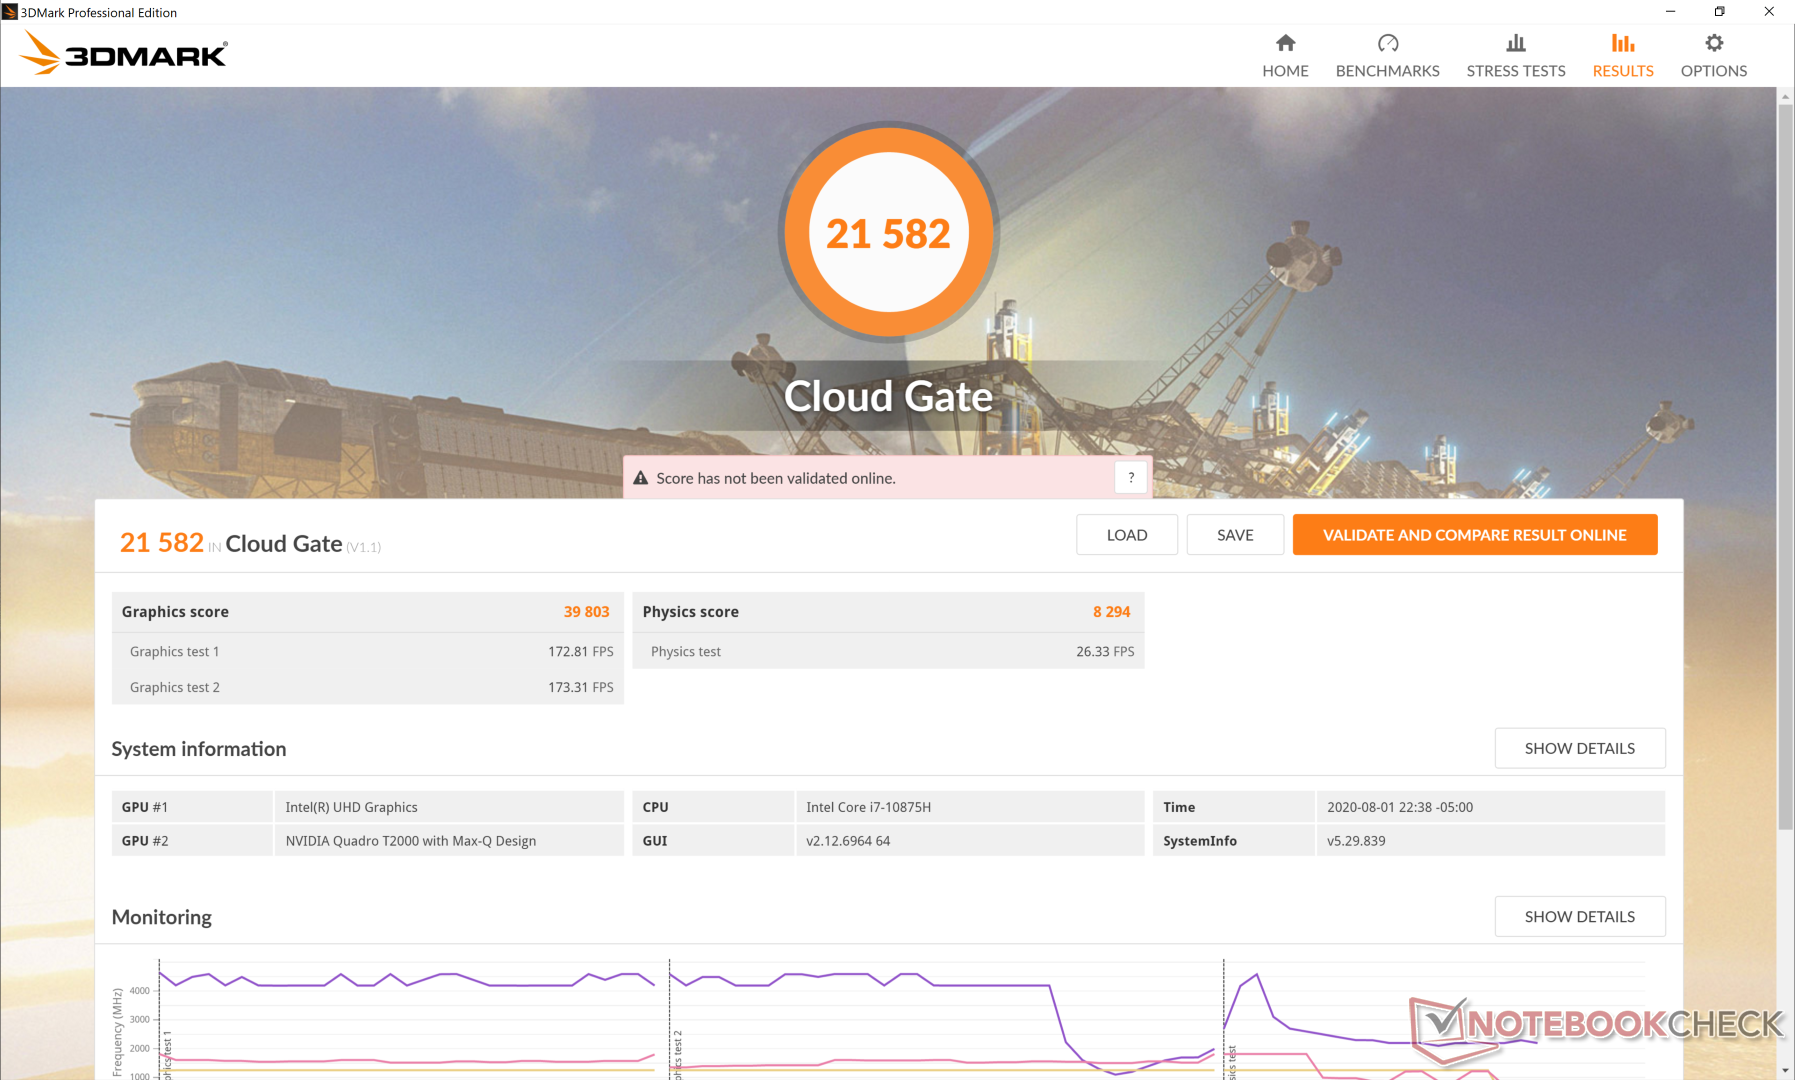
| 3DMark Cloud Gate Standard Score | 21582 puan | |
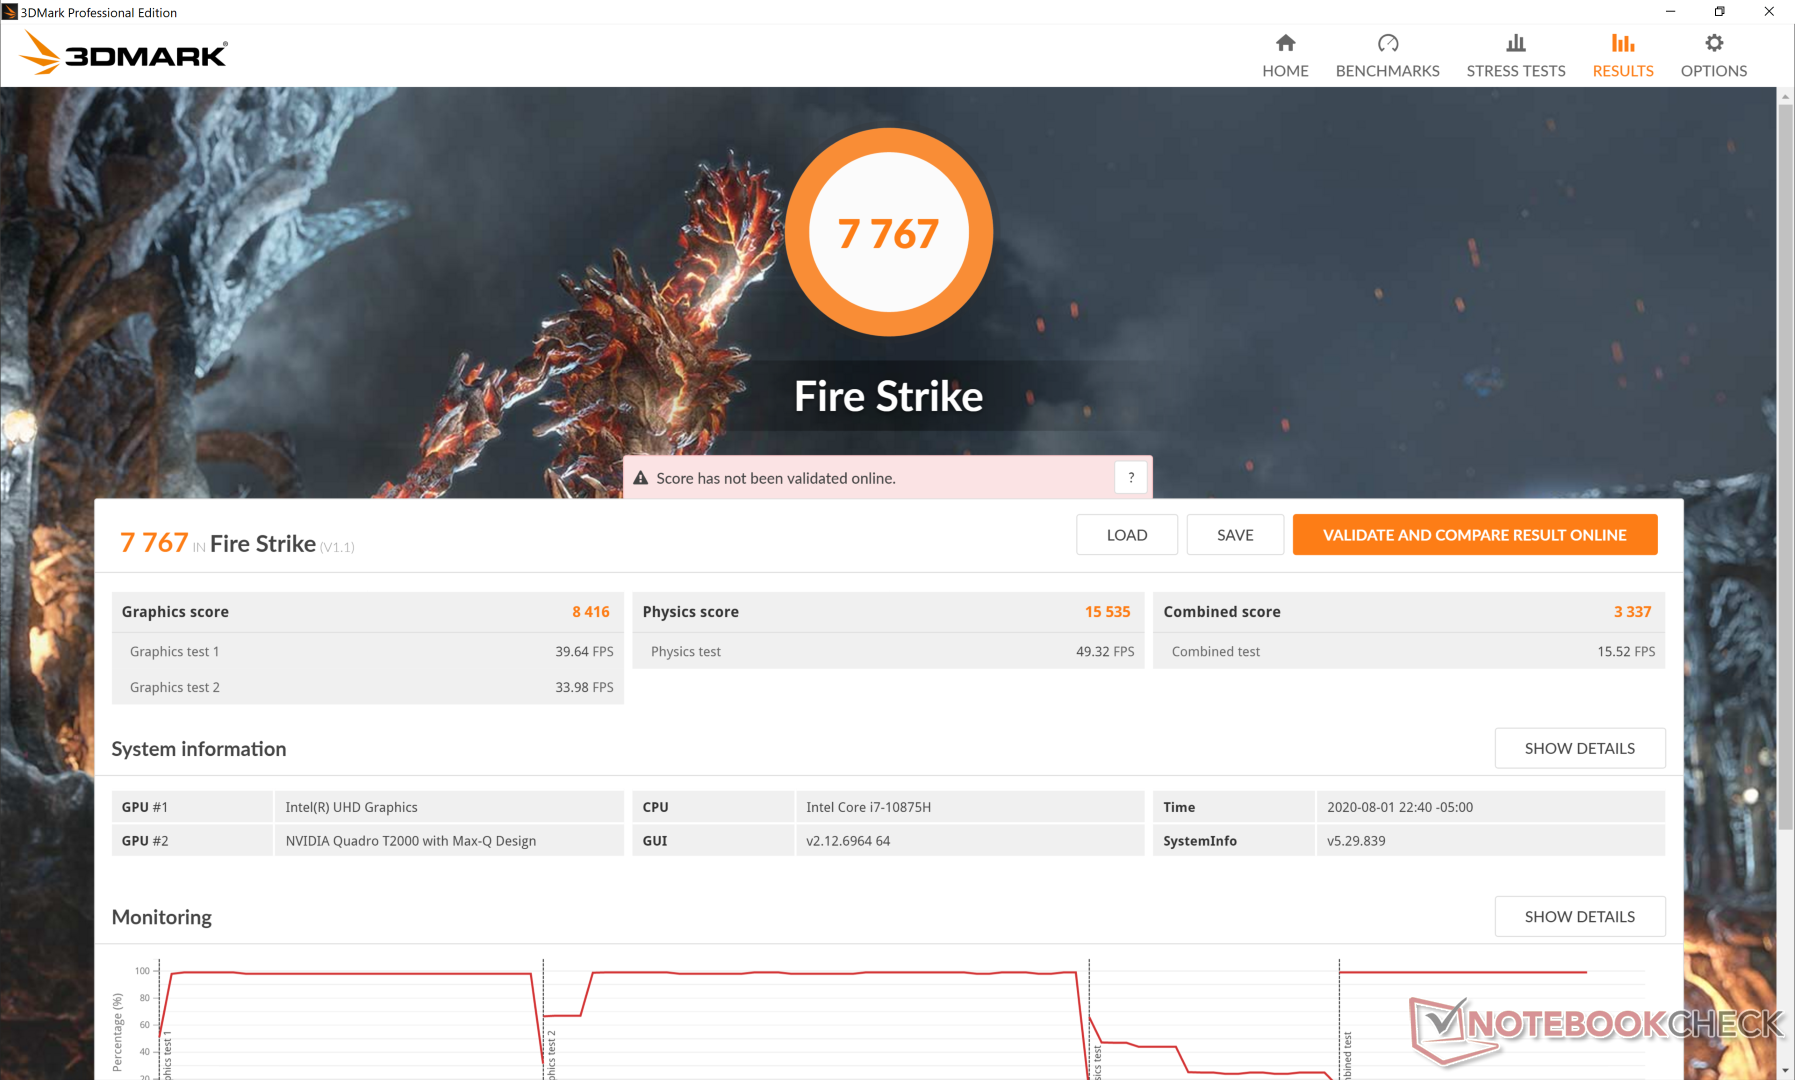
| 3DMark Fire Strike Score | 7767 puan | |
| 3DMark Time Spy Score | 3348 puan | |
Yardım | ||
| düşük | orta | yüksek | ultra | QHD | 4K | |
|---|---|---|---|---|---|---|
| The Witcher 3 (2015) | 181 | 107.6 | 62.5 | 33.4 | ||
| Dota 2 Reborn (2015) | 153 | 140 | 130 | 118 | 47.9 | |
| Final Fantasy XV Benchmark (2018) | 91 | 48.5 | 36.8 | 25.7 | 13.7 | |
| X-Plane 11.11 (2018) | 91.9 | 76 | 64.8 | 47.2 | ||
| Shadow of the Tomb Raider (2018) | 101 | 56 | 48 | 42 | ||
| Assassin´s Creed Odyssey (2018) | 71 | 53 | 45 | 25 | ||
| Apex Legends (2019) | 144 | 86.4 | 72.7 | 64.9 | ||
| Far Cry New Dawn (2019) | 83 | 58 | 55 | 50 | ||
| Metro Exodus (2019) | 91.5 | 41.74 | 31.2 | 24.6 | ||
| Dirt Rally 2.0 (2019) | 271 | 86.1 | 69.9 | 40.3 | ||
| Total War: Three Kingdoms (2019) | 148.4 | 60.3 | 36.3 | 24.4 | ||
| Control (2019) | 120.2 | 40.4 | 28.3 | |||
| Borderlands 3 (2019) | 123.4 | 56 | 35.8 | 27.3 | ||
| GRID 2019 (2019) | 179 | 94.7 | 77.7 | 51 | ||
| Star Wars Jedi Fallen Order (2019) | 64.2 | 53.1 | 47 | |||
| Hunt Showdown (2020) | 141.3 | 50.3 | 44.5 | |||
| Doom Eternal (2020) | 147.4 | 85.5 | 58.1 | |||
| Gears Tactics (2020) | 263.3 | 77.5 | 47.6 | 35.1 | ||
| F1 2020 (2020) | 182 | 96 | 78 | 55 |
Emisyonlar
Sistem Gürültüsü
Web'de gezinirken veya kelime işlem yaparken sessiz olsa da, daha yüksek yükler, oyun dizüstü bilgisayarlarına daha çok benzeyen 40 dB (A) ila 50 dB (A) aralığında çok daha yüksek bir fan gürültüsüne neden olur. İş yükleriniz için en iyi olanı bulmak için Dell Power Manager yazılımı aracılığıyla fan ve performans ayarlarıyla uğraşmak isteyeceksiniz.
| Dell Precision 5550 P91F Quadro T2000 Max-Q, i7-10875H, SK Hynix PC601A NVMe 1TB | Dell Precision 5540 Quadro T2000 Max-Q, i9-9980HK, SK hynix PC400 512 GB | Razer Blade 15 Studio Edition 2020 Quadro RTX 5000 Max-Q, i7-10875H, Samsung PM981a MZVLB1T0HBLR | Acer ConceptD 3 Pro CN315-71P-73W1 Quadro T1000 (Laptop), i7-9750H, WDC PC SN720 SDAPNTW-512G | Lenovo ThinkPad P53-20QN000YGE Quadro RTX 5000 Max-Q, i7-9850H, Samsung PM981a MZVLB1T0HBLR | MSI WP65 Quadro P620, i7-9750H, Samsung SSD PM981 MZVLB512HAJQ | |
|---|---|---|---|---|---|---|
| Noise | 2% | -11% | -7% | 3% | -15% | |
| kapalı / ortam * (dB) | 26.2 | 28.6 -9% | 30.1 -15% | 31.2 -19% | 28.3 -8% | 28.7 -10% |
| Idle Minimum * (dB) | 26.2 | 28.6 -9% | 30.1 -15% | 31.2 -19% | 28.3 -8% | 33.4 -27% |
| Idle Average * (dB) | 26.2 | 28.6 -9% | 30.1 -15% | 31.2 -19% | 28.3 -8% | 33.5 -28% |
| Idle Maximum * (dB) | 26.2 | 28.6 -9% | 30.1 -15% | 31.5 -20% | 28.3 -8% | 33.5 -28% |
| Load Average * (dB) | 39.2 | 33.3 15% | 42.3 -8% | 38.4 2% | 29.8 24% | 37 6% |
| Witcher 3 ultra * (dB) | 39 | 34.7 11% | 48.2 -24% | 36.9 5% | 38.3 2% | 38.7 1% |
| Load Maximum * (dB) | 50.6 | 38 25% | 42.1 17% | 41.2 19% | 38.3 24% | 59.5 -18% |
* ... daha küçük daha iyidir
Ses yüksekliği
| Boşta |
| 26.2 / 26.2 / 26.2 dB |
| Çalışırken |
| 39.2 / 50.6 dB |
 | ||
30 dB sessiz 40 dB(A) duyulabilirlik 50 dB(A) gürültülü |
||
min: | ||
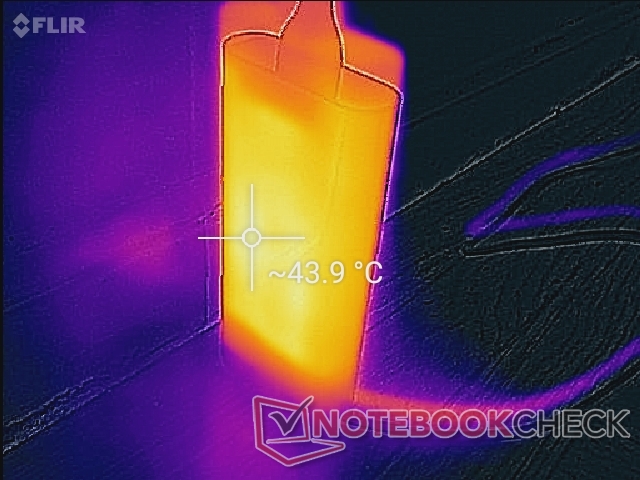
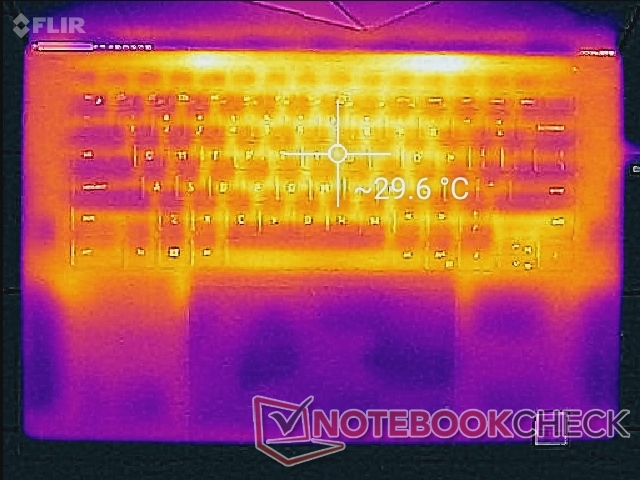
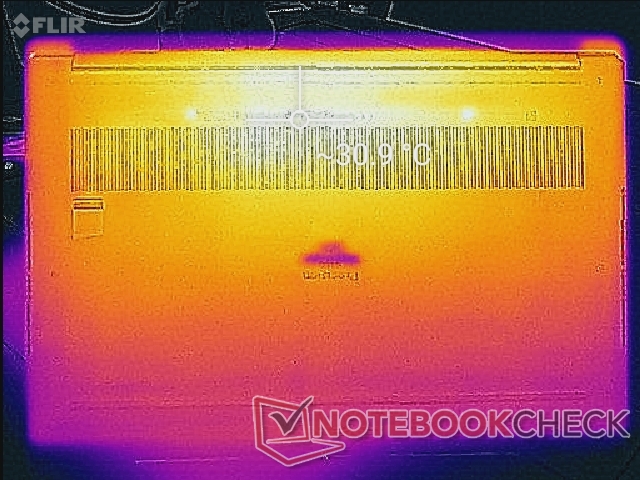
Sıcaklık
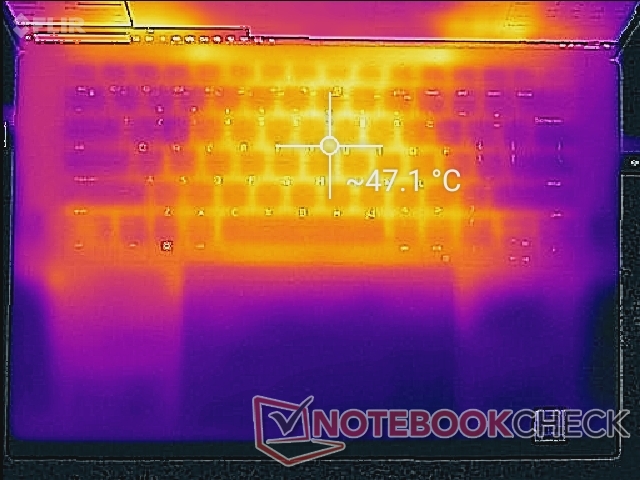
Yüzey sıcaklığı gelişimi büyük ölçüde simetriktir ve yüksek işlem stresi altındayken klavye merkezinde 47 C'yi aşan sıcak noktalar. Sonuçlar, klavyenin 53 C'nin üzerine çıkabildiği Acer ConceptD 3 Pro'da gözlemlediğimizden daha soğuk.
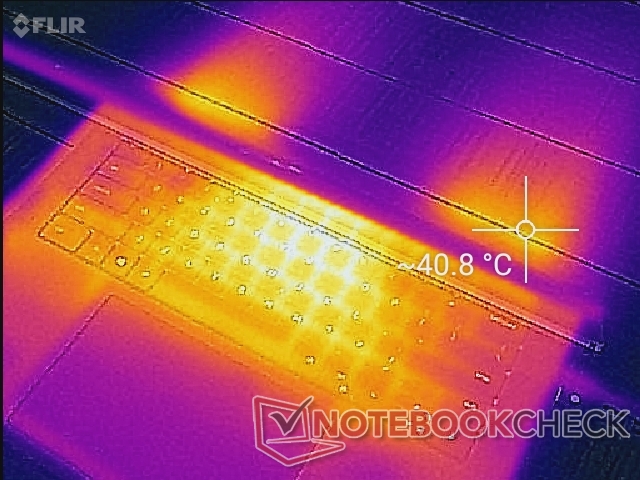
(-) Üst taraftaki maksimum sıcaklık, 38.2 °C / 101 F ortalamasına kıyasla 47 °C / 117 F'dir. , Workstation sınıfı için 22.2 ile 69.8 °C arasında değişir.
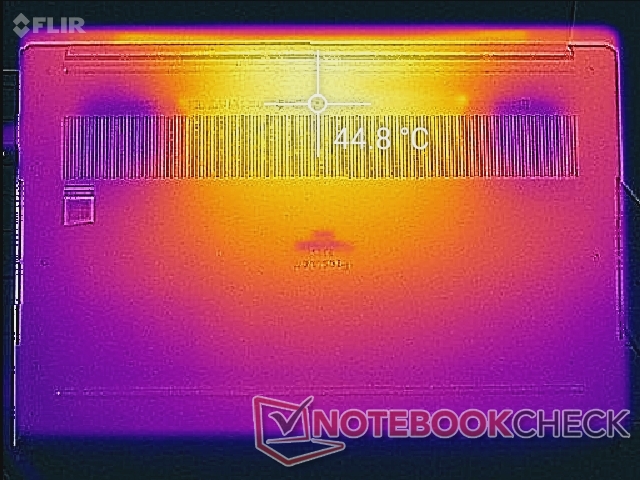
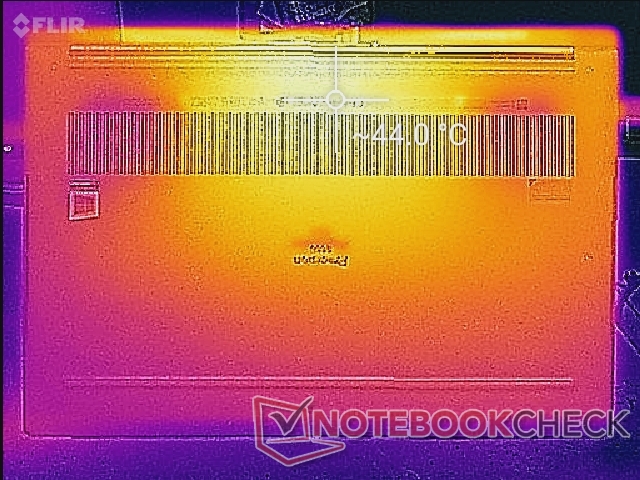
(±) Alt kısım, 41.1 °C / 106 F ortalamasına kıyasla maksimum 44 °C / 111 F'ye kadar ısınır
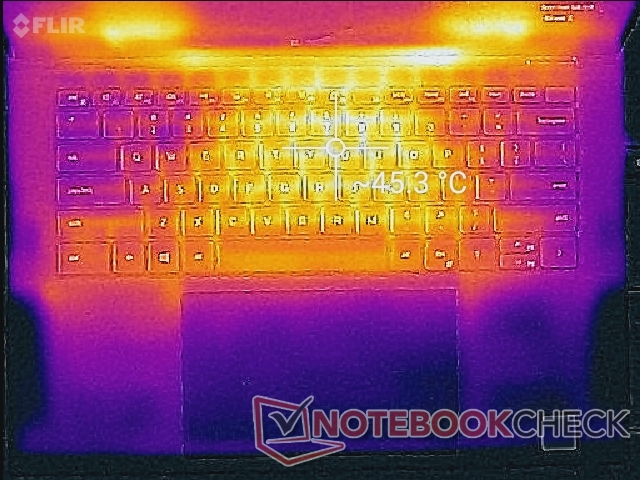
(+) Boşta kullanımda, üst tarafın ortalama sıcaklığı 27.1 °C / 81 F olup, cihazın 32 °C / 90 F.
(±) The Witcher 3 oynarken, üst tarafın ortalama sıcaklığı 35.4 °C / 96 F olup, cihazın 32 °C / 90 F.
(+) Avuç içi dayanakları ve dokunmatik yüzey maksimum (32.2 °C / 90 F) cilt sıcaklığına ulaşıyor ve bu nedenle sıcak değil.
(-) Benzer cihazların avuç içi dayanağı alanının ortalama sıcaklığı 27.8 °C / 82 F (-4.4 °C / -8 F) idi.
Stres testi
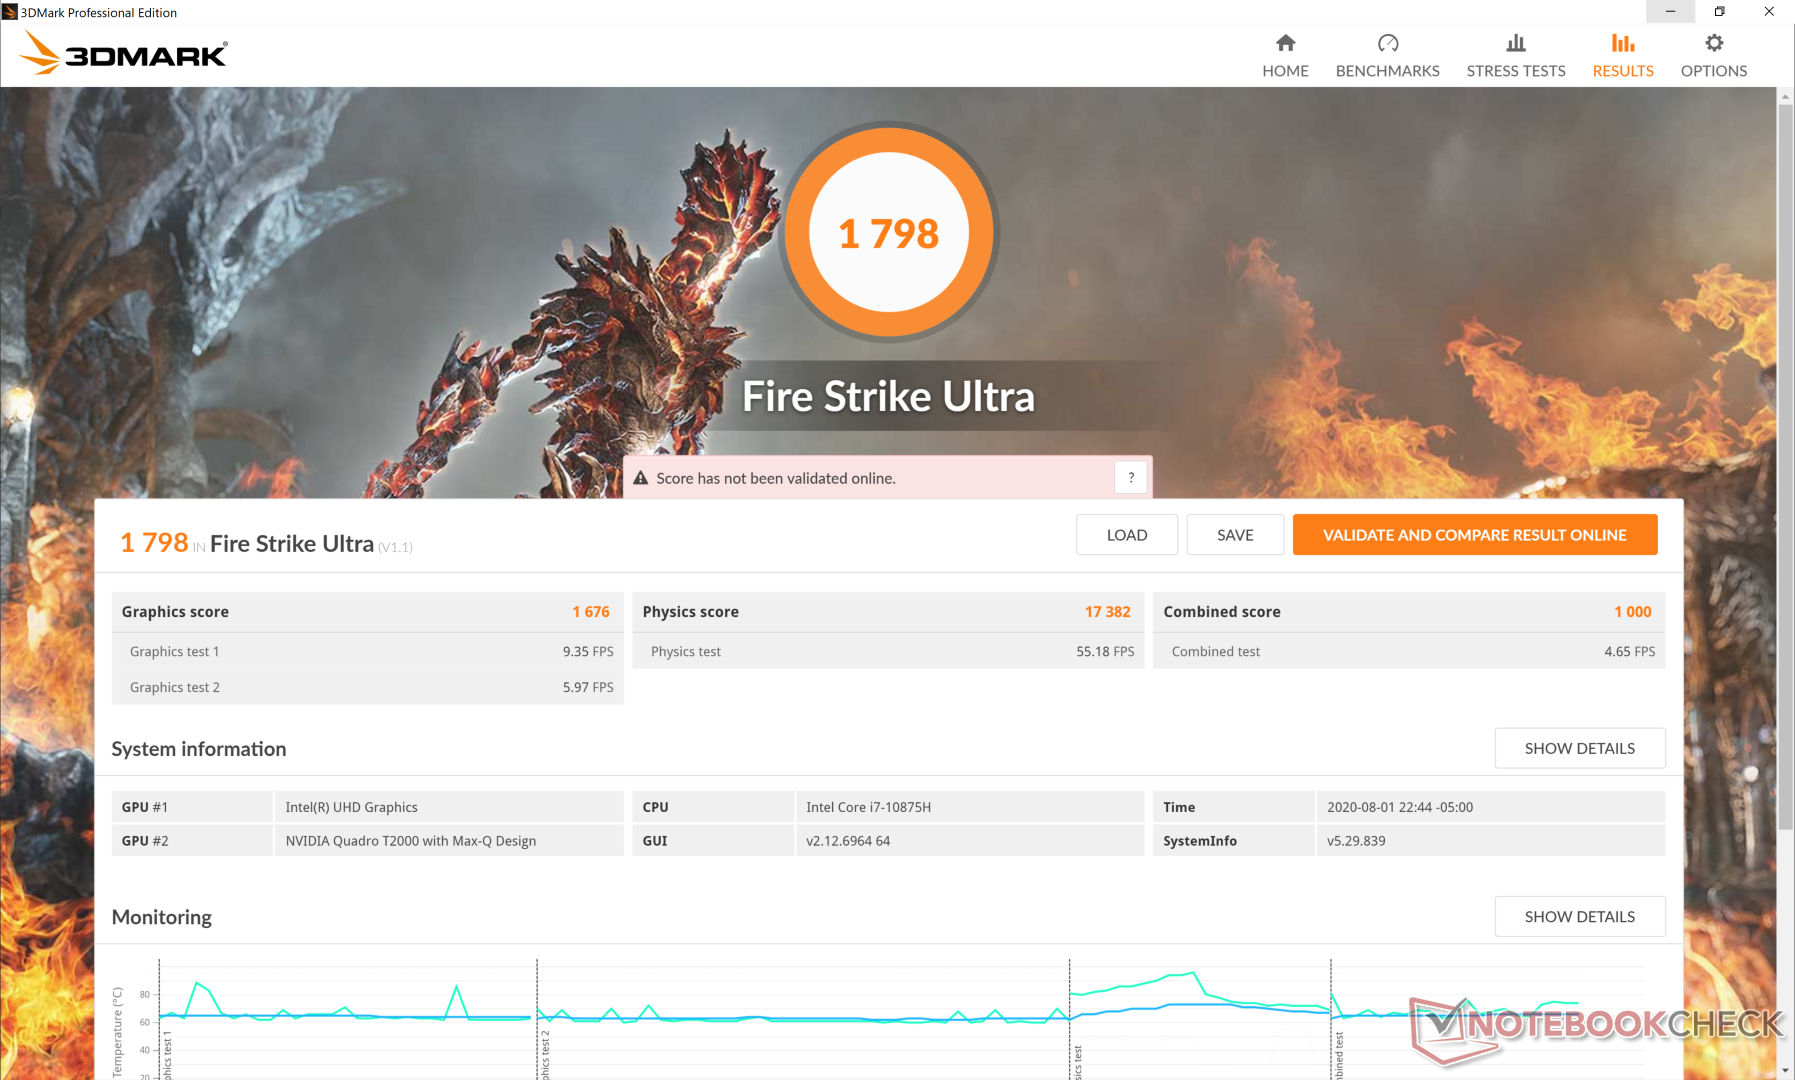
Saat hızı davranışını gözlemlemek için Prime95'i çalıştırırken, CPU, 100 C'lik bir çekirdek sıcaklığa ulaşana kadar ilk birkaç saniye 4.2 GHz'e yükselir. Daha sonra, saat hızları sonraki dakika veya daha önce 3.4 ila 3.5 GHz aralığına düşer. Nihayet 2,8 ila 2,9 GHz aralığında ve 75 C çekirdek sıcaklığında stabilize oluyor. Maksimum Prime95 ve FurMark stresi altındayken, CPU sonunda sadece 1,2 GHz'e düşecek ve bu da kullanıcıların daha muhtemel olduğu bir iş istasyonunda görmek hayal kırıklığı yaratıyor. elde edebilecekleri en yüksek performansı istiyorlar. Pil gücüyle çalışmak grafik performansını sınırlayacaktır. Akülerle yapılan bir Yangın Saldırısı, ana şebekede 15535 ve 8416 puanla karşılaştırıldığında, sırasıyla 20806 ve 6475 puanlık Fizik ve Grafik puanlarını döndürecektir. Pil üzerindeki daha yüksek CPU numaraları, testten önceki daha soğuk bir CPU durumunun sonucudur.
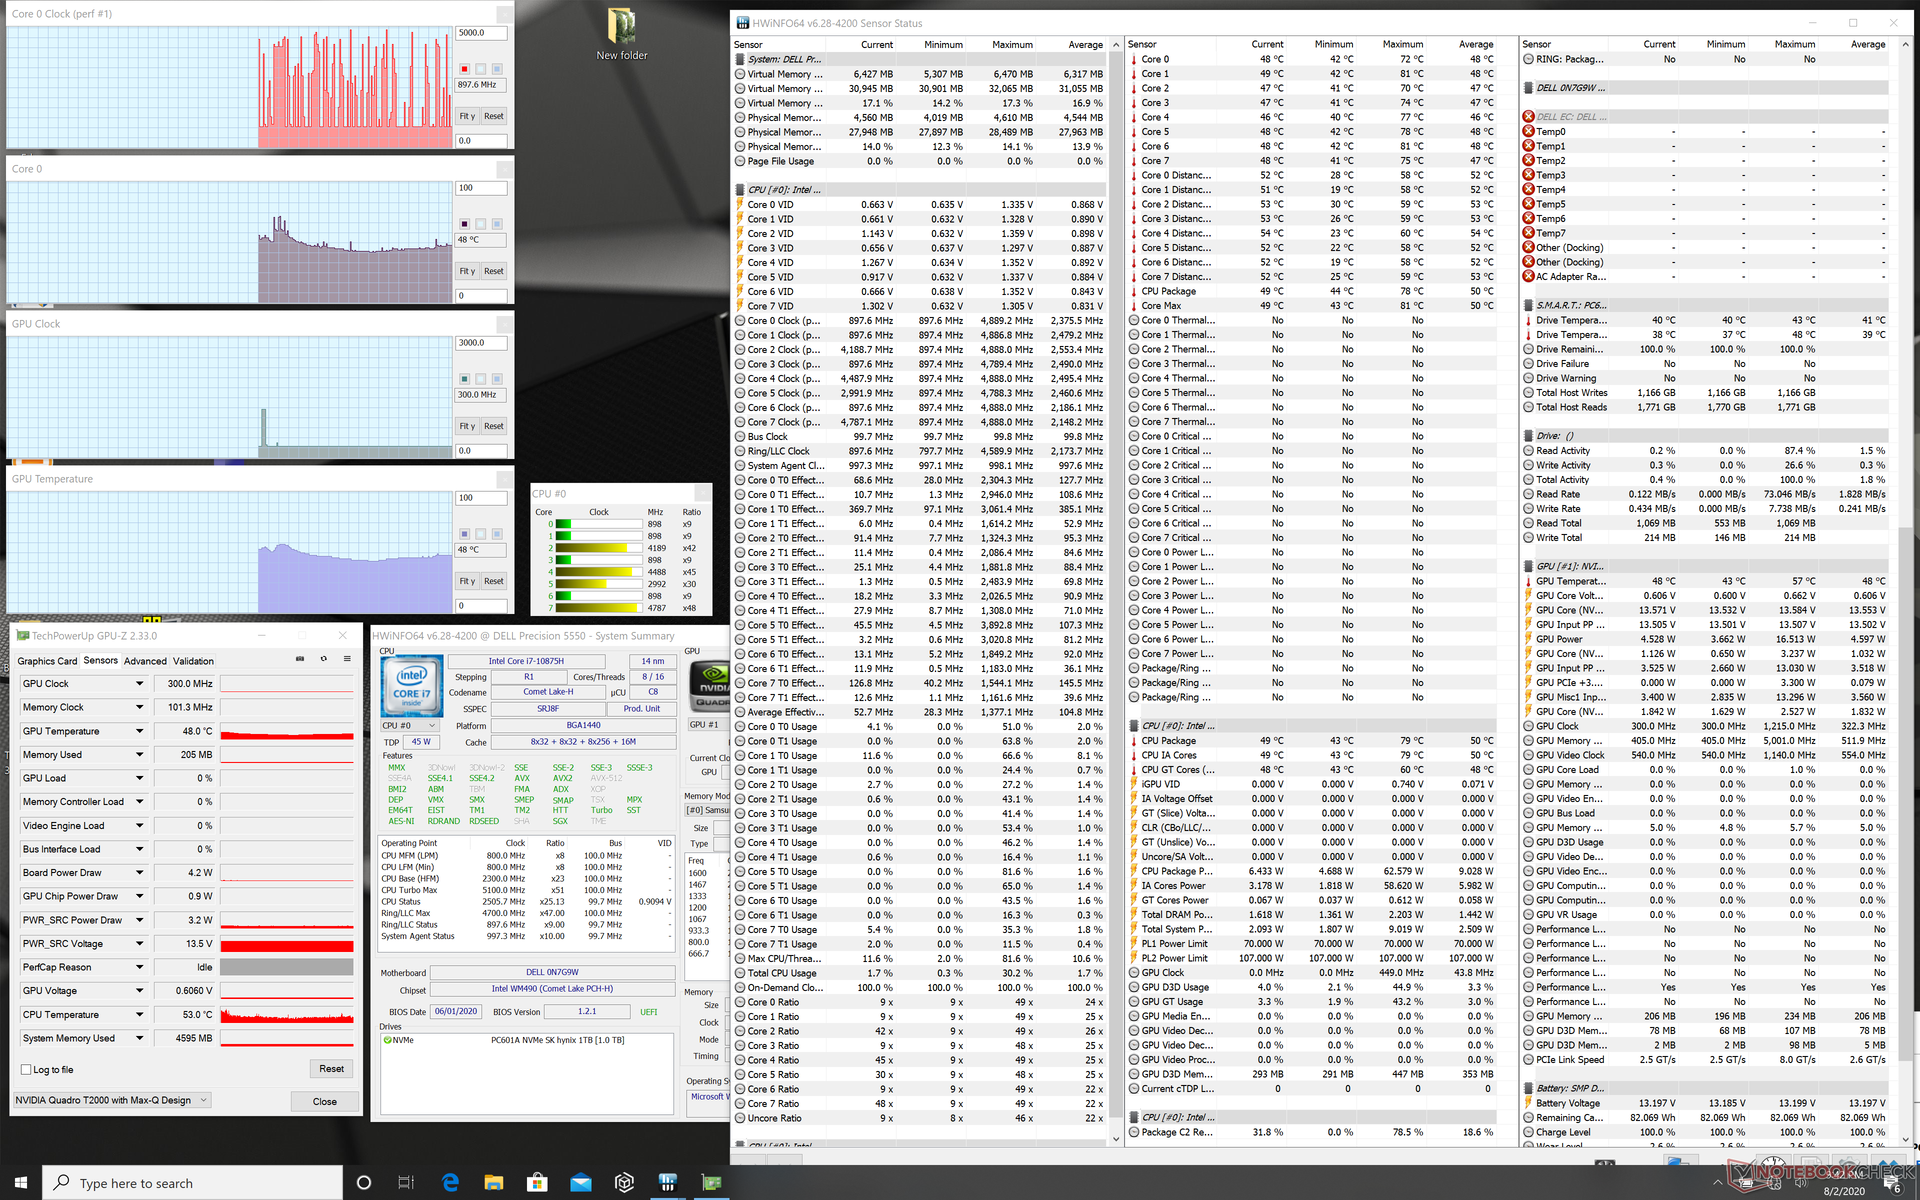
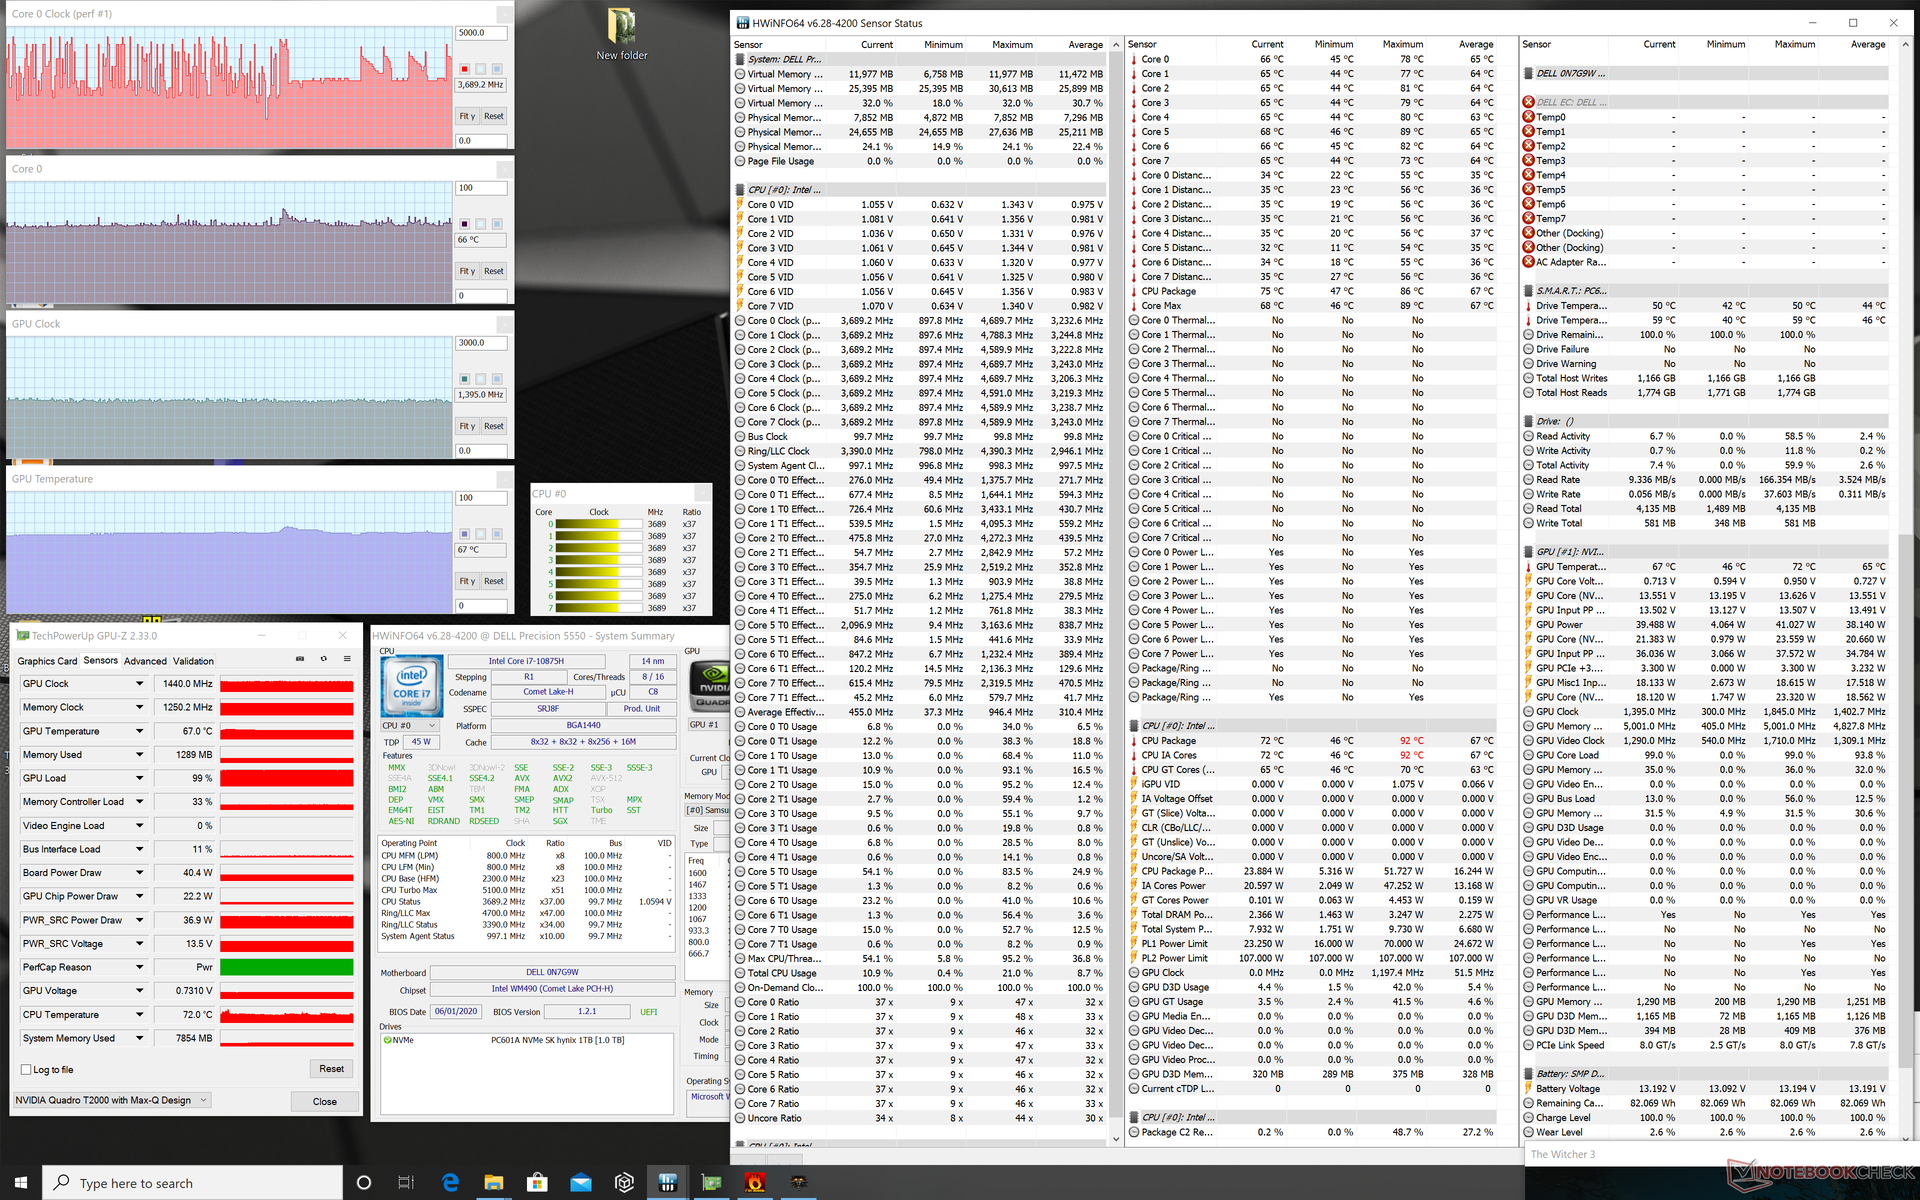
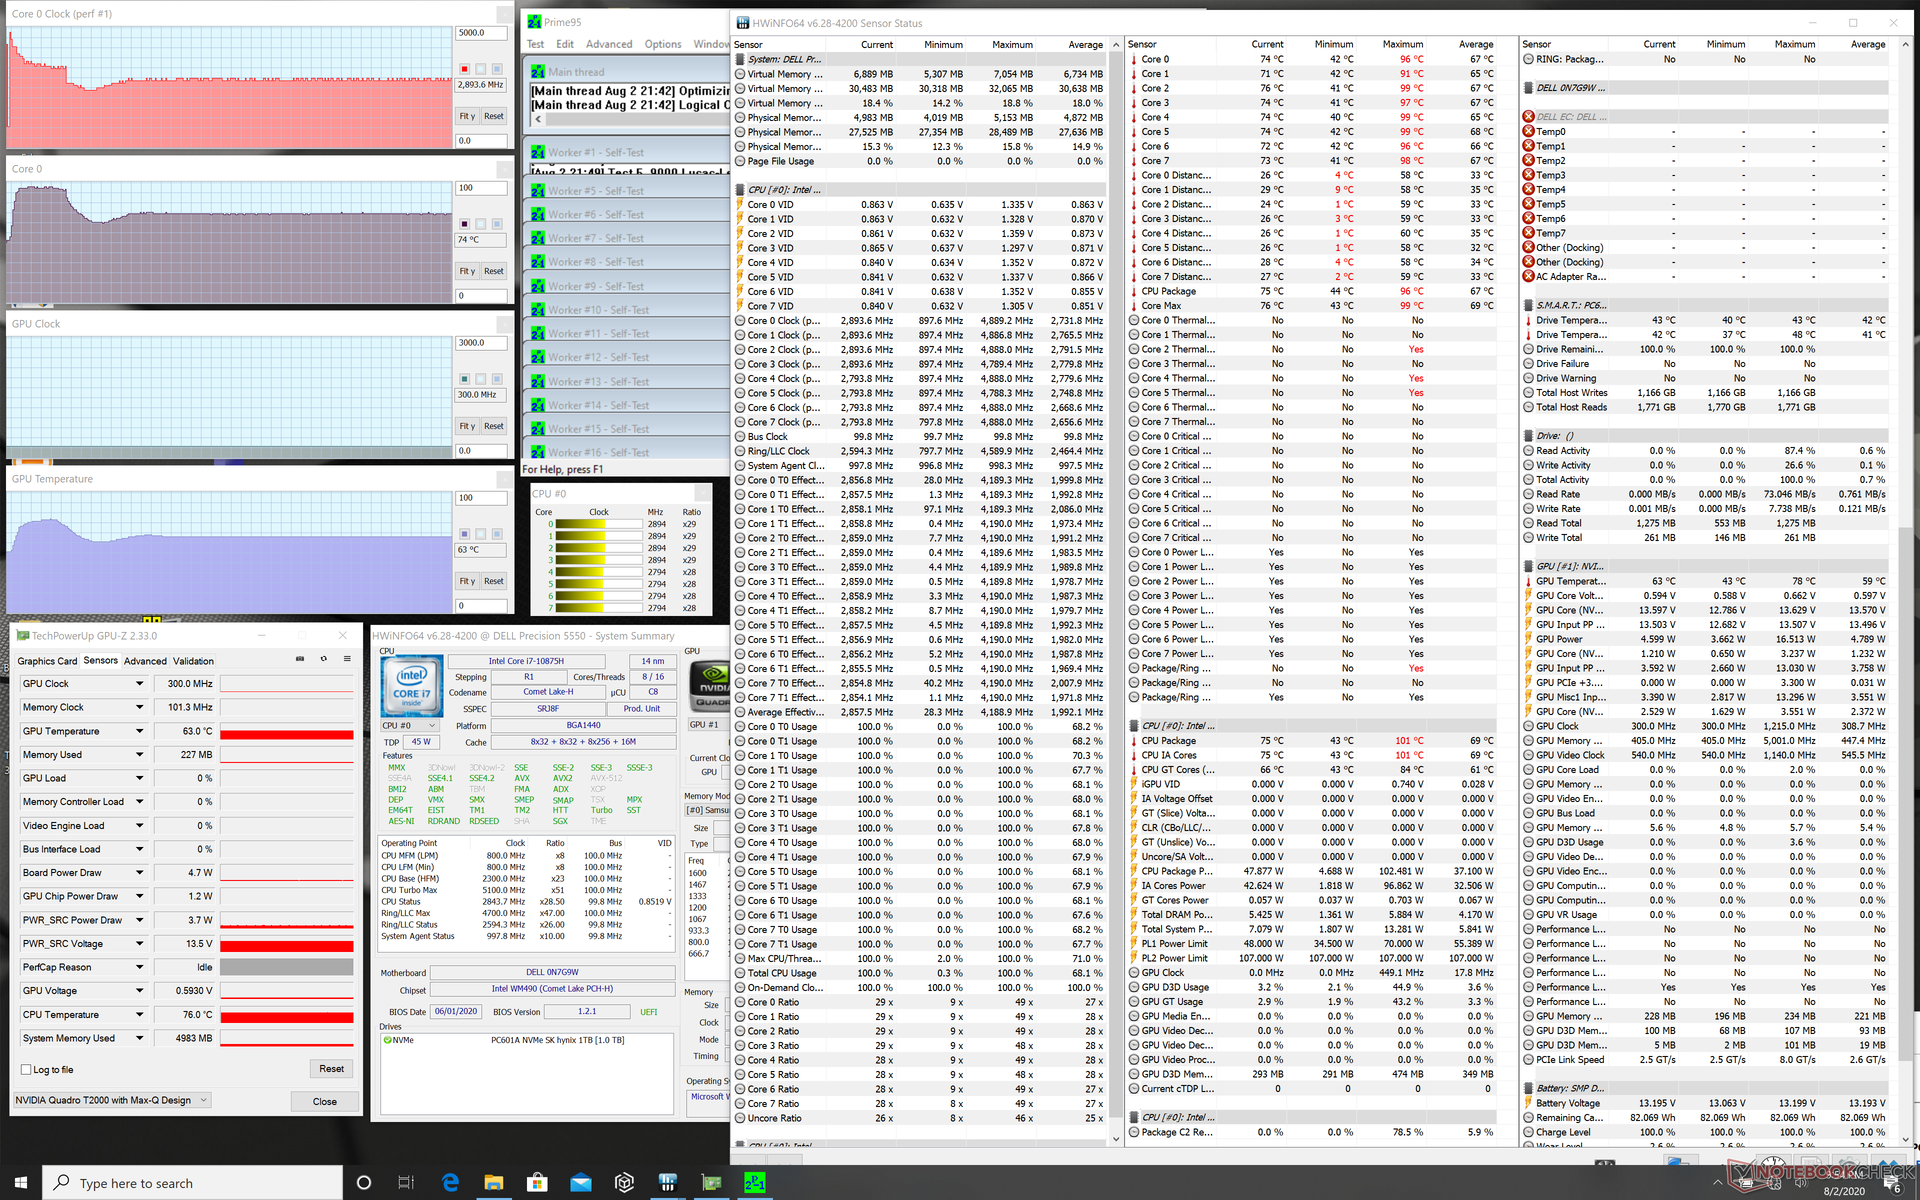
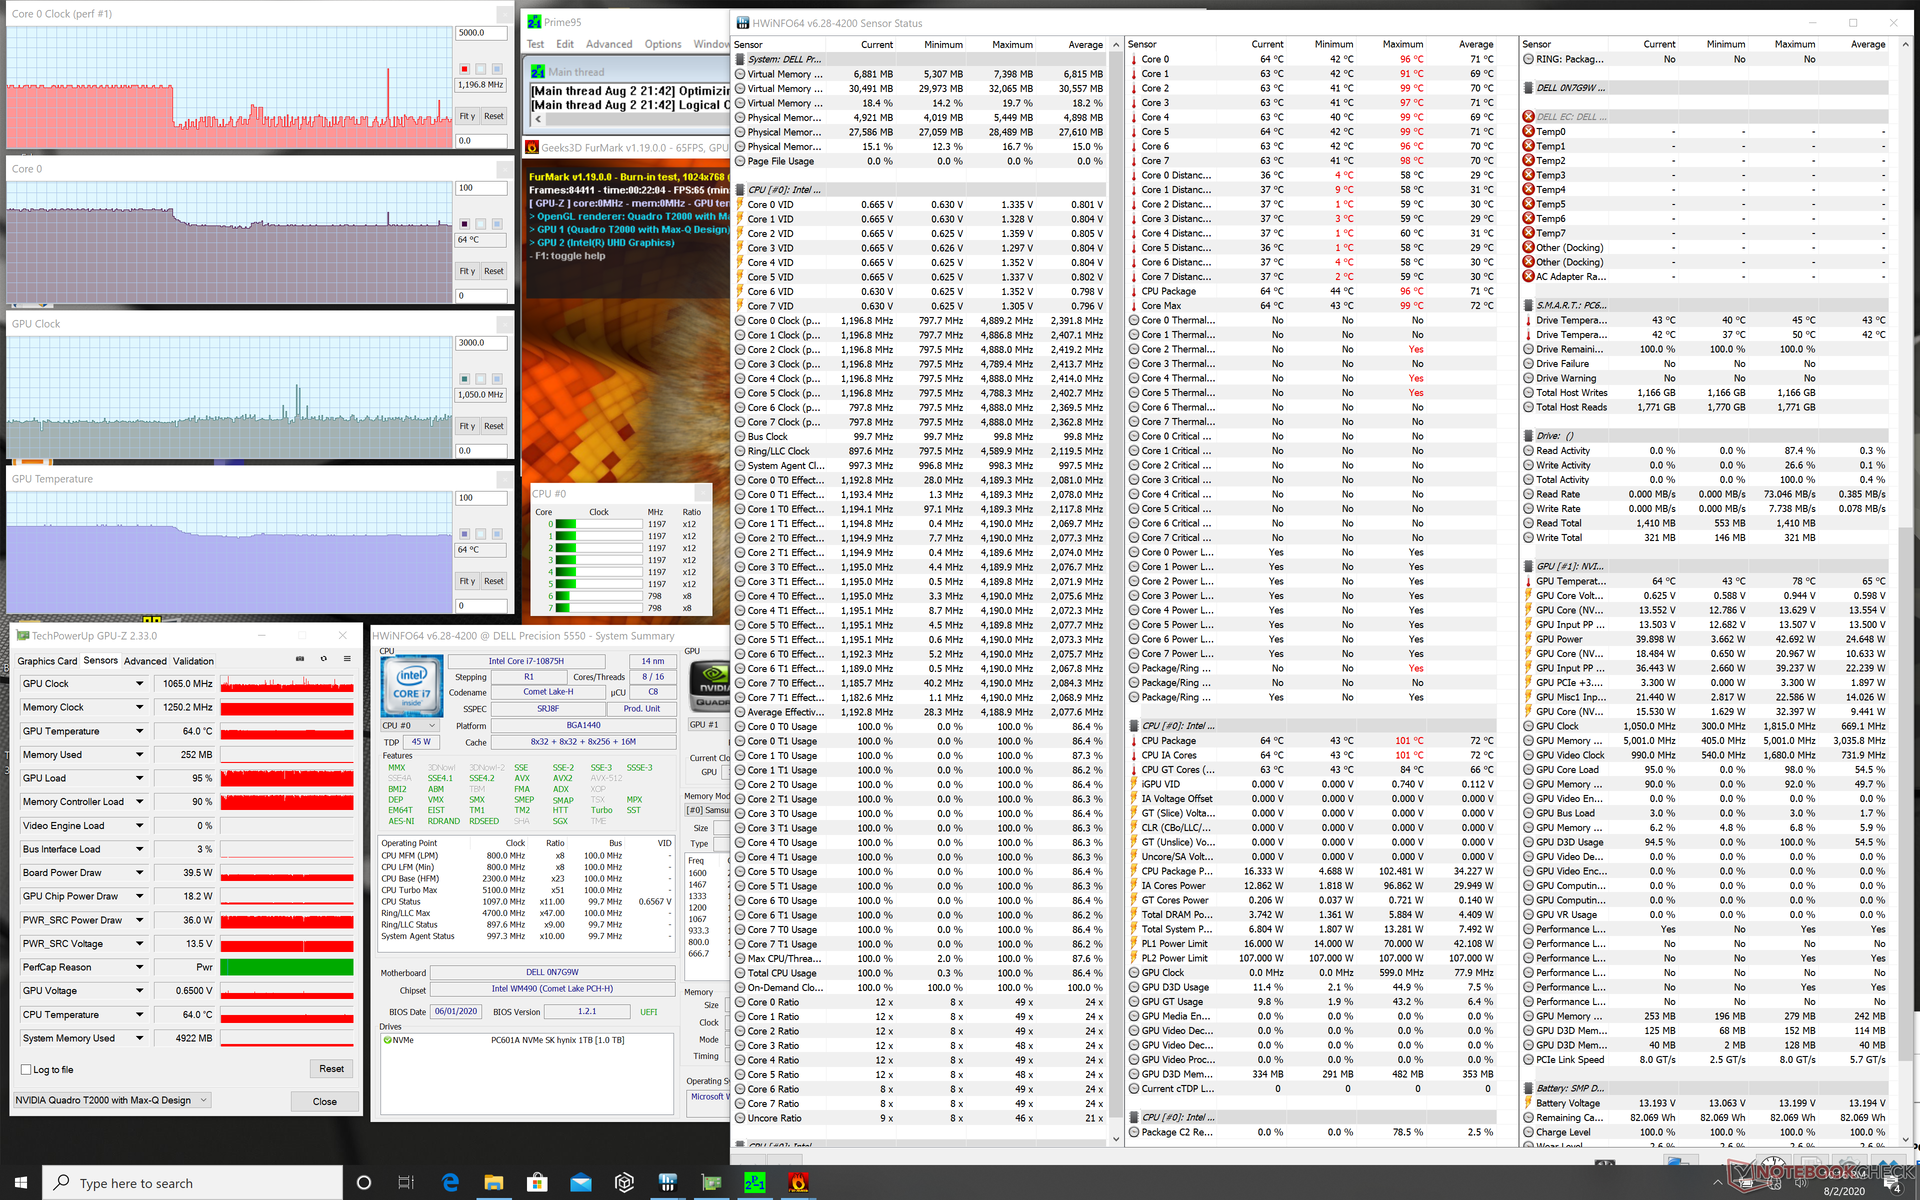
| CPU Clock (GHz) | GPU Clock (MHz) | Average CPU Temperature (°C) | Average GPU Temperature (°C) | |
| System Idle | -- | -- | 48 | 48 |
| Prime95 Stress | 2.8 - 2.9 | -- | 74 | 63 |
| Prime95 + FurMark Stress | ~1.1 - 1.2 | ~1065 | 64 | 64 |
| Witcher 3 Stress | ~3.7 | 1440 | ~66 | 67 |
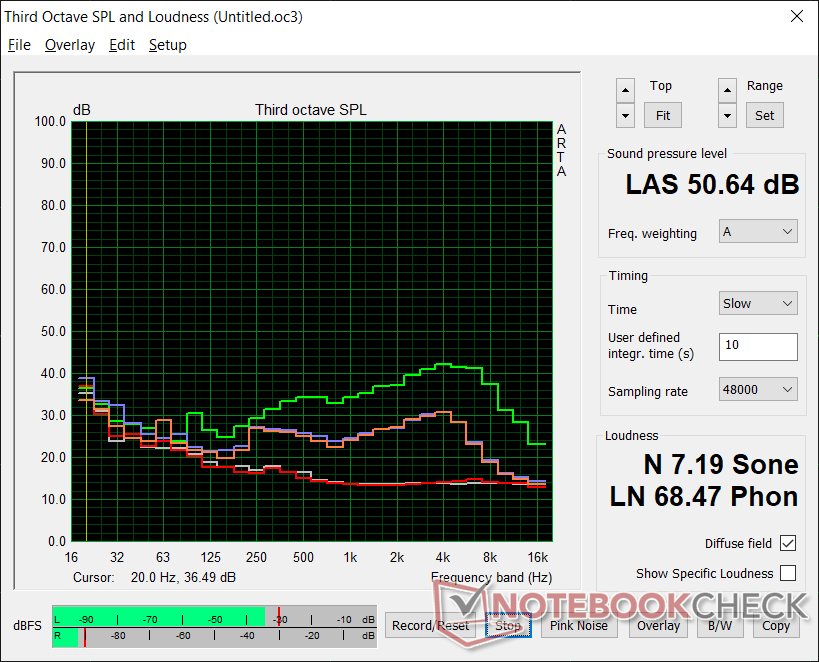
Speakers
Audio is above average for a workstation since the Precision 5550 is derived from a consumer chassis that specializes in audio and visual quality. The system retains the 8 W speaker setup of the original XPS 15 9500 for strong audio playback.


Dell Precision 5550 P91F ses analizi
(+) | hoparlörler nispeten yüksek sesle çalabilir (85 dB)
Bas 100 - 315Hz
(±) | azaltılmış bas - ortalama olarak medyandan 5.7% daha düşük
(±) | Bas doğrusallığı ortalamadır (7.7% delta - önceki frekans)
Ortalar 400 - 2000 Hz
(+) | dengeli ortalar - medyandan yalnızca 2.9% uzakta
(+) | orta frekanslar doğrusaldır (4.2% deltadan önceki frekansa)
Yüksekler 2 - 16 kHz
(+) | dengeli yüksekler - medyandan yalnızca 2.3% uzakta
(+) | yüksekler doğrusaldır (2.6% deltadan önceki frekansa)
Toplam 100 - 16.000 Hz
(+) | genel ses doğrusaldır (6.7% ortancaya göre fark)
Aynı sınıfla karşılaştırıldığında
» Bu sınıftaki tüm test edilen cihazların %0%'si daha iyi, 1% benzer, 99% daha kötüydü
» En iyisinin deltası 7% idi, ortalama 17% idi, en kötüsü 35% idi
Test edilen tüm cihazlarla karşılaştırıldığında
» Test edilen tüm cihazların %1'si daha iyi, 0 benzer, % 99 daha kötüydü
» En iyisinin deltası 4% idi, ortalama 24% idi, en kötüsü 134% idi
Apple MacBook 12 (Early 2016) 1.1 GHz ses analizi
(+) | hoparlörler nispeten yüksek sesle çalabilir (83.6 dB)
Bas 100 - 315Hz
(±) | azaltılmış bas - ortalama olarak medyandan 11.3% daha düşük
(±) | Bas doğrusallığı ortalamadır (14.2% delta - önceki frekans)
Ortalar 400 - 2000 Hz
(+) | dengeli ortalar - medyandan yalnızca 2.4% uzakta
(+) | orta frekanslar doğrusaldır (5.5% deltadan önceki frekansa)
Yüksekler 2 - 16 kHz
(+) | dengeli yüksekler - medyandan yalnızca 2% uzakta
(+) | yüksekler doğrusaldır (4.5% deltadan önceki frekansa)
Toplam 100 - 16.000 Hz
(+) | genel ses doğrusaldır (10.2% ortancaya göre fark)
Aynı sınıfla karşılaştırıldığında
» Bu sınıftaki tüm test edilen cihazların %7%'si daha iyi, 2% benzer, 91% daha kötüydü
» En iyisinin deltası 5% idi, ortalama 18% idi, en kötüsü 53% idi
Test edilen tüm cihazlarla karşılaştırıldığında
» Test edilen tüm cihazların %5'si daha iyi, 1 benzer, % 94 daha kötüydü
» En iyisinin deltası 4% idi, ortalama 24% idi, en kötüsü 134% idi
Energy Management
Power Consumption
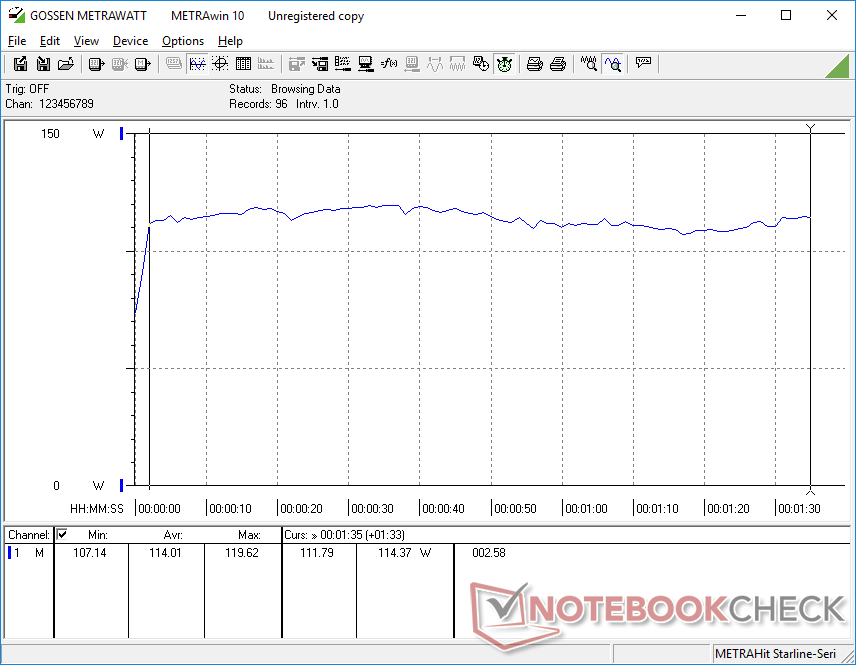
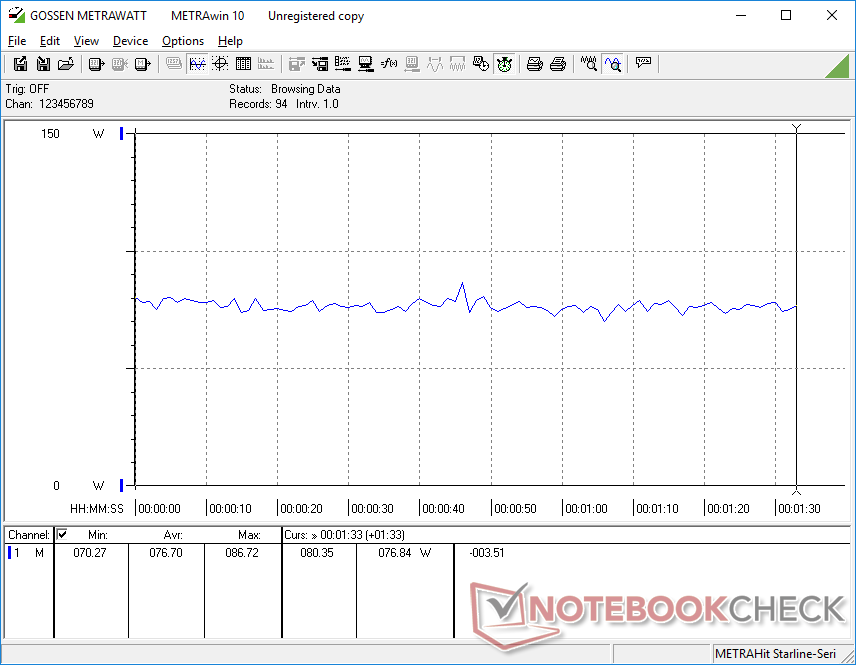
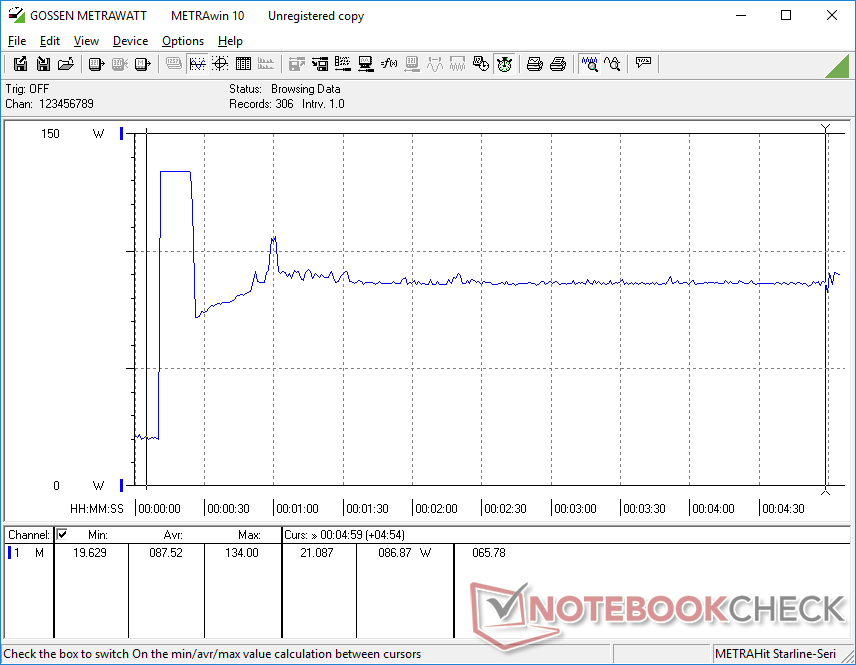
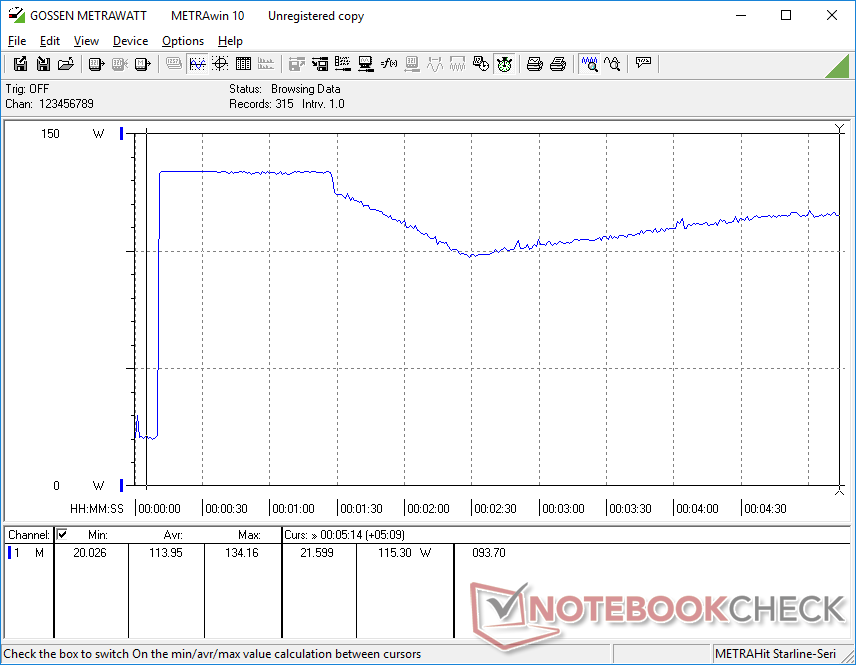
Running 3DMark 06 consumes an average of 114 W not unlike what we recorded on the XPS 15 9500, but power consumption when gaming is lower at 77 W compared to 93 W on the XPS 15. The difference is likely attributed to the Quadro GPU which runs at slower clock rates than the GTX 1660 Ti Max-Q and isn't optimized for gaming.
We're able to record a temporary maximum consumption of 134.2 W from the small-medium 135 W AC adapter (~14.3 x 6.5 x 2.2 cm) as shown by our graphs below. Note that this is the exact same USB-C AC adapter that also ships with the XPS 15, XPS 17, and Precision 5750.
| Kapalı / Bekleme modu | |
| Boşta | |
| Çalışırken |
|
Key:
min: | |
| Dell Precision 5550 P91F i7-10875H, Quadro T2000 Max-Q, SK Hynix PC601A NVMe 1TB, IPS, 3840x2400, 15.6" | Dell Precision 5540 i9-9980HK, Quadro T2000 Max-Q, SK hynix PC400 512 GB, OLED, 3840x2160, 15.6" | Razer Blade 15 Studio Edition 2020 i7-10875H, Quadro RTX 5000 Max-Q, Samsung PM981a MZVLB1T0HBLR, OLED, 3840x2160, 15.6" | Acer ConceptD 3 Pro CN315-71P-73W1 i7-9750H, Quadro T1000 (Laptop), WDC PC SN720 SDAPNTW-512G, IPS, 1920x1080, 15.6" | Lenovo ThinkPad P53-20QN000YGE i7-9850H, Quadro RTX 5000 Max-Q, Samsung PM981a MZVLB1T0HBLR, IPS, 1920x1080, 15.6" | MSI WP65 i7-9750H, Quadro P620, Samsung SSD PM981 MZVLB512HAJQ, IPS, 1920x1080, 15.6" | |
|---|---|---|---|---|---|---|
| Power Consumption | -2% | -59% | 31% | -27% | -4% | |
| Idle Minimum * (Watt) | 5.6 | 7.4 -32% | 13.4 -139% | 2.9 48% | 7.9 -41% | 5.6 -0% |
| Idle Average * (Watt) | 11.2 | 12.1 -8% | 18 -61% | 5.5 51% | 11.8 -5% | 8.6 23% |
| Idle Maximum * (Watt) | 18.4 | 12.7 31% | 26.1 -42% | 10.6 42% | 14.9 19% | 30.7 -67% |
| Load Average * (Watt) | 114 | 98 14% | 115 -1% | 86 25% | 96 16% | 78 32% |
| Witcher 3 ultra * (Watt) | 76.7 | 89.9 -17% | 145 -89% | 83 -8% | 149 -94% | 63.5 17% |
| Load Maximum * (Watt) | 134.2 | 135.1 -1% | 165 -23% | 100.7 25% | 207.8 -55% | 170.2 -27% |
* ... daha küçük daha iyidir
Battery Life
Battery capacity has dropped from 97 Wh on last year's Precision 5540 to 86 Wh on our newer model. Runtimes, however, are longer at about 9 hours of real-world WLAN use to be very close to what we observed on the XPS 15 9500.
Charging from empty to full capacity takes about 2 hours. Any of the three USB-C ports can be used for recharging purposes.
| Dell Precision 5550 P91F i7-10875H, Quadro T2000 Max-Q, 86 Wh | Dell Precision 5540 i9-9980HK, Quadro T2000 Max-Q, 97 Wh | Razer Blade 15 Studio Edition 2020 i7-10875H, Quadro RTX 5000 Max-Q, 80 Wh | Acer ConceptD 3 Pro CN315-71P-73W1 i7-9750H, Quadro T1000 (Laptop), 58.7 Wh | Lenovo ThinkPad P53-20QN000YGE i7-9850H, Quadro RTX 5000 Max-Q, 90 Wh | MSI WP65 i7-9750H, Quadro P620, 51 Wh | |
|---|---|---|---|---|---|---|
| Pil Çalışma Süresi | -9% | -18% | -10% | 33% | -48% | |
| Reader / Idle (h) | 22.6 | 15 -34% | 8.8 -61% | 10.1 -55% | ||
| WiFi v1.3 (h) | 9 | 7.7 -14% | 5.7 -37% | 8.1 -10% | 11.1 23% | 6 -33% |
| Load (h) | 1.4 | 1.7 21% | 2 43% | 2 43% | 0.6 -57% |
Artılar
Eksiler
Verdict
Diğer ultra ince ve hafif Studio dizüstü bilgisayarların çoğu gibi, Precision 5550 de ham performansı ve bağlantı noktası seçeneklerinden çok taşınabilir form faktörü, şık tasarımı ve etkileyici parlak dokunmatik ekranı ile değerlendirilmelidir. Bu, zayıf bir sistem olduğu anlamına gelmez, ancak bu çekici Ultrabook görünümü için kaçınılmaz olarak bazı üst düzey grafik seçeneklerinden ödün vermek zorunda kalacaksınız.
Çok fazla hareket etmeyi planlamıyorsanız veya alanı karşılayabiliyorsanız, daha büyük olan Precision 7550, Precision 5550'den çok daha uzun bacaklara ve daha iyi performans seçeneklerine sahip olacaktır. Bu makine, yolcular ve hibrit iş istasyonu-Ultrabook için daha fazla üretilmiştir. sabit bir çözümden çok, bir seferde saatlerce yüksek yükler çalıştırmak anlamına geliyordu.
Bugün piyasadaki çoğu iş istasyonundan daha küçük, daha ince ve daha hafif. Dell Precision 5550, seyahat dostu bir tasarım için daha yüksek grafik seçeneklerinden ve bağlantı noktası çeşitliliğinden ödün verir.
Dell Precision 5550 P91F
- 08/05/2020 v7 (old)
Allen Ngo
Price comparison

