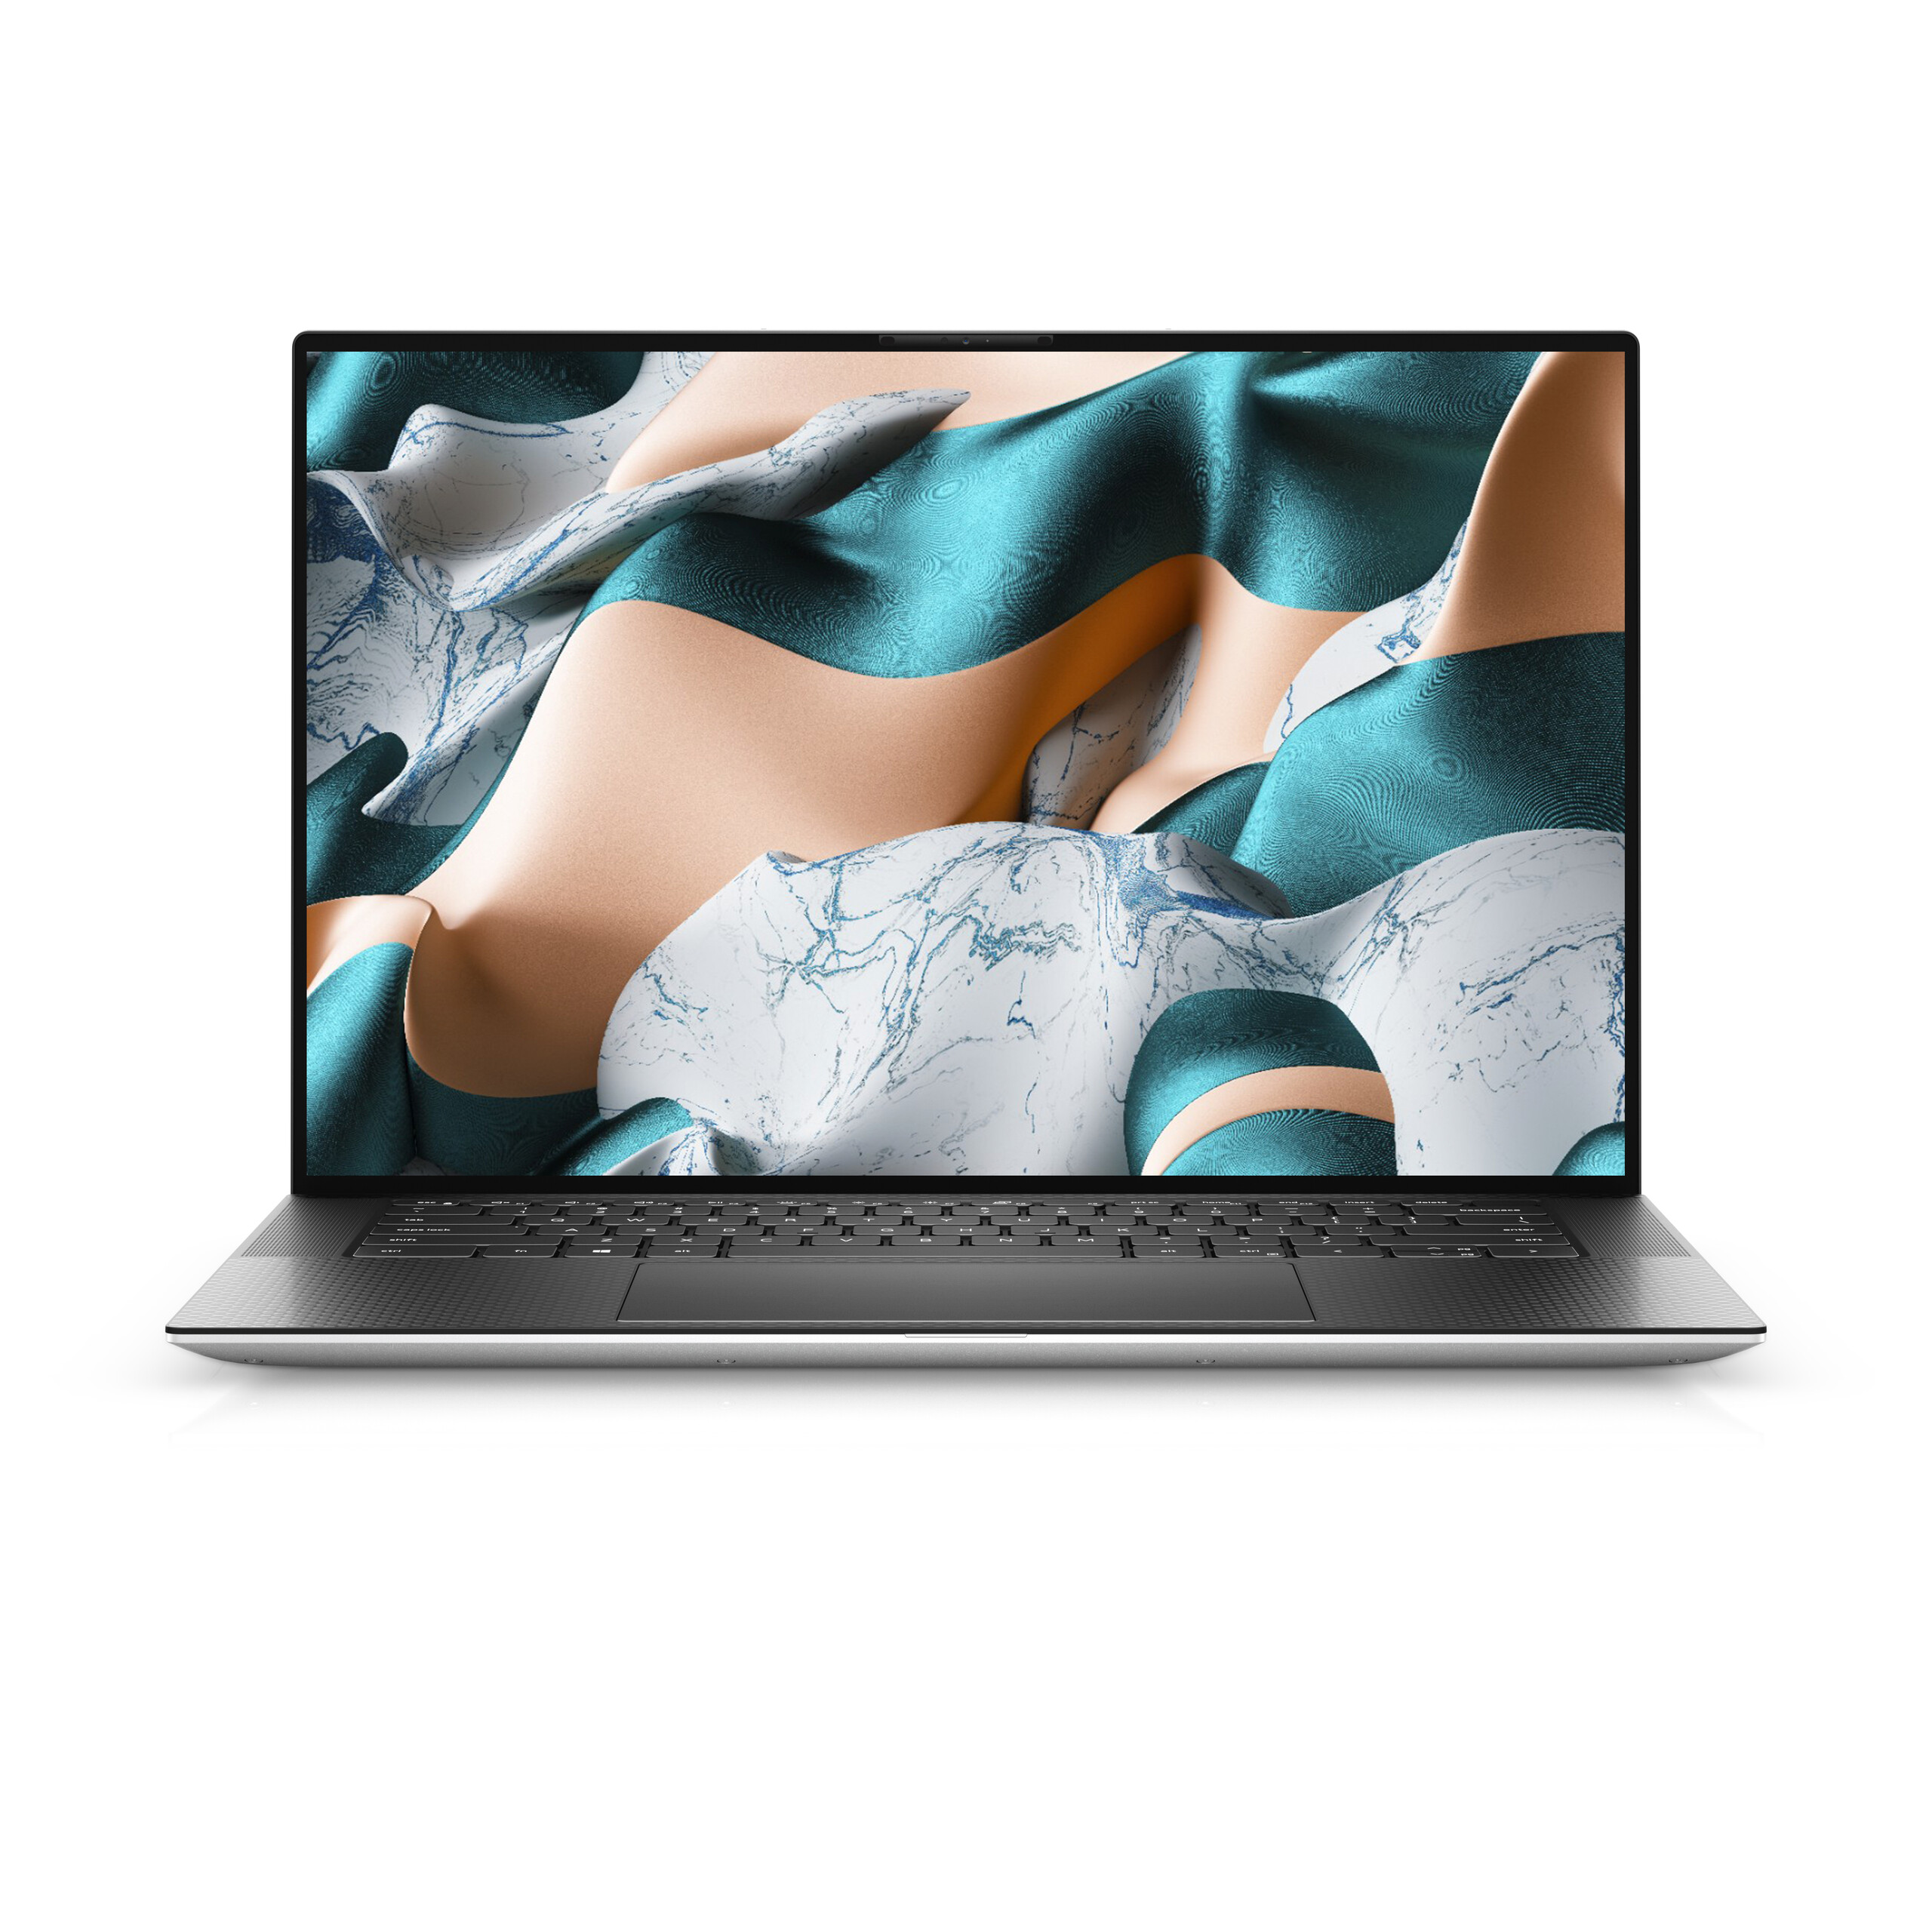
Dell XPS 15 9500 Core i7 GeForce GTX 1650 Ti Laptop incelemesi
(11 Haziran güncellemesi: Bu incelemeyi bitirdikten hemen sonra, Dell XPS 15 9500 için çok daha hızlı bir Core i9-10885H seçeneği açıkladı. Aşağıdaki orijinal metnimiz değişmeden kaldı.) Geçen hafta, en ucuz Dell XPS 15 9500 yapılandırmasını kontrol ettik dört çekirdekli Core i5-10300H CPU, entegre UHD Graphics 630 GPU ve mat FHD ekran ile 1300 USD karşılığında donatılmıştır. Bu hafta, en üst düzey sekiz çekirdekli Core i7-10875H, GeForce GTX 1650 Ti ve 4K UHD dokunmatik ekran yapılandırmasına 2400 $ harcamak isteyen kullanıcılar için sistemin spektrumun diğer tarafından nasıl göründüğünü görmek için buradayız. 2020 XPS 15'in yeni şasi ve fiziksel özellikleri hakkında daha fazla bilgi için lütfen XPS 15 9500 Core i5 hakkındaki mevcut incelememize bakın. Bu inceleme Core i7 yapılandırmasının performansına ve temel Core i5 seçeneğinden ve eski XPS 15 7590 serisinden nasıl farklılaşacağına odaklanacak.Daha fazla Dell incelemesi: XPS 15 9500 Core i5 FHDXPS 15 7590 Core i9 4K UHDLatitude 7490Alienware m15 R2Vostro 15
Derecelendirme | Tarih | Modeli | Ağırlık | Yükseklik | Boyut | Çözünürlük | Fiyat |
|---|---|---|---|---|---|---|---|
| 90.1 % v7 (old) | 06/2020 | Dell XPS 15 9500 Core i7 4K UHD i7-10875H, GeForce GTX 1650 Ti Mobile | 2 kg | 18 mm | 15.60" | 3840x2400 | |
| 86 % v7 (old) | 03/2020 | Lenovo Yoga C940-15IRH i7-9750H, GeForce GTX 1650 Max-Q | 2 kg | 19.7 mm | 15.60" | 1920x1080 | |
| 85.2 % v7 (old) | 03/2020 | Asus ZenBook 15 UX534FTC-A8190T i7-10510U, GeForce GTX 1650 Max-Q | 1.6 kg | 18.9 mm | 15.60" | 1920x1080 | |
| 85.2 % v7 (old) | 12/2019 | MSI Prestige 15 A10SC i7-10710U, GeForce GTX 1650 Max-Q | 1.7 kg | 16 mm | 15.60" | 3840x2160 | |
| 86.8 % v7 (old) | 06/2020 | Dell XPS 15 9500 Core i5 i5-10300H, UHD Graphics 630 | 1.8 kg | 18 mm | 15.60" | 1920x1200 | |
| 89.7 % v7 (old) | 12/2019 | Apple MacBook Pro 16 2019 i9 5500M i9-9880H, Radeon Pro 5500M | 2 kg | 16.2 mm | 16.00" | 3072x1920 |
Durum

Bağlantı
SD Kart Okuyucu
| SD Card Reader | |
| average JPG Copy Test (av. of 3 runs) | |
| Dell XPS 15 9500 Core i7 4K UHD (Toshiba Exceria Pro SDXC 64 GB UHS-II) | |
| Dell XPS 15 7590 9980HK GTX 1650 (Toshiba Exceria Pro SDXC 64 GB UHS-II) | |
| MSI Prestige 15 A10SC (Toshiba Exceria Pro M501 UHS-II) | |
| Dell XPS 15 9575 i5-8305G (Toshiba Exceria Pro M501 UHS-II) | |
| maximum AS SSD Seq Read Test (1GB) | |
| Dell XPS 15 9575 i5-8305G (Toshiba Exceria Pro M501 UHS-II) | |
| Dell XPS 15 9500 Core i7 4K UHD (Toshiba Exceria Pro SDXC 64 GB UHS-II) | |
| MSI Prestige 15 A10SC (Toshiba Exceria Pro M501 UHS-II) | |
| Dell XPS 15 7590 9980HK GTX 1650 (Toshiba Exceria Pro SDXC 64 GB UHS-II) | |
İletişim
Tüm SKU'lar, Wi-Fi 6 bağlantısı için Killer 1650'leri entegre eder. Netgear RAX200 yönlendiricimize bağlandığında herhangi bir sorunla karşılaşmadık.
Web kamerası


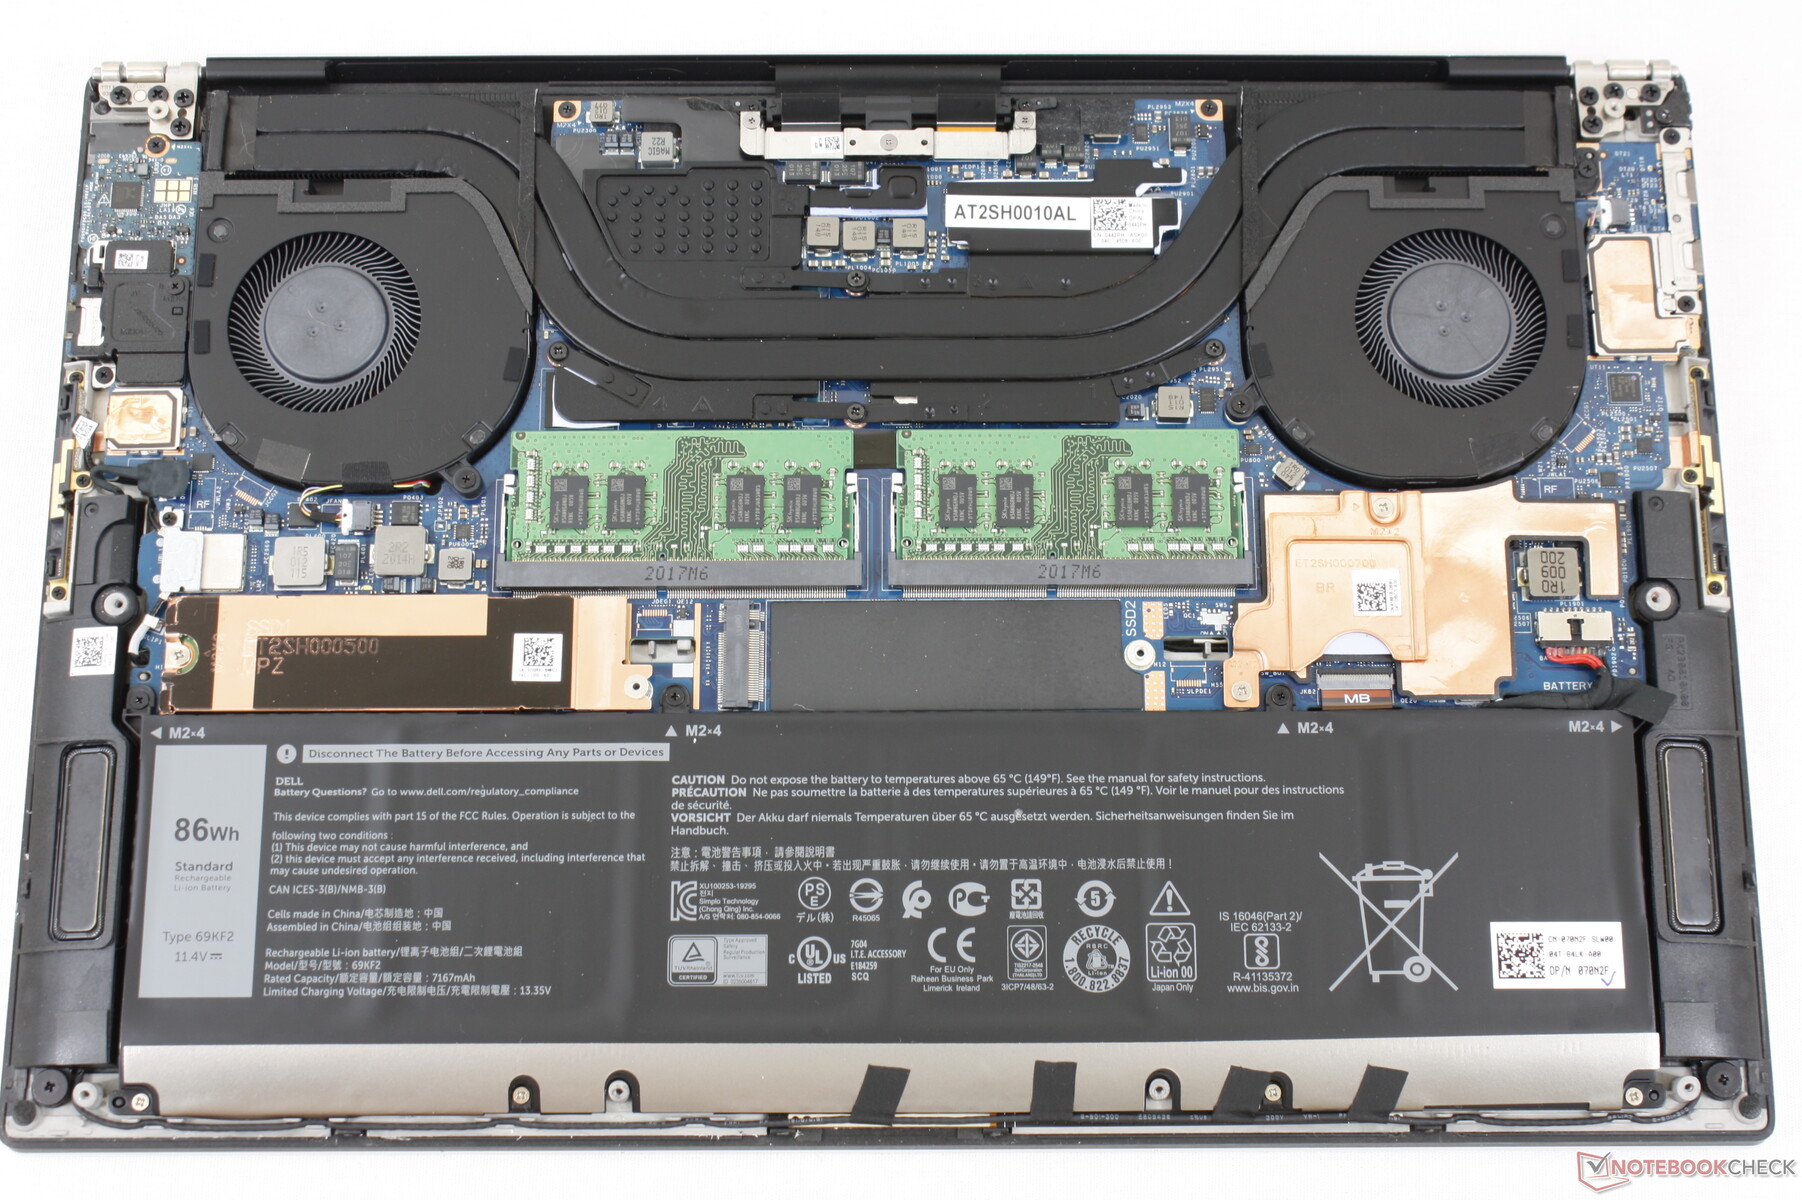
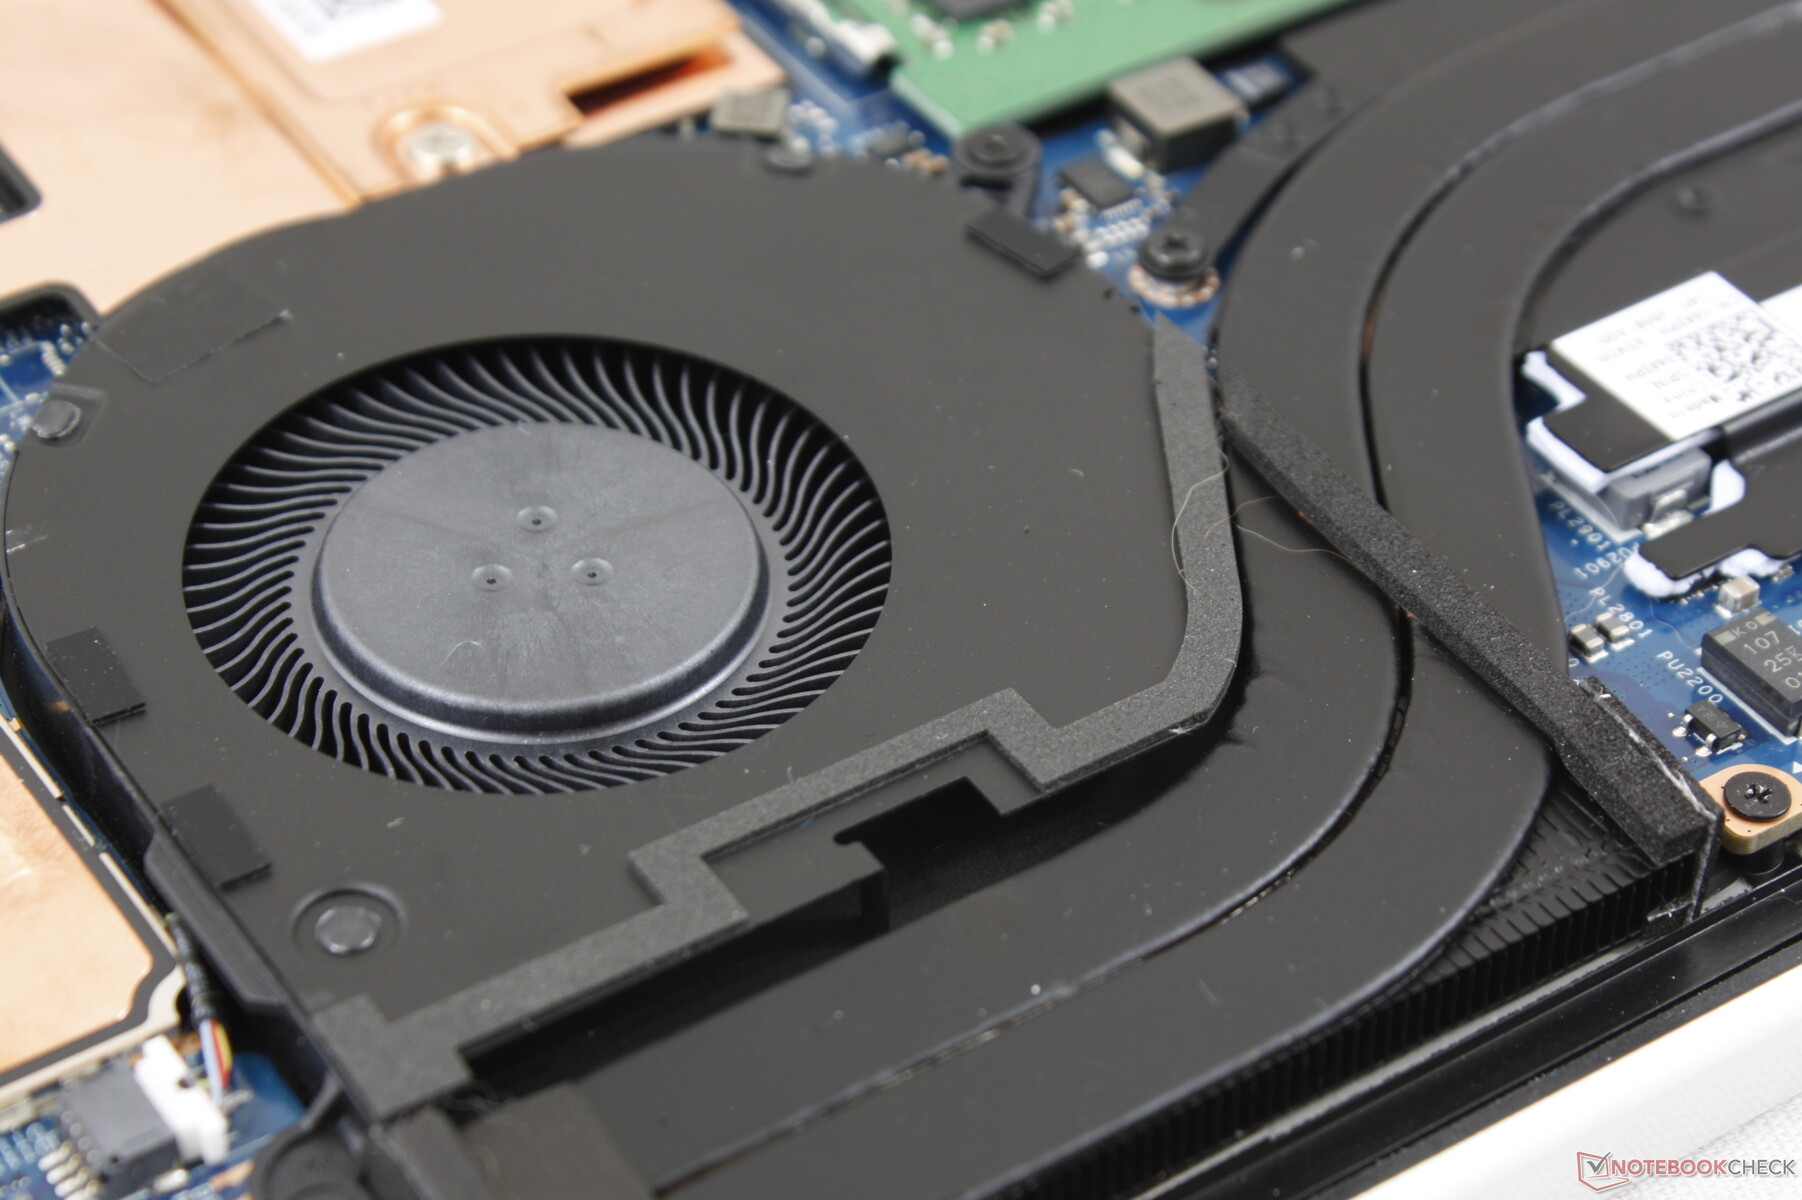
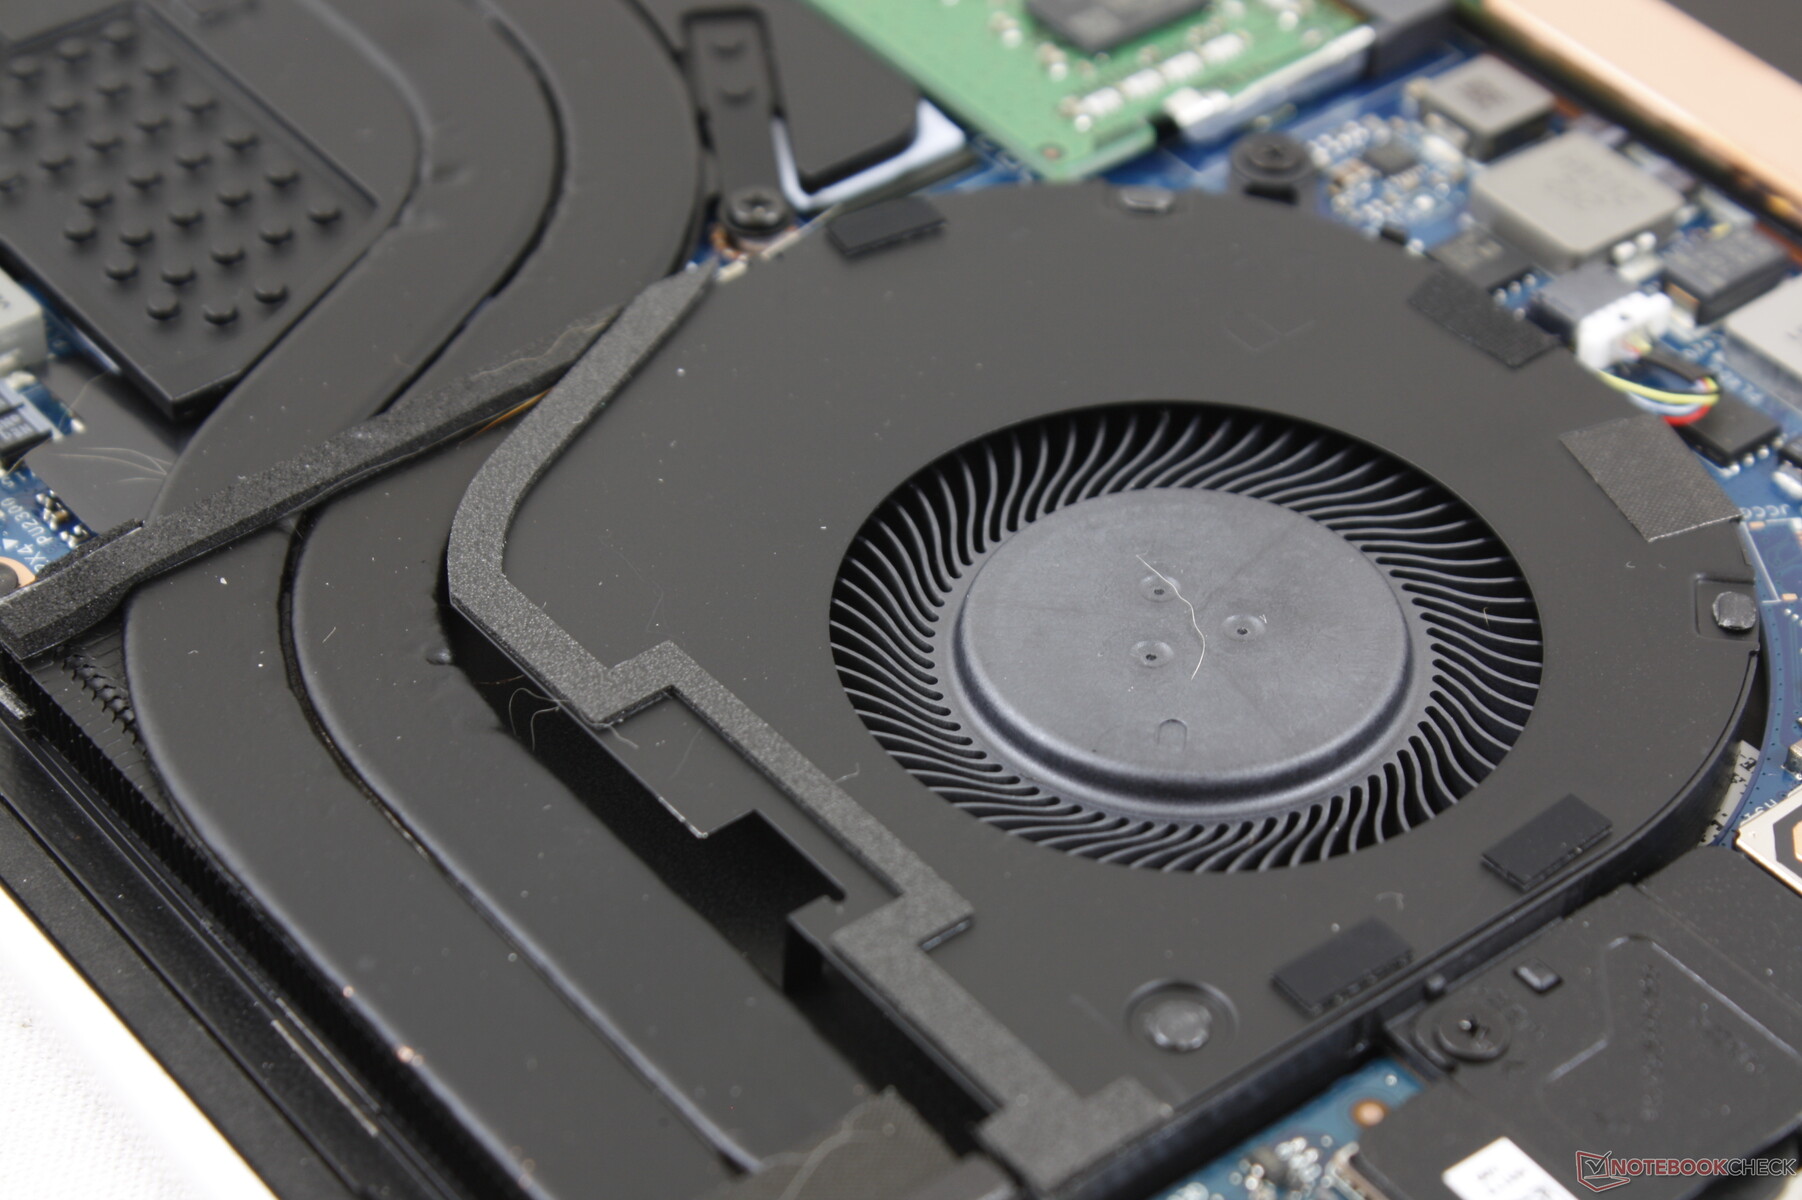
Bakım
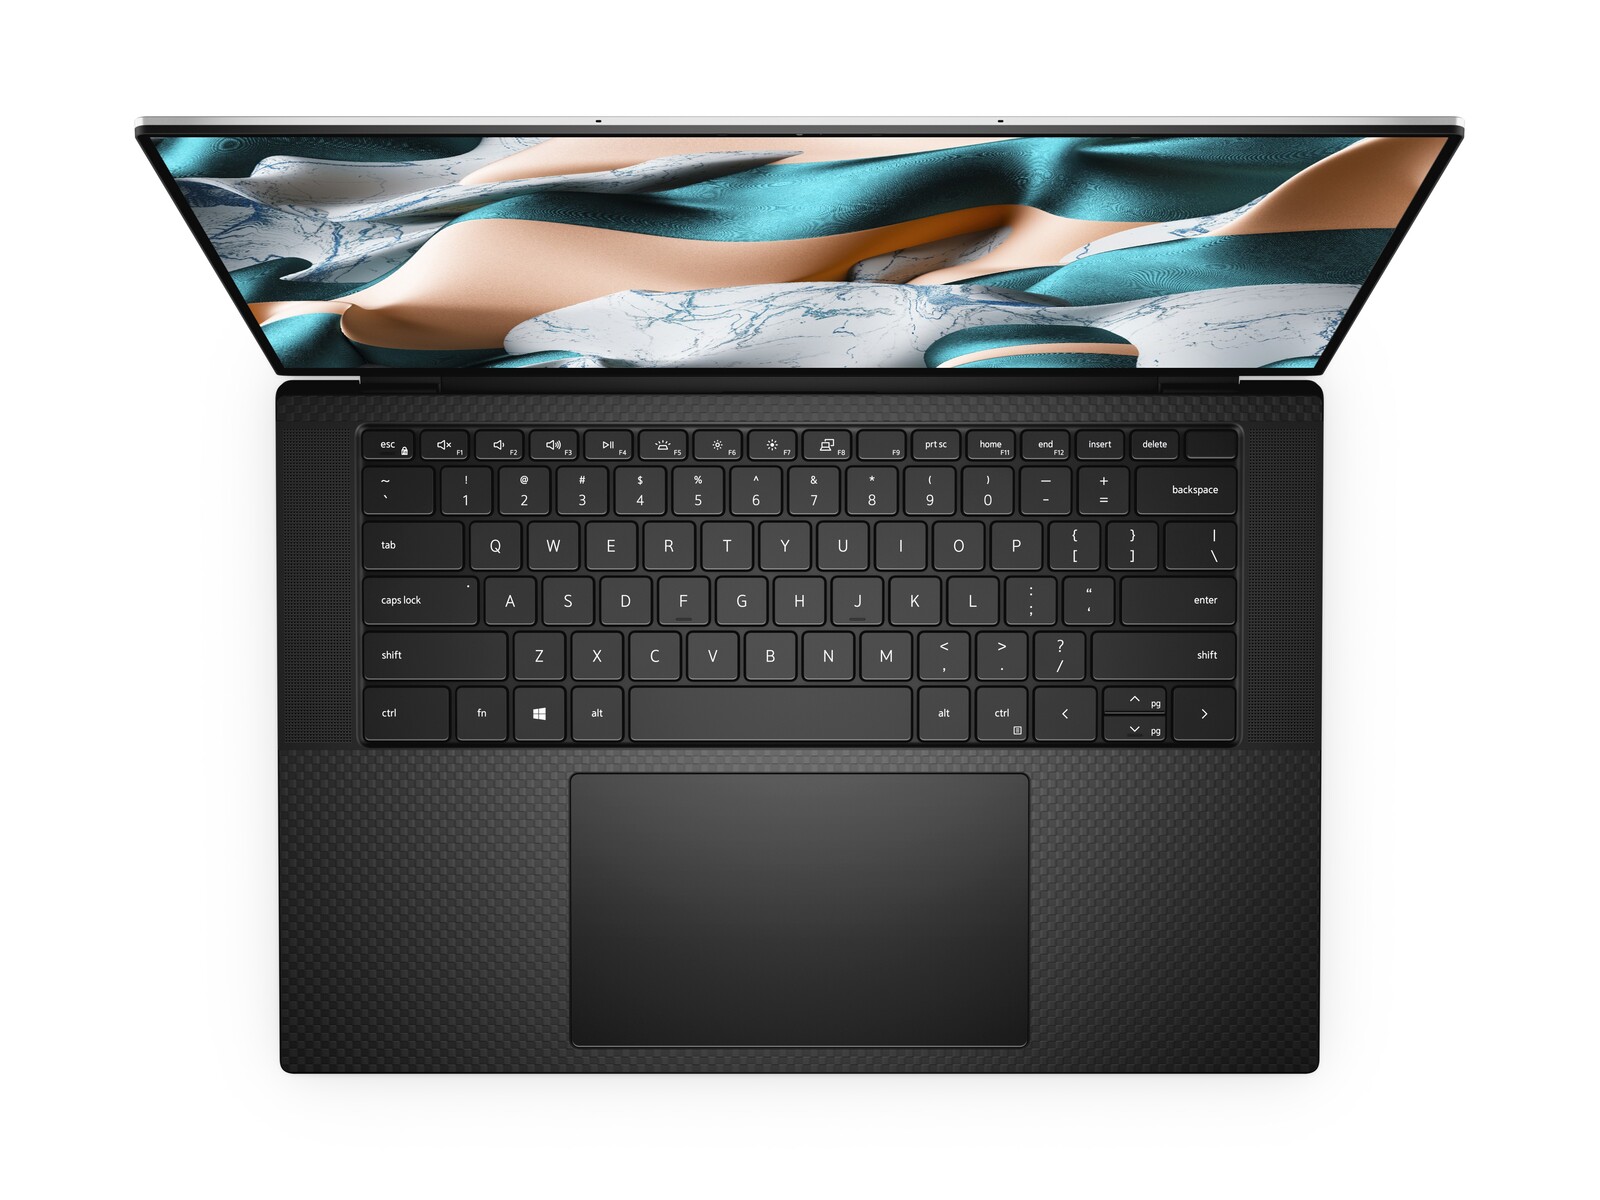
Giriş cihazları
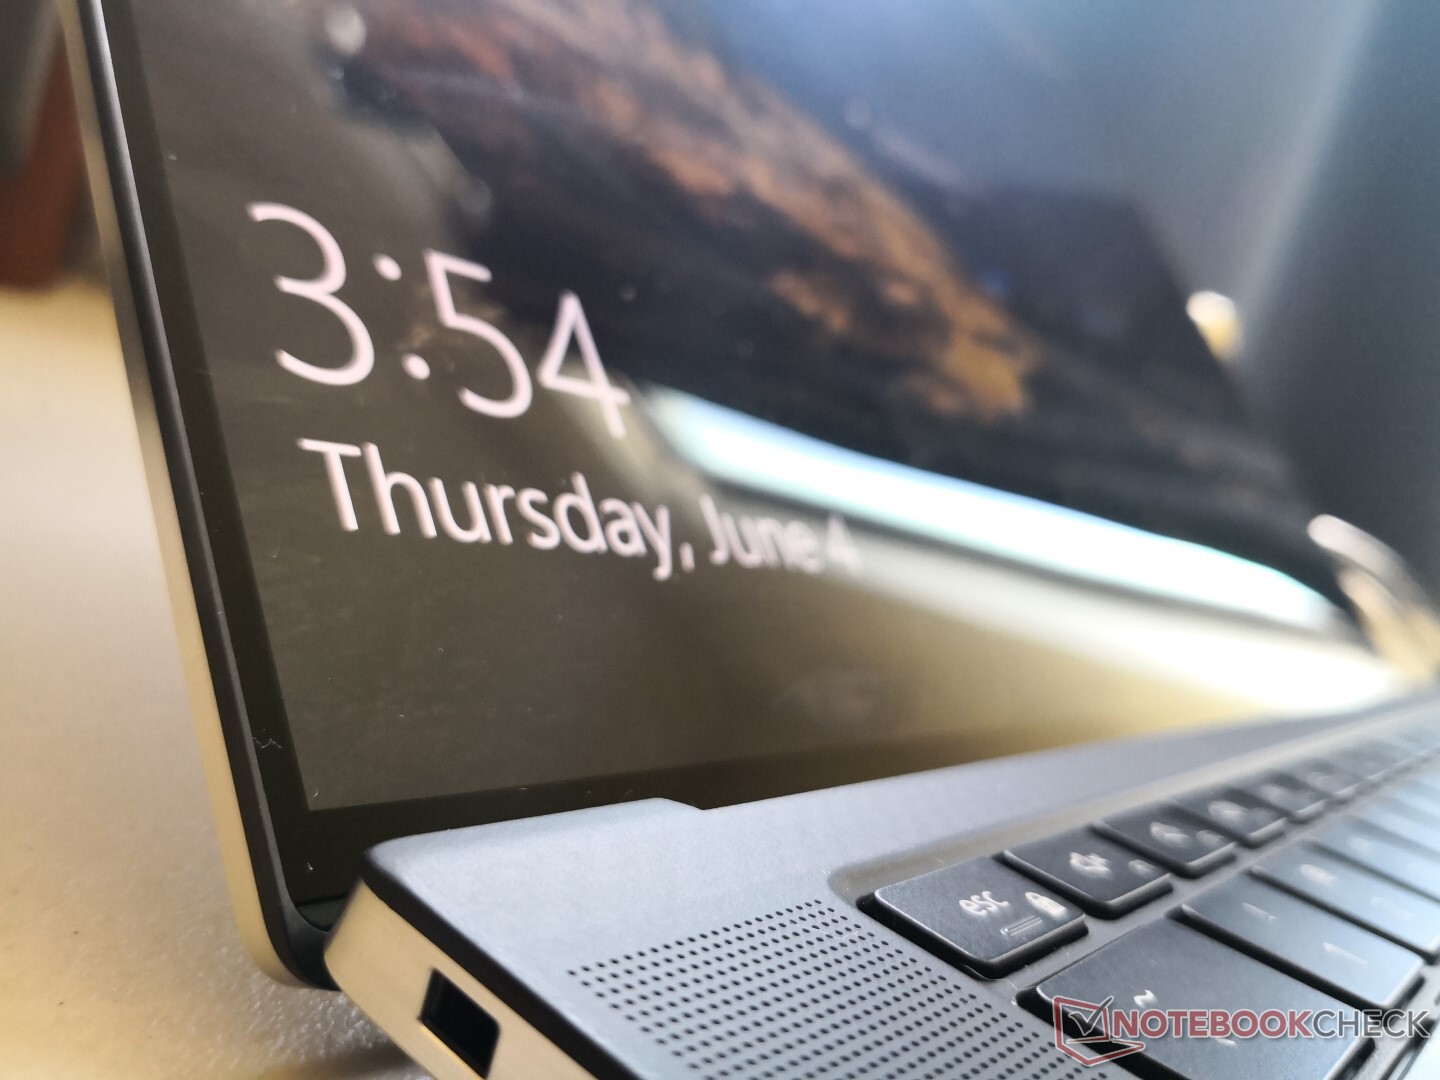
Görüntüle
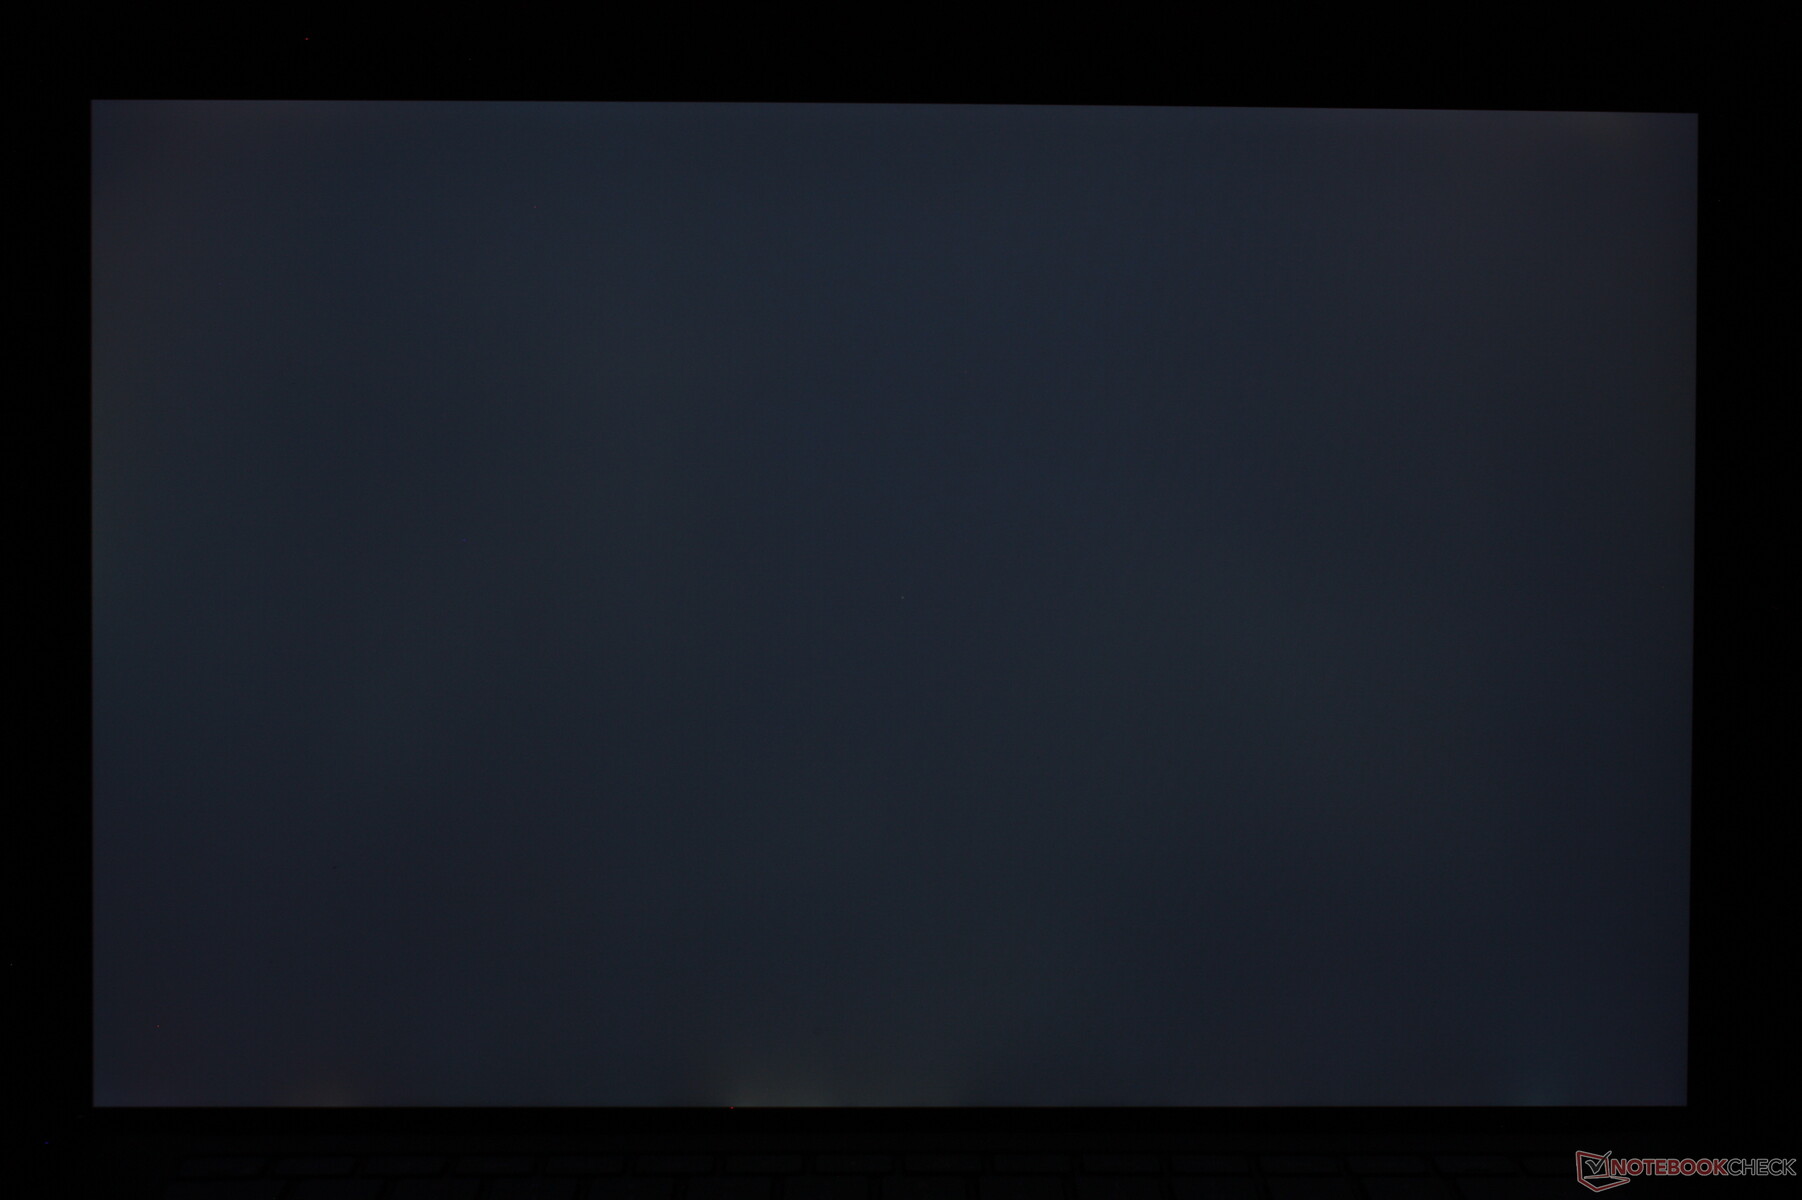
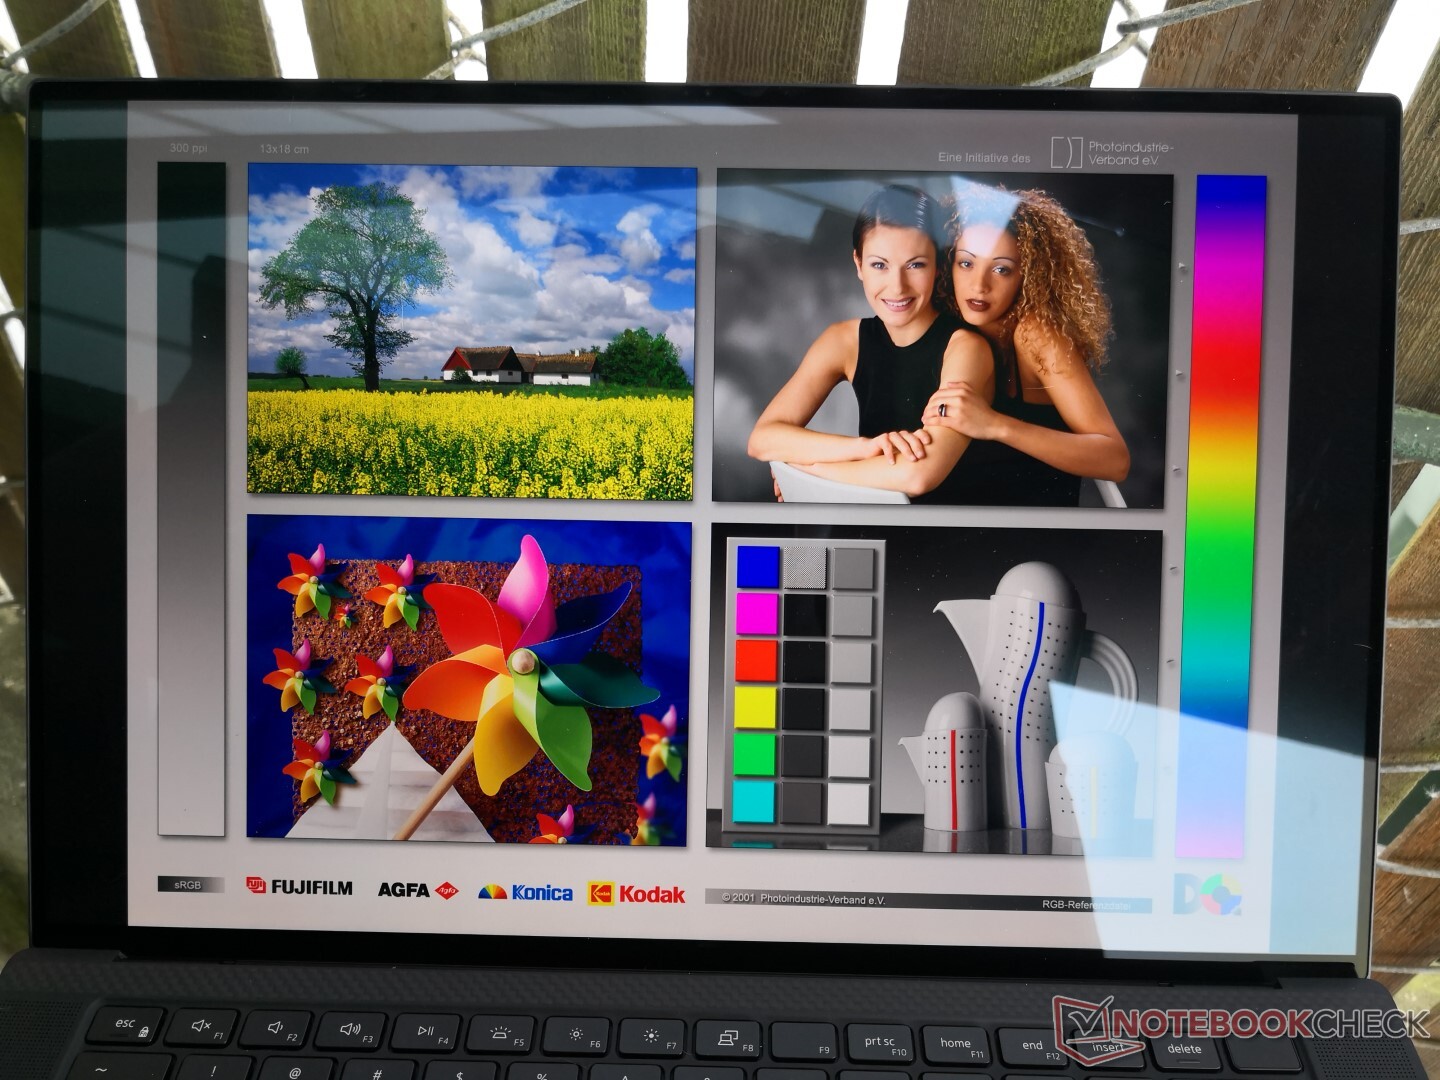
Mat FHD XPS 15 9500, Sharp LQ156N1 IPS panelini kullanırken, parlak 4K SKU'muz Sharp LQ156R1'i kullanıyor. Daha yüksek çözünürlük ve daha derin renkler hemen fark edilir, ancak bu, aşağıdaki karşılaştırma tablosumuzda gösterildiği gibi FHD sürümüne göre biraz daha yavaş tepki süreleri ve biraz daha sönük bir arka ışık maliyetiyle gelir. Küçük dezavantajlar, bunun şu anda başka hiçbir tüketici Ultrabook'ta bulunmayan benzersiz ve yüksek kaliteli bir 16:10 panel olduğu gerçeğinden uzaklaşmak için çok az şey yapıyor. Ek yükseklik, Apple MacBook Pro modellerindeki ekranlara benzer neredeyse tüm uygulamalar için paha biçilmez hale gelir. 2019 XPS 15'ten daha az belirgin bir yükseltme, hem FHD hem de 4K UHD XPS 15 9500 SKU'larda darbe genişliği modülasyonunun tamamen olmamasıdır. Titreşen ekranlara duyarlılık nedeniyle XPS 15 serisine devam eden kullanıcıların artık 2020 modeli için endişelenmesi gerekmeyecek.

| |||||||||||||||||||||||||
Aydınlatma: 91 %
Batarya modunda parlaklık: 557.9 cd/m²
Kontrast: 1431:1 (Siyah: 0.39 cd/m²)
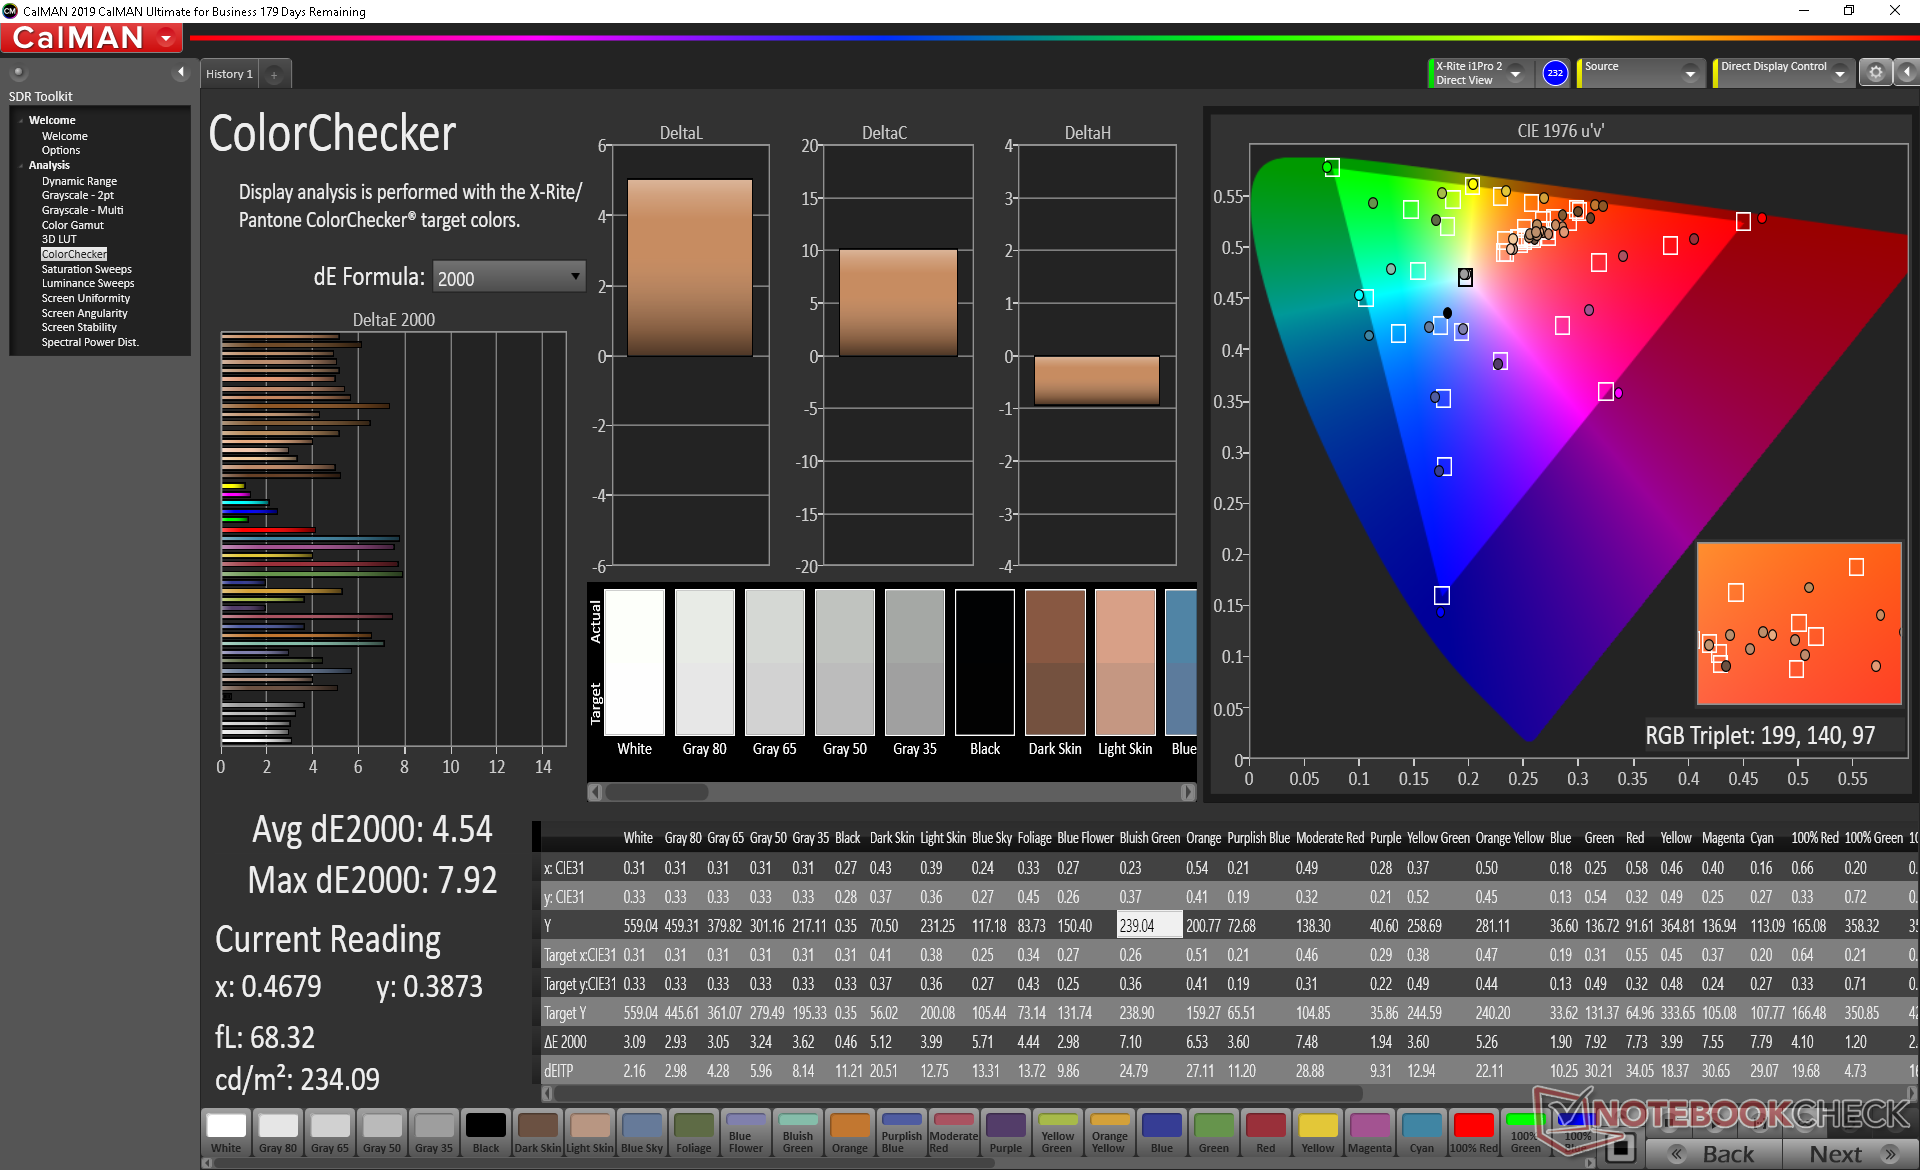
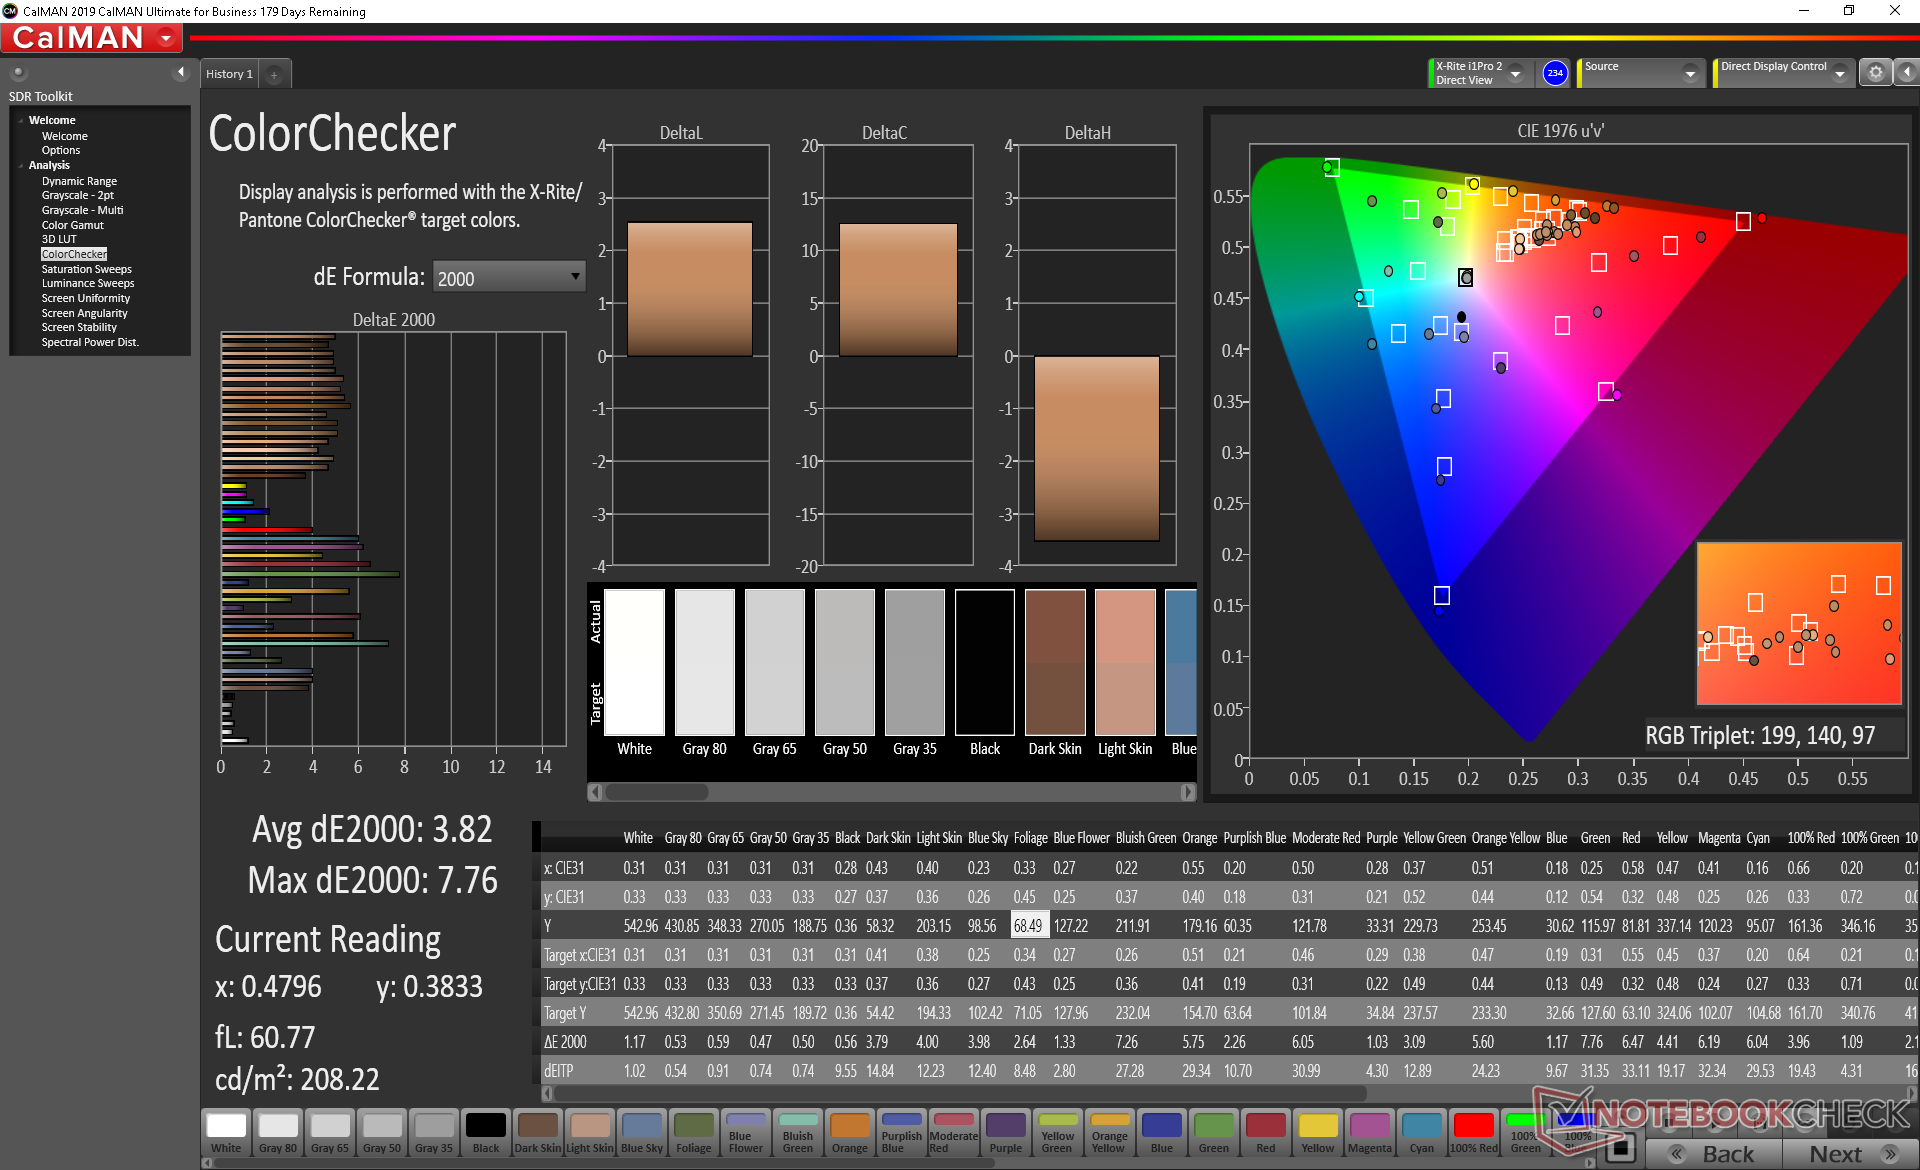
ΔE ColorChecker Calman: 4.54 | ∀{0.5-29.43 Ø4.72}
calibrated: 3.82
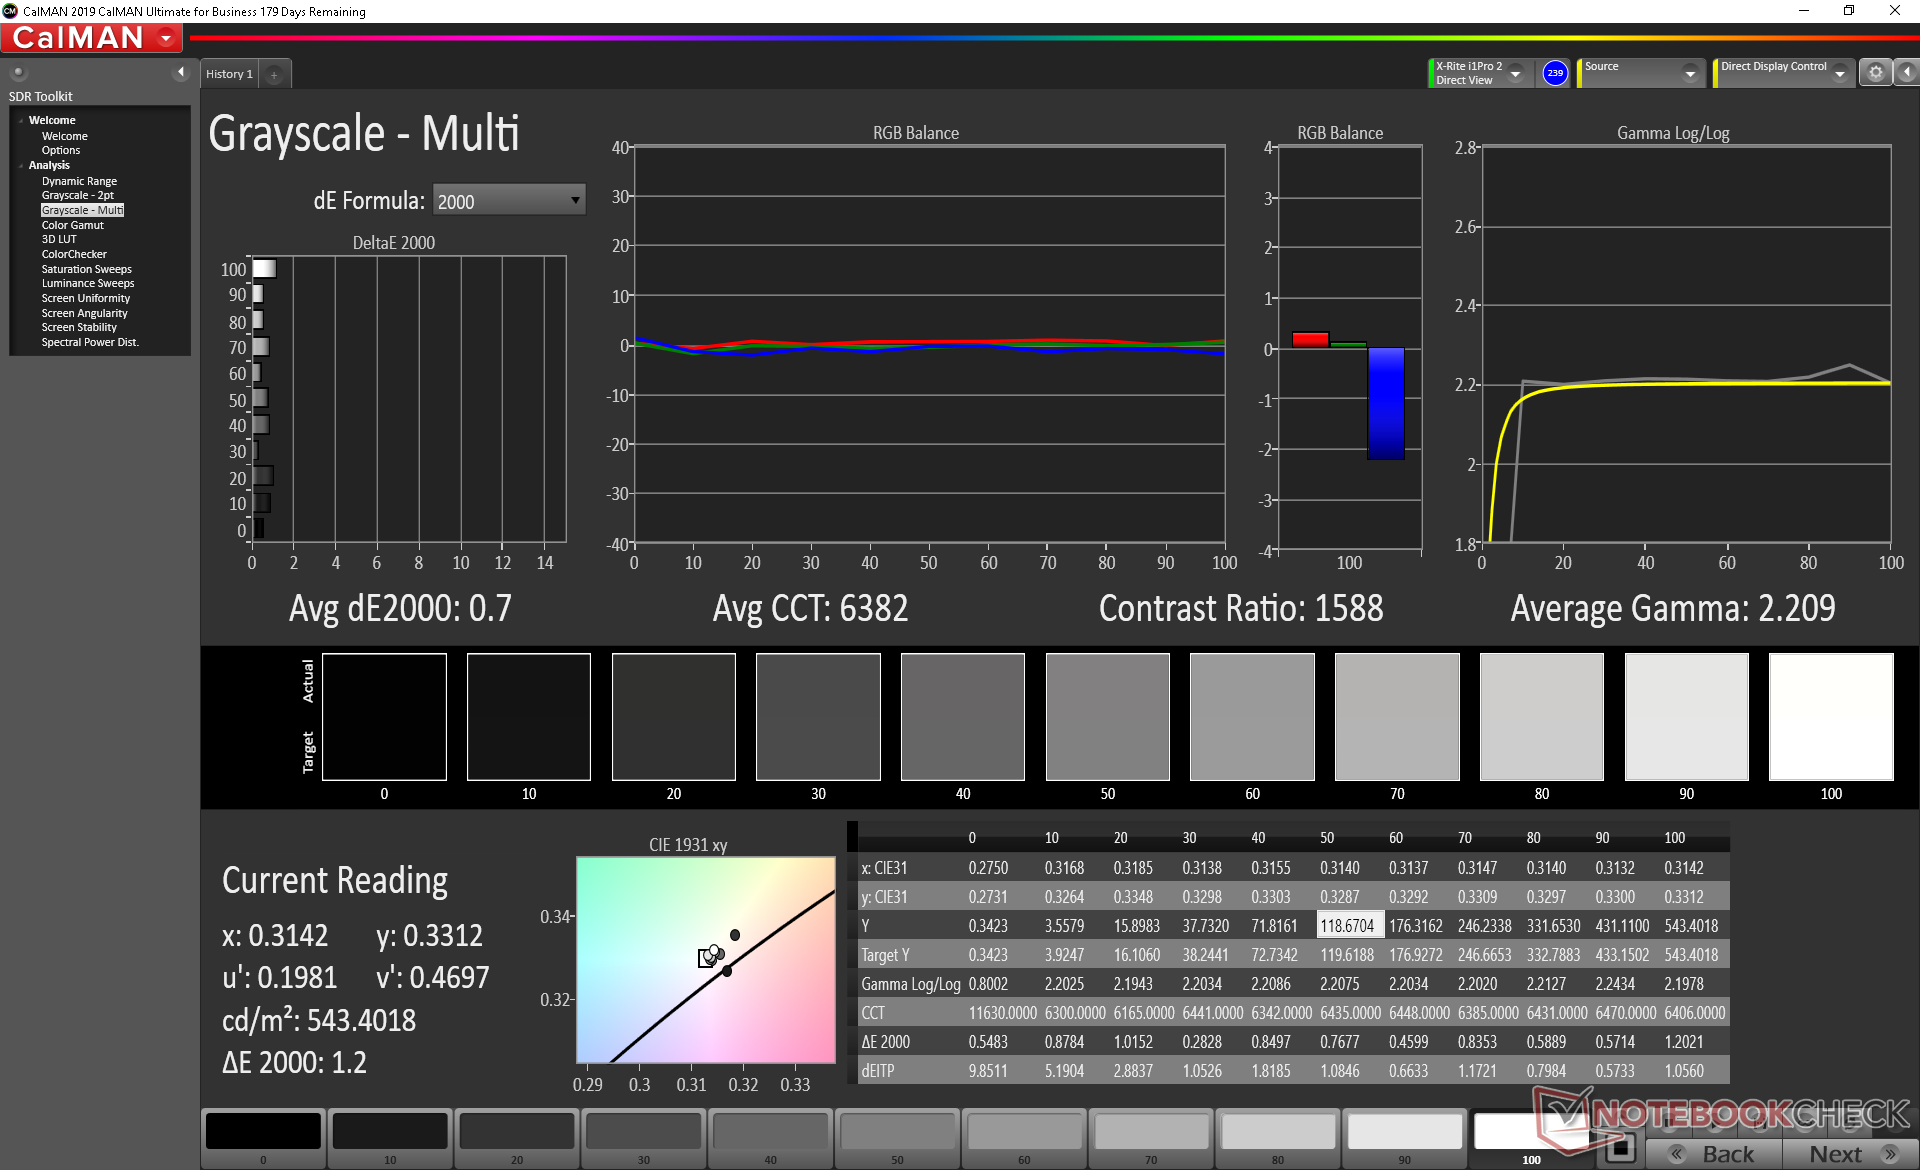
ΔE Greyscale Calman: 3.2 | ∀{0.09-98 Ø4.97}
100% sRGB (Argyll 1.6.3 3D)
89.5% AdobeRGB 1998 (Argyll 1.6.3 3D)
99.8% AdobeRGB 1998 (Argyll 3D)
100% sRGB (Argyll 3D)
89.7% Display P3 (Argyll 3D)
Gamma: 1.99
CCT: 6451 K
| Dell XPS 15 9500 Core i7 4K UHD Sharp LQ156R1, IPS, 15.6", 3840x2400 | Dell XPS 15 9500 Core i5 Sharp LQ156N1, IPS, 15.6", 1920x1200 | Lenovo Yoga C940-15IRH LG Philips LP156WFC-SPU1, IPS, 15.6", 1920x1080 | Asus ZenBook 15 UX534FTC-A8190T BOE CQ NV156FHM-N63, IPS, 15.6", 1920x1080 | MSI Prestige 15 A10SC Sharp LQ156D1JW42, IPS, 15.6", 3840x2160 | Apple MacBook Pro 16 2019 i9 5500M APPA044, IPS, 16", 3072x1920 | |
|---|---|---|---|---|---|---|
| Display | -10% | -25% | -26% | -5% | ||
| Display P3 Coverage (%) | 89.7 | 81.5 -9% | 61.5 -31% | 65 -28% | 82 -9% | |
| sRGB Coverage (%) | 100 | 100 0% | 92.7 -7% | 86.2 -14% | 98.3 -2% | |
| AdobeRGB 1998 Coverage (%) | 99.8 | 79.6 -20% | 63.6 -36% | 62.9 -37% | 96.2 -4% | |
| Response Times | 18% | 0% | 11% | -18% | -1% | |
| Response Time Grey 50% / Grey 80% * (ms) | 54 ? | 42 ? 22% | 48.4 ? 10% | 45 ? 17% | 60 ? -11% | 52.4 ? 3% |
| Response Time Black / White * (ms) | 33.2 ? | 28.8 ? 13% | 36.4 ? -10% | 32 ? 4% | 41.2 ? -24% | 34.9 ? -5% |
| PWM Frequency (Hz) | 26040 ? | 131700 | ||||
| Screen | 4% | -2% | -13% | 0% | 17% | |
| Brightness middle (cd/m²) | 557.9 | 592 6% | 484.8 -13% | 299 -46% | 464.5 -17% | 519 -7% |
| Brightness (cd/m²) | 541 | 565 4% | 463 -14% | 280 -48% | 451 -17% | 477 -12% |
| Brightness Distribution (%) | 91 | 85 -7% | 82 -10% | 89 -2% | 92 1% | 86 -5% |
| Black Level * (cd/m²) | 0.39 | 0.46 -18% | 0.26 33% | 0.21 46% | 0.5 -28% | 0.39 -0% |
| Contrast (:1) | 1431 | 1287 -10% | 1865 30% | 1424 0% | 929 -35% | 1331 -7% |
| Colorchecker dE 2000 * | 4.54 | 3.19 30% | 4.5 1% | 4.76 -5% | 3.36 26% | 2.28 50% |
| Colorchecker dE 2000 max. * | 7.92 | 5.45 31% | 7.55 5% | 9 -14% | 7.06 11% | 6.54 17% |
| Colorchecker dE 2000 calibrated * | 3.82 | 2.03 47% | 1.19 69% | 3.42 10% | 0.86 77% | |
| Greyscale dE 2000 * | 3.2 | 3.9 -22% | 5.7 -78% | 3.53 -10% | 1.3 59% | 0.9 72% |
| Gamma | 1.99 111% | 2.25 98% | 2.45 90% | 2.3 96% | 2.14 103% | 2145 0% |
| CCT | 6451 101% | 6522 100% | 6101 107% | 7228 90% | 6596 99% | 6572 99% |
| Color Space (Percent of AdobeRGB 1998) (%) | 89.5 | 71.6 -20% | 58.7 -34% | 56 -37% | 84.8 -5% | 78 -13% |
| Color Space (Percent of sRGB) (%) | 100 | 100 0% | 92.8 -7% | 86 -14% | 98.3 -2% | |
| Toplam Ortalama (Program / Ayarlar) | 4% /
3% | -9% /
-6% | -9% /
-13% | -8% /
-3% | 8% /
14% |
* ... daha küçük daha iyidir
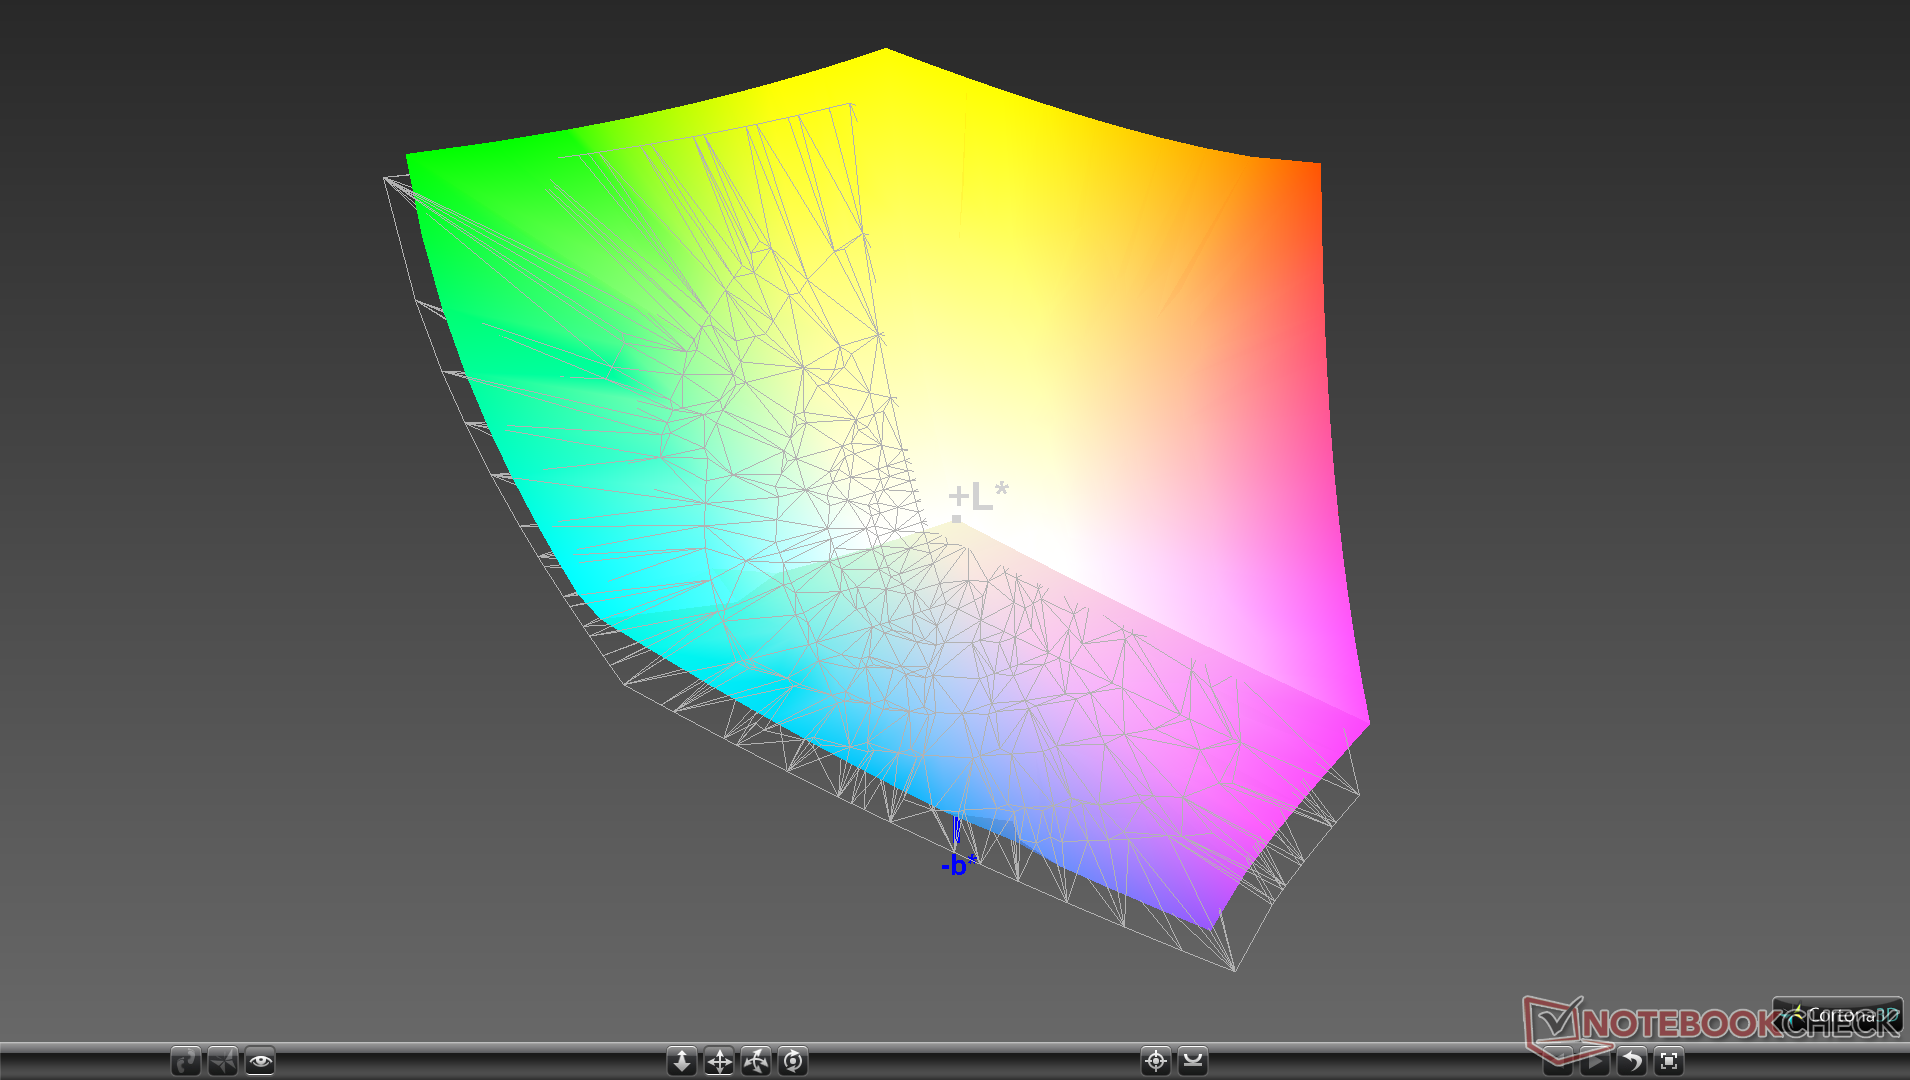
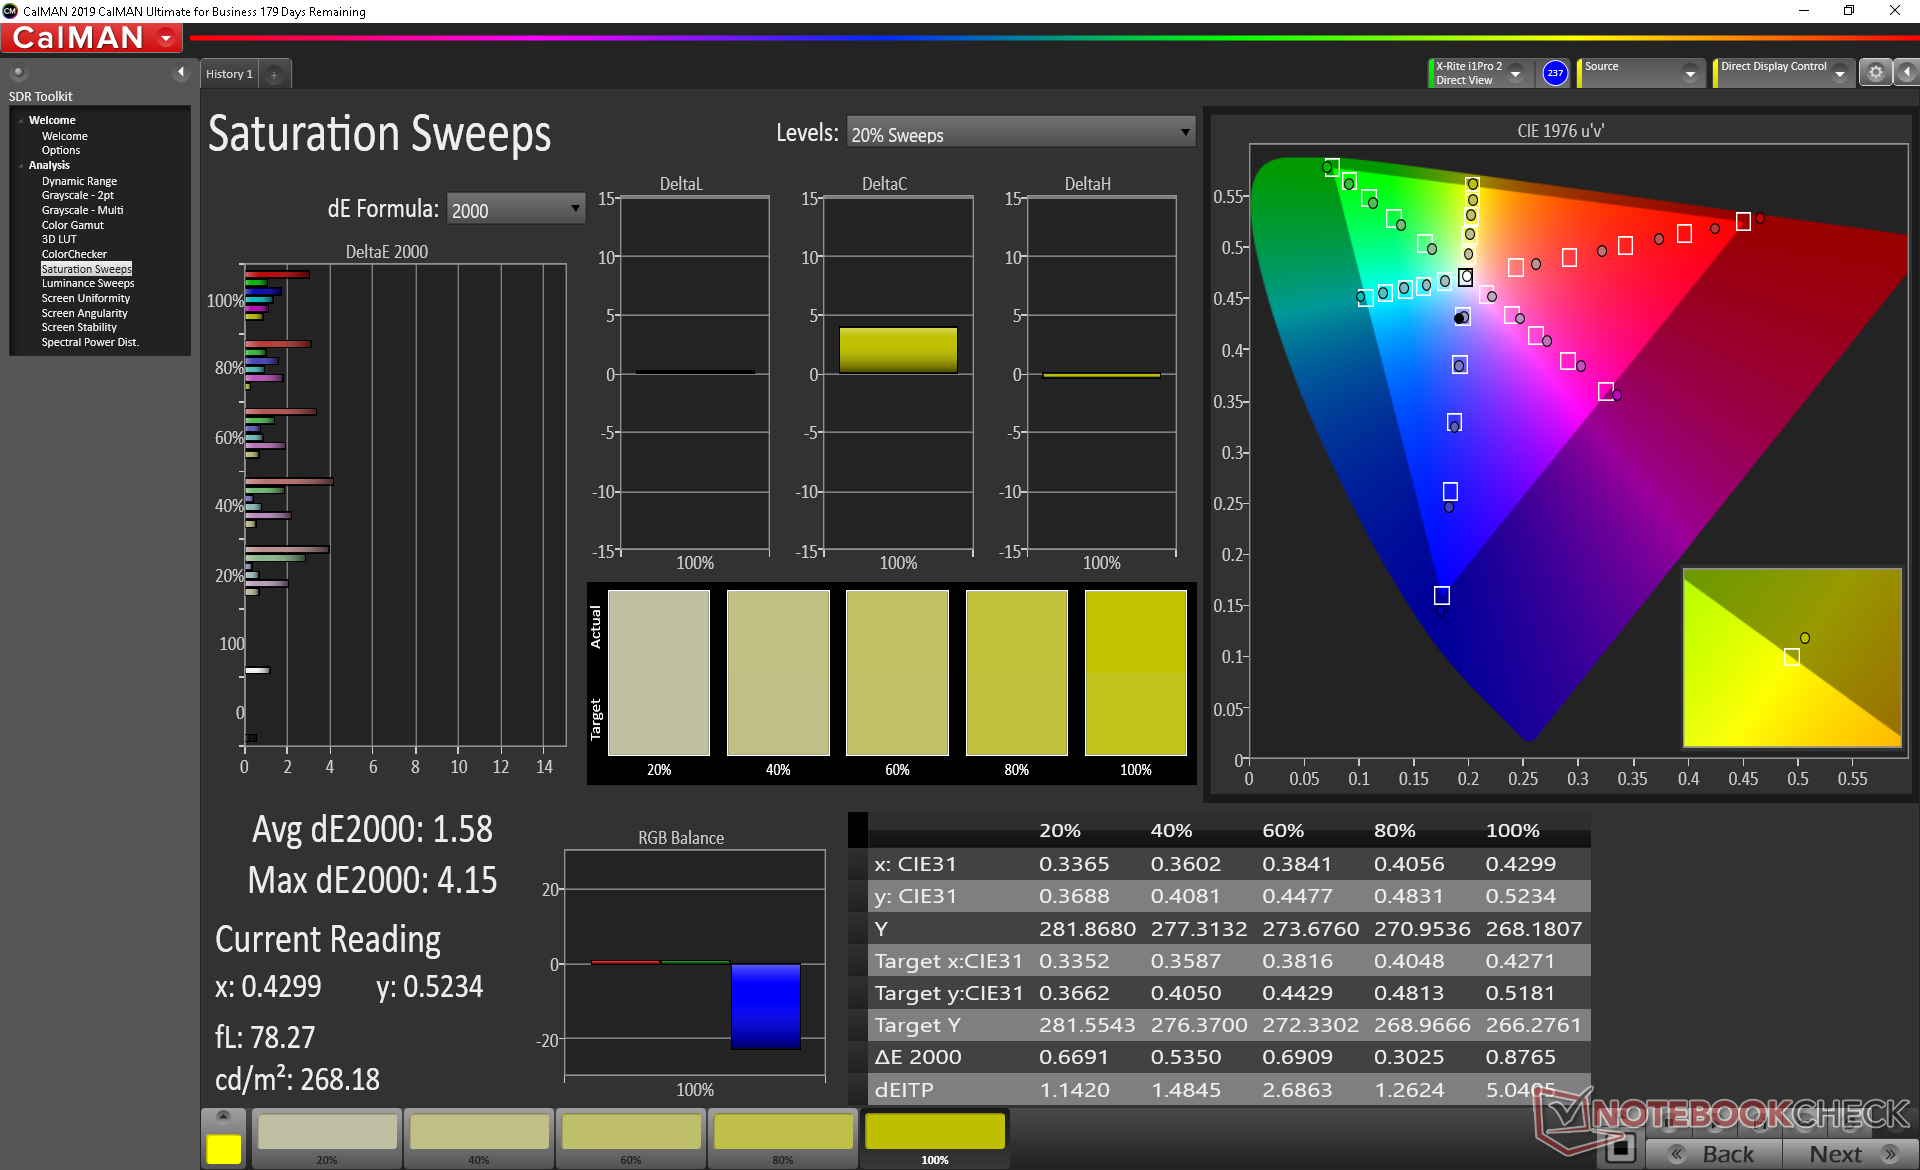
Temel FHD sürümü tüm sRGB'leri kapsarken, 4K UHD sürümümüz daha derin ve potansiyel olarak daha doğru renkler için tüm sRGB'yi ve neredeyse tüm AdobeRGB'yi kapsar.

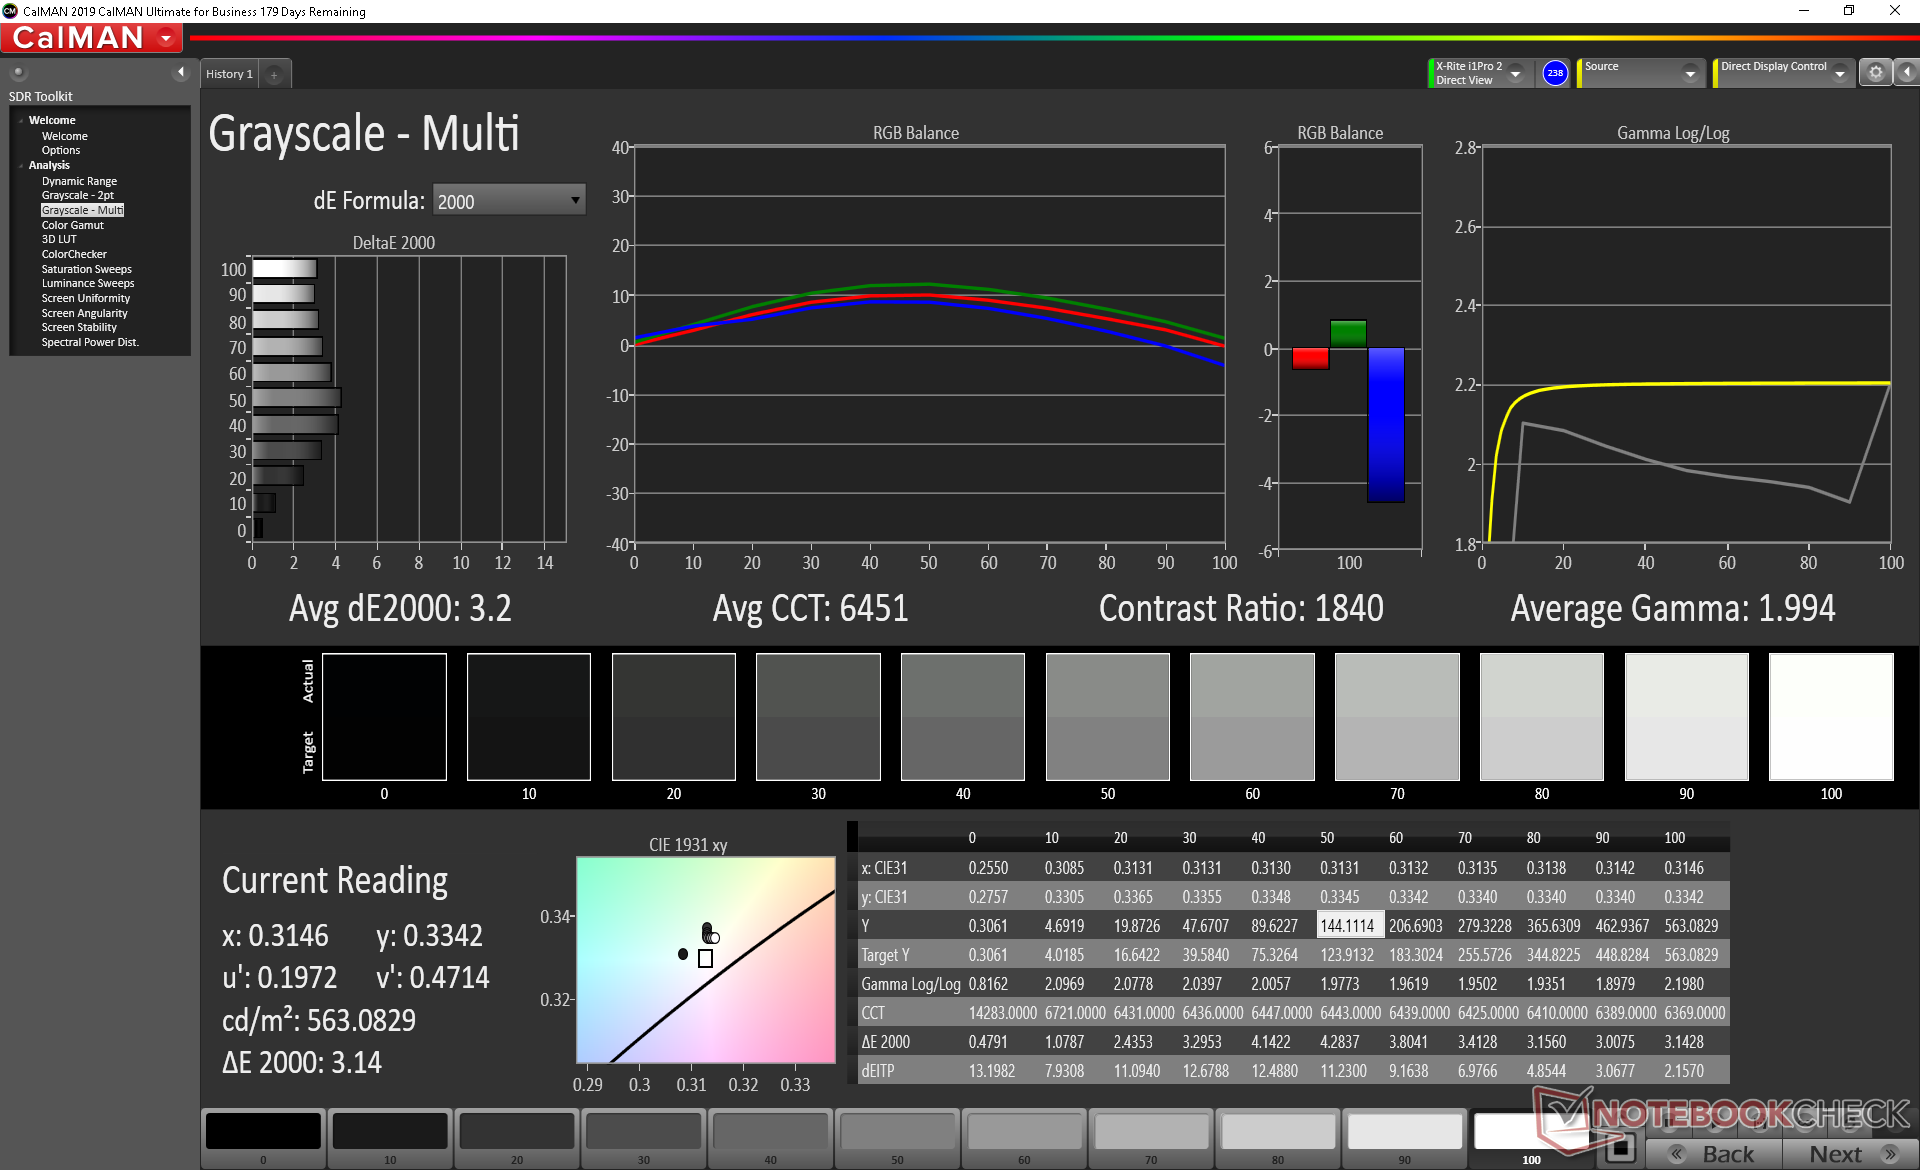
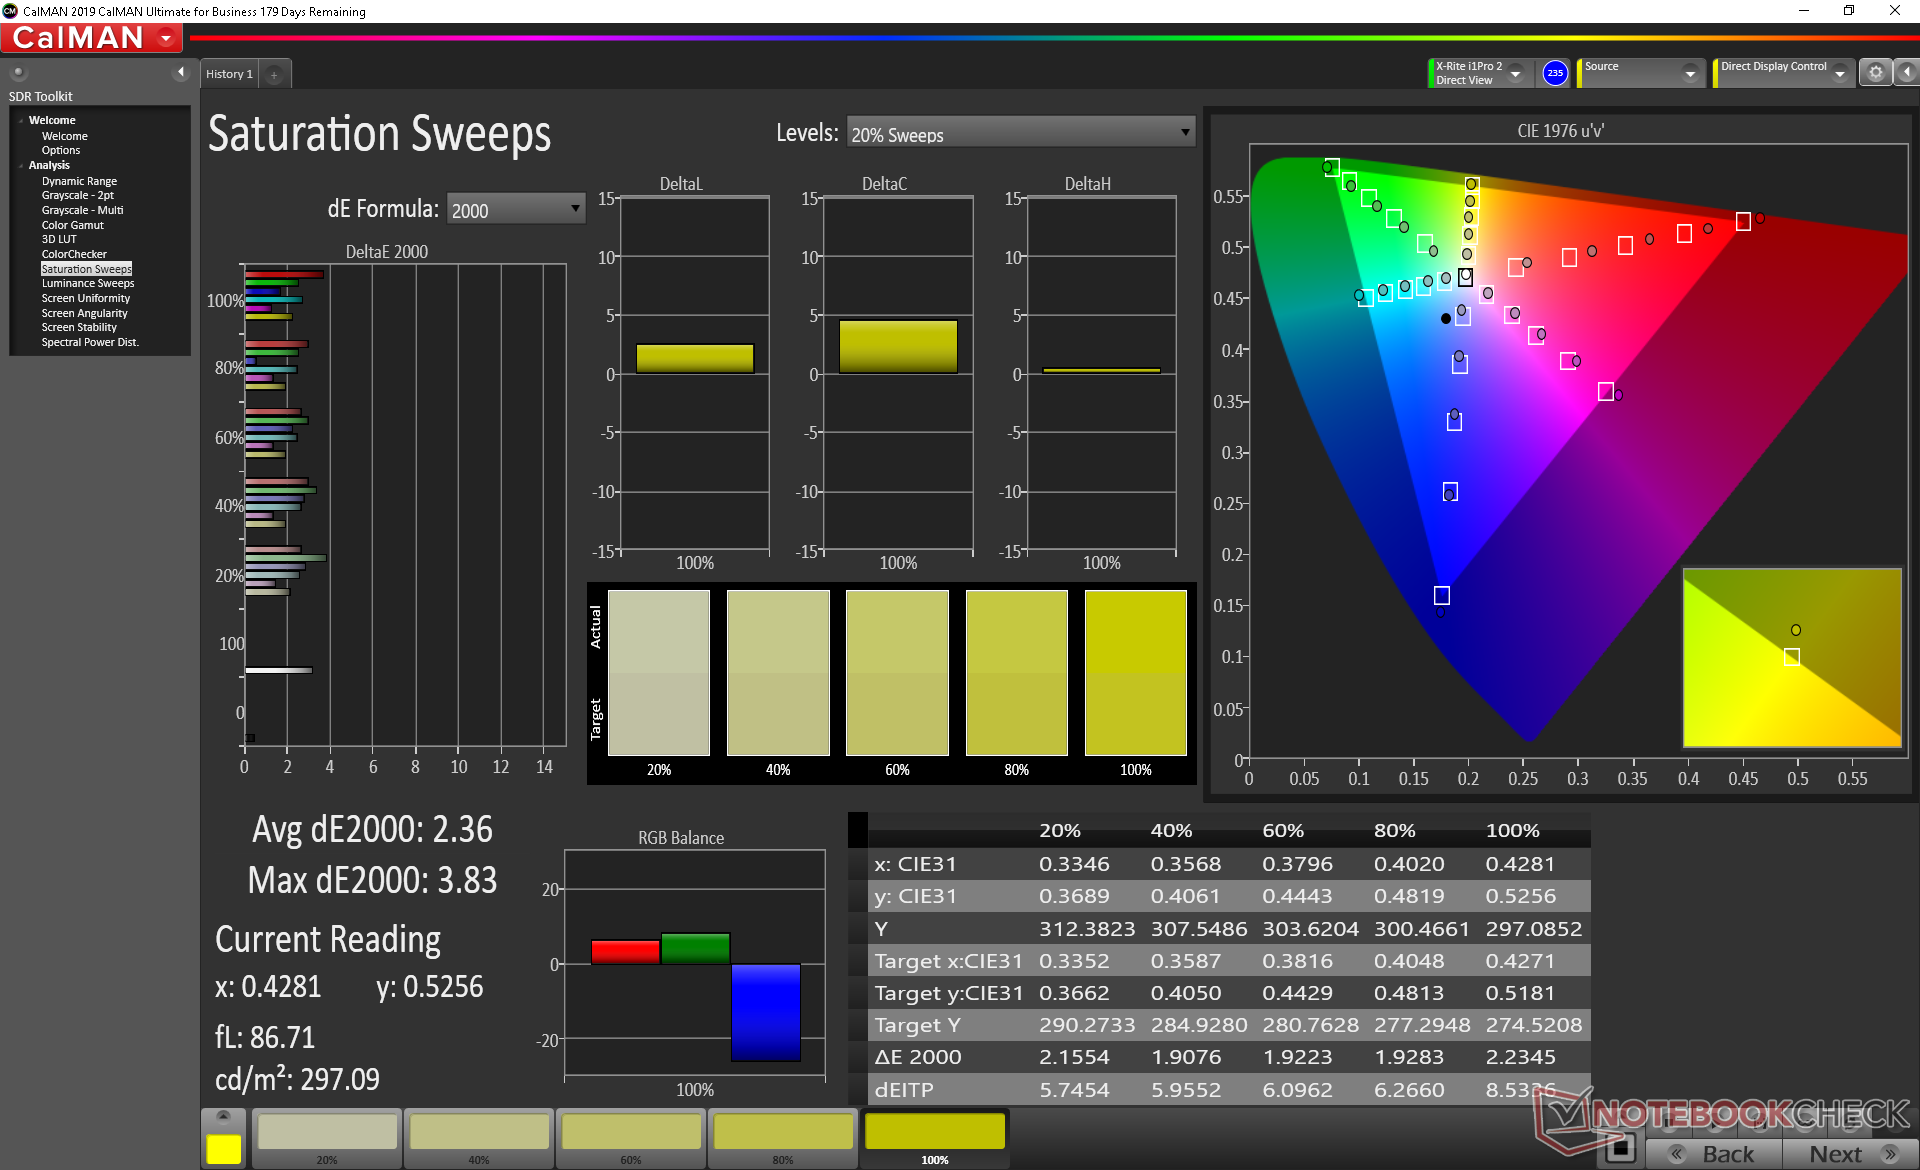
Bir X-Rite kolorimetresi ile yapılan diğer ölçümler, kutunun dışında iyi kalibre edilmiş bir ekran gösterir. Paneli kendimiz kalibre etmek, gri tonlamayı ve renk deltaE değerlerini sadece çok az da olsa iyileştirecektir.
Yanıt Sürelerini Görüntüle
| ↔ Tepki Süresi Siyahtan Beyaza | ||
|---|---|---|
| 33.2 ms ... yükseliş ↗ ve sonbahar↘ birleşimi | ↗ 19.2 ms yükseliş | 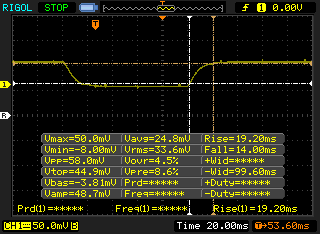 |
| ↘ 14 ms sonbahar | ||
| Ekran, testlerimizde yavaş yanıt oranları gösteriyor ve oyuncular için yetersiz olacaktır. Karşılaştırıldığında, test edilen tüm cihazlar 0.1 (minimum) ile 240 (maksimum) ms arasında değişir. » Tüm cihazların 90 %'si daha iyi. Bu, ölçülen yanıt süresinin test edilen tüm cihazların ortalamasından (19.8 ms) daha kötü olduğu anlamına gelir. | ||
| ↔ Tepki Süresi %50 Griden %80 Griye | ||
| 54 ms ... yükseliş ↗ ve sonbahar↘ birleşimi | ↗ 26.4 ms yükseliş | 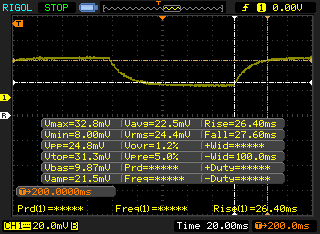 |
| ↘ 27.6 ms sonbahar | ||
| Ekran, testlerimizde yavaş yanıt oranları gösteriyor ve oyuncular için yetersiz olacaktır. Karşılaştırıldığında, test edilen tüm cihazlar 0.165 (minimum) ile 636 (maksimum) ms arasında değişir. » Tüm cihazların 91 %'si daha iyi. Bu, ölçülen yanıt süresinin test edilen tüm cihazların ortalamasından (31 ms) daha kötü olduğu anlamına gelir. | ||
Ekran Titremesi / PWM (Darbe Genişliği Modülasyonu)
| Ekran titriyor / PWM algılanmadı | 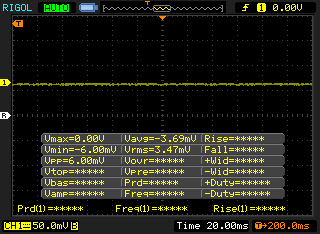 | ||
Karşılaştırıldığında: Test edilen tüm cihazların %52 %'si ekranı karartmak için PWM kullanmıyor. PWM tespit edilirse, ortalama 7753 (minimum: 5 - maksimum: 343500) Hz ölçüldü. | |||
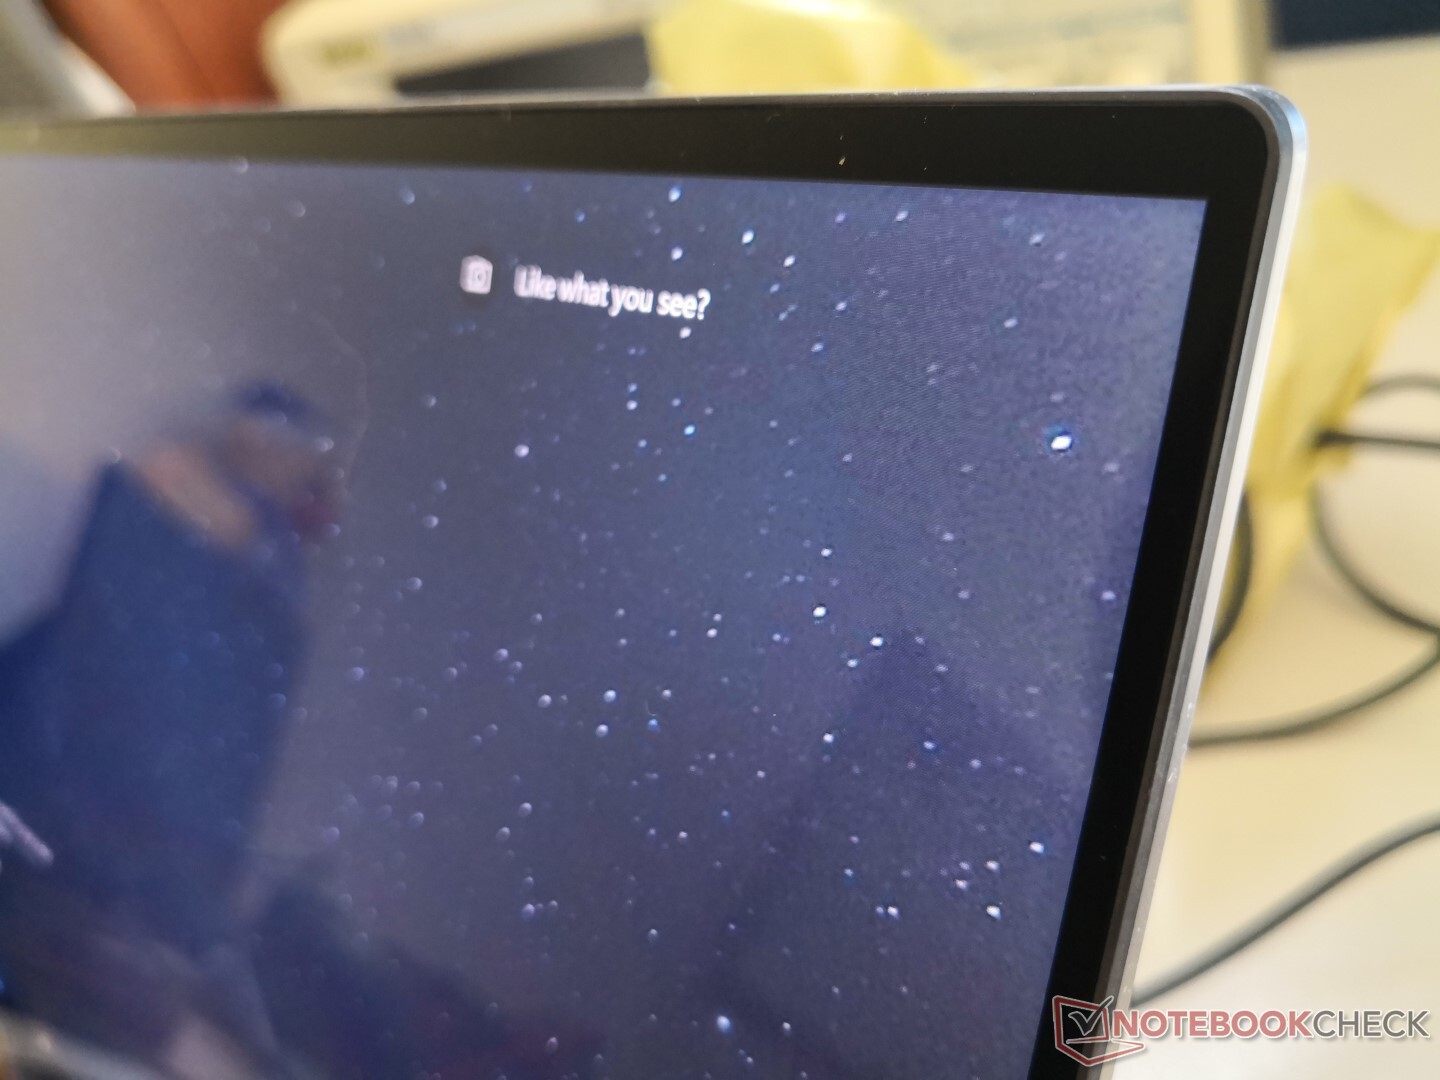
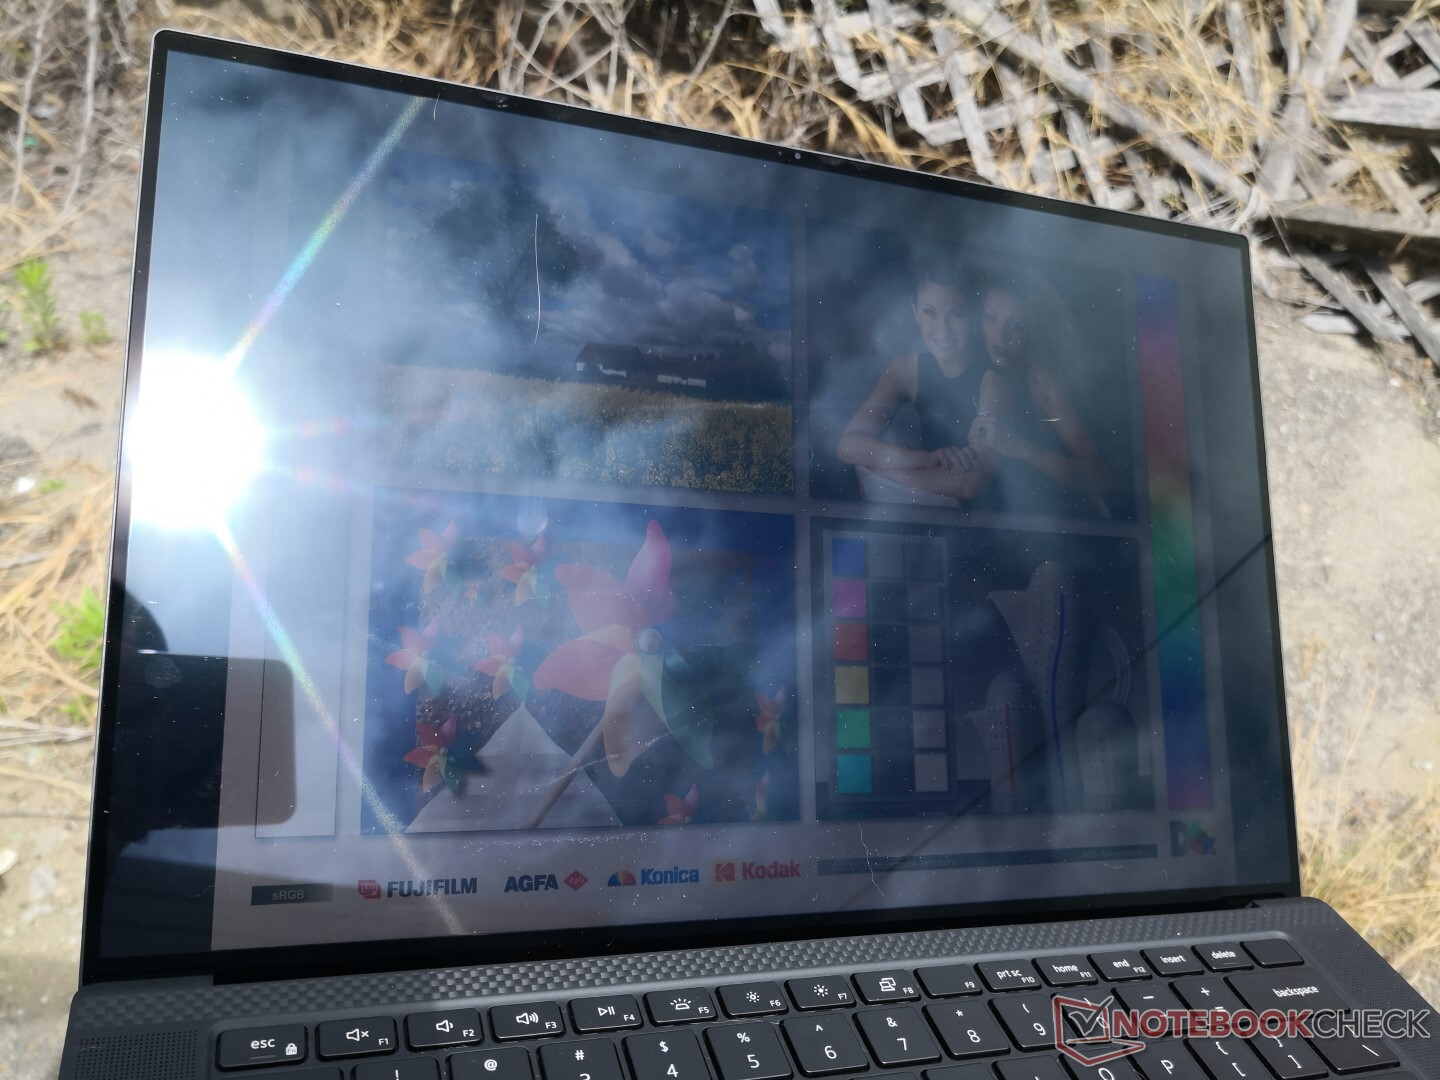
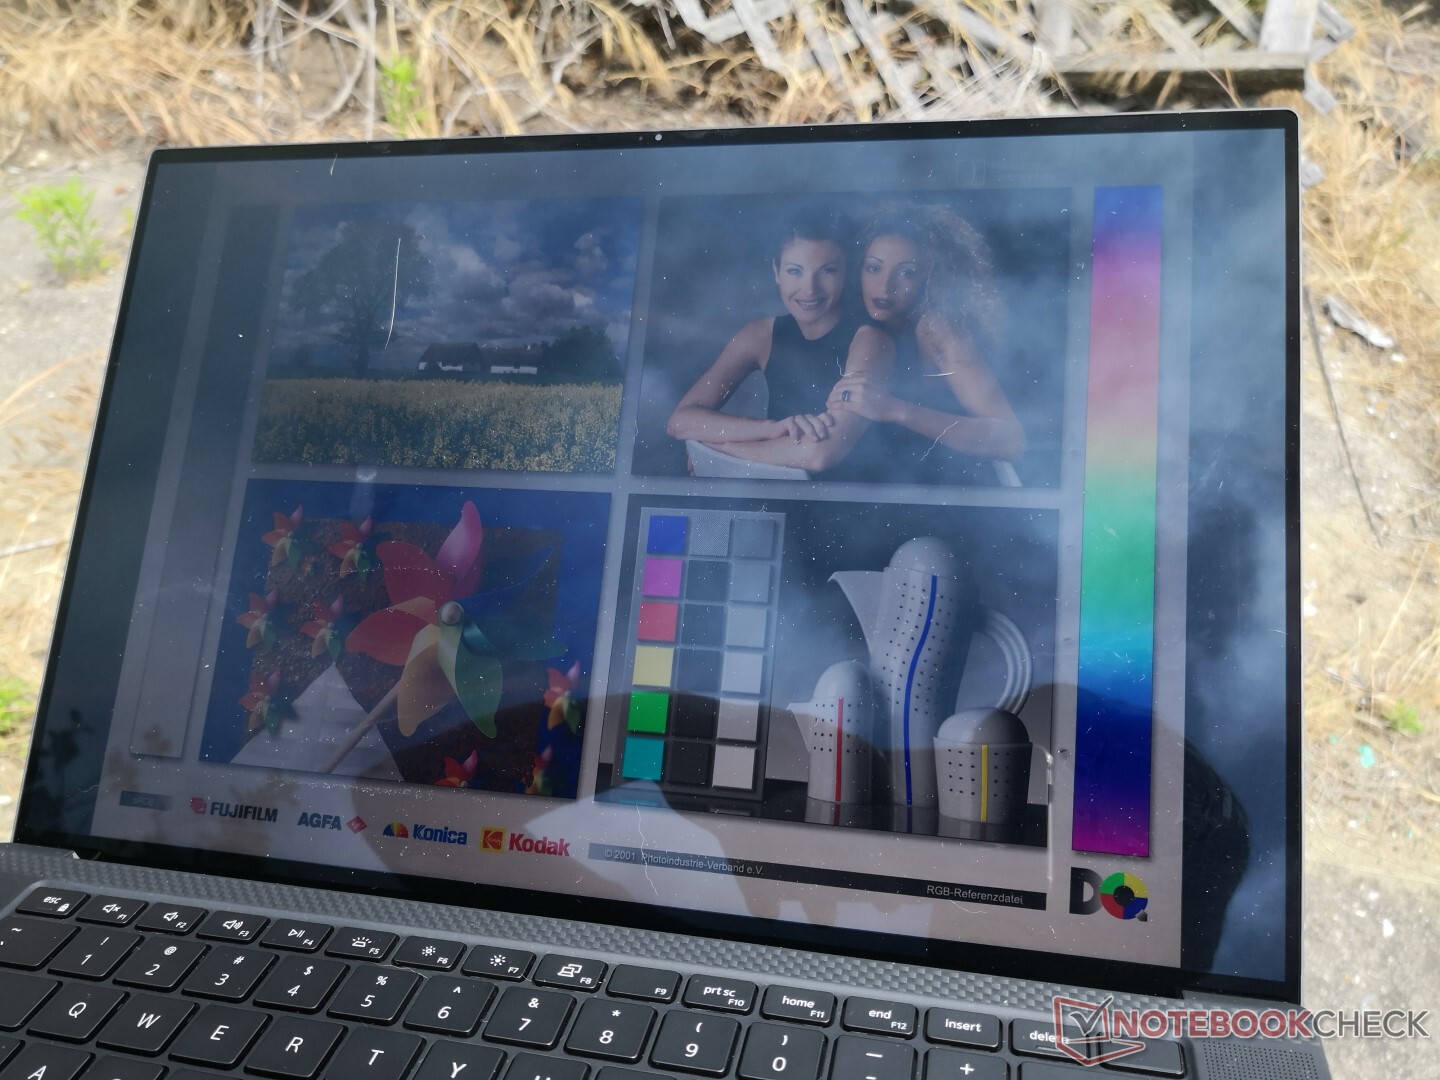
Mat FHD sürümünü parlak 4K sürümüne tercih etmek için herhangi bir neden varsa, dış mekan görünürlüğü için olurdu. Parlama burada daha ağırdır ve arka ışık, yukarıda belirtildiği gibi FHD sürümü kadar parlak değildir. Bununla birlikte, arka ışık ortalamanın üzerinde daha parlak olduğu için XPS, dış mekanlarda diğer Ultrabook'lardan daha iyidir. Intel Graphics Command Center uygulaması aracılığıyla ek ayarların değiştirilmesi gerektiğini veya pil gücüyle çalışırken maksimum parlaklığın 559 nit'den 474 nite düşeceğini unutmayın. Bu fenomen XPS 13 9300 serisinde de ortaya çıkacaktı.


Verim
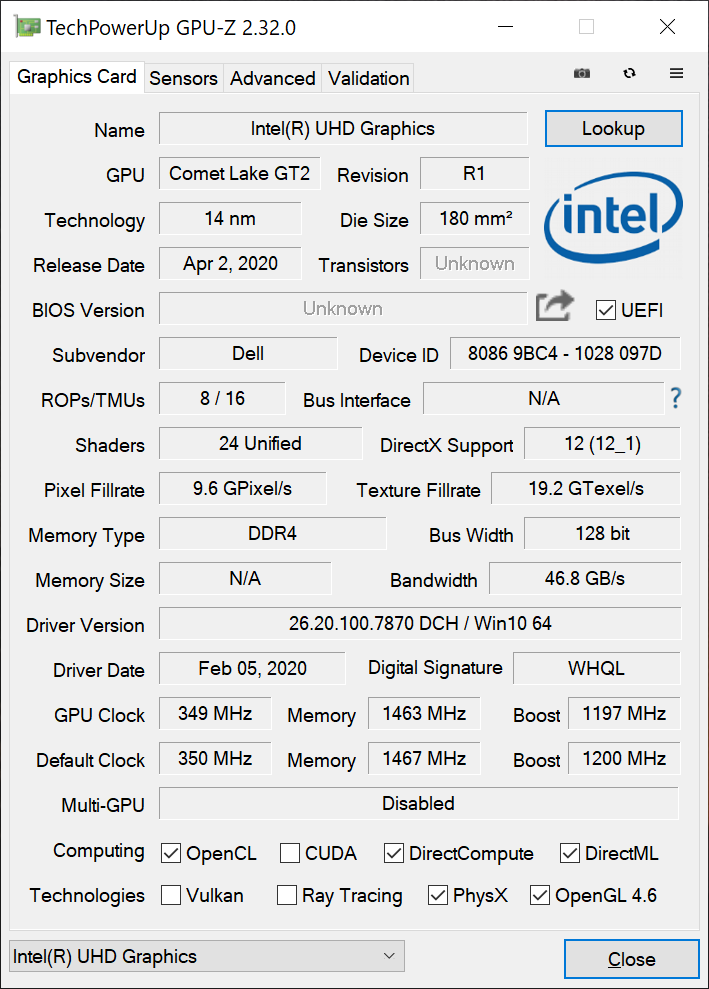
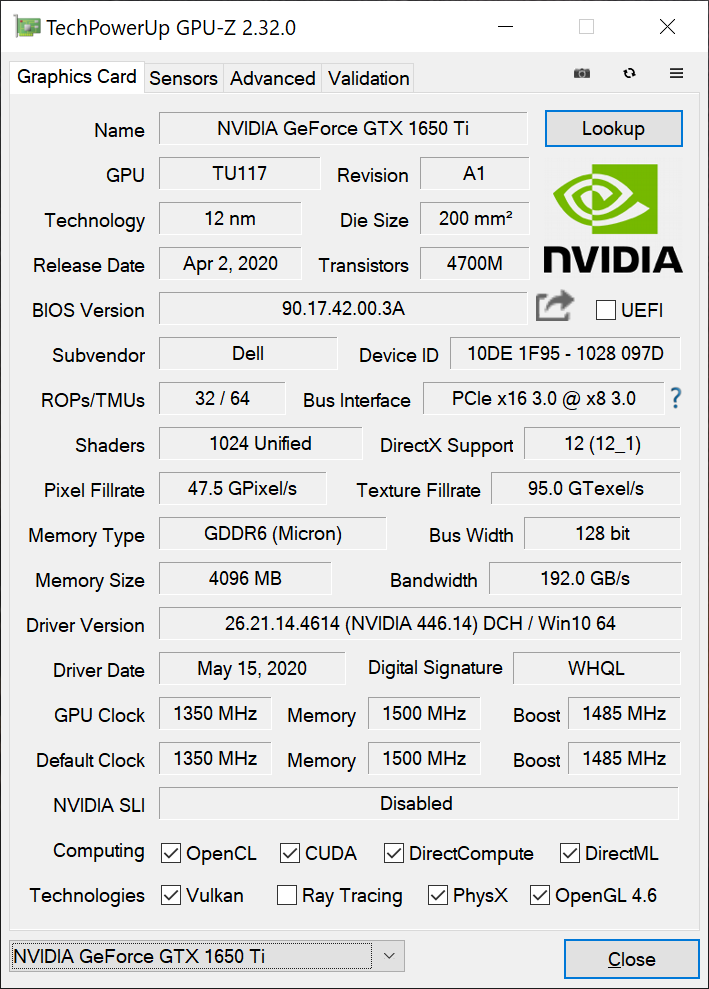
Şu anda XPS 15 9500 için en üst düzey CPU seçeneği, burada sahip olduğumuz Comet Lake-H Core i7-10875H. Bu nedenle, XPS 15 7590'da aksine en azından şimdilik konuşacak Core i9 seçeneği yoktur. Bu muhtemelen en iyisi için Core i9-9980HK'nın Core i7-9750H'ye o kadar yakın bir performans göstereceği göz önüne alındığında Core i9 SKU'yu Core i7 SKU'ya önermek zor oldu. GPU için ise XPS 15 9500 bir Geçen yılki GTX 1650'nin yerini alacak olan ilk GeForce GTX 1650 Ti'yi taşıdı. Dell'in termal sınırlamalar nedeniyle daha da hızlı GTX 1660 Ti sunamadığından şüpheleniyoruz. Kullanıcıların, üst düzey GPU'ların bulunduğu Gigabyte Aero 15, Razer Blade 15 veya Eluktronics RP-15 gibi alternatifleri göz önünde bulundurmaları gerekecektir. Aşağıdaki tüm performans kıyaslama testleri, aksi belirtilmedikçe Dell'in Ultra Performans modunda gerçekleştirilmiştir. Optimus standart olarak geliyor.
İşlemci
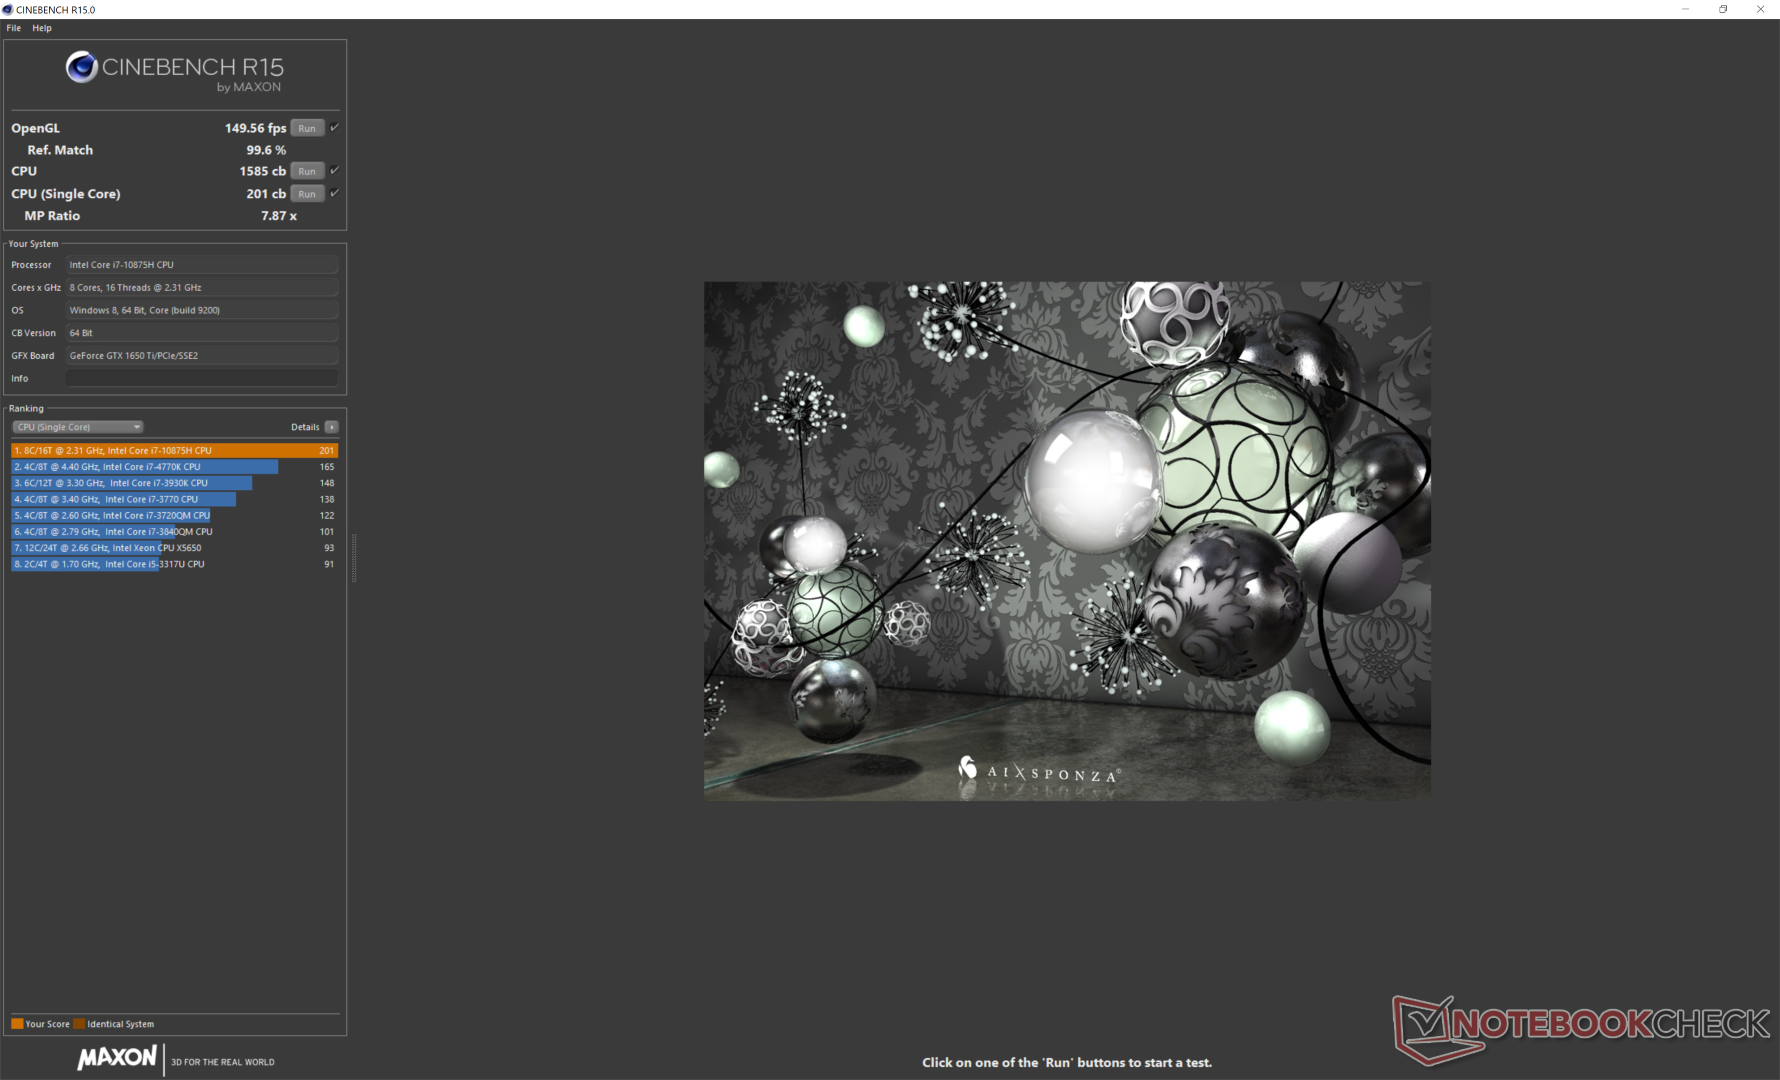
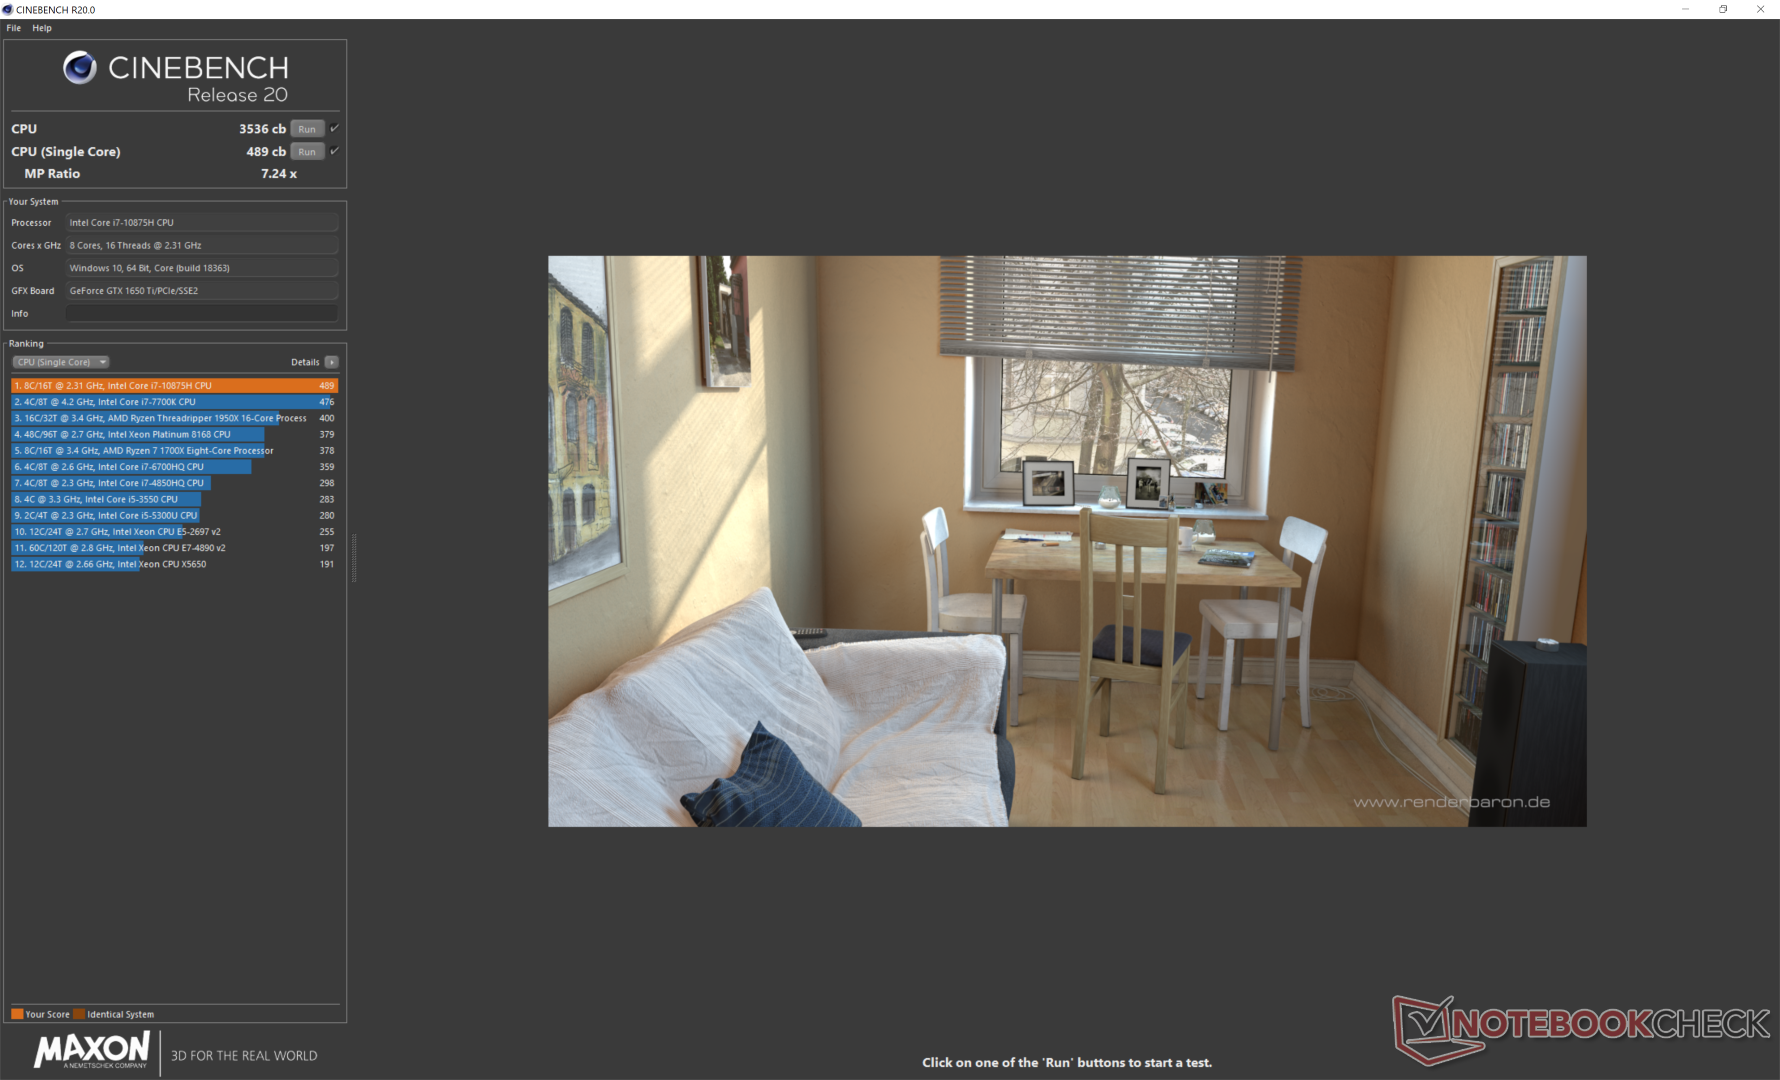
Bir Core i7 olmasına rağmen, 10. nesil Core i7-10875H, 9. nesil Core i9-9880H veya Core i9-9980HK'nın ardışık olarak okta çekirdekli bir CPU olduğundan daha fazla görülebilir. . Aslında, CineBench kriterlerine göre performans geçen yılki XPS 15 7590'da Core i9-9980HK'ya zaten çok yakın. Temel dört çekirdekli Core i5-10300H veya orta sınıf Core i7-10750H'den yükseltme yapan kullanıcılar, sırasıyla bir döngüdeki çok yönlü performans artışlarını sırasıyla yüzde 50 ve yüzde 25 görecekler. modelleri. 1390 puanlık ilk puan düşerek sadece yüzde 7'lik bir performans düşüşünü göstermek için yaklaşık 1290 puana sabitlenecektir. Dell XPS serisi için hala AMD Ryzen seçeneği bulunmaması çok kötü. Örneğin Ryzen 7 4800H, herhangi bir mobil Intel 10. nesil Core i7 modelinden ve hatta birçok Core i9 modelinden daha iyi performans gösterebilir.
Cinebench R15: CPU Multi 64Bit | CPU Single 64Bit
Blender: v2.79 BMW27 CPU
7-Zip 18.03: 7z b 4 -mmt1 | 7z b 4
Geekbench 5.5: Single-Core | Multi-Core
HWBOT x265 Benchmark v2.2: 4k Preset
LibreOffice : 20 Documents To PDF
R Benchmark 2.5: Overall mean
| Cinebench R20 / CPU (Multi Core) | |
| Eluktronics RP-15 | |
| MSI GS66 Stealth 10SFS | |
| Ortalama Intel Core i7-10875H (1986 - 4176, n=32) | |
| Dell XPS 15 7590 9980HK GTX 1650 | |
| Dell XPS 15 9500 Core i7 4K UHD | |
| Apple MacBook Pro 15 2019 i9 Vega 16 | |
| Medion Erazer X15805 | |
| Razer Blade 15 RZ09-0328 | |
| Lenovo IdeaPad S740-15IRH | |
| Schenker Work 15 | |
| Dell XPS 15 9500 Core i5 | |
| MSI Alpha 15 A3DDK-034 | |
| Cinebench R20 / CPU (Single Core) | |
| Medion Erazer X15805 | |
| Dell XPS 15 9500 Core i7 4K UHD | |
| Eluktronics RP-15 | |
| Ortalama Intel Core i7-10875H (430 - 524, n=32) | |
| MSI GS66 Stealth 10SFS | |
| Razer Blade 15 RZ09-0328 | |
| Apple MacBook Pro 15 2019 i9 Vega 16 | |
| Lenovo IdeaPad S740-15IRH | |
| Dell XPS 15 7590 9980HK GTX 1650 | |
| Dell XPS 15 9500 Core i5 | |
| Schenker Work 15 | |
| MSI Alpha 15 A3DDK-034 | |
| Cinebench R15 / CPU Multi 64Bit | |
| Eluktronics RP-15 | |
| MSI GS66 Stealth 10SFS | |
| Dell XPS 15 7590 9980HK GTX 1650 | |
| Ortalama Intel Core i7-10875H (1003 - 1833, n=38) | |
| Dell XPS 15 9500 Core i7 4K UHD | |
| Apple MacBook Pro 15 2019 i9 Vega 16 | |
| Medion Erazer X15805 | |
| Razer Blade 15 RZ09-0328 | |
| Lenovo IdeaPad S740-15IRH | |
| Schenker Work 15 | |
| Dell XPS 15 9500 Core i5 | |
| MSI Alpha 15 A3DDK-034 | |
| Cinebench R15 / CPU Single 64Bit | |
| Dell XPS 15 9500 Core i7 4K UHD | |
| Ortalama Intel Core i7-10875H (190 - 220, n=37) | |
| Medion Erazer X15805 | |
| Dell XPS 15 7590 9980HK GTX 1650 | |
| MSI GS66 Stealth 10SFS | |
| Razer Blade 15 RZ09-0328 | |
| Lenovo IdeaPad S740-15IRH | |
| Eluktronics RP-15 | |
| Dell XPS 15 9500 Core i5 | |
| Apple MacBook Pro 15 2019 i9 Vega 16 | |
| Schenker Work 15 | |
| MSI Alpha 15 A3DDK-034 | |
| Blender / v2.79 BMW27 CPU | |
| Dell XPS 15 9500 Core i5 | |
| Schenker Work 15 | |
| Schenker Work 15 | |
| Razer Blade 15 RZ09-0328 | |
| Apple MacBook Pro 15 2019 i9 Vega 16 | |
| Dell XPS 15 9500 Core i7 4K UHD | |
| Ortalama Intel Core i7-10875H (259 - 535, n=30) | |
| MSI GS66 Stealth 10SFS | |
| Eluktronics RP-15 | |
| 7-Zip 18.03 / 7z b 4 -mmt1 | |
| Ortalama Intel Core i7-10875H (5071 - 5780, n=31) | |
| Dell XPS 15 9500 Core i7 4K UHD | |
| MSI GS66 Stealth 10SFS | |
| Razer Blade 15 RZ09-0328 | |
| Dell XPS 15 9500 Core i5 | |
| Eluktronics RP-15 | |
| Schenker Work 15 | |
| Schenker Work 15 | |
| 7-Zip 18.03 / 7z b 4 | |
| Eluktronics RP-15 | |
| MSI GS66 Stealth 10SFS | |
| Ortalama Intel Core i7-10875H (29844 - 49562, n=31) | |
| Dell XPS 15 9500 Core i7 4K UHD | |
| Razer Blade 15 RZ09-0328 | |
| Schenker Work 15 | |
| Schenker Work 15 | |
| Dell XPS 15 9500 Core i5 | |
| Geekbench 5.5 / Single-Core | |
| Dell XPS 15 9500 Core i7 4K UHD | |
| Ortalama Intel Core i7-10875H (1233 - 1371, n=29) | |
| MSI GS66 Stealth 10SFS | |
| Eluktronics RP-15 | |
| Dell XPS 15 9500 Core i5 | |
| Razer Blade 15 RZ09-0328 | |
| MSI Alpha 15 A3DDK-034 | |
| Geekbench 5.5 / Multi-Core | |
| Eluktronics RP-15 | |
| Dell XPS 15 9500 Core i7 4K UHD | |
| Ortalama Intel Core i7-10875H (5715 - 8620, n=29) | |
| MSI GS66 Stealth 10SFS | |
| Razer Blade 15 RZ09-0328 | |
| Dell XPS 15 9500 Core i5 | |
| MSI Alpha 15 A3DDK-034 | |
| HWBOT x265 Benchmark v2.2 / 4k Preset | |
| Eluktronics RP-15 | |
| MSI GS66 Stealth 10SFS | |
| Ortalama Intel Core i7-10875H (7.27 - 14.1, n=27) | |
| Dell XPS 15 9500 Core i7 4K UHD | |
| Razer Blade 15 RZ09-0328 | |
| Schenker Work 15 | |
| Schenker Work 15 | |
| Dell XPS 15 9500 Core i5 | |
| LibreOffice / 20 Documents To PDF | |
| Dell XPS 15 9500 Core i5 | |
| Eluktronics RP-15 | |
| Razer Blade 15 RZ09-0328 | |
| Dell XPS 15 9500 Core i7 4K UHD | |
| MSI GS66 Stealth 10SFS | |
| Ortalama Intel Core i7-10875H (30.2 - 84.3, n=30) | |
| R Benchmark 2.5 / Overall mean | |
| Dell XPS 15 9500 Core i5 | |
| MSI GS66 Stealth 10SFS | |
| Dell XPS 15 9500 Core i7 4K UHD | |
| Ortalama Intel Core i7-10875H (0.546 - 0.662, n=29) | |
| Eluktronics RP-15 | |
* ... daha küçük daha iyidir
Sistem performansı
PCMark karşılaştırmaları, Core i5 XPS 15 9500 yapılandırmasının tutarlı bir şekilde önündeyken, geçen yıl Digital Creation karşılaştırmasında XPS 15 7590'ın gerisinde kalıyor. Bu özel alt test hiç bu kadar güvenilir olmamıştı ve bu nedenle çoğu durumda göz ardı edilebilir. Test ünitesi ile zamanımız boyunca hiçbir yazılım veya donanım sorunu yaşamadık. Ayrıca, XPS 15 9500 Core i5 birimimizde gördüğümüz tuhaf USB davranışını yeniden üretemedik.
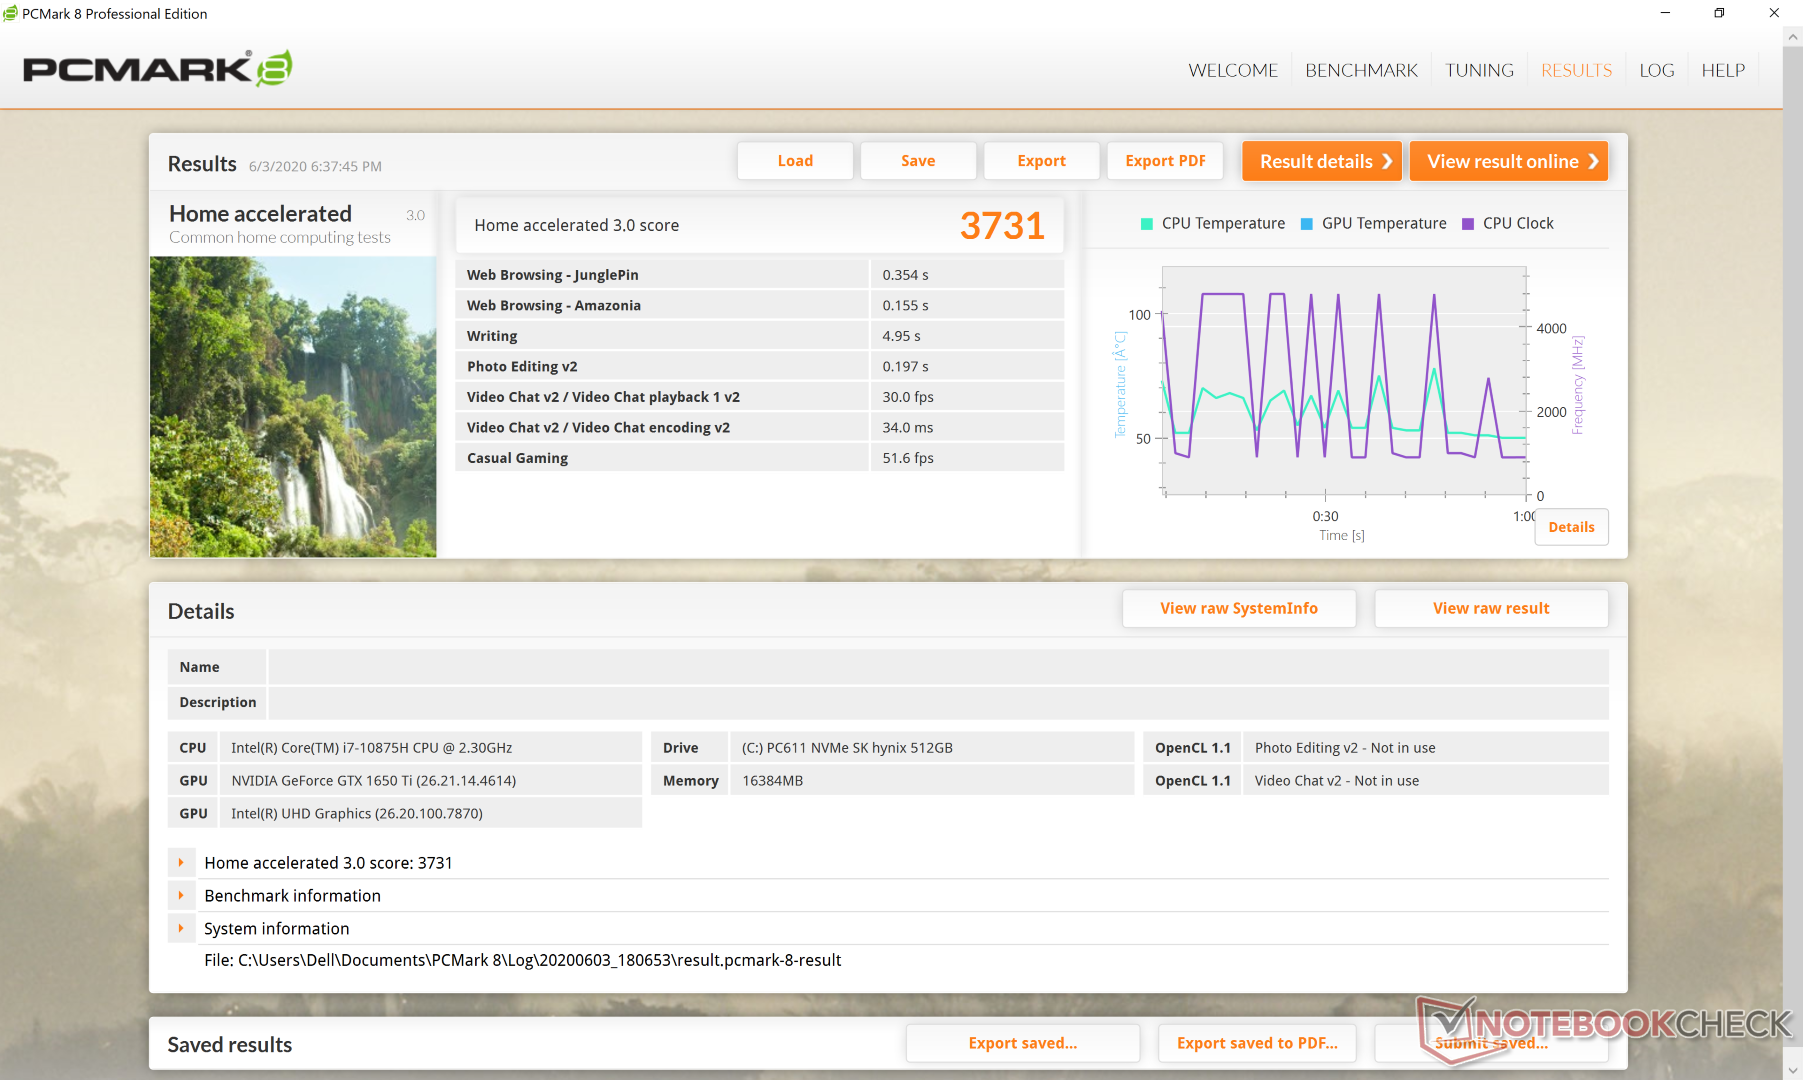

| PCMark 8 Home Score Accelerated v2 | 3731 puan | |
| PCMark 8 Work Score Accelerated v2 | 4540 puan | |
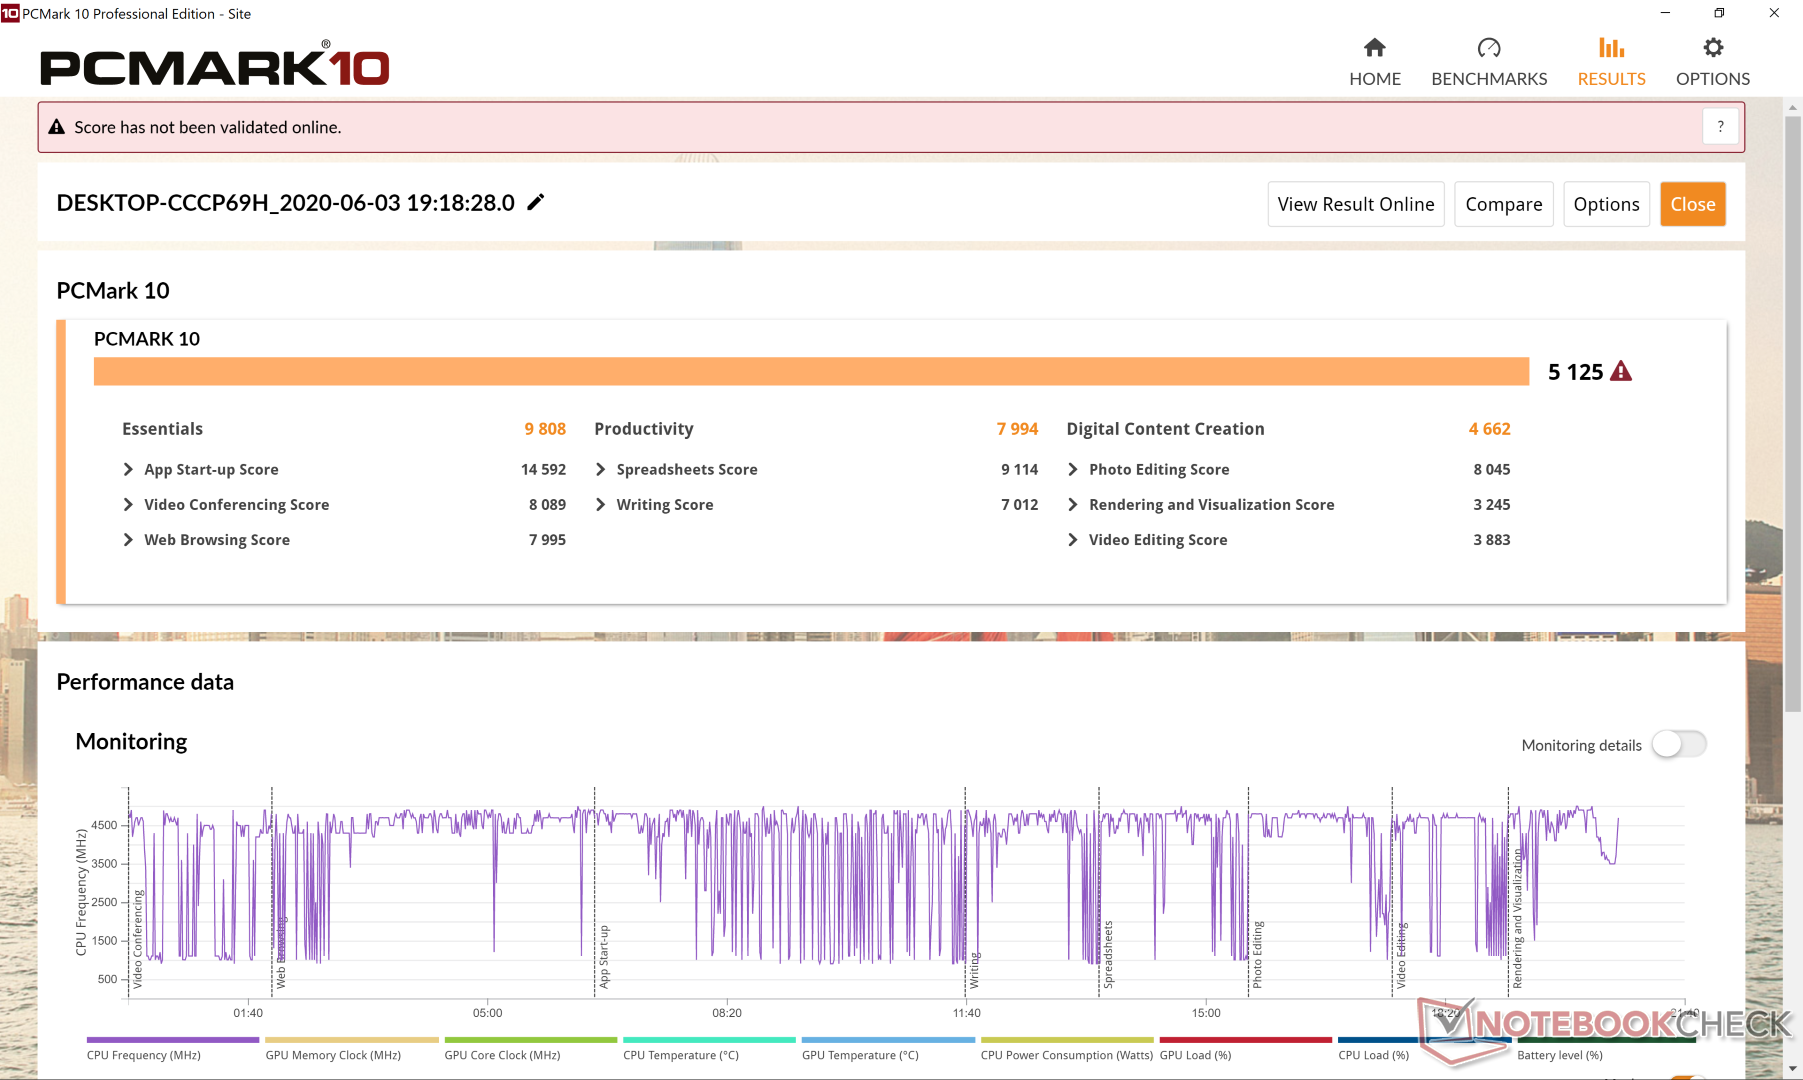
| PCMark 10 Score | 5125 puan | |
Yardım | ||
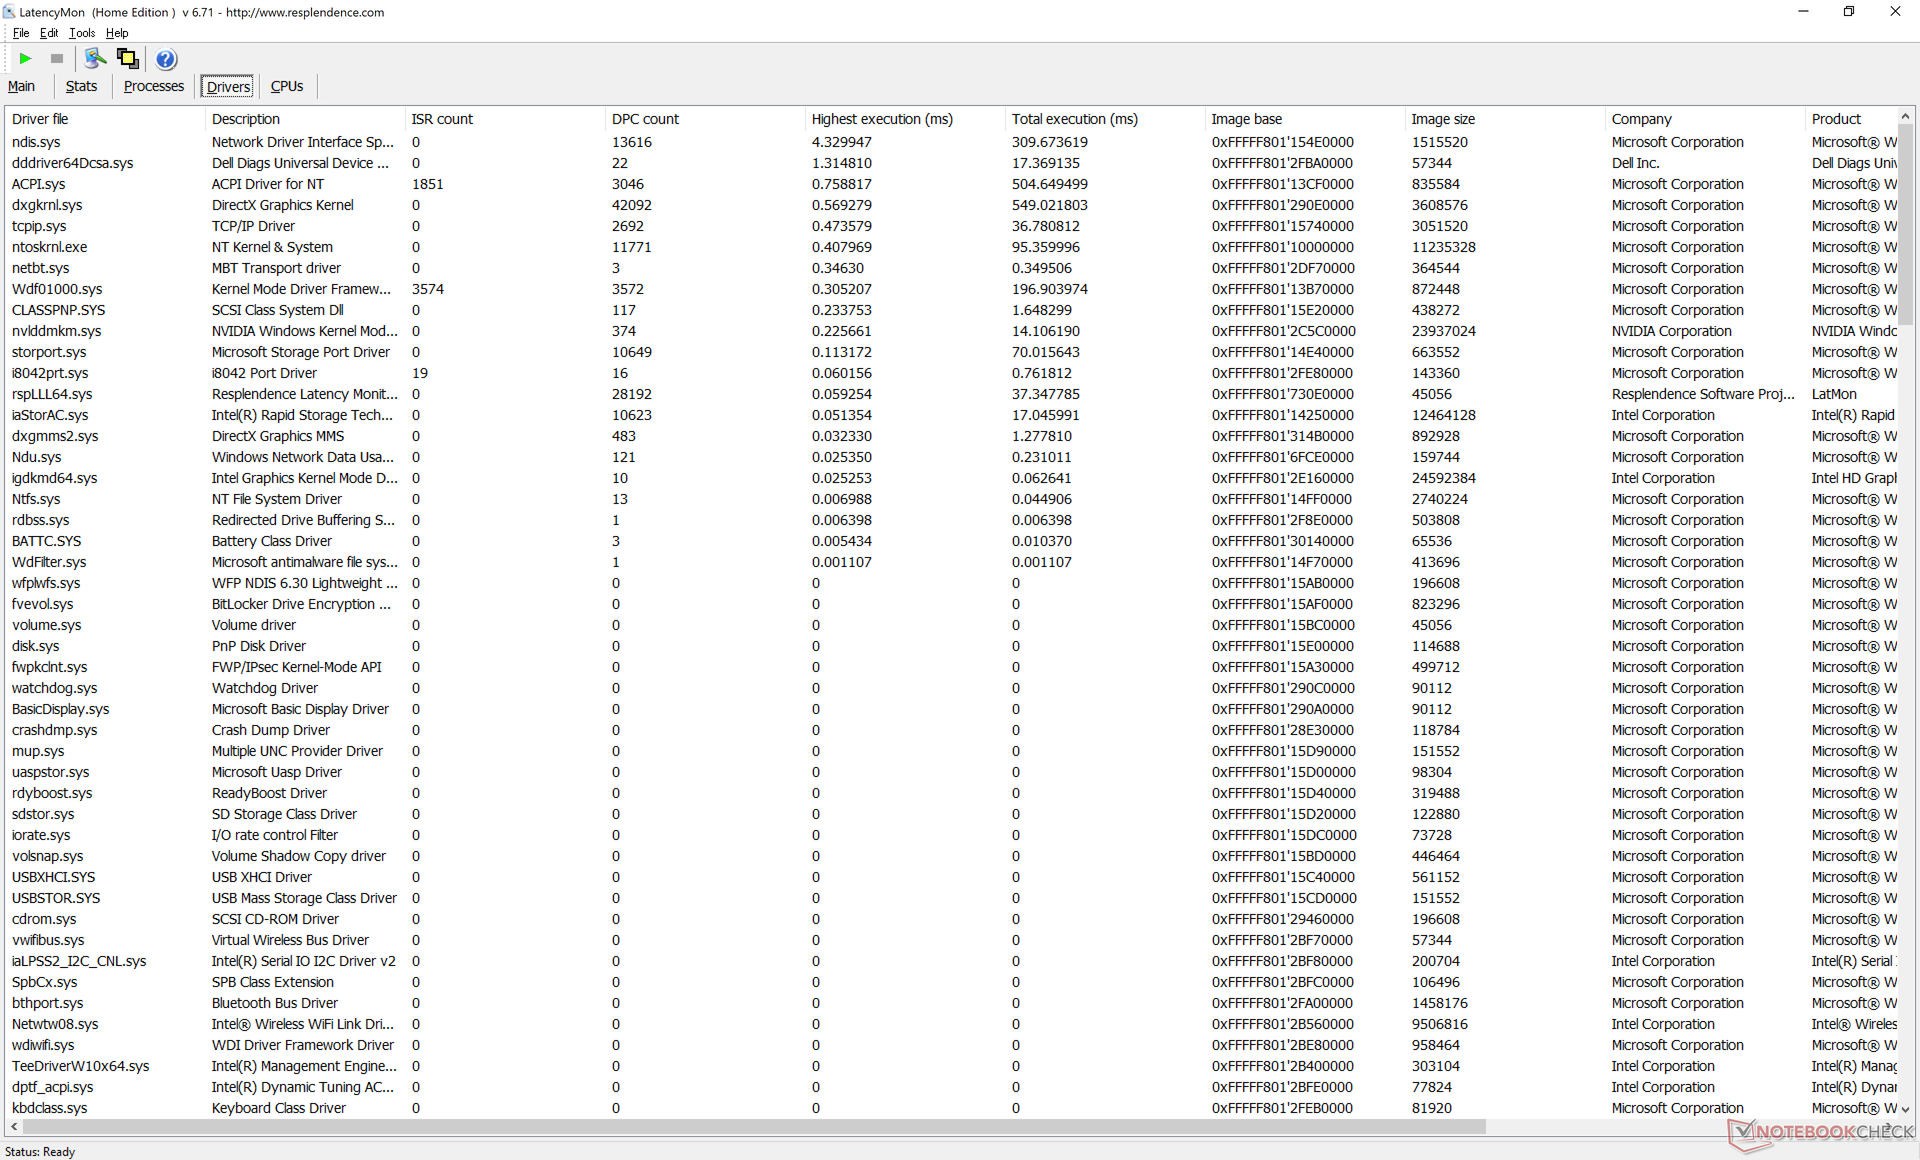
DPC Gecikmesi
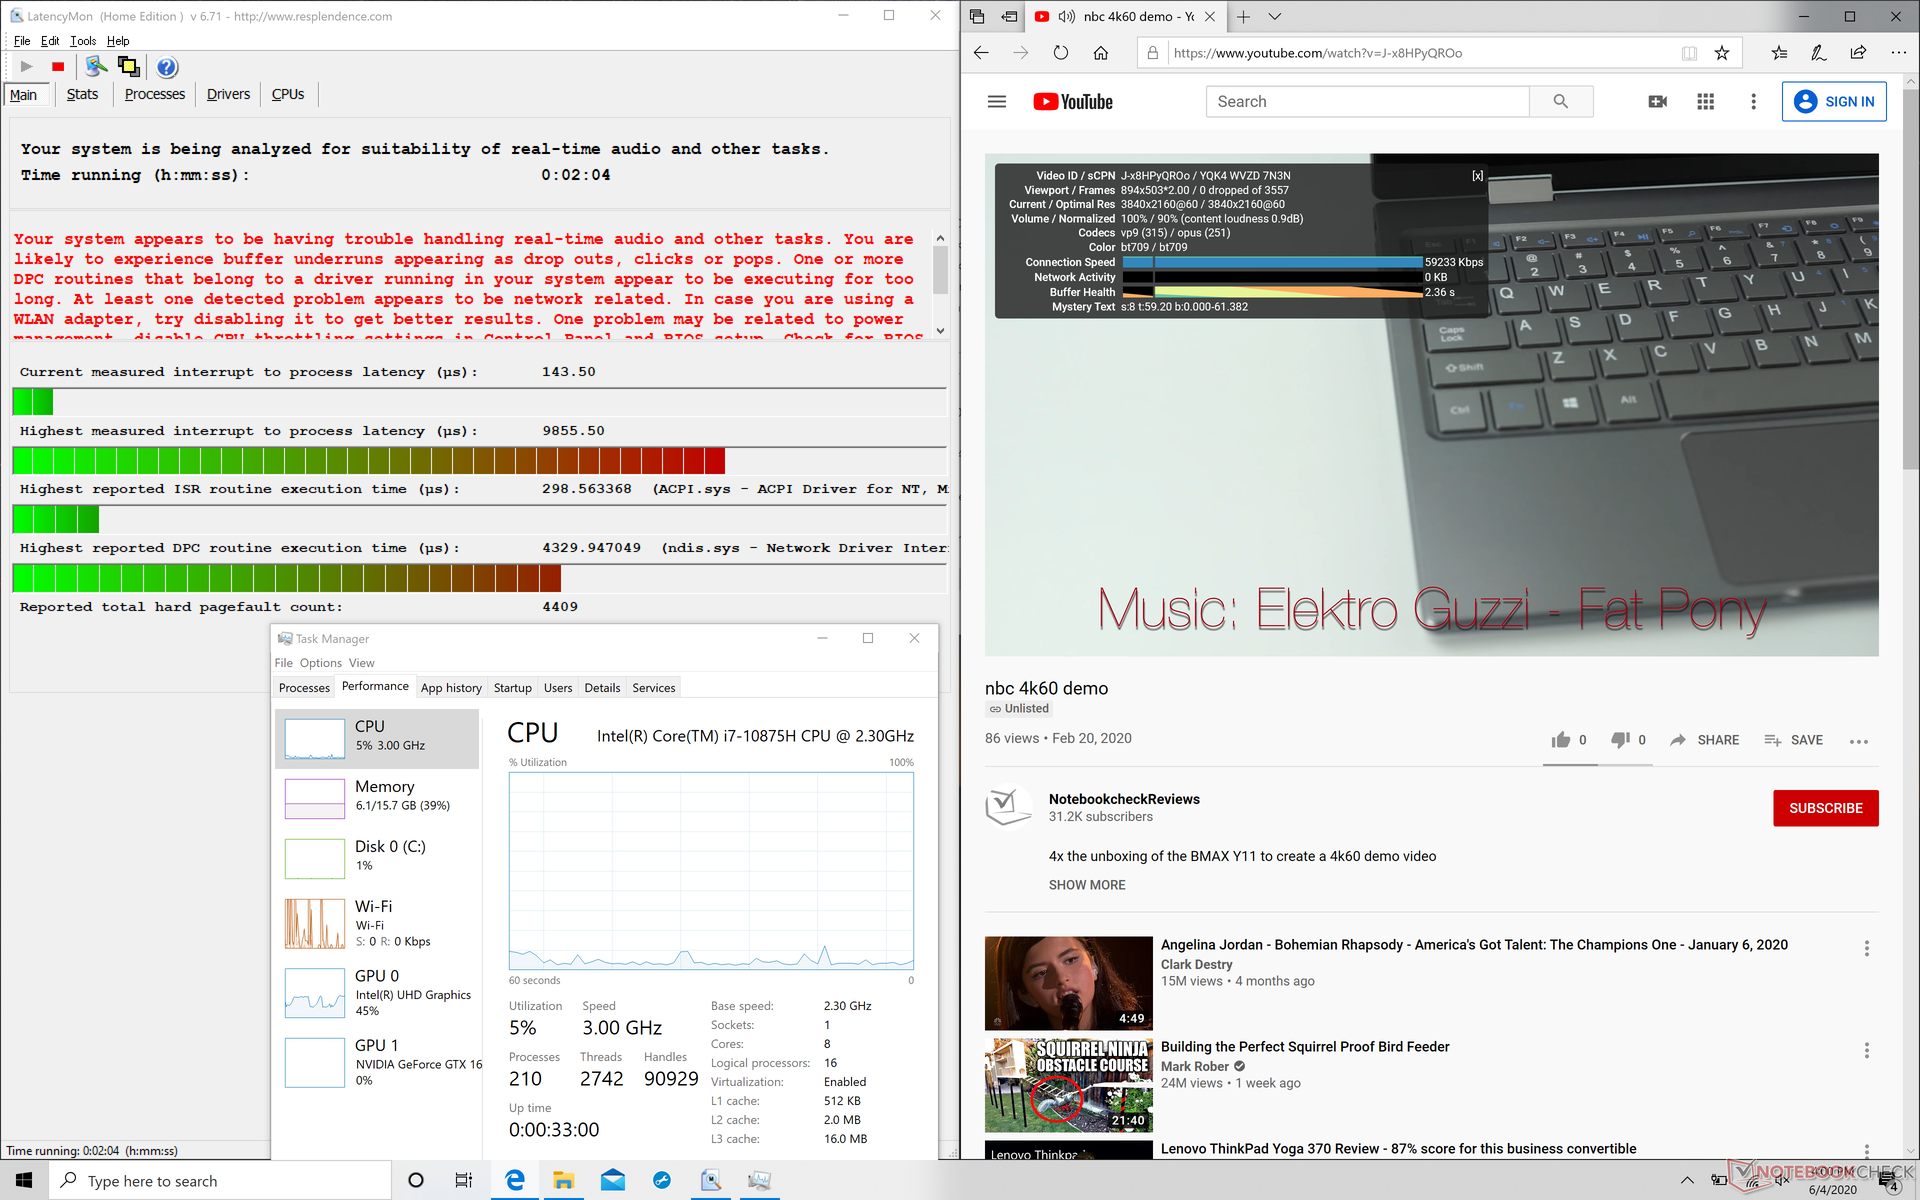
LatencyMon, ana XPS 15 9500 Core i5 seçeneğiyle karşılaştırıldığında, ana sayfamızda birden çok tarayıcı sekmesi açarken daha DPC gecikme sorunlarını gösterir. Neyse ki, 4K UHD video oynatımı pürüzsüz kalır.
| DPC Latencies / LatencyMon - interrupt to process latency (max), Web, Youtube, Prime95 | |
| Dell XPS 15 9500 Core i7 4K UHD | |
| MSI GS66 Stealth 10SFS | |
| Dell XPS 15 9500 Core i5 | |
| Eluktronics RP-15 | |
* ... daha küçük daha iyidir
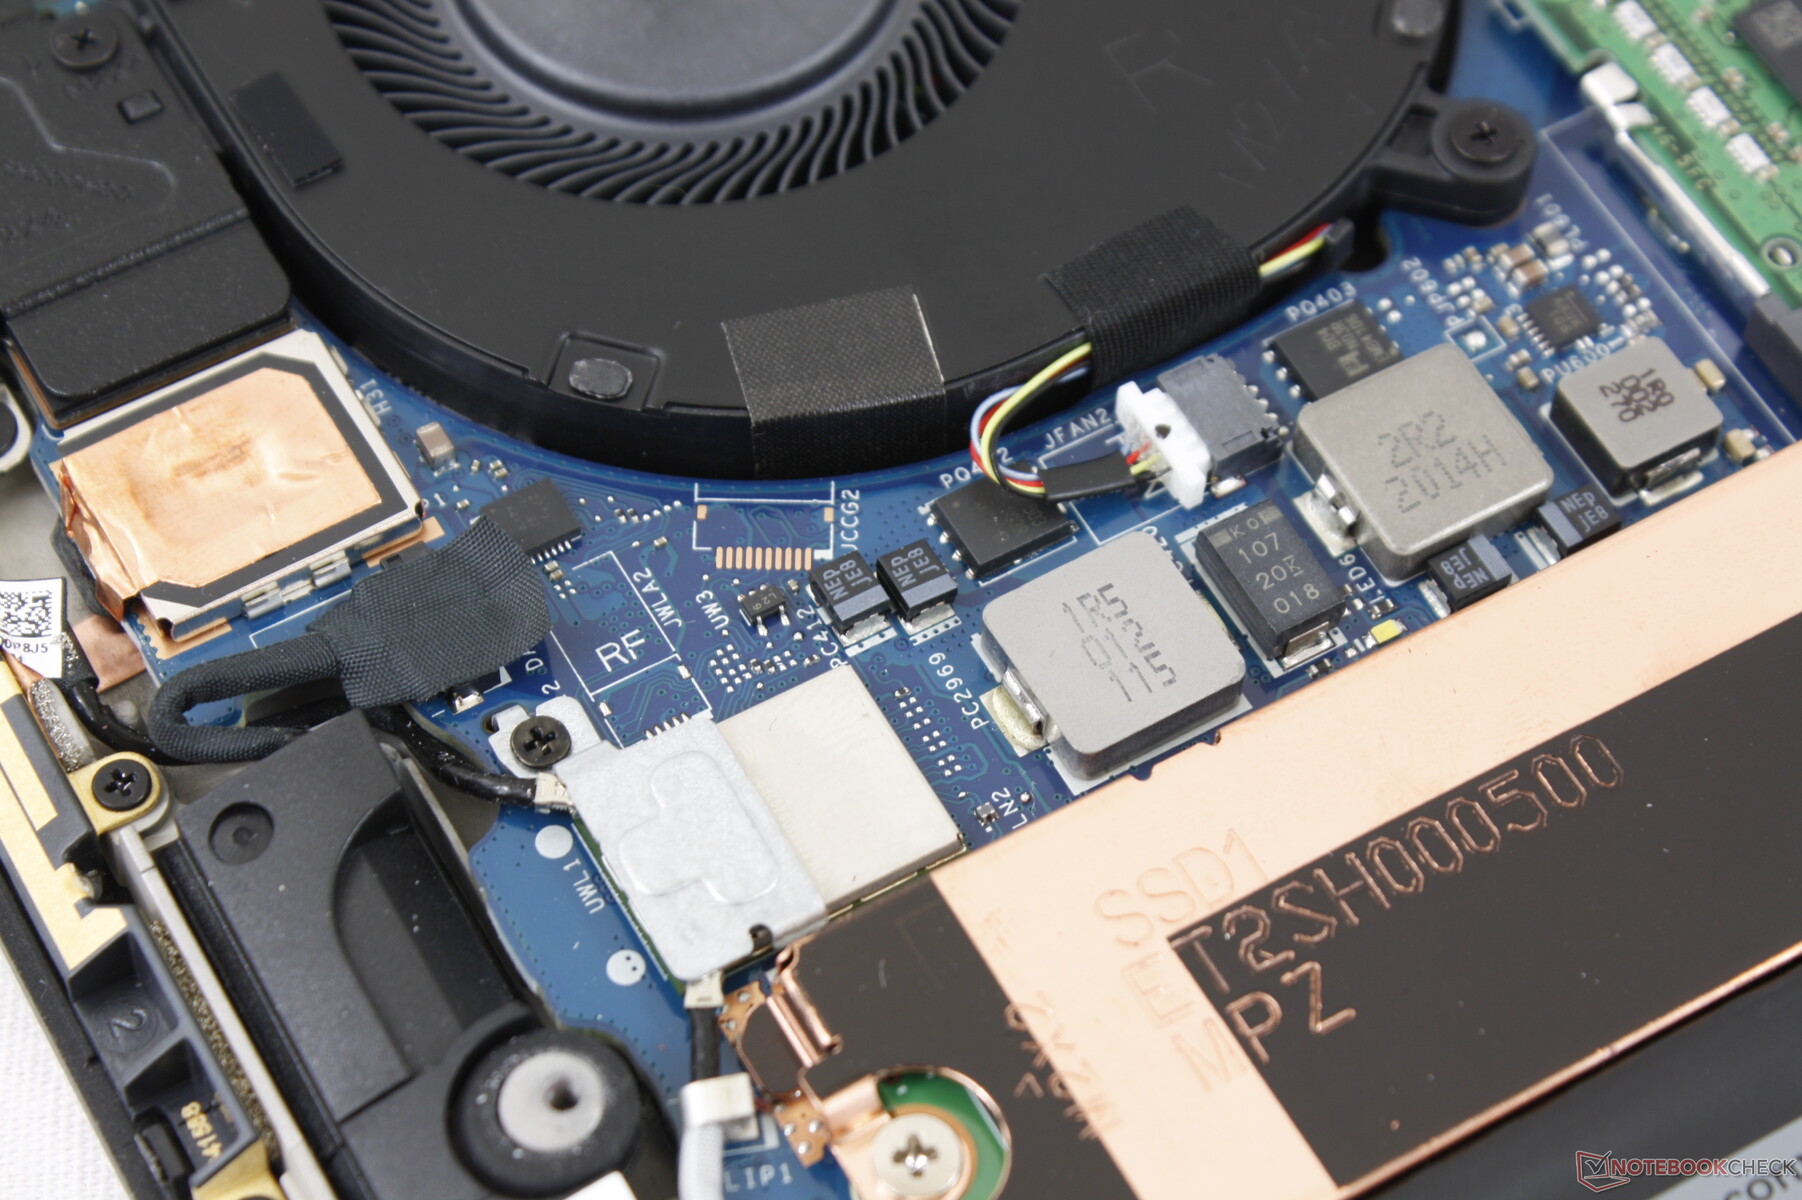
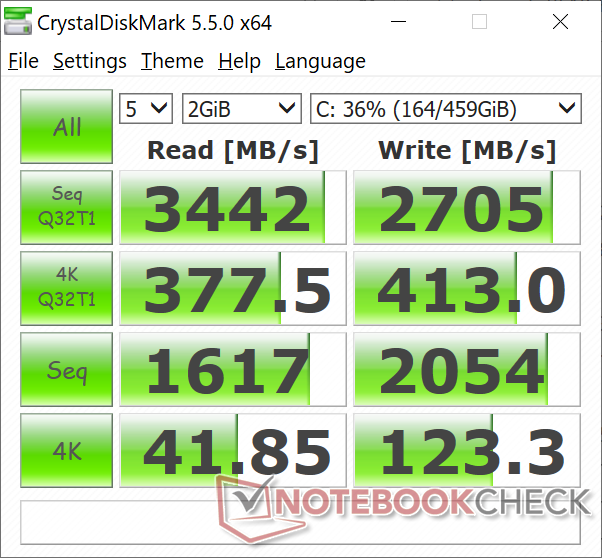
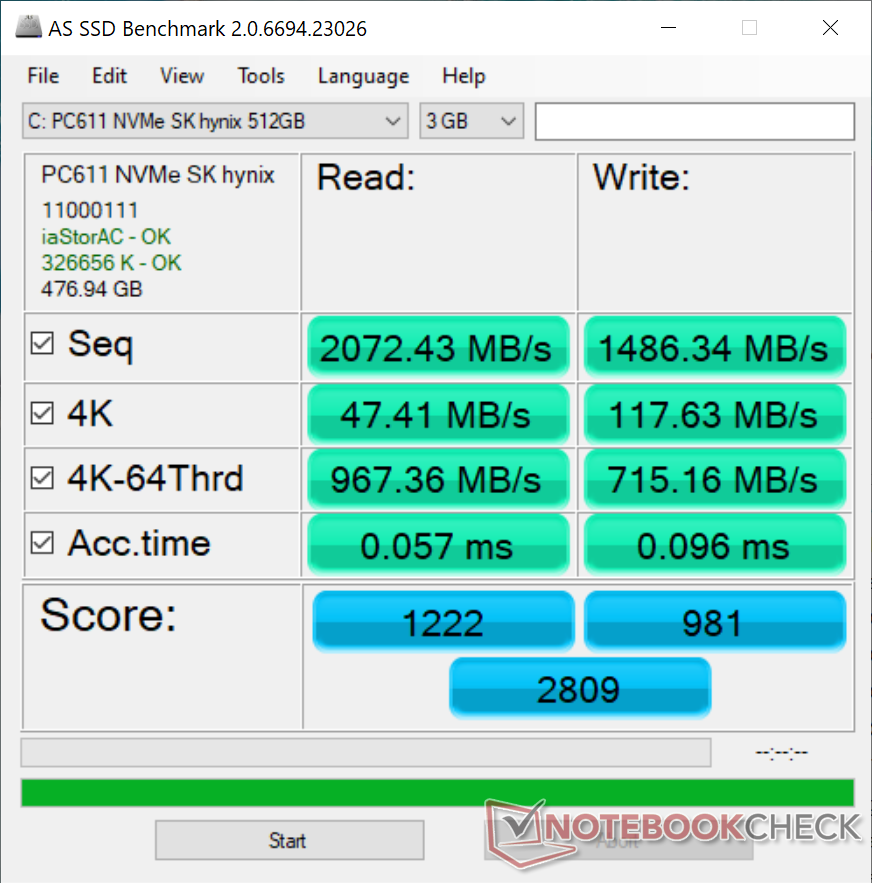
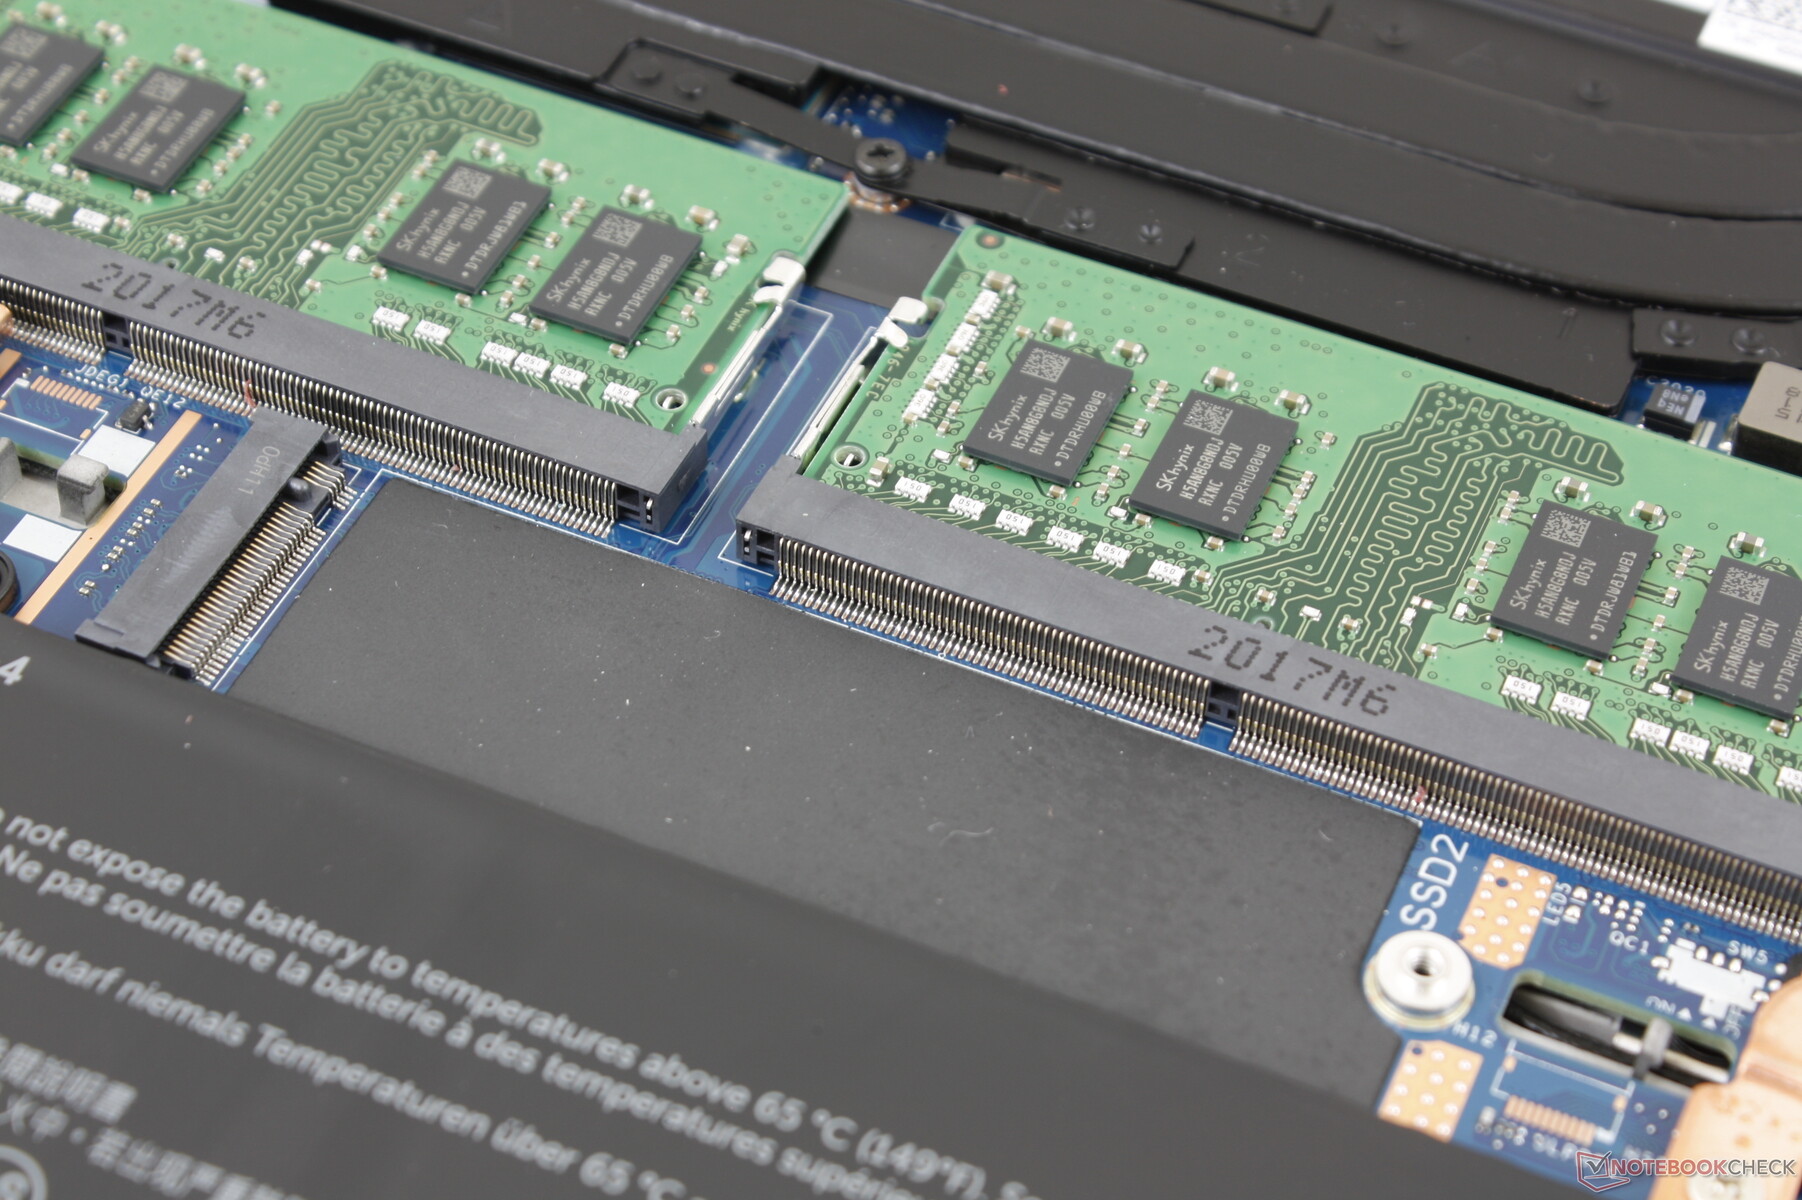
Depolama aygıtları
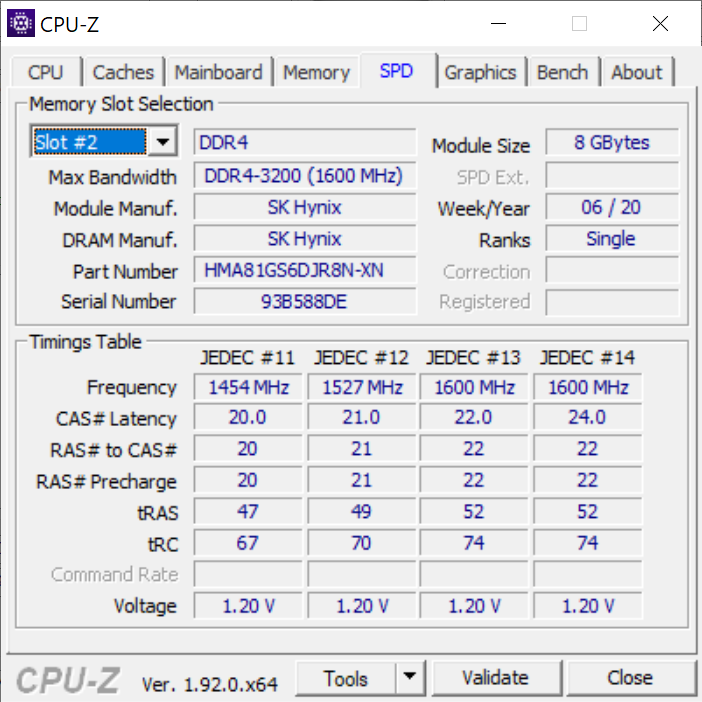
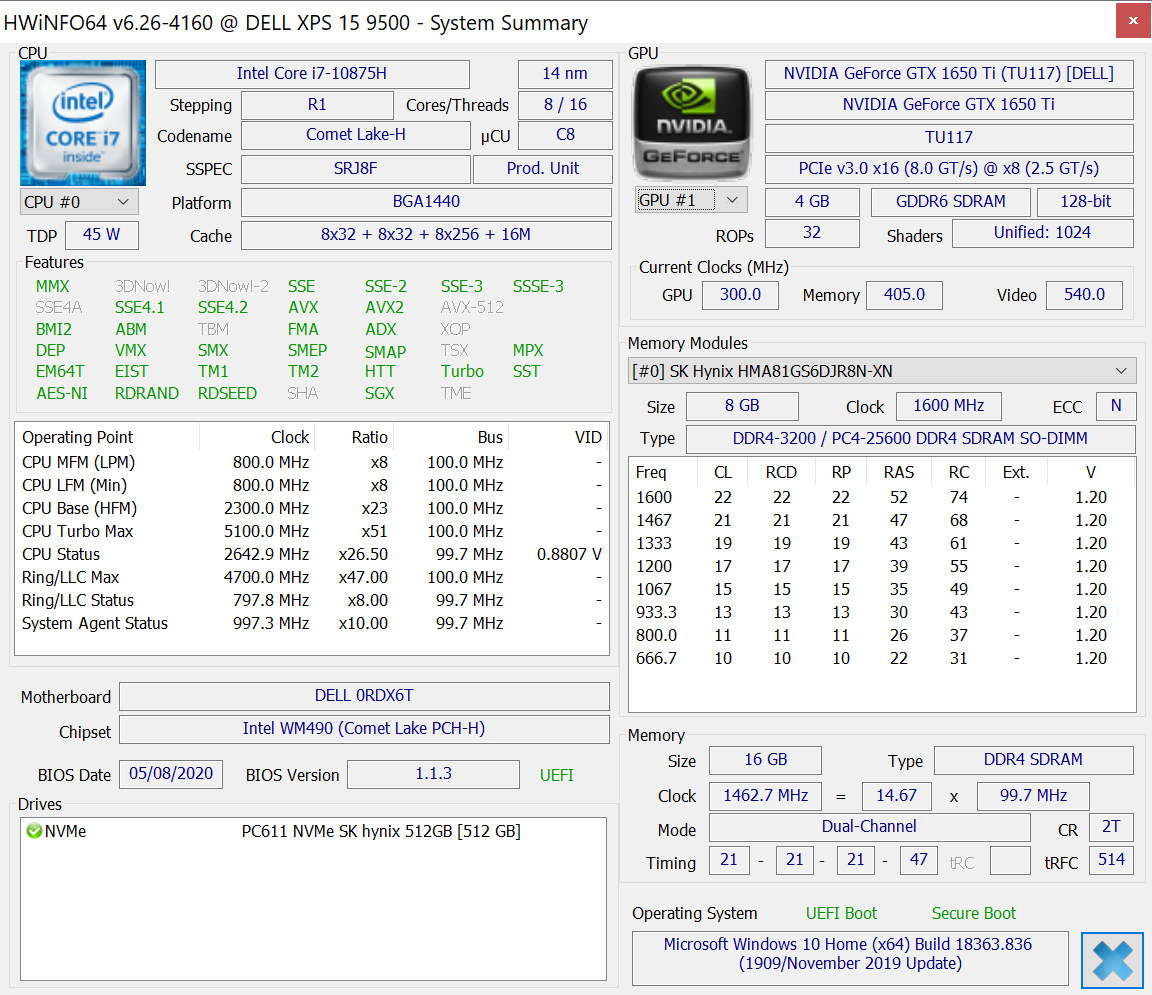
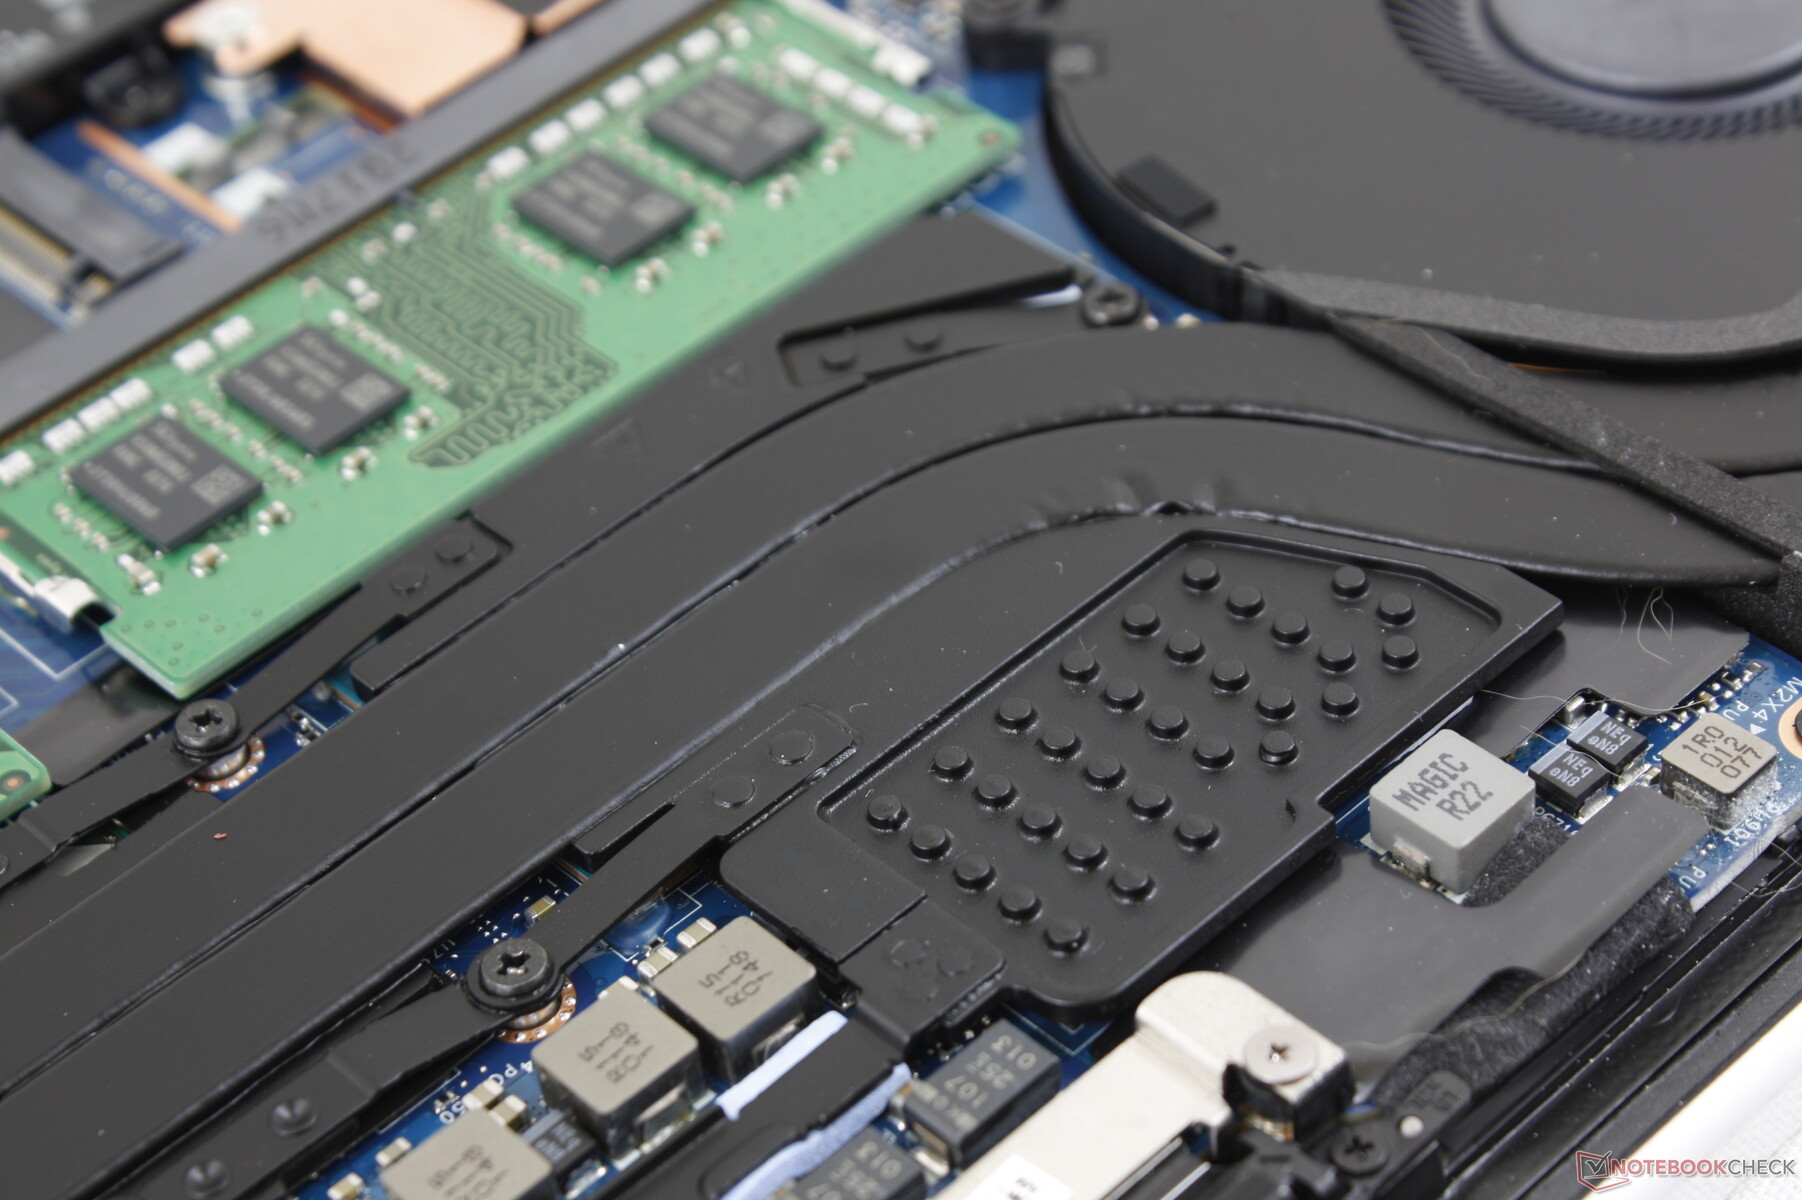
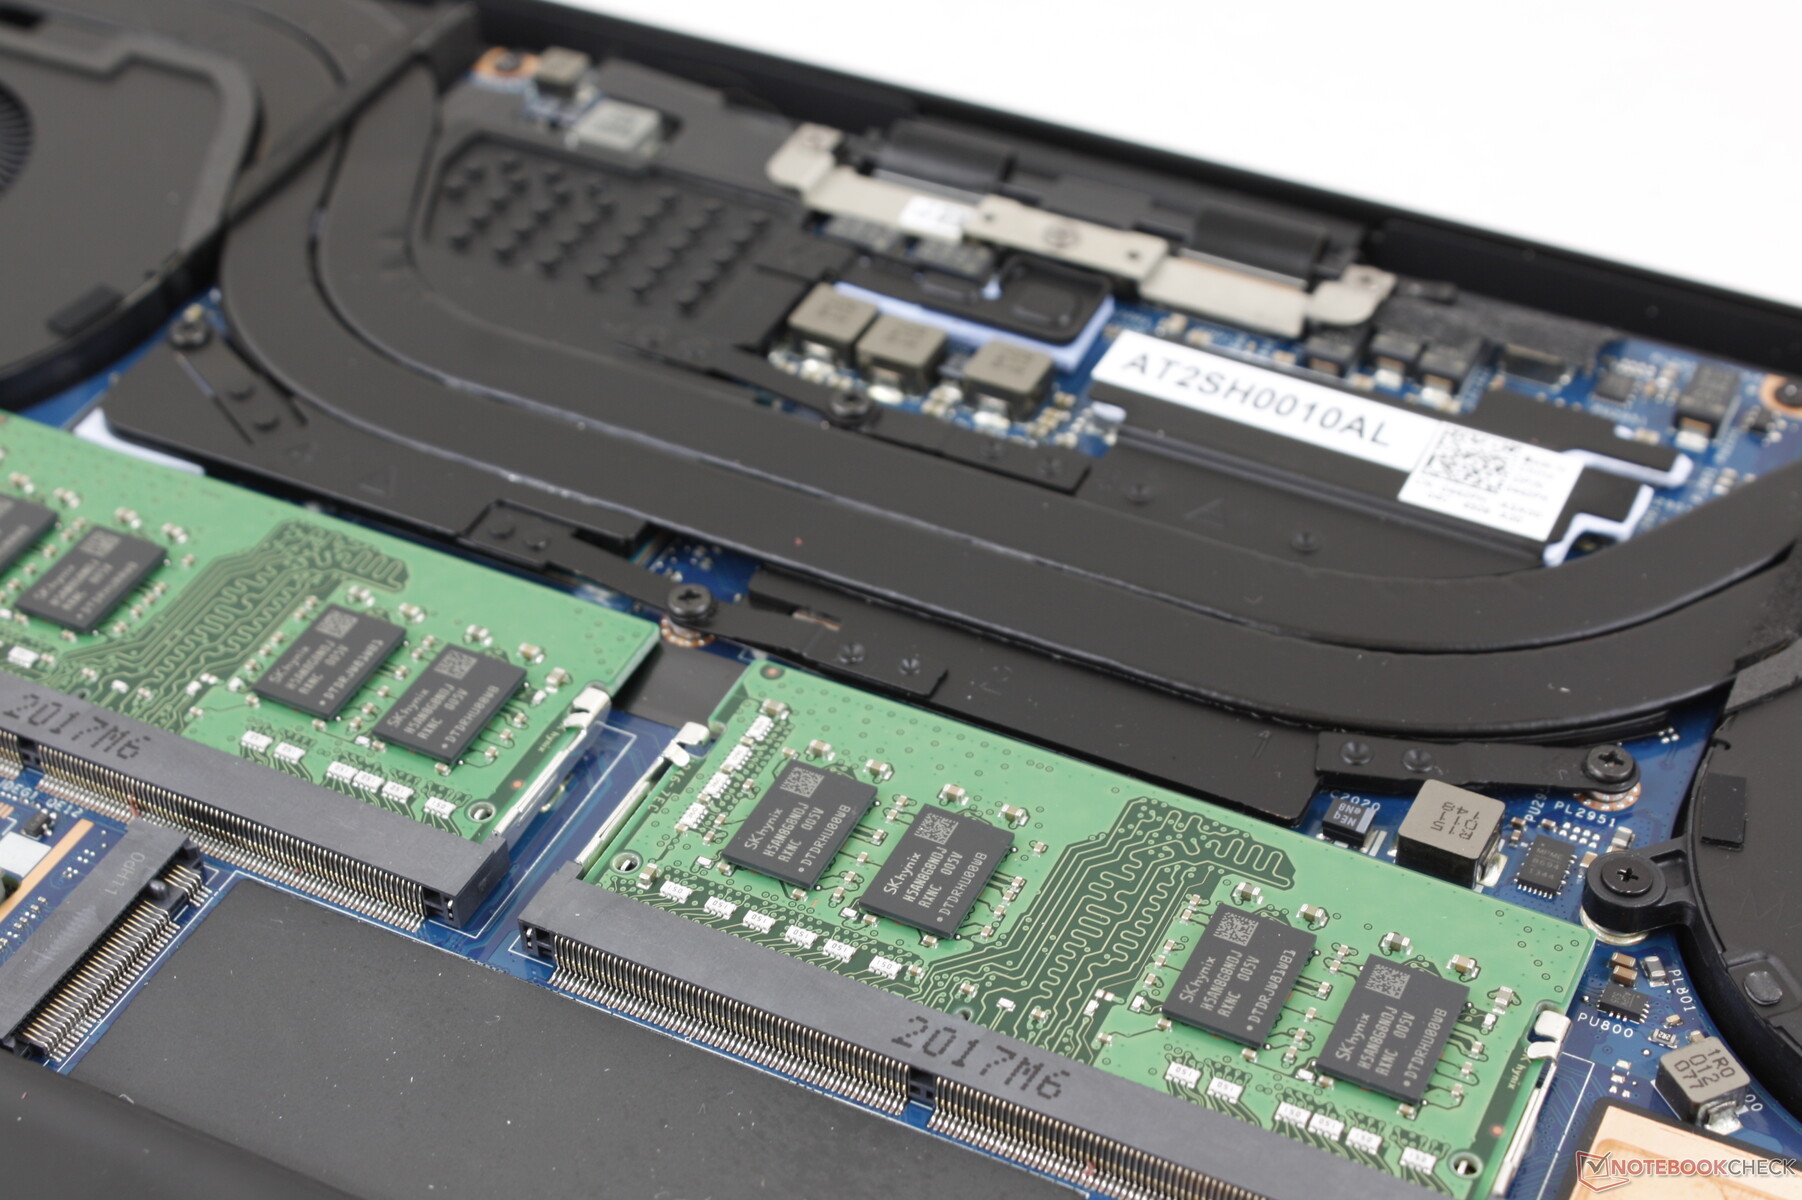
Test birimimiz 512 GB SK Hynix PC611 NVMe SSD ile birlikte gelir ve 2x2 TB M.2 PCIe SSD yapılandırma seçenekleri bulunur. Bir Samsung veya Toshiba sürücüsü olmasa da, performans hala ilgili üst düzey modellerle neredeyse aynı. Tarihsel olarak, XPS sistemleri SK Hynix, Toshiba, Samsung ve Lite-On'dan SSD'ler taşımaktadır ve bu nedenle dördünden hangisini alabileceğinizi bilmek her zaman kolay değildir. Daha fazla karşılaştırma karşılaştırması için SSD'ler ve HDD'ler tablomuza bakın.

| Dell XPS 15 9500 Core i7 4K UHD SK Hynix PC611 512GB | Dell XPS 15 7590 9980HK GTX 1650 Toshiba XG6 KXG60ZNV1T02 | Lenovo Yoga C940-15IRH Intel Optane Memory H10 with Solid State Storage 32GB + 512GB HBRPEKNX0202A(L/H) | Asus ZenBook 15 UX534FTC-A8190T Samsung SSD PM981 MZVLB1T0HALR | MSI Prestige 15 A10SC Samsung SSD PM981 MZVLB1T0HALR | Dell XPS 15 9500 Core i5 Toshiba KBG40ZNS256G NVMe | |
|---|---|---|---|---|---|---|
| AS SSD | 32% | -25% | 27% | 30% | -69% | |
| Seq Read (MB/s) | 2072 | 1723 -17% | 769 -63% | 2643 28% | 1274 -39% | 1423 -31% |
| Seq Write (MB/s) | 1486 | 1386 -7% | 351.1 -76% | 1533 3% | 1395 -6% | 766 -48% |
| 4K Read (MB/s) | 47.41 | 43.25 -9% | 69.1 46% | 49.12 4% | 50.3 6% | 42.21 -11% |
| 4K Write (MB/s) | 117.6 | 98.3 -16% | 100.9 -14% | 134.7 15% | 119.8 2% | 74.8 -36% |
| 4K-64 Read (MB/s) | 967 | 1078 11% | 472 -51% | 1028 6% | 1599 65% | 973 1% |
| 4K-64 Write (MB/s) | 715 | 1456 104% | 948 33% | 1353 89% | 1455 103% | 218.8 -69% |
| Access Time Read * (ms) | 0.057 | 0.05 12% | 0.071 -25% | 0.033 42% | 0.044 23% | 0.125 -119% |
| Access Time Write * (ms) | 0.096 | 0.039 59% | 0.137 -43% | 0.028 71% | 0.092 4% | 0.552 -475% |
| Score Read (Points) | 1222 | 1294 6% | 618 -49% | 1342 10% | 1777 45% | 1157 -5% |
| Score Write (Points) | 981 | 1693 73% | 1084 10% | 1641 67% | 1714 75% | 370 -62% |
| Score Total (Points) | 2809 | 3638 30% | 2024 -28% | 3622 29% | 4411 57% | 2094 -25% |
| Copy ISO MB/s (MB/s) | 1999 | 3182 59% | 839 -58% | 2226 11% | 2830 42% | 1151 -42% |
| Copy Program MB/s (MB/s) | 627 | 984 57% | 455.8 -27% | 506 -19% | 609 -3% | 499.4 -20% |
| Copy Game MB/s (MB/s) | 1001 | 1824 82% | 969 -3% | 1230 23% | 1424 42% | 733 -27% |
| CrystalDiskMark 5.2 / 6 | 1% | 2% | 8% | -13% | -23% | |
| Write 4K (MB/s) | 123.3 | 104.3 -15% | 102.2 -17% | 138.1 12% | 150.8 22% | 93.3 -24% |
| Read 4K (MB/s) | 41.85 | 45.23 8% | 114.3 173% | 45.89 10% | 47.3 13% | 45.9 10% |
| Write Seq (MB/s) | 2054 | 1729 -16% | 468.3 -77% | 2147 5% | 981 -52% | 1211 -41% |
| Read Seq (MB/s) | 1617 | 1861 15% | 1236 -24% | 2188 35% | 976 -40% | 1633 1% |
| Write 4K Q32T1 (MB/s) | 413 | 509 23% | 556 35% | 427.8 4% | 442.7 7% | 273.1 -34% |
| Read 4K Q32T1 (MB/s) | 377.5 | 388.5 3% | 421.6 12% | 404 7% | 499.7 32% | 356 -6% |
| Write Seq Q32T1 (MB/s) | 2705 | 2813 4% | 1264 -53% | 2396 -11% | 1706 -37% | 1198 -56% |
| Read Seq Q32T1 (MB/s) | 3442 | 2906 -16% | 2239 -35% | 3454 0% | 1758 -49% | 2269 -34% |
| Toplam Ortalama (Program / Ayarlar) | 17% /
20% | -12% /
-15% | 18% /
20% | 9% /
14% | -46% /
-52% |
* ... daha küçük daha iyidir

Disk Throttling: DiskSpd Read Loop, Queue Depth 8
GPU Performansı
Geçen yılki GTX 1650'den GTX 1650 Ti'ye performans artışı sadece yüzde 7 ila 16'da nispeten küçük, ancak yine de ölçülebilir. Fark, grafik gerektiren uygulamalar veya oyunlar çalıştırırken farkedilebilecek kadar büyük değil. Daha fazla teknik bilgi ve karşılaştırma karşılaştırmaları için GTX 1650 Ti'deki özel sayfamıza bakın. Genel olarak, kullanıcılar daha eski GTX 1060 cep telefonu ile performansın boydan boya olmasını bekleyebilirler.
| 3DMark | |
| 1920x1080 Fire Strike Graphics | |
| Eluktronics RP-15 | |
| Maingear Vector 15 | |
| MSI P65 8RF-451 - Creator | |
| Asus Zephyrus S GX531GM | |
| Dell XPS 15 9500 Core i7 4K UHD | |
| Gainward GeForce GTX 1650 4 GB | |
| Dell XPS 15 7590 9980HK GTX 1650 | |
| Lenovo IdeaPad S740-15IRH | |
| Dell XPS 15 9570 i7 UHD | |
| Dell XPS 15 9500 Core i5 | |
| 2560x1440 Time Spy Graphics | |
| Eluktronics RP-15 | |
| Maingear Vector 15 | |
| MSI P65 8RF-451 - Creator | |
| Asus Zephyrus S GX531GM | |
| Dell XPS 15 9500 Core i7 4K UHD | |
| Gainward GeForce GTX 1650 4 GB | |
| Dell XPS 15 7590 9980HK GTX 1650 | |
| Lenovo IdeaPad S740-15IRH | |
| Dell XPS 15 9570 i7 UHD | |
| Dell XPS 15 9500 Core i5 | |
| 2560x1440 Time Spy Score | |
| Eluktronics RP-15 | |
| Maingear Vector 15 | |
| MSI P65 8RF-451 - Creator | |
| Gainward GeForce GTX 1650 4 GB | |
| Asus Zephyrus S GX531GM | |
| Dell XPS 15 9500 Core i7 4K UHD | |
| Dell XPS 15 7590 9980HK GTX 1650 | |
| Lenovo IdeaPad S740-15IRH | |
| Dell XPS 15 9570 i7 UHD | |
| Dell XPS 15 9500 Core i5 | |
| 3DMark 11 | |
| 1280x720 Performance GPU | |
| Eluktronics RP-15 | |
| Maingear Vector 15 | |
| MSI P65 8RF-451 - Creator | |
| Gainward GeForce GTX 1650 4 GB | |
| Dell XPS 15 9500 Core i7 4K UHD | |
| Asus Zephyrus S GX531GM | |
| Dell XPS 15 7590 9980HK GTX 1650 | |
| Lenovo IdeaPad S740-15IRH | |
| Dell XPS 15 9570 i7 UHD | |
| Dell XPS 15 9500 Core i5 | |
| 1280x720 Performance Combined | |
| Eluktronics RP-15 | |
| Dell XPS 15 9500 Core i7 4K UHD | |
| Maingear Vector 15 | |
| Gainward GeForce GTX 1650 4 GB | |
| Lenovo IdeaPad S740-15IRH | |
| Dell XPS 15 9570 i7 UHD | |
| MSI P65 8RF-451 - Creator | |
| Dell XPS 15 7590 9980HK GTX 1650 | |
| Asus Zephyrus S GX531GM | |
| Dell XPS 15 9500 Core i5 | |
| 3DMark 06 Standard Score | 39720 puan | |
| 3DMark Vantage P Result | 43517 puan | |
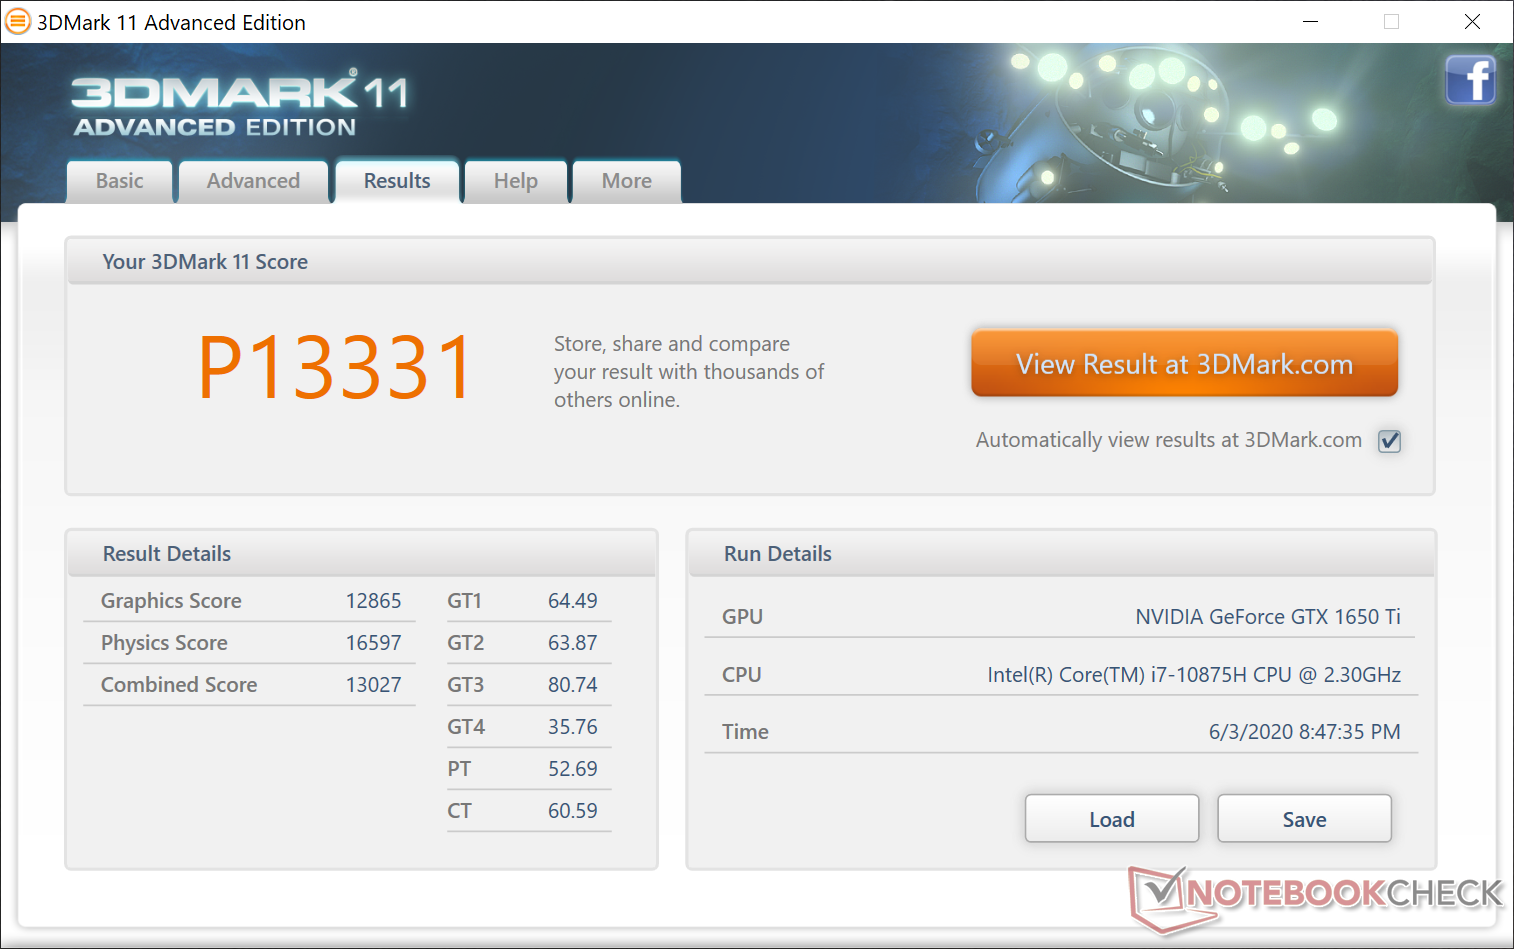
| 3DMark 11 Performance | 13331 puan | |
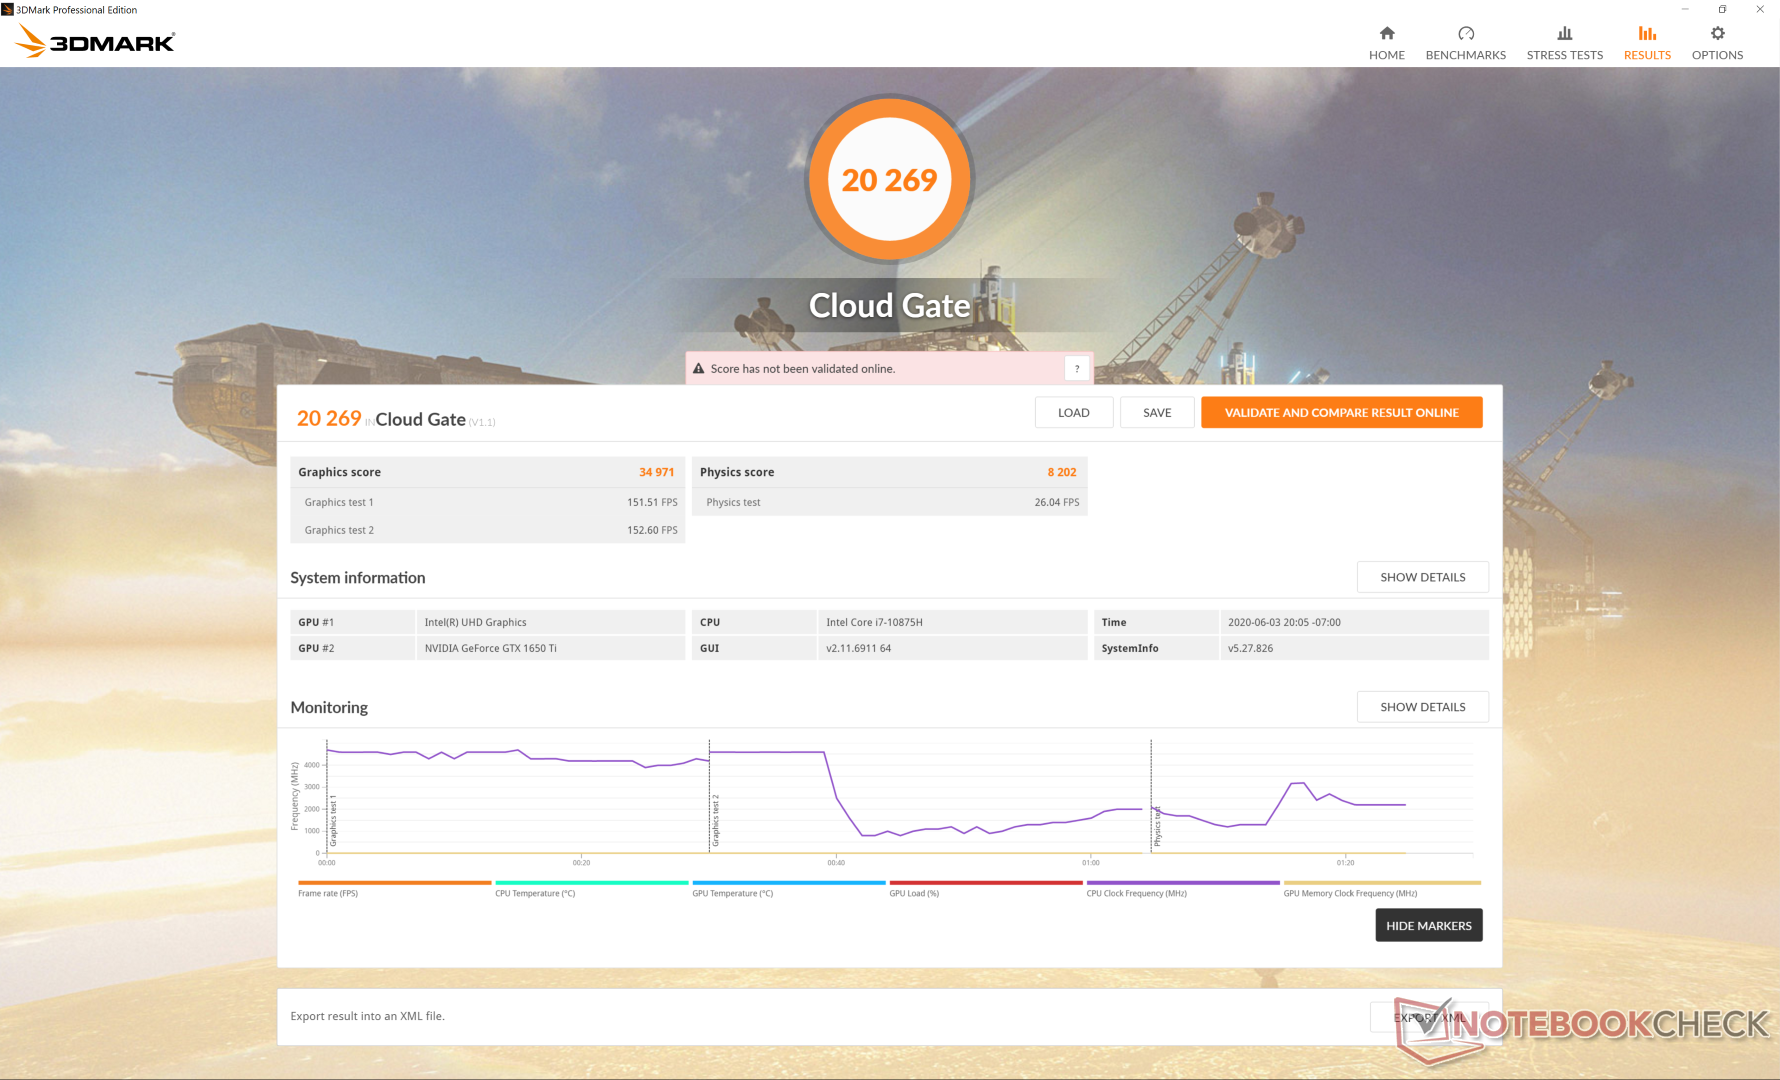
| 3DMark Cloud Gate Standard Score | 20269 puan | |
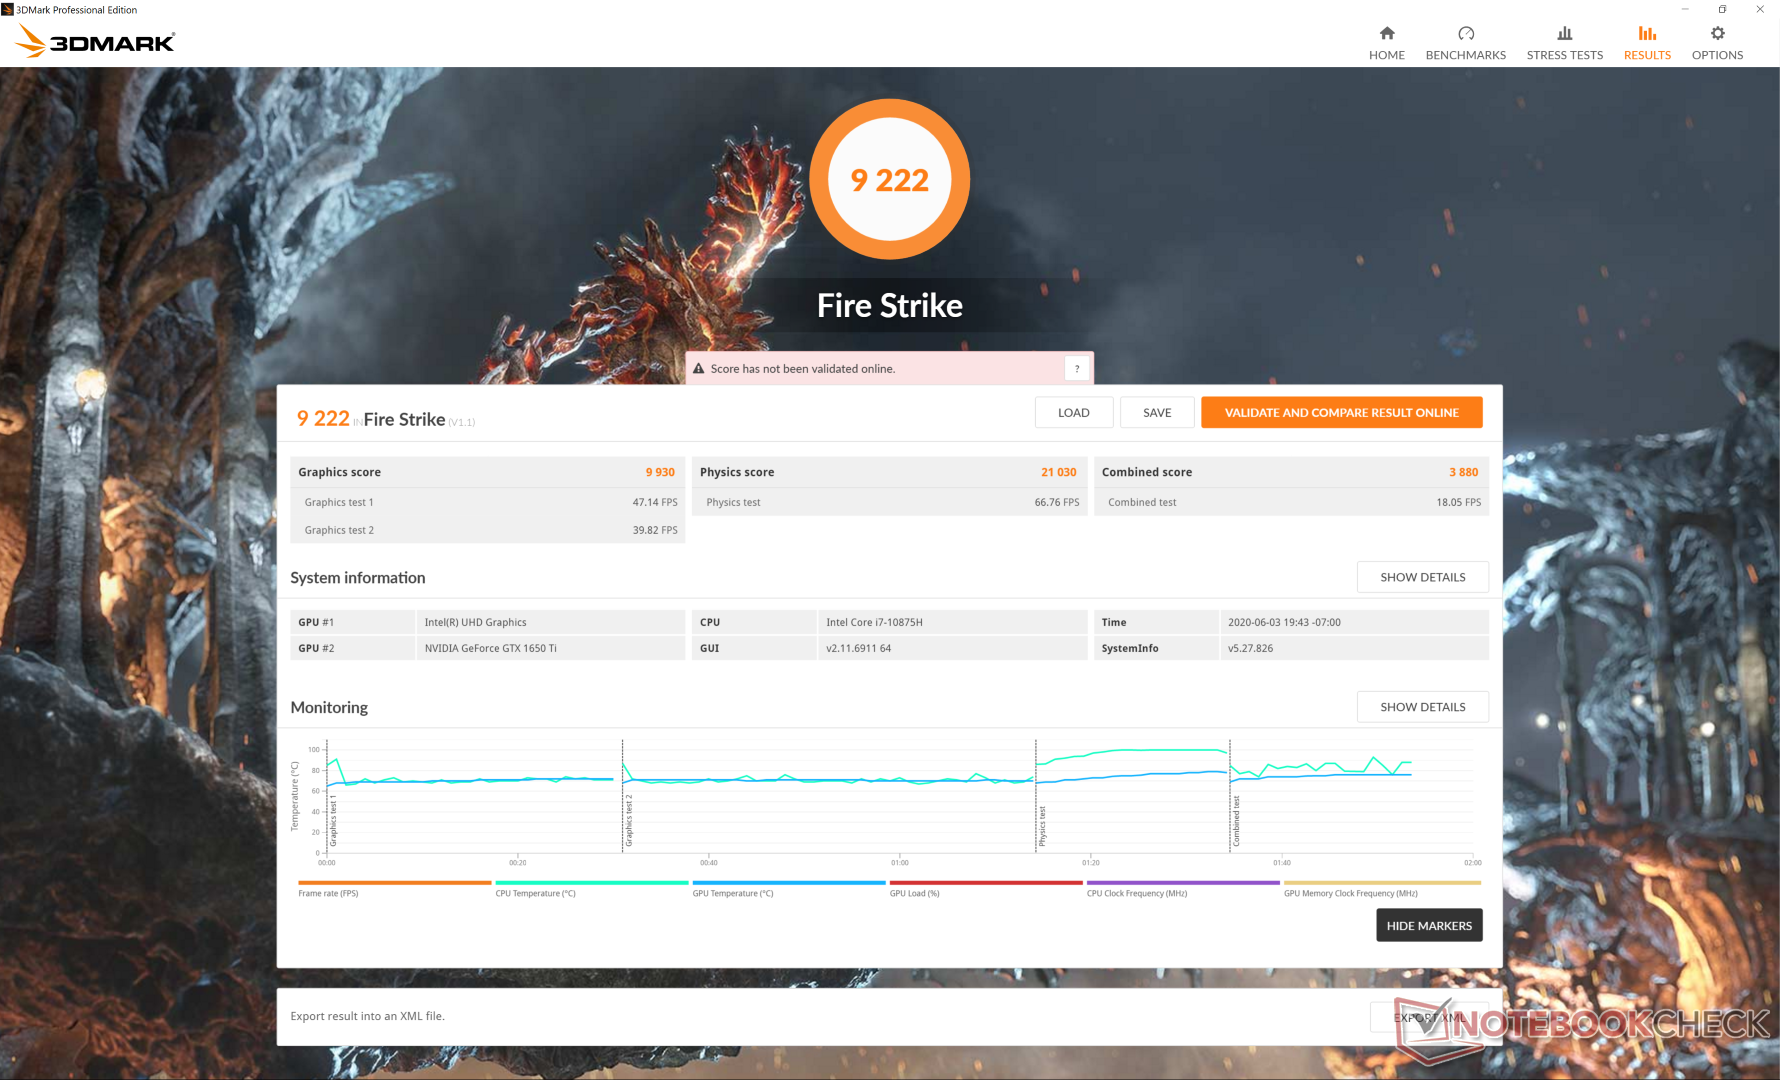
| 3DMark Fire Strike Score | 9222 puan | |
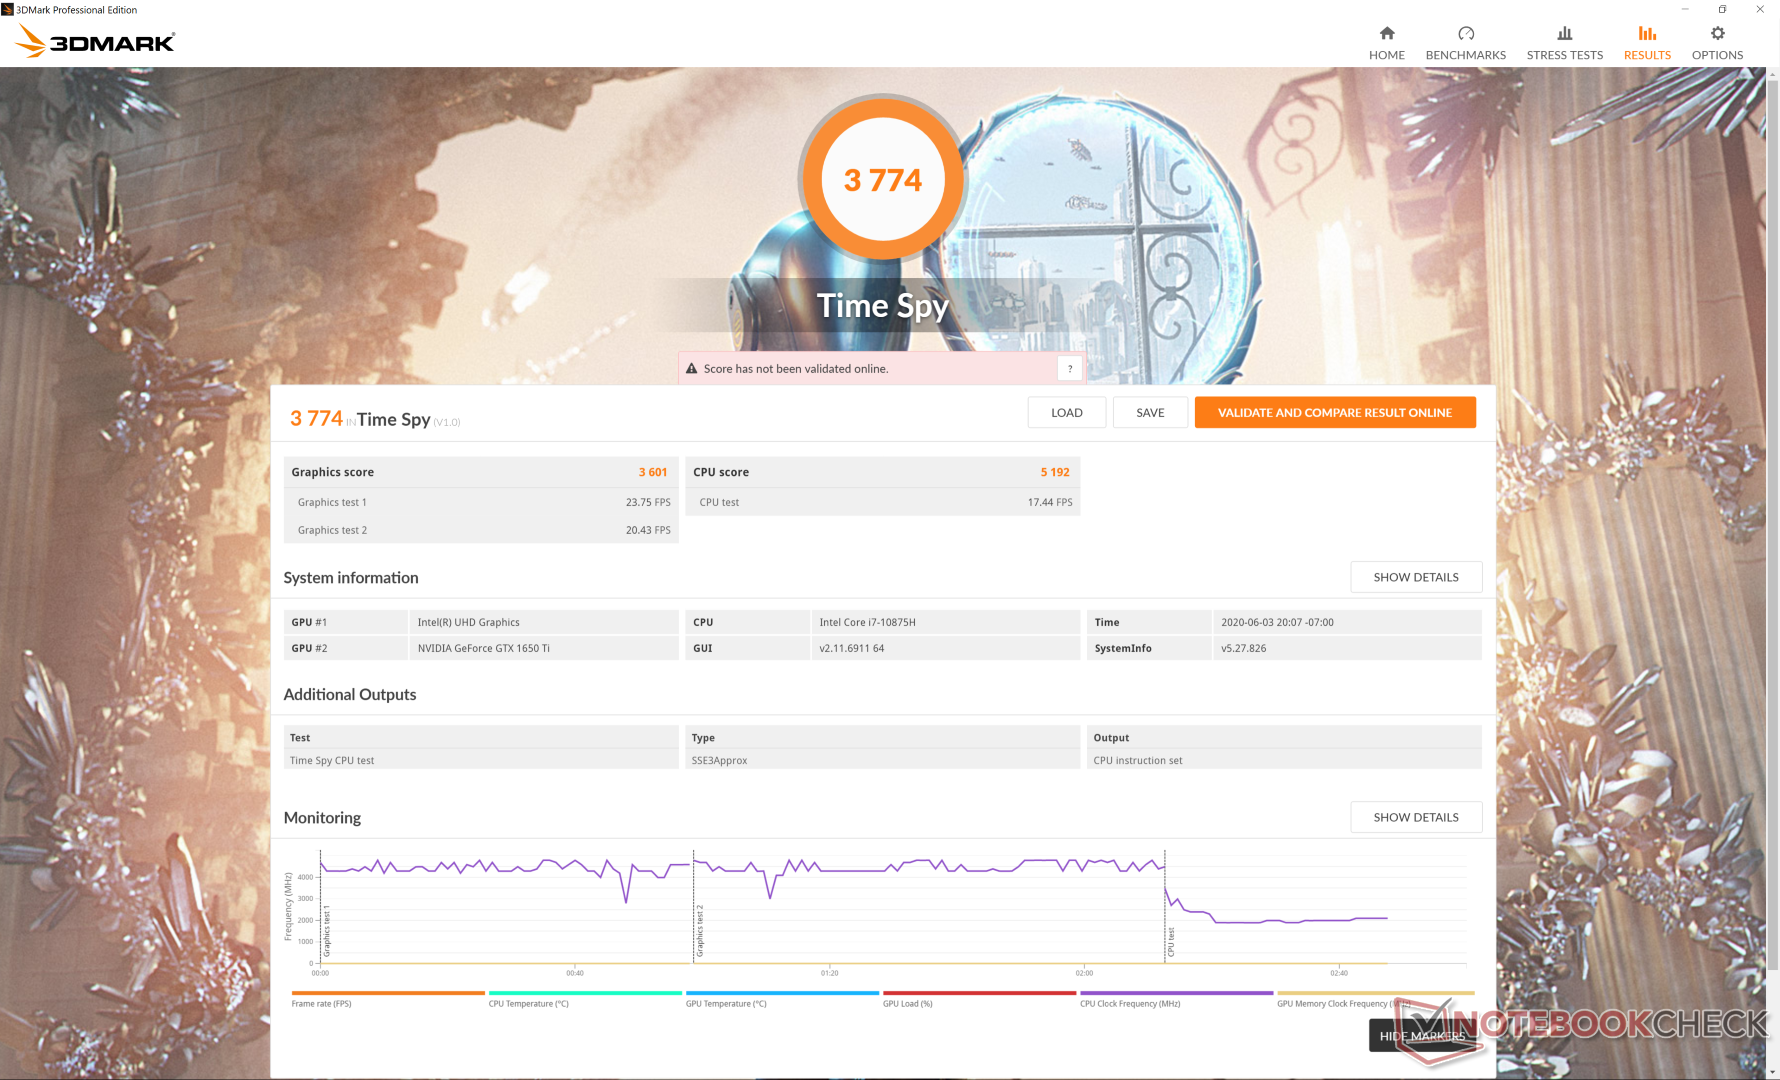
| 3DMark Time Spy Score | 3774 puan | |
Yardım | ||
1080p'de Witcher 3'te rölantide çalışırken kare hızları Yüksek ayarlar aşağıdaki grafikte gösterildiği gibi tutarlı değildir. ~ 62 FPS'den ~ 70 FPS'ye kadar, Ultra Performance profiile'sinde bile belirgin bir neden olmaksızın tekrarlayan küçük tümsekler var. İdeal olarak, kare hızları ani bir çarpma veya düşüş olmadan bir saatlik test boyunca sabit olmalıdır. XPS 15 bir oyun makinesi değil, bu yüzden büyük bir sorun değil, ancak GeForce GTX grafik kartlarına sahip bir PC için hala ideal değil.
| düşük | orta | yüksek | ultra | 4K | |
|---|---|---|---|---|---|
| The Witcher 3 (2015) | 209.9 | 100.8 | 65.6 | 38.1 | |
| Dota 2 Reborn (2015) | 150 | 139 | 130 | 120 | 51.8 |
| X-Plane 11.11 (2018) | 109 | 78.2 | 63.3 | 45.8 | |
| Shadow of the Tomb Raider (2018) | 139 | 62 | 57 | 48 | |
| Assassin´s Creed Odyssey (2018) | 86 | 60 | 42 | 25 | |
| Apex Legends (2019) | 144 | 91 | 84 | 74 | |
| Far Cry New Dawn (2019) | 73 | 57 | 58 | 51 | |
| Metro Exodus (2019) | 91.6 | 48.7 | 35.9 | 27.9 | |
| Dirt Rally 2.0 (2019) | 247.3 | 92.7 | 74.6 | 44.8 | |
| The Division 2 (2019) | 115 | 56 | 47 | 35 | |
| Anno 1800 (2019) | 68.4 | 64.5 | 49.1 | 27.6 | |
| Total War: Three Kingdoms (2019) | 190.2 | 59.1 | 40.8 | 27.2 | |
| F1 2019 (2019) | 206 | 105 | 89 | 76 | |
| Borderlands 3 (2019) | 128.3 | 59.9 | 38.5 | 29.3 | |
| Ghost Recon Breakpoint (2019) | 72 | 53 | 47 | 31 | |
| GRID 2019 (2019) | 103.8 | 70.7 | 64.1 | 27.3 | |
| Need for Speed Heat (2019) | 60.4 | 43.3 | 39 | 37.3 | |
| Star Wars Jedi Fallen Order (2019) | 44.1 | 41.5 | 40.7 | ||
| Escape from Tarkov (2020) | 120.5 | 89.7 | 60.4 | 73 | |
| Hunt Showdown (2020) | 150 | 58.5 | 47.5 | ||
| Doom Eternal (2020) | 149.5 | 90.7 | 66.6 |
Emisyonları
Sistem Gürültüsü
Core i5 incelememizde, sistemin 3DMark 06'nın ilk kıyaslama sahnesinde bile sessiz kalacağını belirtti. Ancak Core i7 GeForce yapılandırması için, fan gürültüsü, sonunda 46 dB (A) çarpana kadar yavaşça artacaktır. aynı kıyaslama sahnesi. Kimse daha hızlı yapılandırmanın temel Core i5 seçeneğinden daha yüksek sesle çalışmamasını şaşırtmamalı. Oyun oynarken, kullanıcılar işlem yüküne bağlı olarak 42 dB (A) ile 46 dB (A) arasında bir fan gürültüsü bekleyebilirler. Core i5 seçeneğinde "sadece" 41,9 dB (A) ile karşılaştırıldığında maksimum 47,1 dB (A) kaydedebiliyoruz.Çok teşekkürler, Core i7 sistemi çok düşük yükler çalıştırırken Core i5 sistemi kadar sessiz olabilir Dell Optimize edilmiş moda veya Sessiz moda ayarlandığında tarama, kelime işlemci veya video akışı gibi. Bu durumda fan gürültüsü, çoğu ortamda zar zor duyulabilmek için yalnızca 31,4 dB (A) seviyesine çıkma eğilimindedir.
| Dell XPS 15 9500 Core i7 4K UHD GeForce GTX 1650 Ti Mobile, i7-10875H, SK Hynix PC611 512GB | Dell XPS 15 7590 9980HK GTX 1650 GeForce GTX 1650 Mobile, i9-9980HK, Toshiba XG6 KXG60ZNV1T02 | Lenovo Yoga C940-15IRH GeForce GTX 1650 Max-Q, i7-9750H, Intel Optane Memory H10 with Solid State Storage 32GB + 512GB HBRPEKNX0202A(L/H) | Asus ZenBook 15 UX534FTC-A8190T GeForce GTX 1650 Max-Q, i7-10510U, Samsung SSD PM981 MZVLB1T0HALR | MSI Prestige 15 A10SC GeForce GTX 1650 Max-Q, i7-10710U, Samsung SSD PM981 MZVLB1T0HALR | Dell XPS 15 9500 Core i5 UHD Graphics 630, i5-10300H, Toshiba KBG40ZNS256G NVMe | |
|---|---|---|---|---|---|---|
| Noise | -2% | -0% | 4% | 3% | 9% | |
| kapalı / ortam * (dB) | 28.4 | 28.2 1% | 28.7 -1% | 30.3 -7% | 29.3 -3% | 28 1% |
| Idle Minimum * (dB) | 28.4 | 28.2 1% | 28.7 -1% | 30.3 -7% | 30.1 -6% | 28 1% |
| Idle Average * (dB) | 28.4 | 28.2 1% | 28.8 -1% | 30.3 -7% | 30.2 -6% | 28 1% |
| Idle Maximum * (dB) | 28.4 | 30.4 -7% | 28.8 -1% | 30.9 -9% | 30.2 -6% | 28 1% |
| Load Average * (dB) | 46 | 43.8 5% | 45 2% | 31.3 32% | 31.5 32% | 28 39% |
| Witcher 3 ultra * (dB) | 42 | 47.2 -12% | 44.7 -6% | 38.1 9% | 37 12% | |
| Load Maximum * (dB) | 47.1 | 47.2 -0% | 44.7 5% | 38.2 19% | 47 -0% | 41.9 11% |
* ... daha küçük daha iyidir
Ses yüksekliği
| Boşta |
| 28.4 / 28.4 / 28.4 dB |
| Çalışırken |
| 46 / 47.1 dB |
 | ||
30 dB sessiz 40 dB(A) duyulabilirlik 50 dB(A) gürültülü |
||
min: | ||
Sıcaklık
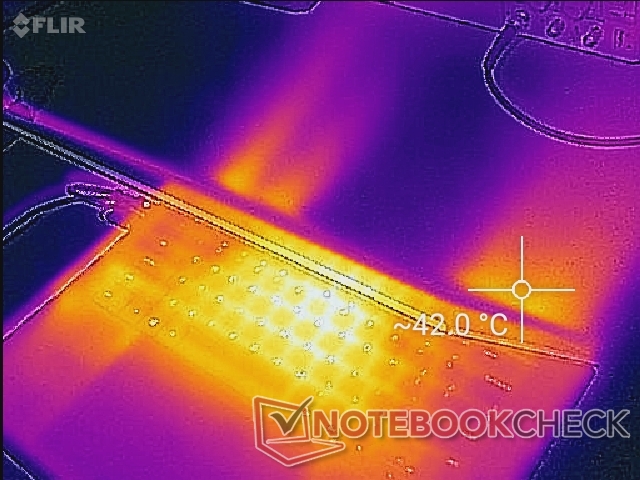
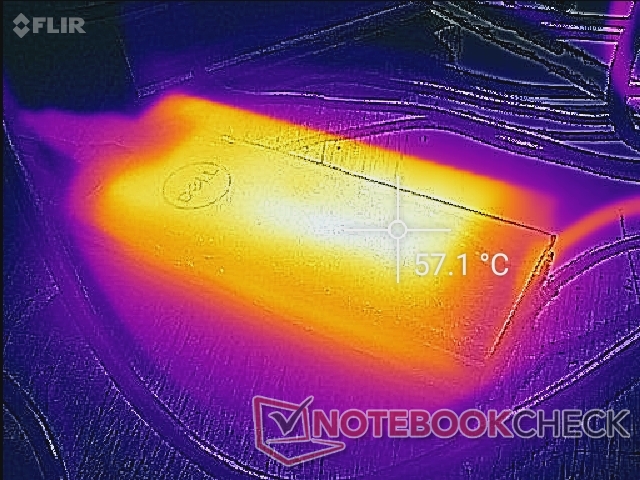
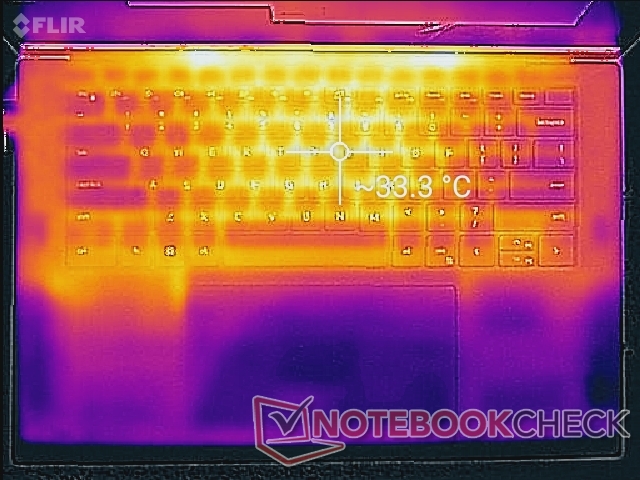
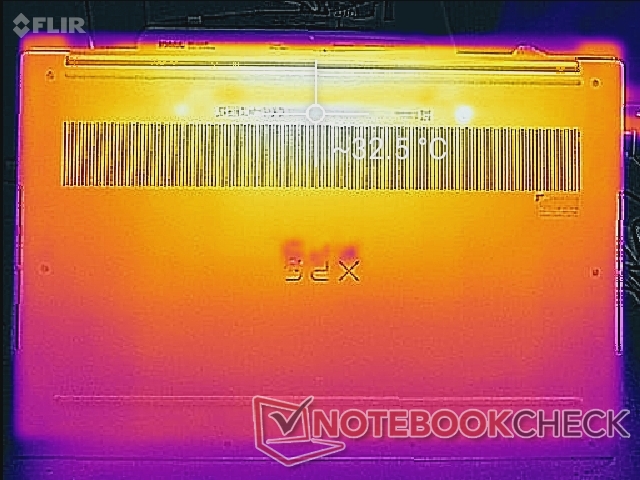
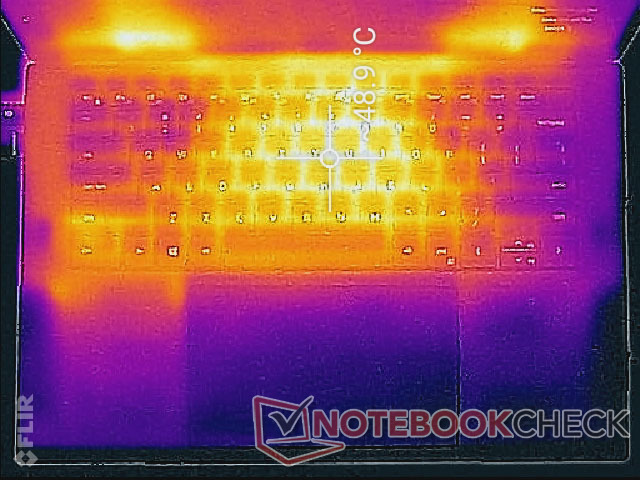
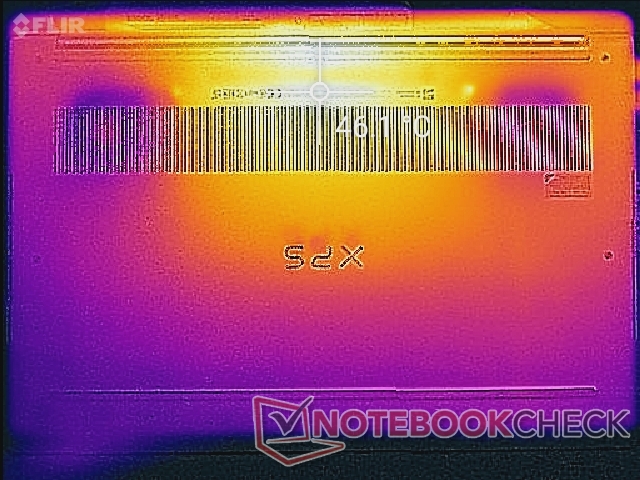
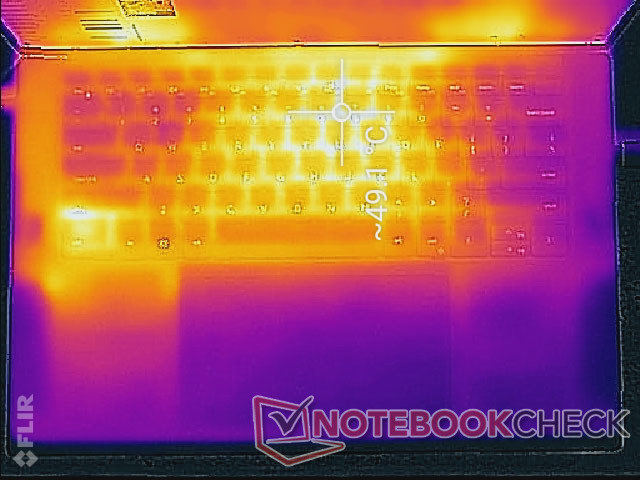
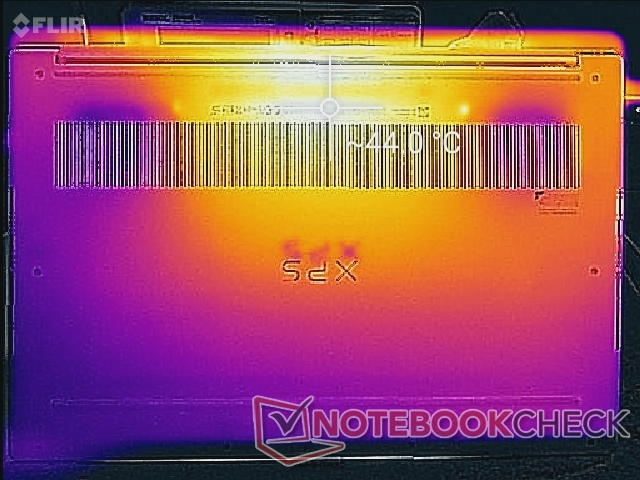
Yüzey sıcaklıkları, temel Core i5 konfigürasyonundan daha belirgin şekilde daha sıcaktır. Örneğin, masaüstünde rölantide çalışırken, yüzey sıcak noktaları Core i5 SKU'daki 26 C'ye kıyasla 33 C kadar sıcak olabilir. Oyun oynarken, klavye merkezi neredeyse 50 C'ye ulaşabilirken, Core i5 SKU yaklaşık 43 C'dir. İyi haber şu ki avuç içi dayanakları, tıklama yüzeyi ve WASD tuşları asla rahatsız edici derecede ısınmaz ve AC adaptörünün Core i5 seçeneği için olan adaptörden daha sıcaktır. Dell, XPS 15 9500 yapılandırması ne olursa olsun aynı 130 W AC adaptörünü gönderir. Birincil NVMe SSD doğrudan altına takıldığından, klavyenin sol alt köşesine en yakın noktanın 40 ° C'nin üzerinde çok sıcak olabileceğini unutmayın. Tabii ki, bu sadece SSD'ye sürekli olarak erişilirse gerçekleşir.
(±) Üst taraftaki maksimum sıcaklık, 36.8 °C / 98 F ortalamasına kıyasla 44 °C / 111 F'dir. , Multimedia sınıfı için 21 ile 71 °C arasında değişir.
(-) Alt kısım, 39.1 °C / 102 F ortalamasına kıyasla maksimum 48.8 °C / 120 F'ye kadar ısınır
(+) Boşta kullanımda, üst tarafın ortalama sıcaklığı 30.5 °C / 87 F olup, cihazın 31.3 °C / 88 F.
(-) The Witcher 3 oynarken, üst tarafın ortalama sıcaklığı 38.9 °C / 102 F olup, cihazın 31.3 °C / 88 F.
(+) Avuç içi dayanakları ve dokunmatik yüzey maksimum (34.4 °C / 93.9 F) cilt sıcaklığına ulaşıyor ve bu nedenle sıcak değil.
(-) Benzer cihazların avuç içi dayanağı alanının ortalama sıcaklığı 28.7 °C / 83.7 F (-5.7 °C / -10.2 F) idi.
Stress Test
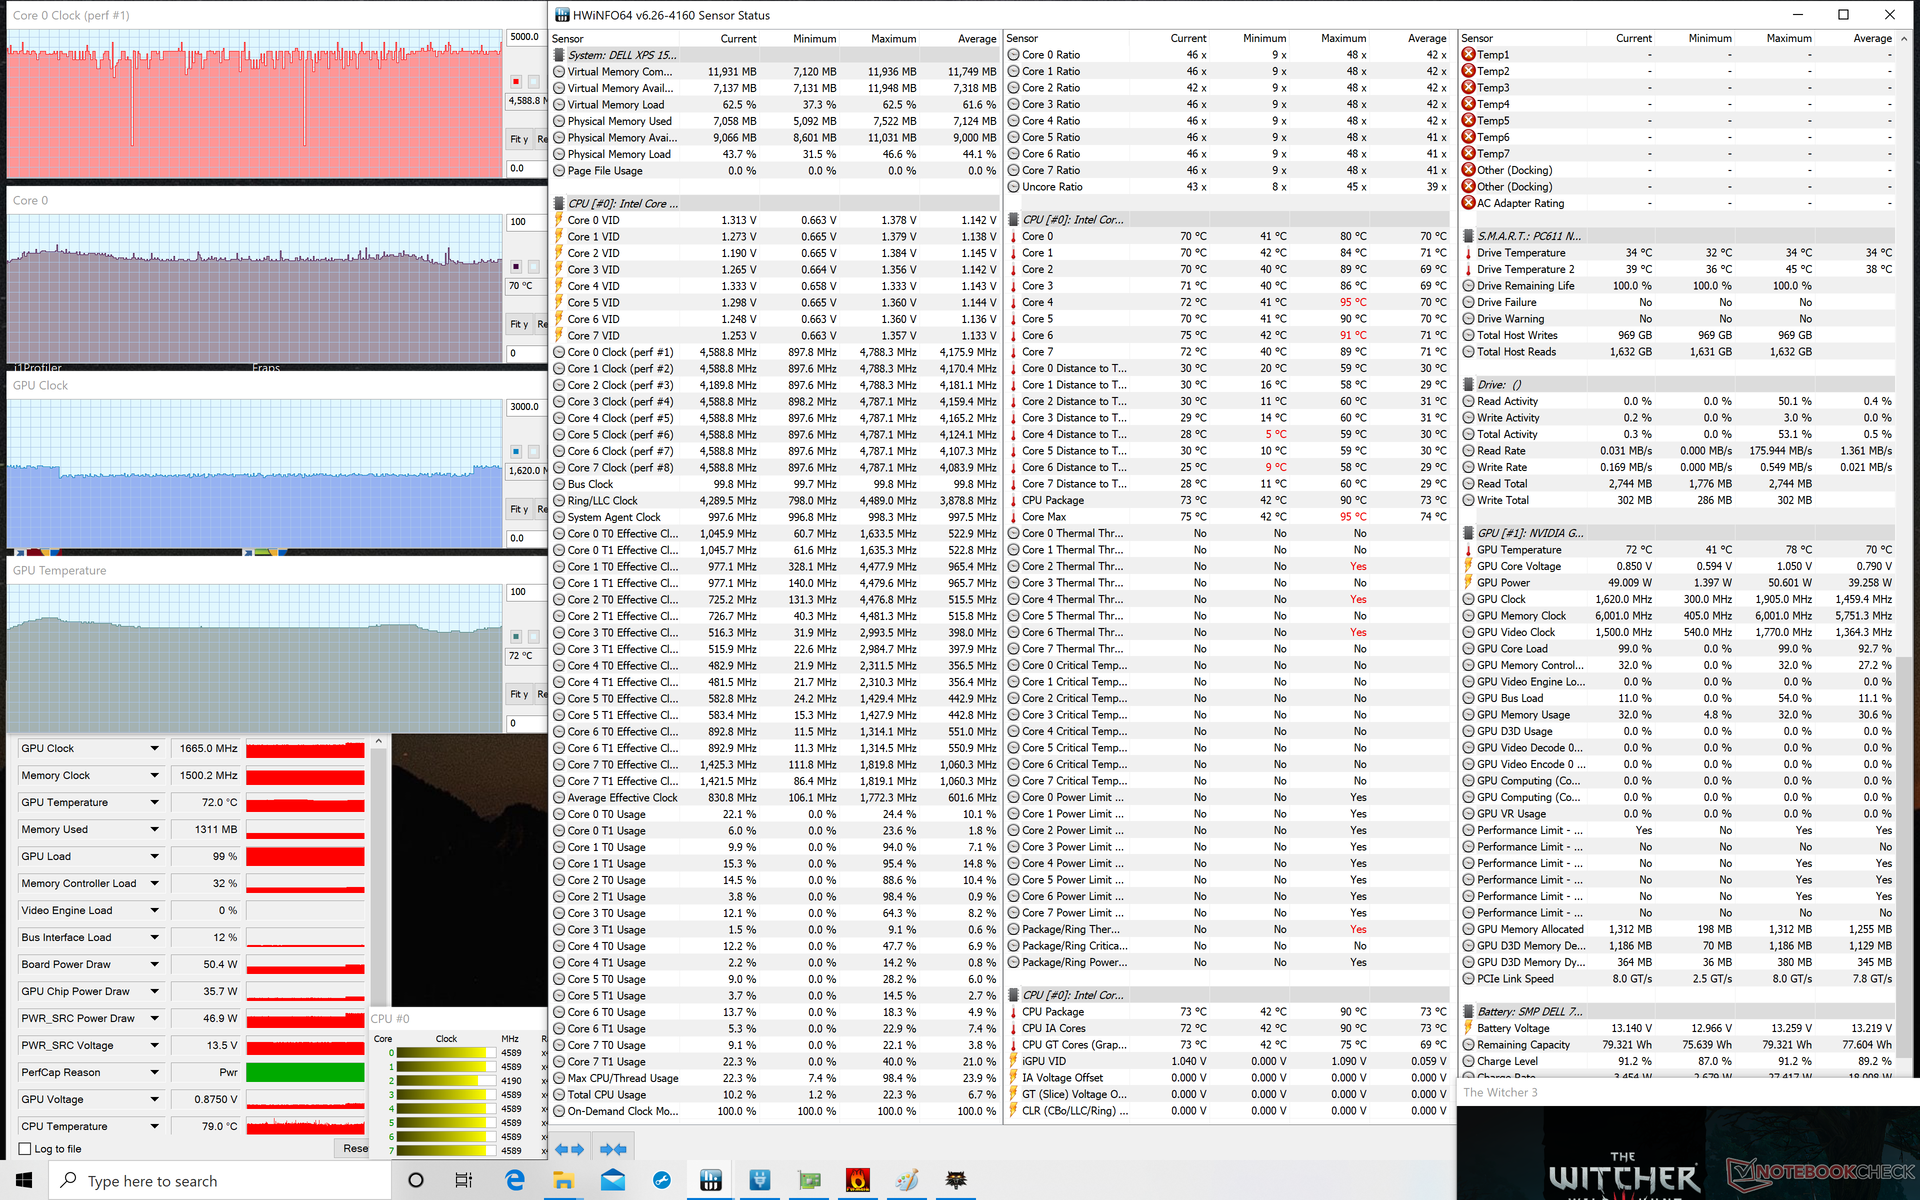
We stress the laptop to identify for any potential throttling or stability issues. When running Prime95, clock rates would boost up to 4.2 GHz for about 15 seconds until hitting a core temperature of 99 C. Thereafter, clock rates would fall to the 3.4 to 3.5 GHz range in order to maintain a slightly cooler core temperature of 90 C. After a minute, however, clock rates and temperature would fall even further to 2.9 GHz and 73 C, respectively, as shown by our screenshots below. This would occur even when running on Dell's Ultra Performance mode. Keep in mind that the Core i7-10875H is rated for a maximum Turbo Boost clock rate of 4.3 GHz for all eight cores meaning that the steady-state 2.9 GHz Turbo Boost on the XPS 15 is likely thermally limited.
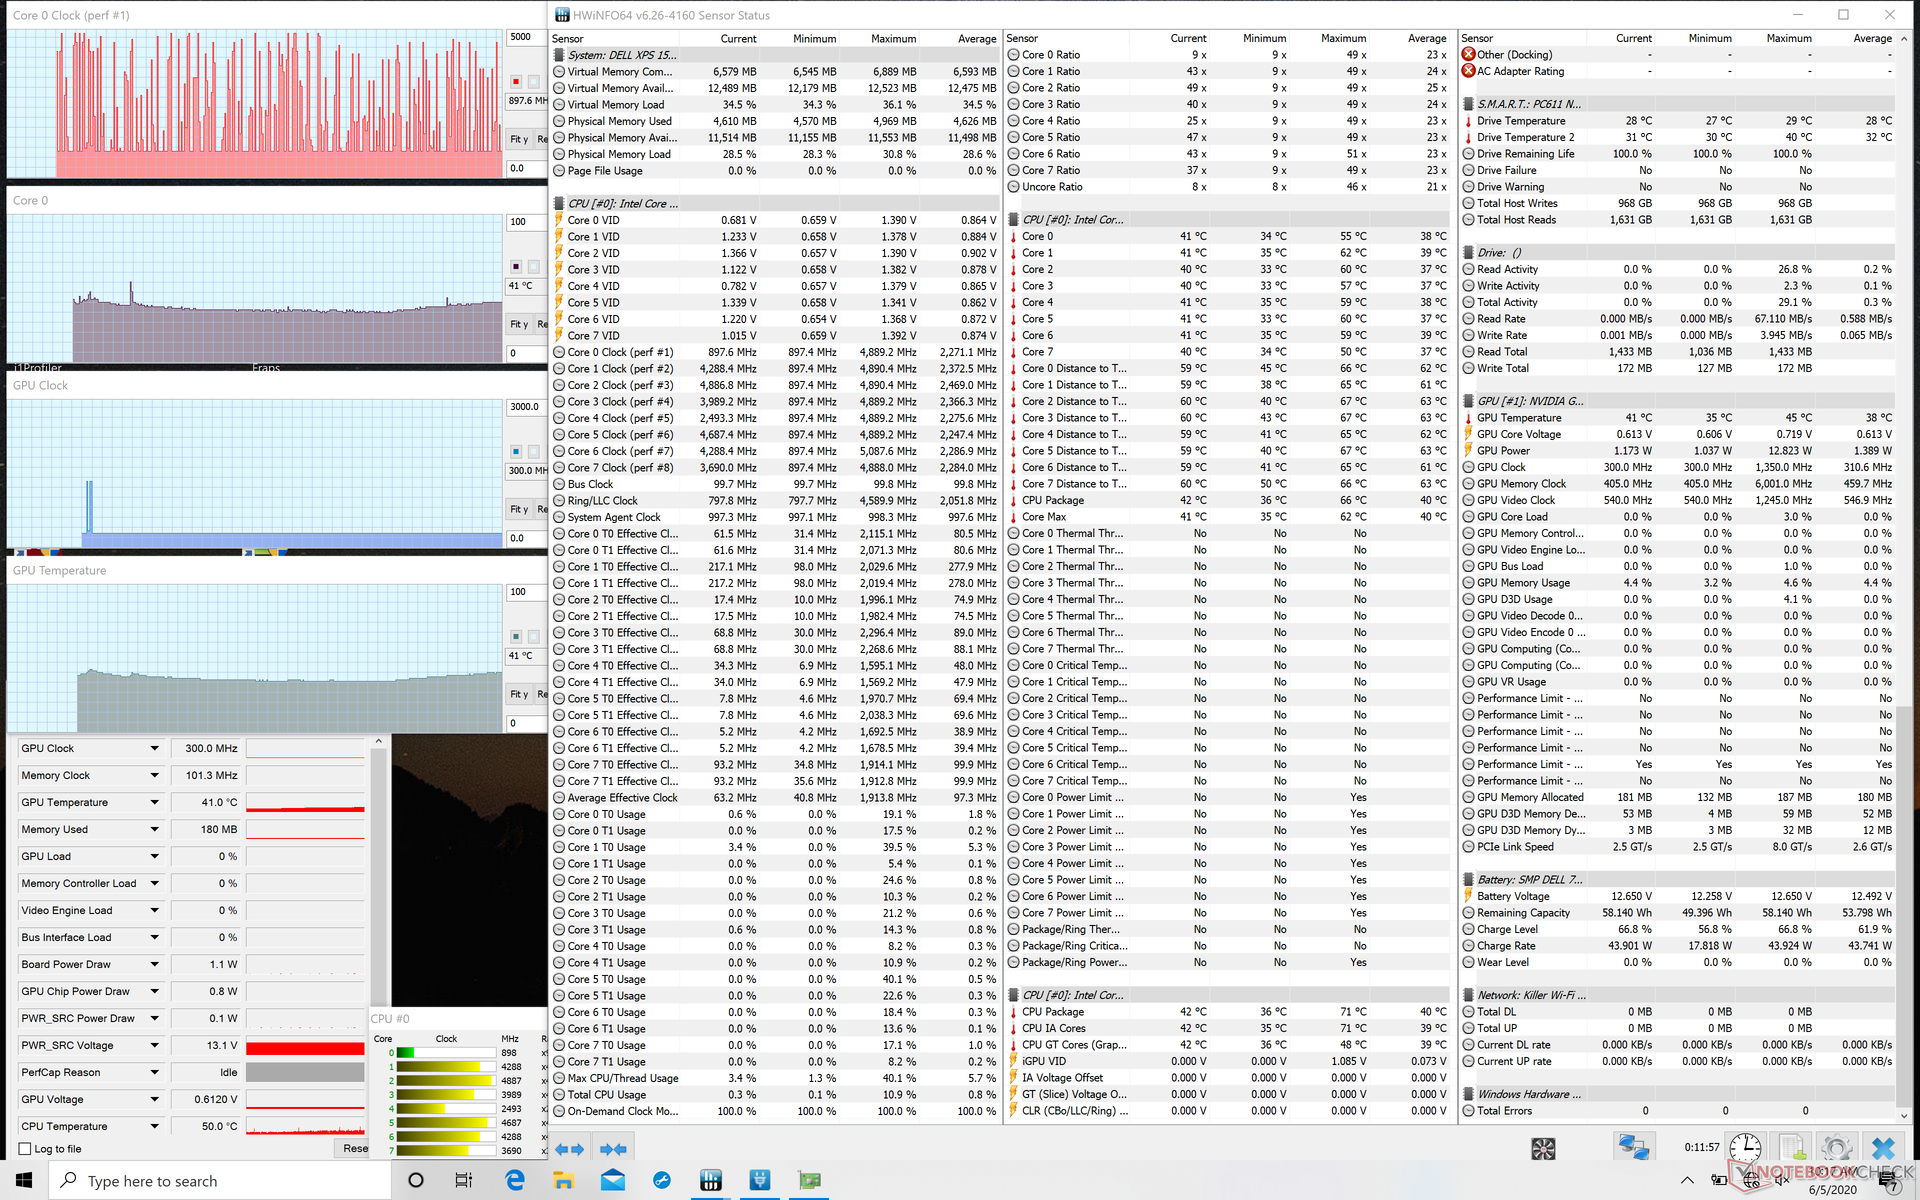
When running Witcher 3, both the CPU and GPU would each stabilize in the low 70 C range to be nearly identical to what we recorded on last year's XPS 15 7590 with the Core i9 CPU and GTX 1650 GPU. From what we can tell, it looks like Dell was aiming to keep temperatures relatively consistent gen-to-gen meaning that users shouldn't expect the XPS 15 9500 to run all that much cooler or warmer than previous generation models despite the significant chassis redesign.
Interestingly, GPU clock rates would alternative between ~1470 MHz and ~1650 MHz every few minutes when idling on Witcher 3 instead of remaining constant like on most other laptops. The cycling clock rates are likely responsible for the undesirable frame rate behavior mentioned in our Witcher 3 graph above.
Running on battery power will limit performance. A Fire Strike run on batteries returns Physics and Graphics scores of 17354 and 7956 points, respectively, compared to 21030 and 9930 points when on mains.
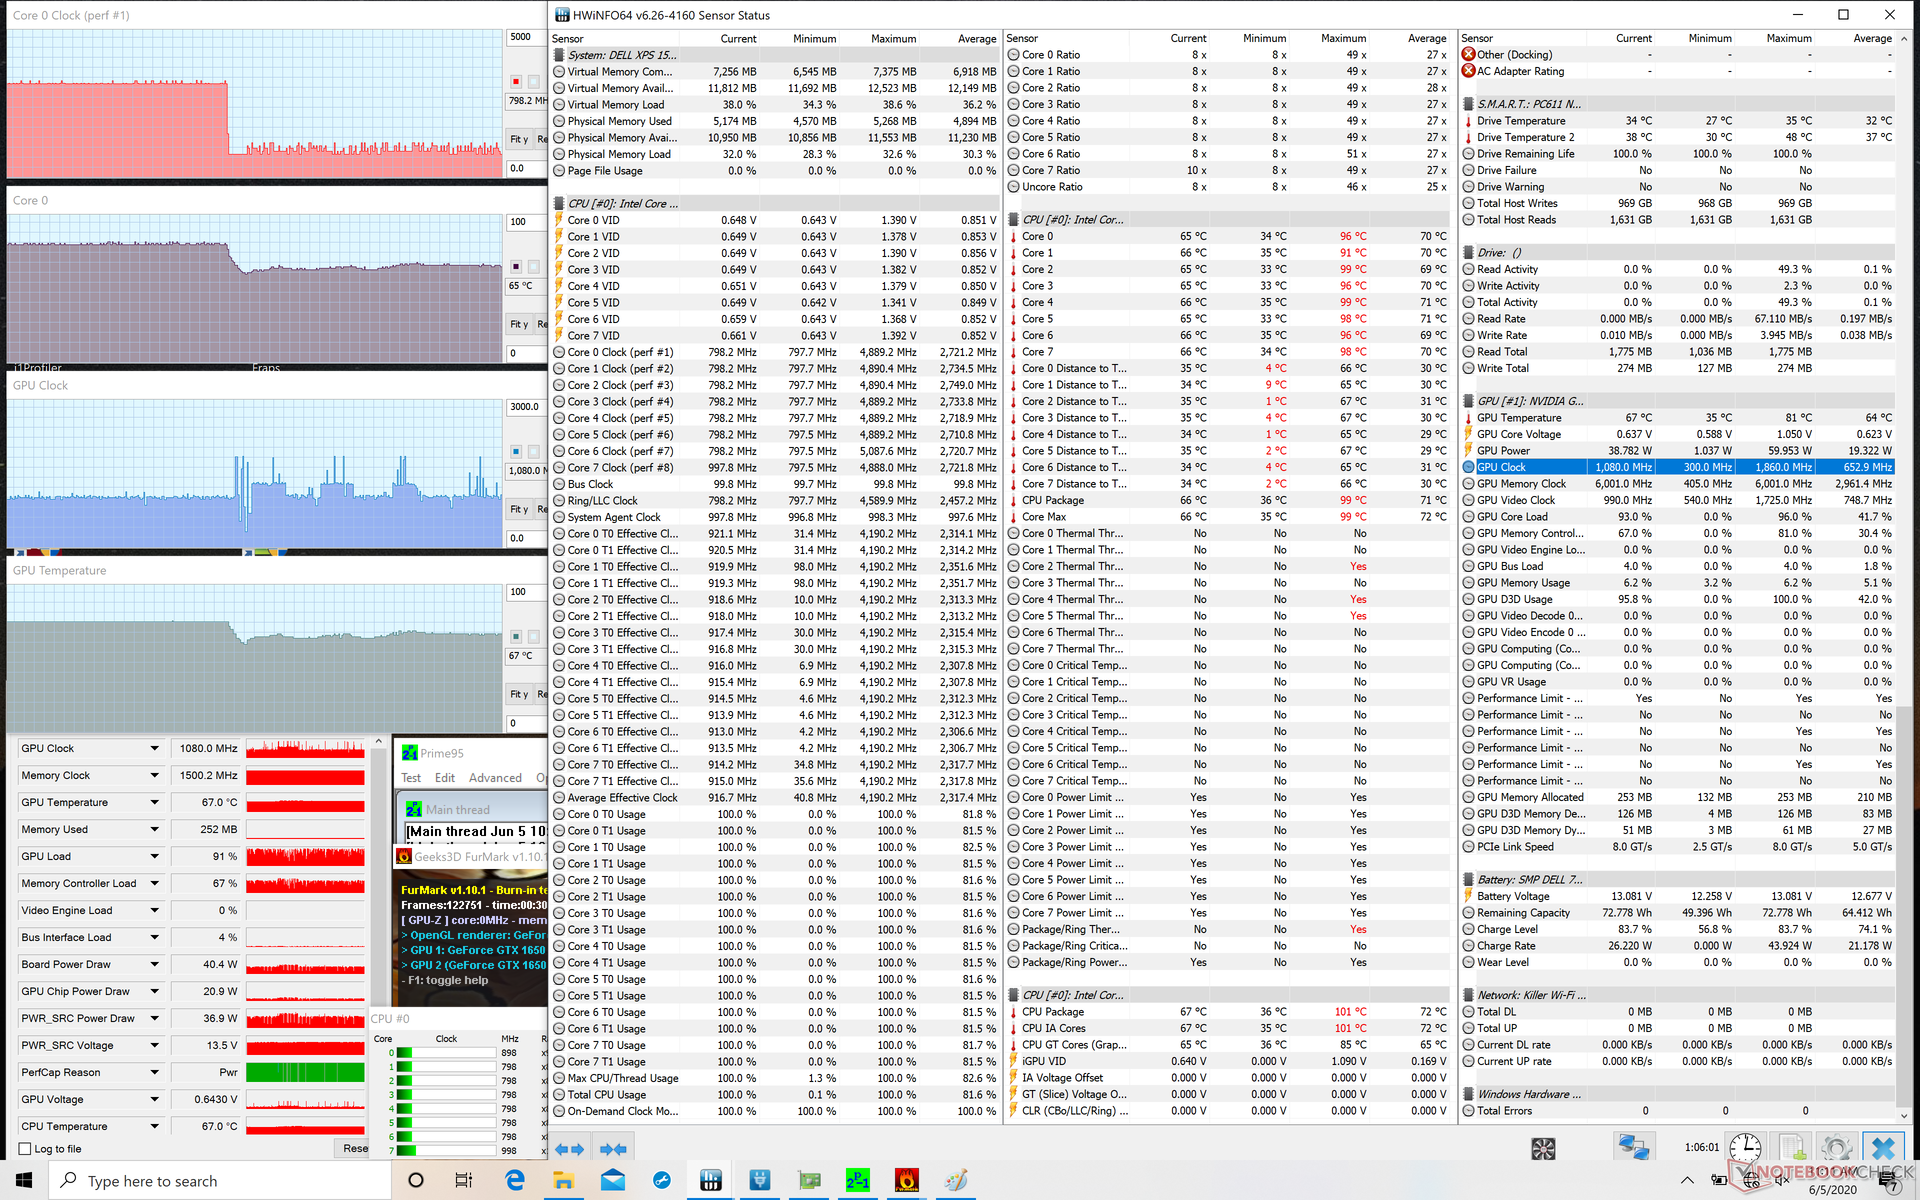
| CPU Clock (GHz) | GPU Clock (MHz) | Average CPU Temperature (°C) | Average GPU Temperature (°C) | |
| System Idle | -- | -- | ~40 | ~40 |
| Prime95 Stress | 2.8 - 3.0 | -- | 73 | 64 |
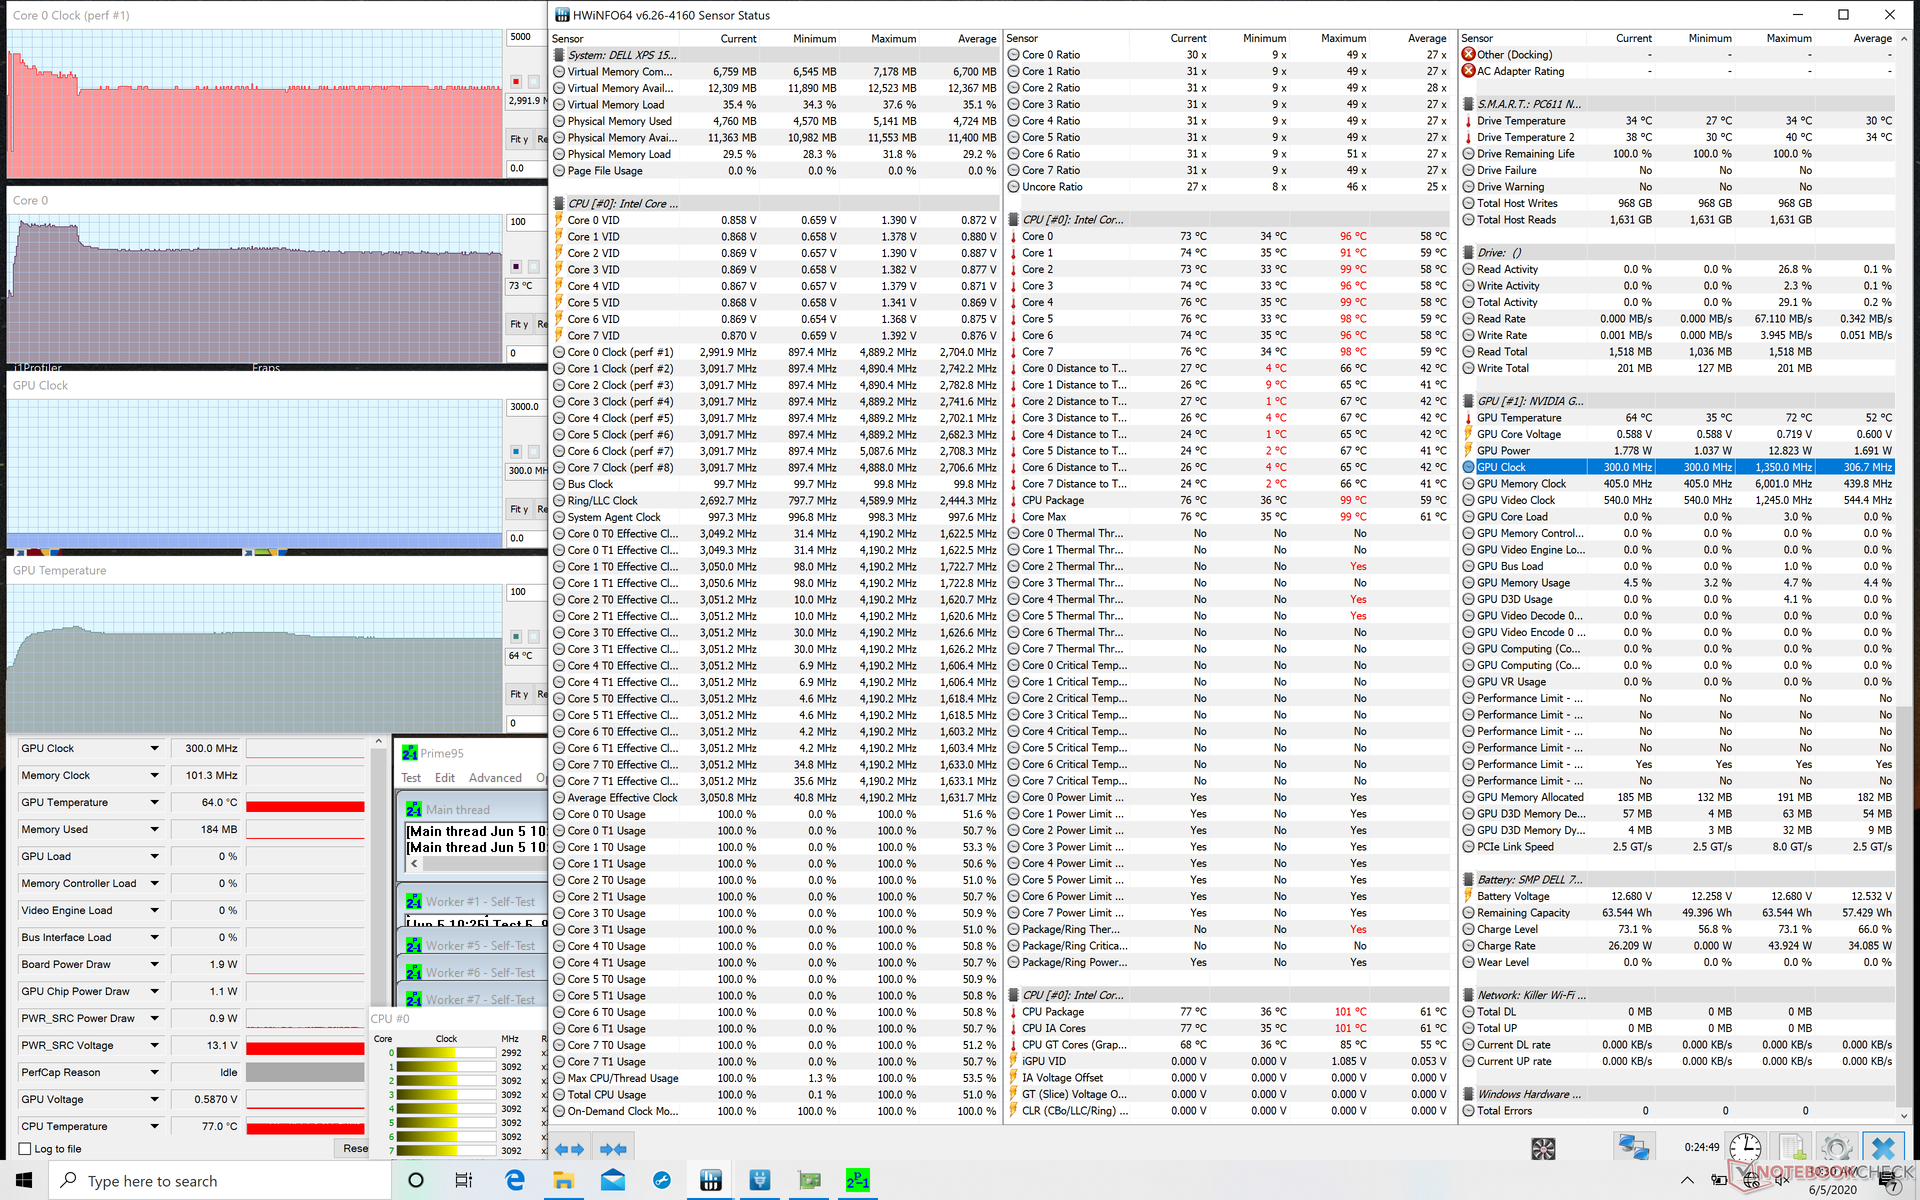
| Prime95 + FurMark Stress | 800 - 1100 | 1.0 - 1.3 | 65 | 67 |
| Witcher 3 Stress | ~4.4 | ~1470 - 1650 | ~70 | ~72 |
Speakers


Energy Management
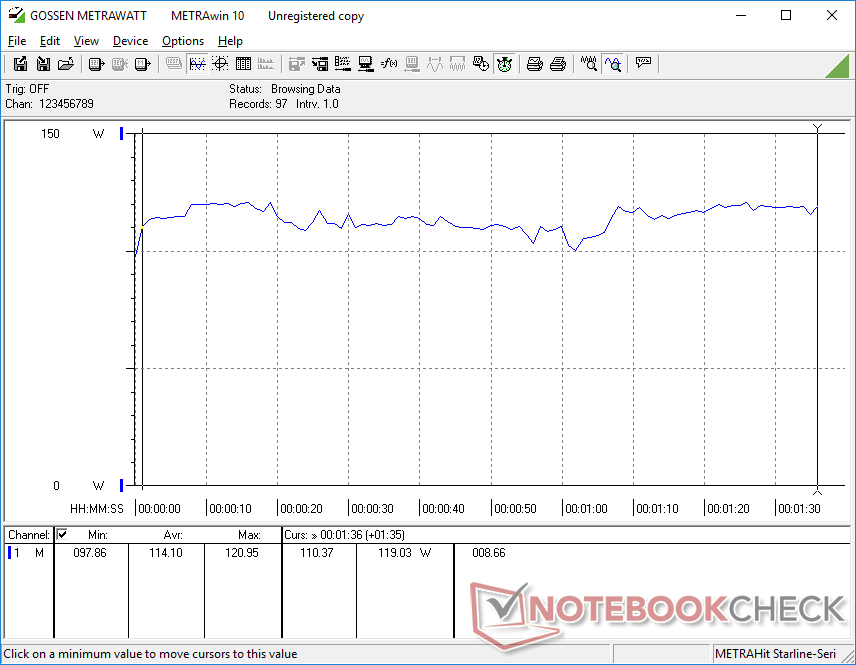
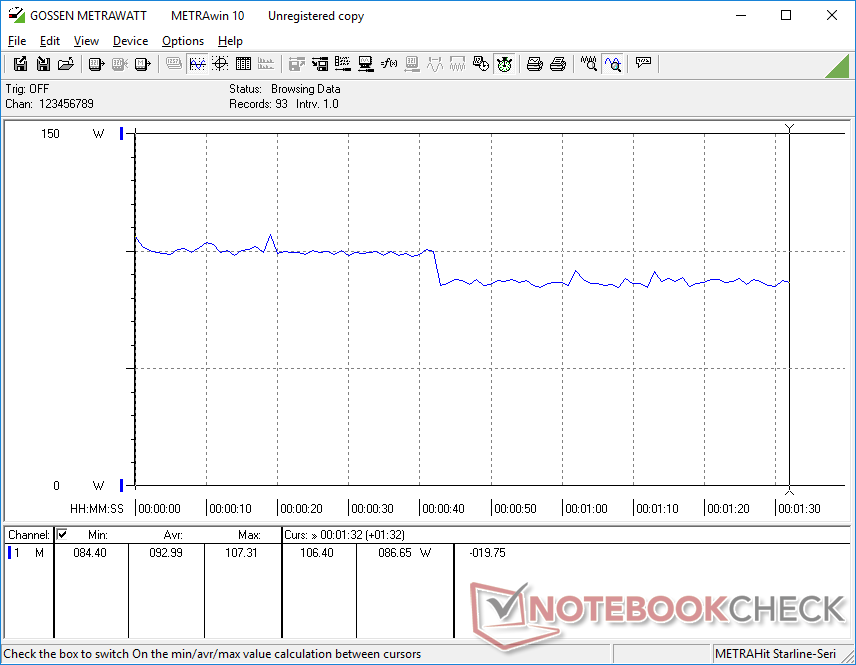
Power Consumption
Our Core i7 configuration draws significantly more power than the base Core i5 configuration by over 2x when gaming or under other high loads. Performance-per-watt, however, is still very much in favor of the Core i7 SKU especially in terms of graphics power. Average rates are very close to what we recorded on the 2019 XPS 15 7590 Core i9 SKU which aligns with our temperature observations above.
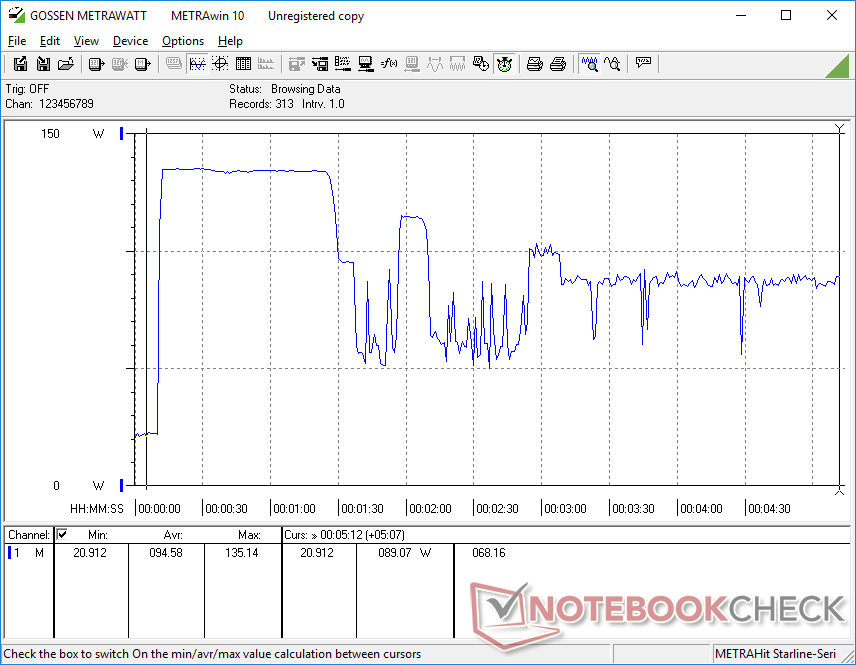
When running Prime95, consumption would spike to 135 W for about 15 seconds before falling to ~120 W for about a minute thereafter. Consumption eventually stabilizes at 84.4 W for a behavior similar to what we observed during our Stress Test clock rate observations.
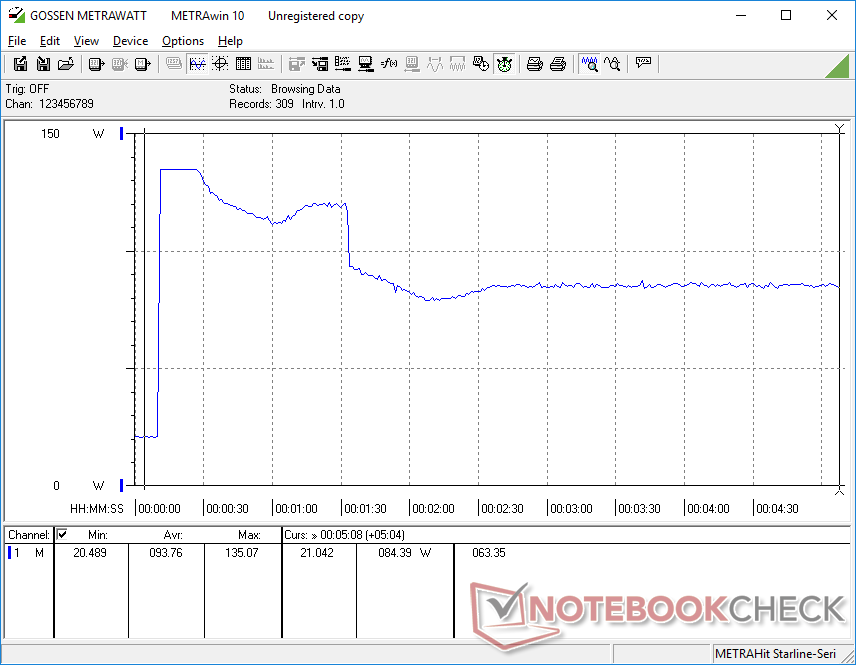
We're able to record a maximum consumption of 135.2 W when running both Prime95 and FurMark simultaneously. This would eventually drop and fluctuate before finally stabilizing at about 89 W.
| Kapalı / Bekleme modu | |
| Boşta | |
| Çalışırken |
|
Key:
min: | |
| Dell XPS 15 9500 Core i7 4K UHD i7-10875H, GeForce GTX 1650 Ti Mobile, SK Hynix PC611 512GB, IPS, 3840x2400, 15.6" | Dell XPS 15 7590 9980HK GTX 1650 i9-9980HK, GeForce GTX 1650 Mobile, Toshiba XG6 KXG60ZNV1T02, OLED, 3840x2160, 15.6" | Lenovo Yoga C940-15IRH i7-9750H, GeForce GTX 1650 Max-Q, Intel Optane Memory H10 with Solid State Storage 32GB + 512GB HBRPEKNX0202A(L/H), IPS, 1920x1080, 15.6" | Asus ZenBook 15 UX534FTC-A8190T i7-10510U, GeForce GTX 1650 Max-Q, Samsung SSD PM981 MZVLB1T0HALR, IPS, 1920x1080, 15.6" | MSI Prestige 15 A10SC i7-10710U, GeForce GTX 1650 Max-Q, Samsung SSD PM981 MZVLB1T0HALR, IPS, 3840x2160, 15.6" | Dell XPS 15 9500 Core i5 i5-10300H, UHD Graphics 630, Toshiba KBG40ZNS256G NVMe, IPS, 1920x1200, 15.6" | |
|---|---|---|---|---|---|---|
| Power Consumption | 4% | 6% | 41% | 14% | 49% | |
| Idle Minimum * (Watt) | 5.7 | 6.2 -9% | 5.2 9% | 2.8 51% | 6.1 -7% | 2.9 49% |
| Idle Average * (Watt) | 13.5 | 9.6 29% | 10.7 21% | 7.7 43% | 13.2 2% | 7.6 44% |
| Idle Maximum * (Watt) | 19.6 | 21.2 -8% | 24.3 -24% | 9.4 52% | 19.2 2% | 8 59% |
| Load Average * (Watt) | 114.1 | 104.3 9% | 84.4 26% | 57 50% | 75 34% | 41.7 63% |
| Witcher 3 ultra * (Watt) | 93 | 91.7 1% | 83.9 10% | 62 33% | 74 20% | |
| Load Maximum * (Watt) | 135.2 | 135.3 -0% | 142.8 -6% | 116 14% | 89.7 34% | 94.8 30% |
* ... daha küçük daha iyidir
Battery Life
Higher-end XPS 15 9500 configurations come with an 86 Wh battery compared to the smaller 56 Wh battery on SKUs without the GeForce GPU. The larger capacity balances out the more demanding hardware quite well as runtimes between our Core i5 and Core i7 SKUs are very close to one another. When both systems are set to the same WLAN conditions, we're able to reach just over 9 hours of constant use before automatic shutdown on each unit.
Charging, on the other hand, will take noticeably longer on the 86 Wh battery. Whereas the 56 Wh module would charge in just 1.5 hours, the 86 Wh battery would take a little over two hours from empty to full capacity.
The 86 Wh battery occupies the same volume as the lesser 56 Wh battery. It's technically possible to swap out one battery for another regardless of SKU.
| Dell XPS 15 9500 Core i7 4K UHD i7-10875H, GeForce GTX 1650 Ti Mobile, 86 Wh | Dell XPS 15 7590 9980HK GTX 1650 i9-9980HK, GeForce GTX 1650 Mobile, 97 Wh | Lenovo Yoga C940-15IRH i7-9750H, GeForce GTX 1650 Max-Q, 69 Wh | Asus ZenBook 15 UX534FTC-A8190T i7-10510U, GeForce GTX 1650 Max-Q, 71 Wh | MSI Prestige 15 A10SC i7-10710U, GeForce GTX 1650 Max-Q, 82 Wh | Dell XPS 15 9575 i5-8305G i5-8305G, Vega M GL / 870, 75 Wh | Dell XPS 15 9500 Core i5 i5-10300H, UHD Graphics 630, 56 Wh | |
|---|---|---|---|---|---|---|---|
| Pil Çalışma Süresi | 6% | -21% | 25% | -9% | -28% | -1% | |
| Reader / Idle (h) | 23 | 15.2 -34% | 18.2 -21% | 27.2 18% | 19.1 -17% | 11.1 -52% | 26.4 15% |
| WiFi v1.3 (h) | 9.1 | 7.8 -14% | 9.7 7% | 12.4 36% | 7.6 -16% | 9.4 3% | 9.3 2% |
| Load (h) | 2 | 3.3 65% | 1 -50% | 2.4 20% | 2.1 5% | 1.3 -35% | 1.6 -20% |
Artılar
Eksiler
Verdict
The XPS 15 9500 with Core i7-10875H and GTX 1650 Ti graphics serves to directly replace last year's XPS 15 with Core i9-9980HK and GTX 1650 graphics. Performance-wise, the newer model is marginally faster without needing to run any warmer or louder. Users who were hoping for a quieter or cooler experience will have to mend their original expectations as power consumption and noise have remained steady gen-over-gen.
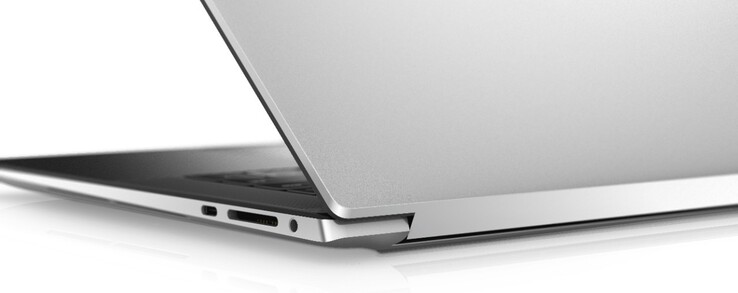
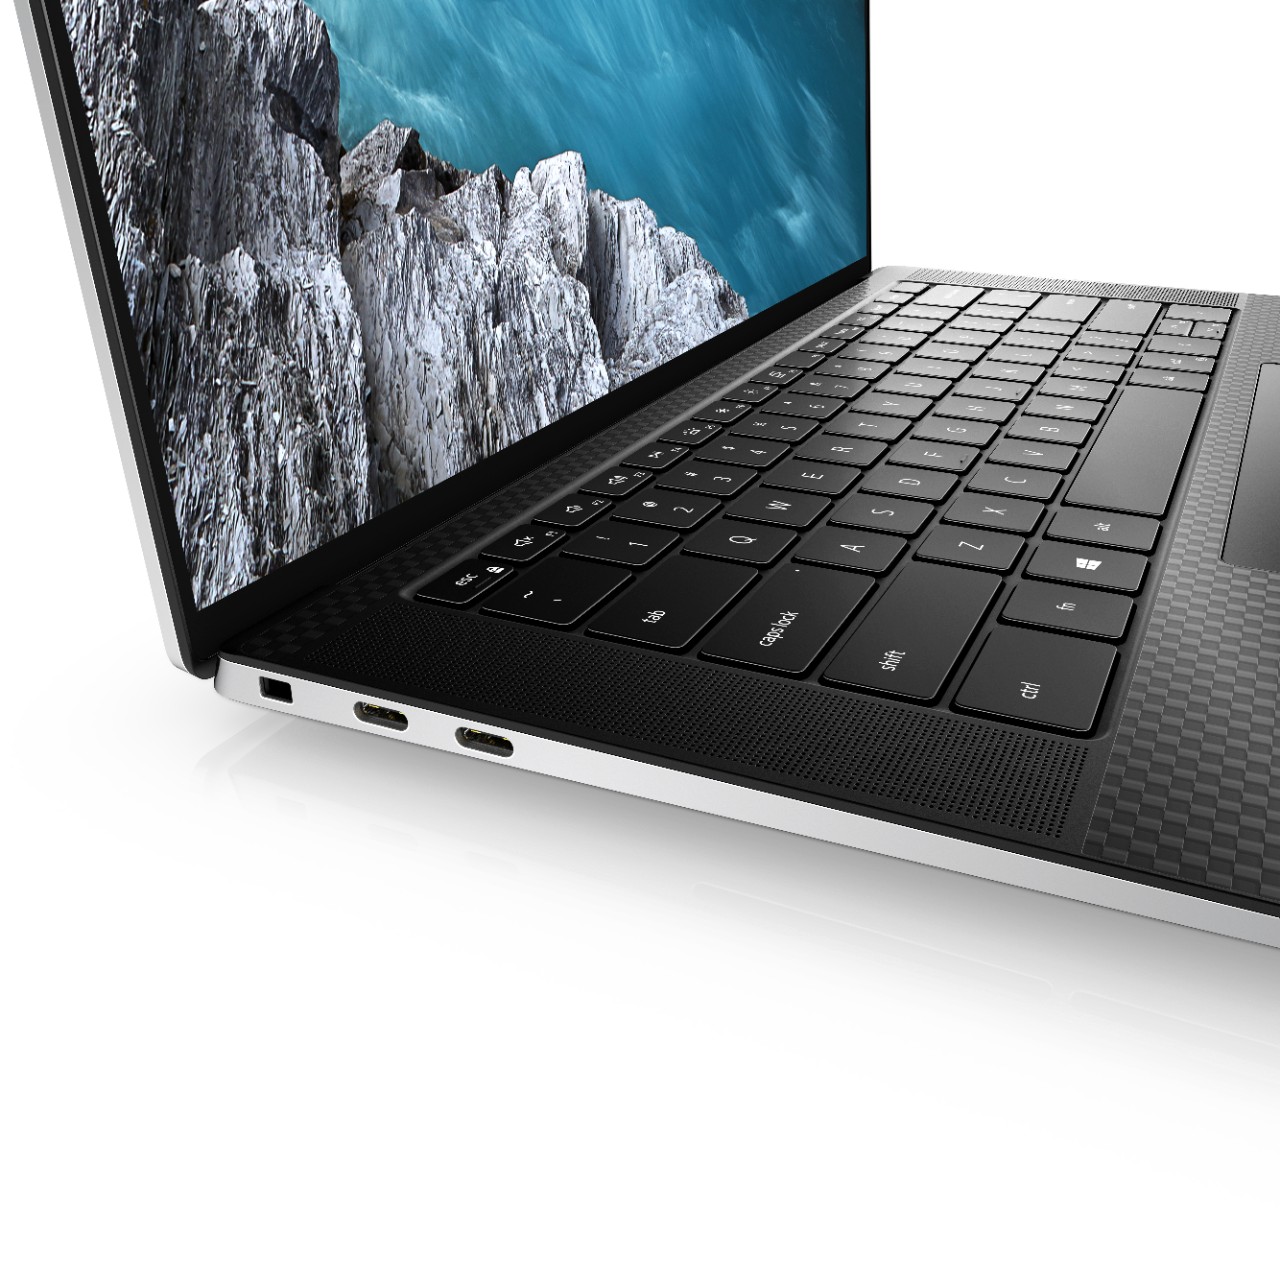
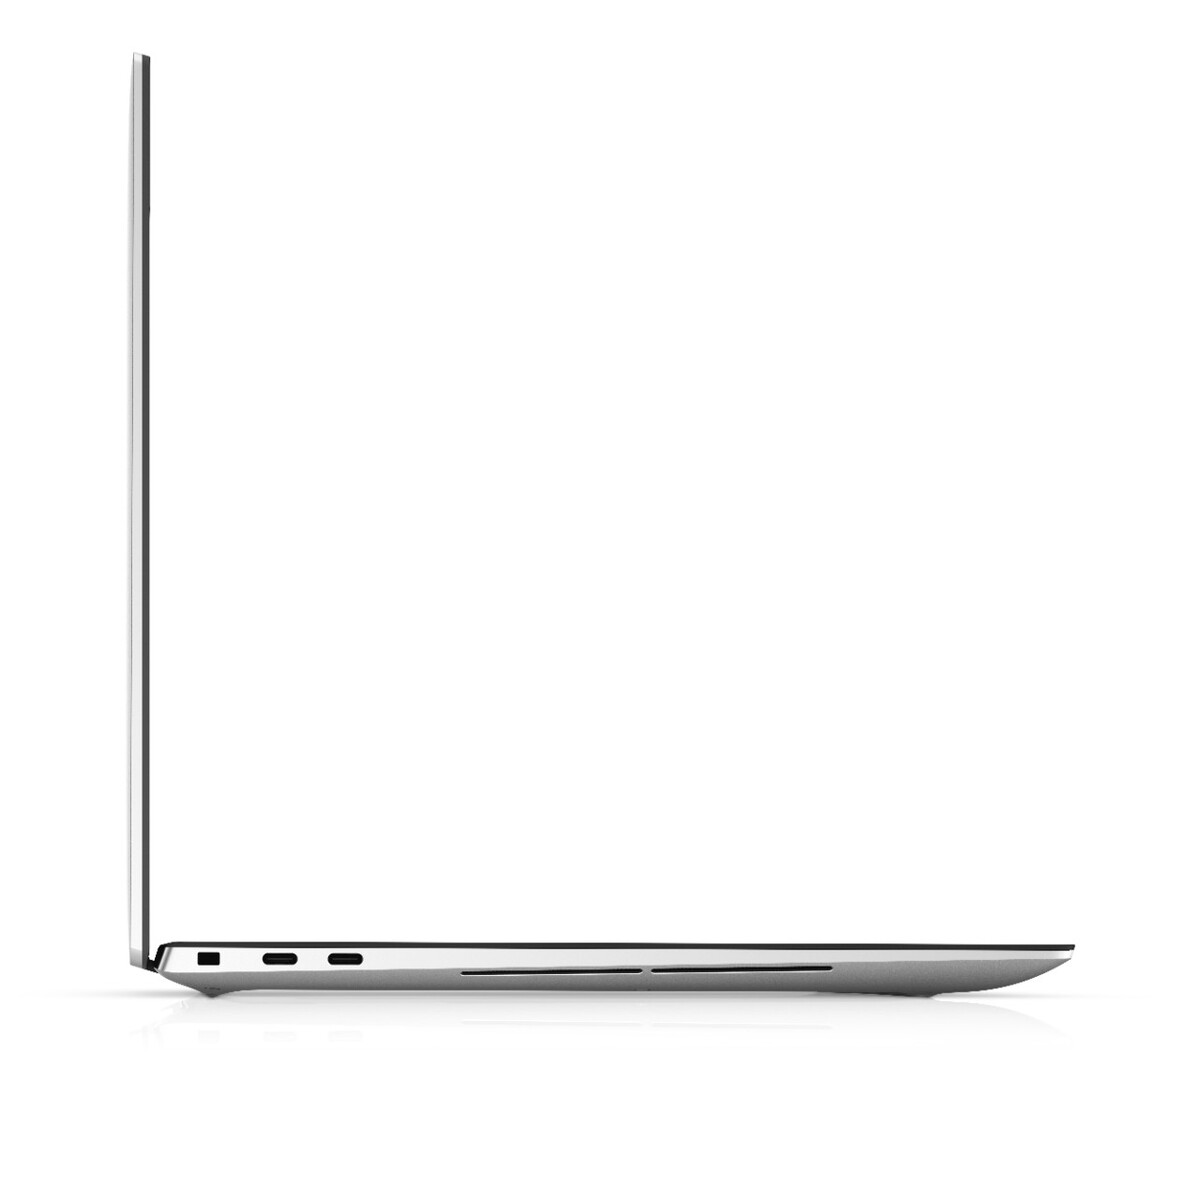
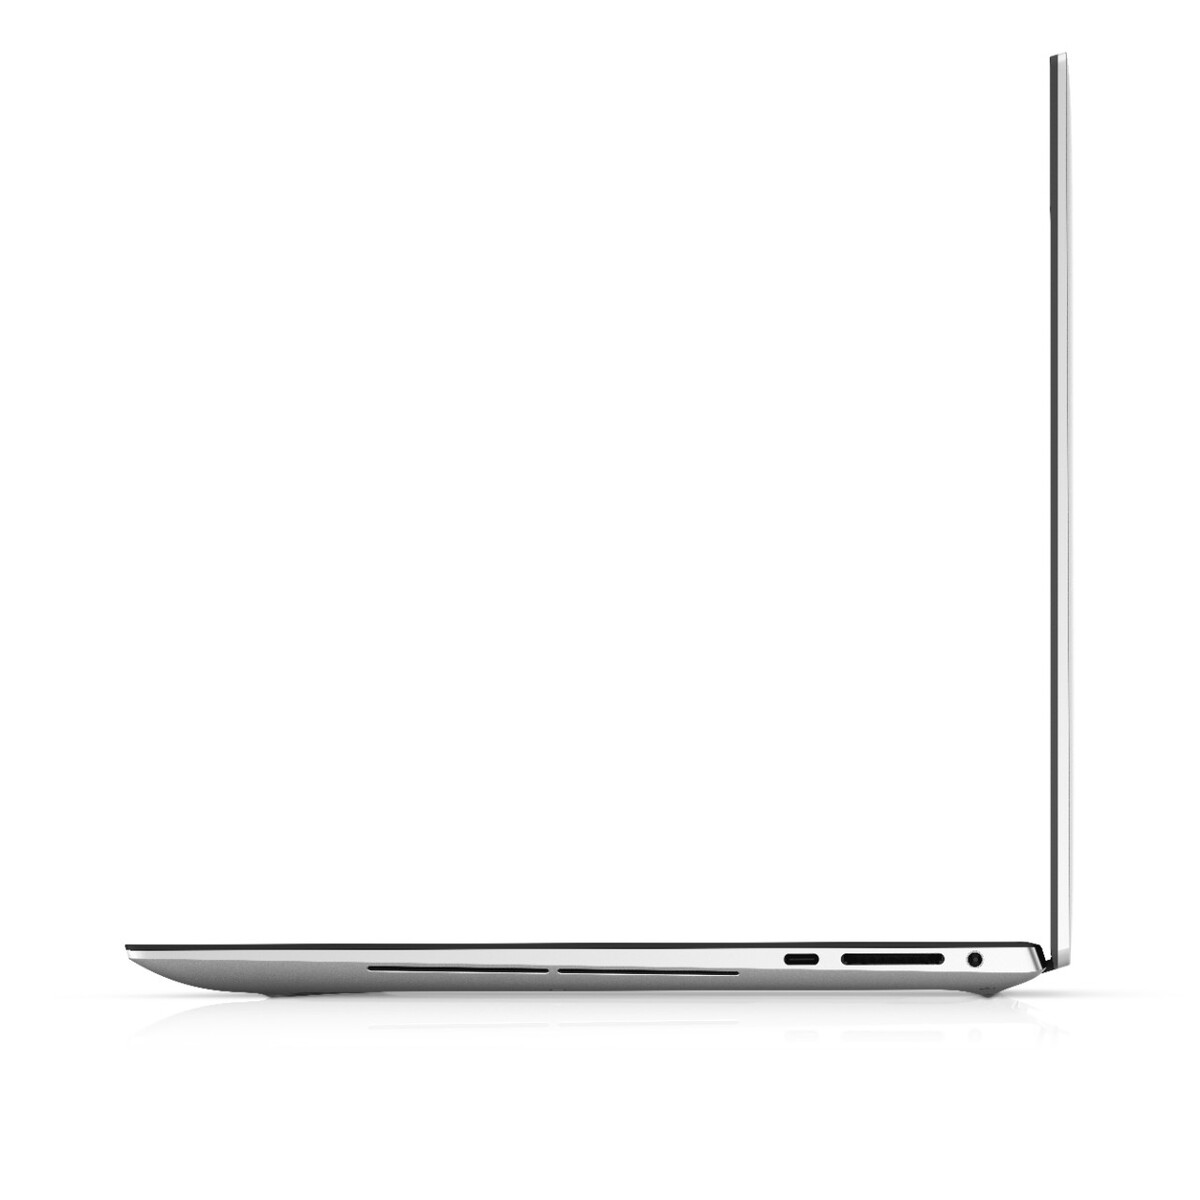
The best reason for choosing the XPS 15 9500 over the older XPS 15 7590 is still for its 16:10 display because this change will be immediately noticeable and beneficial to the end-user in relation to the minor CPU or GPU performance upgrades. Other physical changes like the smaller dimensions, larger clickpad, improved audio, and better keyboard feedback help to make the newer model that much better to use than the 2019 model. Our main gripes with the system relate mostly to the over-reliance of USB Type-C and the average performance sustainability of the GPU when gaming. Fortunately, the former can be addressed with adapters while anyone bothered by the latter can choose from plenty of other options ranging from Alienware to MSI where GPU performance is both steadier and oftentimes faster.
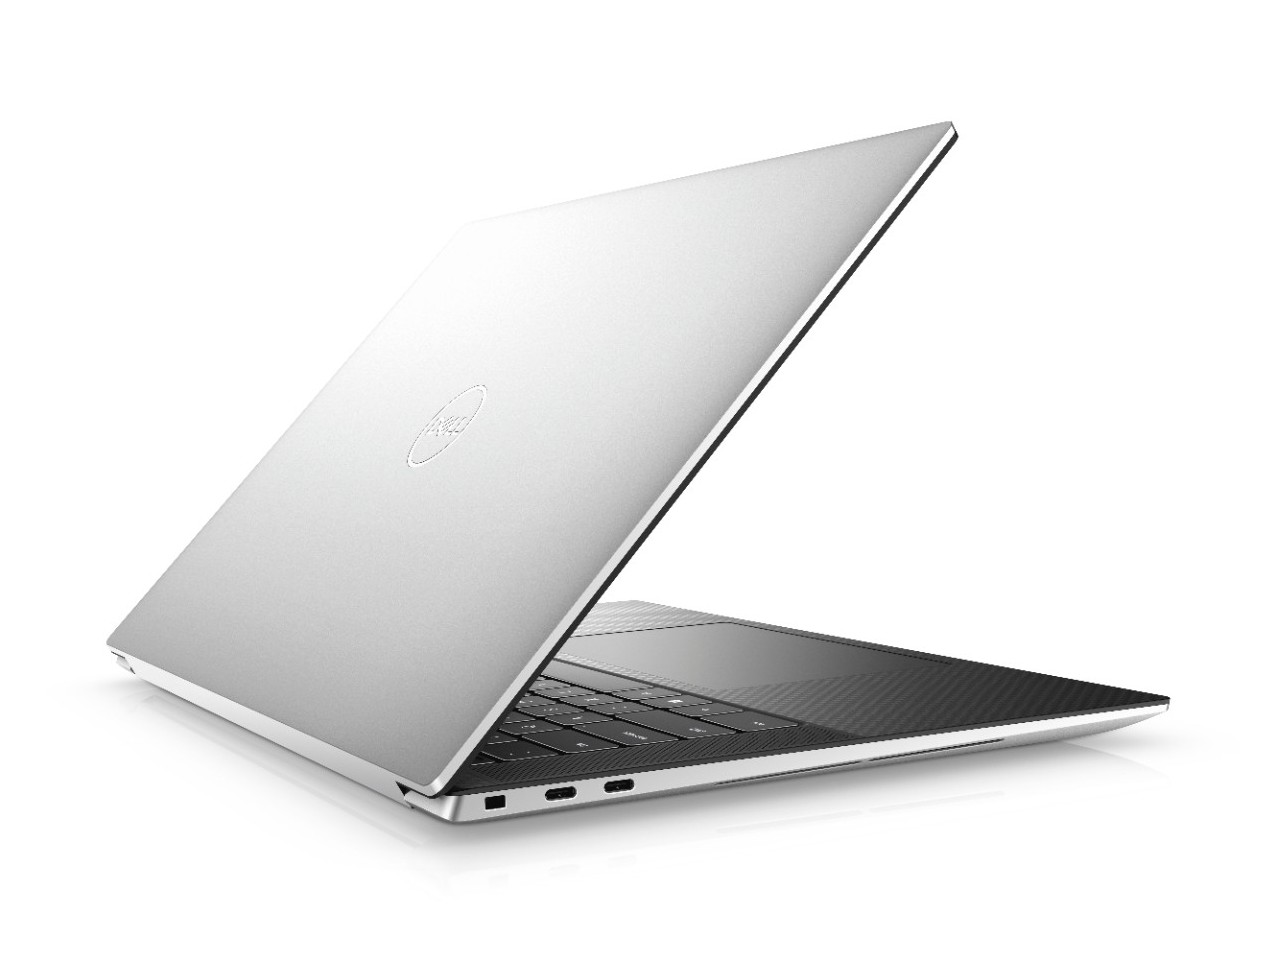
The 2016 XPS 15 was a catalyst for narrow-bezel Ultrabook designs and the 2020 XPS 15 will likely do the same for 16:10 displays. This alone separates the XPS 15 9500 from other Core-H-powered Ultrabooks much more so than any processor differences you can find.
Dell XPS 15 9500 Core i7 4K UHD
- 06/09/2020 v7 (old)
Allen Ngo
Price comparison

