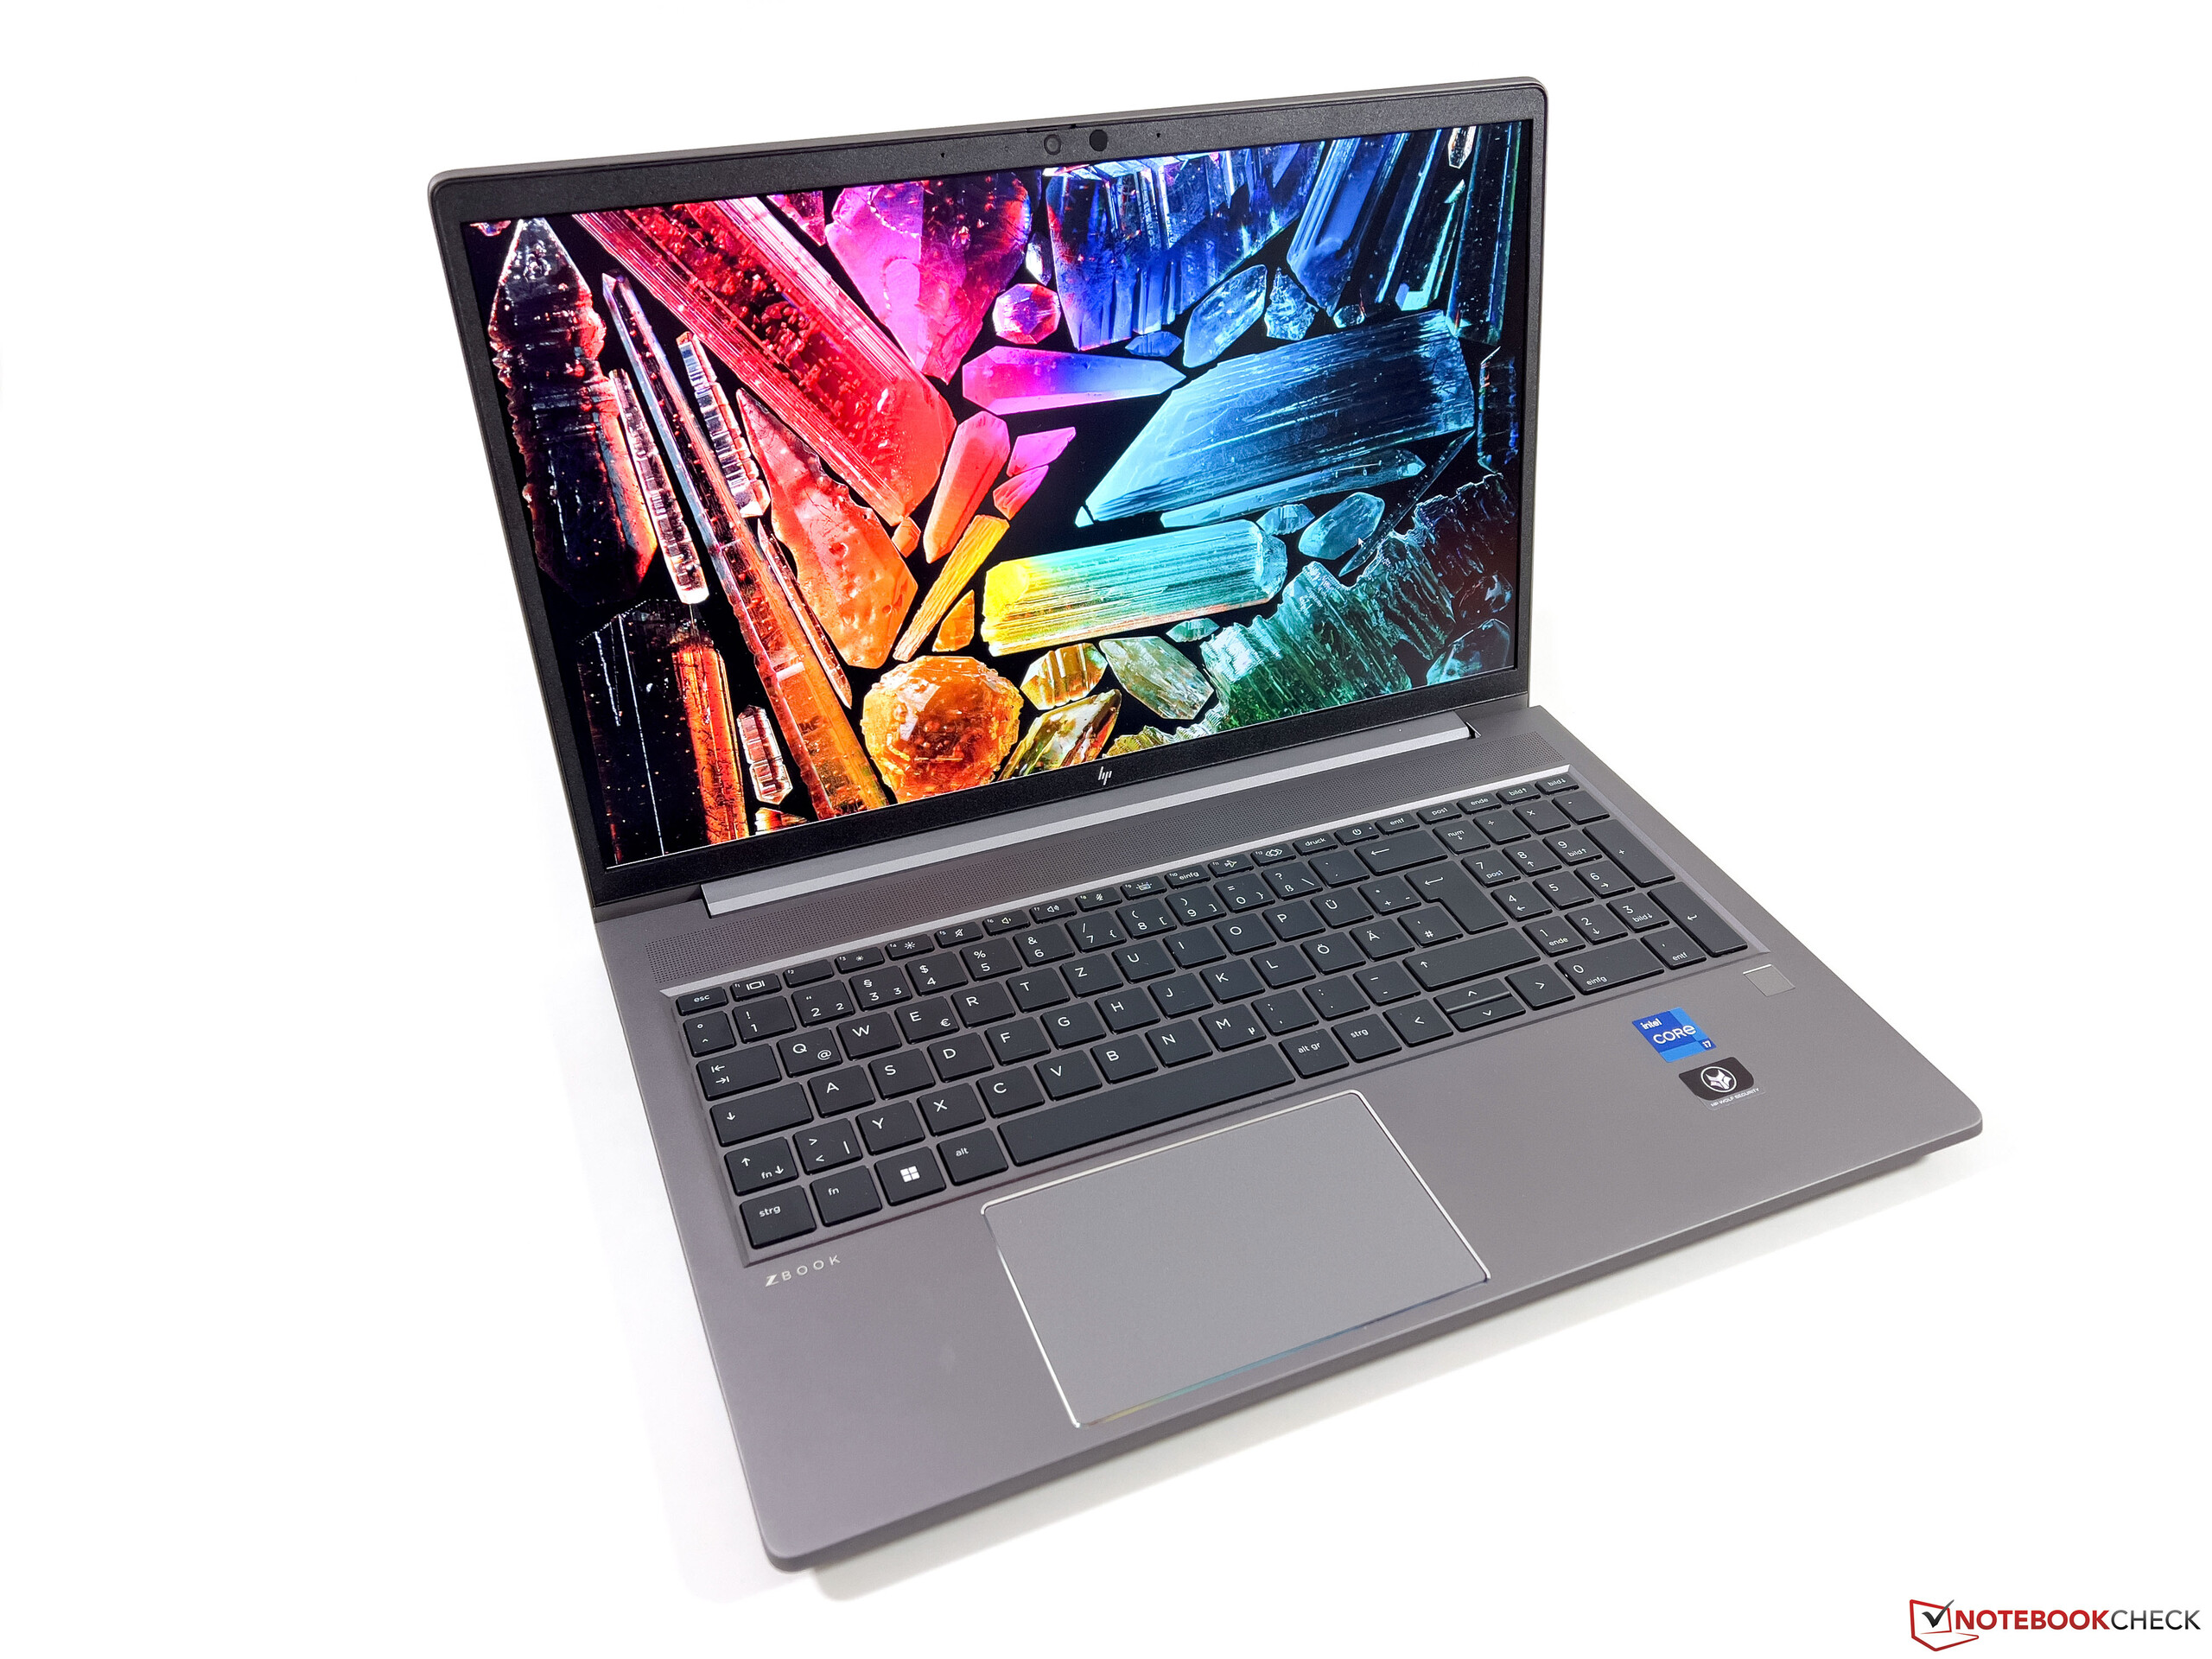
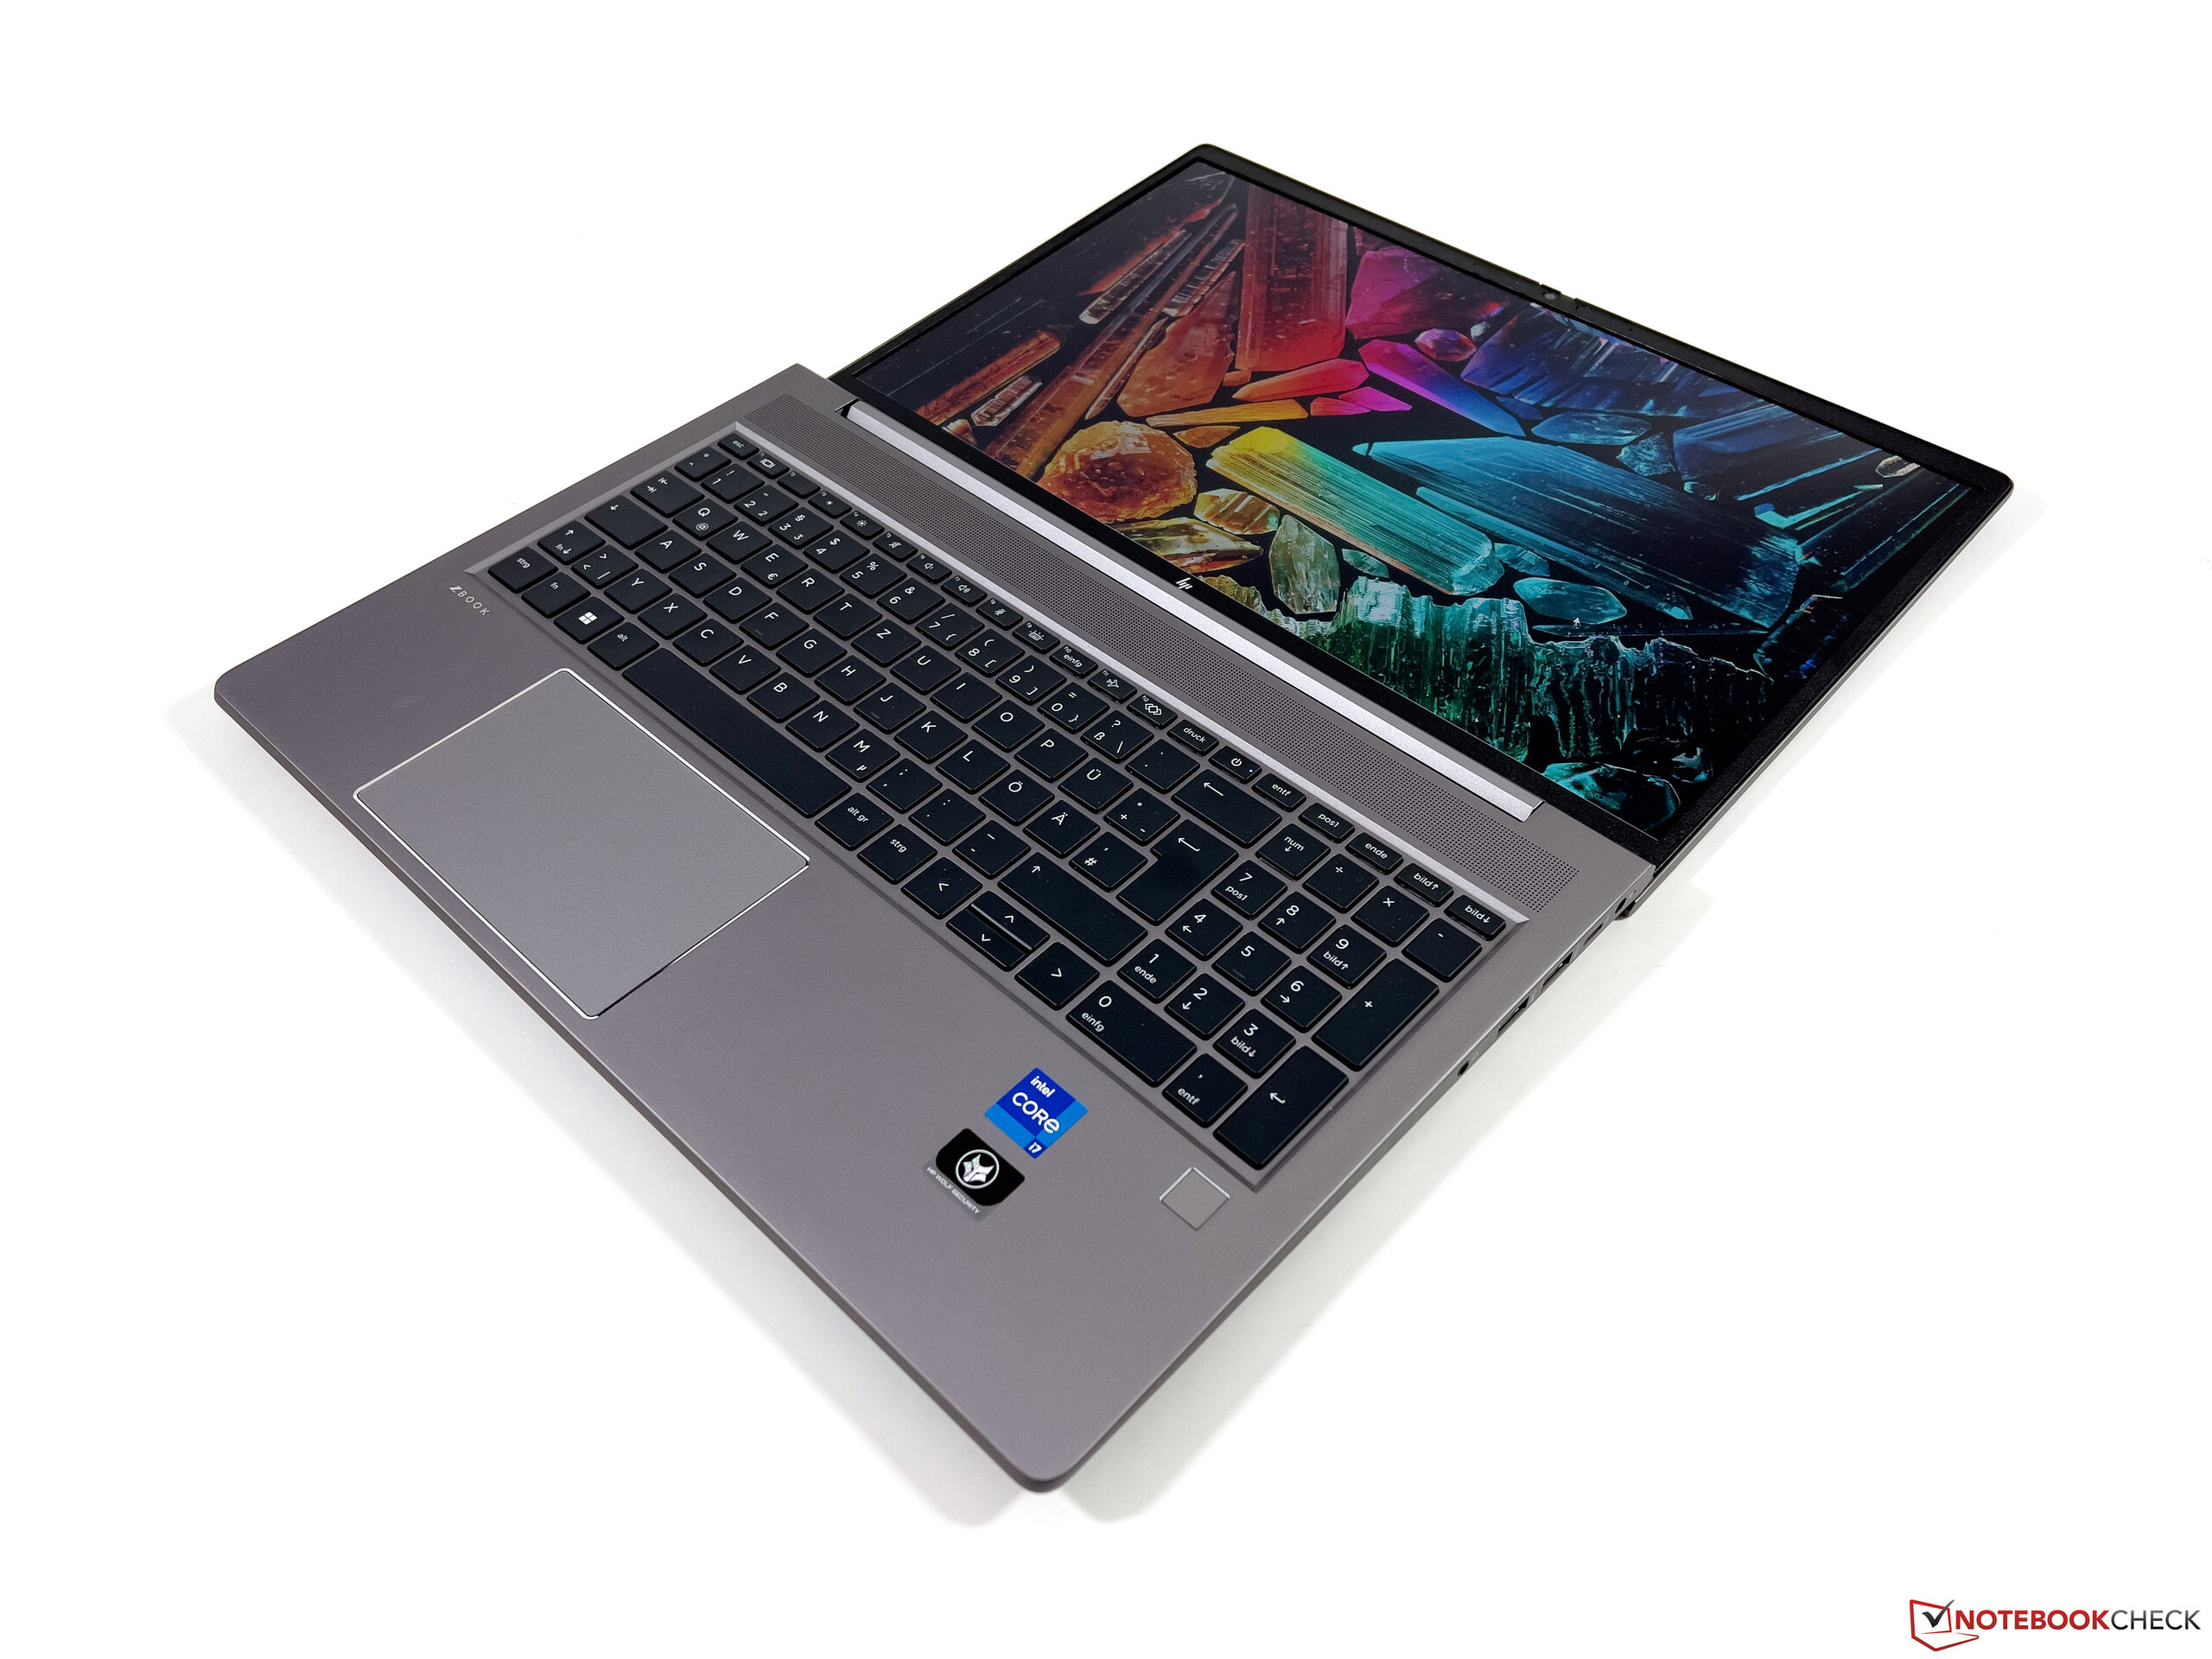
HP ZBook Power 15 G10 iş istasyonu incelemesi: ThinkPad P15v'ye mükemmel bir alternatif

HP ZBook Power 15 G10, Alder Lake 12. nesil Intel CPU'ları daha yeni Raptor Lake 13. nesil ve AMD Ryzen Zen 4 seçenekleriyle değiştirerek geçen yılki ZBook Power 15 G9'un yerini alıyor. Kasa, aksi takdirde geçen yılki ZBook Power 15 G9 veya ZBook Power 15 G8 bu nedenle modelin fiziksel özellikleri hakkında daha fazla bilgi edinmek için eski incelemelerimize göz atmanızı öneririz.
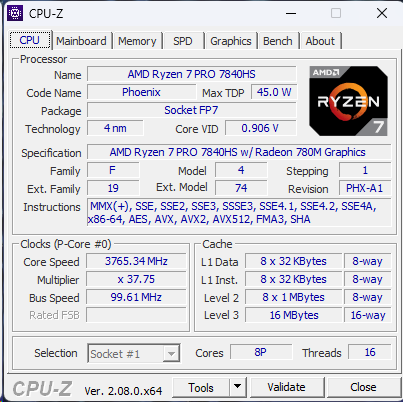
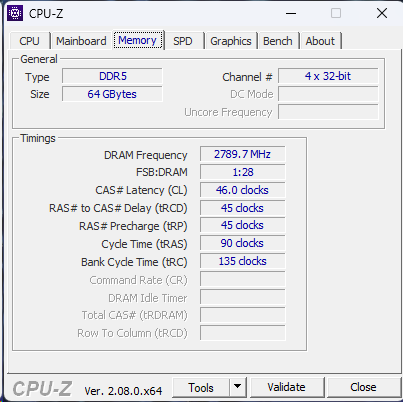
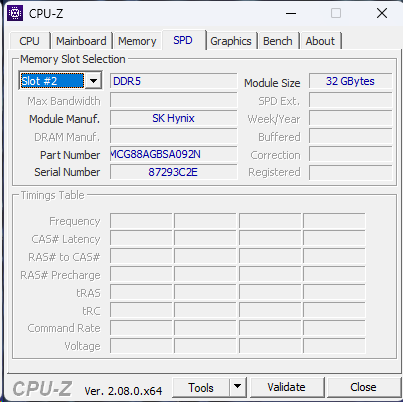
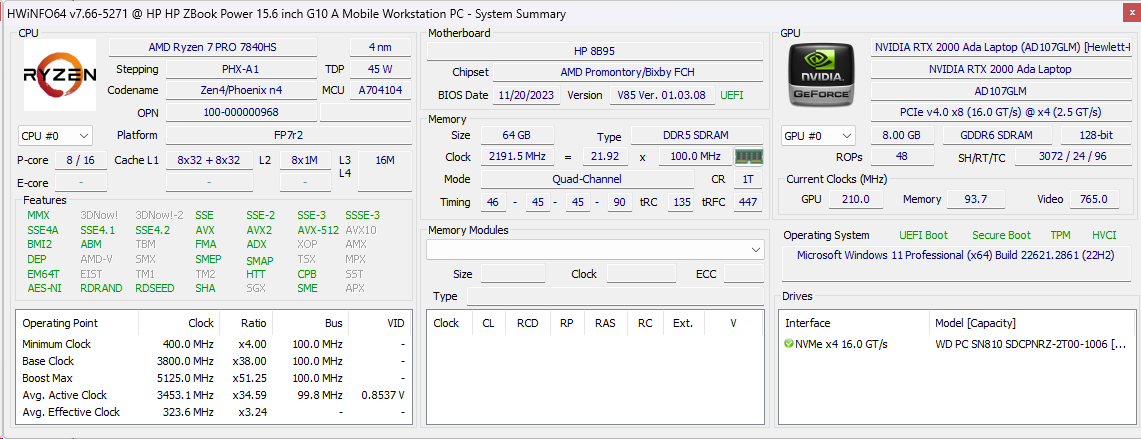
İnceleme birimimiz, Ryzen 7 Pro 7940HS CPU, Nvidia RTX 2000 Ada GPU, 1440p IPS ekran ve 64 GB DDR5-5600 RAM ile yaklaşık 2600 USD karşılığında en üst düzey AMD yapılandırmasıdır. Ryzen 5 7640HS, 1080p ekran ve yalnızca entegre grafiklerle başlayan daha düşük SKU'lar da 1600 $ gibi düşük bir fiyata mevcuttur. Intel CPU'lu konfigürasyonların ZBook Power 15 G10 olarak adlandırıldığını, AMD CPU'lu olanların ise ZBook Power 15 G10 A olarak satıldığını unutmayın.
ZBook Power 15 G10'a alternatifler arasında Dell Precision 5560, Lenovo ThinkPad P15v G3 veya Asus ExpertBook B6 Flip gibi diğer ultra ince iş istasyonları bulunmaktadır.
Daha fazla HP incelemesi:
Karşılaştırmalı olarak olası rakipler
Derecelendirme | Tarih | Modeli | Ağırlık | Yükseklik | Boyut | Çözünürlük | Fiyat |
|---|---|---|---|---|---|---|---|
| 88.9 % v7 (old) | 12/2023 | HP ZBook Power 15 G10 R7 PRO 7840HS, RTX 2000 Ada Generation Laptop | 2 kg | 22.9 mm | 15.60" | 2560x1440 | |
| 87.4 % v7 (old) | 05/2023 | HP ZBook Power 15 G9 6B8C4EA i7-12700H, RTX A2000 Laptop GPU | 2 kg | 22.8 mm | 15.60" | 3840x2160 | |
| 87.8 % v7 (old) | 07/2023 | Lenovo ThinkPad P15v G3 21EM001AGE R7 PRO 6850H, RTX A2000 Laptop GPU | 2.2 kg | 22.7 mm | 15.60" | 3840x2160 | |
| 88.3 % v7 (old) | 12/2021 | Dell Precision 5000 5560 i7-11850H, RTX A2000 Laptop GPU | 2 kg | 18 mm | 15.60" | 3840x2400 | |
| 91.7 % v7 (old) | 10/2023 | Lenovo ThinkPad P1 G6-21FV000DGE i9-13900H, RTX 2000 Ada Generation Laptop | 1.9 kg | 17.5 mm | 16.00" | 2560x1600 | |
| 89.6 % v7 (old) | 09/2023 | Asus ExpertBook B6 Flip B6602FC2 i9-12950HX, RTX A2000 Laptop GPU | 2.8 kg | 27.2 mm | 16.00" | 2560x1600 |
Dava
İletişim
| Networking | |
| iperf3 transmit AX12 | |
| Dell Precision 5000 5560 | |
| iperf3 receive AX12 | |
| Dell Precision 5000 5560 | |
| iperf3 transmit AXE11000 | |
| HP ZBook Power 15 G10 | |
| Lenovo ThinkPad P1 G6-21FV000DGE | |
| Asus ExpertBook B6 Flip B6602FC2 | |
| Lenovo ThinkPad P15v G3 21EM001AGE | |
| iperf3 receive AXE11000 | |
| Lenovo ThinkPad P1 G6-21FV000DGE | |
| Lenovo ThinkPad P15v G3 21EM001AGE | |
| Asus ExpertBook B6 Flip B6602FC2 | |
| HP ZBook Power 15 G10 | |
| iperf3 transmit AXE11000 6GHz | |
| HP ZBook Power 15 G9 6B8C4EA | |
| HP ZBook Power 15 G10 | |
| Asus ExpertBook B6 Flip B6602FC2 | |
| Lenovo ThinkPad P15v G3 21EM001AGE | |
| iperf3 receive AXE11000 6GHz | |
| HP ZBook Power 15 G9 6B8C4EA | |
| Asus ExpertBook B6 Flip B6602FC2 | |
| Lenovo ThinkPad P15v G3 21EM001AGE | |
| HP ZBook Power 15 G10 | |
Web kamerası
ZBook Power G9'umuz 1 MP web kamerası ile yapılandırılmışken, Power G10'umuz çok daha keskin bir görüntü için 5 MP web kamerası ile birlikte geliyor. IR ve fiziksel deklanşör özellikleri değişmeden kalır.


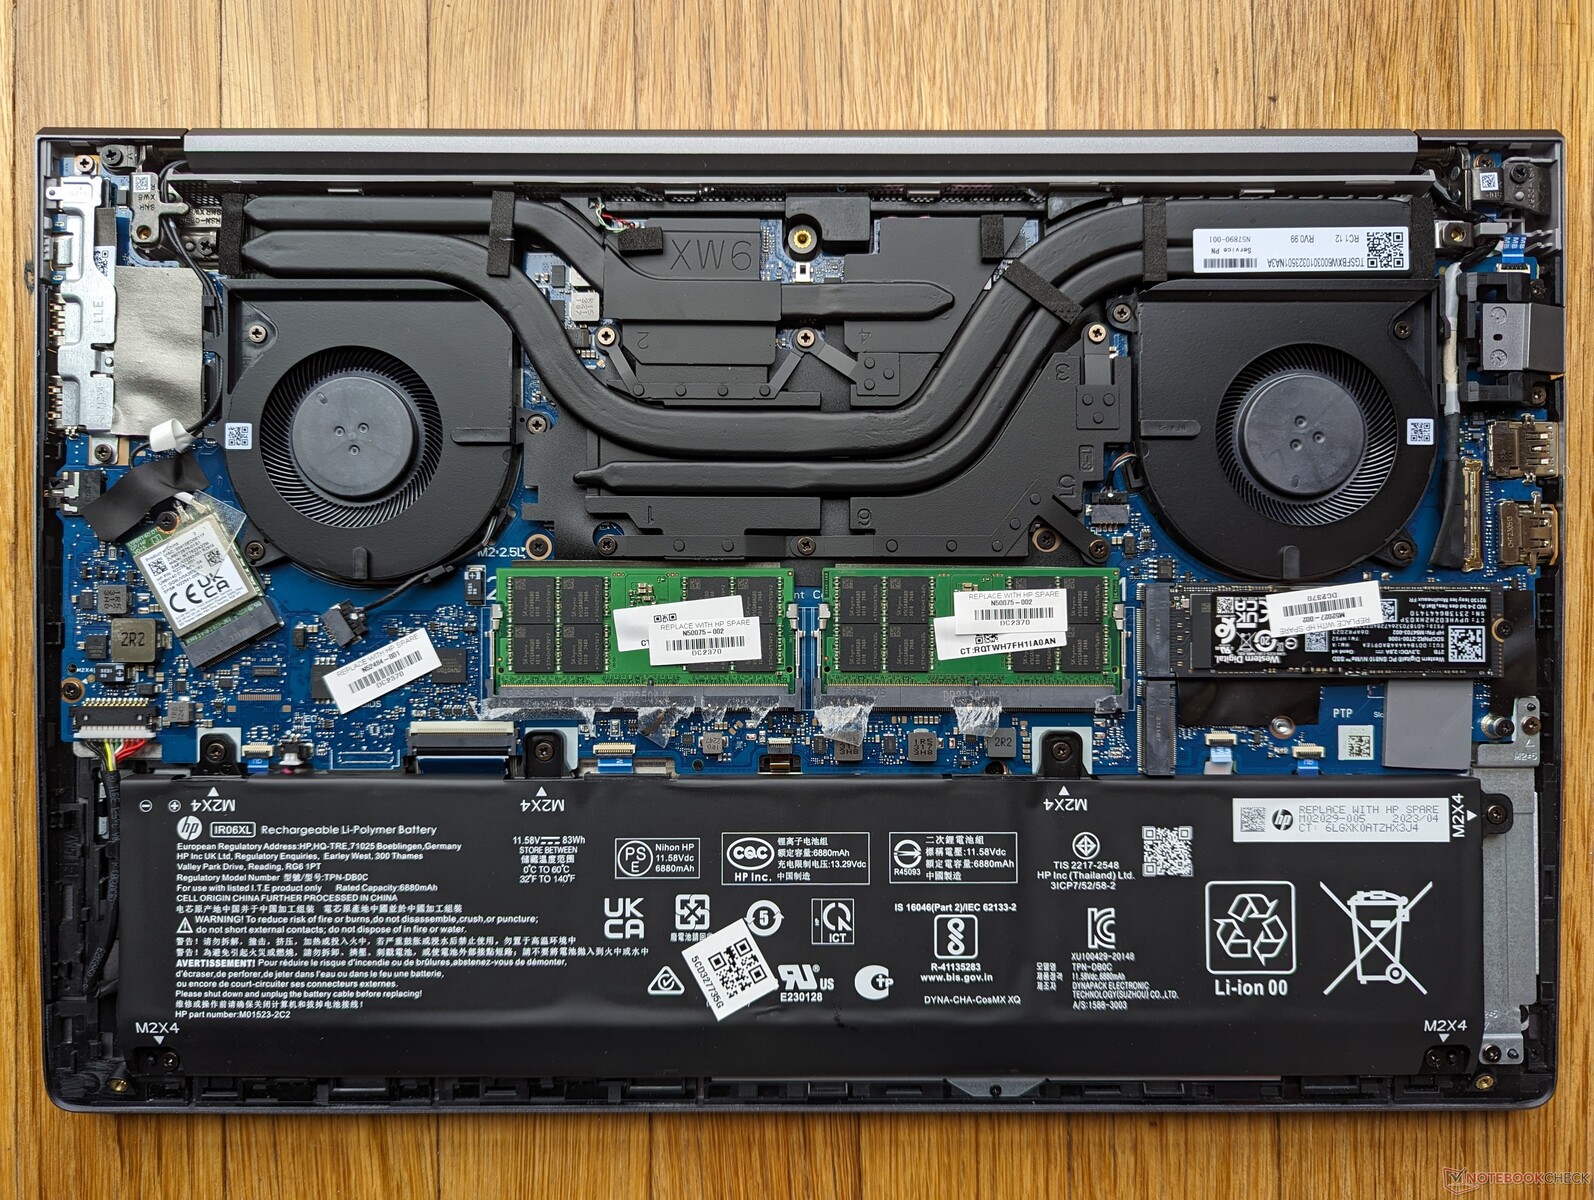
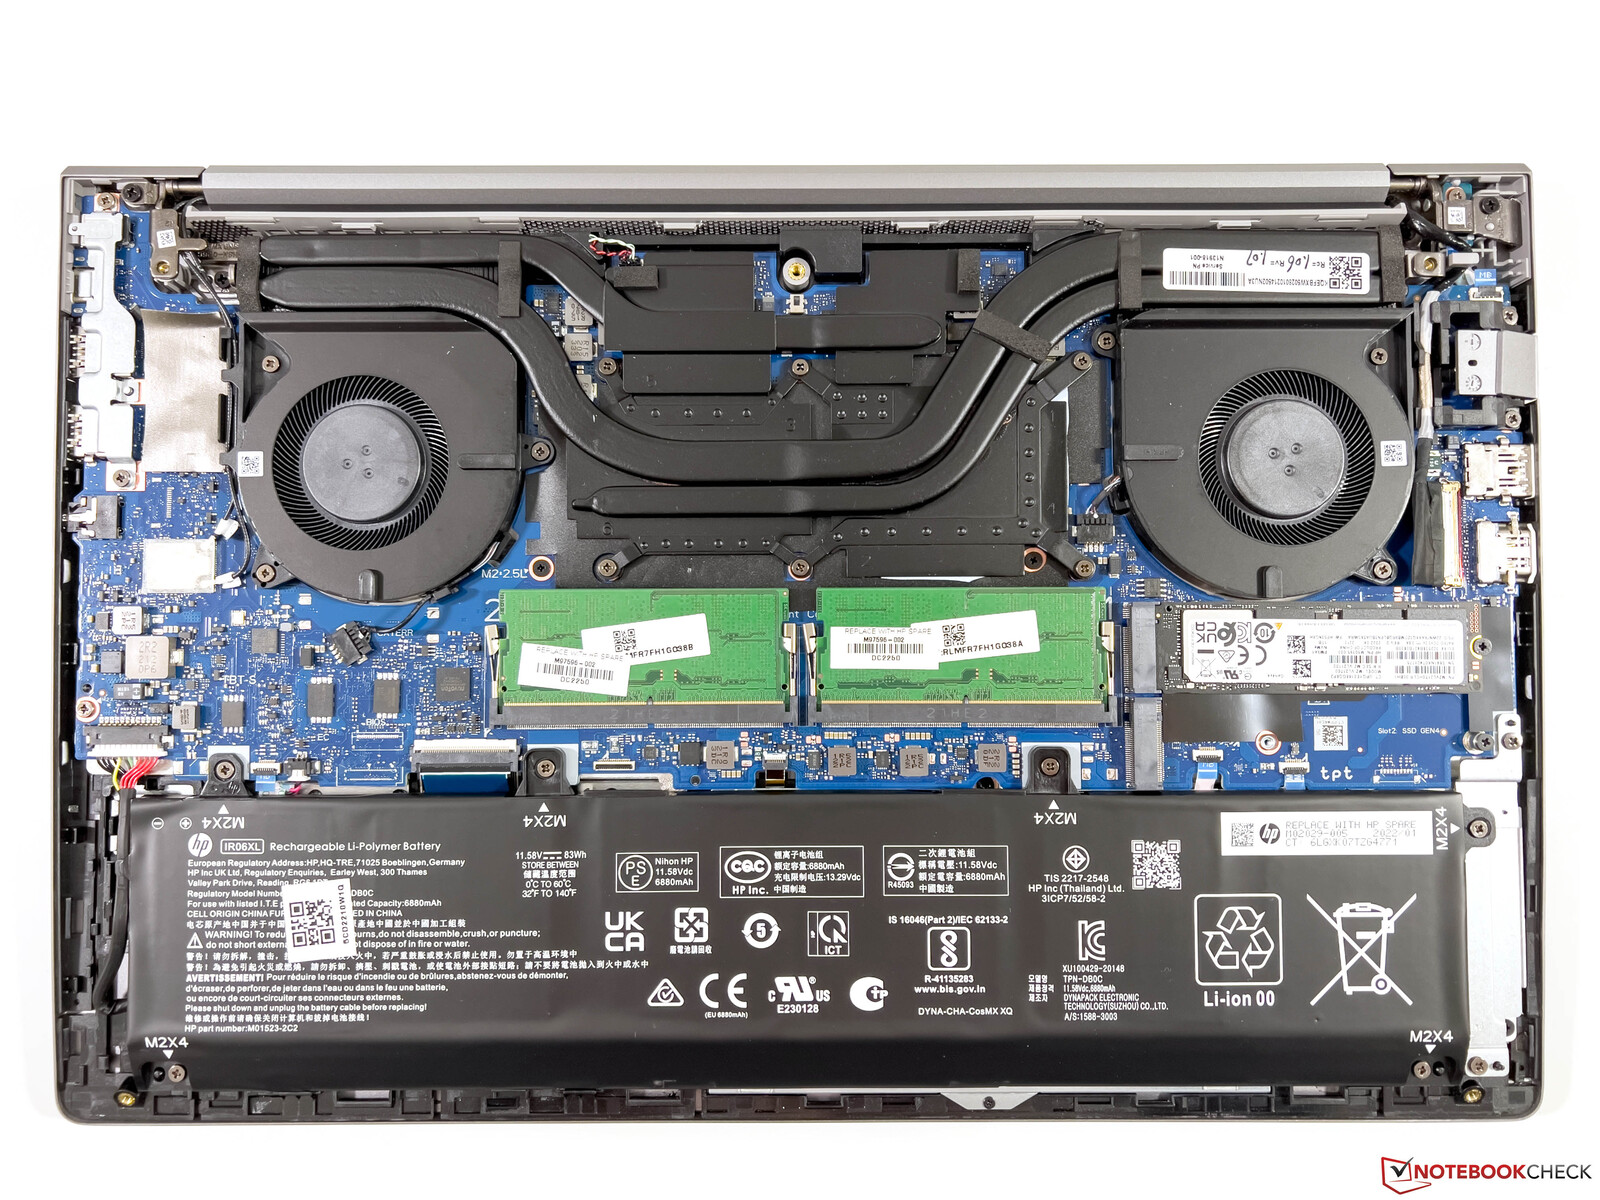
Bakım
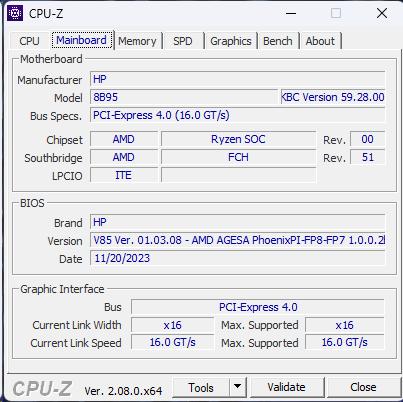
HP küçük ama dikkate değer bir değişiklik yaptı: M.2 WLAN modülü artık değiştirilebilirken, geçen yılki ZBook Power 15 G9'da lehimlenmişti. İki DDR5 SODIMM yuvası ve iki M.2 PCIe4 x4 yuvası da dahil olmak üzere diğer çoğu şeye dokunulmamış.
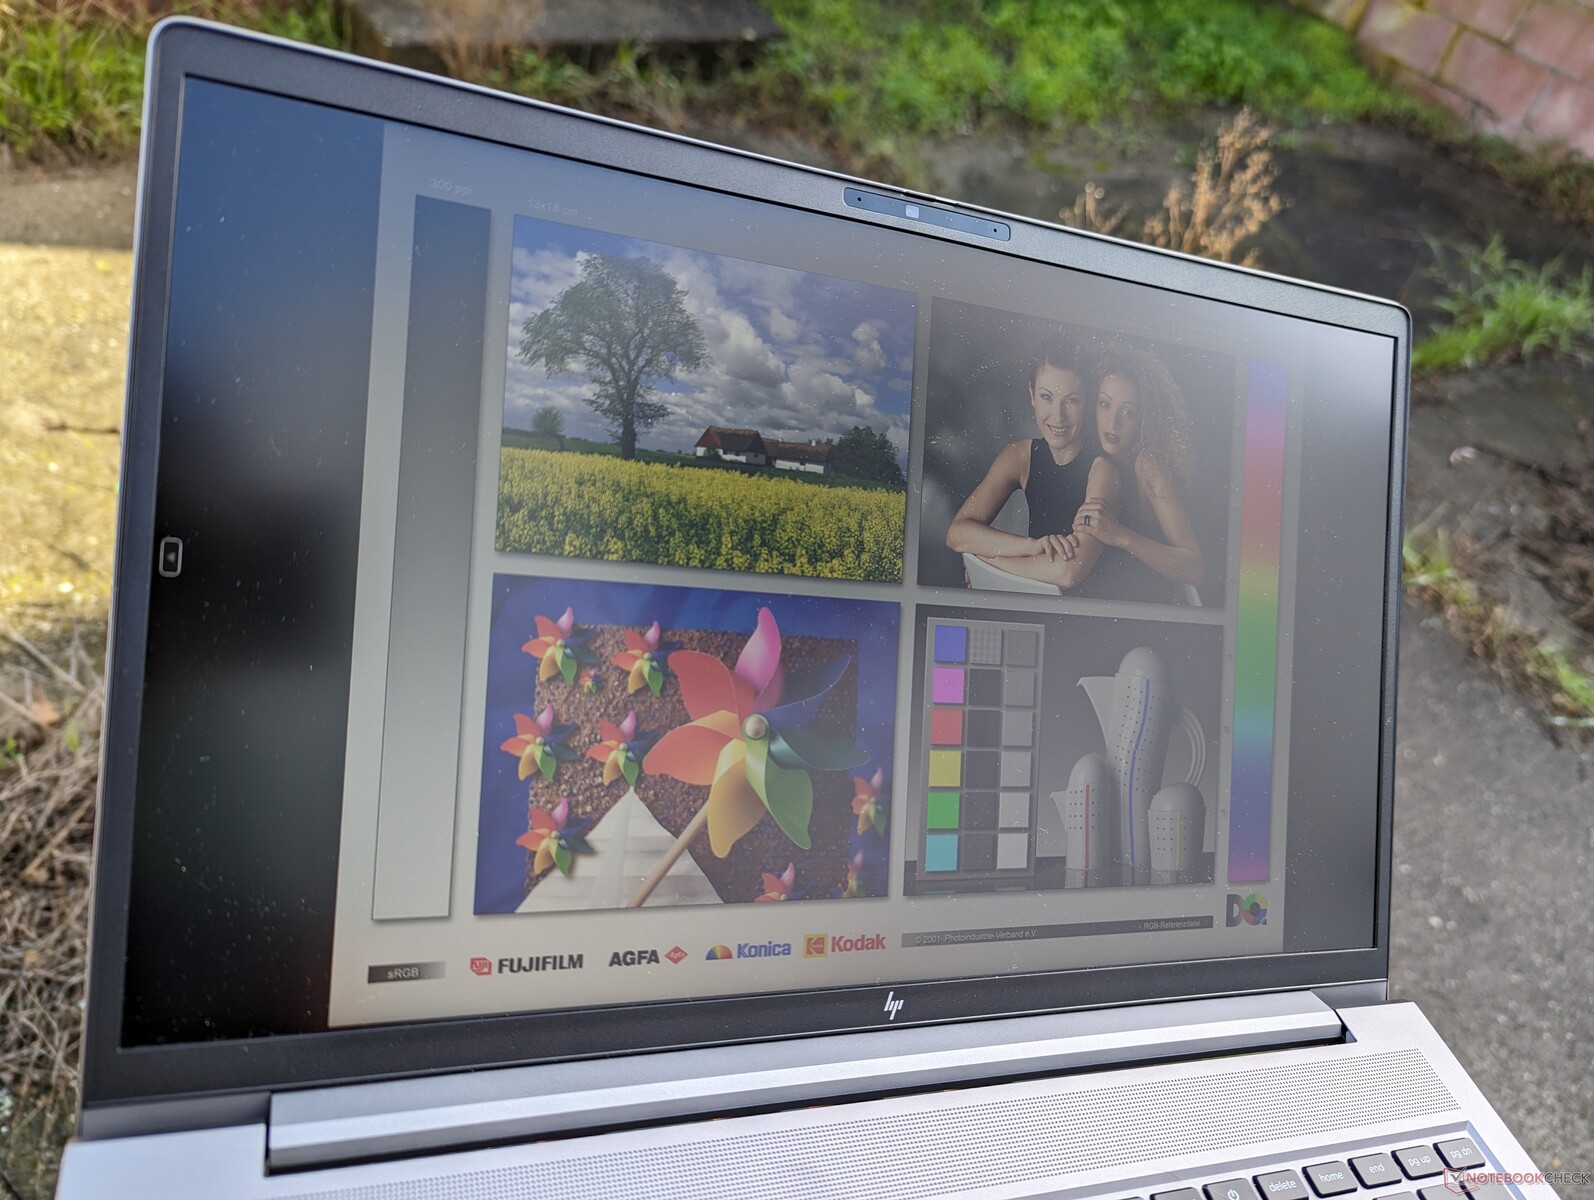
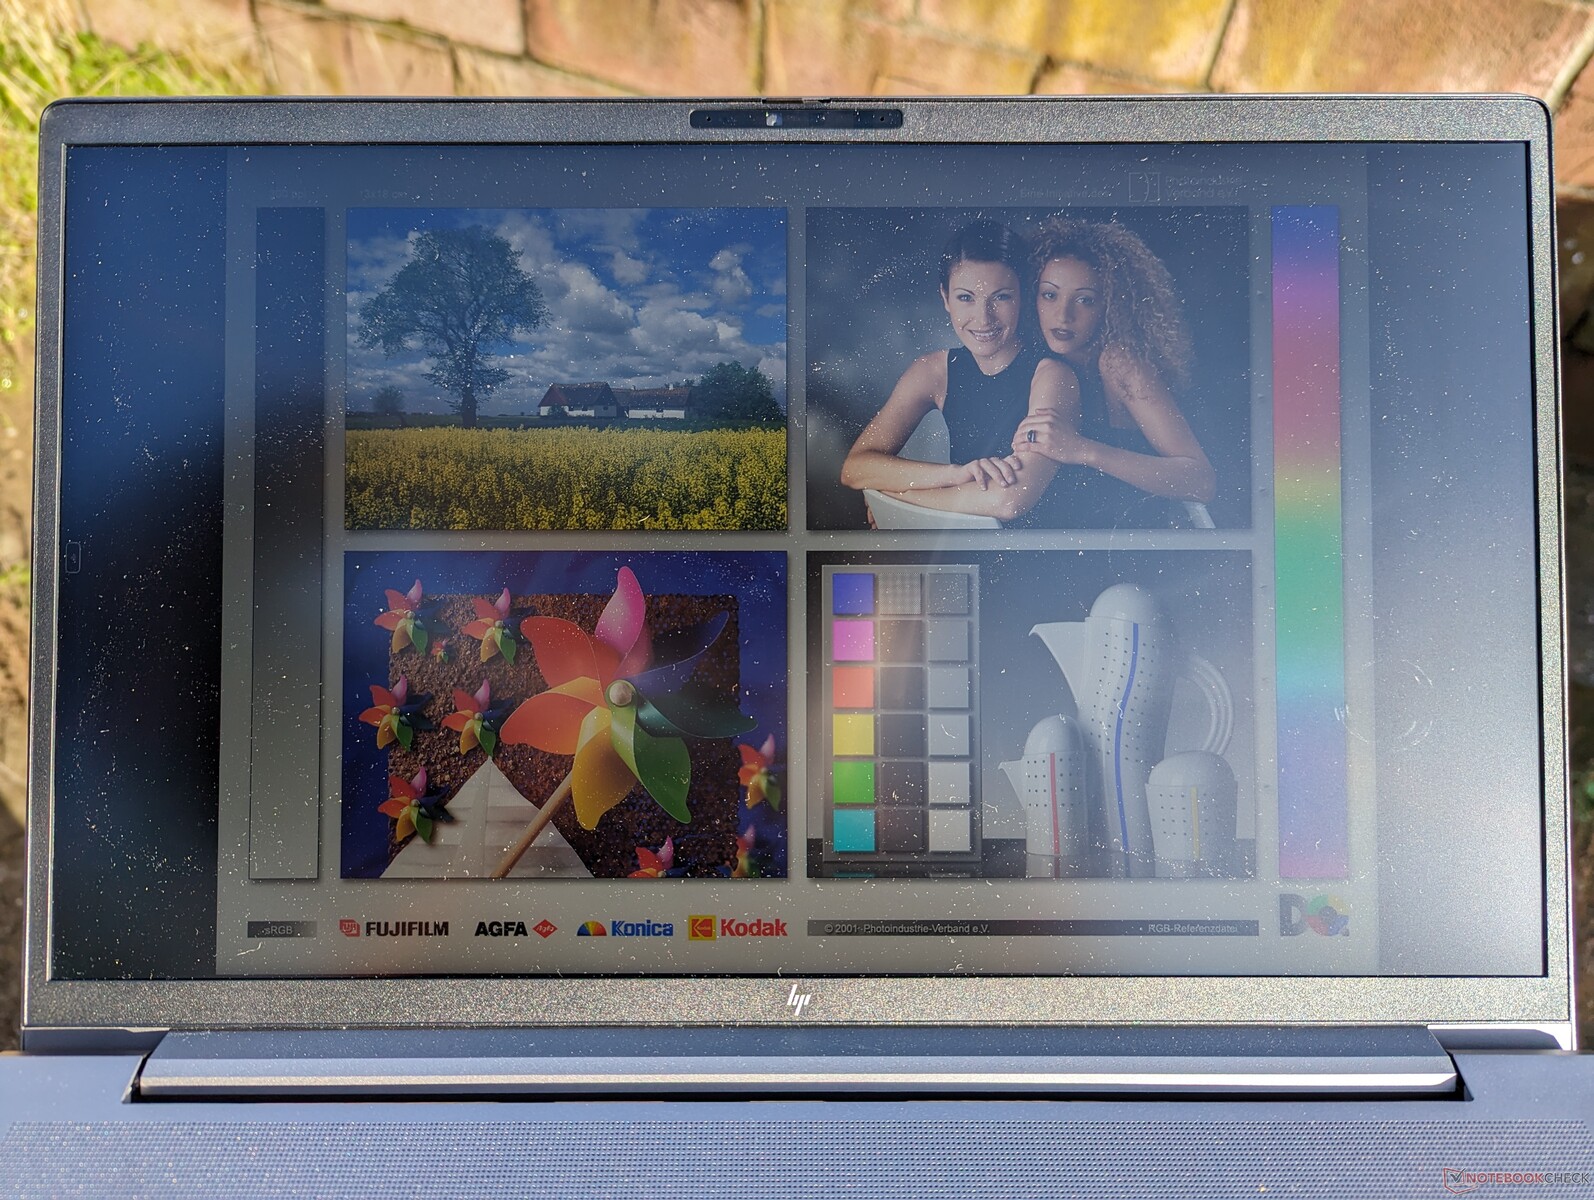
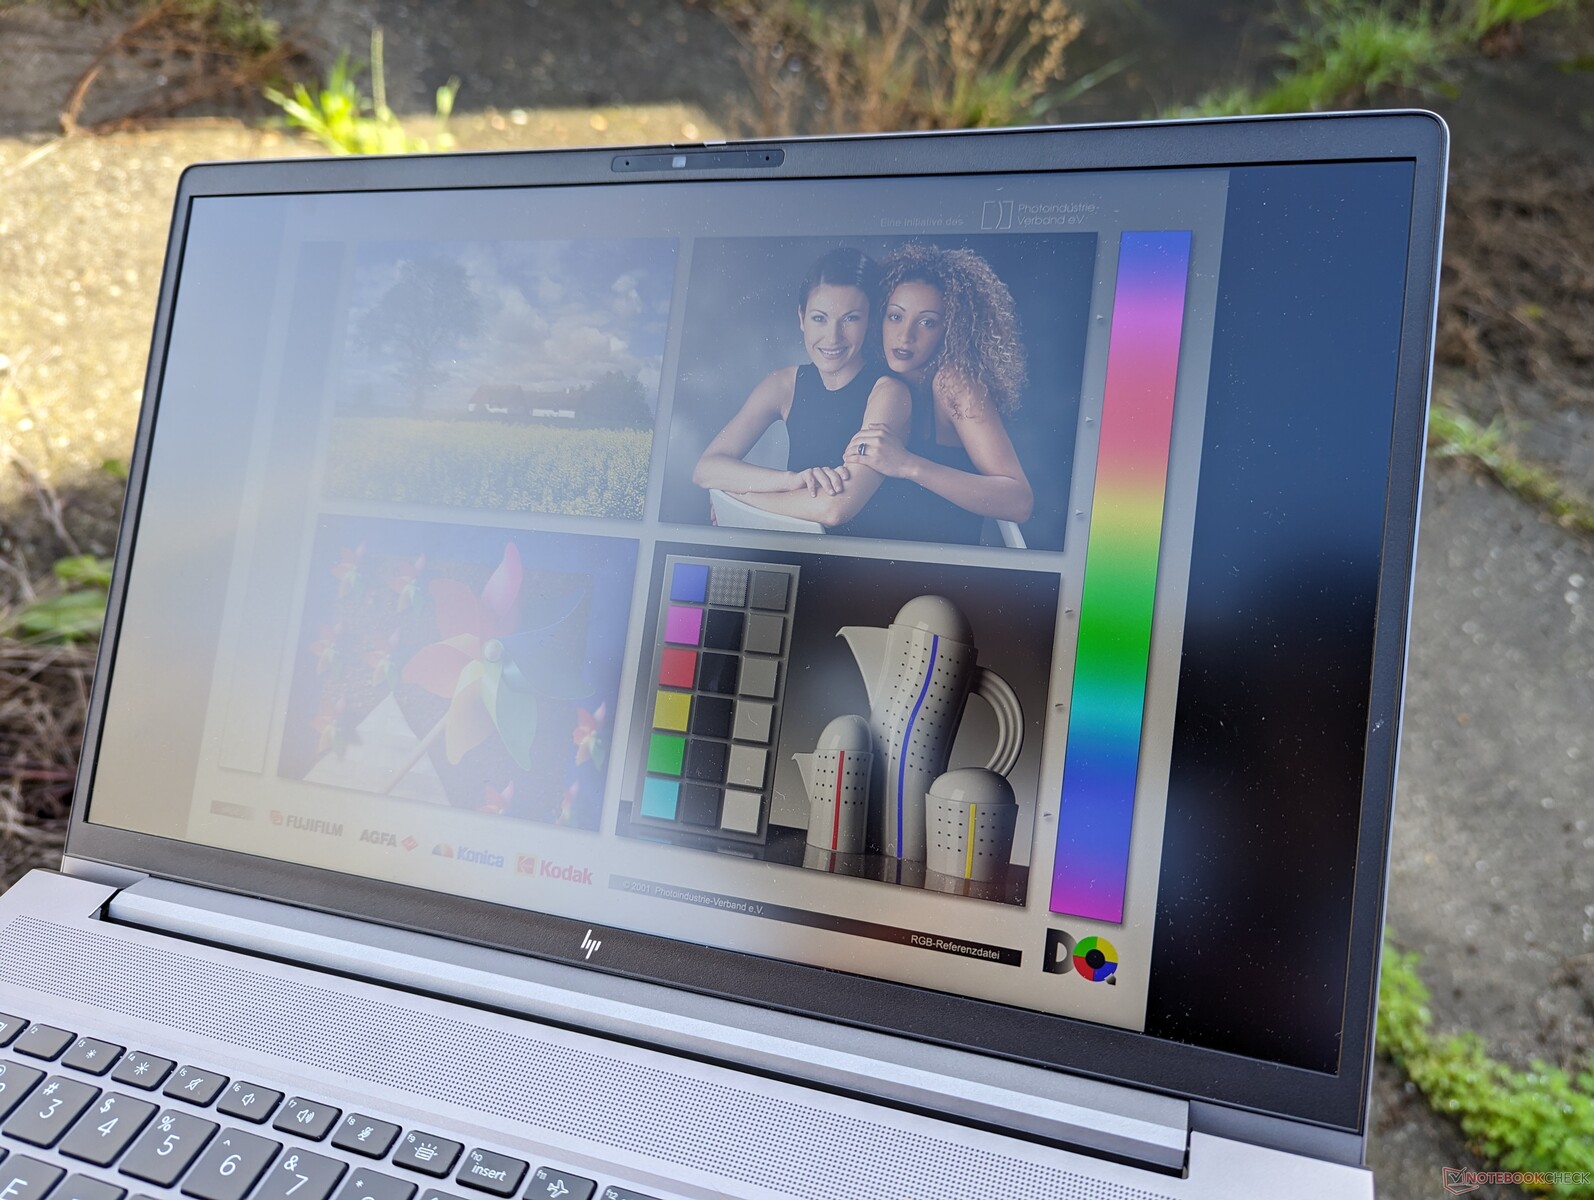
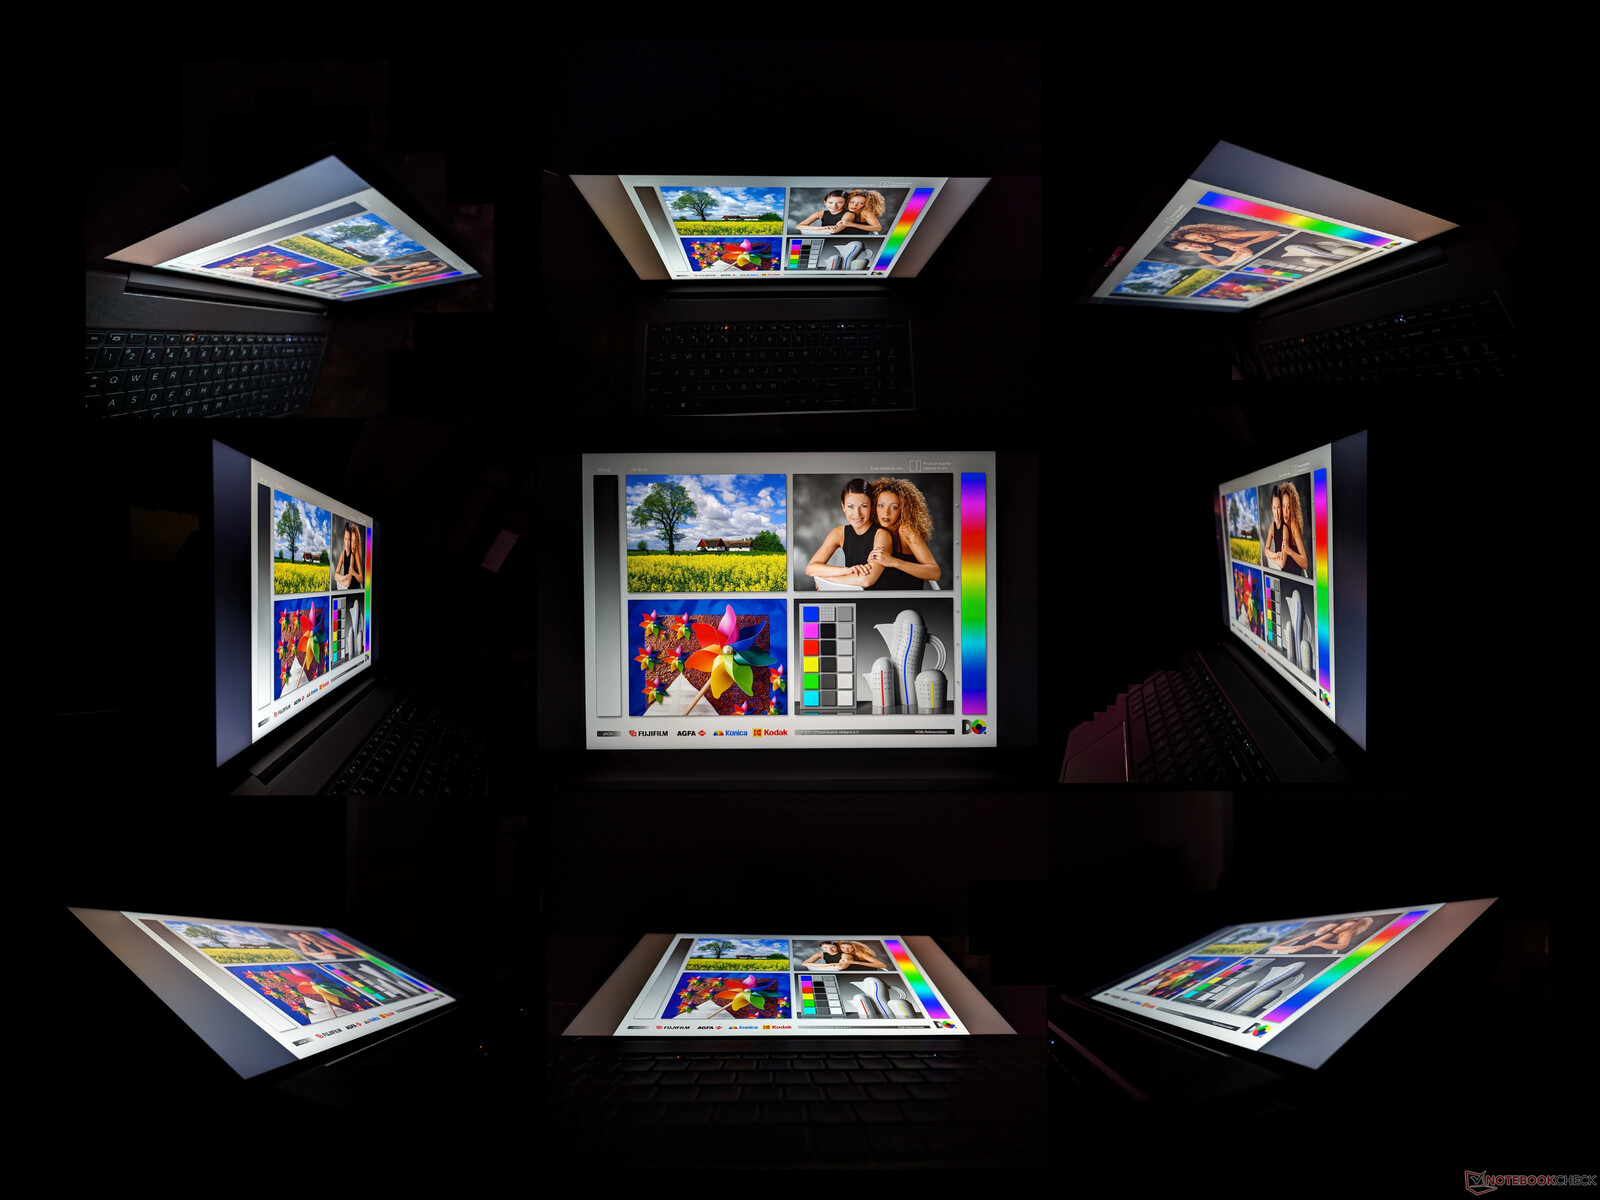
Ekran
Model aşağıdaki gibi dört mat ekran seçeneği sunuyor:
- 1080p, 250 nit, %60 sRGB, dokunmatik ekran
- 1080p, 250 nit, %60 sRGB, dokunmatik olmayan
- 1080p, 400 nit, %100 sRGB, dokunmatik olmayan
- 1440p, 300 nit, %100 sRGB, dokunmatik olmayan, 120 Hz
Dokunmatik ekran bir zorunluluk değilse, her biri belirgin şekilde daha sığ renkler için NTSC'nin yalnızca %45'ini kapsadığından iki 250 nit seçeneğinden kaçınmanızı öneririz.
Bilinmeyen nedenlerden dolayı HP, daha önce ZBook Power G9'da mevcut olmasına rağmen hiçbir ZBook Power G10 yapılandırması için 4K seçeneği sunmuyor. Üreticiler şu anda 16:9 15.6 inç panellerden 16:10 16 inç panellere geçtiği için bunun tedarik sorunlarından kaynaklanabileceğinden şüpheleniyoruz.
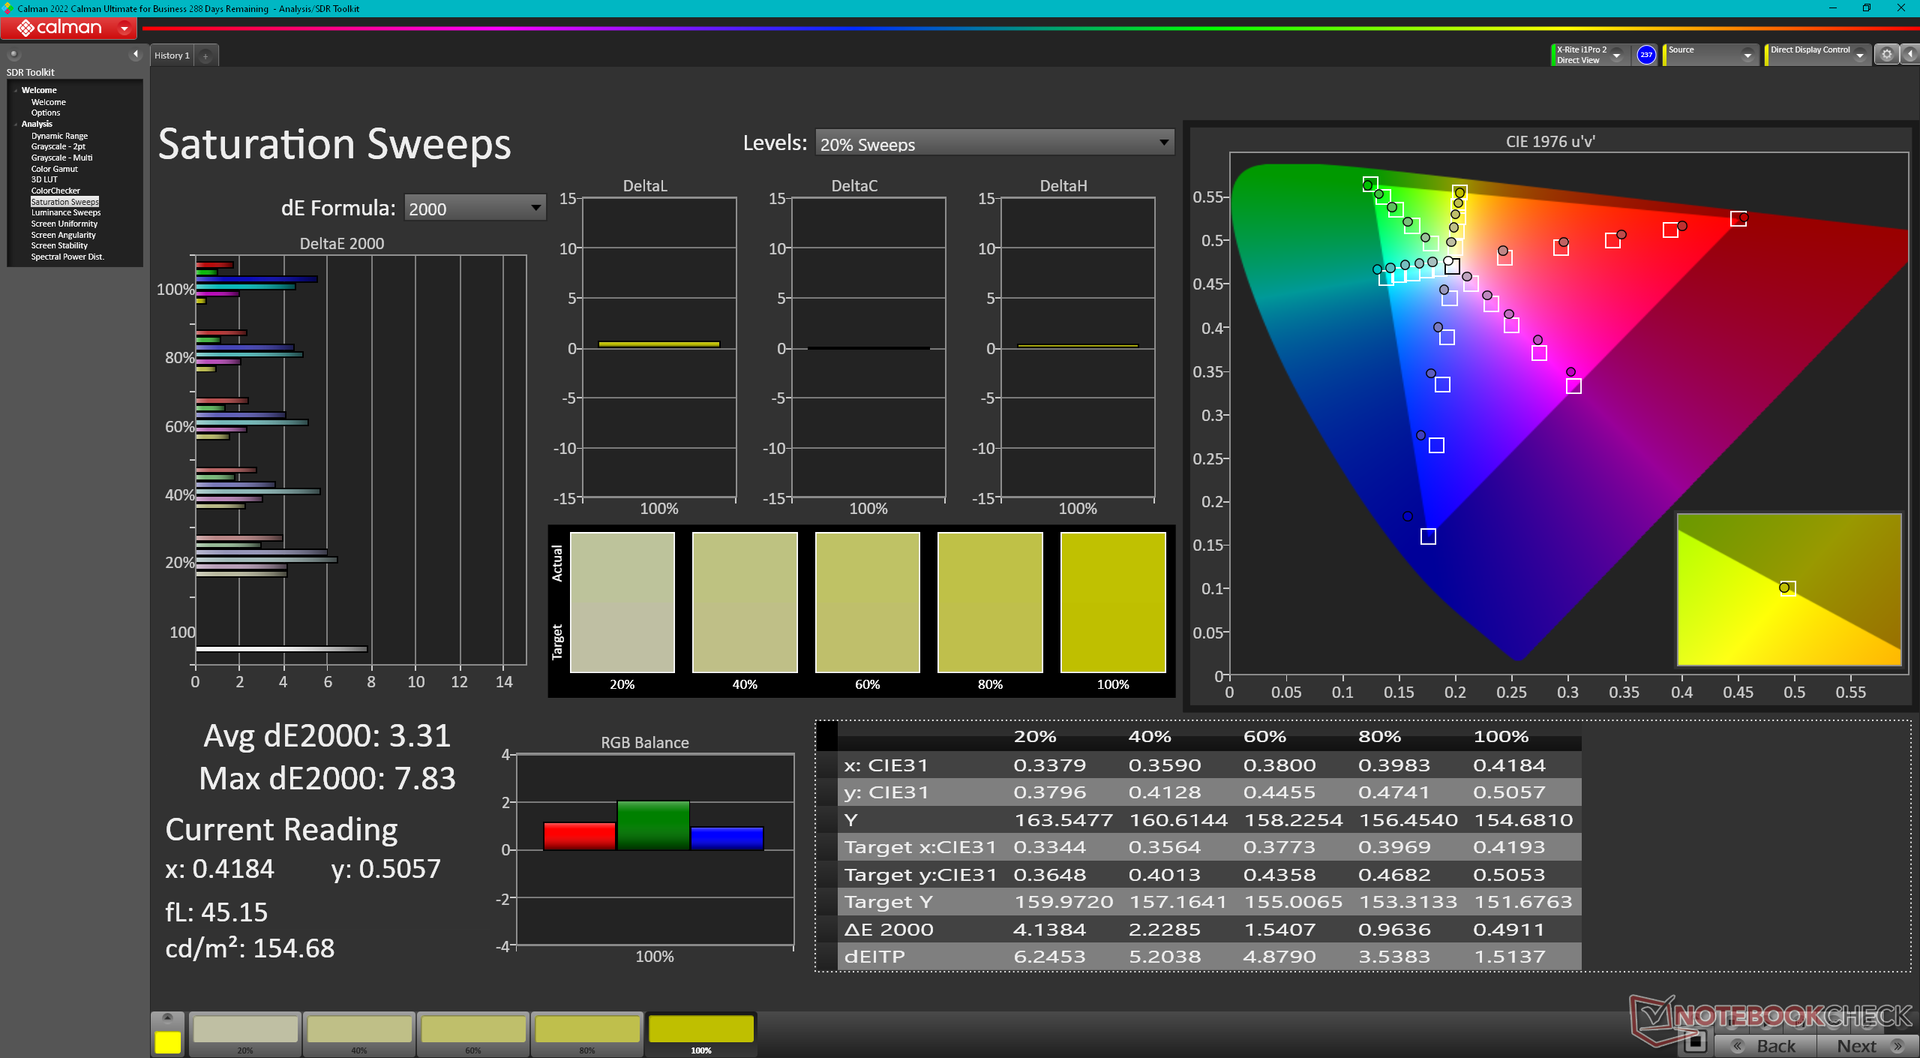
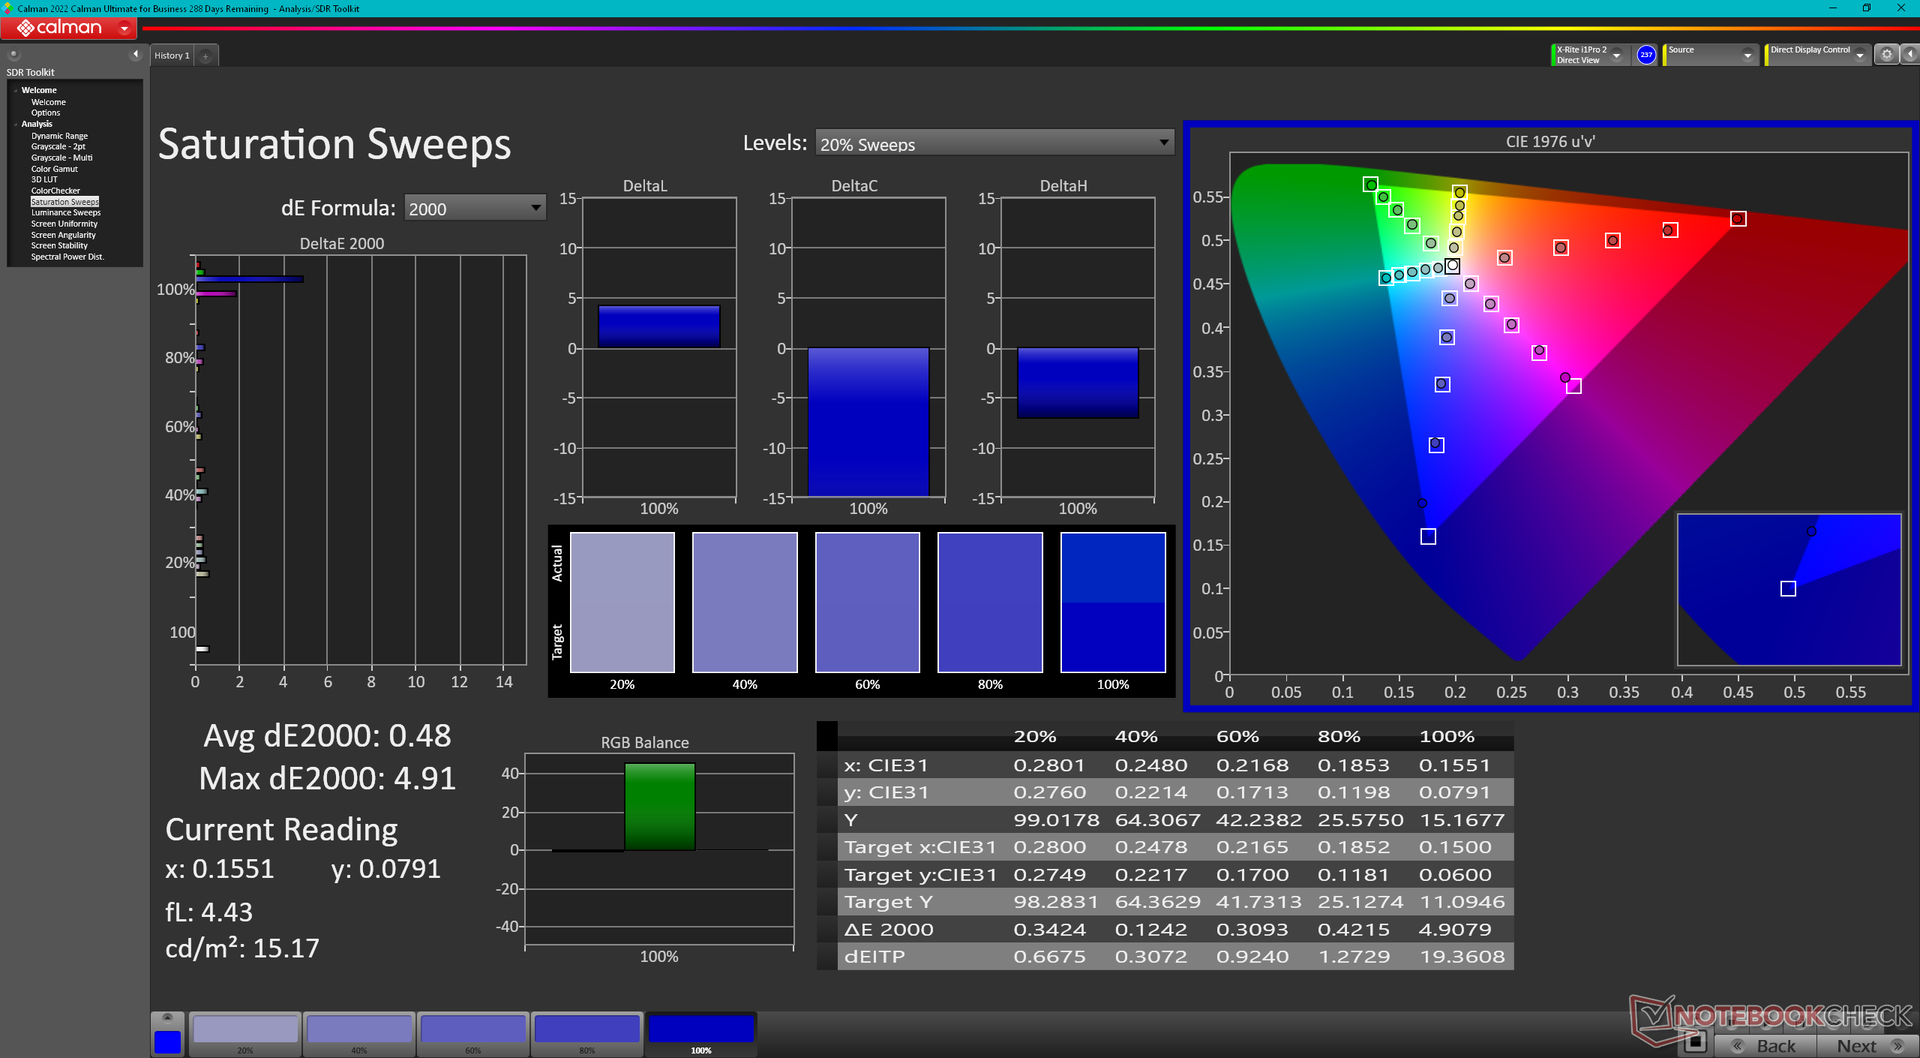
Yine de 1440p panelimiz hızlı yenileme hızı, hızlı tepki süreleri ve içerik oluşturmaya ve hatta oyun oynamaya uygun doğru sRGB renkleriyle mükemmel. OLED veya 4K olmayabilir ama yine de piyasadaki en iyi 15,6 inç IPS ekranlardan biri.

| |||||||||||||||||||||||||
Aydınlatma: 83 %
Batarya modunda parlaklık: 313.8 cd/m²
Kontrast: 1082:1 (Siyah: 0.29 cd/m²)
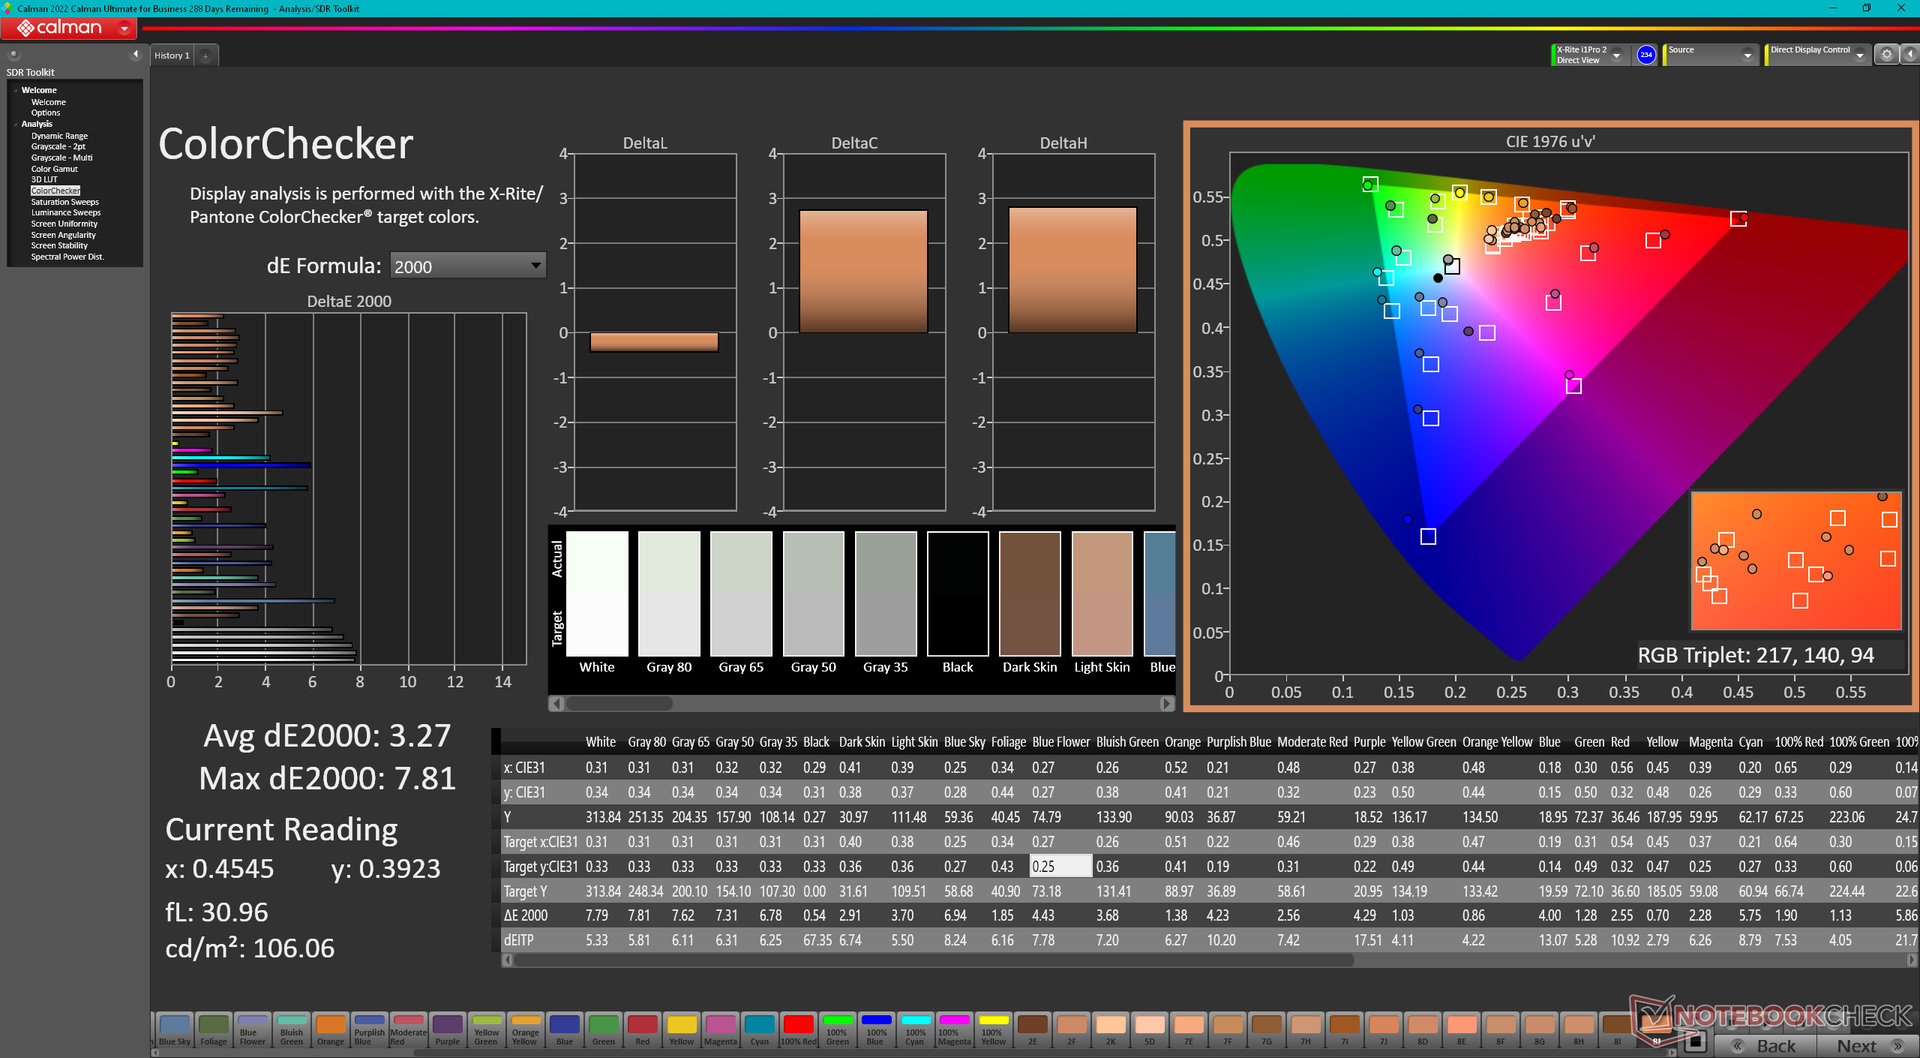
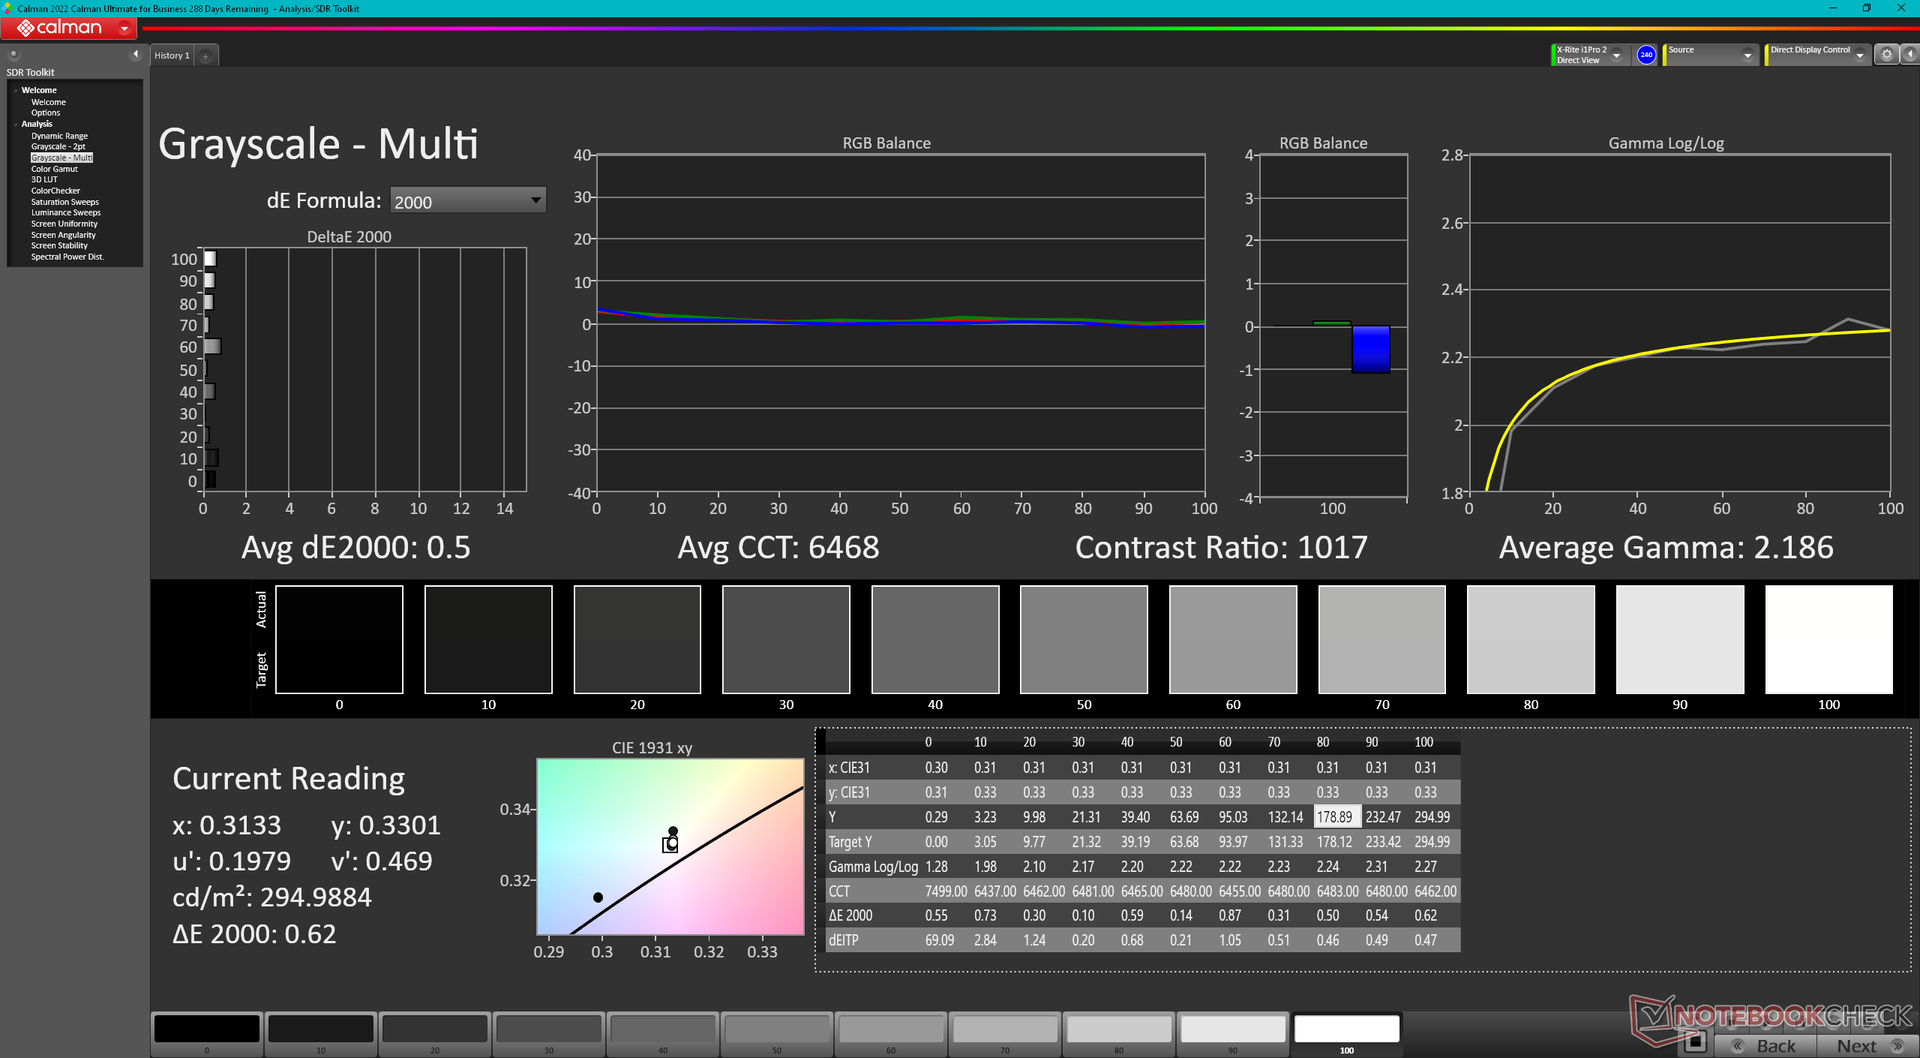
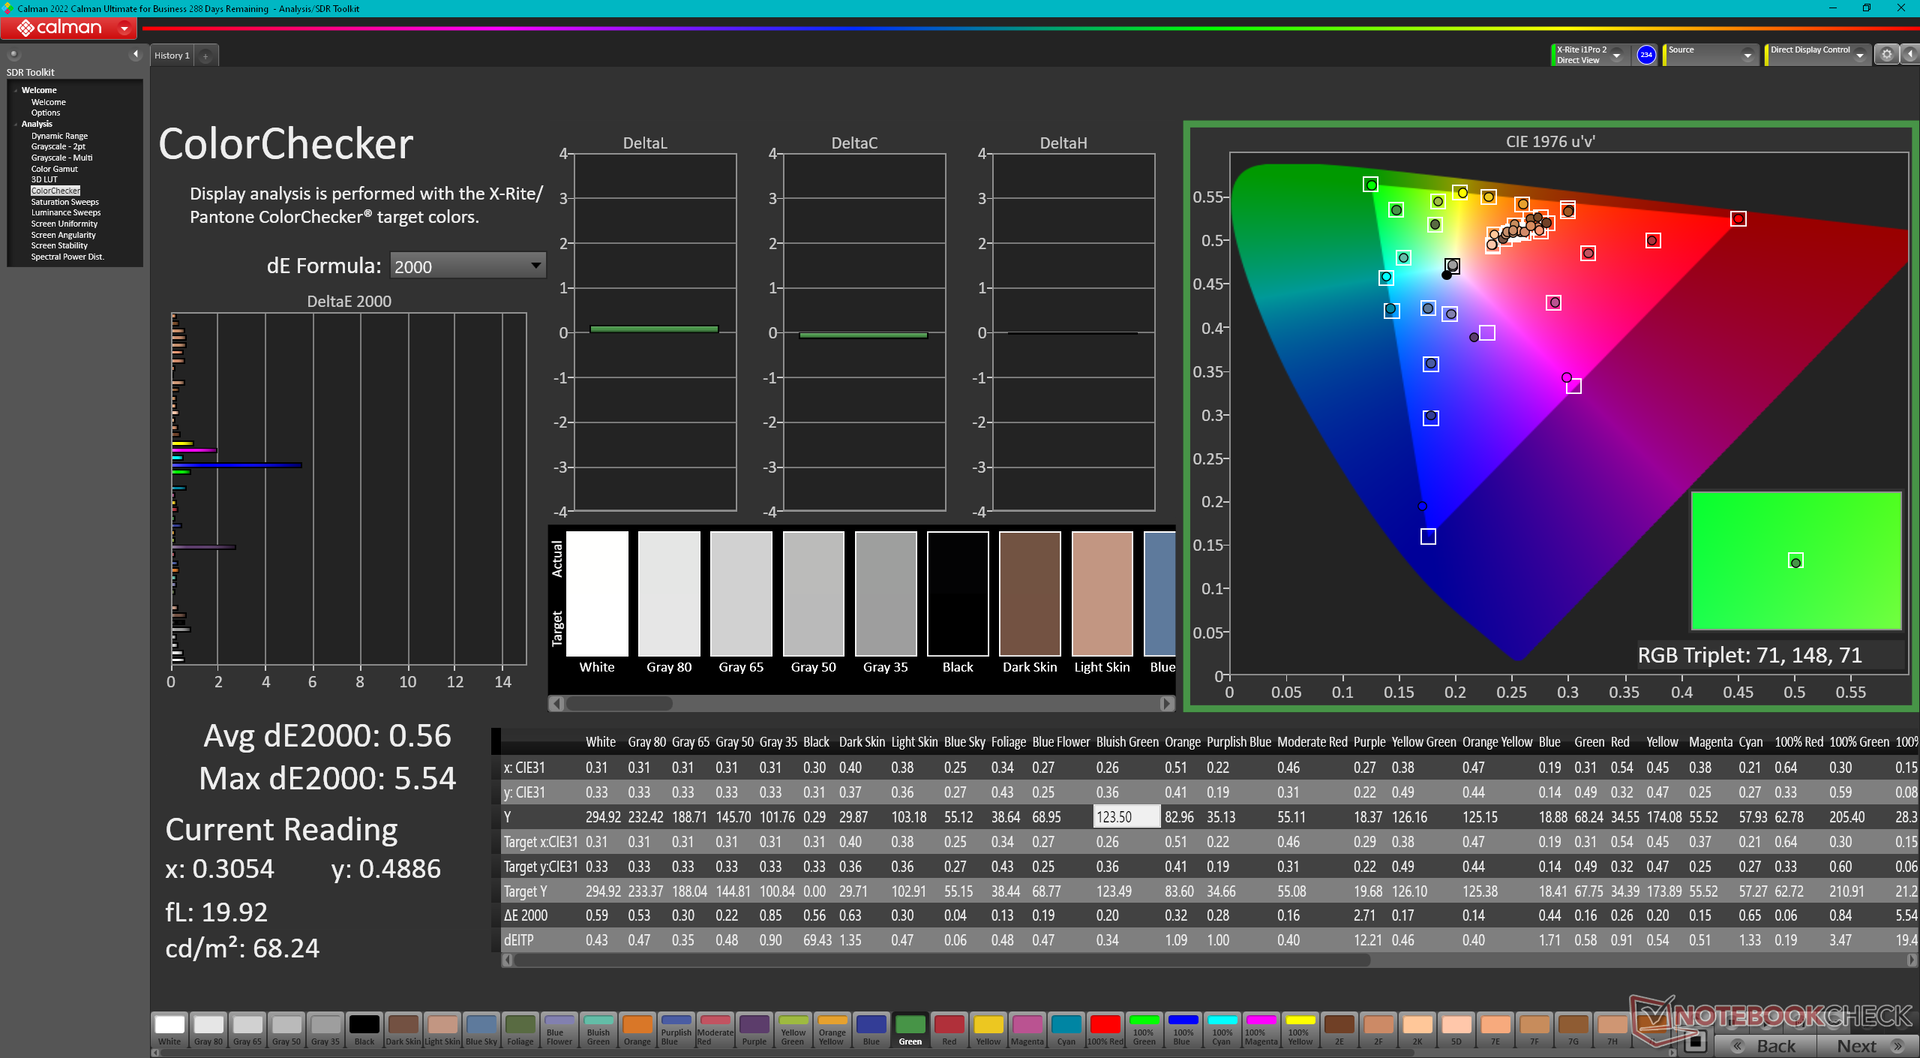
ΔE ColorChecker Calman: 3.27 | ∀{0.5-29.43 Ø4.73}
calibrated: 0.56
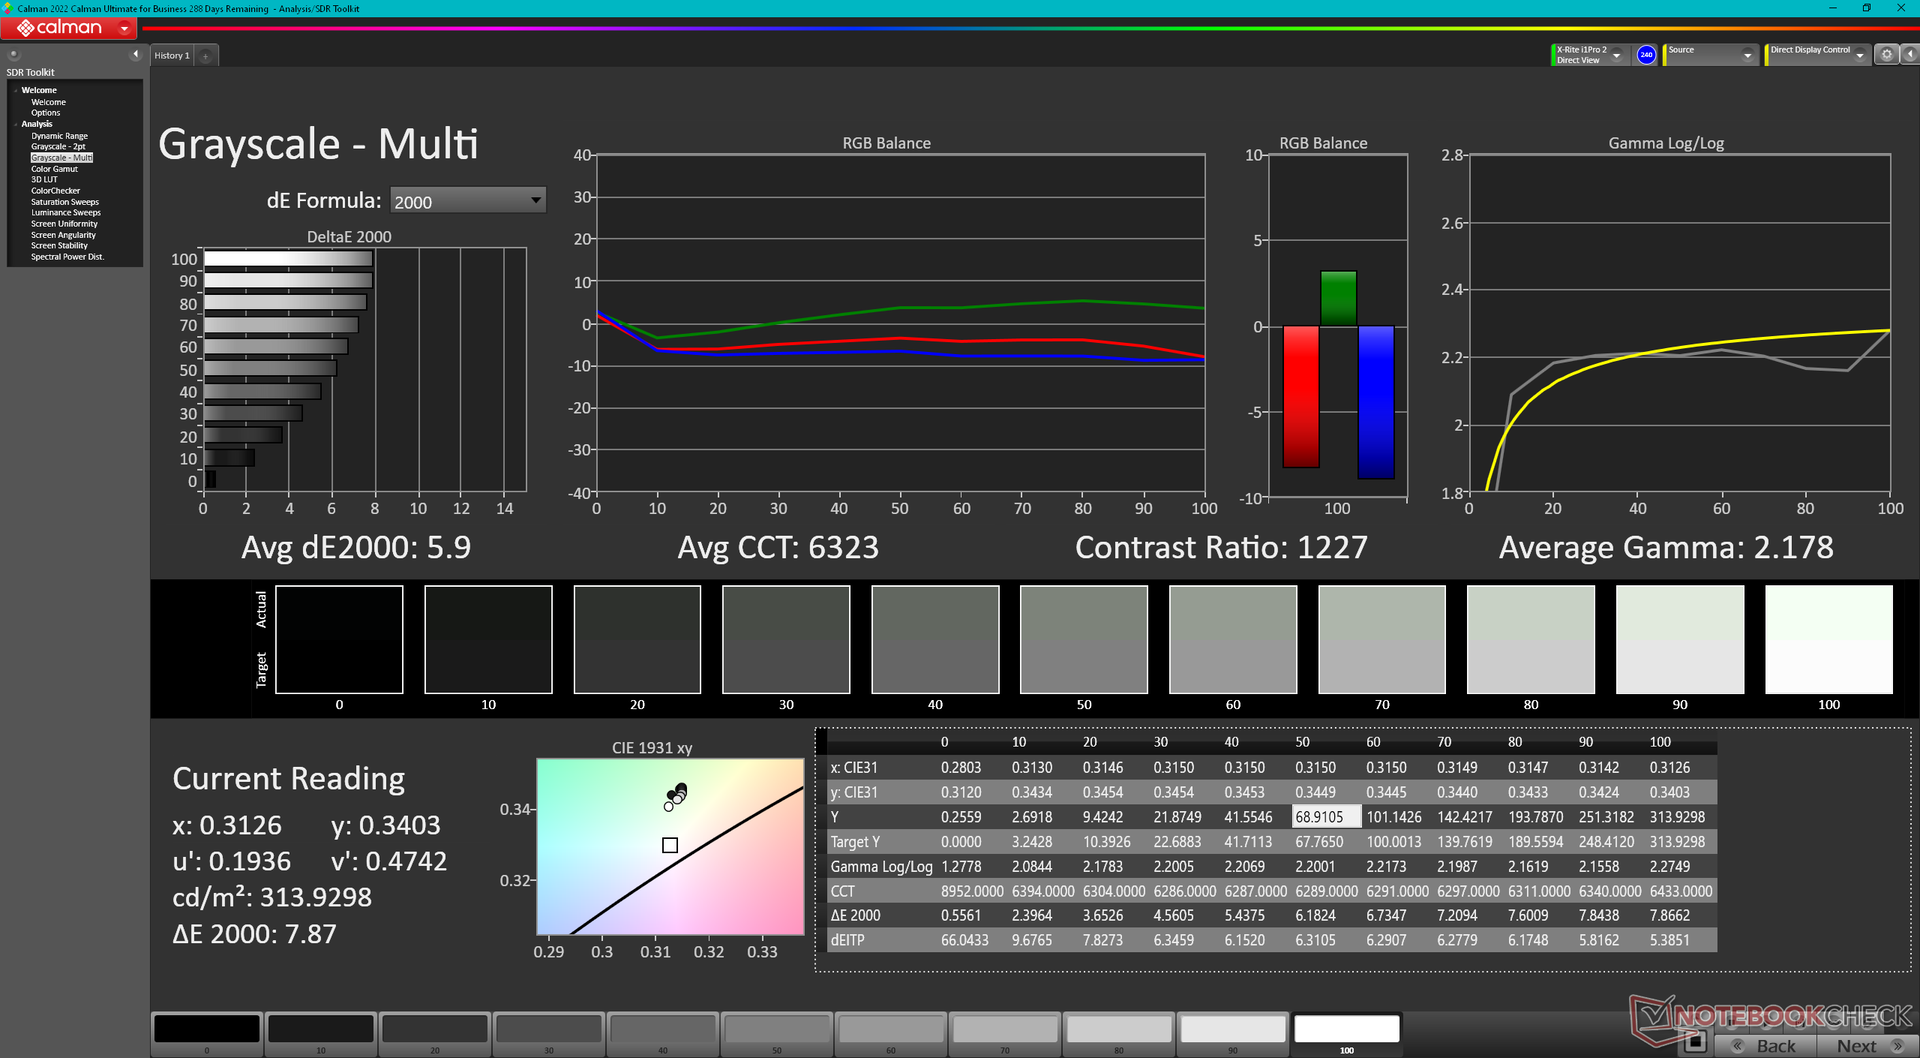
ΔE Greyscale Calman: 5.9 | ∀{0.09-98 Ø4.97}
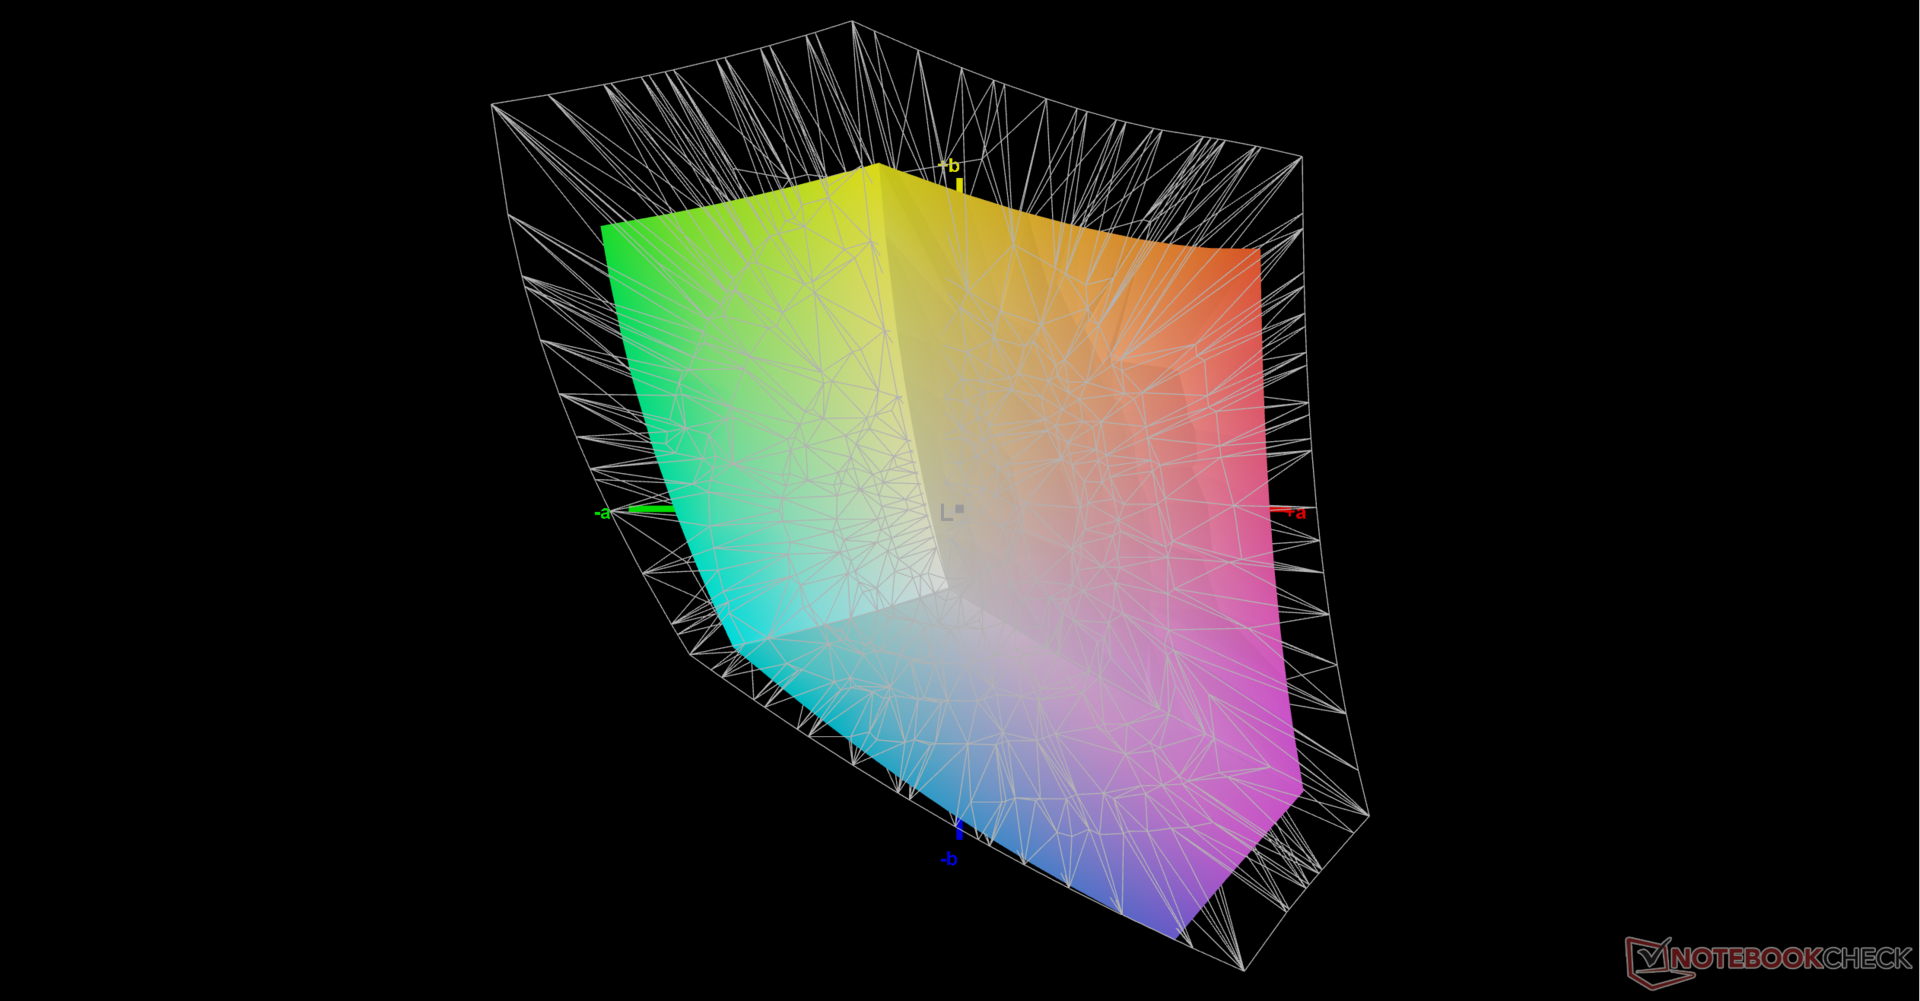
70.5% AdobeRGB 1998 (Argyll 3D)
95.6% sRGB (Argyll 3D)
68.2% Display P3 (Argyll 3D)
Gamma: 2.18
CCT: 6323 K
| HP ZBook Power 15 G10 BOE0B6A, IPS, 2560x1440, 15.6" | HP ZBook Power 15 G9 6B8C4EA LGD073F, IPS, 3840x2160, 15.6" | Lenovo ThinkPad P15v G3 21EM001AGE NE156QUM-N6C, IPS LED, 3840x2160, 15.6" | Dell Precision 5000 5560 Sharp LQ156R1, IPS, 3840x2400, 15.6" | Lenovo ThinkPad P1 G6-21FV000DGE NE160QDM-NY1, IPS, 2560x1600, 16" | Asus ExpertBook B6 Flip B6602FC2 AU Optronics Model: AUOE495, IPS, 2560x1600, 16" | |
|---|---|---|---|---|---|---|
| Display | 1% | 26% | 29% | 1% | 23% | |
| Display P3 Coverage (%) | 68.2 | 69.1 1% | 89.9 32% | 94.9 39% | 68.1 0% | 97.9 44% |
| sRGB Coverage (%) | 95.6 | 97.7 2% | 100 5% | 100 5% | 97.5 2% | 99.89 4% |
| AdobeRGB 1998 Coverage (%) | 70.5 | 69.6 -1% | 99.9 42% | 100 42% | 70.2 0% | 85.52 21% |
| Response Times | -214% | -211% | -228% | 2% | -120% | |
| Response Time Grey 50% / Grey 80% * (ms) | 13 ? | 45.8 ? -252% | 46.7 ? -259% | 47.2 ? -263% | 13.7 ? -5% | 36 ? -177% |
| Response Time Black / White * (ms) | 10.4 ? | 28.6 ? -175% | 27.3 ? -163% | 30.4 ? -192% | 9.6 ? 8% | 17 ? -63% |
| PWM Frequency (Hz) | ||||||
| Screen | 18% | 5% | 7% | 30% | -20% | |
| Brightness middle (cd/m²) | 313.8 | 392 25% | 588 87% | 501.5 60% | 521 66% | 440 40% |
| Brightness (cd/m²) | 302 | 388 28% | 536 77% | 467 55% | 484 60% | 418 38% |
| Brightness Distribution (%) | 83 | 88 6% | 83 0% | 83 0% | 89 7% | 82 -1% |
| Black Level * (cd/m²) | 0.29 | 0.15 48% | 0.38 -31% | 0.44 -52% | 0.36 -24% | 0.3 -3% |
| Contrast (:1) | 1082 | 2613 141% | 1547 43% | 1140 5% | 1447 34% | 1467 36% |
| Colorchecker dE 2000 * | 3.27 | 3.2 2% | 3.9 -19% | 4.73 -45% | 1.2 63% | 2.81 14% |
| Colorchecker dE 2000 max. * | 7.81 | 7 10% | 8.8 -13% | 8.45 -8% | 2.5 68% | 4.62 41% |
| Colorchecker dE 2000 calibrated * | 0.56 | 1.2 -114% | 1 -79% | 0.51 9% | 1 -79% | 2.99 -434% |
| Greyscale dE 2000 * | 5.9 | 4.9 17% | 7.1 -20% | 3.6 39% | 1.4 76% | 0.91 85% |
| Gamma | 2.18 101% | 2.13 103% | 2.12 104% | 2.08 106% | 2.25 98% | 2.2 100% |
| CCT | 6323 103% | 5982 109% | 7268 89% | 6447 101% | 6682 97% | 6600 98% |
| Toplam Ortalama (Program / Ayarlar) | -65% /
-19% | -60% /
-21% | -64% /
-22% | 11% /
20% | -39% /
-25% |
* ... daha küçük daha iyidir
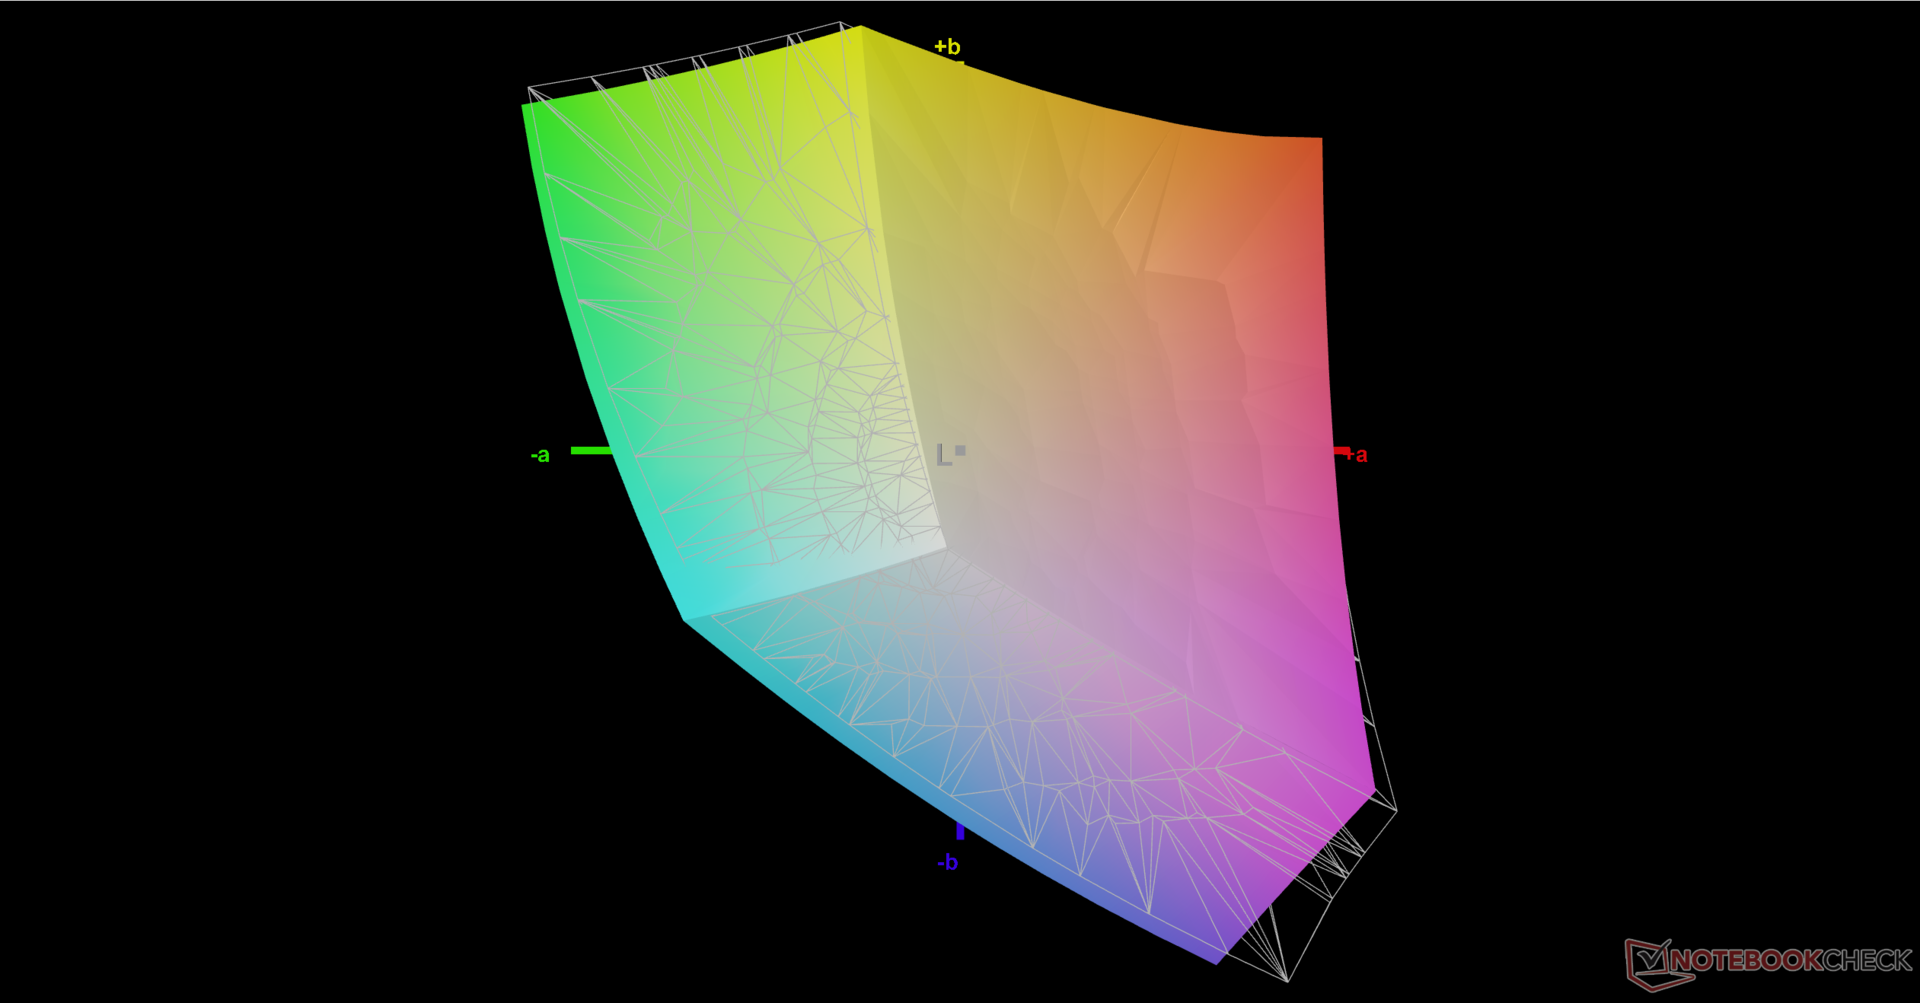
HP, ZBook sınıfı bir dizüstü bilgisayar için utanç verici olan modeli önceden kalibre edilmiş olarak göndermiyor. Kutudan çıkan ortalama gri tonlama ve renk DeltaE değerleri sırasıyla 5,9 ve 3,27'dir ve renk sıcaklığı biraz fazla sıcaktır. Ekranı kendimiz kalibre edersek ortalama deltaE değerleri sadece 0,5 ve 0,56'ya yükselecektir. Kalibre edilmiş ICM dosyamız yukarıda ücretsiz olarak indirilebilir.
Yanıt Sürelerini Görüntüle
| ↔ Tepki Süresi Siyahtan Beyaza | ||
|---|---|---|
| 10.4 ms ... yükseliş ↗ ve sonbahar↘ birleşimi | ↗ 5.5 ms yükseliş | 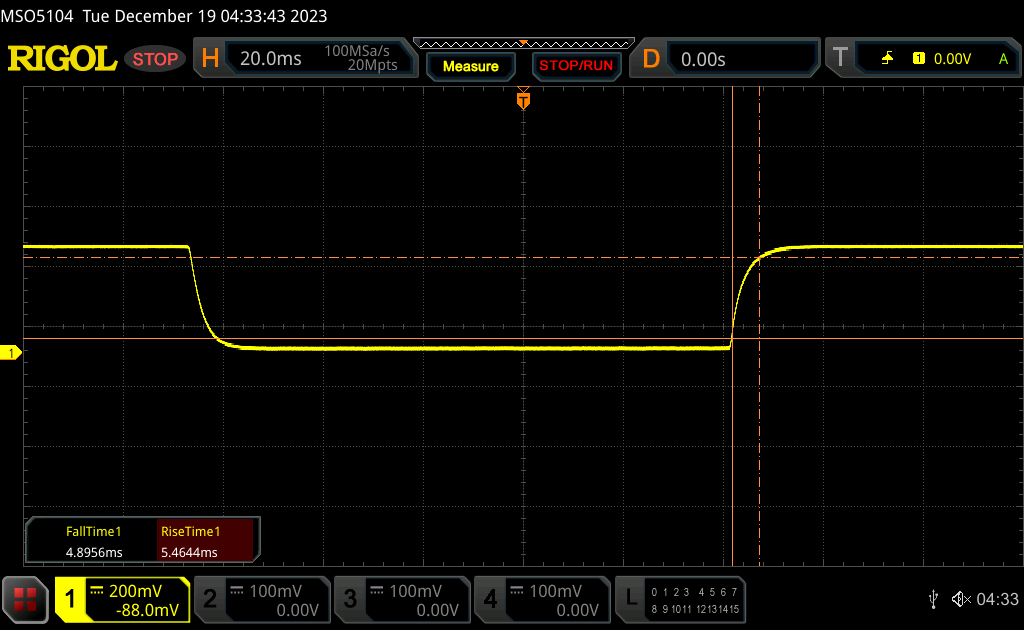 |
| ↘ 4.9 ms sonbahar | ||
| Ekran, testlerimizde iyi yanıt oranları gösteriyor ancak rekabetçi oyuncular için çok yavaş olabilir. Karşılaştırıldığında, test edilen tüm cihazlar 0.1 (minimum) ile 240 (maksimum) ms arasında değişir. » Tüm cihazların 28 %'si daha iyi. Bu, ölçülen yanıt süresinin test edilen tüm cihazların ortalamasından (19.9 ms) daha iyi olduğu anlamına gelir. | ||
| ↔ Tepki Süresi %50 Griden %80 Griye | ||
| 13 ms ... yükseliş ↗ ve sonbahar↘ birleşimi | ↗ 6.4 ms yükseliş | 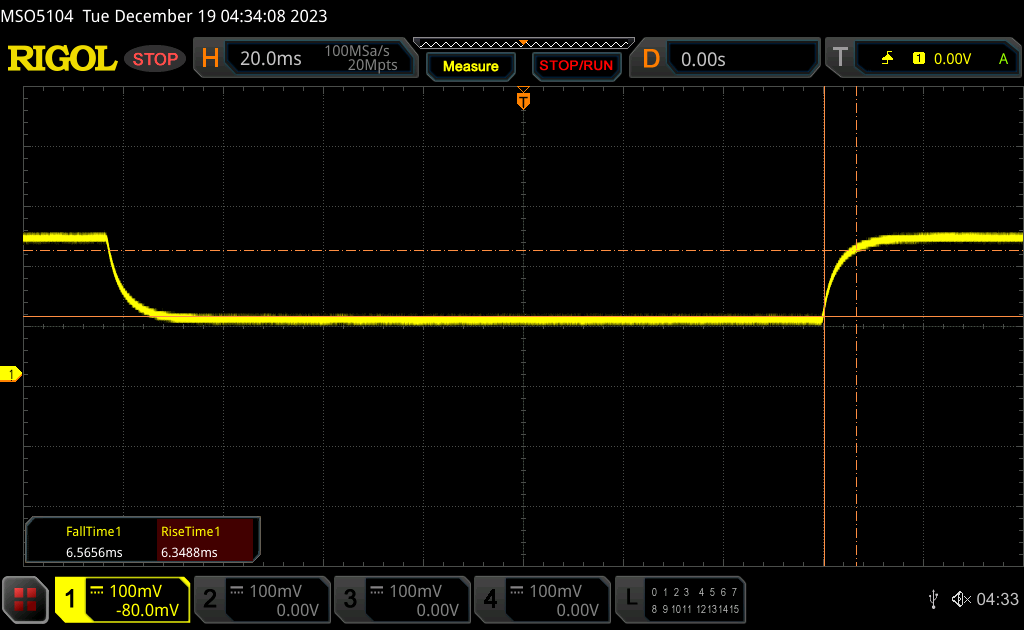 |
| ↘ 6.6 ms sonbahar | ||
| Ekran, testlerimizde iyi yanıt oranları gösteriyor ancak rekabetçi oyuncular için çok yavaş olabilir. Karşılaştırıldığında, test edilen tüm cihazlar 0.165 (minimum) ile 636 (maksimum) ms arasında değişir. » Tüm cihazların 26 %'si daha iyi. Bu, ölçülen yanıt süresinin test edilen tüm cihazların ortalamasından (31.1 ms) daha iyi olduğu anlamına gelir. | ||
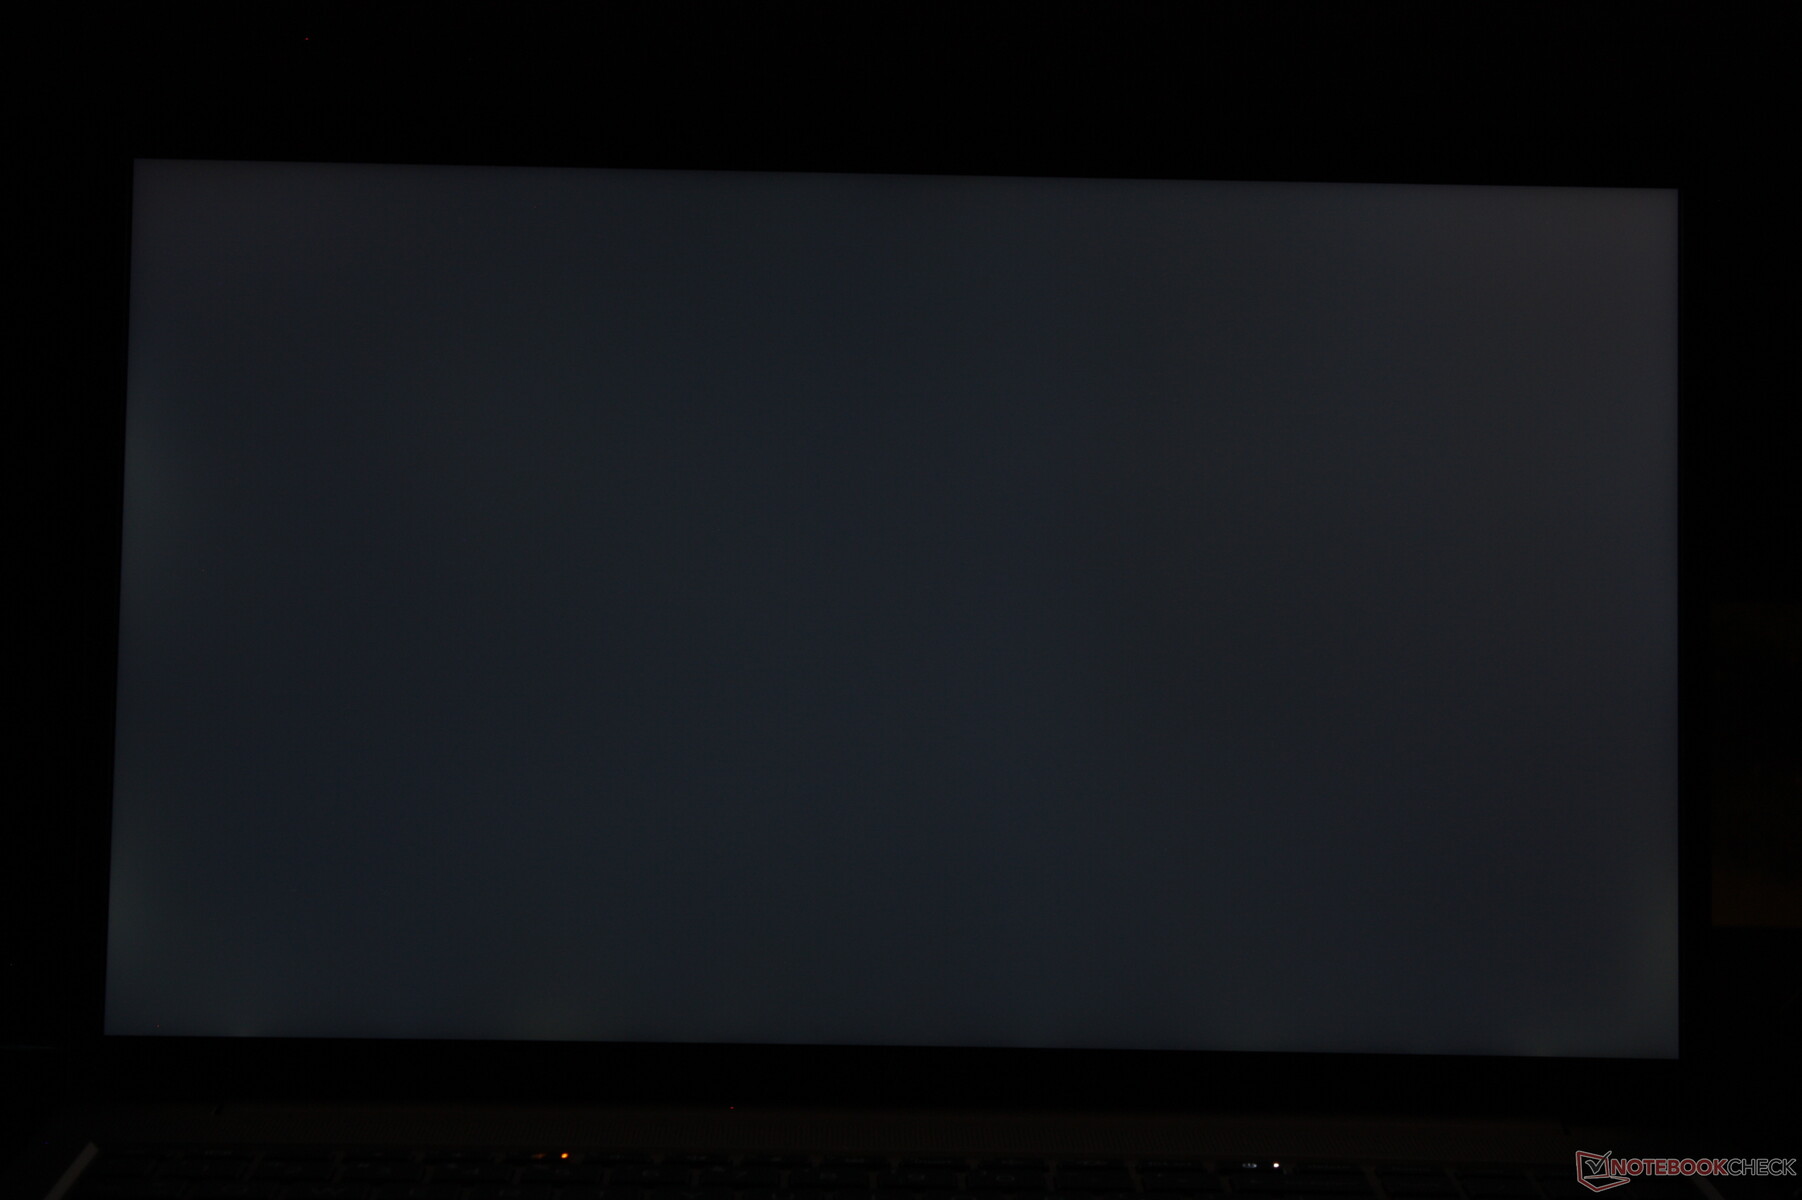
Ekran Titremesi / PWM (Darbe Genişliği Modülasyonu)
| Ekran titriyor / PWM algılanmadı | 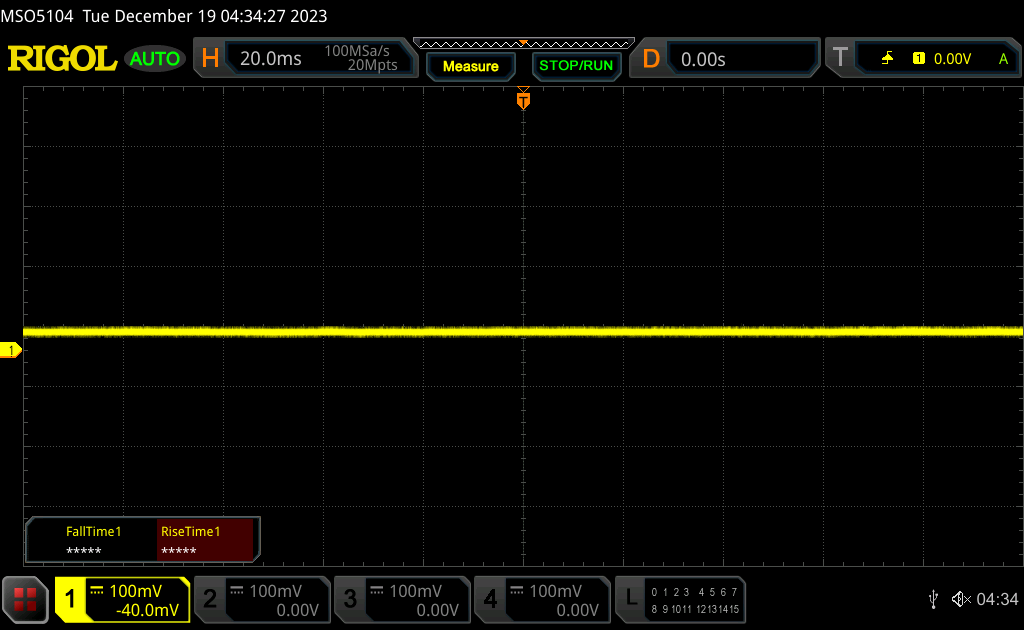 | ||
Karşılaştırıldığında: Test edilen tüm cihazların %52 %'si ekranı karartmak için PWM kullanmıyor. PWM tespit edilirse, ortalama 7784 (minimum: 5 - maksimum: 343500) Hz ölçüldü. | |||
Performans
Test Koşulları
Aşağıdaki kıyaslamaları çalıştırmadan önce hem Windows hem de Nvidia Denetim Masası'nı Performans moduna ayarladık. Sistem HP'nin herhangi bir ek güç profiline sahip görünmüyor.
Optimus beklendiği gibi destekleniyor, ancak daha kalın olanın aksine ECC VRAM modu yok ZBook Fury 16 G10 daha hızlı RTX 5000 Ada ile.
İşlemci
Bu Ryzen 7 Pro 7840HS 'ye göre yüzde 20'ye kadar daha hızlı çoklu iş parçacığı performansı sunar Core i7-12700H geçen yılın ZBook Power 15 G9'unda. Bununla birlikte, daha da hızlı performans için kullanıcılar Intel Core i9-13900H bunun yerine Ryzen 7'den yüzde 30'a kadar daha hızlı çalışabilir.
Ryzen 7'ye düşürmek Ryzen 5 Pro 7640HS ryzen 7 Pro 7840HS yapılandırmamızın performansı yüzde 25 ila 30 oranında etkilemesi bekleniyor. Öte yandan, Ryzen 7 Pro Ryzen 9 Pro 7940HS ile geçirdiğimiz süreye dayanarak performansı yalnızca yüzde 5 ila 10 oranında marjinal olarak artırması bekleniyor Lenovo ThinkPad Z16 Gen 2. Bu nedenle, Ryzen 7 yerine Ryzen 9 ile yapılandırıldığında dolar başına performans önemli ölçüde azalır.
Cinebench R15 Multi Loop
Cinebench R23: Multi Core | Single Core
Cinebench R20: CPU (Multi Core) | CPU (Single Core)
Cinebench R15: CPU Multi 64Bit | CPU Single 64Bit
Blender: v2.79 BMW27 CPU
7-Zip 18.03: 7z b 4 | 7z b 4 -mmt1
Geekbench 5.5: Multi-Core | Single-Core
HWBOT x265 Benchmark v2.2: 4k Preset
LibreOffice : 20 Documents To PDF
R Benchmark 2.5: Overall mean
| CPU Performance rating | |
| HP ZBook Fury 16 G10 | |
| Asus ExpertBook B6 Flip B6602FC2 | |
| Lenovo ThinkPad P1 G6-21FV000DGE | |
| Lenovo ThinkPad Z16 Gen 2 | |
| HP ZBook Studio 16 G9 62U04EA | |
| HP ZBook Power 15 G10 | |
| Ortalama AMD Ryzen 7 PRO 7840HS | |
| HP ZBook Power 15 G9 6B8C4EA | |
| HP ZBook Firefly 14 G10 A | |
| Lenovo ThinkPad P15v G3 21EM001AGE | |
| Dell Precision 5000 5560 -2! | |
| Lenovo ThinkPad P15v G2 21A9000XGE -1! | |
| Cinebench R23 / Multi Core | |
| HP ZBook Fury 16 G10 | |
| Asus ExpertBook B6 Flip B6602FC2 | |
| Lenovo ThinkPad P1 G6-21FV000DGE | |
| Lenovo ThinkPad Z16 Gen 2 | |
| HP ZBook Studio 16 G9 62U04EA | |
| HP ZBook Power 15 G10 | |
| Ortalama AMD Ryzen 7 PRO 7840HS (14240 - 15863, n=2) | |
| HP ZBook Power 15 G9 6B8C4EA | |
| Lenovo ThinkPad P15v G3 21EM001AGE | |
| HP ZBook Firefly 14 G10 A | |
| Lenovo ThinkPad P15v G2 21A9000XGE | |
| Dell Precision 5000 5560 | |
| Cinebench R20 / CPU (Multi Core) | |
| HP ZBook Fury 16 G10 | |
| Asus ExpertBook B6 Flip B6602FC2 | |
| Lenovo ThinkPad P1 G6-21FV000DGE | |
| Lenovo ThinkPad Z16 Gen 2 | |
| HP ZBook Studio 16 G9 62U04EA | |
| HP ZBook Power 15 G10 | |
| Ortalama AMD Ryzen 7 PRO 7840HS (5327 - 6235, n=2) | |
| HP ZBook Power 15 G9 6B8C4EA | |
| Lenovo ThinkPad P15v G3 21EM001AGE | |
| Lenovo ThinkPad P15v G3 21EM001AGE | |
| HP ZBook Firefly 14 G10 A | |
| Dell Precision 5000 5560 | |
| Lenovo ThinkPad P15v G2 21A9000XGE | |
| Cinebench R20 / CPU (Single Core) | |
| HP ZBook Fury 16 G10 | |
| Lenovo ThinkPad P1 G6-21FV000DGE | |
| Asus ExpertBook B6 Flip B6602FC2 | |
| HP ZBook Studio 16 G9 62U04EA | |
| Lenovo ThinkPad Z16 Gen 2 | |
| HP ZBook Power 15 G10 | |
| HP ZBook Power 15 G9 6B8C4EA | |
| Ortalama AMD Ryzen 7 PRO 7840HS (651 - 693, n=2) | |
| HP ZBook Firefly 14 G10 A | |
| Dell Precision 5000 5560 | |
| Lenovo ThinkPad P15v G3 21EM001AGE | |
| Lenovo ThinkPad P15v G3 21EM001AGE | |
| Lenovo ThinkPad P15v G2 21A9000XGE | |
| Cinebench R15 / CPU Multi 64Bit | |
| HP ZBook Fury 16 G10 | |
| Asus ExpertBook B6 Flip B6602FC2 | |
| Lenovo ThinkPad Z16 Gen 2 | |
| Lenovo ThinkPad P1 G6-21FV000DGE | |
| HP ZBook Power 15 G10 | |
| HP ZBook Studio 16 G9 62U04EA | |
| Ortalama AMD Ryzen 7 PRO 7840HS (2361 - 2519, n=2) | |
| Lenovo ThinkPad P15v G3 21EM001AGE | |
| HP ZBook Power 15 G9 6B8C4EA | |
| HP ZBook Firefly 14 G10 A | |
| Lenovo ThinkPad P15v G2 21A9000XGE | |
| Dell Precision 5000 5560 | |
| Cinebench R15 / CPU Single 64Bit | |
| HP ZBook Fury 16 G10 | |
| Lenovo ThinkPad P1 G6-21FV000DGE | |
| Lenovo ThinkPad Z16 Gen 2 | |
| HP ZBook Power 15 G10 | |
| Asus ExpertBook B6 Flip B6602FC2 | |
| HP ZBook Studio 16 G9 62U04EA | |
| Ortalama AMD Ryzen 7 PRO 7840HS (262 - 276, n=2) | |
| HP ZBook Power 15 G9 6B8C4EA | |
| HP ZBook Firefly 14 G10 A | |
| Dell Precision 5000 5560 | |
| Lenovo ThinkPad P15v G2 21A9000XGE | |
| Lenovo ThinkPad P15v G3 21EM001AGE | |
| Blender / v2.79 BMW27 CPU | |
| Lenovo ThinkPad P15v G2 21A9000XGE | |
| Dell Precision 5000 5560 | |
| HP ZBook Firefly 14 G10 A | |
| Lenovo ThinkPad P15v G3 21EM001AGE | |
| HP ZBook Power 15 G9 6B8C4EA | |
| Ortalama AMD Ryzen 7 PRO 7840HS (201 - 205, n=2) | |
| HP ZBook Power 15 G10 | |
| Lenovo ThinkPad P1 G6-21FV000DGE | |
| HP ZBook Studio 16 G9 62U04EA | |
| Lenovo ThinkPad Z16 Gen 2 | |
| Asus ExpertBook B6 Flip B6602FC2 | |
| HP ZBook Fury 16 G10 | |
| 7-Zip 18.03 / 7z b 4 | |
| HP ZBook Fury 16 G10 | |
| Asus ExpertBook B6 Flip B6602FC2 | |
| Lenovo ThinkPad P1 G6-21FV000DGE | |
| HP ZBook Power 15 G10 | |
| HP ZBook Studio 16 G9 62U04EA | |
| Lenovo ThinkPad Z16 Gen 2 | |
| Ortalama AMD Ryzen 7 PRO 7840HS (62497 - 70387, n=2) | |
| HP ZBook Power 15 G9 6B8C4EA | |
| Lenovo ThinkPad P15v G3 21EM001AGE | |
| HP ZBook Firefly 14 G10 A | |
| Dell Precision 5000 5560 | |
| Lenovo ThinkPad P15v G2 21A9000XGE | |
| 7-Zip 18.03 / 7z b 4 -mmt1 | |
| HP ZBook Fury 16 G10 | |
| Lenovo ThinkPad P1 G6-21FV000DGE | |
| Ortalama AMD Ryzen 7 PRO 7840HS (6493 - 6498, n=2) | |
| HP ZBook Power 15 G10 | |
| Lenovo ThinkPad Z16 Gen 2 | |
| Asus ExpertBook B6 Flip B6602FC2 | |
| HP ZBook Studio 16 G9 62U04EA | |
| HP ZBook Firefly 14 G10 A | |
| HP ZBook Power 15 G9 6B8C4EA | |
| Dell Precision 5000 5560 | |
| Lenovo ThinkPad P15v G3 21EM001AGE | |
| Lenovo ThinkPad P15v G2 21A9000XGE | |
| Geekbench 5.5 / Multi-Core | |
| HP ZBook Fury 16 G10 | |
| Asus ExpertBook B6 Flip B6602FC2 | |
| HP ZBook Studio 16 G9 62U04EA | |
| HP ZBook Power 15 G10 | |
| Lenovo ThinkPad Z16 Gen 2 | |
| HP ZBook Power 15 G9 6B8C4EA | |
| Lenovo ThinkPad P1 G6-21FV000DGE | |
| Ortalama AMD Ryzen 7 PRO 7840HS (10034 - 12039, n=2) | |
| HP ZBook Firefly 14 G10 A | |
| Lenovo ThinkPad P15v G3 21EM001AGE | |
| Lenovo ThinkPad P15v G2 21A9000XGE | |
| Geekbench 5.5 / Single-Core | |
| HP ZBook Fury 16 G10 | |
| Lenovo ThinkPad P1 G6-21FV000DGE | |
| Lenovo ThinkPad Z16 Gen 2 | |
| HP ZBook Power 15 G10 | |
| Ortalama AMD Ryzen 7 PRO 7840HS (1822 - 1953, n=2) | |
| Asus ExpertBook B6 Flip B6602FC2 | |
| HP ZBook Studio 16 G9 62U04EA | |
| HP ZBook Firefly 14 G10 A | |
| HP ZBook Power 15 G9 6B8C4EA | |
| Lenovo ThinkPad P15v G2 21A9000XGE | |
| Lenovo ThinkPad P15v G3 21EM001AGE | |
| HWBOT x265 Benchmark v2.2 / 4k Preset | |
| HP ZBook Fury 16 G10 | |
| Asus ExpertBook B6 Flip B6602FC2 | |
| Lenovo ThinkPad Z16 Gen 2 | |
| HP ZBook Power 15 G10 | |
| HP ZBook Studio 16 G9 62U04EA | |
| Lenovo ThinkPad P1 G6-21FV000DGE | |
| Ortalama AMD Ryzen 7 PRO 7840HS (18.1 - 19.9, n=2) | |
| HP ZBook Power 15 G9 6B8C4EA | |
| HP ZBook Firefly 14 G10 A | |
| Lenovo ThinkPad P15v G3 21EM001AGE | |
| Dell Precision 5000 5560 | |
| Lenovo ThinkPad P15v G2 21A9000XGE | |
| LibreOffice / 20 Documents To PDF | |
| Lenovo ThinkPad P15v G3 21EM001AGE | |
| HP ZBook Firefly 14 G10 A | |
| HP ZBook Power 15 G10 | |
| Lenovo ThinkPad P15v G2 21A9000XGE | |
| Ortalama AMD Ryzen 7 PRO 7840HS (45.9 - 54.7, n=2) | |
| Dell Precision 5000 5560 | |
| Lenovo ThinkPad P1 G6-21FV000DGE | |
| Lenovo ThinkPad Z16 Gen 2 | |
| HP ZBook Power 15 G9 6B8C4EA | |
| HP ZBook Fury 16 G10 | |
| HP ZBook Studio 16 G9 62U04EA | |
| Asus ExpertBook B6 Flip B6602FC2 | |
| R Benchmark 2.5 / Overall mean | |
| Lenovo ThinkPad P15v G2 21A9000XGE | |
| Dell Precision 5000 5560 | |
| Lenovo ThinkPad P15v G3 21EM001AGE | |
| HP ZBook Firefly 14 G10 A | |
| HP ZBook Power 15 G9 6B8C4EA | |
| Asus ExpertBook B6 Flip B6602FC2 | |
| Lenovo ThinkPad Z16 Gen 2 | |
| HP ZBook Power 15 G10 | |
| Ortalama AMD Ryzen 7 PRO 7840HS (0.44 - 0.4487, n=2) | |
| HP ZBook Studio 16 G9 62U04EA | |
| Lenovo ThinkPad P1 G6-21FV000DGE | |
| HP ZBook Fury 16 G10 | |
* ... daha küçük daha iyidir
AIDA64: FP32 Ray-Trace | FPU Julia | CPU SHA3 | CPU Queen | FPU SinJulia | FPU Mandel | CPU AES | CPU ZLib | FP64 Ray-Trace | CPU PhotoWorxx
| Performance rating | |
| HP ZBook Power 15 G10 | |
| Ortalama AMD Ryzen 7 PRO 7840HS | |
| Lenovo ThinkPad P1 G6-21FV000DGE | |
| Lenovo ThinkPad P15v G3 21EM001AGE | |
| Asus ExpertBook B6 Flip B6602FC2 | |
| HP ZBook Power 15 G9 6B8C4EA | |
| Dell Precision 5000 5560 -9! | |
| AIDA64 / FP32 Ray-Trace | |
| HP ZBook Power 15 G10 | |
| Ortalama AMD Ryzen 7 PRO 7840HS (25606 - 25776, n=2) | |
| Lenovo ThinkPad P1 G6-21FV000DGE | |
| Asus ExpertBook B6 Flip B6602FC2 | |
| Lenovo ThinkPad P15v G3 21EM001AGE | |
| HP ZBook Power 15 G9 6B8C4EA | |
| AIDA64 / FPU Julia | |
| HP ZBook Power 15 G10 | |
| Ortalama AMD Ryzen 7 PRO 7840HS (107907 - 109059, n=2) | |
| Lenovo ThinkPad P15v G3 21EM001AGE | |
| Lenovo ThinkPad P1 G6-21FV000DGE | |
| Asus ExpertBook B6 Flip B6602FC2 | |
| HP ZBook Power 15 G9 6B8C4EA | |
| AIDA64 / CPU SHA3 | |
| HP ZBook Power 15 G10 | |
| Ortalama AMD Ryzen 7 PRO 7840HS (4631 - 4656, n=2) | |
| Lenovo ThinkPad P1 G6-21FV000DGE | |
| Asus ExpertBook B6 Flip B6602FC2 | |
| HP ZBook Power 15 G9 6B8C4EA | |
| Lenovo ThinkPad P15v G3 21EM001AGE | |
| AIDA64 / CPU Queen | |
| Lenovo ThinkPad P1 G6-21FV000DGE | |
| HP ZBook Power 15 G10 | |
| Ortalama AMD Ryzen 7 PRO 7840HS (97729 - 115640, n=2) | |
| Asus ExpertBook B6 Flip B6602FC2 | |
| Lenovo ThinkPad P15v G3 21EM001AGE | |
| HP ZBook Power 15 G9 6B8C4EA | |
| AIDA64 / FPU SinJulia | |
| HP ZBook Power 15 G10 | |
| Ortalama AMD Ryzen 7 PRO 7840HS (14693 - 14742, n=2) | |
| Lenovo ThinkPad P15v G3 21EM001AGE | |
| Asus ExpertBook B6 Flip B6602FC2 | |
| Lenovo ThinkPad P1 G6-21FV000DGE | |
| HP ZBook Power 15 G9 6B8C4EA | |
| AIDA64 / FPU Mandel | |
| HP ZBook Power 15 G10 | |
| Ortalama AMD Ryzen 7 PRO 7840HS (57502 - 58181, n=2) | |
| Lenovo ThinkPad P15v G3 21EM001AGE | |
| Lenovo ThinkPad P1 G6-21FV000DGE | |
| Asus ExpertBook B6 Flip B6602FC2 | |
| HP ZBook Power 15 G9 6B8C4EA | |
| AIDA64 / CPU AES | |
| Lenovo ThinkPad P15v G3 21EM001AGE | |
| HP ZBook Power 15 G10 | |
| Ortalama AMD Ryzen 7 PRO 7840HS (84454 - 85341, n=2) | |
| Lenovo ThinkPad P1 G6-21FV000DGE | |
| Asus ExpertBook B6 Flip B6602FC2 | |
| HP ZBook Power 15 G9 6B8C4EA | |
| AIDA64 / CPU ZLib | |
| Lenovo ThinkPad P1 G6-21FV000DGE | |
| HP ZBook Power 15 G10 | |
| Ortalama AMD Ryzen 7 PRO 7840HS (1032 - 1043, n=2) | |
| Asus ExpertBook B6 Flip B6602FC2 | |
| HP ZBook Power 15 G9 6B8C4EA | |
| Lenovo ThinkPad P15v G3 21EM001AGE | |
| Dell Precision 5000 5560 | |
| AIDA64 / FP64 Ray-Trace | |
| HP ZBook Power 15 G10 | |
| Ortalama AMD Ryzen 7 PRO 7840HS (13545 - 13800, n=2) | |
| Lenovo ThinkPad P1 G6-21FV000DGE | |
| Asus ExpertBook B6 Flip B6602FC2 | |
| Lenovo ThinkPad P15v G3 21EM001AGE | |
| HP ZBook Power 15 G9 6B8C4EA | |
| AIDA64 / CPU PhotoWorxx | |
| HP ZBook Power 15 G10 | |
| HP ZBook Power 15 G9 6B8C4EA | |
| Asus ExpertBook B6 Flip B6602FC2 | |
| Ortalama AMD Ryzen 7 PRO 7840HS (24325 - 42810, n=2) | |
| Lenovo ThinkPad P1 G6-21FV000DGE | |
| Lenovo ThinkPad P15v G3 21EM001AGE | |
Sistem Performansı
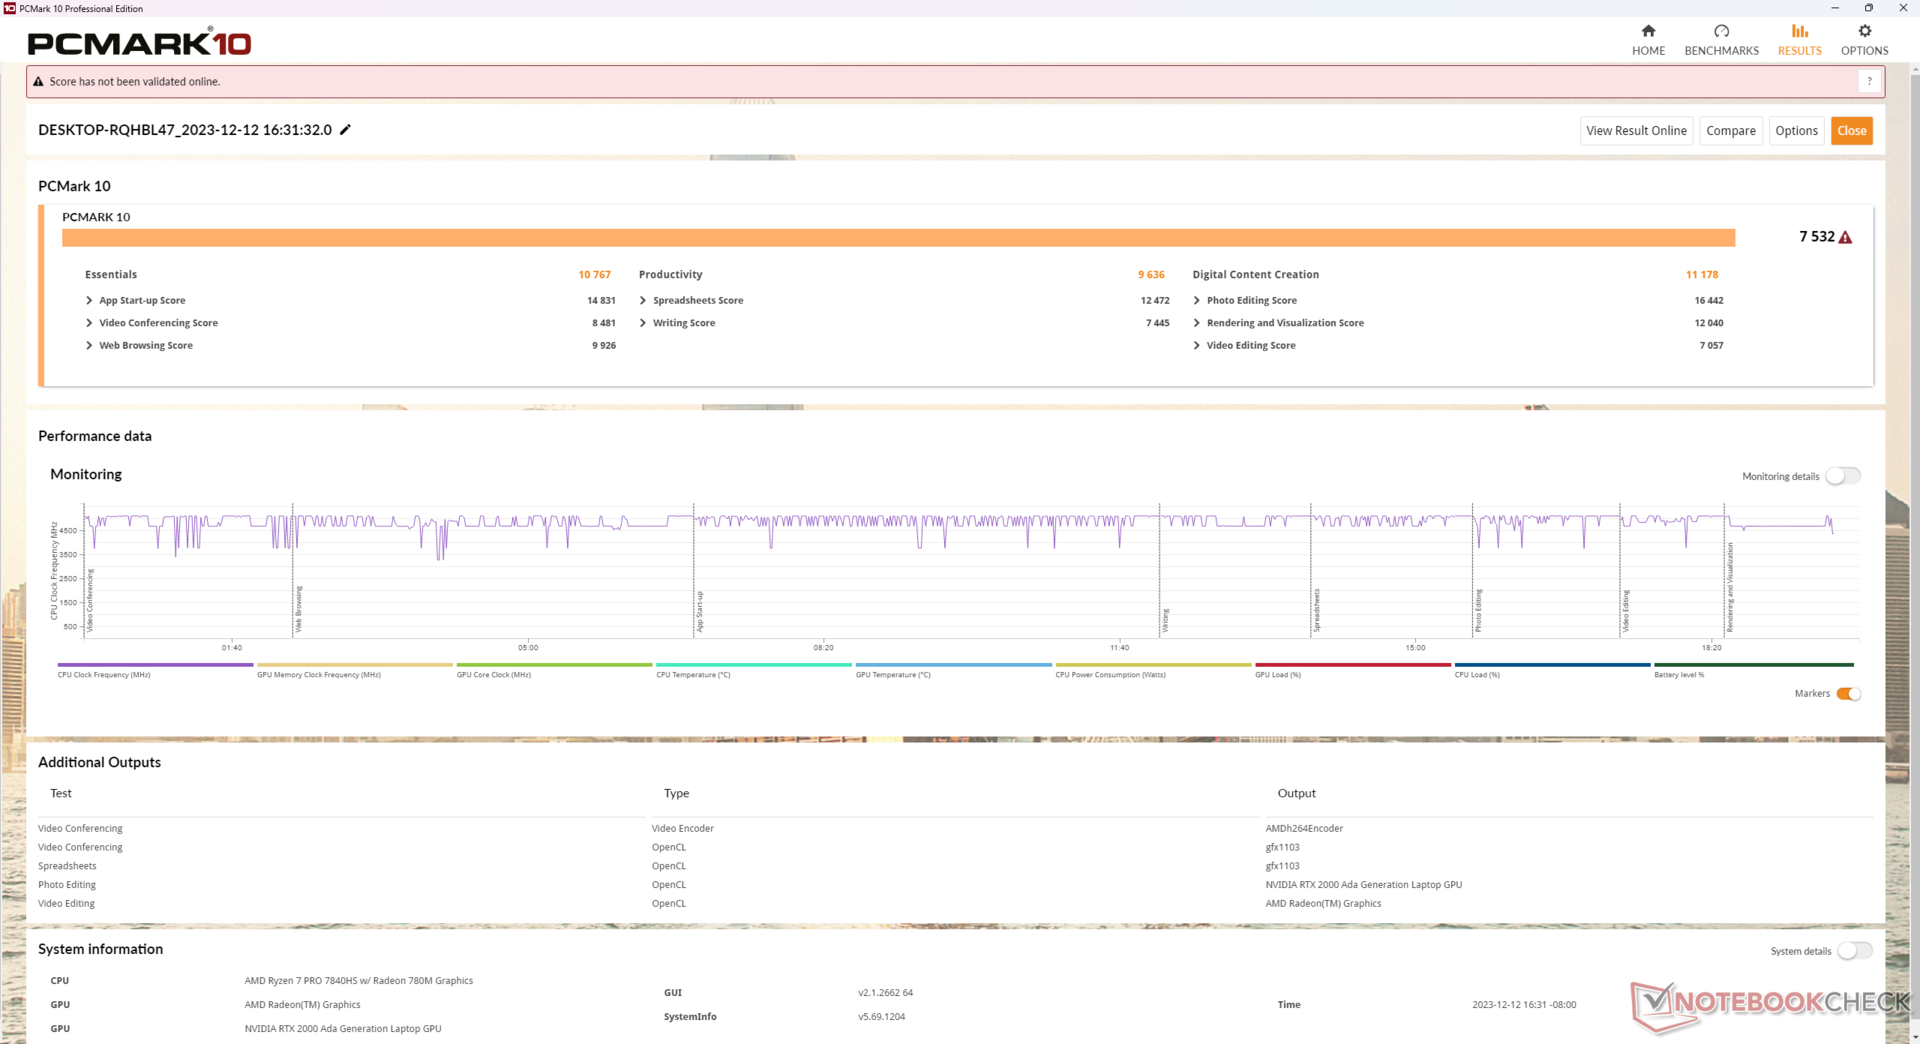
PCMark sonuçları, ZBook Power 15 G9 da dahil olmak üzere eski Nvidia RTX A2000 ile çalışan diğer iş istasyonlarından sürekli olarak daha yüksek puanlarla mükemmeldir. Hızlı 5600 MHz RAM de yüksek AIDA64 bellek skorlarından anlaşılacağı üzere öne çıkan bir özellik.
CrossMark: Overall | Productivity | Creativity | Responsiveness
WebXPRT 3: Overall
WebXPRT 4: Overall
Mozilla Kraken 1.1: Total
| PCMark 10 / Score | |
| HP ZBook Power 15 G10 | |
| Ortalama AMD Ryzen 7 PRO 7840HS, NVIDIA RTX 2000 Ada Generation Laptop (n=1) | |
| Lenovo ThinkPad P1 G6-21FV000DGE | |
| Asus ExpertBook B6 Flip B6602FC2 | |
| Dell Precision 5000 5560 | |
| Lenovo ThinkPad P15v G3 21EM001AGE | |
| HP ZBook Power 15 G9 6B8C4EA | |
| PCMark 10 / Essentials | |
| Lenovo ThinkPad P1 G6-21FV000DGE | |
| Asus ExpertBook B6 Flip B6602FC2 | |
| HP ZBook Power 15 G10 | |
| Ortalama AMD Ryzen 7 PRO 7840HS, NVIDIA RTX 2000 Ada Generation Laptop (n=1) | |
| Dell Precision 5000 5560 | |
| Lenovo ThinkPad P15v G3 21EM001AGE | |
| HP ZBook Power 15 G9 6B8C4EA | |
| PCMark 10 / Productivity | |
| Asus ExpertBook B6 Flip B6602FC2 | |
| Lenovo ThinkPad P1 G6-21FV000DGE | |
| HP ZBook Power 15 G10 | |
| Ortalama AMD Ryzen 7 PRO 7840HS, NVIDIA RTX 2000 Ada Generation Laptop (n=1) | |
| Dell Precision 5000 5560 | |
| Lenovo ThinkPad P15v G3 21EM001AGE | |
| HP ZBook Power 15 G9 6B8C4EA | |
| PCMark 10 / Digital Content Creation | |
| HP ZBook Power 15 G10 | |
| Ortalama AMD Ryzen 7 PRO 7840HS, NVIDIA RTX 2000 Ada Generation Laptop (n=1) | |
| Lenovo ThinkPad P1 G6-21FV000DGE | |
| Asus ExpertBook B6 Flip B6602FC2 | |
| Lenovo ThinkPad P15v G3 21EM001AGE | |
| HP ZBook Power 15 G9 6B8C4EA | |
| Dell Precision 5000 5560 | |
| CrossMark / Overall | |
| Asus ExpertBook B6 Flip B6602FC2 | |
| Lenovo ThinkPad P1 G6-21FV000DGE | |
| HP ZBook Power 15 G9 6B8C4EA | |
| HP ZBook Power 15 G10 | |
| Ortalama AMD Ryzen 7 PRO 7840HS, NVIDIA RTX 2000 Ada Generation Laptop (n=1) | |
| Lenovo ThinkPad P15v G3 21EM001AGE | |
| CrossMark / Productivity | |
| Asus ExpertBook B6 Flip B6602FC2 | |
| Lenovo ThinkPad P1 G6-21FV000DGE | |
| HP ZBook Power 15 G10 | |
| Ortalama AMD Ryzen 7 PRO 7840HS, NVIDIA RTX 2000 Ada Generation Laptop (n=1) | |
| HP ZBook Power 15 G9 6B8C4EA | |
| Lenovo ThinkPad P15v G3 21EM001AGE | |
| CrossMark / Creativity | |
| Asus ExpertBook B6 Flip B6602FC2 | |
| Lenovo ThinkPad P1 G6-21FV000DGE | |
| HP ZBook Power 15 G9 6B8C4EA | |
| HP ZBook Power 15 G10 | |
| Ortalama AMD Ryzen 7 PRO 7840HS, NVIDIA RTX 2000 Ada Generation Laptop (n=1) | |
| Lenovo ThinkPad P15v G3 21EM001AGE | |
| CrossMark / Responsiveness | |
| Asus ExpertBook B6 Flip B6602FC2 | |
| Lenovo ThinkPad P1 G6-21FV000DGE | |
| HP ZBook Power 15 G9 6B8C4EA | |
| HP ZBook Power 15 G10 | |
| Ortalama AMD Ryzen 7 PRO 7840HS, NVIDIA RTX 2000 Ada Generation Laptop (n=1) | |
| Lenovo ThinkPad P15v G3 21EM001AGE | |
| WebXPRT 3 / Overall | |
| Lenovo ThinkPad P1 G6-21FV000DGE | |
| HP ZBook Power 15 G10 | |
| Ortalama AMD Ryzen 7 PRO 7840HS, NVIDIA RTX 2000 Ada Generation Laptop (n=1) | |
| Asus ExpertBook B6 Flip B6602FC2 | |
| HP ZBook Power 15 G9 6B8C4EA | |
| Dell Precision 5000 5560 | |
| Lenovo ThinkPad P15v G3 21EM001AGE | |
| WebXPRT 4 / Overall | |
| Lenovo ThinkPad P1 G6-21FV000DGE | |
| Asus ExpertBook B6 Flip B6602FC2 | |
| HP ZBook Power 15 G9 6B8C4EA | |
| HP ZBook Power 15 G10 | |
| Ortalama AMD Ryzen 7 PRO 7840HS, NVIDIA RTX 2000 Ada Generation Laptop (n=1) | |
| Lenovo ThinkPad P15v G3 21EM001AGE | |
| Mozilla Kraken 1.1 / Total | |
| Lenovo ThinkPad P15v G3 21EM001AGE | |
| Dell Precision 5000 5560 | |
| HP ZBook Power 15 G10 | |
| Ortalama AMD Ryzen 7 PRO 7840HS, NVIDIA RTX 2000 Ada Generation Laptop (n=1) | |
| HP ZBook Power 15 G9 6B8C4EA | |
| Asus ExpertBook B6 Flip B6602FC2 | |
| Lenovo ThinkPad P1 G6-21FV000DGE | |
* ... daha küçük daha iyidir
| PCMark 10 Score | 7532 puan | |
Yardım | ||
| AIDA64 / Memory Copy | |
| HP ZBook Power 15 G10 | |
| HP ZBook Power 15 G9 6B8C4EA | |
| Asus ExpertBook B6 Flip B6602FC2 | |
| Ortalama AMD Ryzen 7 PRO 7840HS (34323 - 67943, n=2) | |
| Lenovo ThinkPad P1 G6-21FV000DGE | |
| Lenovo ThinkPad P15v G3 21EM001AGE | |
| AIDA64 / Memory Read | |
| HP ZBook Power 15 G9 6B8C4EA | |
| HP ZBook Power 15 G10 | |
| Asus ExpertBook B6 Flip B6602FC2 | |
| Ortalama AMD Ryzen 7 PRO 7840HS (30787 - 61660, n=2) | |
| Lenovo ThinkPad P1 G6-21FV000DGE | |
| Lenovo ThinkPad P15v G3 21EM001AGE | |
| AIDA64 / Memory Write | |
| HP ZBook Power 15 G10 | |
| HP ZBook Power 15 G9 6B8C4EA | |
| Ortalama AMD Ryzen 7 PRO 7840HS (39362 - 83167, n=2) | |
| Asus ExpertBook B6 Flip B6602FC2 | |
| Lenovo ThinkPad P1 G6-21FV000DGE | |
| Lenovo ThinkPad P15v G3 21EM001AGE | |
| AIDA64 / Memory Latency | |
| Ortalama AMD Ryzen 7 PRO 7840HS (99.6 - 101.2, n=2) | |
| HP ZBook Power 15 G10 | |
| Lenovo ThinkPad P15v G3 21EM001AGE | |
| Asus ExpertBook B6 Flip B6602FC2 | |
| HP ZBook Power 15 G9 6B8C4EA | |
| Lenovo ThinkPad P1 G6-21FV000DGE | |
* ... daha küçük daha iyidir
DPC Gecikme Süresi
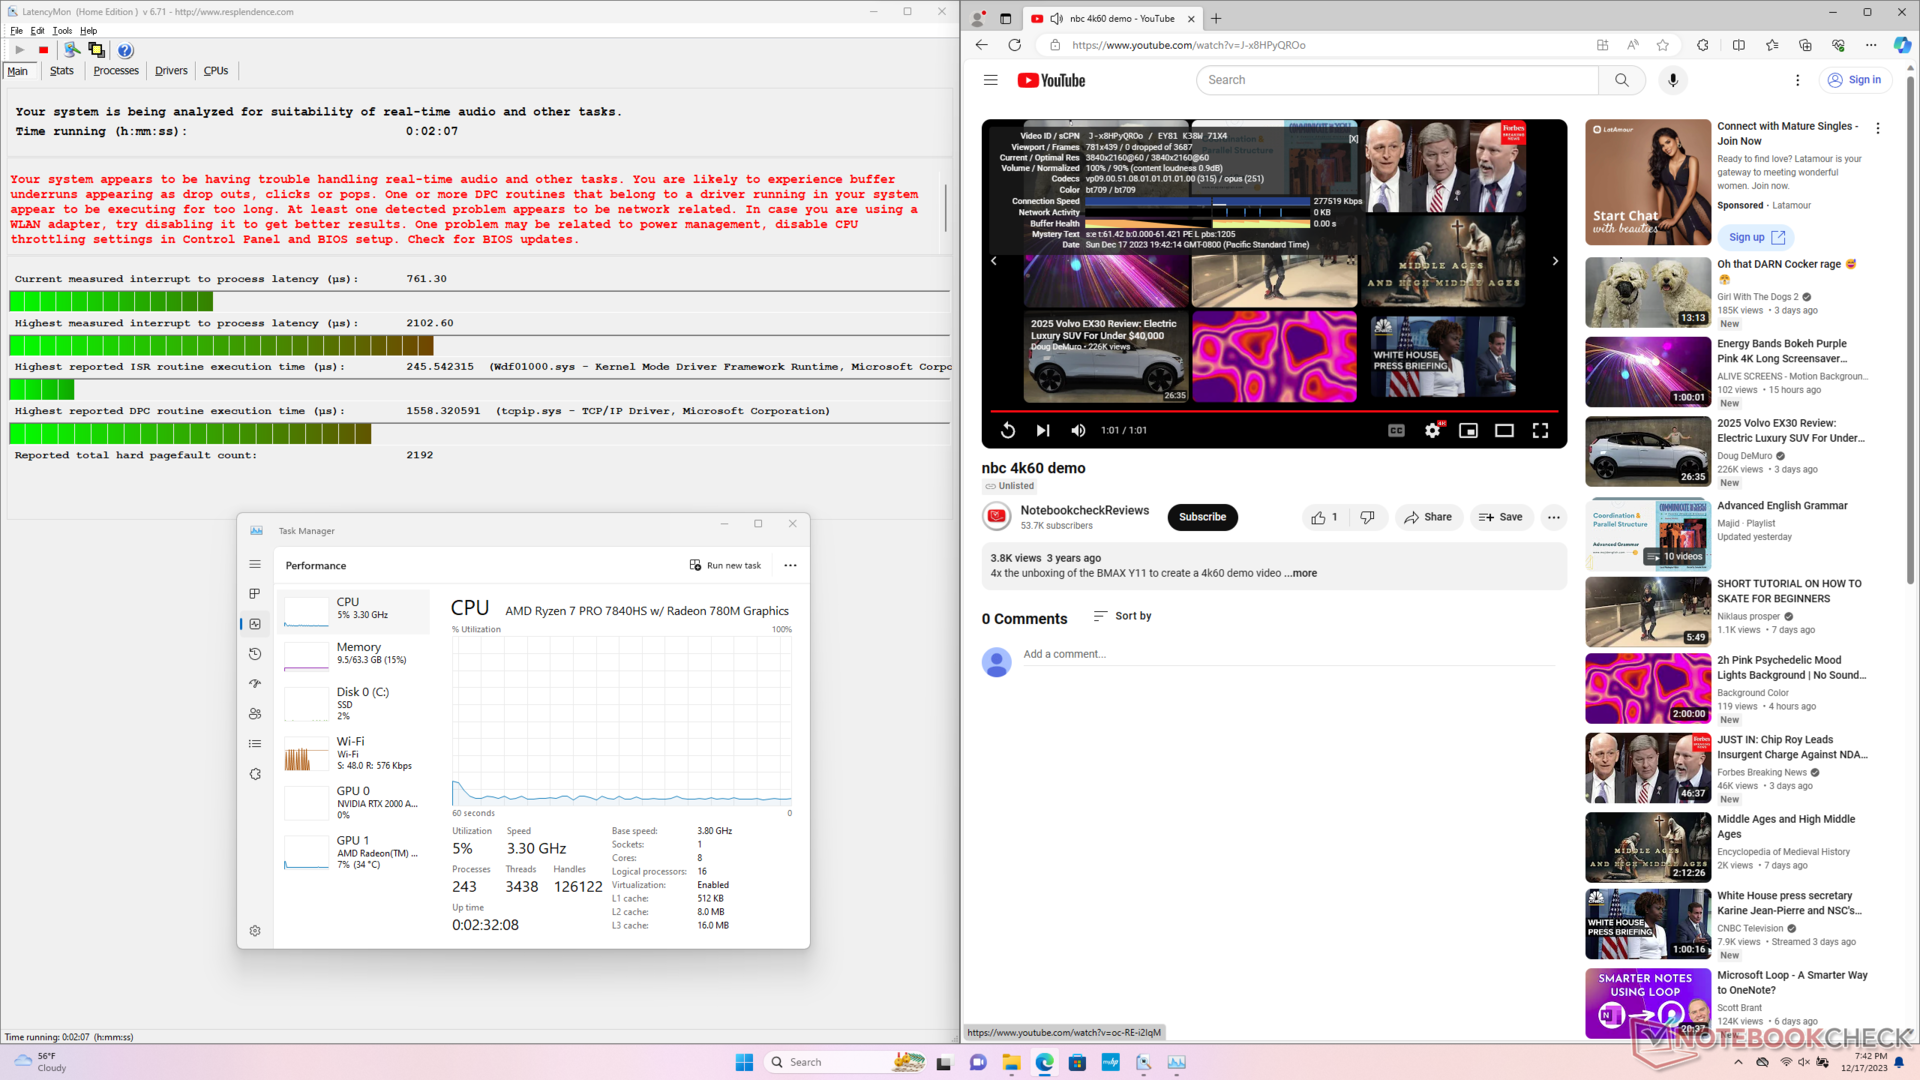
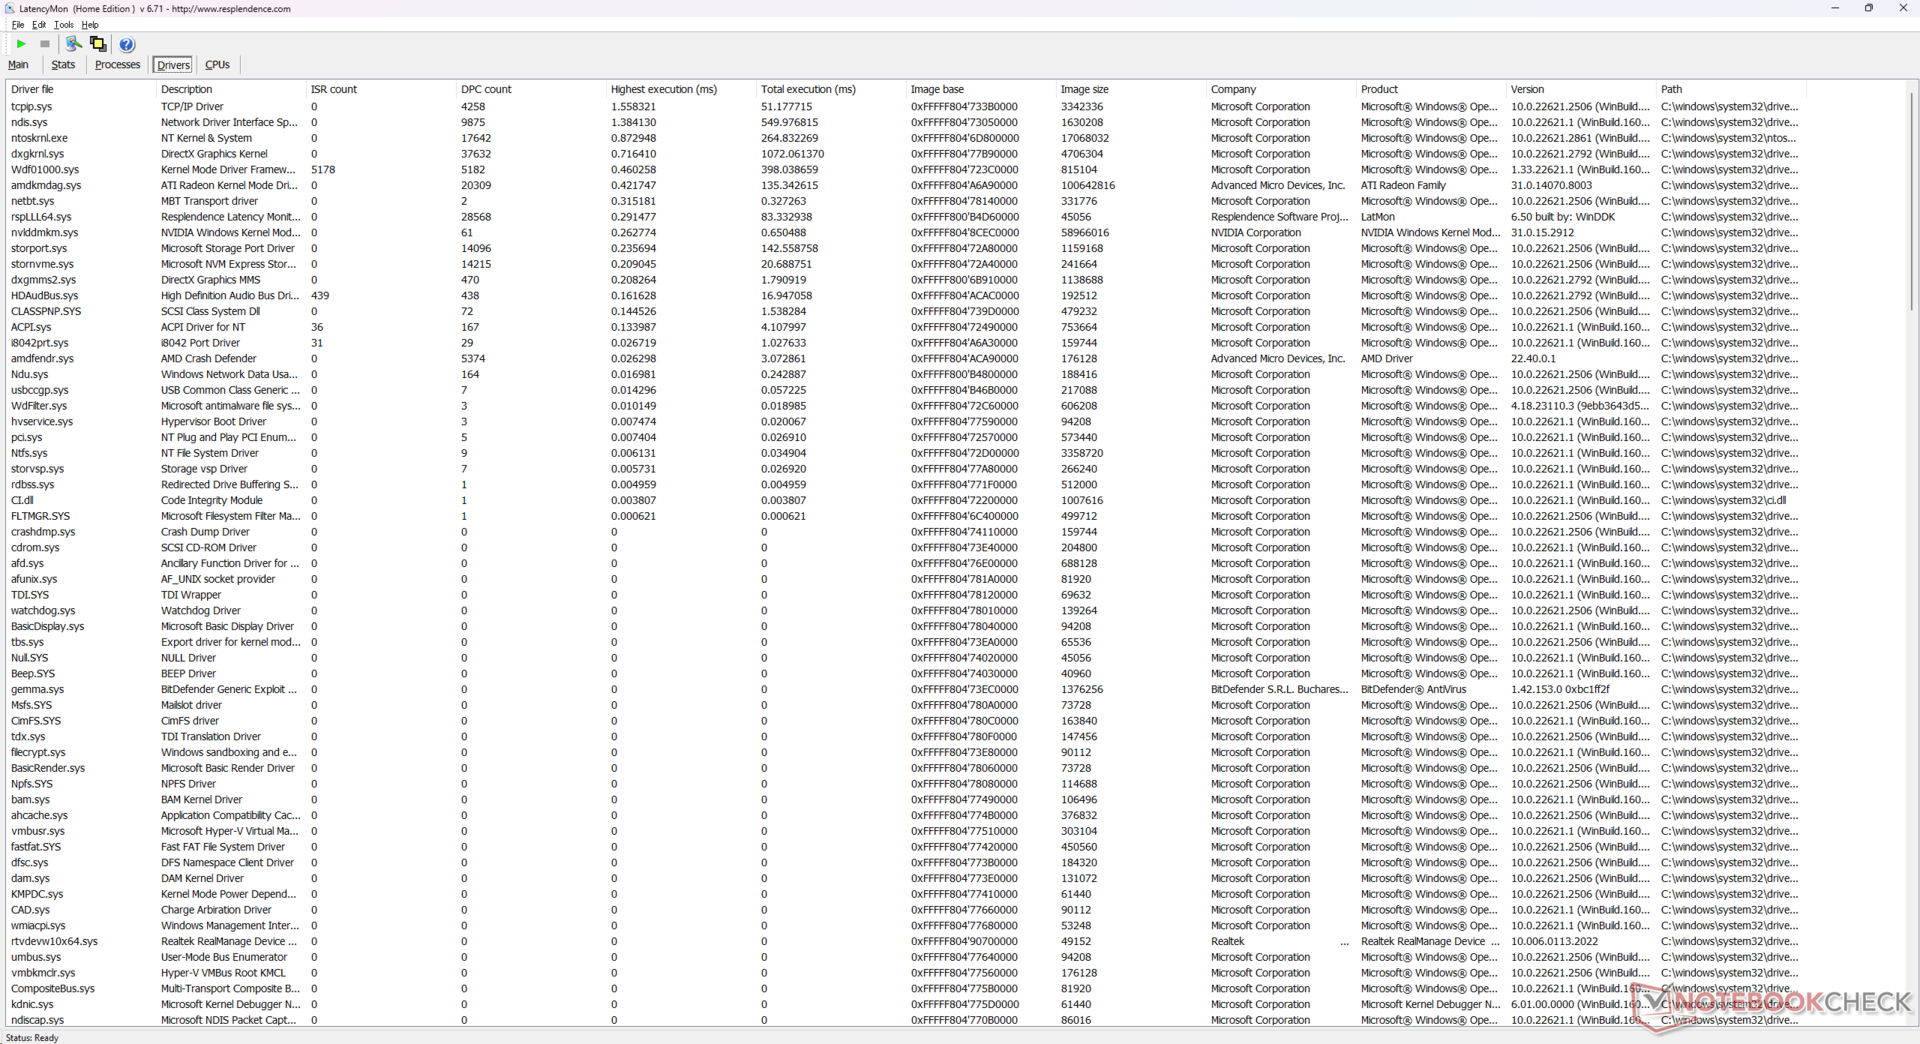
LatencyMon, ana sayfamızın birden fazla tarayıcı sekmesini açarken DPC sorunlarını ortaya çıkarıyor. 60 FPS'de 4K video oynatma, kaydedilen hiçbir kare düşmesi olmadan mükemmeldir.
| DPC Latencies / LatencyMon - interrupt to process latency (max), Web, Youtube, Prime95 | |
| Lenovo ThinkPad P1 G6-21FV000DGE | |
| Asus ExpertBook B6 Flip B6602FC2 | |
| HP ZBook Power 15 G10 | |
| HP ZBook Power 15 G9 6B8C4EA | |
| Dell Precision 5000 5560 | |
| Lenovo ThinkPad P15v G3 21EM001AGE | |
* ... daha küçük daha iyidir
Depolama Cihazları
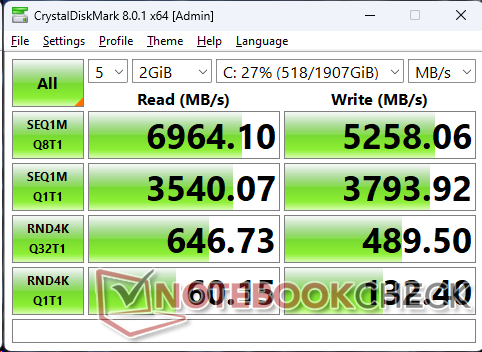
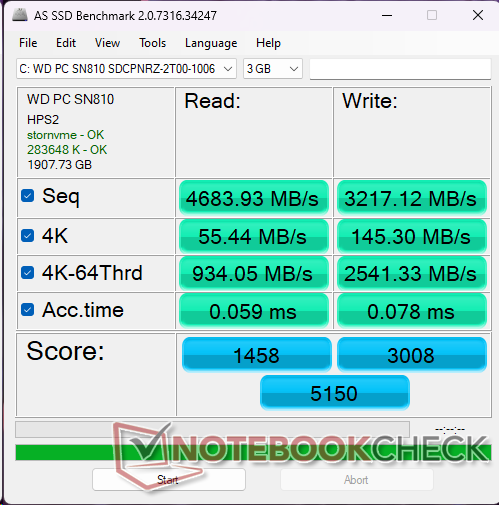
Ünitemiz aşağıdakilerle yapılandırılmış olarak gelir WDC PC SN810 geçen yılın modelindeki Samsung PM9A1 yerine. Genel olarak WDC sürücü, yüksek kuyruk derinliklerinde küçük 4K blokları okuma ve yazma söz konusu olduğunda Samsung'dan daha yavaştır. HP, alıcıların SED veya SED olmayan sürücülerle yapılandırma yapmasına izin veriyor, ancak HP söz konusu SSD markalarını açıkça listelemiyor.

* ... daha küçük daha iyidir
Disk Throttling: DiskSpd Read Loop, Queue Depth 8
GPU Performansı
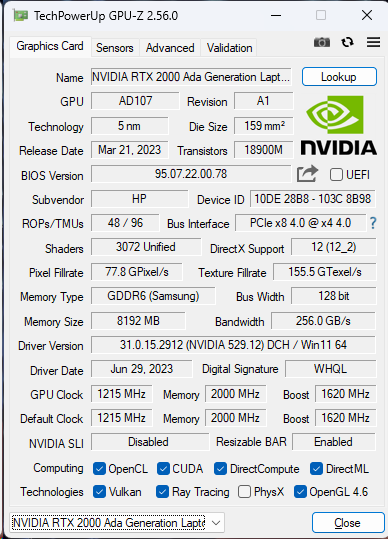
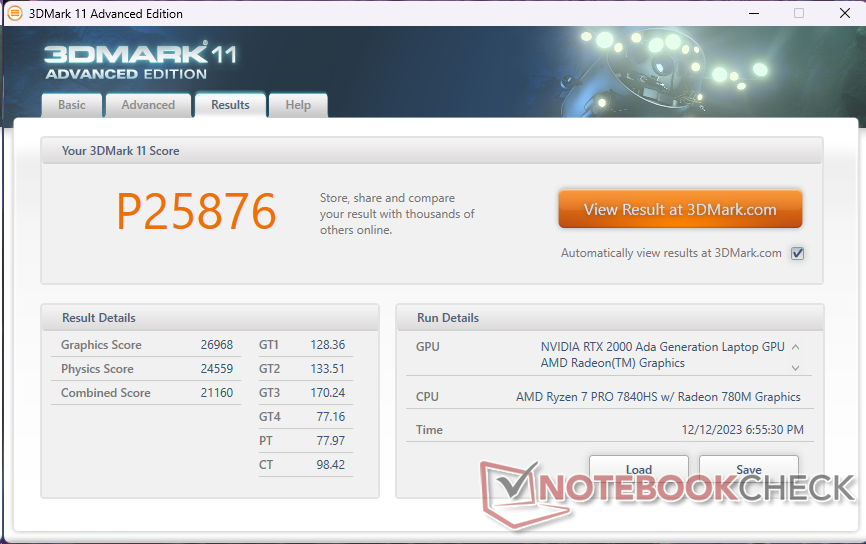
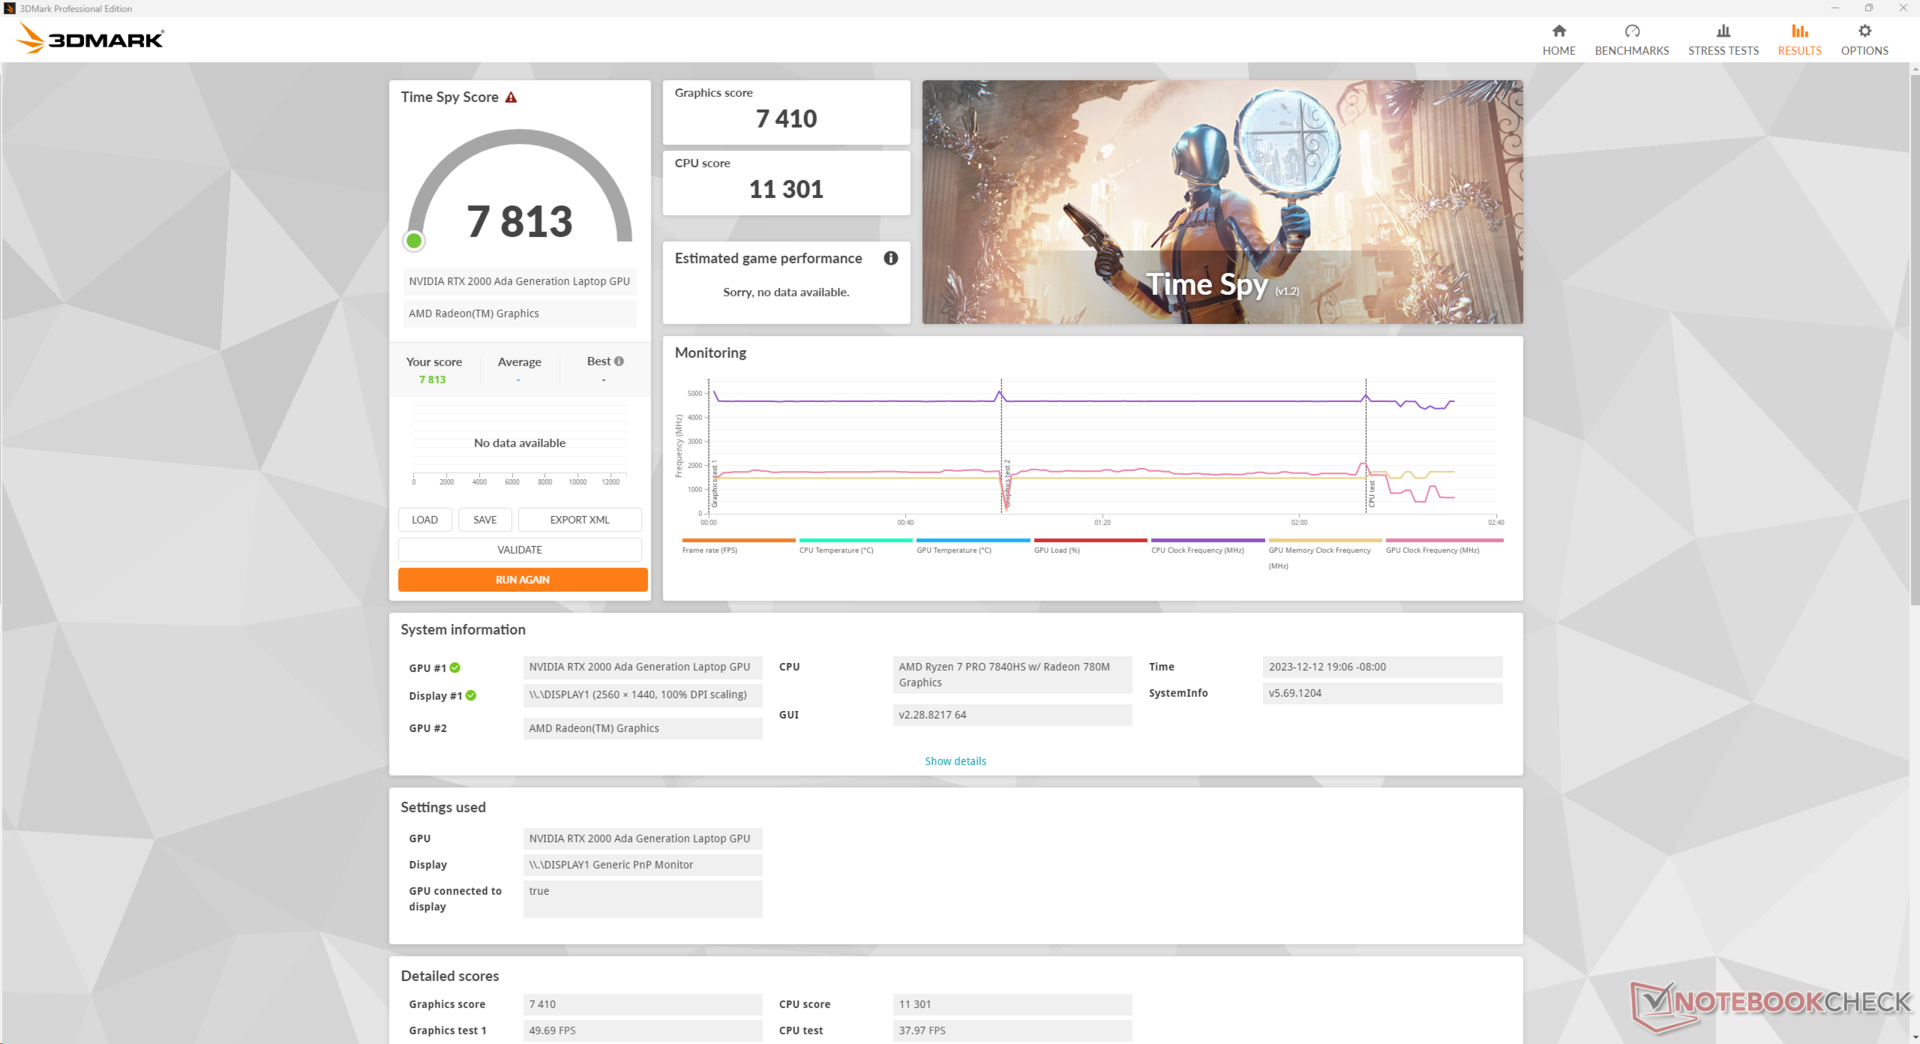
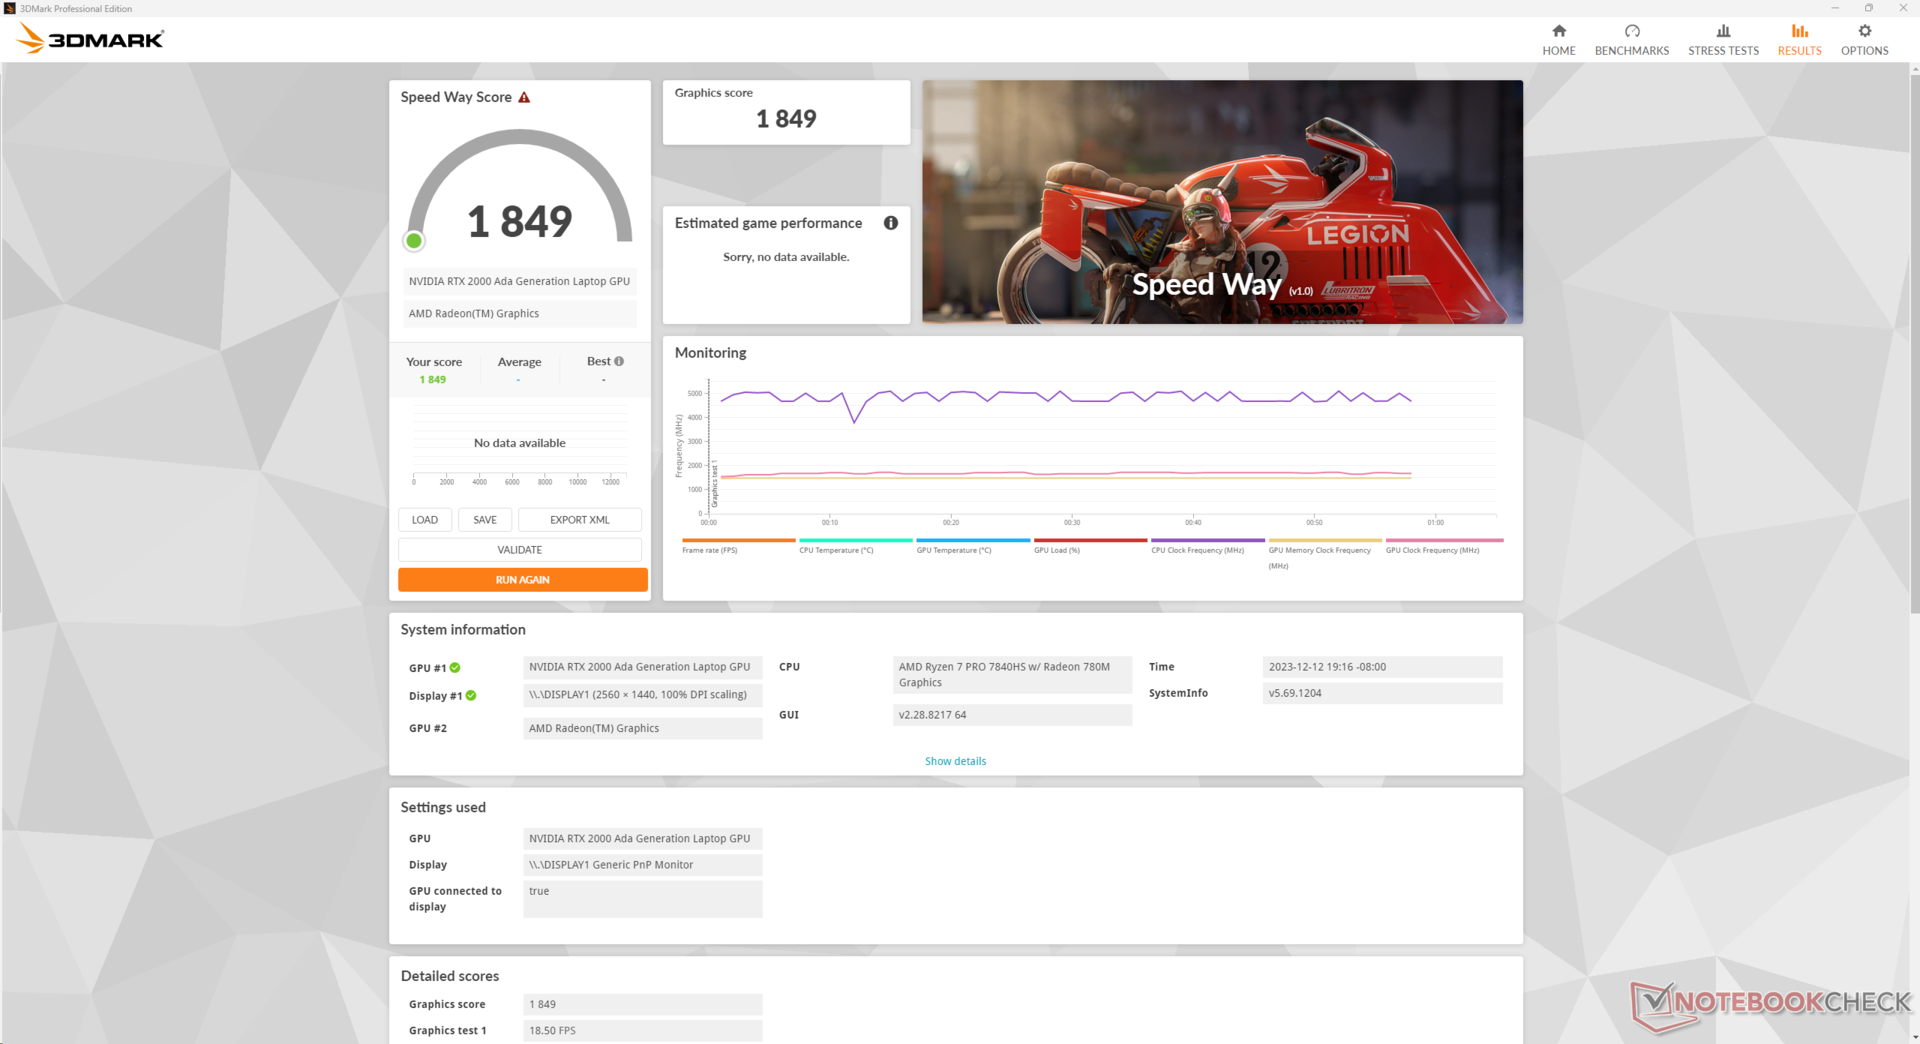
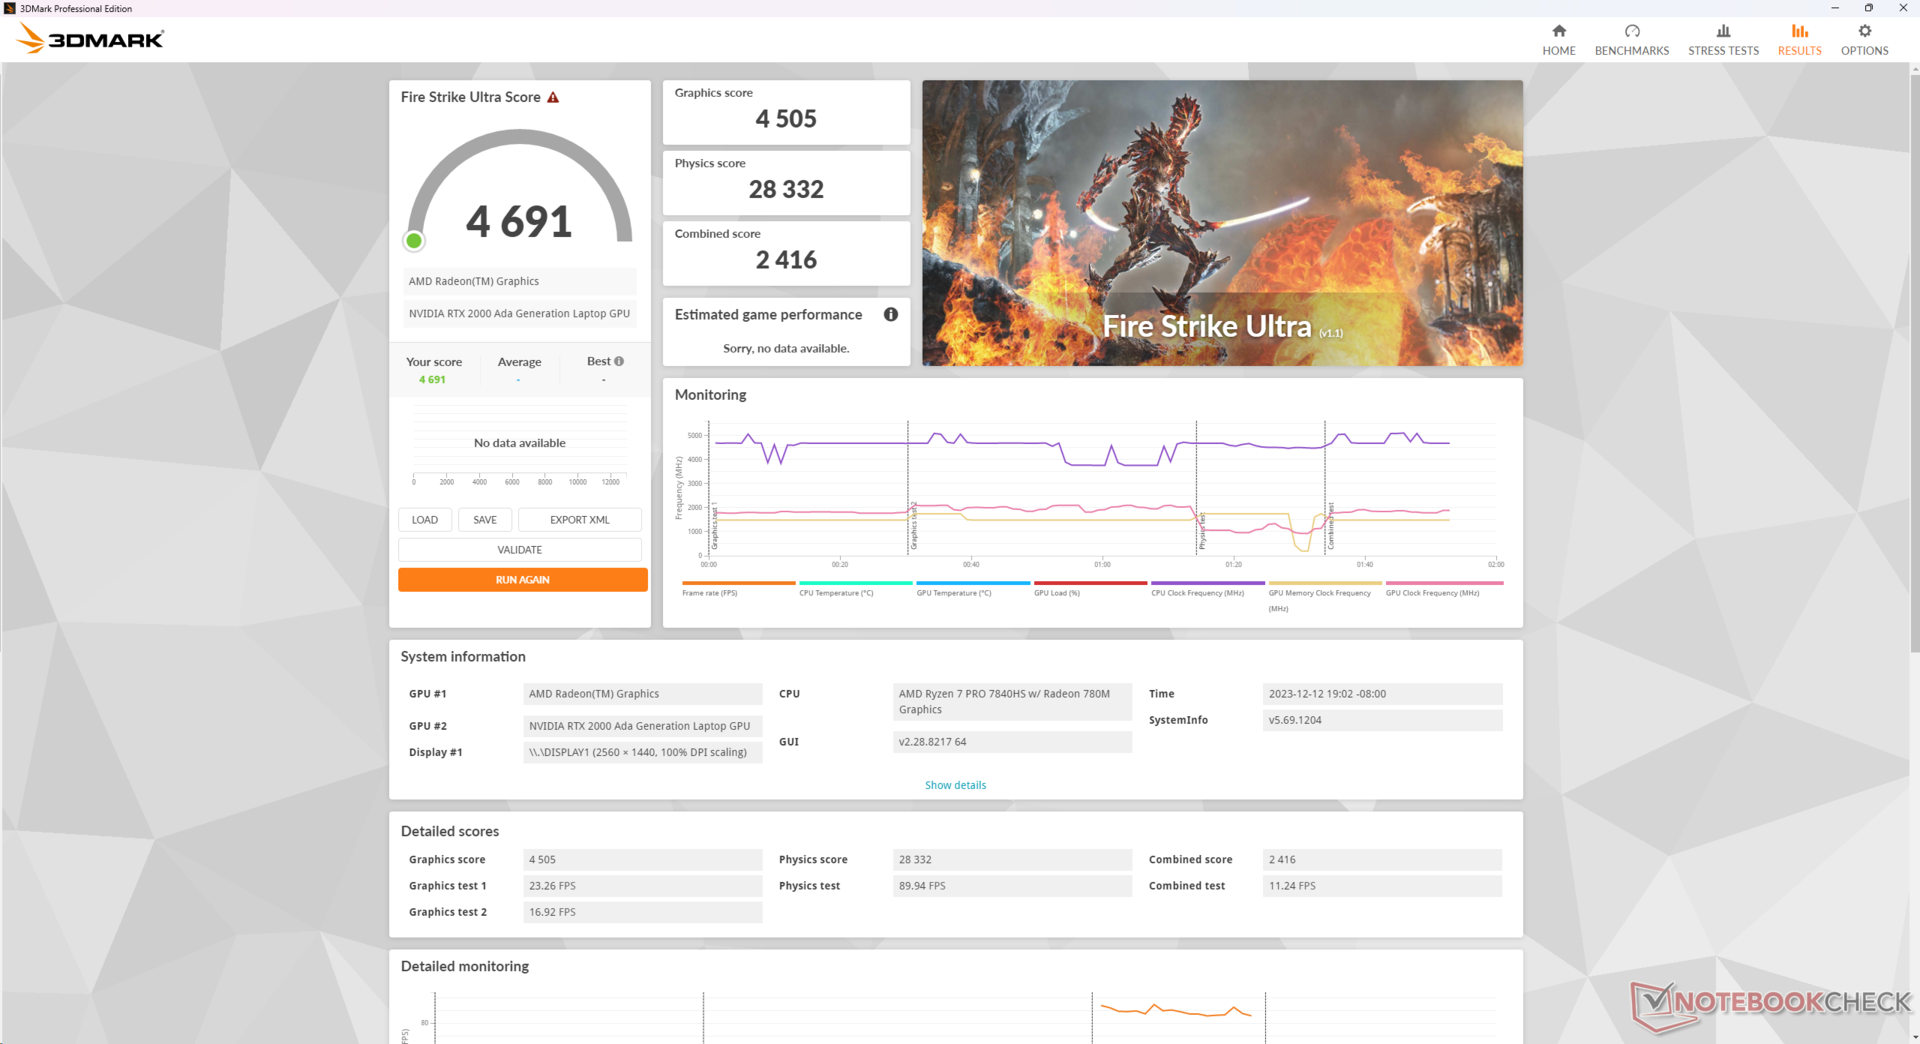
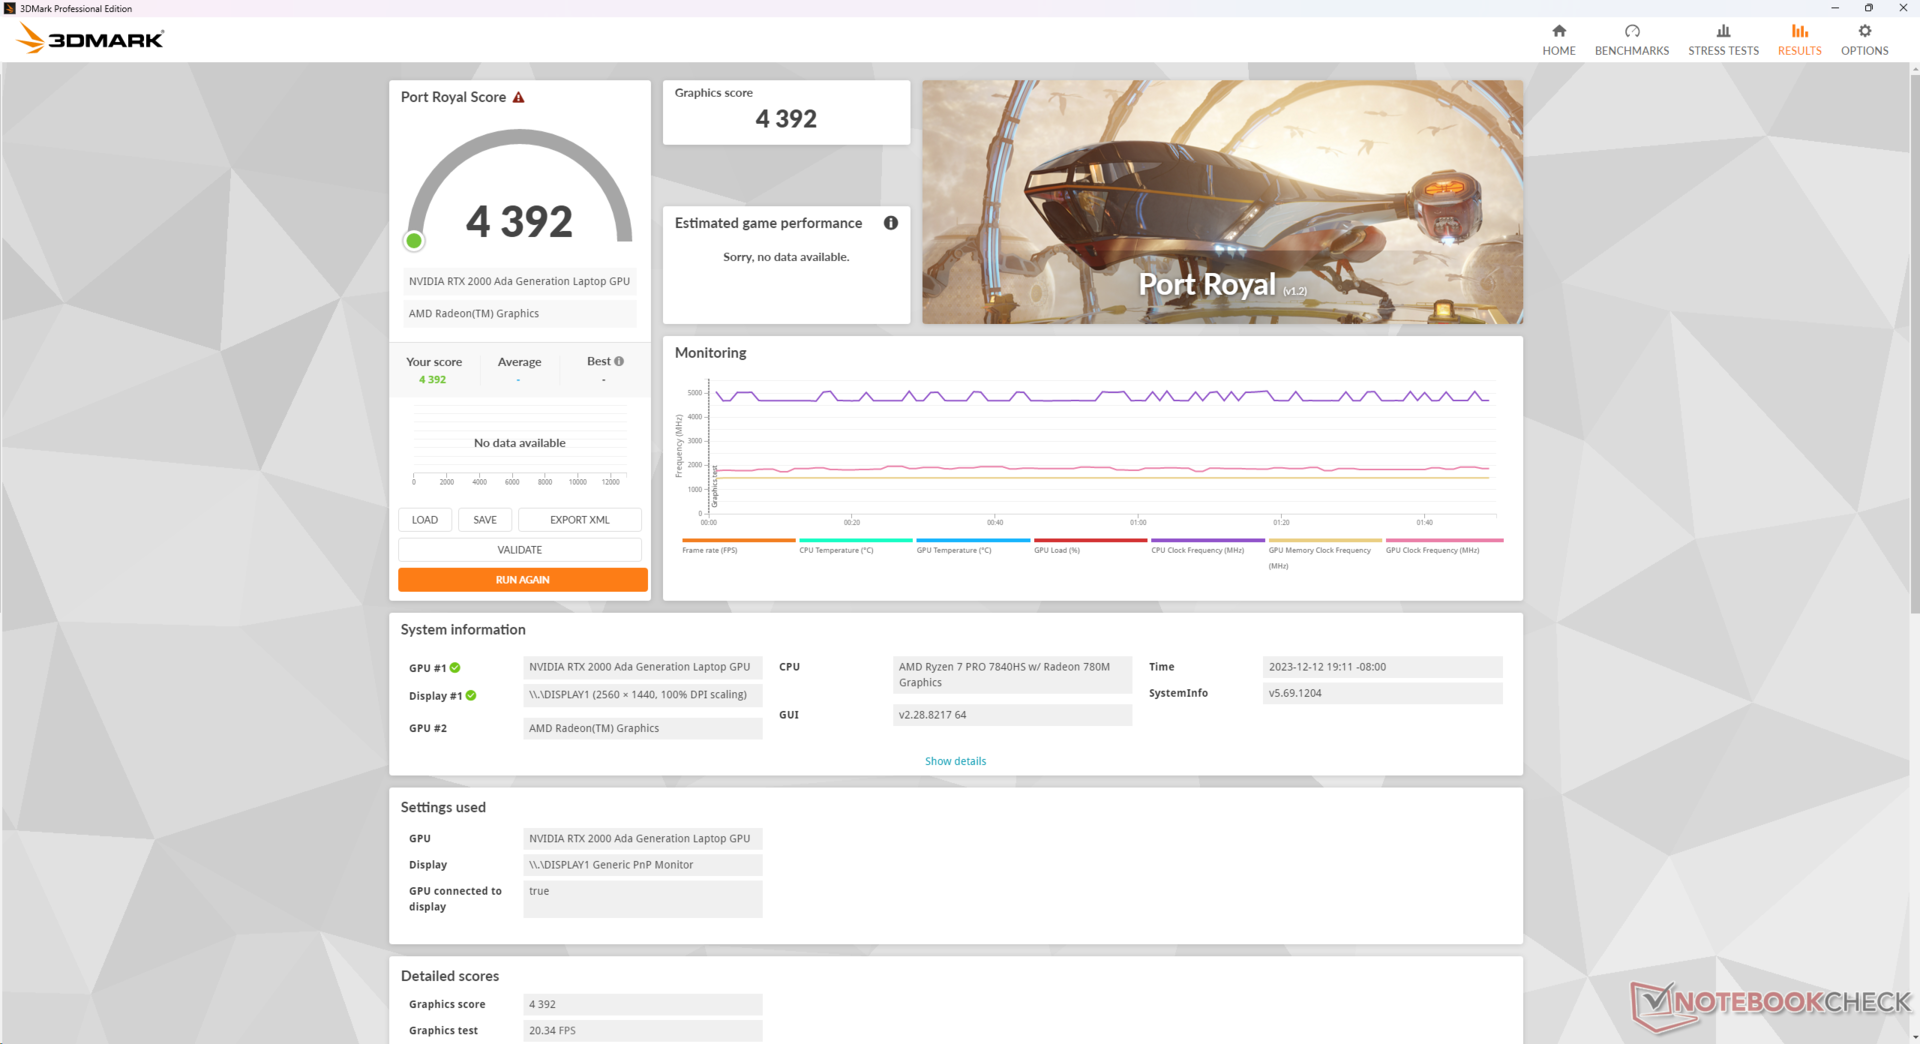
Bu Nvidia RTX 2000 Ada 'e göre gözle görülür bir yükseltmedir RTX A2000 geçen yılki ZBook Power 15 G9'da ve önceki versiyona göre yeni G10 modelini seçmenin önemli bir nedeni. Ham grafik gücü yaklaşık yüzde 55 ila 65 daha hızlı ve SpecViewPerf sonuçları da sürekli olarak daha yüksek.
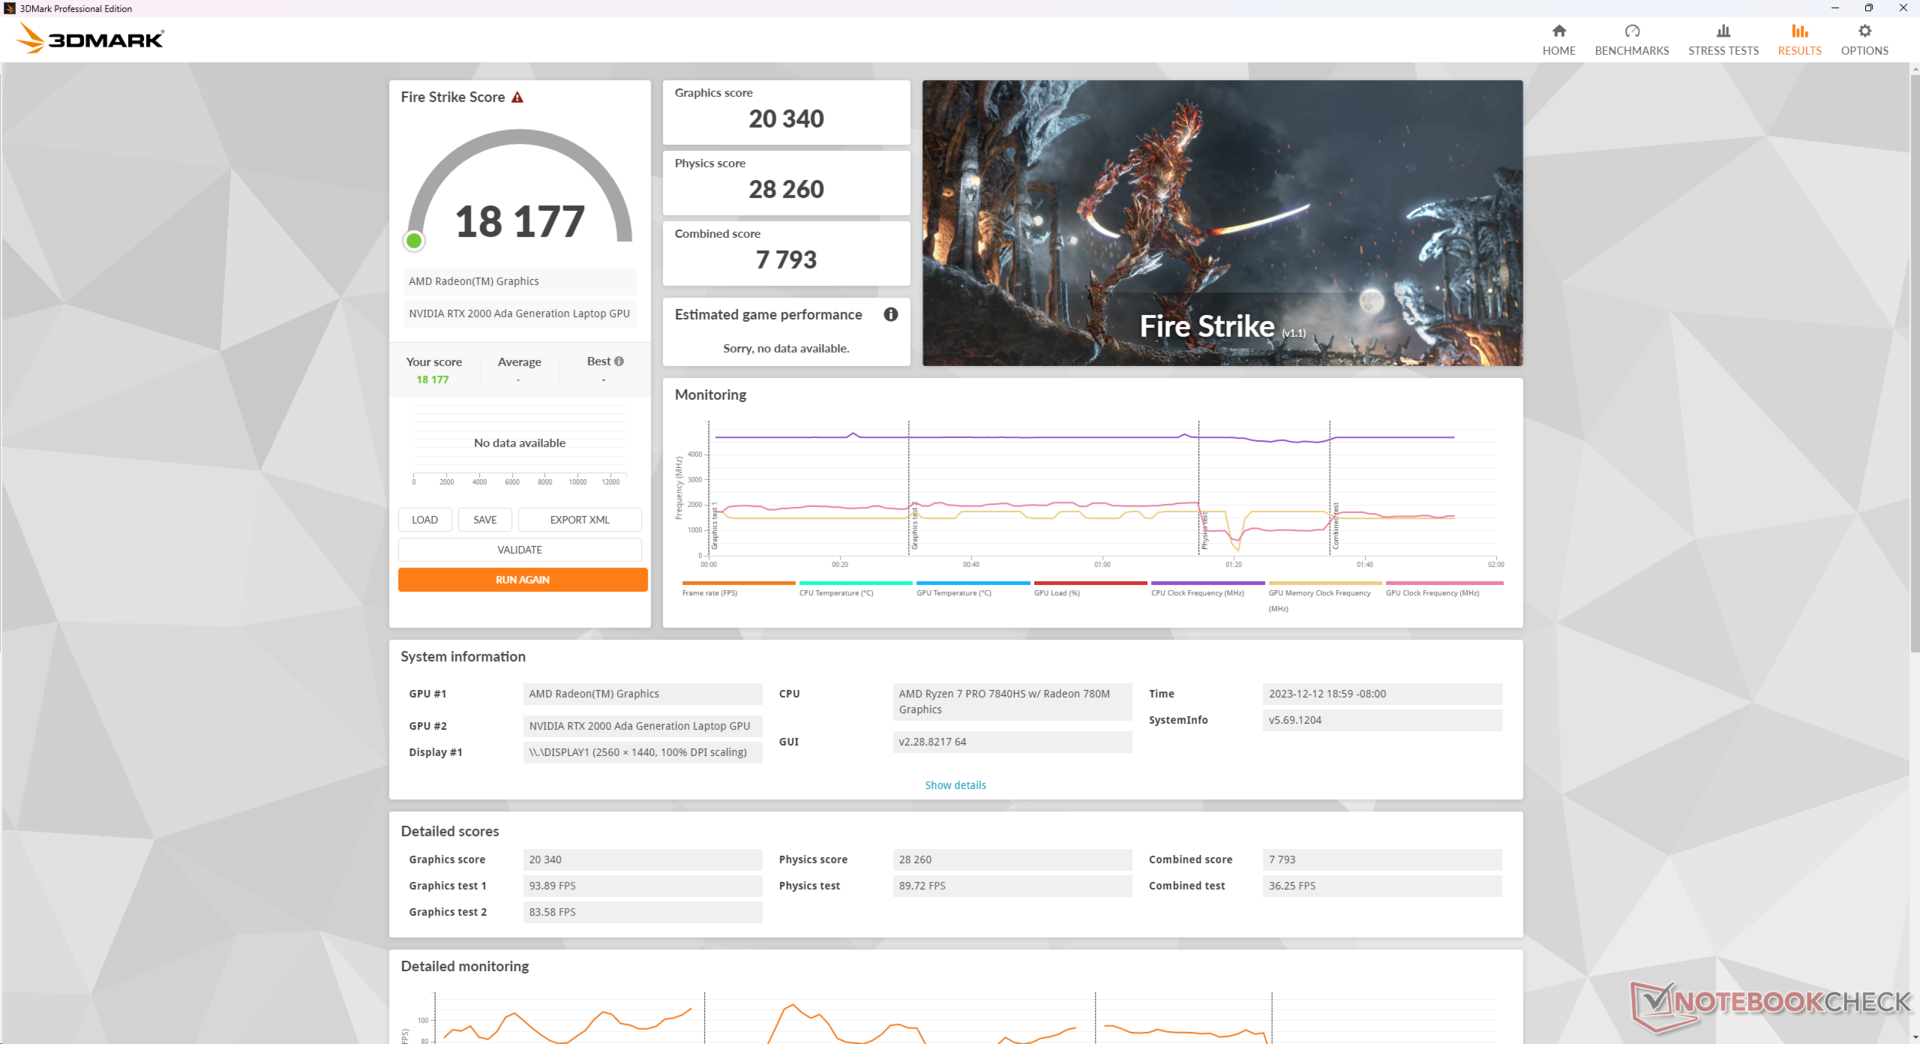
Performans modu yerine Dengeli modda çalıştırmak, aşağıdaki Fire Strike sonuçlarımızda gösterildiği gibi CPU veya GPU performansını etkilemiyor gibi görünüyor. Ancak pil gücüyle çalıştırmak, Performans moduna ayarlanmış olsa bile performansı önemli ölçüde düşürür.
| Güç Profili | Fizik Puanı | Grafik Puanı | Birleşik Puan |
| Performans Modu (şebeke üzerinde) | 28260 | 20340 | 7793 |
| Dengeli Mod (şebeke üzerinde) | 27579 (-0%) | 20812 (-0%) | 7877 (-0%) |
| Performans Modu (pille) | 6105 (-78%) | 12744 (-37%) | 2392 (-69%) |
Sinir bozucu bir şekilde, HP RTX 3000 Ada GPU yalnızca ZBook Power 15 G10'un Intel yapılandırmaları içindir, AMD yapılandırmaları ise RTX 2000 Ada ile sınırlıdır. 3000 Ada GPU, 2000 Ada'ya göre yaklaşık yüzde 5 ila 15 daha hızlı performans sunuyor Dell Precision 5480.
| 3DMark Performance rating - Percent | |
| HP ZBook Fury 16 G10 | |
| Lenovo ThinkPad P1 G6-21FV000DGE -8! | |
| Dell Precision 5480 | |
| Ortalama NVIDIA RTX 2000 Ada Generation Laptop | |
| HP ZBook Power 15 G10 | |
| Asus ExpertBook B6 Flip B6602FC2 -8! | |
| HP ZBook Power 15 G9 6B8C4EA -8! | |
| Lenovo ThinkPad P15v G3 21EM001AGE -1! | |
| Dell Precision 5000 5470 -8! | |
| Lenovo ThinkPad Z16 Gen 2 -25! | |
| Lenovo ThinkPad P15v G2 21A9000XGE -9! | |
| HP ZBook Firefly 14 G10 A -26! | |
| 3DMark 11 Performance | 25876 puan | |
| 3DMark Fire Strike Score | 18177 puan | |
| 3DMark Time Spy Score | 7813 puan | |
Yardım | ||
* ... daha küçük daha iyidir
Oyun Performansı
Genel oyun performansı en çok GeForce RTX 4050 2000 Ada daha fazla birleşik boru hattı, TMU, VRAM ve daha geniş bir bellek bant genişliği entegre etmesine rağmen. Cyberpunk 2077 gibi zorlu oyunlar 1080p ve Extreme ayarlarda oynanabilir, ancak doğal 1440p çözünürlükte oynarken daha düşük ayarlar gerekir.
| Cyberpunk 2077 | |
| 1920x1080 Low Preset (FSR off) | |
| HP ZBook Power 15 G10 | |
| Ortalama NVIDIA RTX 2000 Ada Generation Laptop (81.1 - 85.4, n=2) | |
| Lenovo ThinkPad Z16 Gen 2 | |
| 1920x1080 Medium Preset (FSR off) | |
| HP ZBook Power 15 G10 | |
| Ortalama NVIDIA RTX 2000 Ada Generation Laptop (61.4 - 64.5, n=2) | |
| Lenovo ThinkPad Z16 Gen 2 | |
| 1920x1080 High Preset (FSR off) | |
| HP ZBook Power 15 G10 | |
| Ortalama NVIDIA RTX 2000 Ada Generation Laptop (51.7 - 55.2, n=2) | |
| Lenovo ThinkPad Z16 Gen 2 | |
| 1920x1080 Ultra Preset (FSR off) | |
| HP ZBook Power 15 G10 | |
| Ortalama NVIDIA RTX 2000 Ada Generation Laptop (44.8 - 48.3, n=2) | |
| Lenovo ThinkPad Z16 Gen 2 | |
| 2560x1440 Ultra Preset (FSR off) | |
| HP ZBook Power 15 G10 | |
| Ortalama NVIDIA RTX 2000 Ada Generation Laptop (29.7 - 29.9, n=2) | |
| Lenovo ThinkPad Z16 Gen 2 | |
| 1920x1080 Ray Tracing Ultra Preset (DLSS off) | |
| HP ZBook Power 15 G10 | |
| Ortalama NVIDIA RTX 2000 Ada Generation Laptop (19.2 - 21.6, n=2) | |
| Lenovo ThinkPad Z16 Gen 2 | |
Witcher 3 FPS Chart
| düşük | orta | yüksek | ultra | QHD | |
|---|---|---|---|---|---|
| GTA V (2015) | 178.1 | 170.6 | 157.7 | 86.2 | 60.6 |
| The Witcher 3 (2015) | 336.4 | 219 | 127.9 | 65.5 | |
| Dota 2 Reborn (2015) | 155 | 140.8 | 136.9 | 132 | |
| Final Fantasy XV Benchmark (2018) | 173.3 | 93.5 | 67.7 | 50.3 | |
| X-Plane 11.11 (2018) | 80.6 | 73 | 52.5 | ||
| Far Cry 5 (2018) | 151 | 110 | 102 | 95 | 63 |
| Strange Brigade (2018) | 332 | 183 | 148.4 | 132.5 | 94.1 |
| Tiny Tina's Wonderlands (2022) | 119.8 | 110.5 | 77.3 | 62.3 | 43.5 |
| F1 22 (2022) | 166.7 | 151.8 | 119.9 | 44.2 | 28.9 |
| Cyberpunk 2077 (2023) | 85.4 | 64.5 | 55.2 | 48.3 | 29.9 |
Emisyonlar
Sistem Gürültüsü
Fan gürültüsü, performans farklılıklarına rağmen benzer minimum ve maksimum değerlerle geçen yılki modelle temelde aynı. Ne olursa olsun, G10 ünitemizin dahili fanları 3DMark 06'yı çalıştırırken G9 ünitemizden biraz daha uzun süre daha sessiz kalabiliyor, ancak bu elbette başlangıçtaki sıcaklık koşullarına bağlı.
Çalışırken fan gürültüsü Witcher 3 dengeli ve Performans modları arasında aynı kalacaktır, bu da iki güç profili arasında minimum fark gösteren test sonuçlarımızla ilişkilidir.
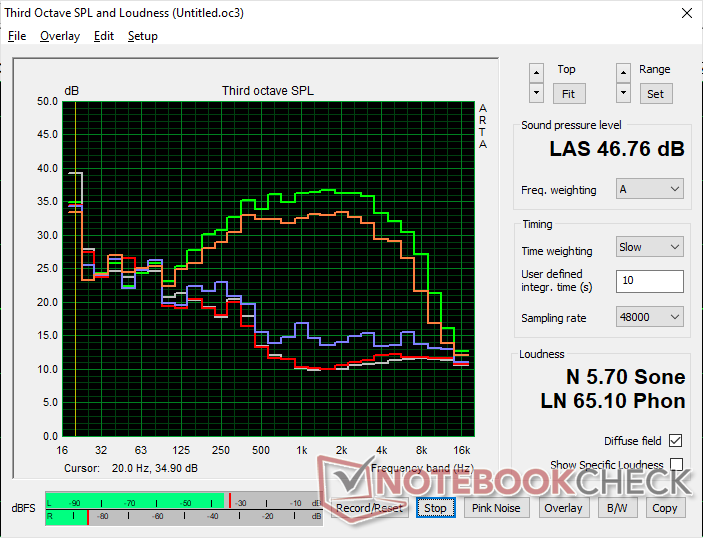
Ses yüksekliği
| Boşta |
| 24.4 / 24.4 / 24.4 dB |
| Çalışırken |
| 27.4 / 46.8 dB |
 | ||
30 dB sessiz 40 dB(A) duyulabilirlik 50 dB(A) gürültülü |
||
min: | ||
| HP ZBook Power 15 G10 RTX 2000 Ada Generation Laptop, R7 PRO 7840HS, WDC PC SN810 2TB | HP ZBook Power 15 G9 6B8C4EA RTX A2000 Laptop GPU, i7-12700H, Samsung PM9A1 MZVL21T0HCLR | Lenovo ThinkPad P15v G3 21EM001AGE RTX A2000 Laptop GPU, R7 PRO 6850H, SK Hynix PC711 1TB HFS001TDE9X081N | Dell Precision 5000 5560 RTX A2000 Laptop GPU, i7-11850H, Samsung PM9A1 MZVL22T0HBLB | Lenovo ThinkPad P1 G6-21FV000DGE RTX 2000 Ada Generation Laptop, i9-13900H, SK Hynix PC711 1TB HFS001TDE9X084N | Asus ExpertBook B6 Flip B6602FC2 RTX A2000 Laptop GPU, i9-12950HX, Samsung PM9A1 MZVL21T0HCLR | |
|---|---|---|---|---|---|---|
| Noise | -8% | 3% | 5% | -10% | -34% | |
| kapalı / ortam * (dB) | 24.2 | 23.8 2% | 23.2 4% | 23.4 3% | 24.5 -1% | 26 -7% |
| Idle Minimum * (dB) | 24.4 | 23.8 2% | 23.2 5% | 23.6 3% | 24.5 -0% | 32.4 -33% |
| Idle Average * (dB) | 24.4 | 23.8 2% | 23.2 5% | 23.6 3% | 24.5 -0% | 32.4 -33% |
| Idle Maximum * (dB) | 24.4 | 23.8 2% | 23.2 5% | 23.6 3% | 24.5 -0% | 32.4 -33% |
| Load Average * (dB) | 27.4 | 42.9 -57% | 35 -28% | 25.8 6% | 48 -75% | 51.9 -89% |
| Witcher 3 ultra * (dB) | 43.3 | 44.5 -3% | 37.9 12% | 40.1 7% | 40.7 6% | |
| Load Maximum * (dB) | 46.8 | 47.9 -2% | 37.5 20% | 41.4 12% | 48 -3% | 52.1 -11% |
* ... daha küçük daha iyidir
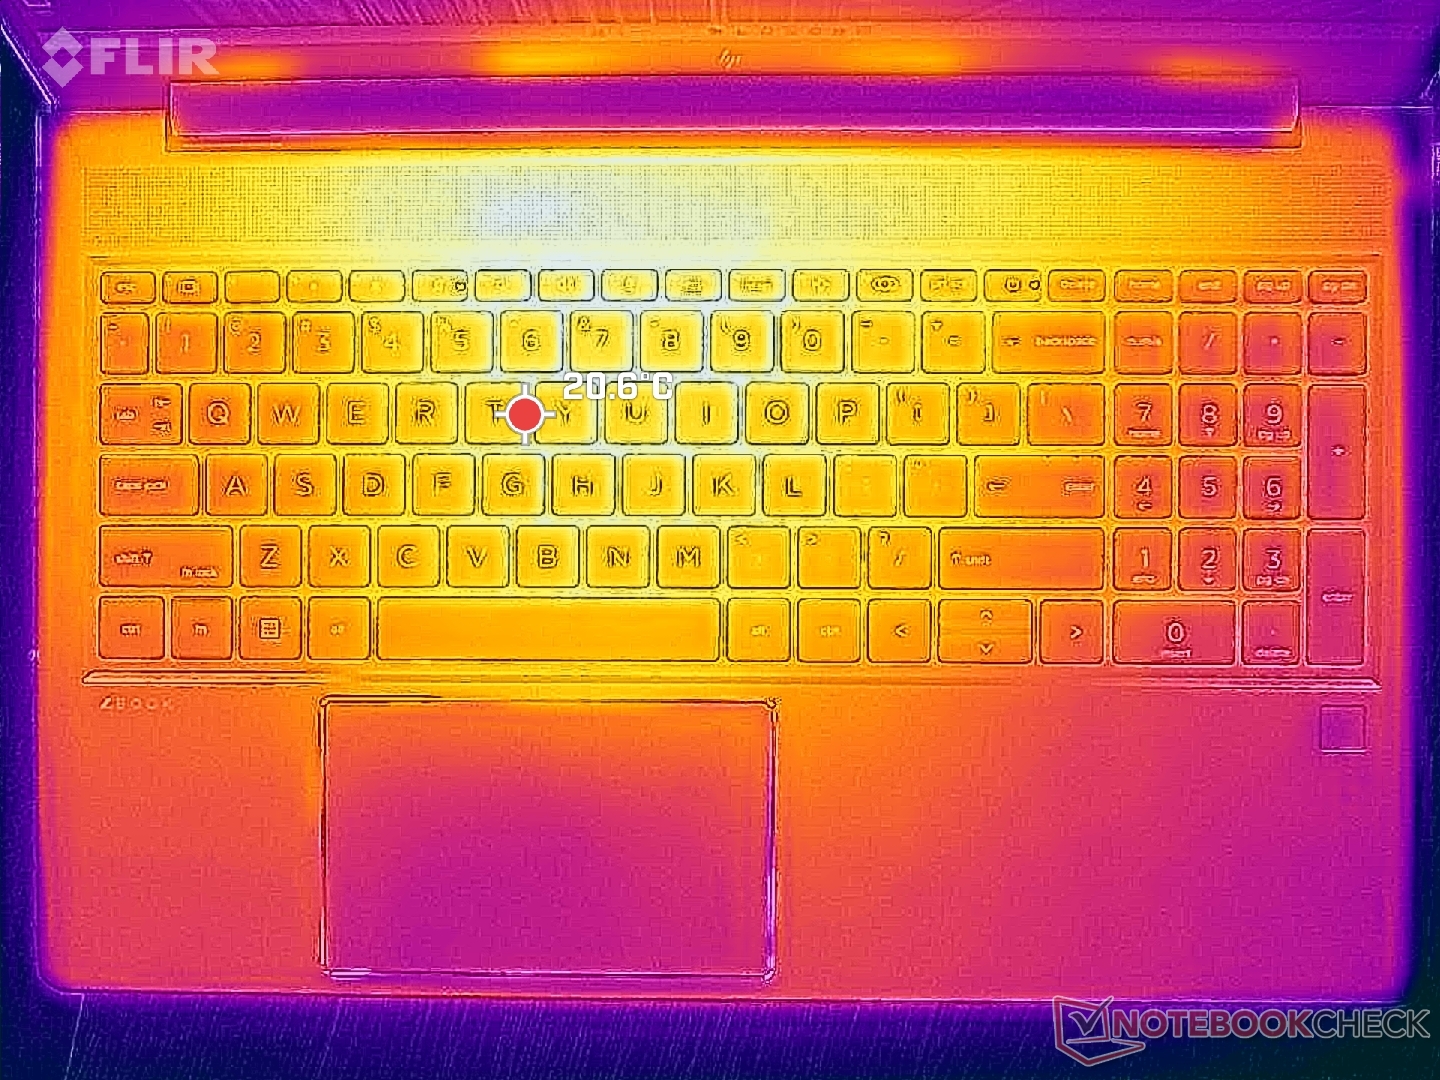
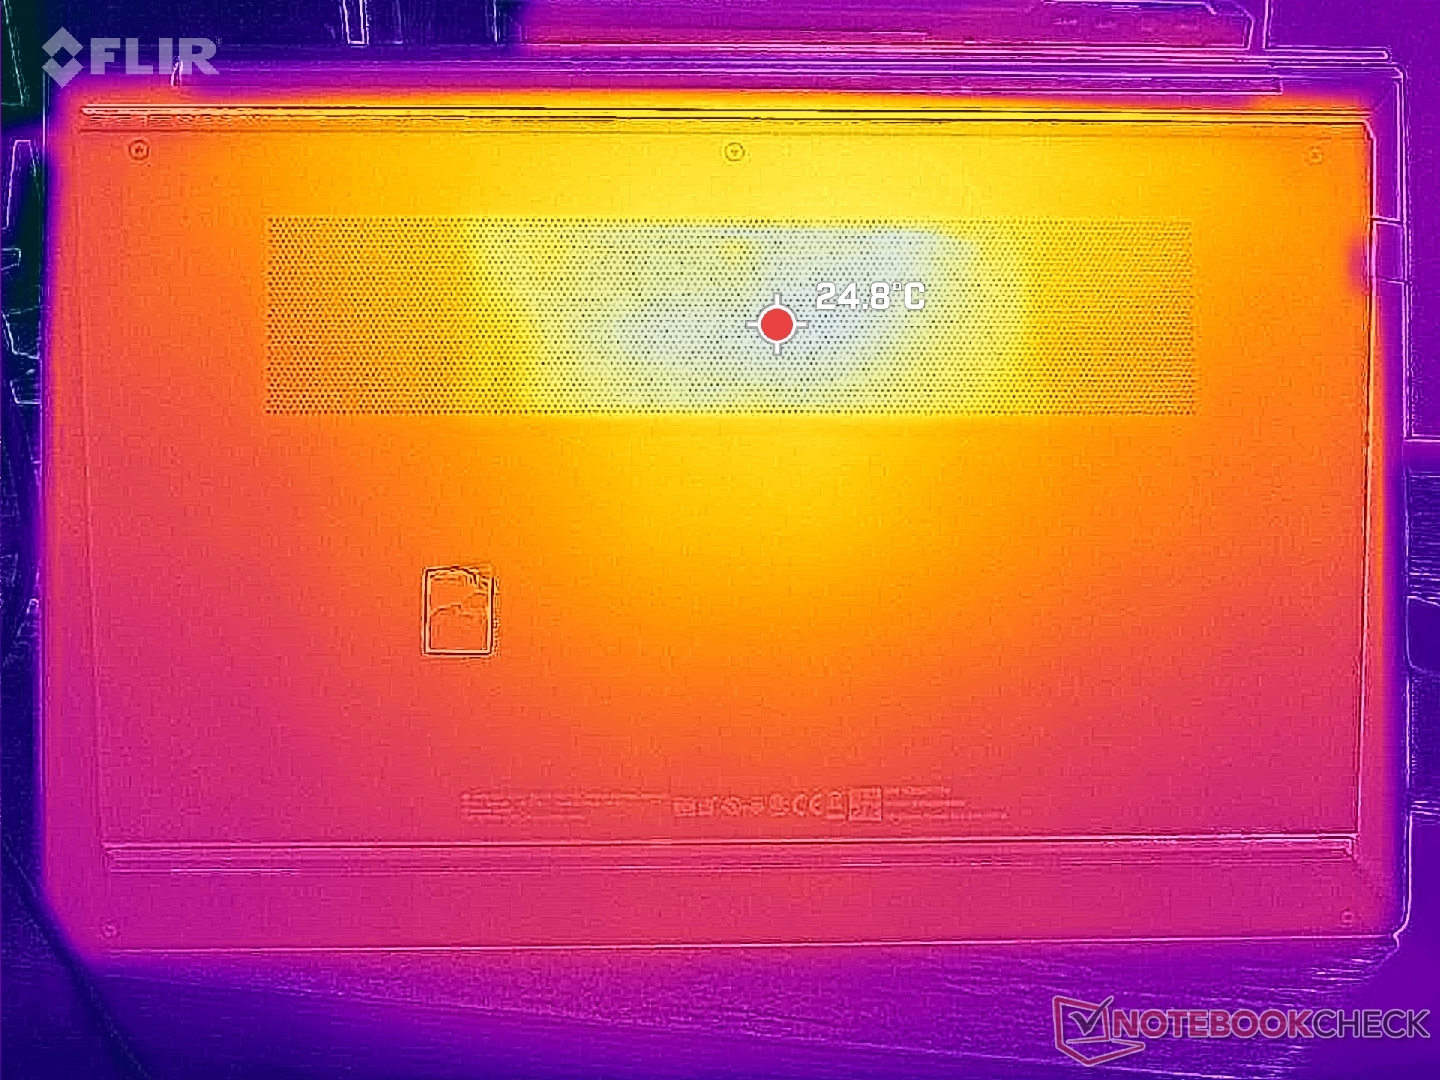
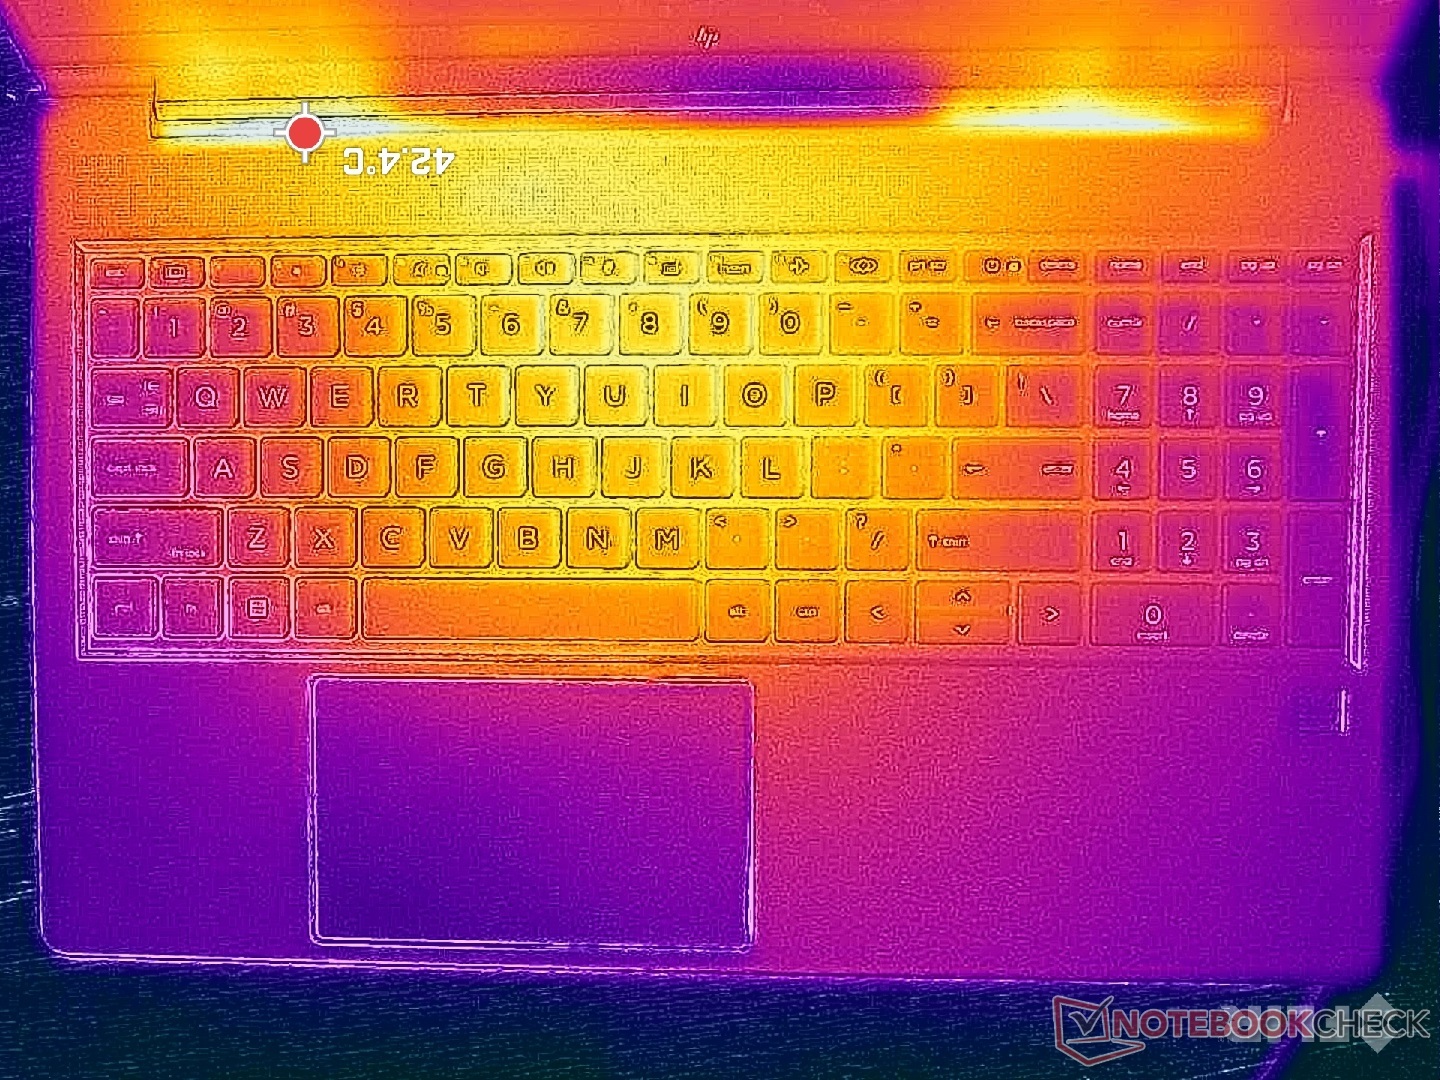
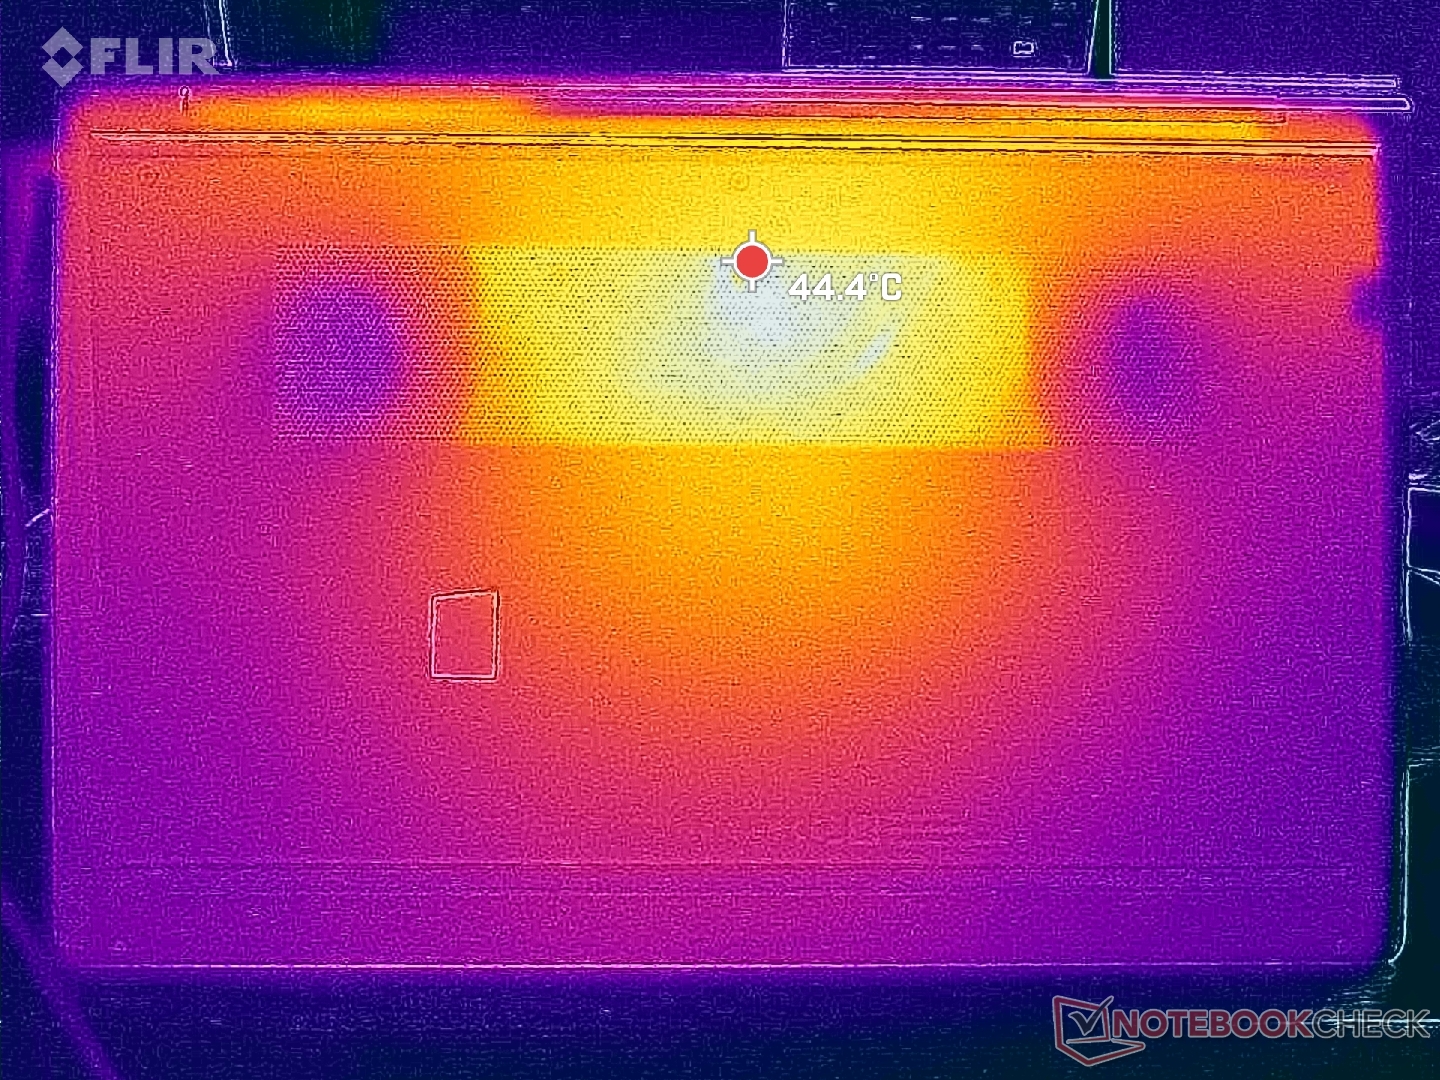
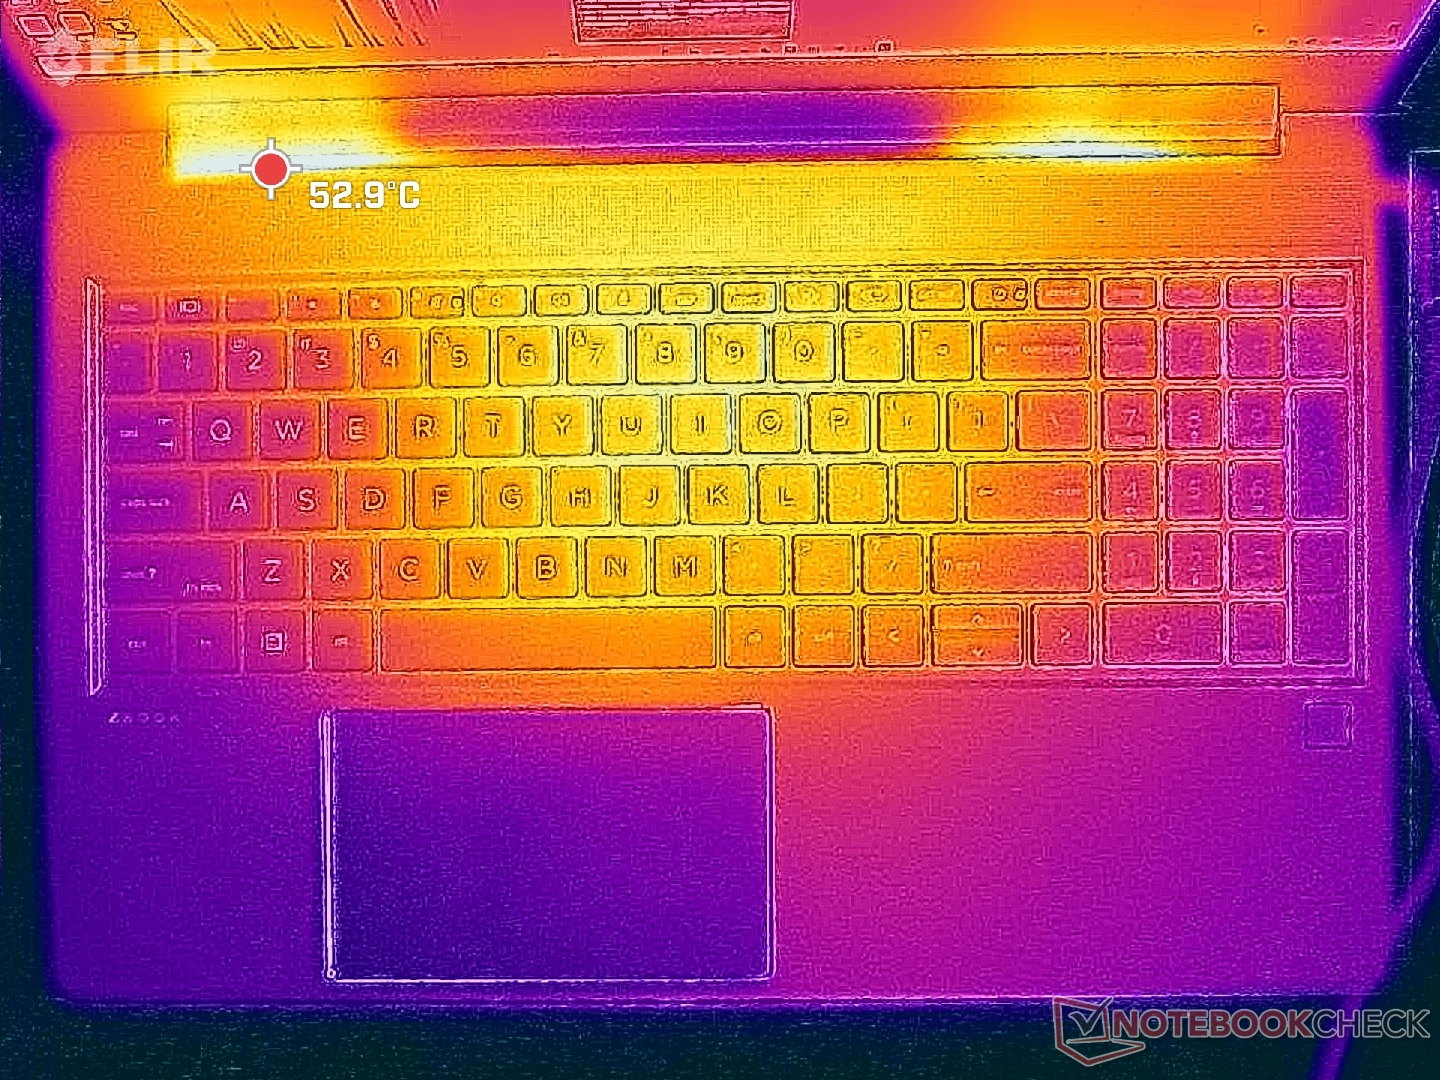
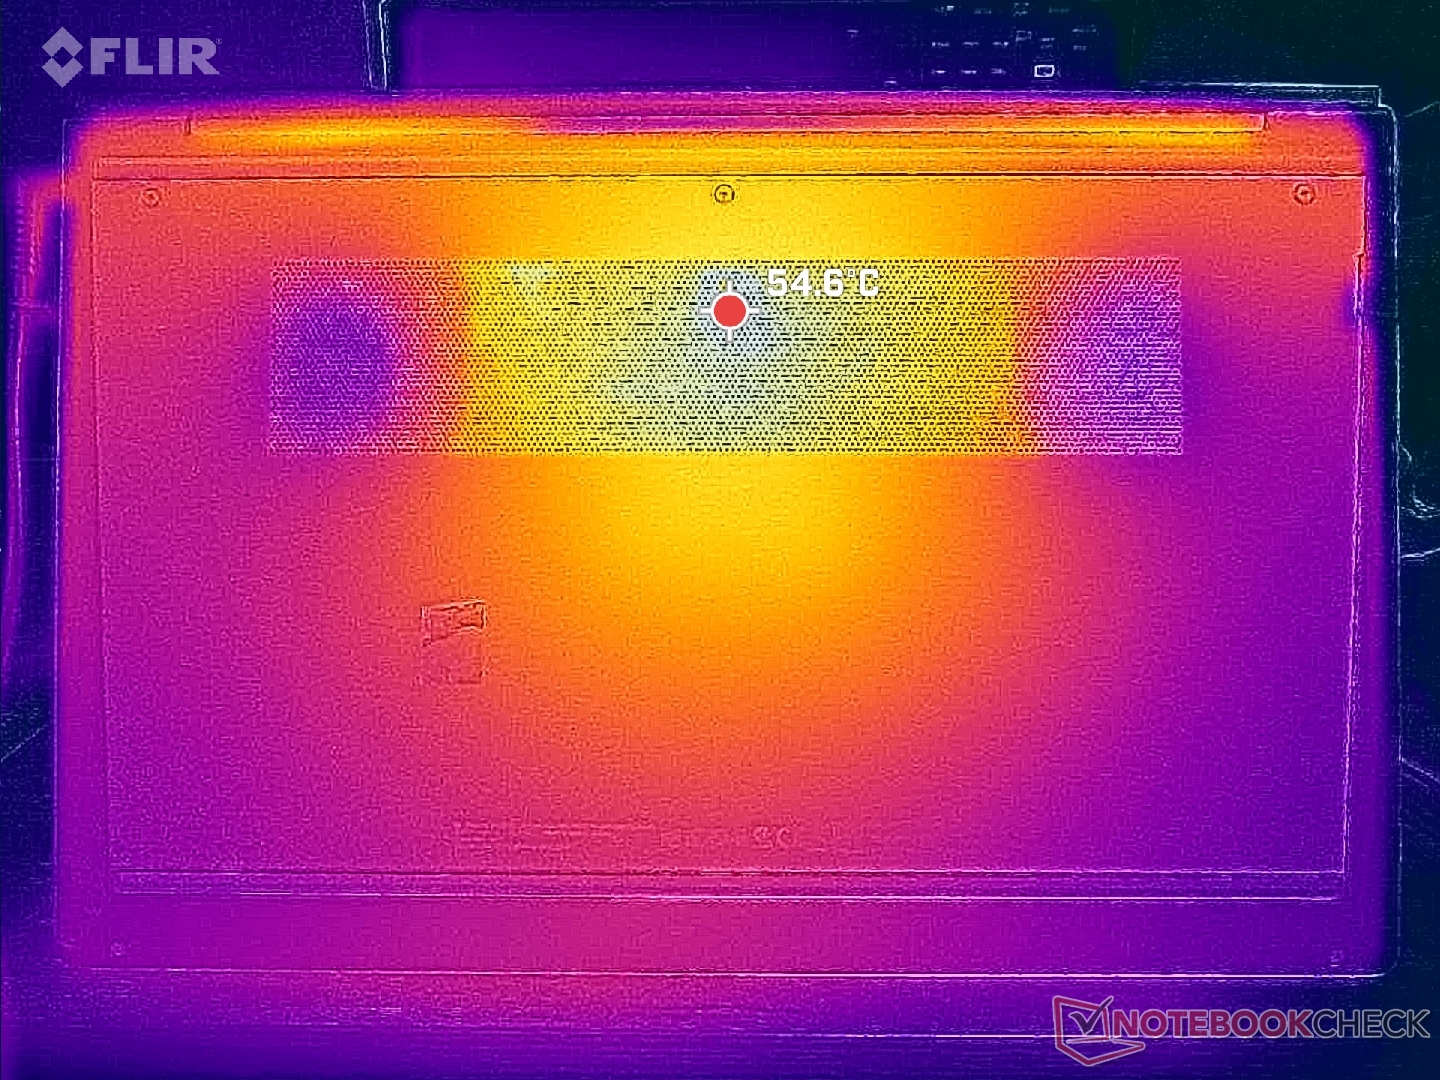
Sıcaklık
Yüzey sıcaklıkları merkeze doğru en sıcak ve klavyenin yanları veya kasanın kenarları boyunca daha soğuktur. Klavyenin ortasındaki ve altındaki sıcak noktalar 42 C'nin üzerine çıkabilir, bu da rakiplerine göre birkaç derece daha soğuktur ThinkPad P1 G6 aynı RTX 2000 GPU ile.
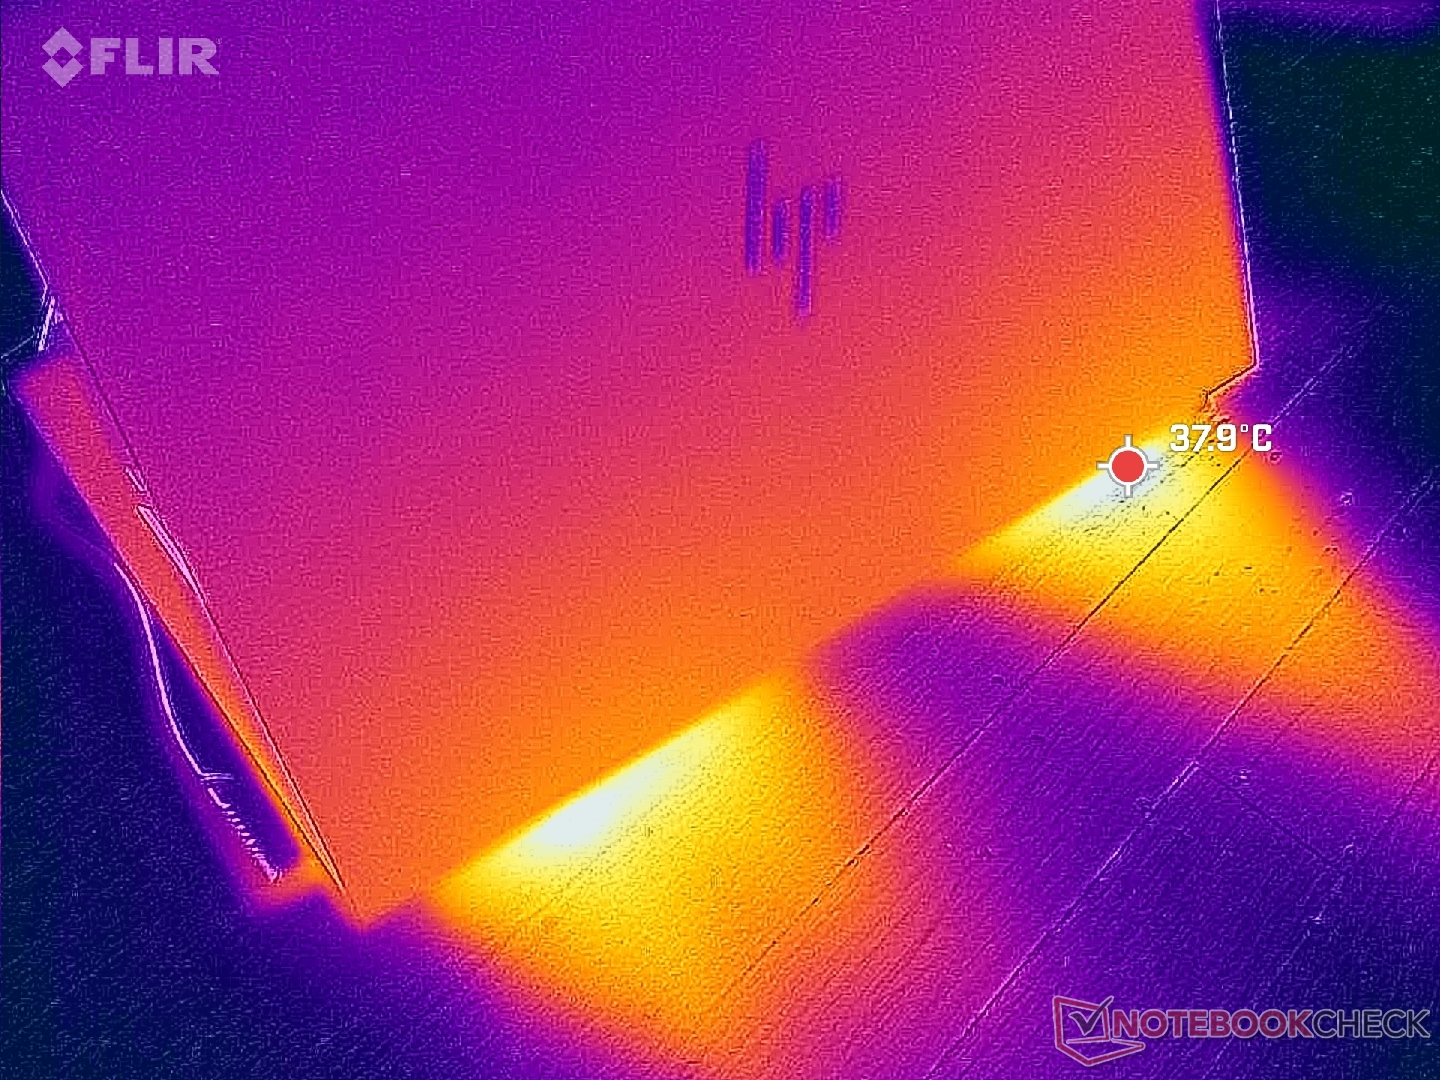
(±) Üst taraftaki maksimum sıcaklık, 38.2 °C / 101 F ortalamasına kıyasla 42.4 °C / 108 F'dir. , Workstation sınıfı için 22.2 ile 69.8 °C arasında değişir.
(-) Alt kısım, 41.1 °C / 106 F ortalamasına kıyasla maksimum 47.8 °C / 118 F'ye kadar ısınır
(+) Boşta kullanımda, üst tarafın ortalama sıcaklığı 24.4 °C / 76 F olup, cihazın 32 °C / 90 F.
(+) The Witcher 3 oynarken, üst tarafın ortalama sıcaklığı 31.2 °C / 88 F olup, cihazın 32 °C / 90 F.
(+) Avuç içi dayanakları ve dokunmatik yüzey, maksimum 27.6 °C / 81.7 F ile cilt sıcaklığından daha soğuktur ve bu nedenle dokunulduğunda soğuktur.
(±) Benzer cihazların avuç içi dayanağı alanının ortalama sıcaklığı 27.8 °C / 82 F (+0.2 °C / 0.3 F) idi.
| HP ZBook Power 15 G10 AMD Ryzen 7 PRO 7840HS, NVIDIA RTX 2000 Ada Generation Laptop | HP ZBook Power 15 G9 6B8C4EA Intel Core i7-12700H, NVIDIA RTX A2000 Laptop GPU | Lenovo ThinkPad P15v G3 21EM001AGE AMD Ryzen 7 PRO 6850H, NVIDIA RTX A2000 Laptop GPU | Dell Precision 5000 5560 Intel Core i7-11850H, NVIDIA RTX A2000 Laptop GPU | Lenovo ThinkPad P1 G6-21FV000DGE Intel Core i9-13900H, NVIDIA RTX 2000 Ada Generation Laptop | Asus ExpertBook B6 Flip B6602FC2 Intel Core i9-12950HX, NVIDIA RTX A2000 Laptop GPU | |
|---|---|---|---|---|---|---|
| Heat | 7% | -2% | -16% | -9% | -10% | |
| Maximum Upper Side * (°C) | 42.4 | 40.3 5% | 48.7 -15% | 48.2 -14% | 47.1 -11% | 48.4 -14% |
| Maximum Bottom * (°C) | 47.8 | 48.3 -1% | 50.5 -6% | 42.6 11% | 56.5 -18% | 52.3 -9% |
| Idle Upper Side * (°C) | 26.8 | 23.7 12% | 25 7% | 34.8 -30% | 28.1 -5% | 27.8 -4% |
| Idle Bottom * (°C) | 27.2 | 23.8 12% | 25.4 7% | 35.2 -29% | 27.6 -1% | 30.3 -11% |
* ... daha küçük daha iyidir
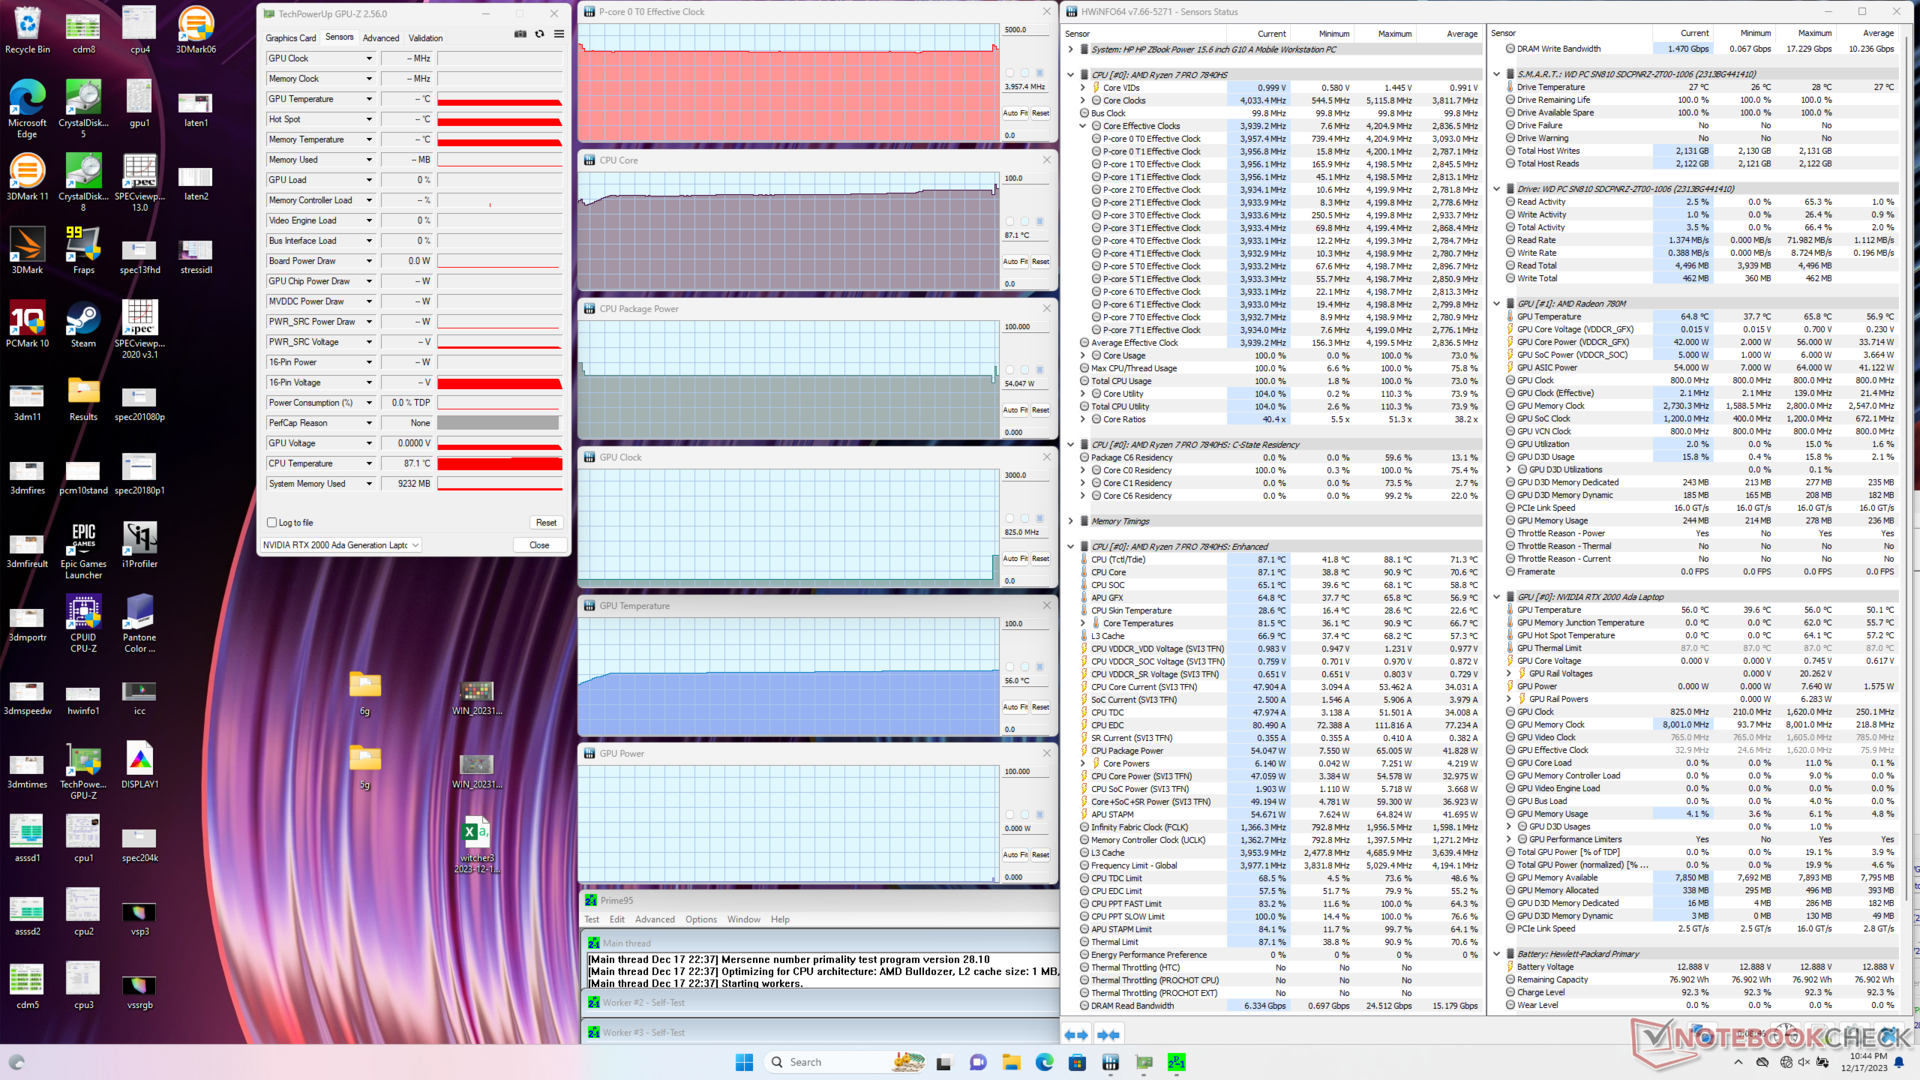
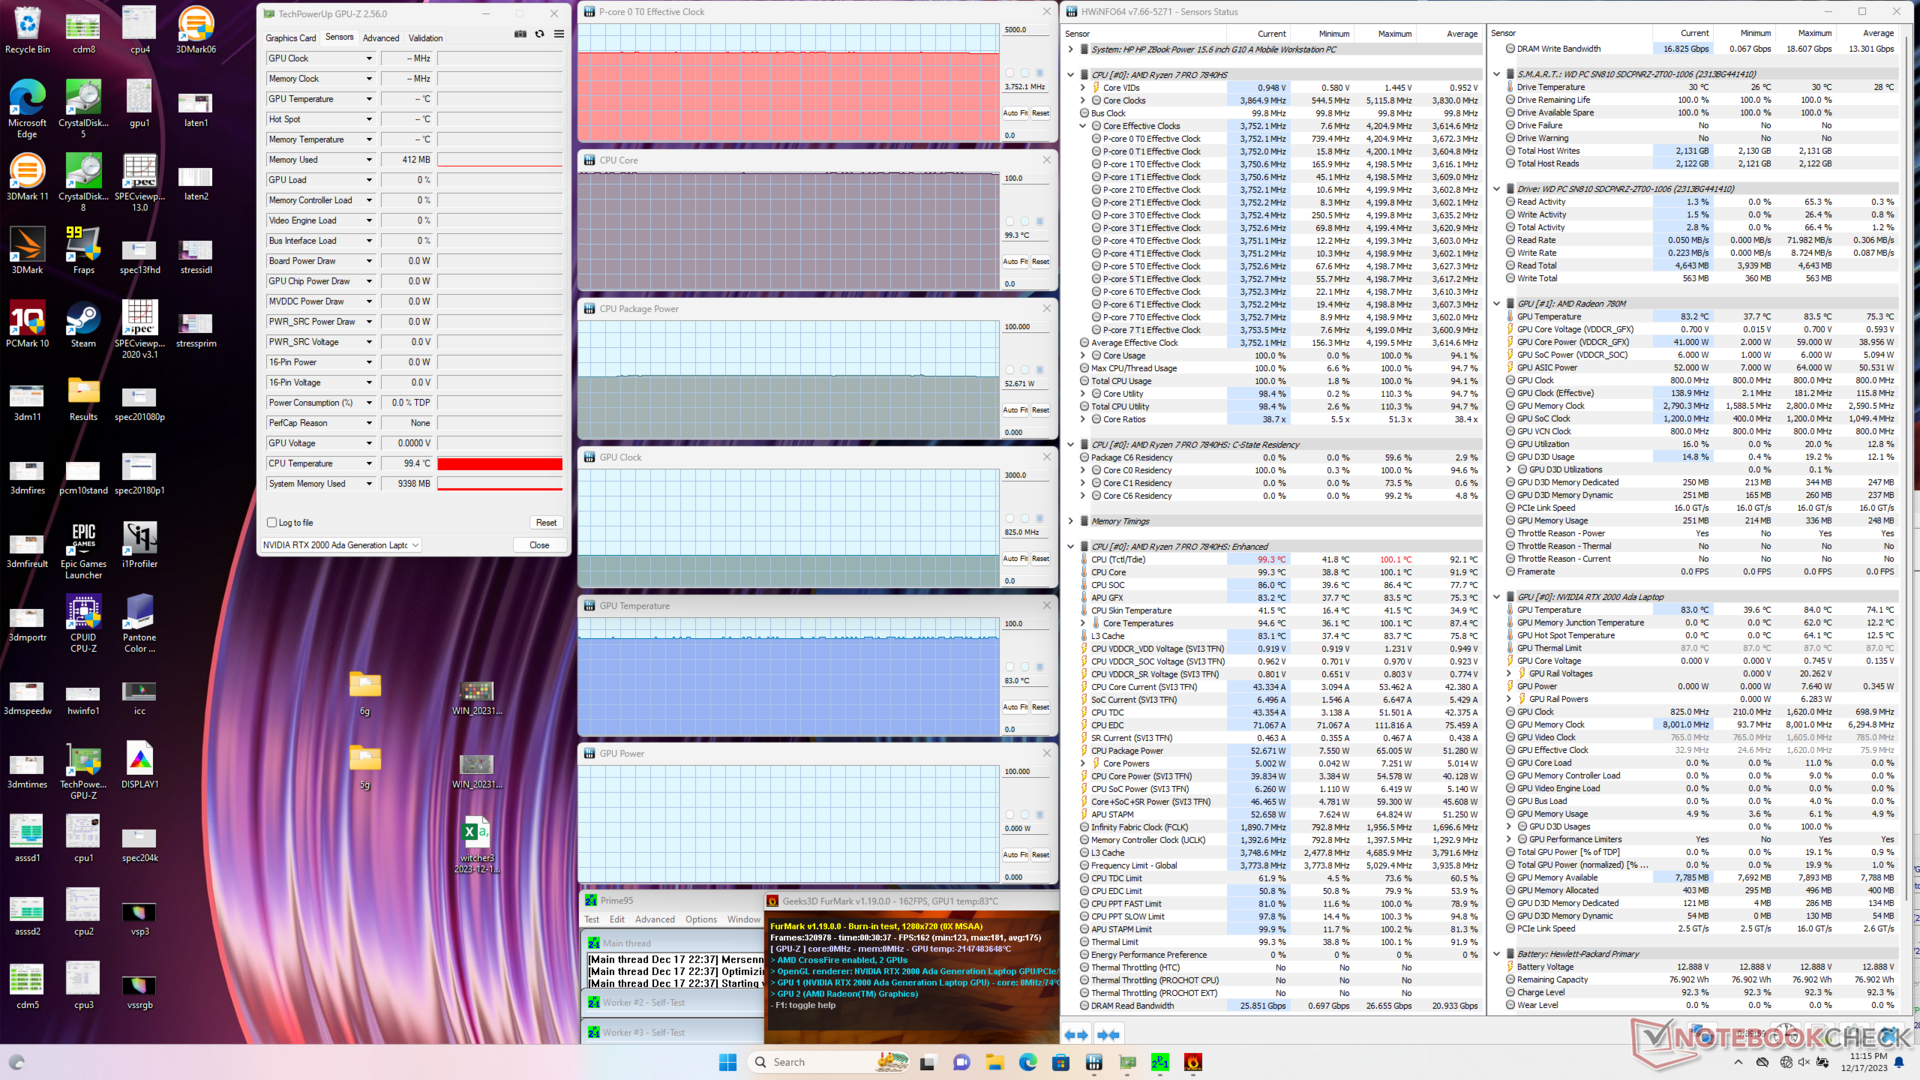
Stres Testi
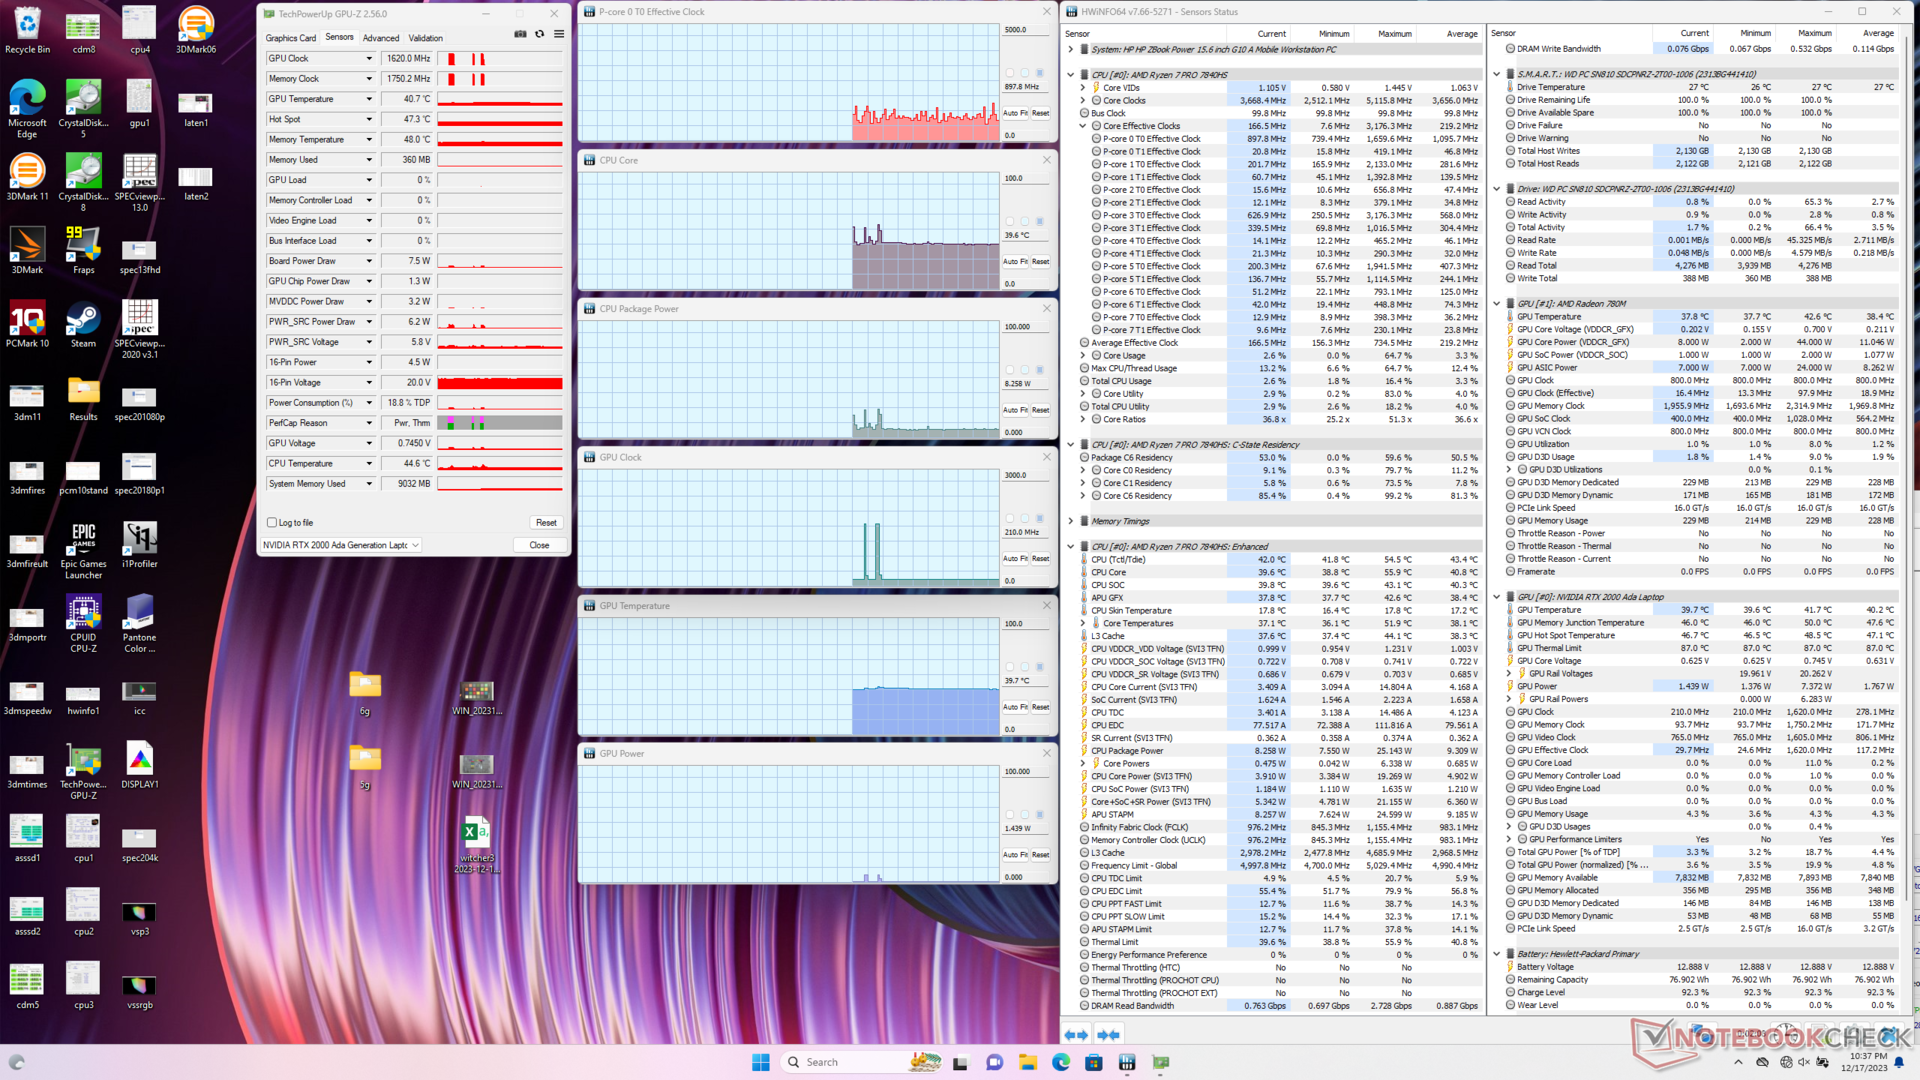
Prime95 ile zorlandığında, CPU hafifçe düşüp 4,0 GHz ve 54 W'da sabitlenmeden önce sadece ilk birkaç saniye için 4,2 GHz ve 65 W'a yükselir. Çekirdek sıcaklığı 87 C'de oldukça sıcak olur, ancak bu, Zen 4 ile çalışan birçok dizüstü bilgisayar söz konusu olduğunda kurala uygun olabilir. Bu testin tekrarlanması ThinkPad Z16 G2örneğin, Ryzen 9 CPU'sunun daha da sıcak olan 100 C'de sabitlenmesine neden olur.
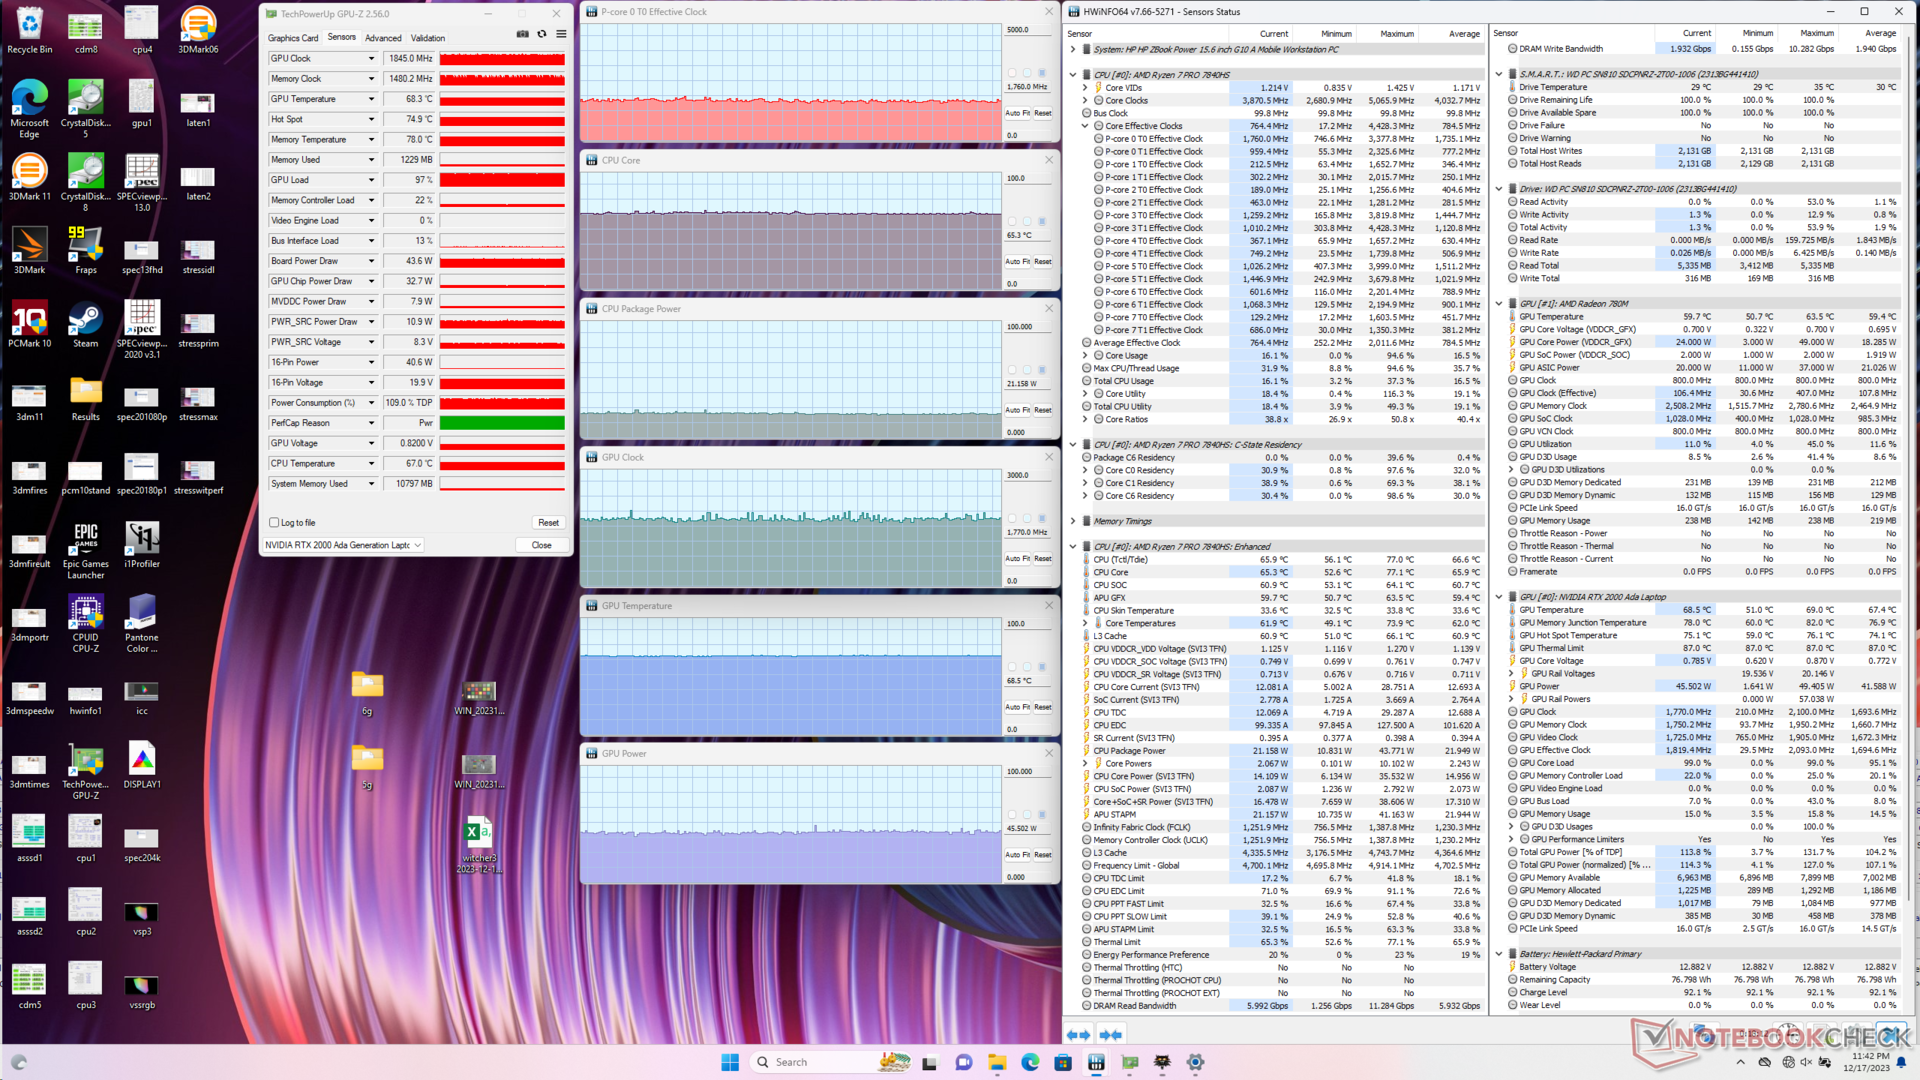
Çalışıyor Witcher 3 dengeli modda, yukarıdaki bölümde yer alan Fire Strike gözlemlerimizle uyumlu olan Performans moduna kıyasla sıcaklıklarda veya saat hızlarında önemli bir fark görülmeyecektir. GPU kartı güç çekişi 50 W hedefine karşılık 44 W civarında seyredecektir.
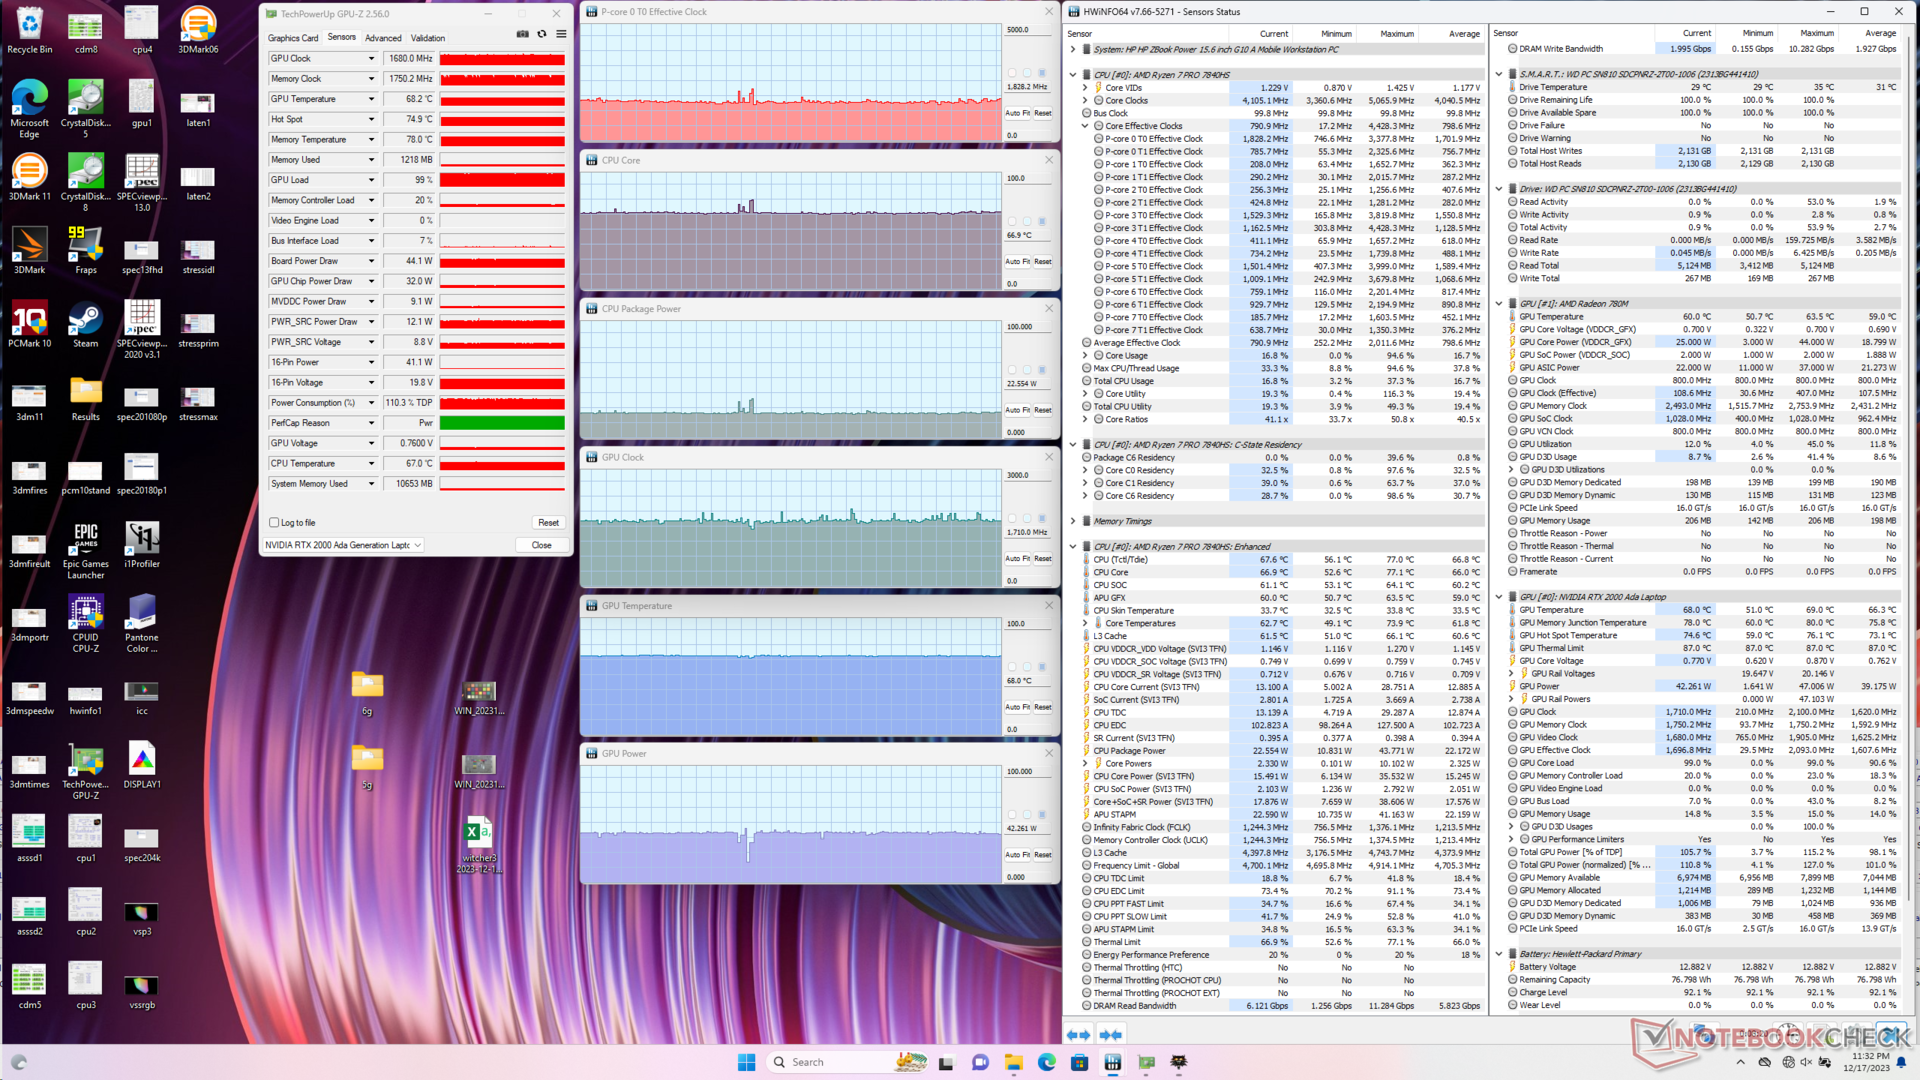
| CPU Saati (GHz) | GPU Saati (MHz) | Ortalama CPU Sıcaklığı (°C) | Ortalama GPU Sıcaklığı (°C) | |
| Sistem Boşta | -- | -- | 40 | 40 |
| Prime95 Stres | 4.0 | -- | 87 | 56 |
| Prime95 + FurMark Stres | 3.8 | 825 | 99 | 83 |
| Witcher 3 Stres (Dengeli mod) | 1.8 | 1770 | 65 | 69 |
| Witcher 3 Stres (Performans modu) | 1.8 | 1710 | 67 | 68 |
Enerji Yönetimi
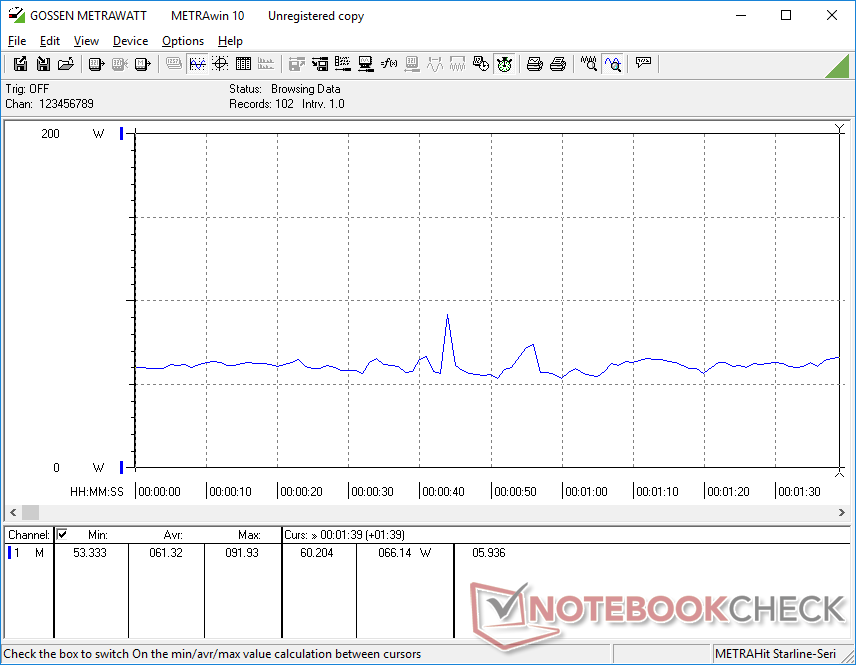
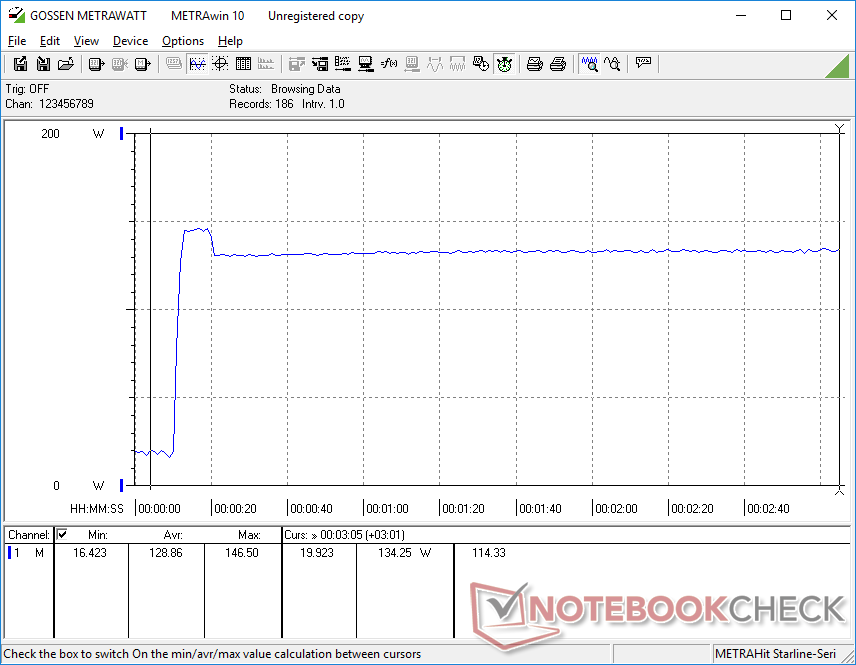
Güç Tüketimi
Genel güç tüketimi geçen yılki modelden daha yüksektir ve bu da konfigürasyonumuzun daha yüksek performansıyla ilişkilidir. Ancak, özellikle grafik performansı söz konusu olduğunda watt başına performans hala yeni modelimizin lehine. Örneğin, Prime95'i çalıştırmak ZBook Power 15 G9'daki Core i7-12700H'ye göre yüzde 20 daha hızlı çoklu iş parçacığı performansı için yüzde 16 daha fazla güç gerektirirken, FurMark'ı çalıştırmak yüzde 65'e kadar daha fazla grafik performansı için sadece yüzde 14 daha fazla güç gerektiriyor.
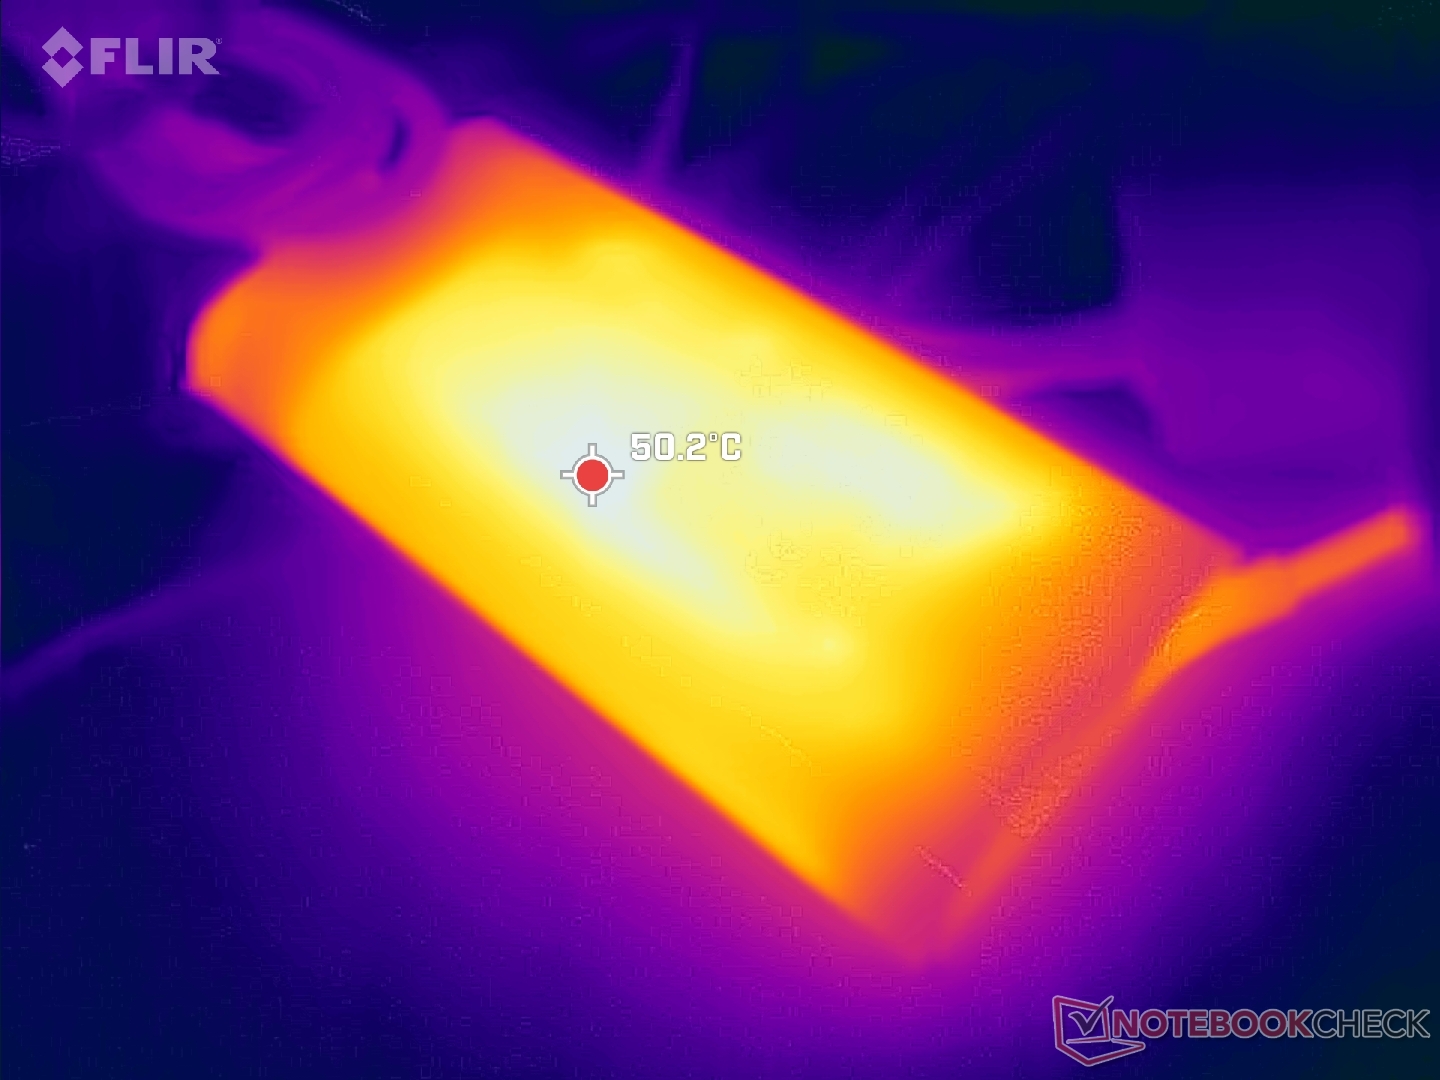
Orta büyüklükteki (~13,8 x 6,5 x 2,3 cm) 150 W AC adaptörü, ZBook Power 15 G10, ZBook Power 15 G9 ile aynı güç zarfı altında çalıştığı için değişmedi. USB-C şarjı yine de desteklenmektedir; örneğin Lenovo'nun 135 W USB-C şarj cihazı HP test ünitemizle uyumludur.
| Kapalı / Bekleme modu | |
| Boşta | |
| Çalışırken |
|
Key:
min: | |
| HP ZBook Power 15 G10 R7 PRO 7840HS, RTX 2000 Ada Generation Laptop, WDC PC SN810 2TB, IPS, 2560x1440, 15.6" | HP ZBook Power 15 G9 6B8C4EA i7-12700H, RTX A2000 Laptop GPU, Samsung PM9A1 MZVL21T0HCLR, IPS, 3840x2160, 15.6" | Lenovo ThinkPad P15v G3 21EM001AGE R7 PRO 6850H, RTX A2000 Laptop GPU, SK Hynix PC711 1TB HFS001TDE9X081N, IPS LED, 3840x2160, 15.6" | Dell Precision 5000 5560 i7-11850H, RTX A2000 Laptop GPU, Samsung PM9A1 MZVL22T0HBLB, IPS, 3840x2400, 15.6" | Lenovo ThinkPad P1 G6-21FV000DGE i9-13900H, RTX 2000 Ada Generation Laptop, SK Hynix PC711 1TB HFS001TDE9X084N, IPS, 2560x1600, 16" | Asus ExpertBook B6 Flip B6602FC2 i9-12950HX, RTX A2000 Laptop GPU, Samsung PM9A1 MZVL21T0HCLR, IPS, 2560x1600, 16" | |
|---|---|---|---|---|---|---|
| Power Consumption | 11% | -11% | -24% | -30% | -81% | |
| Idle Minimum * (Watt) | 5.3 | 3.9 26% | 6.3 -19% | 6.2 -17% | 8.3 -57% | 10.5 -98% |
| Idle Average * (Watt) | 9.9 | 7.2 27% | 13.9 -40% | 13.9 -40% | 14.5 -46% | 11.9 -20% |
| Idle Maximum * (Watt) | 16.7 | 8.5 49% | 14.5 13% | 23.8 -43% | 15.3 8% | 18 -8% |
| Load Average * (Watt) | 61.3 | 87.2 -42% | 82.8 -35% | 95.7 -56% | 91.8 -50% | 182 -197% |
| Witcher 3 ultra * (Watt) | 87.9 | 86.8 1% | 88.8 -1% | 87 1% | 104.7 -19% | 177.5 -102% |
| Load Maximum * (Watt) | 145.3 | 139 4% | 124.8 14% | 132.6 9% | 164.5 -13% | 229 -58% |
* ... daha küçük daha iyidir
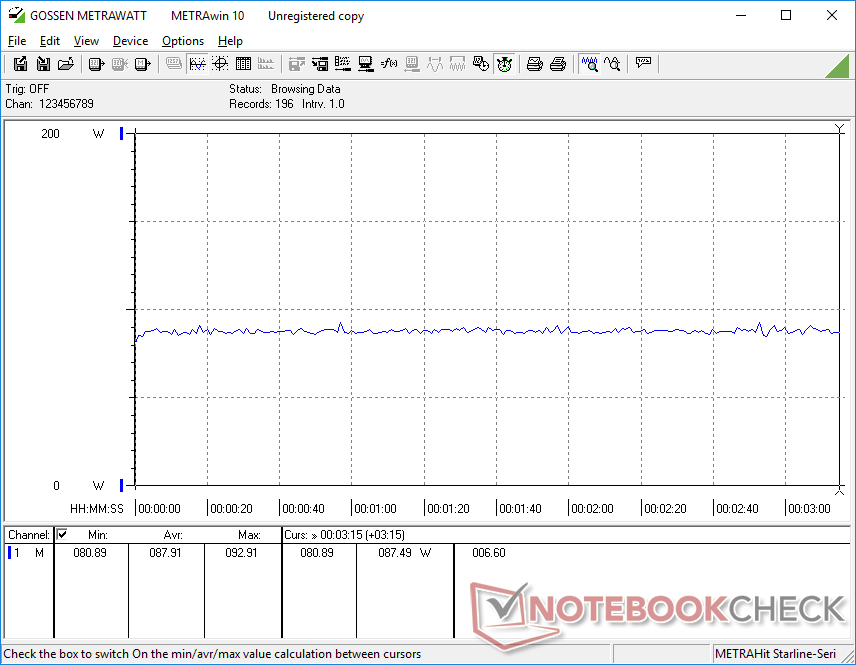
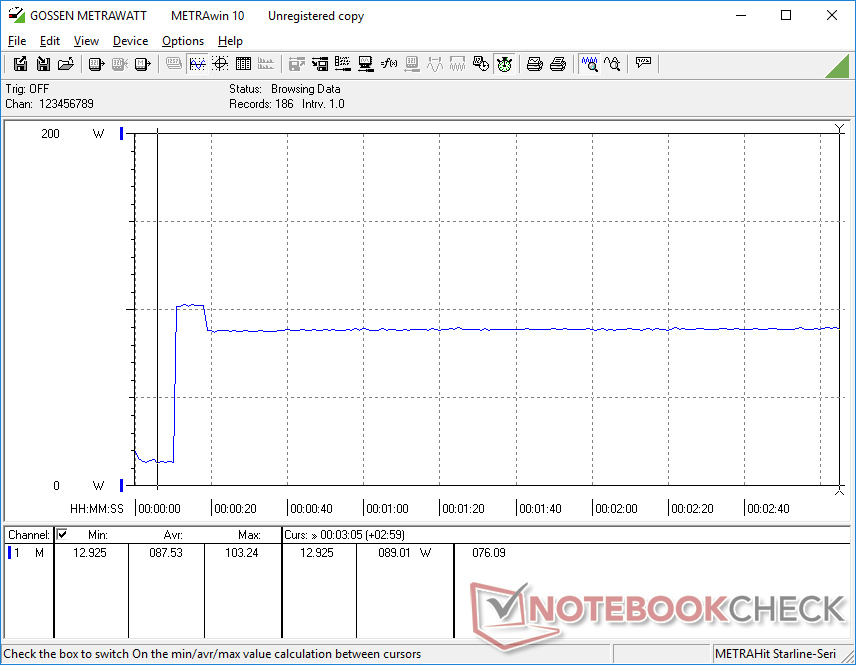
Power Consumption Witcher 3 / Stresstest
Power Consumption external Monitor
Pil Ömrü
CPU, GPU ve ekran farklılıklarına rağmen çalışma süreleri neredeyse geçen yılki modelde kaydettiklerimizle aynı. On saatlik gerçek dünya gezintisi, tüketici seviyesindeki birçok Ultrabook'a benzer.
| HP ZBook Power 15 G10 R7 PRO 7840HS, RTX 2000 Ada Generation Laptop, 83 Wh | HP ZBook Power 15 G9 6B8C4EA i7-12700H, RTX A2000 Laptop GPU, 83 Wh | Lenovo ThinkPad P15v G3 21EM001AGE R7 PRO 6850H, RTX A2000 Laptop GPU, 68 Wh | Dell Precision 5000 5560 i7-11850H, RTX A2000 Laptop GPU, 86 Wh | Lenovo ThinkPad P1 G6-21FV000DGE i9-13900H, RTX 2000 Ada Generation Laptop, 90 Wh | Asus ExpertBook B6 Flip B6602FC2 i9-12950HX, RTX A2000 Laptop GPU, 90 Wh | |
|---|---|---|---|---|---|---|
| Pil Çalışma Süresi | 0% | -31% | -37% | -5% | -13% | |
| WiFi v1.3 (h) | 10 | 10 0% | 6.9 -31% | 6.3 -37% | 9.5 -5% | 8.7 -13% |
| H.264 (h) | 10.7 | 11.2 | 5.8 | |||
| Load (h) | 1.8 | 1.8 | 1.1 | 1.7 | ||
| Reader / Idle (h) | 12 | 12.5 |
Artılar
Eksiler
Karar - Bozulmadıysa Düzeltmeyin
ZBook Power 15 G10 tasarımı üç yaşına yaklaşıyor. Hem AMD Zen 4 Pro CPU'ları hem de Nvidia RTX Ada GPU'ları taşıyan birkaç 16:19 15,6 inç iş istasyonundan biri olan bu kategorideki diğerlerinin çoğu OLED ve 4K dahil olmak üzere ek ekran seçenekleriyle 16:10 16 inç form faktörlerine geçti. Daha uzun form faktörü ve daha yeni ekranlar iş yükleriniz için önemliyse, HP'nin ZBook Power tasarımını yenilemesini beklemek veya aşağıdaki gibi alternatiflere bakmak isteyebilirsiniz Lenovo ThinkPad P1 G6 yerine. Değilse, ZBook Power 15 G10 hala klasik ve güvenilir bir seçenektir.
Gelecekteki potansiyel 16:10 revizyonları için, HP'nin hem ECC RAM hem de ECC VRAM desteği ve yalnızca tam USB-C şarjı dahil ederek ekstra yol kat ettiğini görmek isteriz. Yeni nesil Thunderbolt 240 W'a kadar USB-C şarjını destekleyebildiği için tescilli AC varil şarj cihazını haklı çıkarmak daha zor hale geliyor.
ZBook Power 15 G10, seri daha modern bir 16:10 tasarımla yenilenmeden önce muhtemelen HP'nin son 15.6 inç iş istasyonlarından biri olacak.
ZBook Power 15 G9 ve G10 arasındaki en önemli fark, ikincisinin eski Ampere GPU'lardan çok daha yüksek watt başına performans için Ada Lovelace GPU'larla birlikte gelmesidir. Daha yeni CPU'lar ve GPU'lar değerliyse, G9 yerine G10 önerilir. Aksi takdirde, modeller arasındaki kullanıcı deneyimi, pil ömrü de dahil olmak üzere esasen aynıdır.
Fiyat ve Bulunabilirlik
HP şu anda ZBook Power 15 G10'u Ryzen 5 konfigürasyonu için 1600 USD'den başlayıp Ryzen 7 ve Nvidia 2000 Ada veya daha yüksek konfigürasyonumuz için 2100 USD'ye kadar gönderiyor.
HP ZBook Power 15 G10
- 12/20/2023 v7 (old)
Allen Ngo
Şeffaflık
İncelenecek cihazların seçimi editör ekibimiz tarafından yapılır. Test örneği, bu incelemenin amacı doğrultusunda üretici veya perakendeci tarafından yazara ödünç olarak sağlanmıştır. Borç verenin bu inceleme üzerinde herhangi bir etkisi olmadığı gibi, üretici de yayınlanmadan önce bu incelemenin bir kopyasını almamıştır. Bu incelemeyi yayınlama zorunluluğu yoktu. Bağımsız bir medya şirketi olarak Notebookcheck, üreticilerin, perakendecilerin veya yayıncıların otoritesine tabi değildir.
Notebookcheck bu şekilde test yapıyor
Notebookcheck, tüm sonuçların karşılaştırılabilir olmasını sağlamak için her yıl yüzlerce dizüstü bilgisayarı ve akıllı telefonu standart prosedürler kullanarak bağımsız olarak inceliyor. Yaklaşık 20 yıldır test yöntemlerimizi sürekli olarak geliştirdik ve bu süreçte endüstri standartlarını belirledik. Test laboratuvarlarımızda deneyimli teknisyenler ve editörler tarafından yüksek kaliteli ölçüm ekipmanları kullanılmaktadır. Bu testler çok aşamalı bir doğrulama sürecini içerir. Karmaşık derecelendirme sistemimiz, nesnelliği koruyan yüzlerce sağlam temellere dayanan ölçüm ve kıyaslamaya dayanmaktadır.Price comparison

