Radeon RX 6550M performansı ilk kez: Lenovo ThinkPad Z16 Gen 2 dizüstü bilgisayar incelemesi

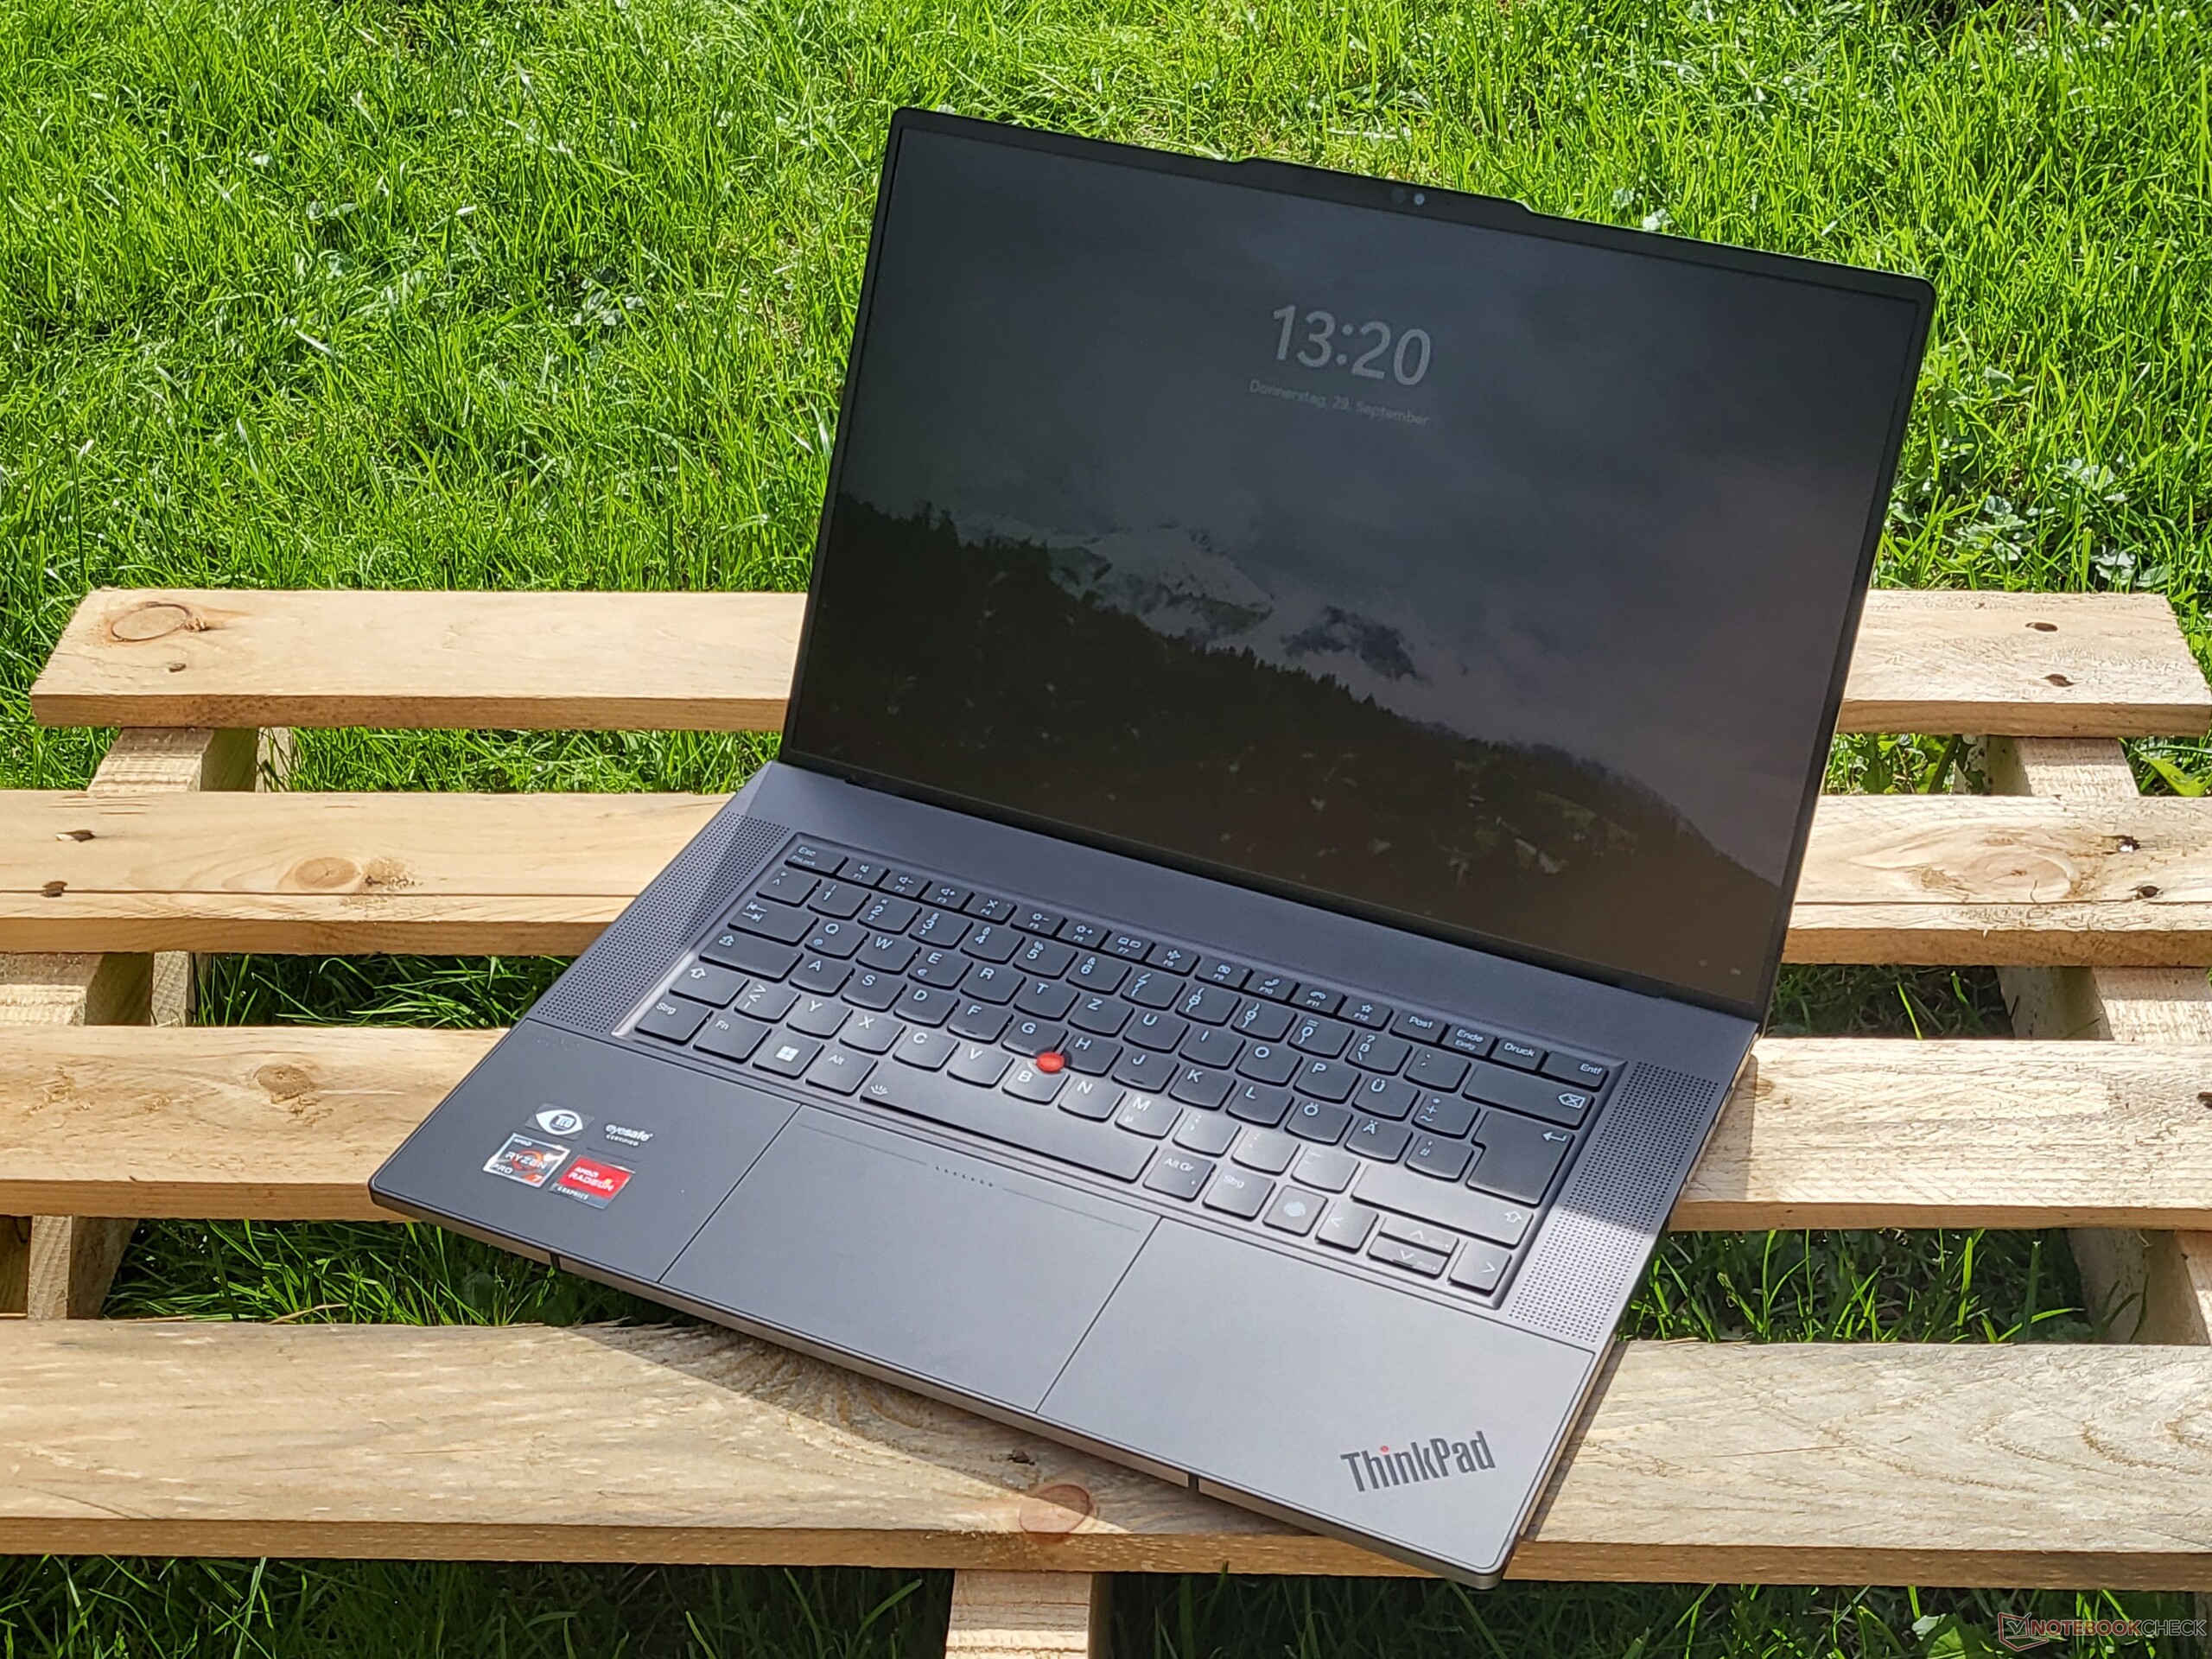
ThinkPad Z16 G2, yeni AMD Zen 4 CPU seçenekleri, daha hızlı Radeon RX grafikleri ve yeni 2400p OLED dokunmatik ekranı ile bir yıllık ThinkPad Z16 G1'in yerini alıyor. Ayrıca nadir bulunan giriş seviyesi Radeon RX 6550M'ye sahip çok az sayıdaki dizüstü bilgisayardan biri. Kasa, ThinkPad Z16 G1 ile aynıdır ve bu nedenle aşağıdakilere göz atmanızı öneririz birinci nesil modele ilişkin mevcut incelememiz serisinin fiziksel özellikleri ve bağlantı seçenekleri hakkında daha fazla bilgi edinmek için.
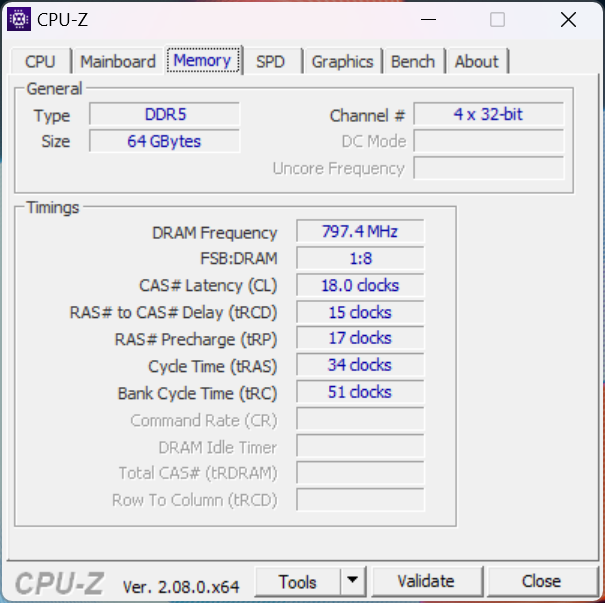
İnceleme birimimiz, Ryzen 9 Pro 7940HS, Radeon RX 6550M, OLED dokunmatik ekran ve 64 GB RAM ile yaklaşık 2600 USD karşılığında en üst düzey yapılandırmadır. Daha düşük SKU'lar Ryzen 5 Pro 7640HS, entegre grafikler ve 1200p IPS ekran ile 1600 dolardan başlıyor. ThinkPad Z16, tipik Pro olmayan seçenekler yerine Ryzen Pro CPU'ları taşıdığı için yarı profesyonel bir multimedya veya içerik oluşturucu dizüstü bilgisayar olarak düşünülebilir.
ThinkPad Z16 G2'nin alternatifleri arasında 16 inçlik diğer üst düzey içerik oluşturucu dizüstü bilgisayarlar MSI Creator Z16P, Apple MacBook Pro 16, Asus Vivobook Pro 16Xveya Dell XPS serisi.
Daha fazla Lenovo incelemesi:
Karşılaştırmalı olarak olası rakipler
Derecelendirme | Tarih | Modeli | Ağırlık | Yükseklik | Boyut | Çözünürlük | Fiyat |
|---|---|---|---|---|---|---|---|
| 88.6 % v7 (old) | 12/2023 | Lenovo ThinkPad Z16 Gen 2 R9 PRO 7940HS, Radeon RX 6550M | 1.8 kg | 15.8 mm | 16.00" | 3840x2400 | |
| 87.3 % v7 (old) | 09/2022 | Lenovo ThinkPad Z16 G1 21D5S00T00 R7 PRO 6850H, Radeon RX 6500M | 1.9 kg | 15.8 mm | 16.00" | 1920x1200 | |
| 85.7 % v7 (old) | 11/2023 | Lenovo ThinkBook 16 G6 ABP R5 7530U, Vega 7 | 1.8 kg | 17.5 mm | 16.00" | 1920x1200 | |
| 83.7 % v7 (old) | MSI Creator Z16P B12UHST i9-12900H, GeForce RTX 3080 Ti Laptop GPU | 2.4 kg | 20.4 mm | 16.00" | 2560x1600 | ||
| 93.7 % v7 (old) | 11/2023 | Apple MacBook Pro 16 2023 M3 Pro Apple M3 Pro 12-Core, M3 Pro 18-Core GPU | 2.1 kg | 16.9 mm | 16.20" | 3456x2234 | |
| 86.2 % v7 (old) | Asus Vivobook Pro 16X K6604JV-MX016W i9-13980HX, GeForce RTX 4060 Laptop GPU | 2.1 kg | 22.8 mm | 16.00" | 3200x2000 |
Dava
SD Kart Okuyucu
| SD Card Reader | |
| average JPG Copy Test (av. of 3 runs) | |
| Lenovo ThinkPad Z16 Gen 2 (Toshiba Exceria Pro SDXC 64 GB UHS-II) | |
| Asus Vivobook Pro 16X K6604JV-MX016W | |
| Lenovo ThinkPad Z16 G1 21D5S00T00 | |
| Lenovo ThinkBook 16 G6 ABP (Angelbird AV Pro V60) | |
| MSI Creator Z16P B12UHST (AV PRO microSD 128 GB V60) | |
| maximum AS SSD Seq Read Test (1GB) | |
| Lenovo ThinkPad Z16 G1 21D5S00T00 | |
| Lenovo ThinkPad Z16 Gen 2 (Toshiba Exceria Pro SDXC 64 GB UHS-II) | |
| Asus Vivobook Pro 16X K6604JV-MX016W | |
| Lenovo ThinkBook 16 G6 ABP (Angelbird AV Pro V60) | |
İletişim
Lenovo, geçen yılki modelde bulunan Qualcomm WCN685x'i bu yılki modelde MediaTek MT7922 ile değiştirdi. Wi-Fi 6 veya Wi-Fi 6E ağlarımızla eşleştirildiğinde aktarım hızları sabit ve mükemmel kalıyor.
| Networking | |
| iperf3 transmit AXE11000 | |
| Lenovo ThinkPad Z16 G1 21D5S00T00 | |
| Asus Vivobook Pro 16X K6604JV-MX016W | |
| Lenovo ThinkPad Z16 Gen 2 | |
| Lenovo ThinkBook 16 G6 ABP | |
| iperf3 receive AXE11000 | |
| Lenovo ThinkPad Z16 G1 21D5S00T00 | |
| Asus Vivobook Pro 16X K6604JV-MX016W | |
| MSI Creator Z16P B12UHST | |
| Lenovo ThinkPad Z16 Gen 2 | |
| Lenovo ThinkBook 16 G6 ABP | |
| iperf3 transmit AXE11000 6GHz | |
| Lenovo ThinkPad Z16 G1 21D5S00T00 | |
| Asus Vivobook Pro 16X K6604JV-MX016W | |
| Lenovo ThinkPad Z16 Gen 2 | |
| iperf3 receive AXE11000 6GHz | |
| Lenovo ThinkPad Z16 G1 21D5S00T00 | |
| Asus Vivobook Pro 16X K6604JV-MX016W | |
| Lenovo ThinkPad Z16 Gen 2 | |
Web kamerası
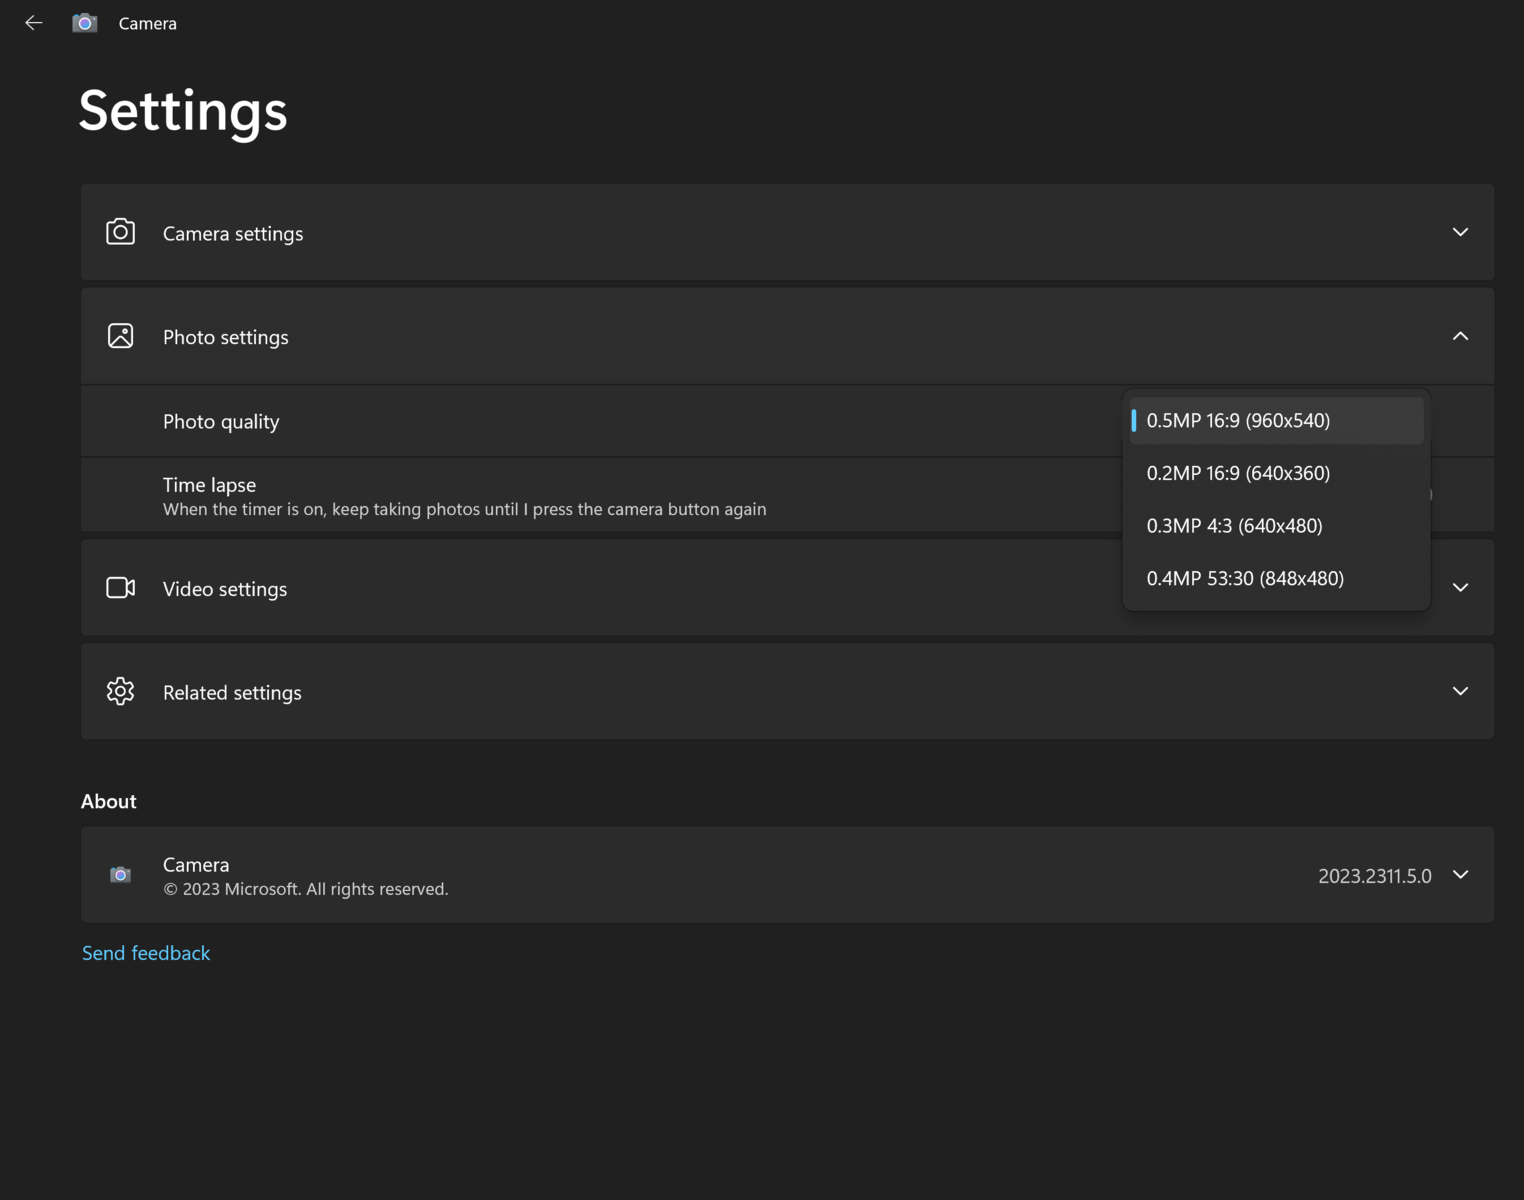
Lenovo 2 MP web kamerasının reklamını yapsa da, sağdaki ekran görüntüsünde gösterildiği gibi yerleşik kamera uygulamasıyla yalnızca 0,5 MP'ye kadar seçim yapabiliyoruz. Bu hatayı Lenovo'ya bildirdik ve bir yanıt alırsak bu bölümü güncelleyeceğiz.


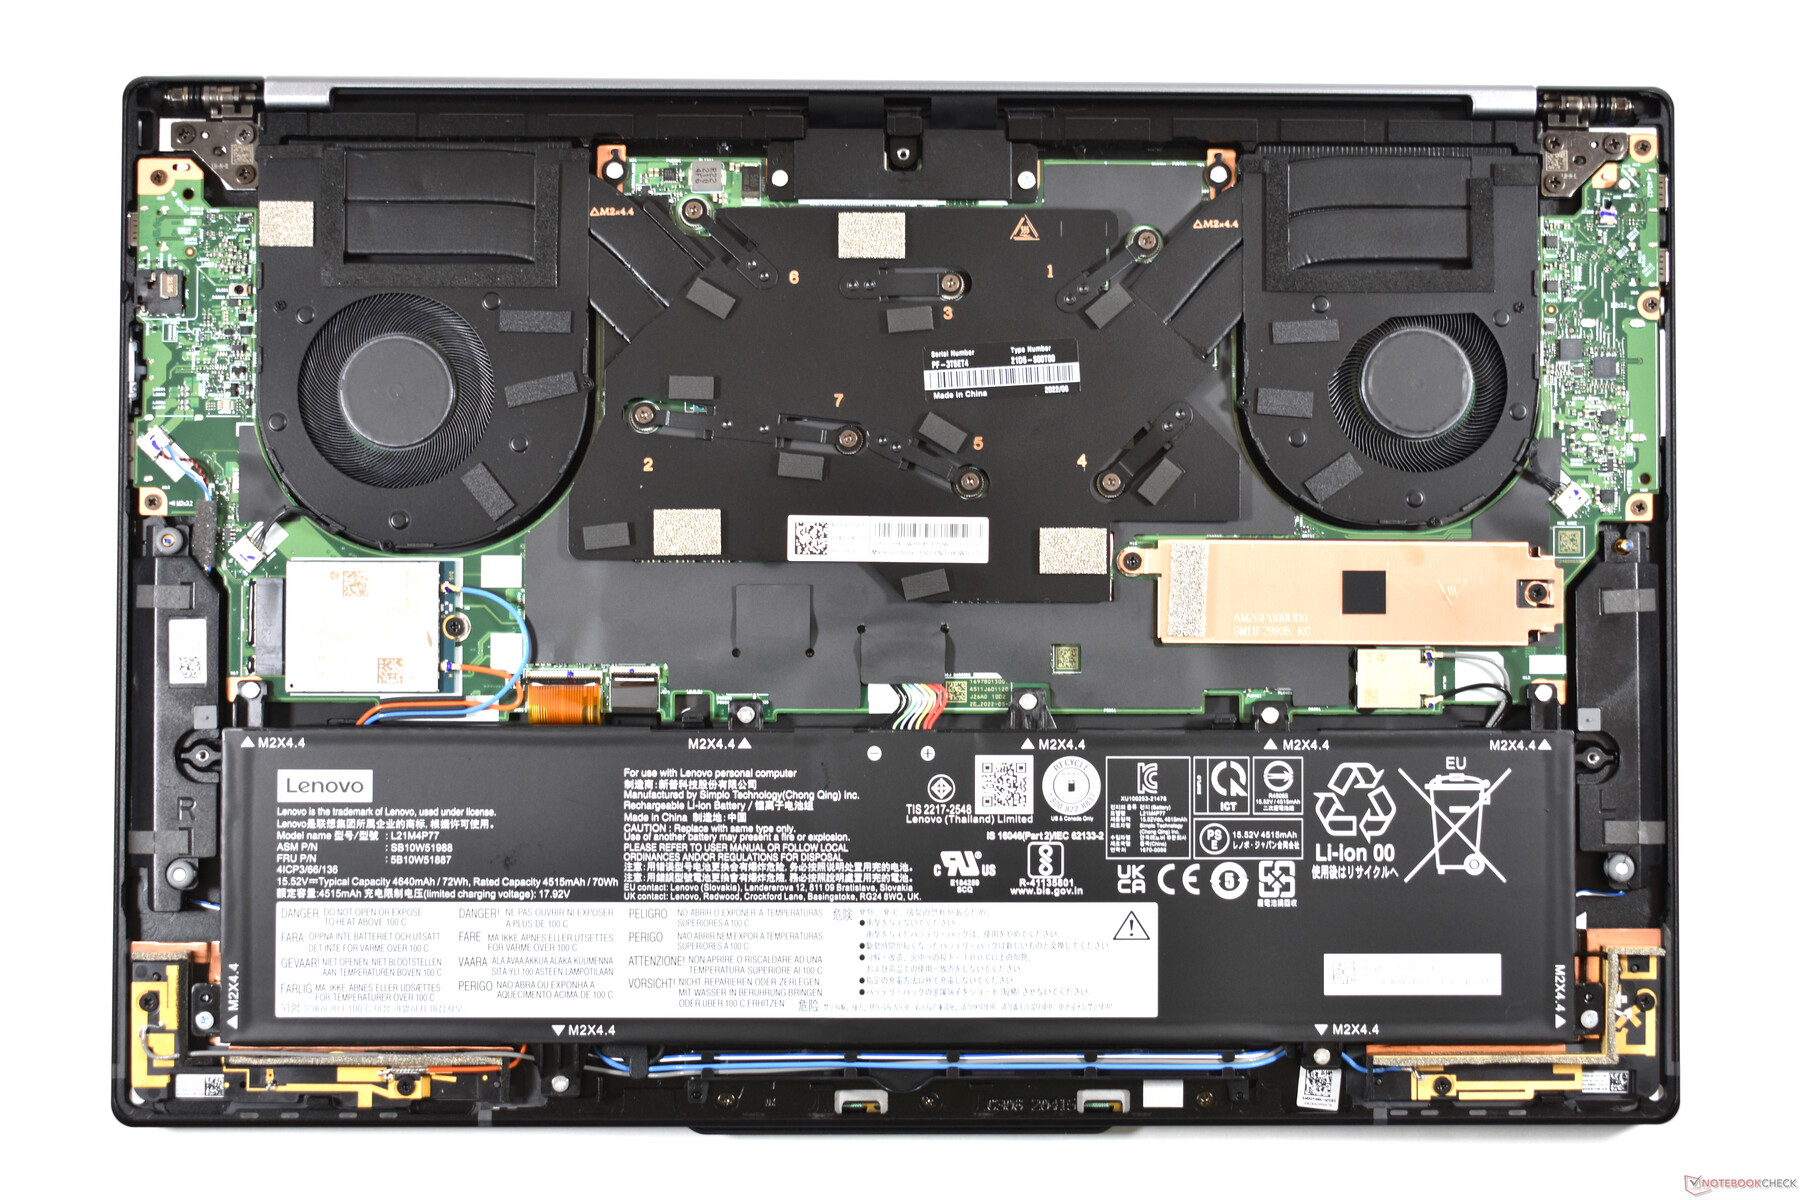
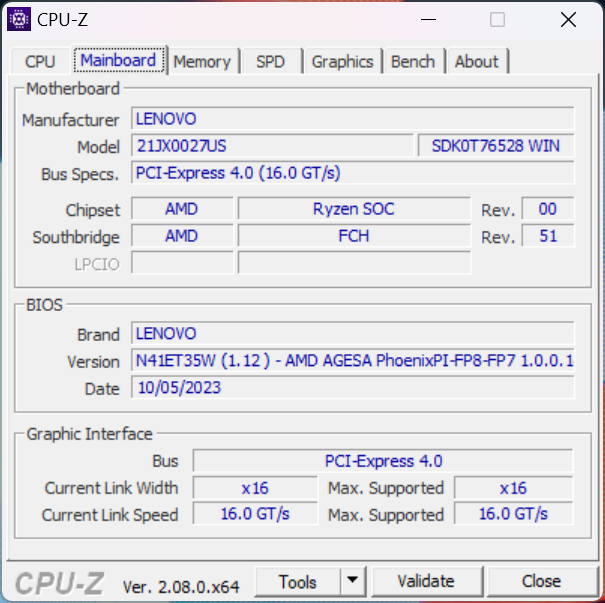
Bakım
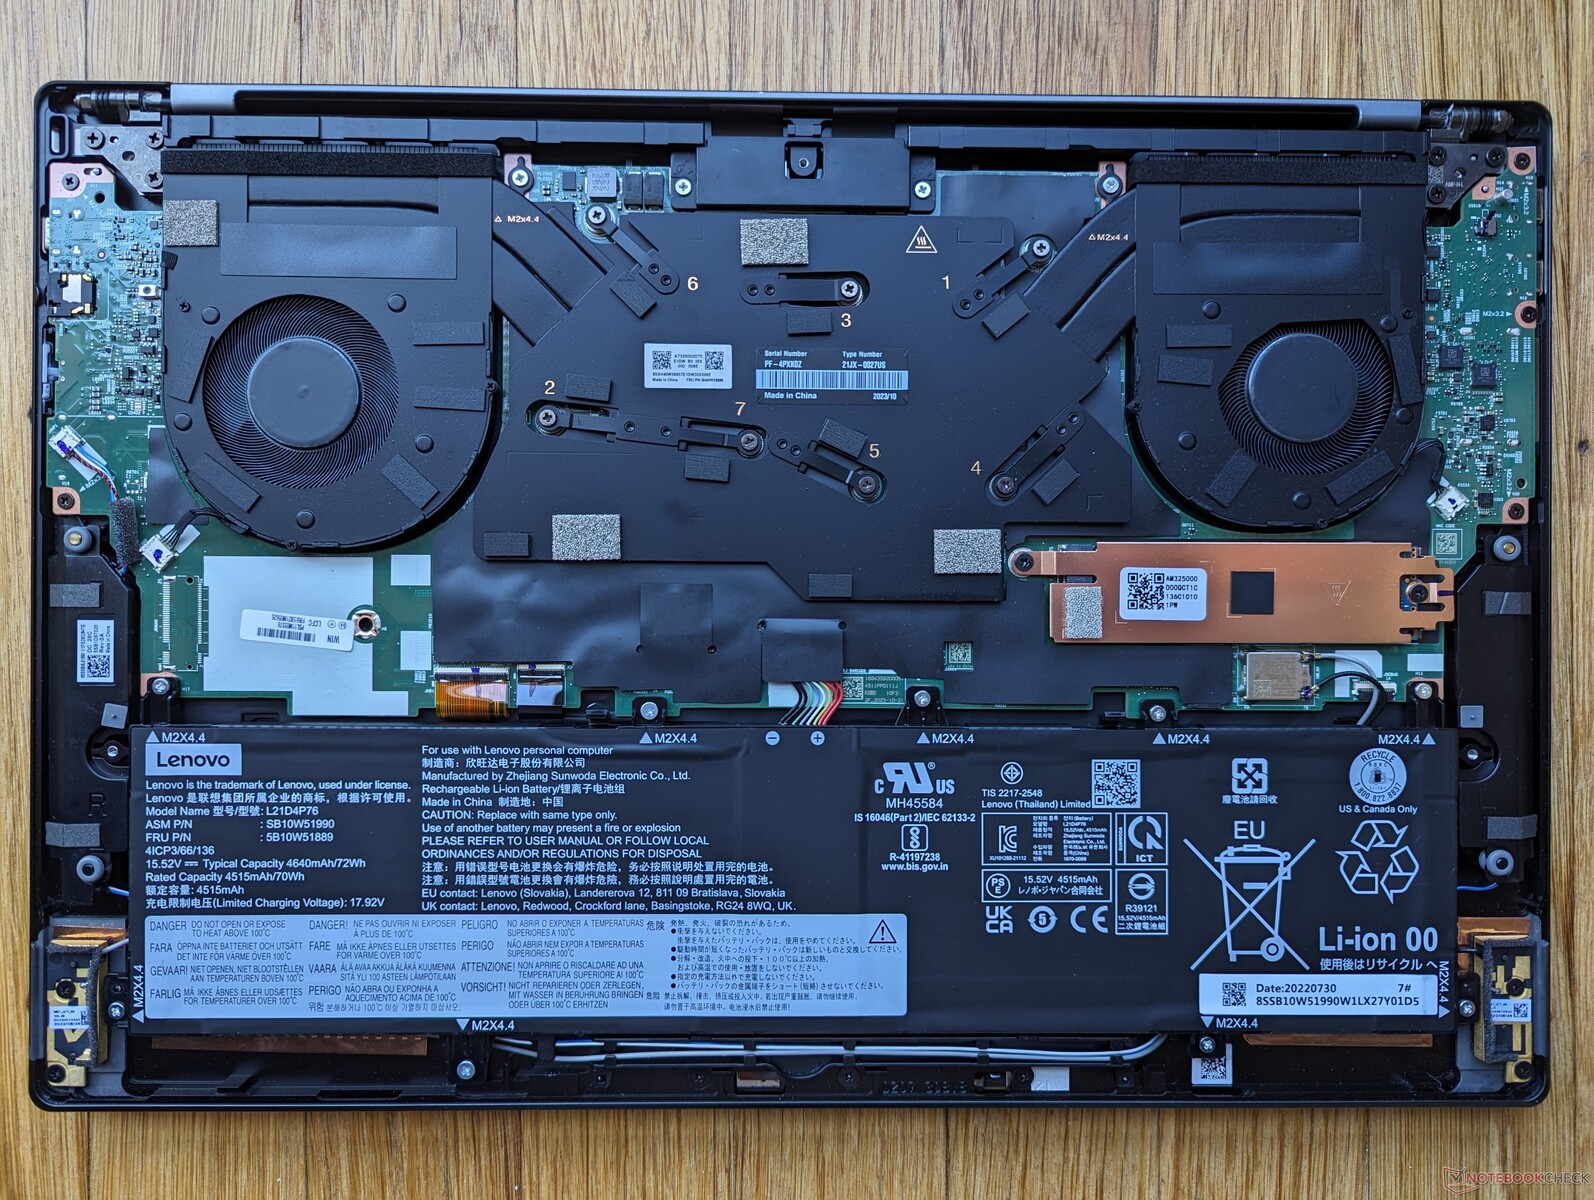
Alt panel çıkarıldığında Gen 1 ve Gen 2 versiyonları arasında önemli bir iç fark görülmüyor. Ancak Gen 2 konfigürasyonumuz WAN desteği içermediğinden M.2 WAN yuvası ve anteni bulunmuyor. Bu maalesef kullanıcıların gelecekte bir WAN modülü ekleme niyetiyle WAN'sız bir SKU satın alamayacağı anlamına geliyor.
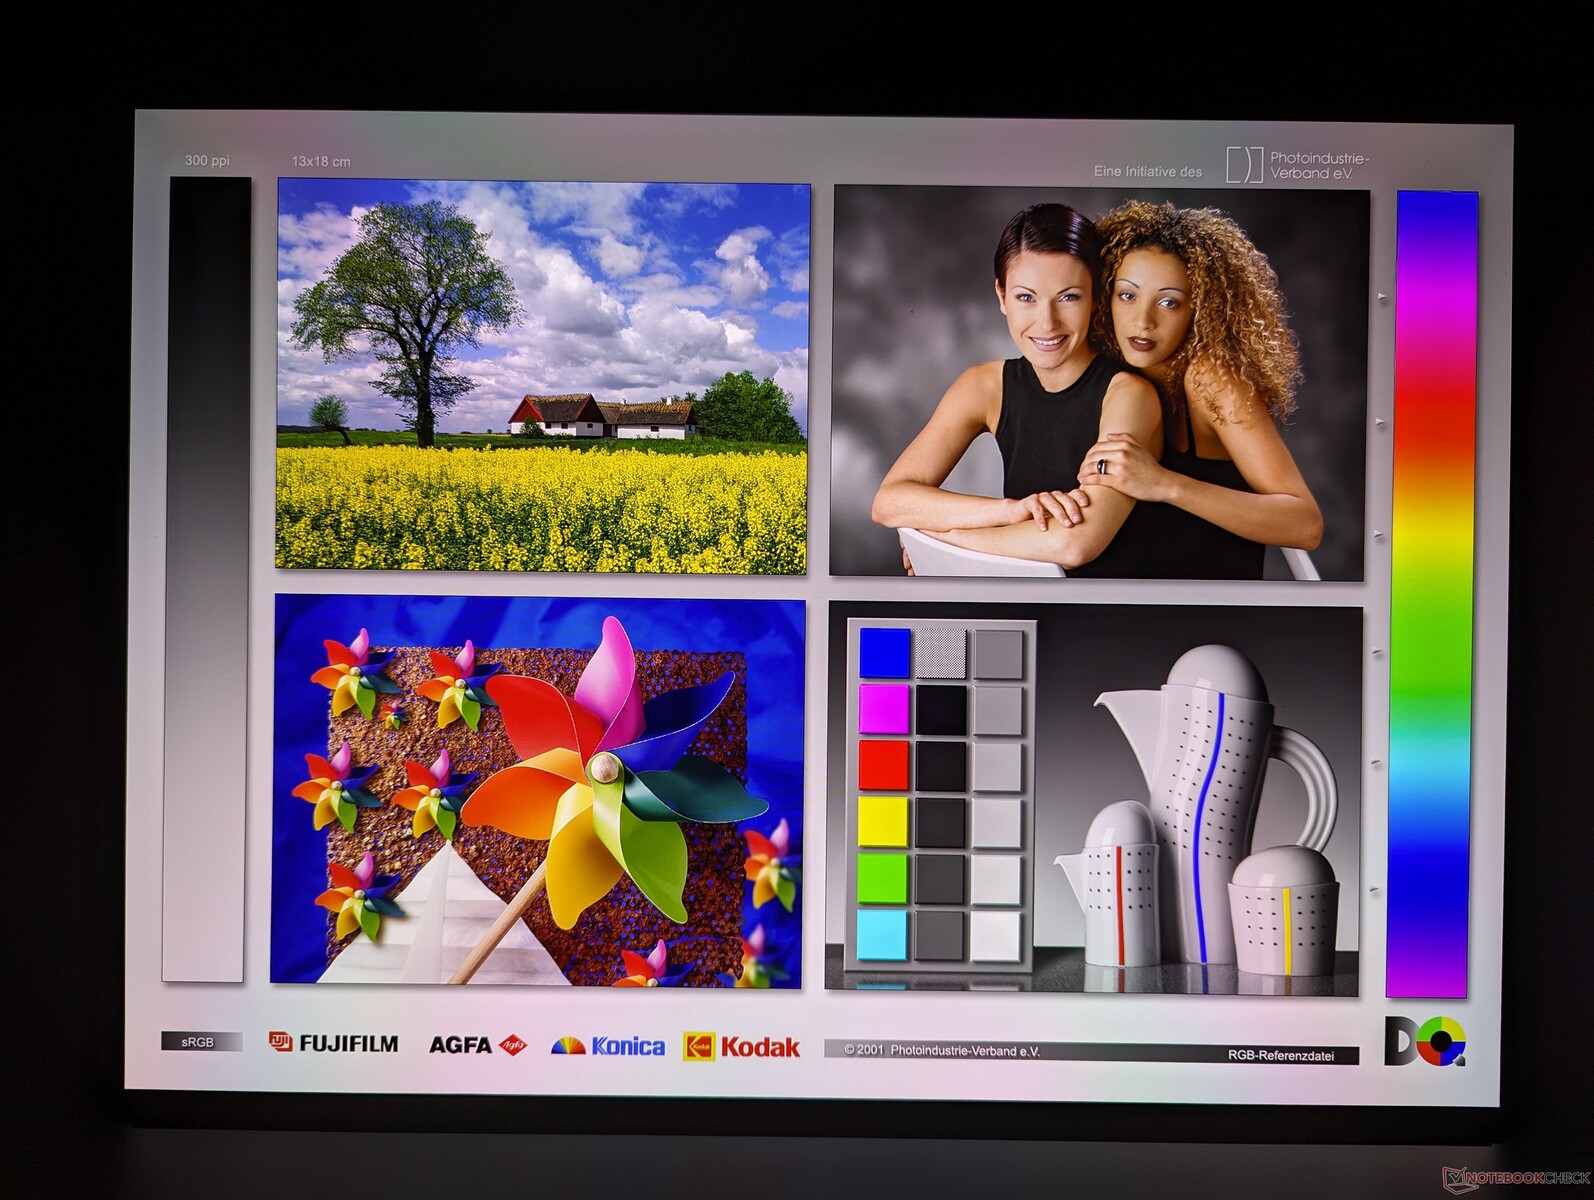
Ekran
Lenovo aşağıdaki gibi dört ekran seçeneği sunuyor ve bunların hepsi yalnızca 60 Hz ve FreeSync desteği yok:
- 1920 x 1200, IPS, mat, dokunmatik olmayan, %100 sRGB, 400 nit
- 1920 x 1200, IPS, parlak, dokunmatik, %100 sRGB, 400 nit
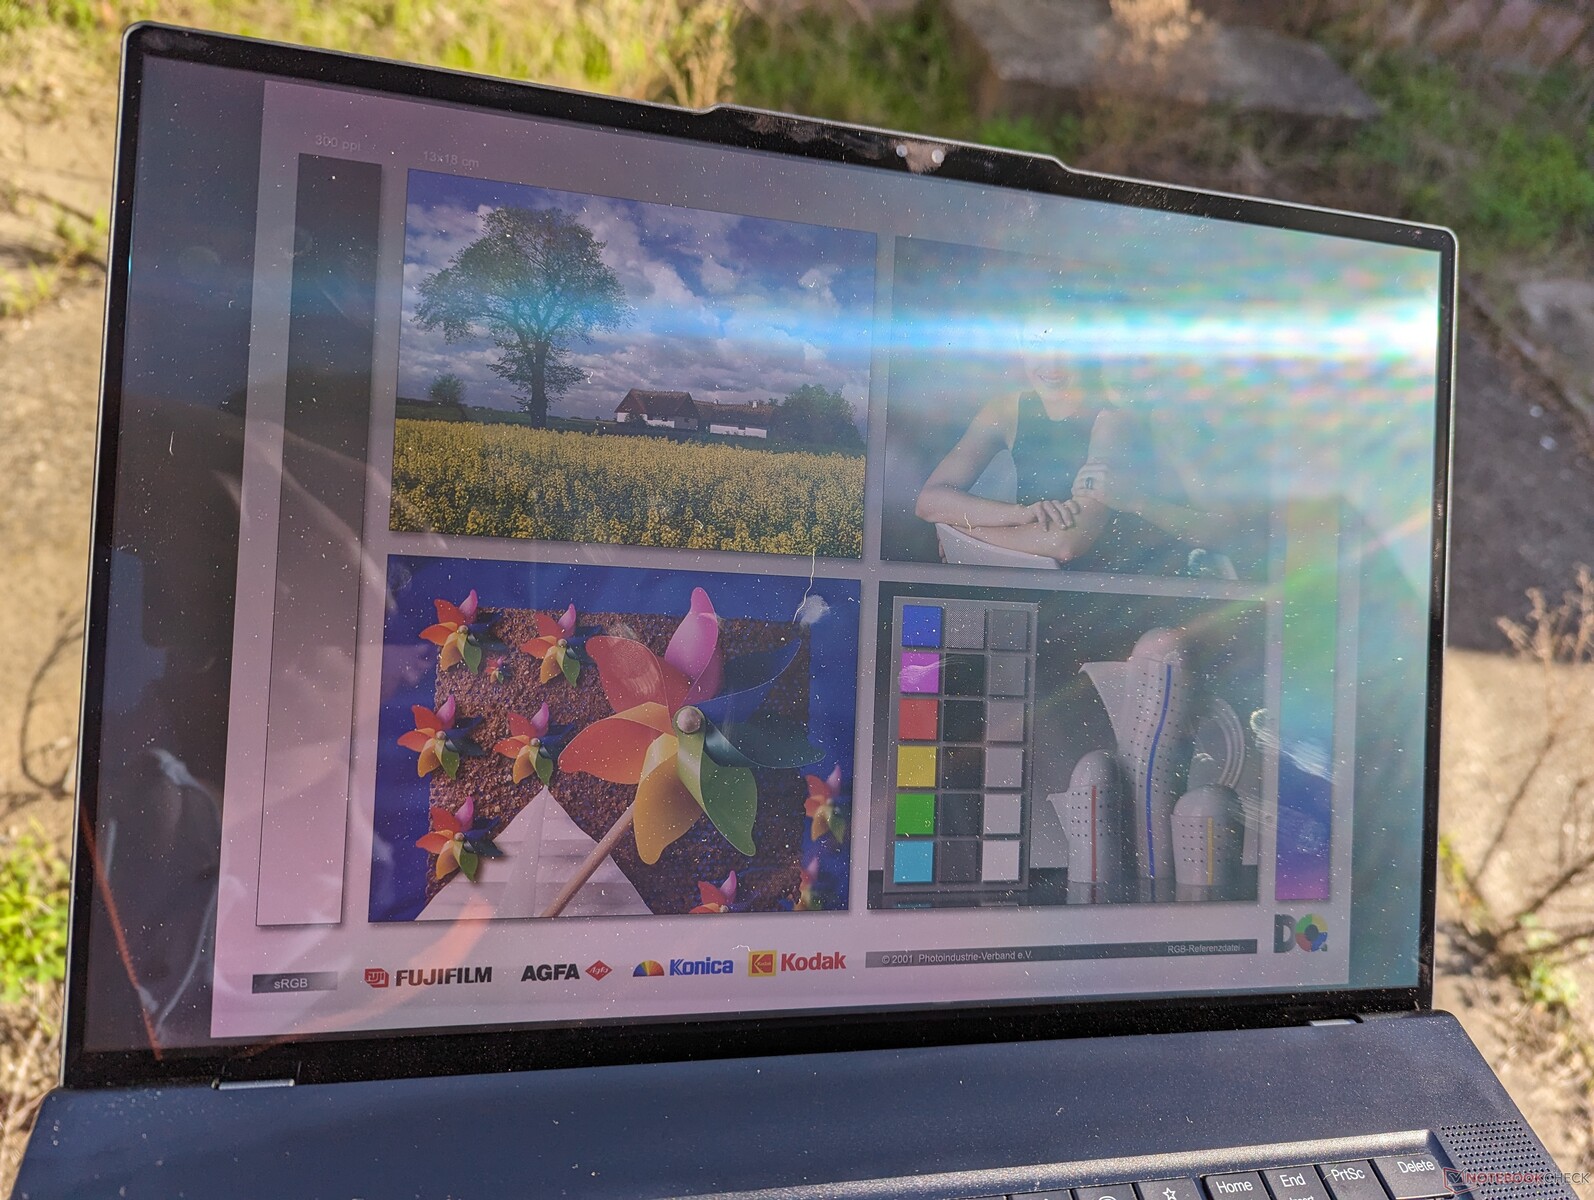
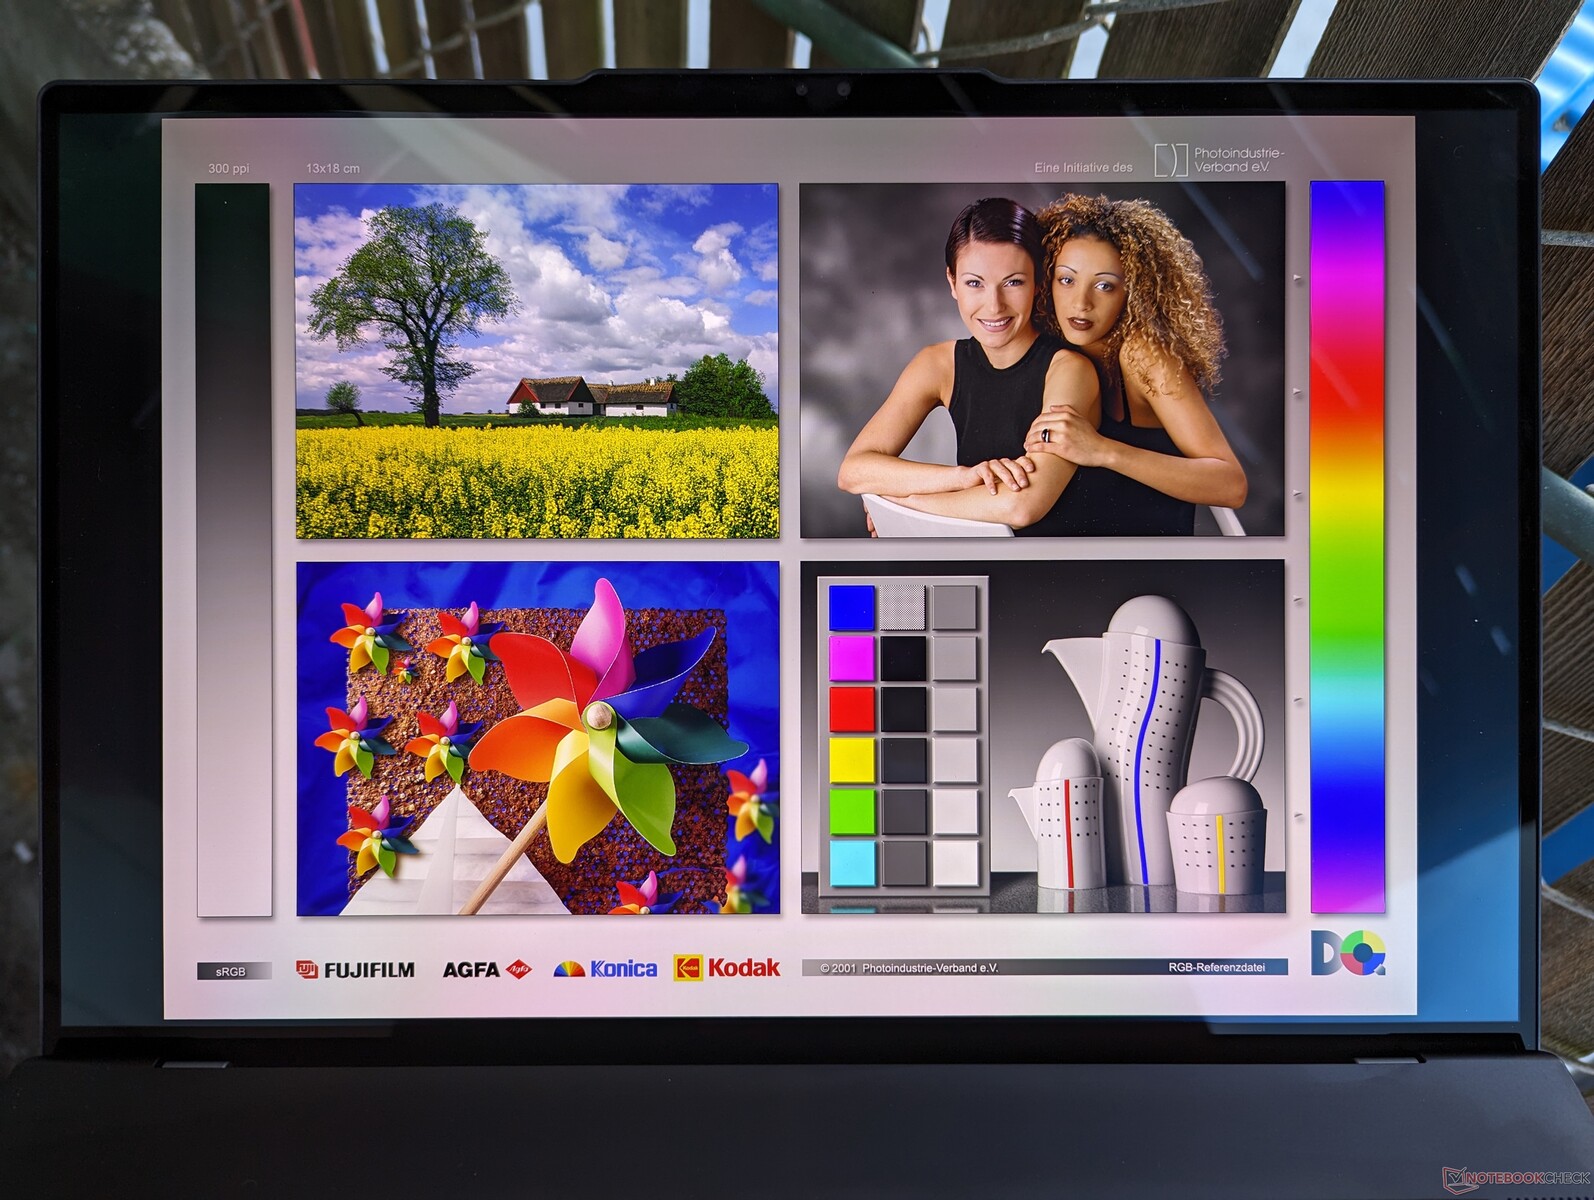
- 3840 x 2400, OLED, parlak, dokunmatik, %100 DCI-P3, 400 nit, HDR400
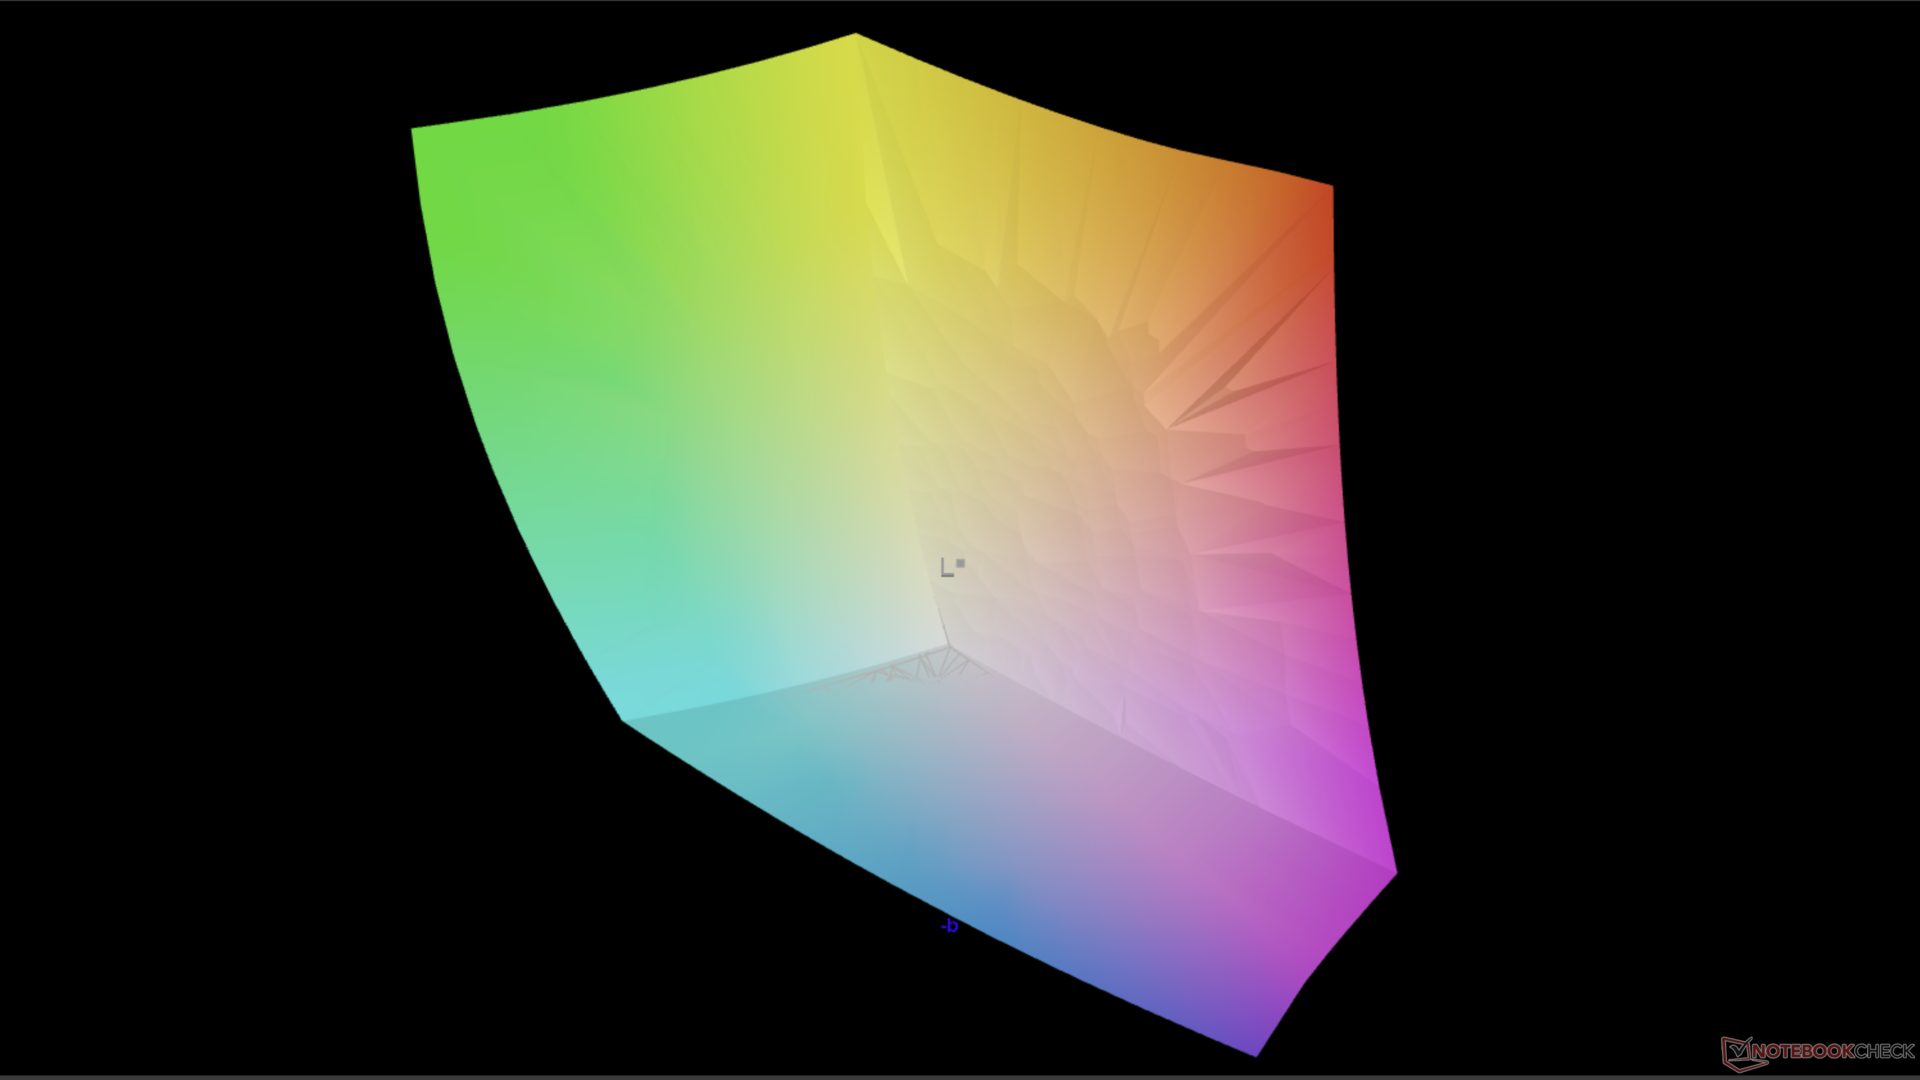
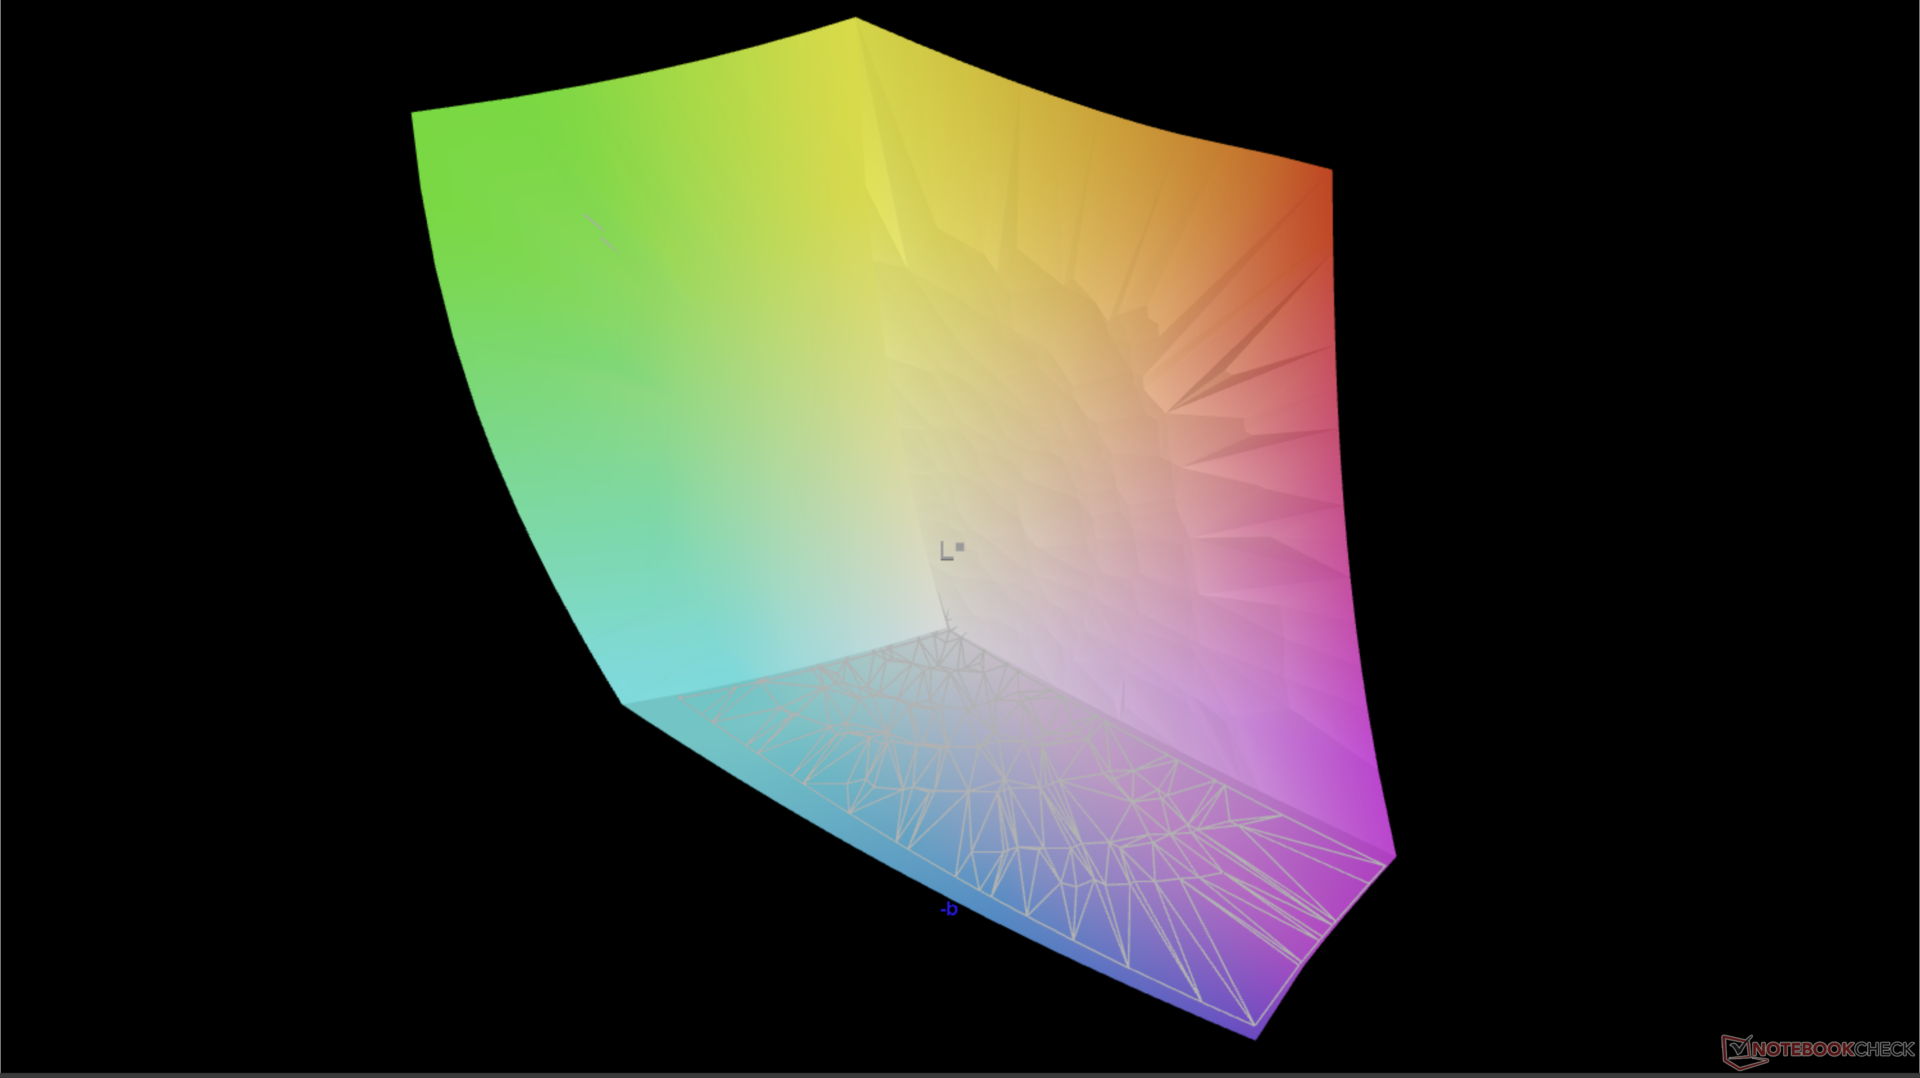
İnceleme ünitemizdeki Samsung ATNA60YV04-0 OLED panelin aynısı yeni ThinkPad P1 G6 modelinde de bulunmaktadır ve bu nedenle görüntüleme deneyimi bu iki model arasında benzerdir. Bir üreticinin aynı panel seçeneklerini birden fazla modelde kullanması alışılmadık bir durum değildir.
Gen 1 ünitemizdeki 1200p panel ile karşılaştırıldığında, OLED panel daha derin siyah seviyeleri, HDR desteği, daha hızlı siyah-beyaz tepki süreleri, daha canlı renkler ve daha yüksek bir doğal çözünürlük sunuyor. Seçenek ne olursa olsun, tam sRGB kapsamının, kaçınılması gereken düşük kaliteli SKU'lar olmadan standart hale geldiğini görmekten memnunuz. Gelecekteki revizyonların Asus VivoBook serisi gibi yüksek yenileme panelleri içereceğini umuyoruz.
| |||||||||||||||||||||||||
Aydınlatma: 97 %
Batarya modunda parlaklık: 390.1 cd/m²
Kontrast: ∞:1 (Siyah: 0 cd/m²)
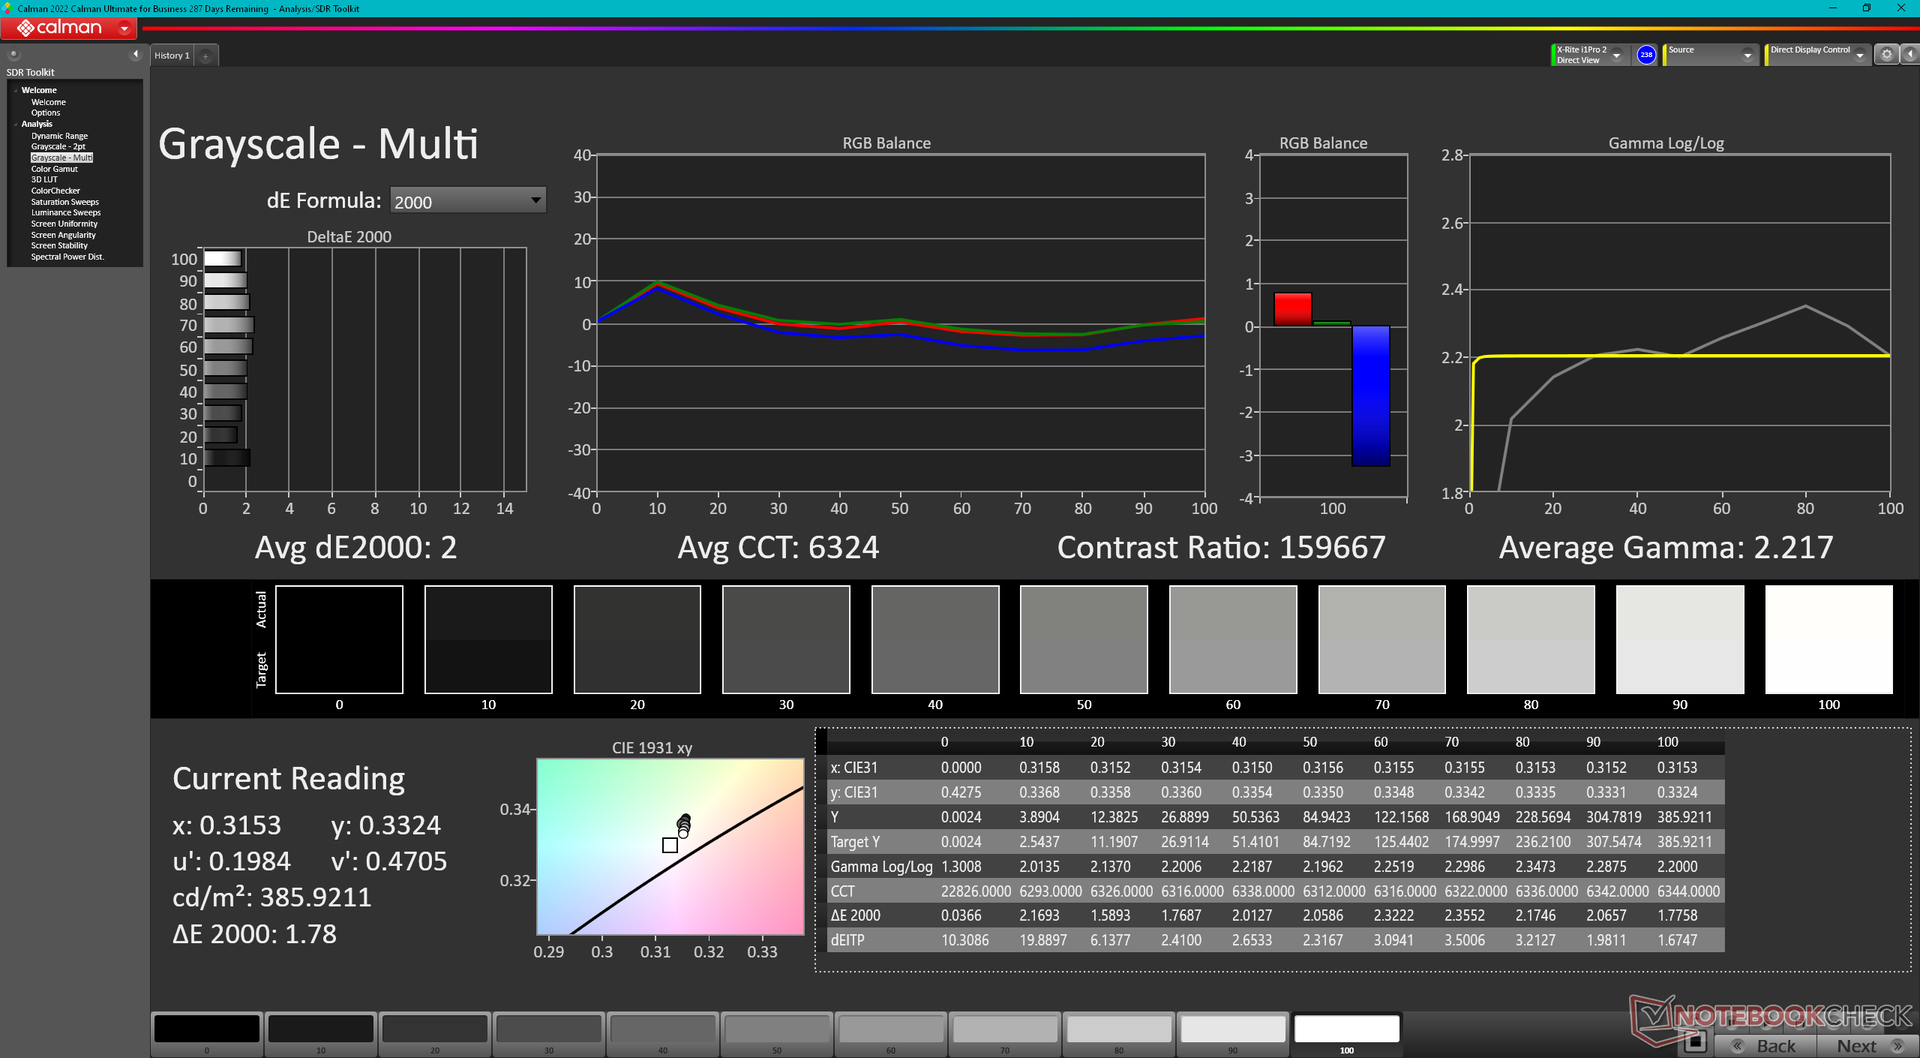
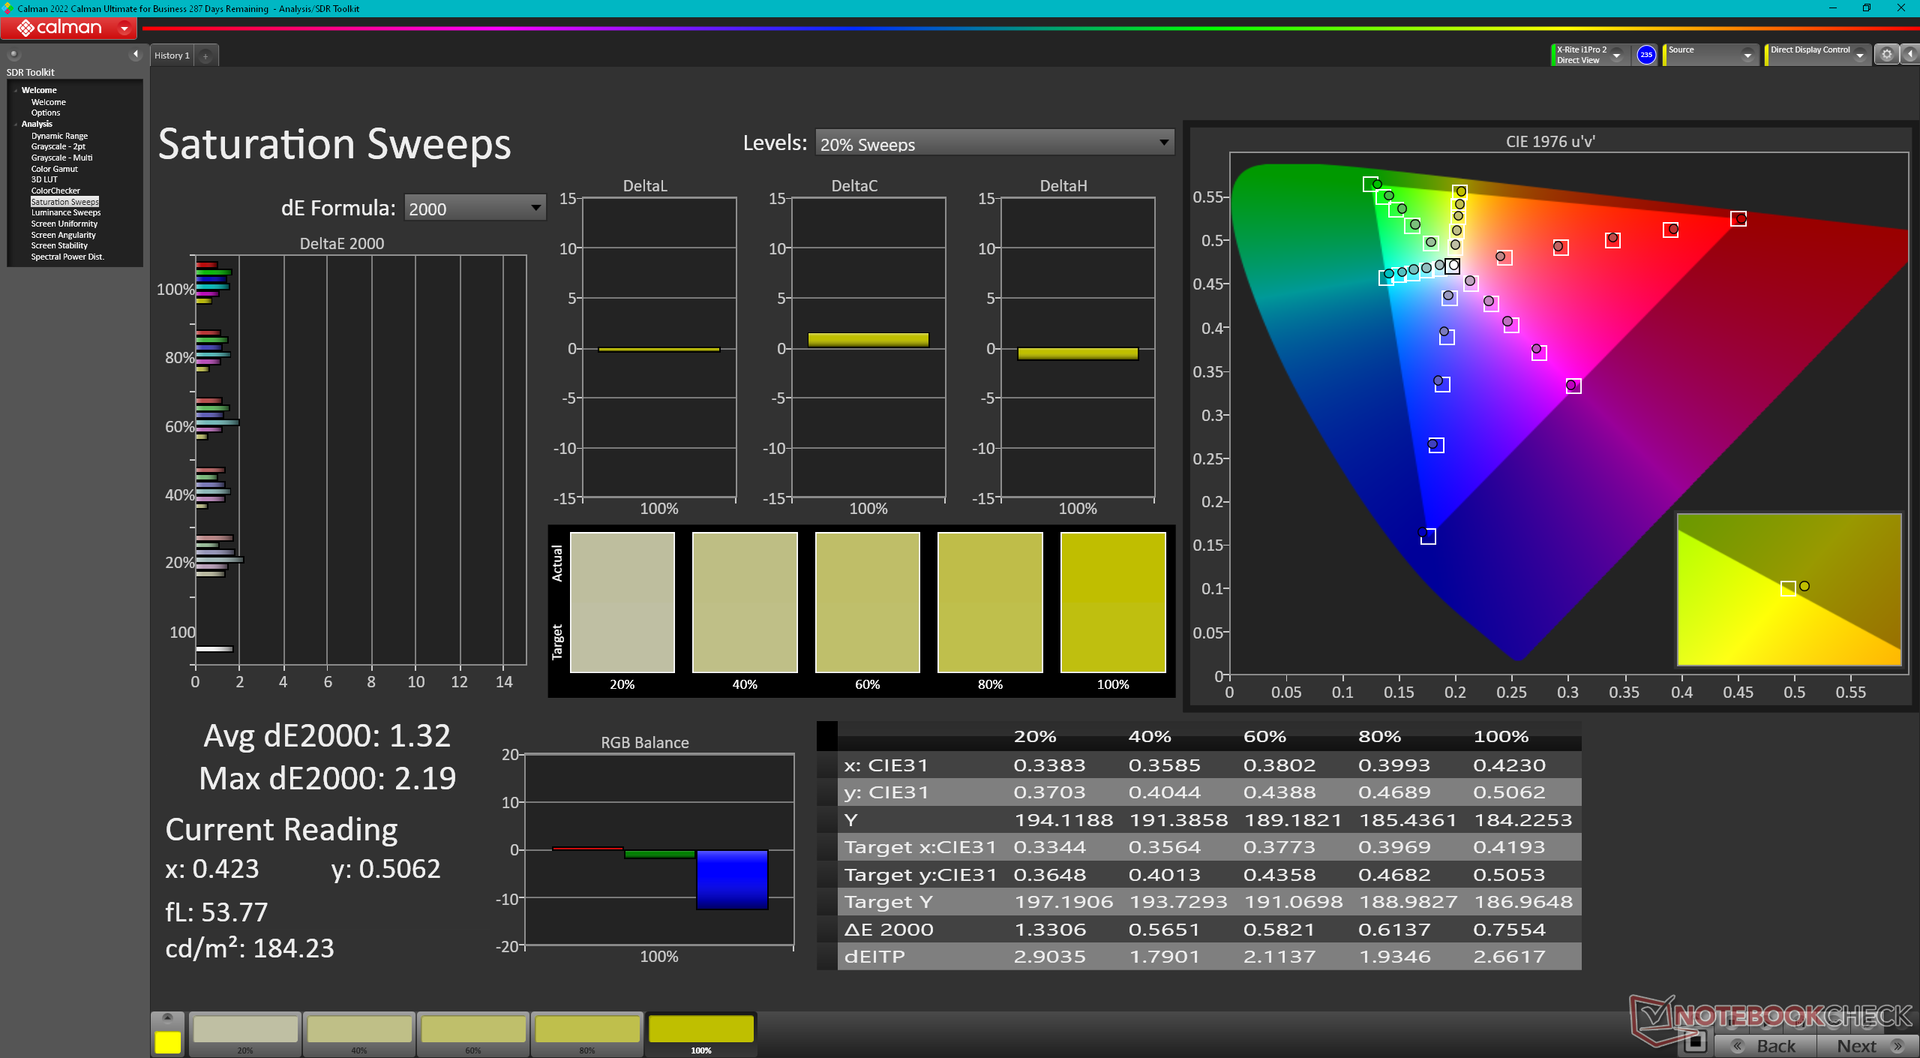
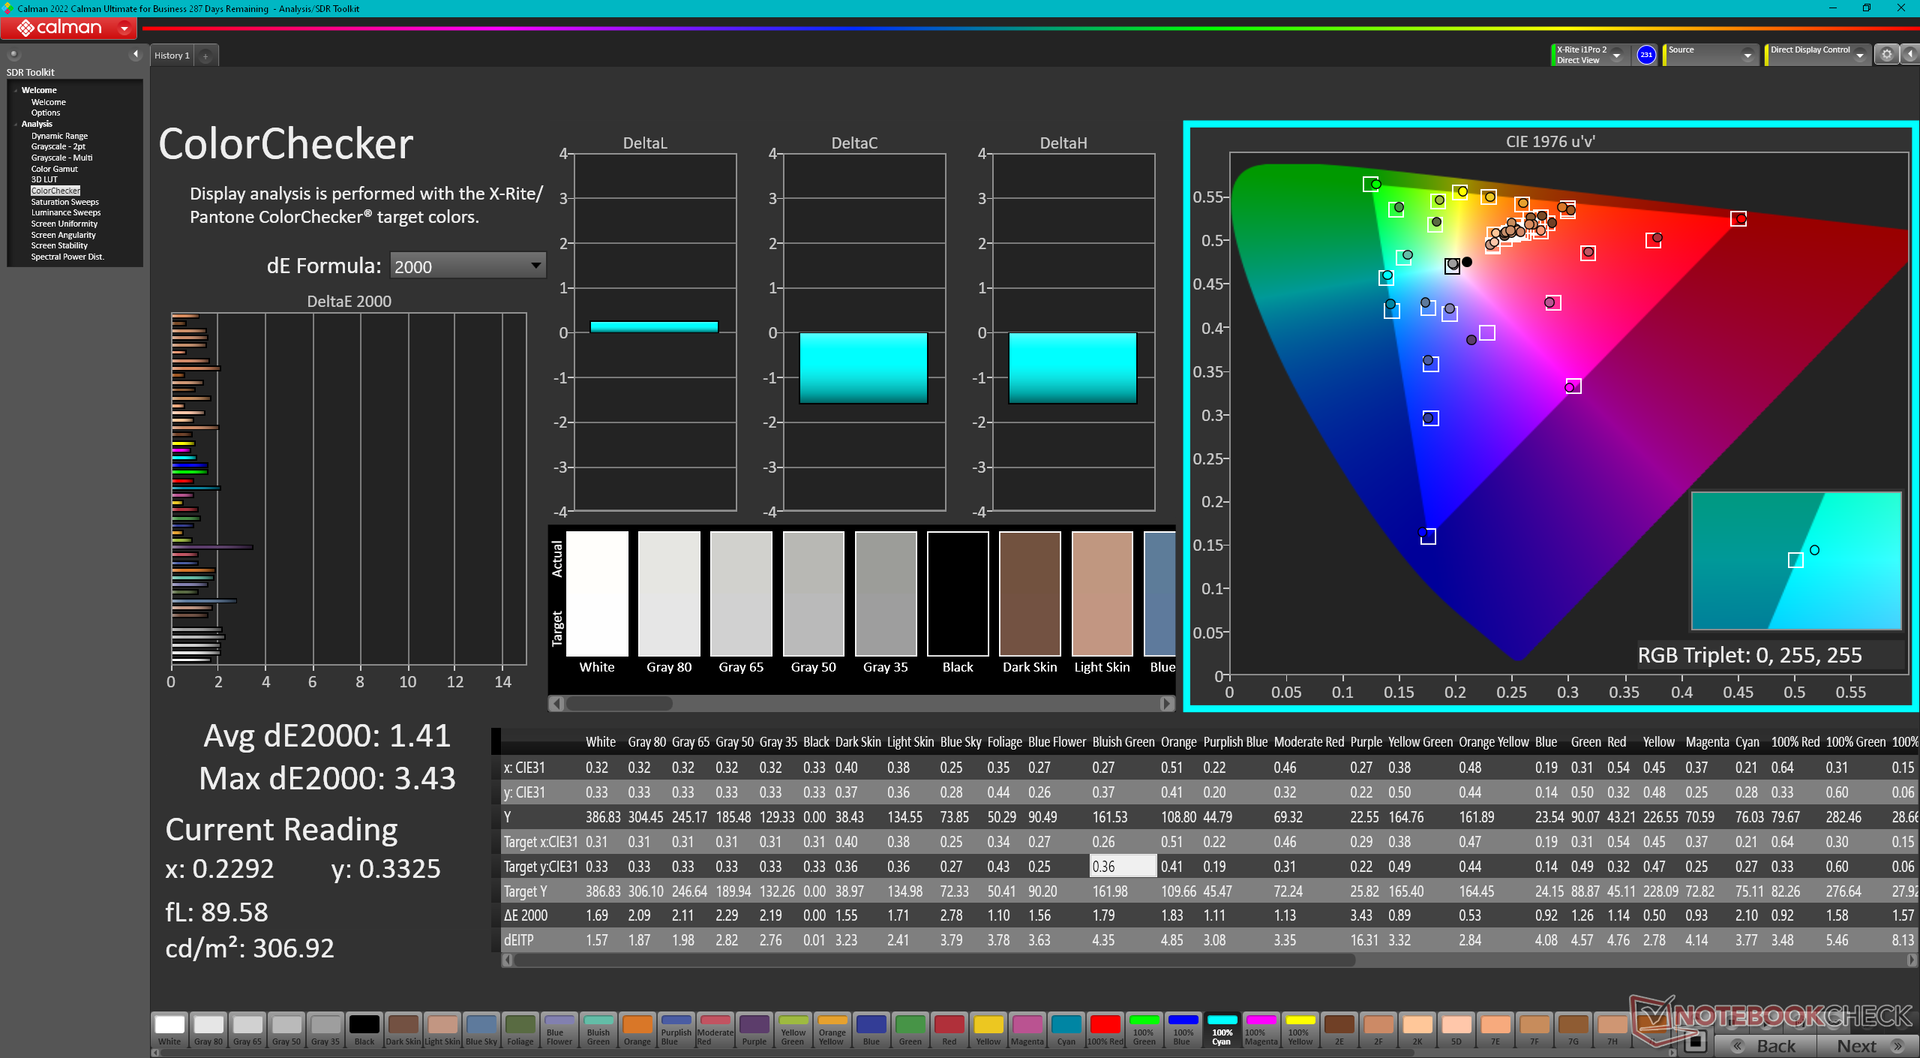
ΔE ColorChecker Calman: 1.41 | ∀{0.5-29.43 Ø4.71}
ΔE Greyscale Calman: 2 | ∀{0.09-98 Ø4.96}
96.7% AdobeRGB 1998 (Argyll 3D)
100% sRGB (Argyll 3D)
99.7% Display P3 (Argyll 3D)
Gamma: 2.22
CCT: 6324 K
| Lenovo ThinkPad Z16 Gen 2 Samsung ATNA60YV04-0, OLED, 3840x2400, 16" | Lenovo ThinkPad Z16 G1 21D5S00T00 NE160WUM-N62 , IPS LED, 1920x1200, 16" | Lenovo ThinkBook 16 G6 ABP LEN160WUXGA, IPS, 1920x1200, 16" | MSI Creator Z16P B12UHST AUOD298, IPS True Pixel (~100% DCI-P3), 2560x1600, 16" | Asus Vivobook Pro 16X K6604JV-MX016W Samsung SDC4178 ATNA60BX01-1, OLED, 3200x2000, 16" | Apple MacBook Pro 16 2023 M3 Max Mini-LED, 3456x2234, 16" | |
|---|---|---|---|---|---|---|
| Display | -18% | -52% | -4% | -1% | -1% | |
| Display P3 Coverage (%) | 99.7 | 70 -30% | 40.4 -59% | 97.6 -2% | 98.4 -1% | 99.2 -1% |
| sRGB Coverage (%) | 100 | 99.7 0% | 59.8 -40% | 99.9 0% | 99.7 0% | |
| AdobeRGB 1998 Coverage (%) | 96.7 | 72.1 -25% | 42 -57% | 86.8 -10% | 95.8 -1% | |
| Response Times | -1637% | -1414% | -417% | 20% | -2852% | |
| Response Time Grey 50% / Grey 80% * (ms) | 1.86 ? | 40 ? -2051% | 32.8 ? -1663% | 12.9 ? -594% | 1.6 ? 14% | 66.9 ? -3497% |
| Response Time Black / White * (ms) | 1.89 ? | 25 ? -1223% | 23.9 ? -1165% | 6.4 ? -239% | 1.4 ? 26% | 43.6 ? -2207% |
| PWM Frequency (Hz) | 60 ? | 120 ? | 14877 | |||
| Screen | -3% | -185% | -23% | -5% | 25% | |
| Brightness middle (cd/m²) | 390.1 | 487 25% | 310 -21% | 428 10% | 347 -11% | 630 61% |
| Brightness (cd/m²) | 393 | 446 13% | 290 -26% | 394 0% | 346 -12% | 604 54% |
| Brightness Distribution (%) | 97 | 83 -14% | 86 -11% | 86 -11% | 97 0% | 94 -3% |
| Black Level * (cd/m²) | 0.31 | 0.22 | 0.42 | 0.06 | ||
| Colorchecker dE 2000 * | 1.41 | 1.8 -28% | 6.2 -340% | 1.67 -18% | 1.89 -34% | 1.2 15% |
| Colorchecker dE 2000 max. * | 3.43 | 3.3 4% | 24.7 -620% | 5.71 -66% | 3.26 5% | 2.8 18% |
| Greyscale dE 2000 * | 2 | 2.3 -15% | 3.8 -90% | 3.1 -55% | 1.55 22% | 1.9 5% |
| Gamma | 2.22 99% | 2.16 102% | 2.22 99% | 2.195 100% | 2.39 92% | 2.29 96% |
| CCT | 6324 103% | 6867 95% | 6011 108% | 6498 100% | 6458 101% | 6812 95% |
| Contrast (:1) | 1571 | 1409 | 1019 | 5783 | ||
| Colorchecker dE 2000 calibrated * | 0.8 | 5.3 | 0.71 | 1.97 | ||
| Toplam Ortalama (Program / Ayarlar) | -553% /
-304% | -550% /
-372% | -148% /
-90% | 5% /
1% | -943% /
-617% |
* ... daha küçük daha iyidir
OLED ekran, ortalama gri tonlama ve renk deltaE değerleri sırasıyla sadece 2.0 ve 1.41 ile kutudan çıktığı haliyle iyi kalibre edilmiştir. Bu nedenle kullanıcıların büyük çoğunluğu için son kullanıcı kalibrasyonu gerekli değildir.
Yanıt Sürelerini Görüntüle
| ↔ Tepki Süresi Siyahtan Beyaza | ||
|---|---|---|
| 1.89 ms ... yükseliş ↗ ve sonbahar↘ birleşimi | ↗ ms yükseliş | 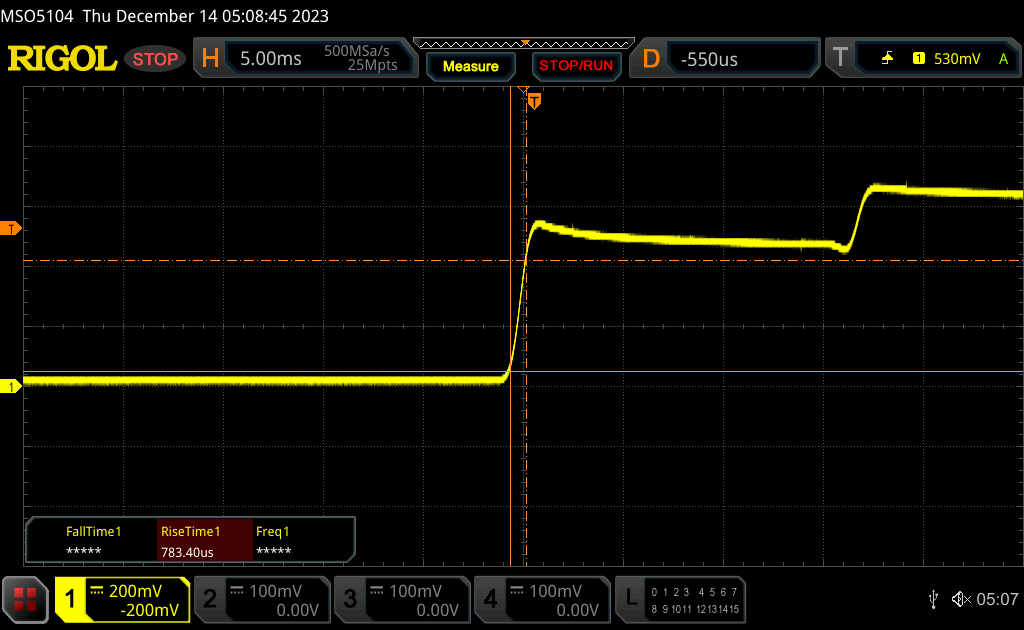 |
| ↘ 0.89 ms sonbahar | ||
| Ekran, testlerimizde çok hızlı yanıt oranları gösteriyor ve hızlı oyun oynamaya çok uygun olmalı. Karşılaştırıldığında, test edilen tüm cihazlar 0.1 (minimum) ile 240 (maksimum) ms arasında değişir. » Tüm cihazların 11 %'si daha iyi. Bu, ölçülen yanıt süresinin test edilen tüm cihazların ortalamasından (19.8 ms) daha iyi olduğu anlamına gelir. | ||
| ↔ Tepki Süresi %50 Griden %80 Griye | ||
| 1.86 ms ... yükseliş ↗ ve sonbahar↘ birleşimi | ↗ 0.96 ms yükseliş | 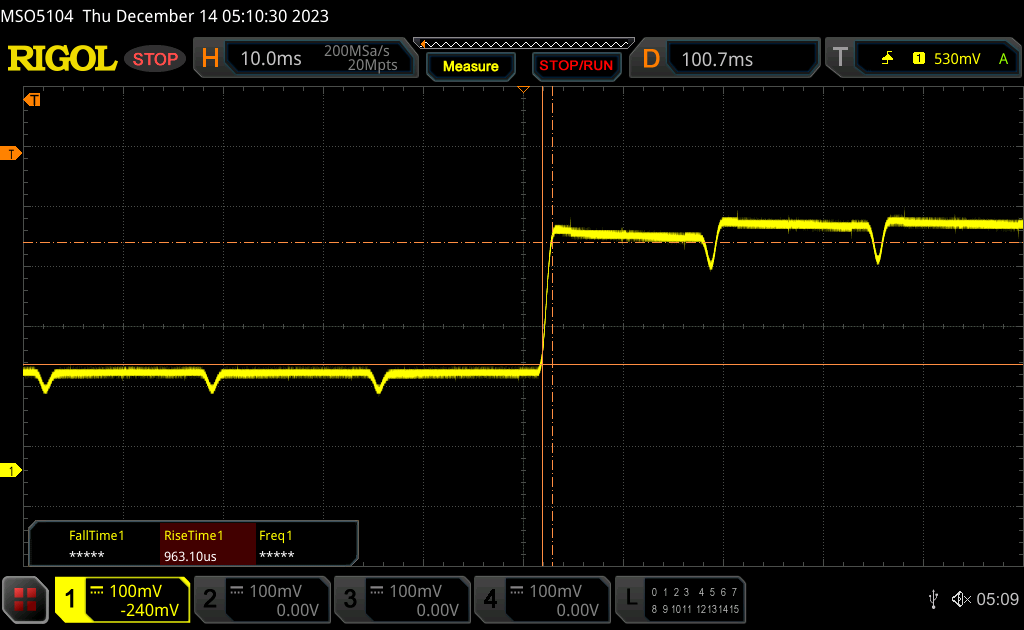 |
| ↘ 0.9 ms sonbahar | ||
| Ekran, testlerimizde çok hızlı yanıt oranları gösteriyor ve hızlı oyun oynamaya çok uygun olmalı. Karşılaştırıldığında, test edilen tüm cihazlar 0.165 (minimum) ile 636 (maksimum) ms arasında değişir. » Tüm cihazların 9 %'si daha iyi. Bu, ölçülen yanıt süresinin test edilen tüm cihazların ortalamasından (30.9 ms) daha iyi olduğu anlamına gelir. | ||
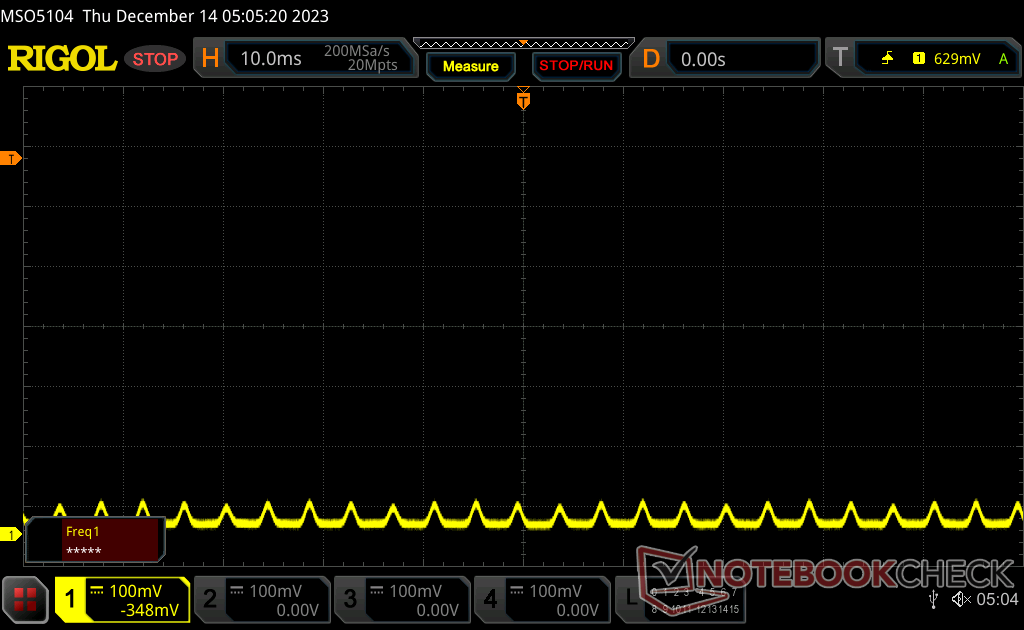
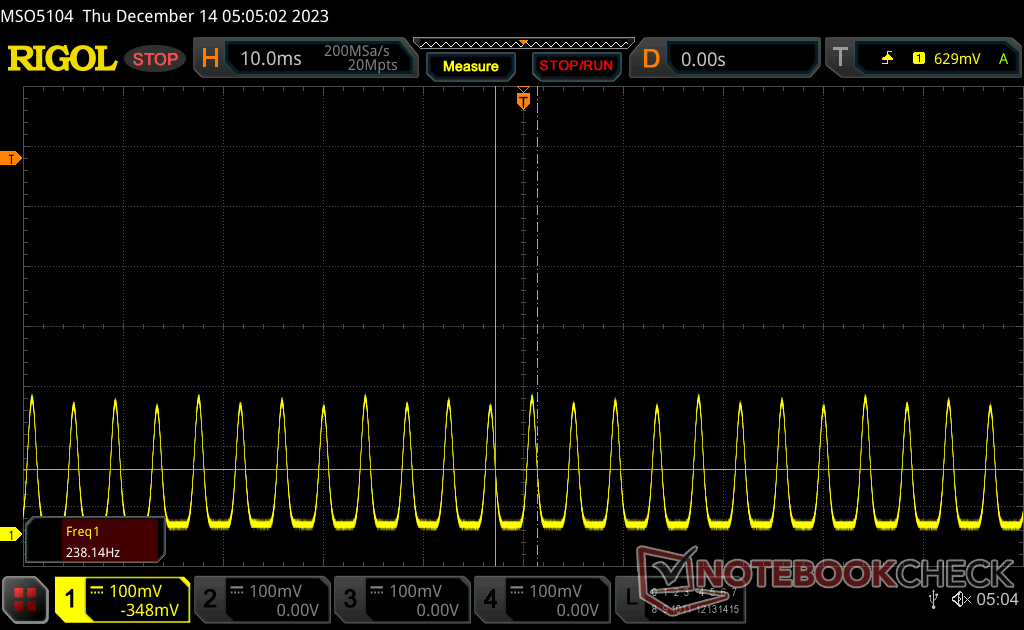
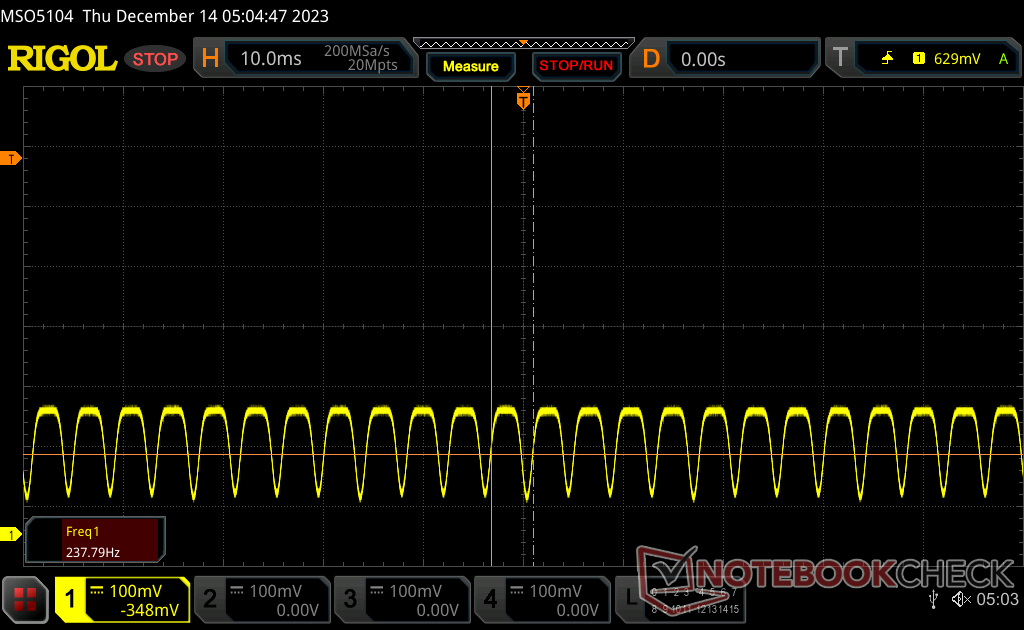
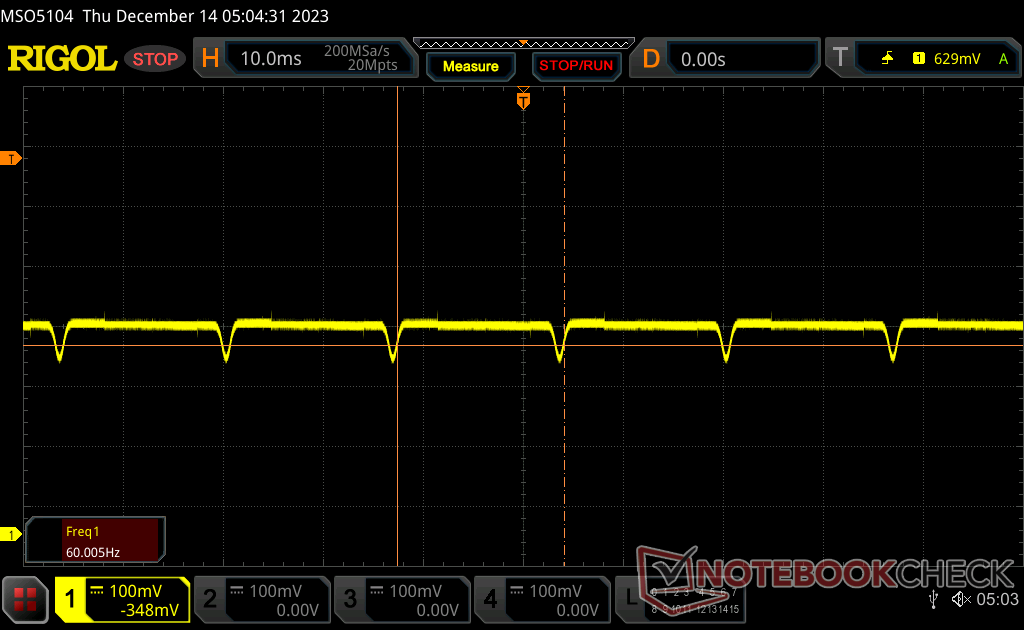
Ekran Titremesi / PWM (Darbe Genişliği Modülasyonu)
| Ekran titriyor / PWM algılandı | 60 Hz | ≤ 100 % parlaklık ayarı | 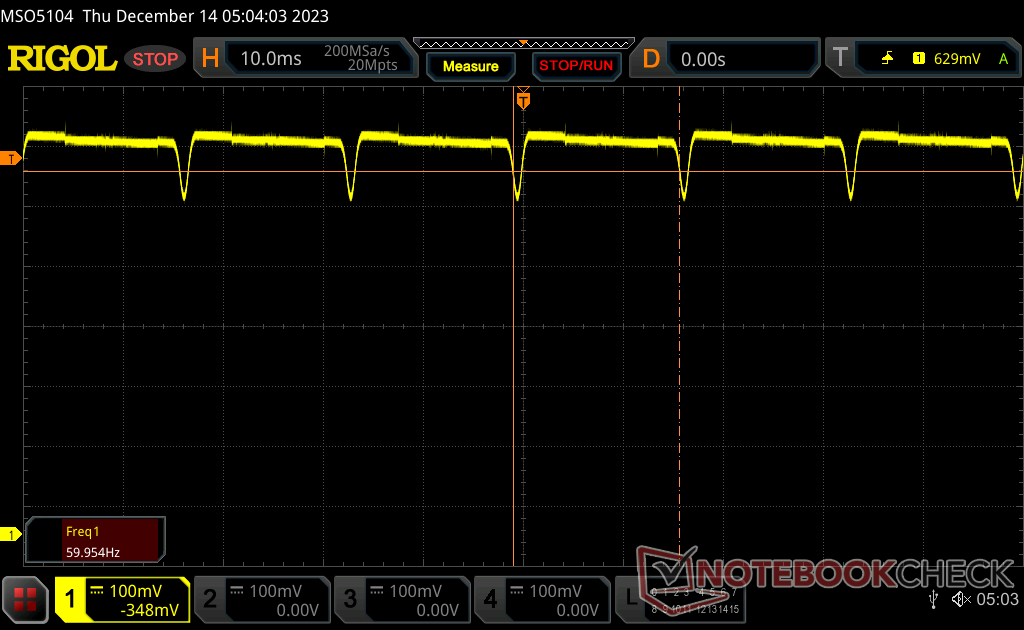 |
Ekran arka ışığı 60 Hz'de titriyor (en kötü durum, örneğin PWM kullanılması) 100 % ve altındaki parlaklık ayarında titreme algılandı. Bu parlaklık ayarının üzerinde titreme veya PWM olmamalıdır. 60 Hz frekansı çok düşüktür, bu nedenle titreme, uzun süreli kullanımdan sonra göz yorgunluğuna ve baş ağrısına neden olabilir. Karşılaştırıldığında: Test edilen tüm cihazların %52 %'si ekranı karartmak için PWM kullanmıyor. PWM tespit edilirse, ortalama 7741 (minimum: 5 - maksimum: 343500) Hz ölçüldü. | |||
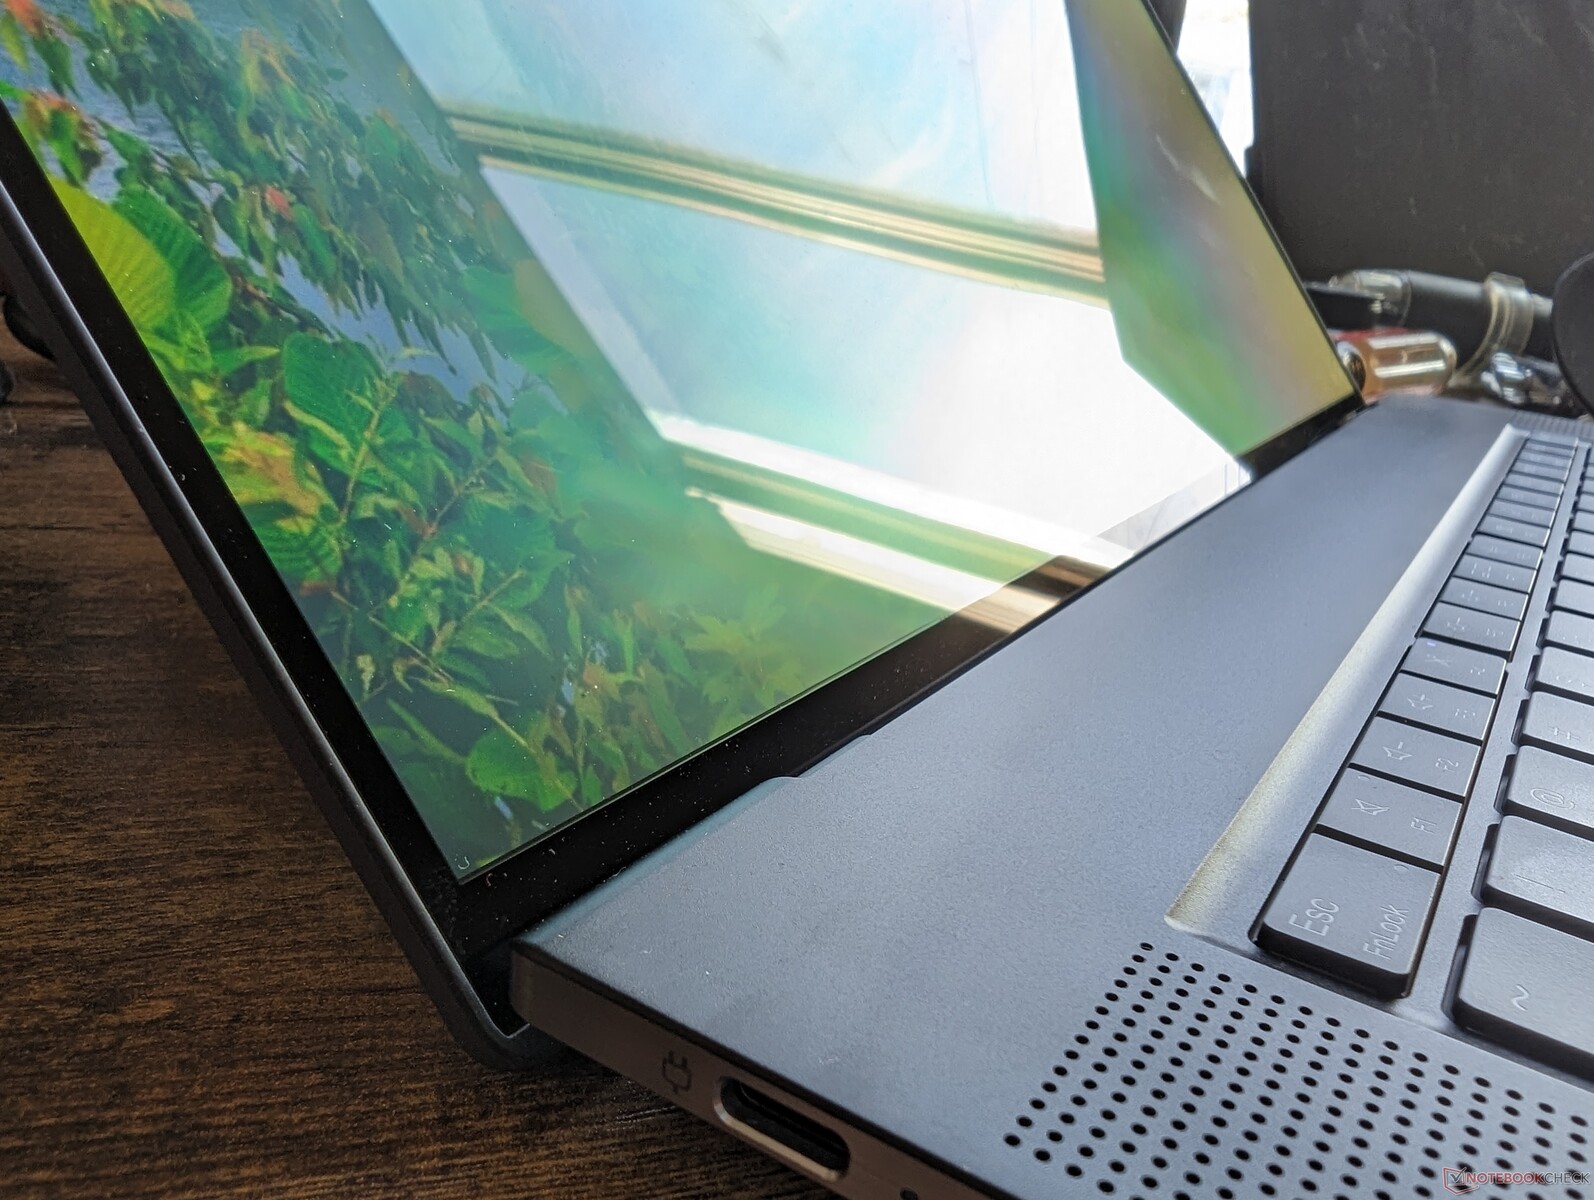
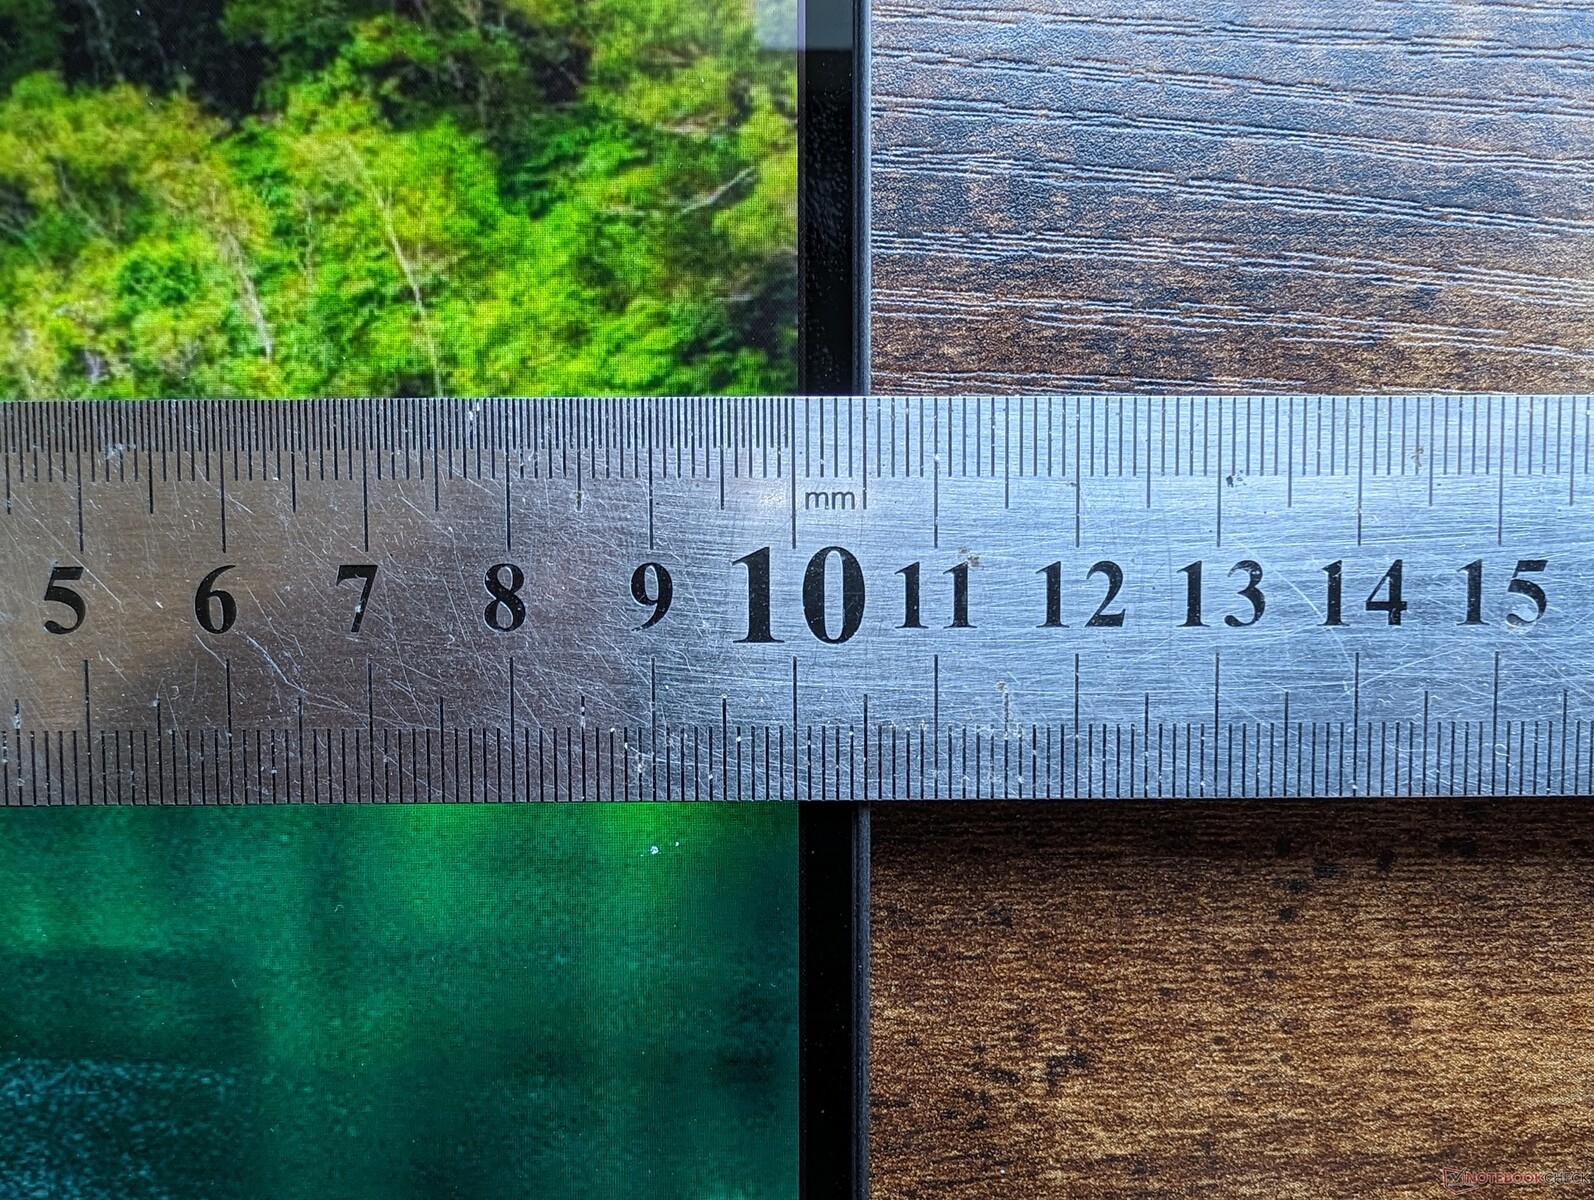
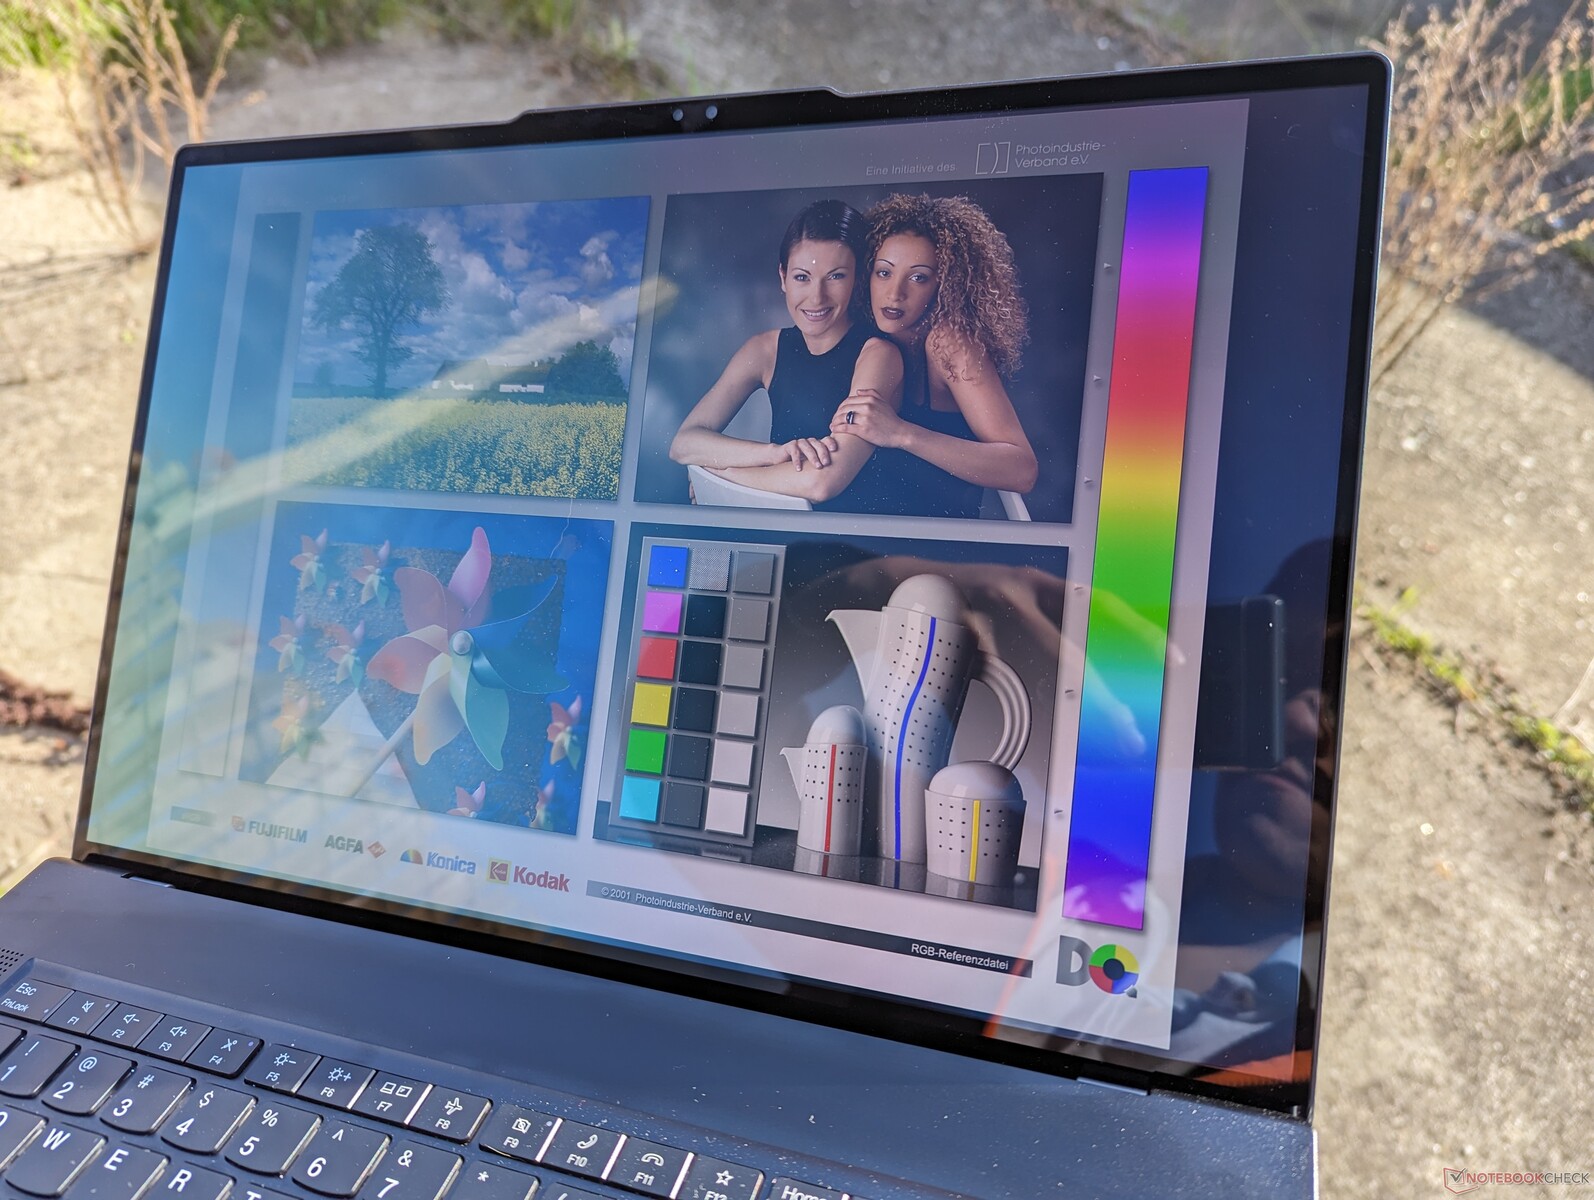
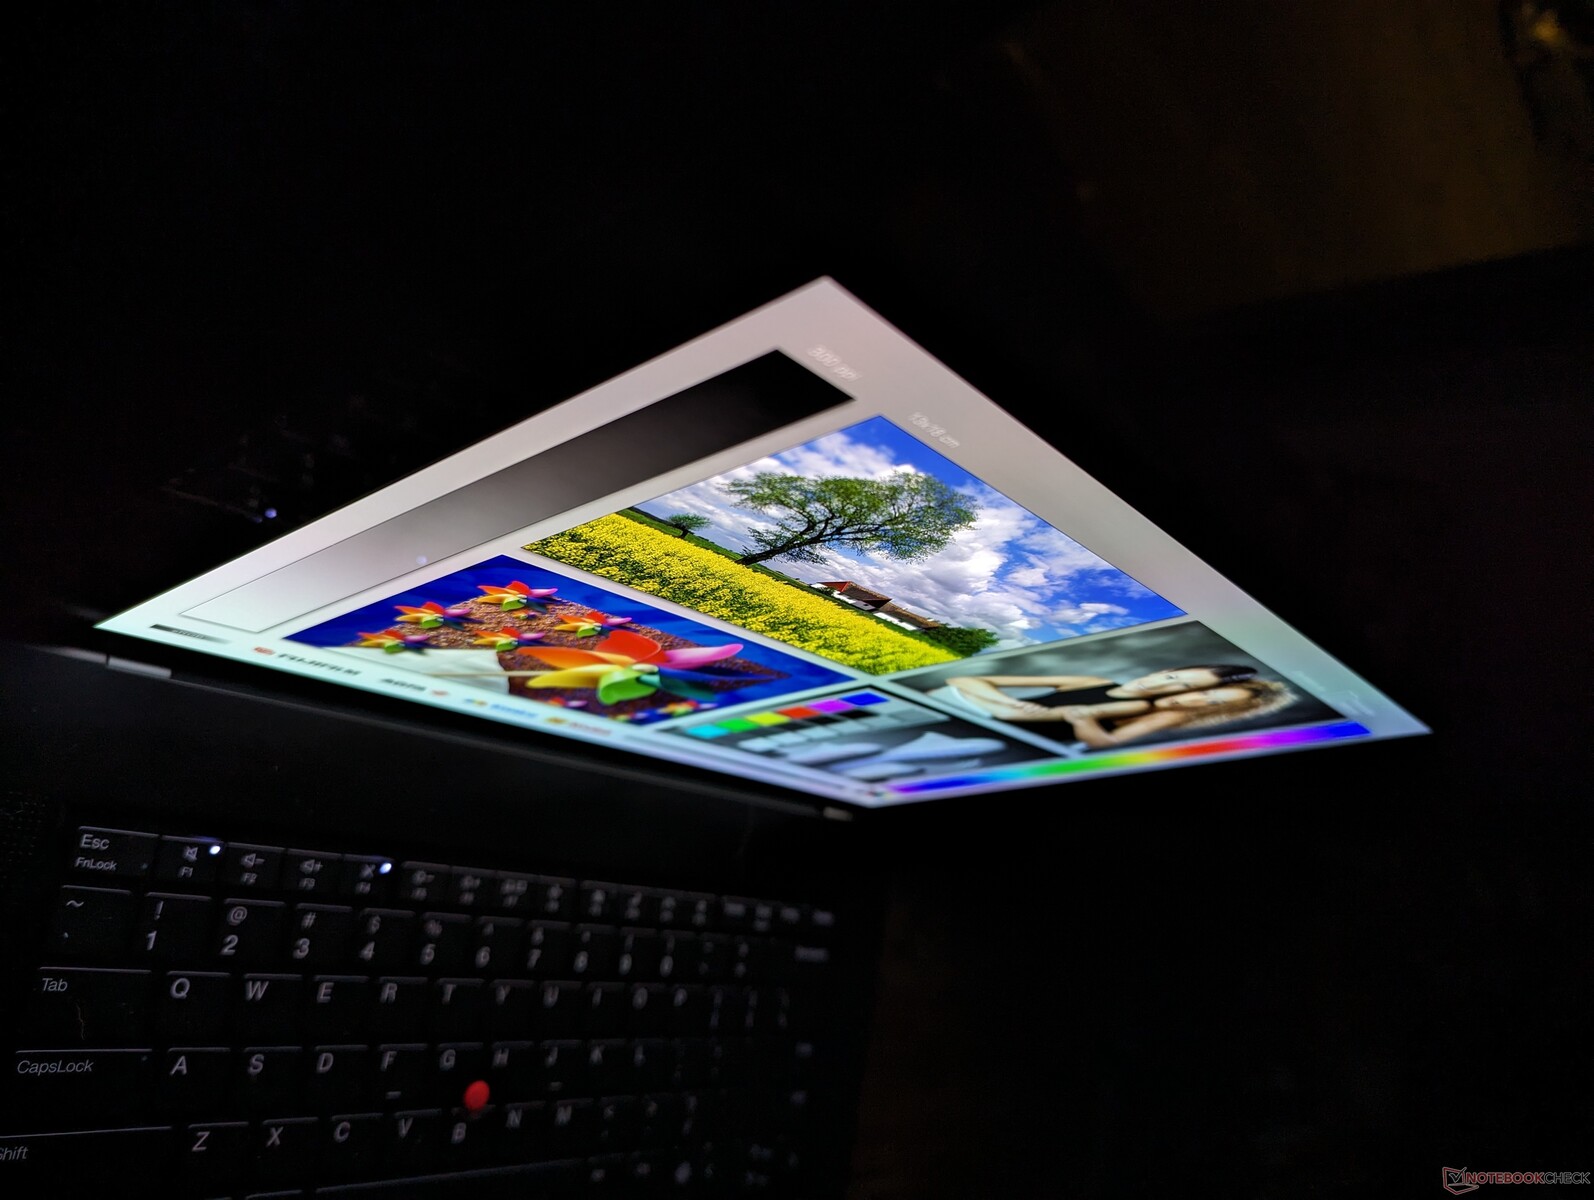
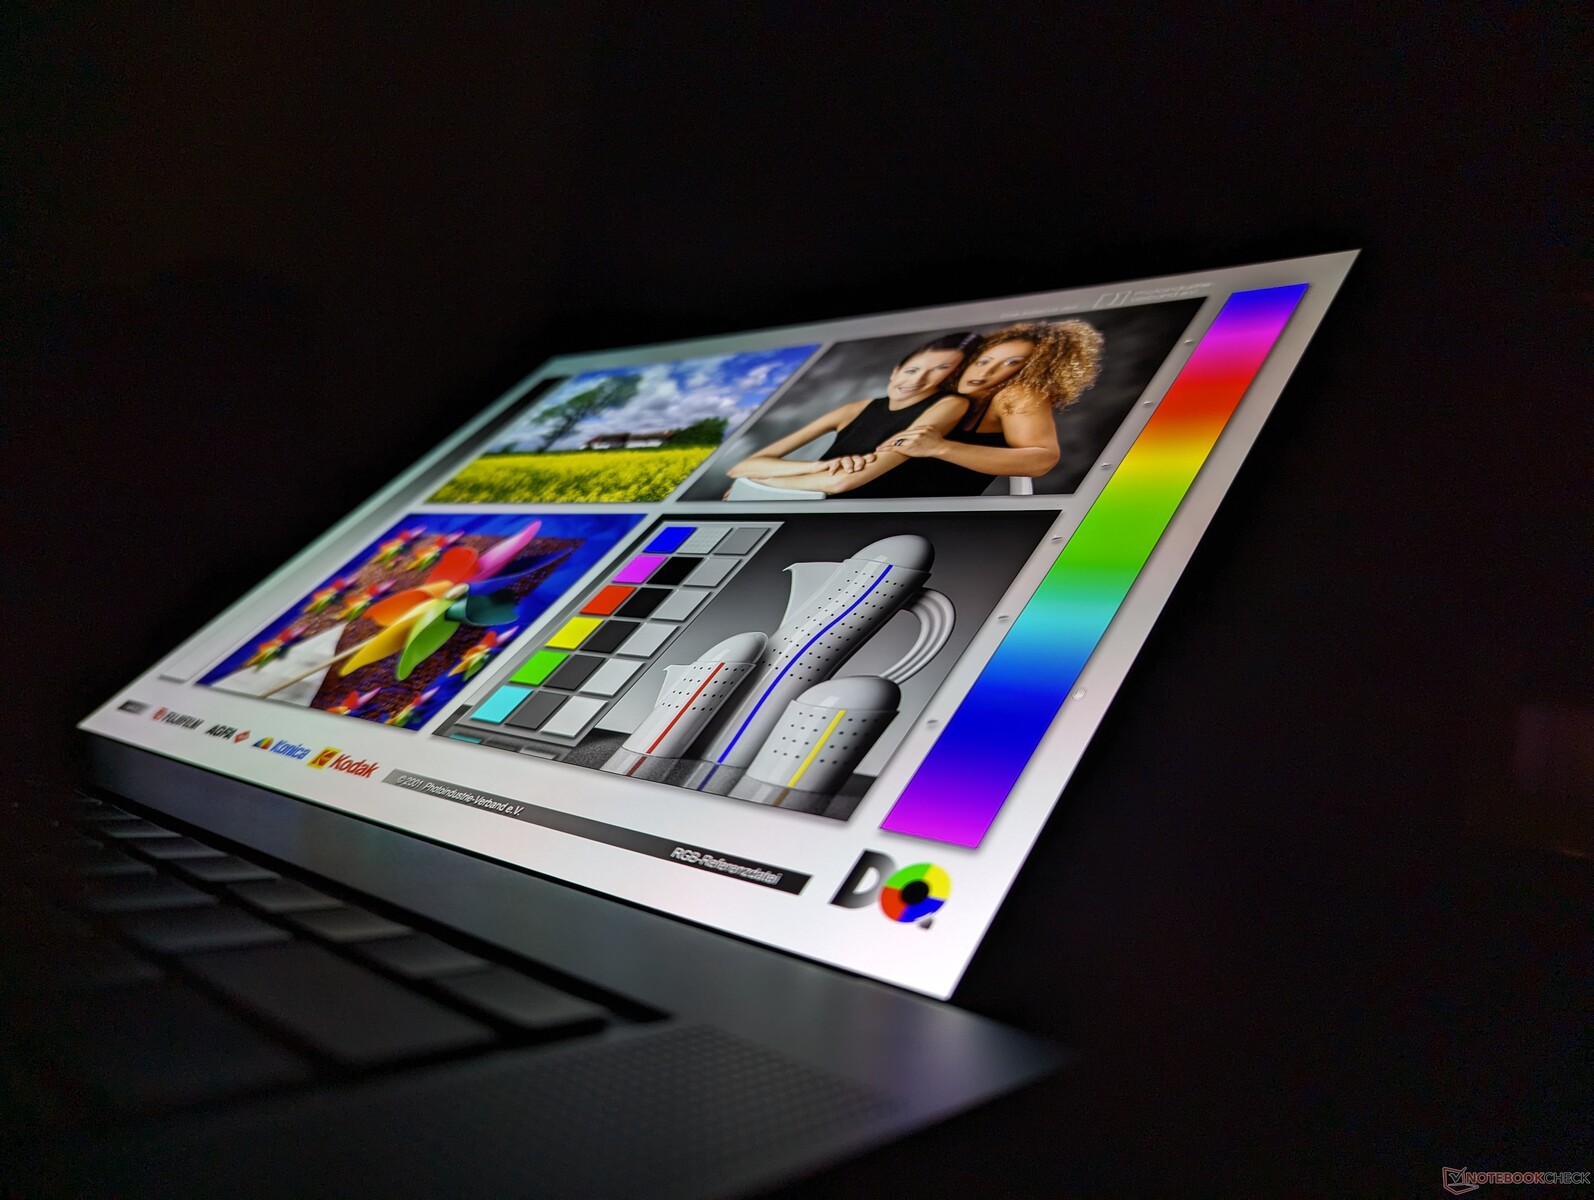
Görüntüleme açıları IPS'den daha geniştir ve daha derin siyah seviyeleri parlak ortam aydınlatması altında renklerin korunmasına yardımcı olur. Buna rağmen, parlak kaplamadan kaynaklanan parlama kaçınılmazdır ve maksimum parlaklık temel 1200p IPS yapılandırmasından daha parlak değildir. Karşılaştırma yapmak gerekirse MacBook Pro 16 daha iyi dış mekan görünürlüğü için yüzde 50 daha parlaktır.
Performans
Test Koşulları
Aşağıdaki kıyaslamaları çalıştırmadan önce Windows'u Performans moduna ayarladık. Önceden yüklenmiş Lenovo Commercial Vantage yazılımı, normal Windows seçiminin ötesinde herhangi bir ek güç profili ayarı içermez. Yine de BIOS güncellemeleri ve pil şarj davranışını ayarlamak için hayati önem taşıyor.
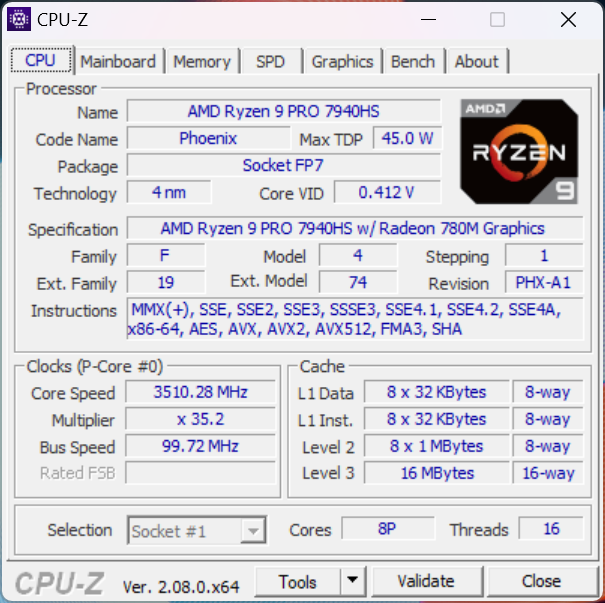
İşlemci
Bu Ryzen 9 Pro 7940HS ile aynı performansı gösterir Ryzen 9 7940HS üzerinde bulunduğu gibi Asus TUF Gaming A16. Böylece, kullanıcıların Pro özelliklerinden yararlanmak için performanstan ödün vermeleri gerekmeyecek. Genel performans geçen yılki 12. nesil ile karşılaştırılabilir Core i9-12900H hem tek hem de çok iş parçacıklı iş yüklerinde.
Zen 4 Ryzen 9 Pro 7940HS ile Zen 3+ arasındaki performans farkları Ryzen 7 Pro 6850H geçen yılki ThinkPad Z16 Gen 1'de daha fazla sayıda çekirdek nedeniyle çok iş parçacıklı iş yükleri için yüzde 35 ila 45 oranında oldukça önemli olabilir. Bu nedenle, Zen 4 ile sağlanan performans artışı, ThinkPad Z16'nın Gen 1 yerine Gen 2 sürümünü seçmenin ana nedenlerinden biridir.
Alt uç konfigürasyonlar şunları sunar Ryzen 7 Pro 7840HS veya Ryzen 5 Pro 7640HS bunun yerine. Ryzen 7 seçeneği, Ryzen 9 seçeneğiyle geçirdiğimiz zamana dayanarak neredeyse aynı performansı gösteriyor Lenovo Legion Slim 5 16 bu nedenle maliyetten tasarruf etmek için bir Ryzen 7 yapılandırması seçmeniz önerilir. Aslında Ryzen 7 Pro 7840HS, Ryzen 9 Pro 7940HS ile tamamen aynı sayıda çekirdeği ve özellikleri paylaşır ve hedef saat hızlarında yalnızca 100 ila 200 MHz'lik çok küçük farklar vardır.
Ryzen 5 Pro 7640HS konfigürasyonuna geçişin işlemci performansını, Ryzen 5 Pro 7640HS ile geçirdiğimiz süreye bağlı olarak yaklaşık yüzde 30 ila 35 oranında daha önemli ölçüde etkilemesi beklenmektedir HP ZBook Firefly 14 G10. Bu nedenle Ryzen 5, Ryzen 7 ve Ryzen 9 seçenekleri arasındaki performans farkları, Ryzen 5 ve Ryzen 7 SKU'ları arasında büyük ölçüde çarpıktır.
Cinebench R15 Multi Loop
Cinebench R23: Multi Core | Single Core
Cinebench R20: CPU (Multi Core) | CPU (Single Core)
Cinebench R15: CPU Multi 64Bit | CPU Single 64Bit
Blender: v2.79 BMW27 CPU
7-Zip 18.03: 7z b 4 | 7z b 4 -mmt1
Geekbench 5.5: Multi-Core | Single-Core
HWBOT x265 Benchmark v2.2: 4k Preset
LibreOffice : 20 Documents To PDF
R Benchmark 2.5: Overall mean
| CPU Performance rating | |
| Asus Zephyrus Duo 16 GX650PY-NM006W | |
| MSI Raider GE68HX 13VF | |
| Asus Vivobook Pro 16X K6604JV-MX016W | |
| Alienware m16 R1 AMD | |
| MSI Raider GE68 HX 13VG, i7-13700HX | |
| Lenovo ThinkPad P1 G6 21FV001KUS | |
| MSI Creator Z16P B12UHST | |
| Lenovo Legion Slim 5 16APH8 | |
| Lenovo ThinkPad Z16 Gen 2 | |
| MSI Stealth 16 Mercedes-AMG Motorsport A13VG | |
| HP Victus 16-r0076TX -1! | |
| Apple MacBook Pro 16 2023 M3 Pro -8! | |
| Lenovo Legion Slim 7 16APH8 | |
| Ortalama AMD Ryzen 9 PRO 7940HS | |
| Lenovo ThinkPad Z16 G1 21D5S00T00 | |
| HP ZBook Firefly 14 G10 A | |
| LG Gram 2in1 16 16T90R - G.AA78G | |
| Lenovo ThinkBook 16 G6 ABP | |
| Cinebench R23 / Multi Core | |
| Asus Zephyrus Duo 16 GX650PY-NM006W | |
| MSI Raider GE68HX 13VF | |
| Asus Vivobook Pro 16X K6604JV-MX016W | |
| Alienware m16 R1 AMD | |
| MSI Raider GE68 HX 13VG, i7-13700HX | |
| MSI Stealth 16 Mercedes-AMG Motorsport A13VG | |
| MSI Creator Z16P B12UHST | |
| HP Victus 16-r0076TX | |
| Lenovo ThinkPad P1 G6 21FV001KUS | |
| Lenovo Legion Slim 5 16APH8 | |
| Lenovo ThinkPad Z16 Gen 2 | |
| Lenovo Legion Slim 7 16APH8 | |
| Ortalama AMD Ryzen 9 PRO 7940HS (14919 - 16938, n=3) | |
| Apple MacBook Pro 16 2023 M3 Pro | |
| Lenovo ThinkPad Z16 G1 21D5S00T00 | |
| LG Gram 2in1 16 16T90R - G.AA78G | |
| HP ZBook Firefly 14 G10 A | |
| Lenovo ThinkBook 16 G6 ABP | |
| Cinebench R23 / Single Core | |
| MSI Raider GE68HX 13VF | |
| MSI Stealth 16 Mercedes-AMG Motorsport A13VG | |
| Lenovo ThinkPad P1 G6 21FV001KUS | |
| Apple MacBook Pro 16 2023 M3 Pro | |
| Asus Zephyrus Duo 16 GX650PY-NM006W | |
| MSI Creator Z16P B12UHST | |
| MSI Raider GE68 HX 13VG, i7-13700HX | |
| Alienware m16 R1 AMD | |
| Asus Vivobook Pro 16X K6604JV-MX016W | |
| Lenovo ThinkPad Z16 Gen 2 | |
| Lenovo Legion Slim 5 16APH8 | |
| Lenovo Legion Slim 7 16APH8 | |
| Ortalama AMD Ryzen 9 PRO 7940HS (1568 - 1794, n=3) | |
| LG Gram 2in1 16 16T90R - G.AA78G | |
| HP Victus 16-r0076TX | |
| HP ZBook Firefly 14 G10 A | |
| Lenovo ThinkPad Z16 G1 21D5S00T00 | |
| Lenovo ThinkBook 16 G6 ABP | |
| Cinebench R20 / CPU (Multi Core) | |
| Asus Zephyrus Duo 16 GX650PY-NM006W | |
| MSI Raider GE68HX 13VF | |
| Asus Vivobook Pro 16X K6604JV-MX016W | |
| Alienware m16 R1 AMD | |
| MSI Raider GE68 HX 13VG, i7-13700HX | |
| MSI Stealth 16 Mercedes-AMG Motorsport A13VG | |
| HP Victus 16-r0076TX | |
| MSI Creator Z16P B12UHST | |
| Lenovo ThinkPad P1 G6 21FV001KUS | |
| Lenovo Legion Slim 5 16APH8 | |
| Lenovo ThinkPad Z16 Gen 2 | |
| Lenovo Legion Slim 7 16APH8 | |
| Ortalama AMD Ryzen 9 PRO 7940HS (5790 - 6601, n=3) | |
| Lenovo ThinkPad Z16 G1 21D5S00T00 | |
| HP ZBook Firefly 14 G10 A | |
| LG Gram 2in1 16 16T90R - G.AA78G | |
| Lenovo ThinkBook 16 G6 ABP | |
| Cinebench R20 / CPU (Single Core) | |
| MSI Raider GE68HX 13VF | |
| MSI Stealth 16 Mercedes-AMG Motorsport A13VG | |
| Lenovo ThinkPad P1 G6 21FV001KUS | |
| Asus Zephyrus Duo 16 GX650PY-NM006W | |
| MSI Creator Z16P B12UHST | |
| MSI Raider GE68 HX 13VG, i7-13700HX | |
| Alienware m16 R1 AMD | |
| Asus Vivobook Pro 16X K6604JV-MX016W | |
| Lenovo Legion Slim 5 16APH8 | |
| Lenovo ThinkPad Z16 Gen 2 | |
| Lenovo Legion Slim 7 16APH8 | |
| Ortalama AMD Ryzen 9 PRO 7940HS (611 - 695, n=3) | |
| LG Gram 2in1 16 16T90R - G.AA78G | |
| HP Victus 16-r0076TX | |
| HP ZBook Firefly 14 G10 A | |
| Lenovo ThinkPad Z16 G1 21D5S00T00 | |
| Lenovo ThinkBook 16 G6 ABP | |
| Cinebench R15 / CPU Multi 64Bit | |
| Asus Zephyrus Duo 16 GX650PY-NM006W | |
| Asus Vivobook Pro 16X K6604JV-MX016W | |
| MSI Raider GE68HX 13VF | |
| Alienware m16 R1 AMD | |
| MSI Raider GE68 HX 13VG, i7-13700HX | |
| MSI Stealth 16 Mercedes-AMG Motorsport A13VG | |
| MSI Creator Z16P B12UHST | |
| HP Victus 16-r0076TX | |
| Lenovo ThinkPad P1 G6 21FV001KUS | |
| Lenovo ThinkPad Z16 Gen 2 | |
| Lenovo Legion Slim 5 16APH8 | |
| Lenovo Legion Slim 7 16APH8 | |
| Ortalama AMD Ryzen 9 PRO 7940HS (2356 - 2718, n=3) | |
| LG Gram 2in1 16 16T90R - G.AA78G | |
| Apple MacBook Pro 16 2023 M3 Pro | |
| Lenovo ThinkPad Z16 G1 21D5S00T00 | |
| HP ZBook Firefly 14 G10 A | |
| Lenovo ThinkBook 16 G6 ABP | |
| Cinebench R15 / CPU Single 64Bit | |
| Asus Zephyrus Duo 16 GX650PY-NM006W | |
| MSI Raider GE68HX 13VF | |
| Alienware m16 R1 AMD | |
| Asus Vivobook Pro 16X K6604JV-MX016W | |
| Lenovo ThinkPad P1 G6 21FV001KUS | |
| Lenovo Legion Slim 5 16APH8 | |
| MSI Stealth 16 Mercedes-AMG Motorsport A13VG | |
| Lenovo ThinkPad Z16 Gen 2 | |
| MSI Creator Z16P B12UHST | |
| MSI Raider GE68 HX 13VG, i7-13700HX | |
| Lenovo Legion Slim 7 16APH8 | |
| Ortalama AMD Ryzen 9 PRO 7940HS (247 - 280, n=3) | |
| HP ZBook Firefly 14 G10 A | |
| Lenovo ThinkPad Z16 G1 21D5S00T00 | |
| LG Gram 2in1 16 16T90R - G.AA78G | |
| HP Victus 16-r0076TX | |
| Lenovo ThinkBook 16 G6 ABP | |
| Blender / v2.79 BMW27 CPU | |
| Lenovo ThinkBook 16 G6 ABP | |
| Apple MacBook Pro 16 2023 M3 Pro | |
| LG Gram 2in1 16 16T90R - G.AA78G | |
| HP ZBook Firefly 14 G10 A | |
| Lenovo ThinkPad Z16 G1 21D5S00T00 | |
| MSI Stealth 16 Mercedes-AMG Motorsport A13VG | |
| Ortalama AMD Ryzen 9 PRO 7940HS (191 - 215, n=3) | |
| Lenovo Legion Slim 7 16APH8 | |
| HP Victus 16-r0076TX | |
| Lenovo ThinkPad P1 G6 21FV001KUS | |
| Lenovo ThinkPad Z16 Gen 2 | |
| MSI Creator Z16P B12UHST | |
| Lenovo Legion Slim 5 16APH8 | |
| MSI Raider GE68 HX 13VG, i7-13700HX | |
| Asus Vivobook Pro 16X K6604JV-MX016W | |
| Alienware m16 R1 AMD | |
| MSI Raider GE68HX 13VF | |
| Asus Zephyrus Duo 16 GX650PY-NM006W | |
| 7-Zip 18.03 / 7z b 4 | |
| Asus Zephyrus Duo 16 GX650PY-NM006W | |
| MSI Raider GE68HX 13VF | |
| Alienware m16 R1 AMD | |
| Asus Vivobook Pro 16X K6604JV-MX016W | |
| MSI Raider GE68 HX 13VG, i7-13700HX | |
| MSI Creator Z16P B12UHST | |
| HP Victus 16-r0076TX | |
| Lenovo ThinkPad P1 G6 21FV001KUS | |
| Lenovo Legion Slim 7 16APH8 | |
| Lenovo Legion Slim 5 16APH8 | |
| Lenovo ThinkPad Z16 Gen 2 | |
| Ortalama AMD Ryzen 9 PRO 7940HS (61111 - 67813, n=3) | |
| MSI Stealth 16 Mercedes-AMG Motorsport A13VG | |
| Lenovo ThinkPad Z16 G1 21D5S00T00 | |
| HP ZBook Firefly 14 G10 A | |
| LG Gram 2in1 16 16T90R - G.AA78G | |
| Lenovo ThinkBook 16 G6 ABP | |
| 7-Zip 18.03 / 7z b 4 -mmt1 | |
| Asus Zephyrus Duo 16 GX650PY-NM006W | |
| Alienware m16 R1 AMD | |
| Asus Vivobook Pro 16X K6604JV-MX016W | |
| MSI Raider GE68HX 13VF | |
| Lenovo Legion Slim 7 16APH8 | |
| Lenovo Legion Slim 5 16APH8 | |
| Lenovo ThinkPad P1 G6 21FV001KUS | |
| MSI Stealth 16 Mercedes-AMG Motorsport A13VG | |
| Lenovo ThinkPad Z16 Gen 2 | |
| Ortalama AMD Ryzen 9 PRO 7940HS (5844 - 6497, n=3) | |
| MSI Raider GE68 HX 13VG, i7-13700HX | |
| MSI Creator Z16P B12UHST | |
| HP ZBook Firefly 14 G10 A | |
| HP Victus 16-r0076TX | |
| Lenovo ThinkPad Z16 G1 21D5S00T00 | |
| Lenovo ThinkBook 16 G6 ABP | |
| LG Gram 2in1 16 16T90R - G.AA78G | |
| Geekbench 5.5 / Multi-Core | |
| MSI Raider GE68HX 13VF | |
| Asus Zephyrus Duo 16 GX650PY-NM006W | |
| Asus Vivobook Pro 16X K6604JV-MX016W | |
| MSI Raider GE68 HX 13VG, i7-13700HX | |
| Apple MacBook Pro 16 2023 M3 Pro | |
| Alienware m16 R1 AMD | |
| MSI Creator Z16P B12UHST | |
| Lenovo ThinkPad P1 G6 21FV001KUS | |
| HP Victus 16-r0076TX | |
| Lenovo ThinkPad Z16 Gen 2 | |
| Lenovo Legion Slim 7 16APH8 | |
| Lenovo Legion Slim 5 16APH8 | |
| Ortalama AMD Ryzen 9 PRO 7940HS (9897 - 12038, n=3) | |
| MSI Stealth 16 Mercedes-AMG Motorsport A13VG | |
| LG Gram 2in1 16 16T90R - G.AA78G | |
| HP ZBook Firefly 14 G10 A | |
| Lenovo ThinkPad Z16 G1 21D5S00T00 | |
| Lenovo ThinkBook 16 G6 ABP | |
| Geekbench 5.5 / Single-Core | |
| Apple MacBook Pro 16 2023 M3 Pro | |
| Asus Zephyrus Duo 16 GX650PY-NM006W | |
| MSI Raider GE68HX 13VF | |
| Alienware m16 R1 AMD | |
| Asus Vivobook Pro 16X K6604JV-MX016W | |
| Lenovo Legion Slim 5 16APH8 | |
| MSI Stealth 16 Mercedes-AMG Motorsport A13VG | |
| Lenovo ThinkPad P1 G6 21FV001KUS | |
| Lenovo ThinkPad Z16 Gen 2 | |
| Lenovo Legion Slim 7 16APH8 | |
| MSI Raider GE68 HX 13VG, i7-13700HX | |
| Ortalama AMD Ryzen 9 PRO 7940HS (1758 - 1969, n=3) | |
| MSI Creator Z16P B12UHST | |
| HP ZBook Firefly 14 G10 A | |
| HP Victus 16-r0076TX | |
| LG Gram 2in1 16 16T90R - G.AA78G | |
| Lenovo ThinkBook 16 G6 ABP | |
| Lenovo ThinkPad Z16 G1 21D5S00T00 | |
| HWBOT x265 Benchmark v2.2 / 4k Preset | |
| Asus Zephyrus Duo 16 GX650PY-NM006W | |
| MSI Raider GE68HX 13VF | |
| Alienware m16 R1 AMD | |
| Asus Vivobook Pro 16X K6604JV-MX016W | |
| MSI Raider GE68 HX 13VG, i7-13700HX | |
| Lenovo Legion Slim 5 16APH8 | |
| Lenovo ThinkPad Z16 Gen 2 | |
| HP Victus 16-r0076TX | |
| Lenovo Legion Slim 7 16APH8 | |
| Lenovo ThinkPad P1 G6 21FV001KUS | |
| MSI Creator Z16P B12UHST | |
| Ortalama AMD Ryzen 9 PRO 7940HS (17 - 20.4, n=3) | |
| Lenovo ThinkPad Z16 G1 21D5S00T00 | |
| HP ZBook Firefly 14 G10 A | |
| MSI Stealth 16 Mercedes-AMG Motorsport A13VG | |
| Lenovo ThinkBook 16 G6 ABP | |
| LG Gram 2in1 16 16T90R - G.AA78G | |
| LibreOffice / 20 Documents To PDF | |
| Lenovo Legion Slim 7 16APH8 | |
| Asus Zephyrus Duo 16 GX650PY-NM006W | |
| MSI Stealth 16 Mercedes-AMG Motorsport A13VG | |
| LG Gram 2in1 16 16T90R - G.AA78G | |
| HP ZBook Firefly 14 G10 A | |
| Lenovo ThinkBook 16 G6 ABP | |
| MSI Raider GE68 HX 13VG, i7-13700HX | |
| Asus Vivobook Pro 16X K6604JV-MX016W | |
| Lenovo ThinkPad Z16 G1 21D5S00T00 | |
| Ortalama AMD Ryzen 9 PRO 7940HS (46.1 - 55, n=3) | |
| Lenovo ThinkPad Z16 Gen 2 | |
| Lenovo ThinkPad P1 G6 21FV001KUS | |
| Alienware m16 R1 AMD | |
| MSI Creator Z16P B12UHST | |
| Lenovo Legion Slim 5 16APH8 | |
| MSI Raider GE68HX 13VF | |
| R Benchmark 2.5 / Overall mean | |
| LG Gram 2in1 16 16T90R - G.AA78G | |
| Lenovo ThinkBook 16 G6 ABP | |
| Lenovo ThinkPad Z16 G1 21D5S00T00 | |
| HP Victus 16-r0076TX | |
| HP ZBook Firefly 14 G10 A | |
| Ortalama AMD Ryzen 9 PRO 7940HS (0.4462 - 0.4835, n=3) | |
| Lenovo ThinkPad Z16 Gen 2 | |
| Lenovo Legion Slim 7 16APH8 | |
| MSI Raider GE68 HX 13VG, i7-13700HX | |
| Lenovo Legion Slim 5 16APH8 | |
| MSI Creator Z16P B12UHST | |
| MSI Stealth 16 Mercedes-AMG Motorsport A13VG | |
| Alienware m16 R1 AMD | |
| Lenovo ThinkPad P1 G6 21FV001KUS | |
| Asus Vivobook Pro 16X K6604JV-MX016W | |
| Asus Zephyrus Duo 16 GX650PY-NM006W | |
| MSI Raider GE68HX 13VF | |
Cinebench R23: Multi Core | Single Core
Cinebench R20: CPU (Multi Core) | CPU (Single Core)
Cinebench R15: CPU Multi 64Bit | CPU Single 64Bit
Blender: v2.79 BMW27 CPU
7-Zip 18.03: 7z b 4 | 7z b 4 -mmt1
Geekbench 5.5: Multi-Core | Single-Core
HWBOT x265 Benchmark v2.2: 4k Preset
LibreOffice : 20 Documents To PDF
R Benchmark 2.5: Overall mean
* ... daha küçük daha iyidir
AIDA64: FP32 Ray-Trace | FPU Julia | CPU SHA3 | CPU Queen | FPU SinJulia | FPU Mandel | CPU AES | CPU ZLib | FP64 Ray-Trace | CPU PhotoWorxx
| Performance rating | |
| Lenovo ThinkPad Z16 Gen 2 | |
| Asus Vivobook Pro 16X K6604JV-MX016W | |
| Ortalama AMD Ryzen 9 PRO 7940HS | |
| Lenovo ThinkPad Z16 G1 21D5S00T00 | |
| MSI Creator Z16P B12UHST | |
| Lenovo ThinkBook 16 G6 ABP | |
| AIDA64 / FP32 Ray-Trace | |
| Lenovo ThinkPad Z16 Gen 2 | |
| Ortalama AMD Ryzen 9 PRO 7940HS (24034 - 27411, n=3) | |
| Asus Vivobook Pro 16X K6604JV-MX016W | |
| Lenovo ThinkPad Z16 G1 21D5S00T00 | |
| Lenovo ThinkBook 16 G6 ABP | |
| MSI Creator Z16P B12UHST | |
| AIDA64 / FPU Julia | |
| Lenovo ThinkPad Z16 Gen 2 | |
| Asus Vivobook Pro 16X K6604JV-MX016W | |
| Ortalama AMD Ryzen 9 PRO 7940HS (101262 - 116960, n=3) | |
| Lenovo ThinkPad Z16 G1 21D5S00T00 | |
| Lenovo ThinkBook 16 G6 ABP | |
| MSI Creator Z16P B12UHST | |
| AIDA64 / CPU SHA3 | |
| Asus Vivobook Pro 16X K6604JV-MX016W | |
| Lenovo ThinkPad Z16 Gen 2 | |
| Ortalama AMD Ryzen 9 PRO 7940HS (4418 - 4944, n=3) | |
| Lenovo ThinkPad Z16 G1 21D5S00T00 | |
| MSI Creator Z16P B12UHST | |
| Lenovo ThinkBook 16 G6 ABP | |
| AIDA64 / CPU Queen | |
| Asus Vivobook Pro 16X K6604JV-MX016W | |
| Lenovo ThinkPad Z16 Gen 2 | |
| Ortalama AMD Ryzen 9 PRO 7940HS (112873 - 124565, n=3) | |
| MSI Creator Z16P B12UHST | |
| Lenovo ThinkPad Z16 G1 21D5S00T00 | |
| Lenovo ThinkBook 16 G6 ABP | |
| AIDA64 / FPU SinJulia | |
| Lenovo ThinkPad Z16 Gen 2 | |
| Ortalama AMD Ryzen 9 PRO 7940HS (14147 - 15304, n=3) | |
| Asus Vivobook Pro 16X K6604JV-MX016W | |
| Lenovo ThinkPad Z16 G1 21D5S00T00 | |
| MSI Creator Z16P B12UHST | |
| Lenovo ThinkBook 16 G6 ABP | |
| AIDA64 / FPU Mandel | |
| Lenovo ThinkPad Z16 Gen 2 | |
| Ortalama AMD Ryzen 9 PRO 7940HS (54003 - 62357, n=3) | |
| Asus Vivobook Pro 16X K6604JV-MX016W | |
| Lenovo ThinkPad Z16 G1 21D5S00T00 | |
| Lenovo ThinkBook 16 G6 ABP | |
| MSI Creator Z16P B12UHST | |
| AIDA64 / CPU AES | |
| Asus Vivobook Pro 16X K6604JV-MX016W | |
| MSI Creator Z16P B12UHST | |
| Lenovo ThinkPad Z16 Gen 2 | |
| Ortalama AMD Ryzen 9 PRO 7940HS (76133 - 88705, n=3) | |
| Lenovo ThinkPad Z16 G1 21D5S00T00 | |
| Lenovo ThinkBook 16 G6 ABP | |
| AIDA64 / CPU ZLib | |
| Asus Vivobook Pro 16X K6604JV-MX016W | |
| MSI Creator Z16P B12UHST | |
| Lenovo ThinkPad Z16 Gen 2 | |
| Ortalama AMD Ryzen 9 PRO 7940HS (976 - 1079, n=3) | |
| Lenovo ThinkPad Z16 G1 21D5S00T00 | |
| Lenovo ThinkBook 16 G6 ABP | |
| AIDA64 / FP64 Ray-Trace | |
| Lenovo ThinkPad Z16 Gen 2 | |
| Ortalama AMD Ryzen 9 PRO 7940HS (12715 - 14590, n=3) | |
| Asus Vivobook Pro 16X K6604JV-MX016W | |
| Lenovo ThinkPad Z16 G1 21D5S00T00 | |
| Lenovo ThinkBook 16 G6 ABP | |
| MSI Creator Z16P B12UHST | |
| AIDA64 / CPU PhotoWorxx | |
| Asus Vivobook Pro 16X K6604JV-MX016W | |
| MSI Creator Z16P B12UHST | |
| Lenovo ThinkPad Z16 Gen 2 | |
| Ortalama AMD Ryzen 9 PRO 7940HS (24030 - 37800, n=3) | |
| Lenovo ThinkPad Z16 G1 21D5S00T00 | |
| Lenovo ThinkBook 16 G6 ABP | |
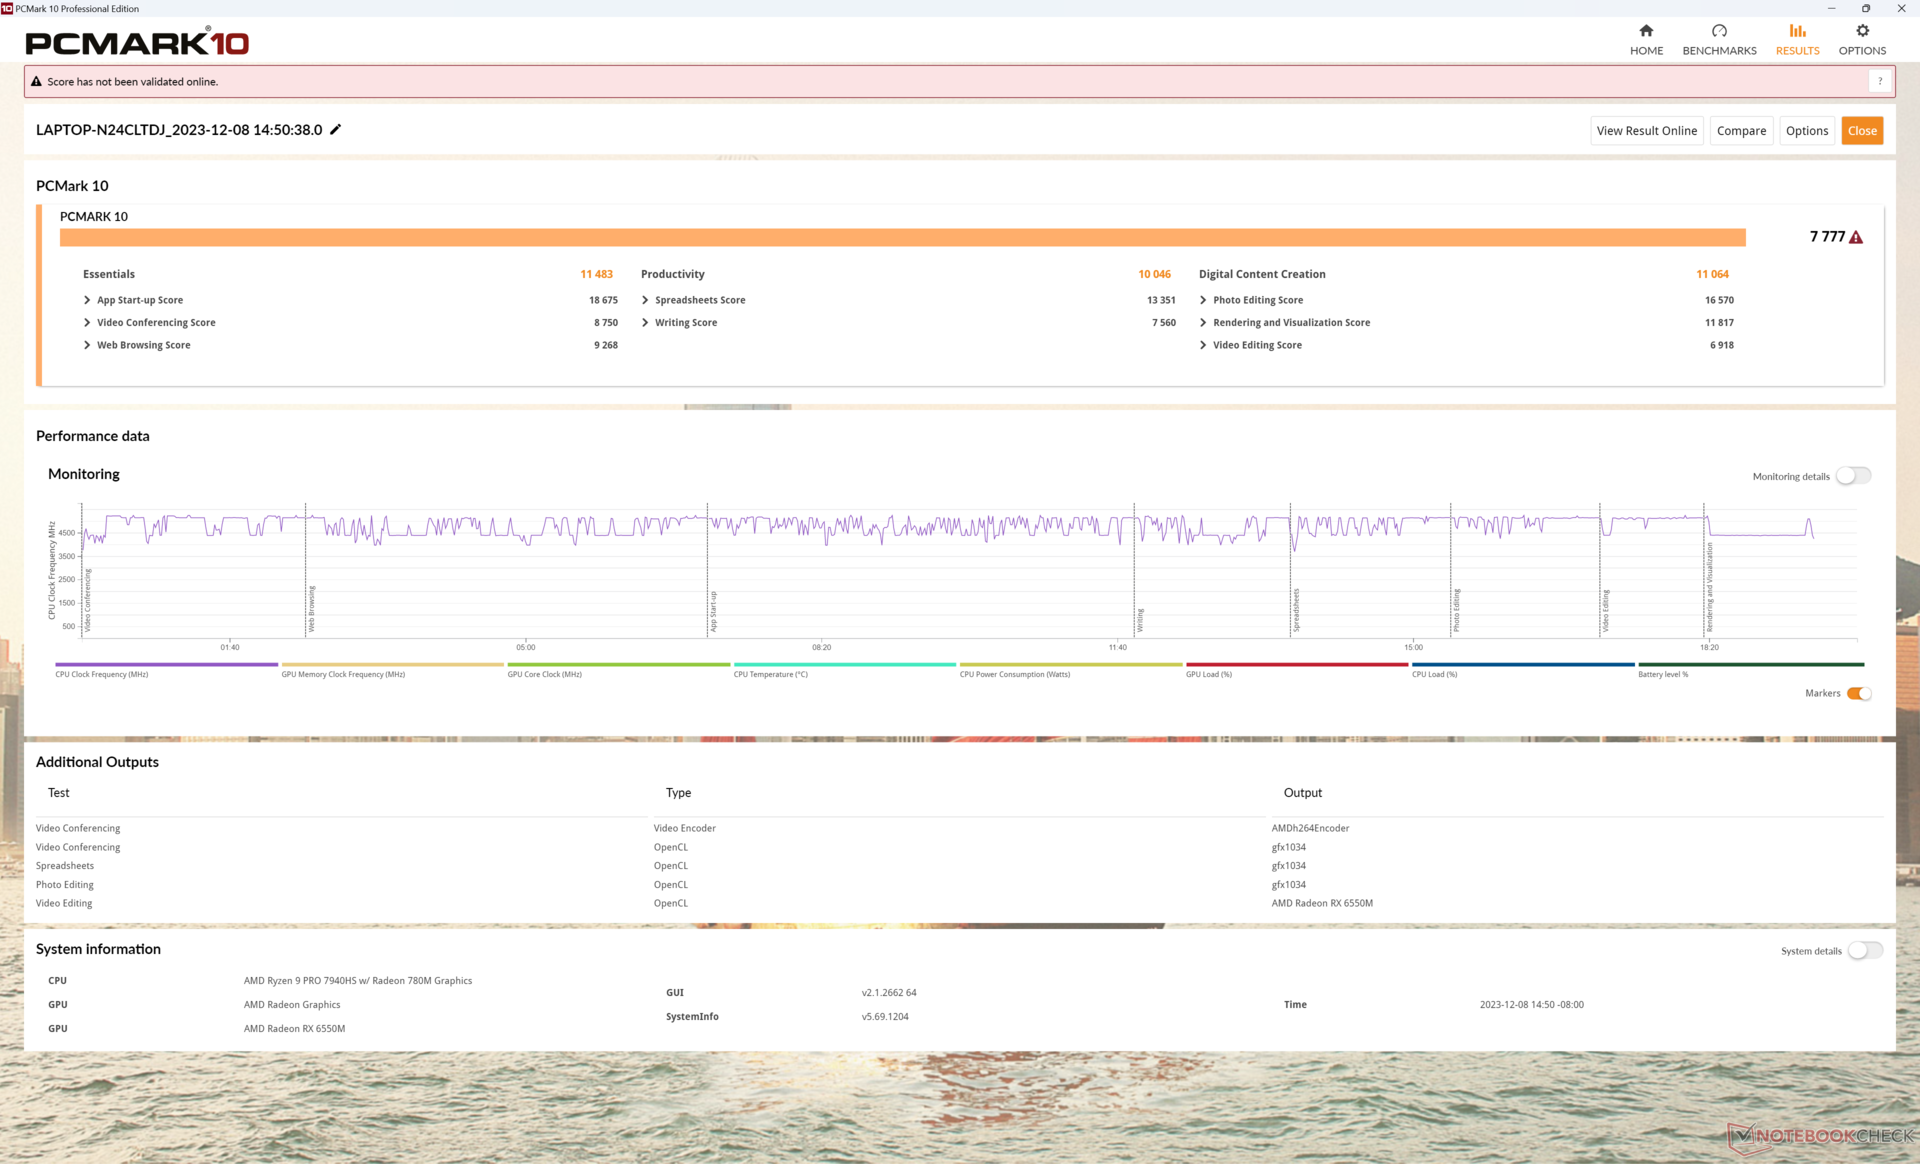
Sistem Performansı
CrossMark: Overall | Productivity | Creativity | Responsiveness
WebXPRT 3: Overall
WebXPRT 4: Overall
Mozilla Kraken 1.1: Total
| PCMark 10 / Score | |
| MSI Creator Z16P B12UHST | |
| Lenovo ThinkPad Z16 Gen 2 | |
| Ortalama AMD Ryzen 9 PRO 7940HS, AMD Radeon RX 6550M (n=1) | |
| Asus Vivobook Pro 16X K6604JV-MX016W | |
| Lenovo ThinkPad Z16 G1 21D5S00T00 | |
| Lenovo ThinkBook 16 G6 ABP | |
| PCMark 10 / Essentials | |
| Lenovo ThinkPad Z16 Gen 2 | |
| Ortalama AMD Ryzen 9 PRO 7940HS, AMD Radeon RX 6550M (n=1) | |
| MSI Creator Z16P B12UHST | |
| Lenovo ThinkBook 16 G6 ABP | |
| Asus Vivobook Pro 16X K6604JV-MX016W | |
| Lenovo ThinkPad Z16 G1 21D5S00T00 | |
| PCMark 10 / Productivity | |
| MSI Creator Z16P B12UHST | |
| Lenovo ThinkPad Z16 Gen 2 | |
| Ortalama AMD Ryzen 9 PRO 7940HS, AMD Radeon RX 6550M (n=1) | |
| Lenovo ThinkBook 16 G6 ABP | |
| Asus Vivobook Pro 16X K6604JV-MX016W | |
| Lenovo ThinkPad Z16 G1 21D5S00T00 | |
| PCMark 10 / Digital Content Creation | |
| MSI Creator Z16P B12UHST | |
| Lenovo ThinkPad Z16 Gen 2 | |
| Ortalama AMD Ryzen 9 PRO 7940HS, AMD Radeon RX 6550M (n=1) | |
| Asus Vivobook Pro 16X K6604JV-MX016W | |
| Lenovo ThinkPad Z16 G1 21D5S00T00 | |
| Lenovo ThinkBook 16 G6 ABP | |
| CrossMark / Overall | |
| Asus Vivobook Pro 16X K6604JV-MX016W | |
| Apple MacBook Pro 16 2023 M3 Pro | |
| Lenovo ThinkPad Z16 Gen 2 | |
| Ortalama AMD Ryzen 9 PRO 7940HS, AMD Radeon RX 6550M (n=1) | |
| Lenovo ThinkPad Z16 G1 21D5S00T00 | |
| Lenovo ThinkBook 16 G6 ABP | |
| CrossMark / Productivity | |
| Asus Vivobook Pro 16X K6604JV-MX016W | |
| Apple MacBook Pro 16 2023 M3 Pro | |
| Lenovo ThinkPad Z16 Gen 2 | |
| Ortalama AMD Ryzen 9 PRO 7940HS, AMD Radeon RX 6550M (n=1) | |
| Lenovo ThinkPad Z16 G1 21D5S00T00 | |
| Lenovo ThinkBook 16 G6 ABP | |
| CrossMark / Creativity | |
| Apple MacBook Pro 16 2023 M3 Pro | |
| Asus Vivobook Pro 16X K6604JV-MX016W | |
| Lenovo ThinkPad Z16 Gen 2 | |
| Ortalama AMD Ryzen 9 PRO 7940HS, AMD Radeon RX 6550M (n=1) | |
| Lenovo ThinkPad Z16 G1 21D5S00T00 | |
| Lenovo ThinkBook 16 G6 ABP | |
| CrossMark / Responsiveness | |
| Asus Vivobook Pro 16X K6604JV-MX016W | |
| Apple MacBook Pro 16 2023 M3 Pro | |
| Lenovo ThinkPad Z16 Gen 2 | |
| Ortalama AMD Ryzen 9 PRO 7940HS, AMD Radeon RX 6550M (n=1) | |
| Lenovo ThinkPad Z16 G1 21D5S00T00 | |
| Lenovo ThinkBook 16 G6 ABP | |
| WebXPRT 3 / Overall | |
| Apple MacBook Pro 16 2023 M3 Pro | |
| MSI Creator Z16P B12UHST | |
| Lenovo ThinkPad Z16 Gen 2 | |
| Ortalama AMD Ryzen 9 PRO 7940HS, AMD Radeon RX 6550M (n=1) | |
| Asus Vivobook Pro 16X K6604JV-MX016W | |
| Lenovo ThinkBook 16 G6 ABP | |
| Lenovo ThinkPad Z16 G1 21D5S00T00 | |
| WebXPRT 4 / Overall | |
| Lenovo ThinkPad Z16 Gen 2 | |
| Ortalama AMD Ryzen 9 PRO 7940HS, AMD Radeon RX 6550M (n=1) | |
| Asus Vivobook Pro 16X K6604JV-MX016W | |
| Lenovo ThinkBook 16 G6 ABP | |
| Lenovo ThinkPad Z16 G1 21D5S00T00 | |
| Mozilla Kraken 1.1 / Total | |
| Lenovo ThinkBook 16 G6 ABP | |
| Lenovo ThinkPad Z16 G1 21D5S00T00 | |
| Lenovo ThinkPad Z16 Gen 2 | |
| Ortalama AMD Ryzen 9 PRO 7940HS, AMD Radeon RX 6550M (n=1) | |
| Asus Vivobook Pro 16X K6604JV-MX016W | |
| MSI Creator Z16P B12UHST | |
| Apple MacBook Pro 16 2023 M3 Pro | |
* ... daha küçük daha iyidir
| PCMark 10 Score | 7777 puan | |
Yardım | ||
| AIDA64 / Memory Copy | |
| Asus Vivobook Pro 16X K6604JV-MX016W | |
| Lenovo ThinkPad Z16 Gen 2 | |
| MSI Creator Z16P B12UHST | |
| Lenovo ThinkPad Z16 G1 21D5S00T00 | |
| Ortalama AMD Ryzen 9 PRO 7940HS (34339 - 66740, n=3) | |
| Lenovo ThinkBook 16 G6 ABP | |
| AIDA64 / Memory Read | |
| Asus Vivobook Pro 16X K6604JV-MX016W | |
| MSI Creator Z16P B12UHST | |
| Lenovo ThinkPad Z16 Gen 2 | |
| Lenovo ThinkPad Z16 G1 21D5S00T00 | |
| Lenovo ThinkBook 16 G6 ABP | |
| Ortalama AMD Ryzen 9 PRO 7940HS (30289 - 50398, n=3) | |
| AIDA64 / Memory Write | |
| Lenovo ThinkPad Z16 Gen 2 | |
| Asus Vivobook Pro 16X K6604JV-MX016W | |
| MSI Creator Z16P B12UHST | |
| Ortalama AMD Ryzen 9 PRO 7940HS (39877 - 91516, n=3) | |
| Lenovo ThinkPad Z16 G1 21D5S00T00 | |
| Lenovo ThinkBook 16 G6 ABP | |
| AIDA64 / Memory Latency | |
| Lenovo ThinkPad Z16 G1 21D5S00T00 | |
| Lenovo ThinkPad Z16 Gen 2 | |
| Ortalama AMD Ryzen 9 PRO 7940HS (102.2 - 121.3, n=3) | |
| Lenovo ThinkBook 16 G6 ABP | |
| MSI Creator Z16P B12UHST | |
| Asus Vivobook Pro 16X K6604JV-MX016W | |
* ... daha küçük daha iyidir
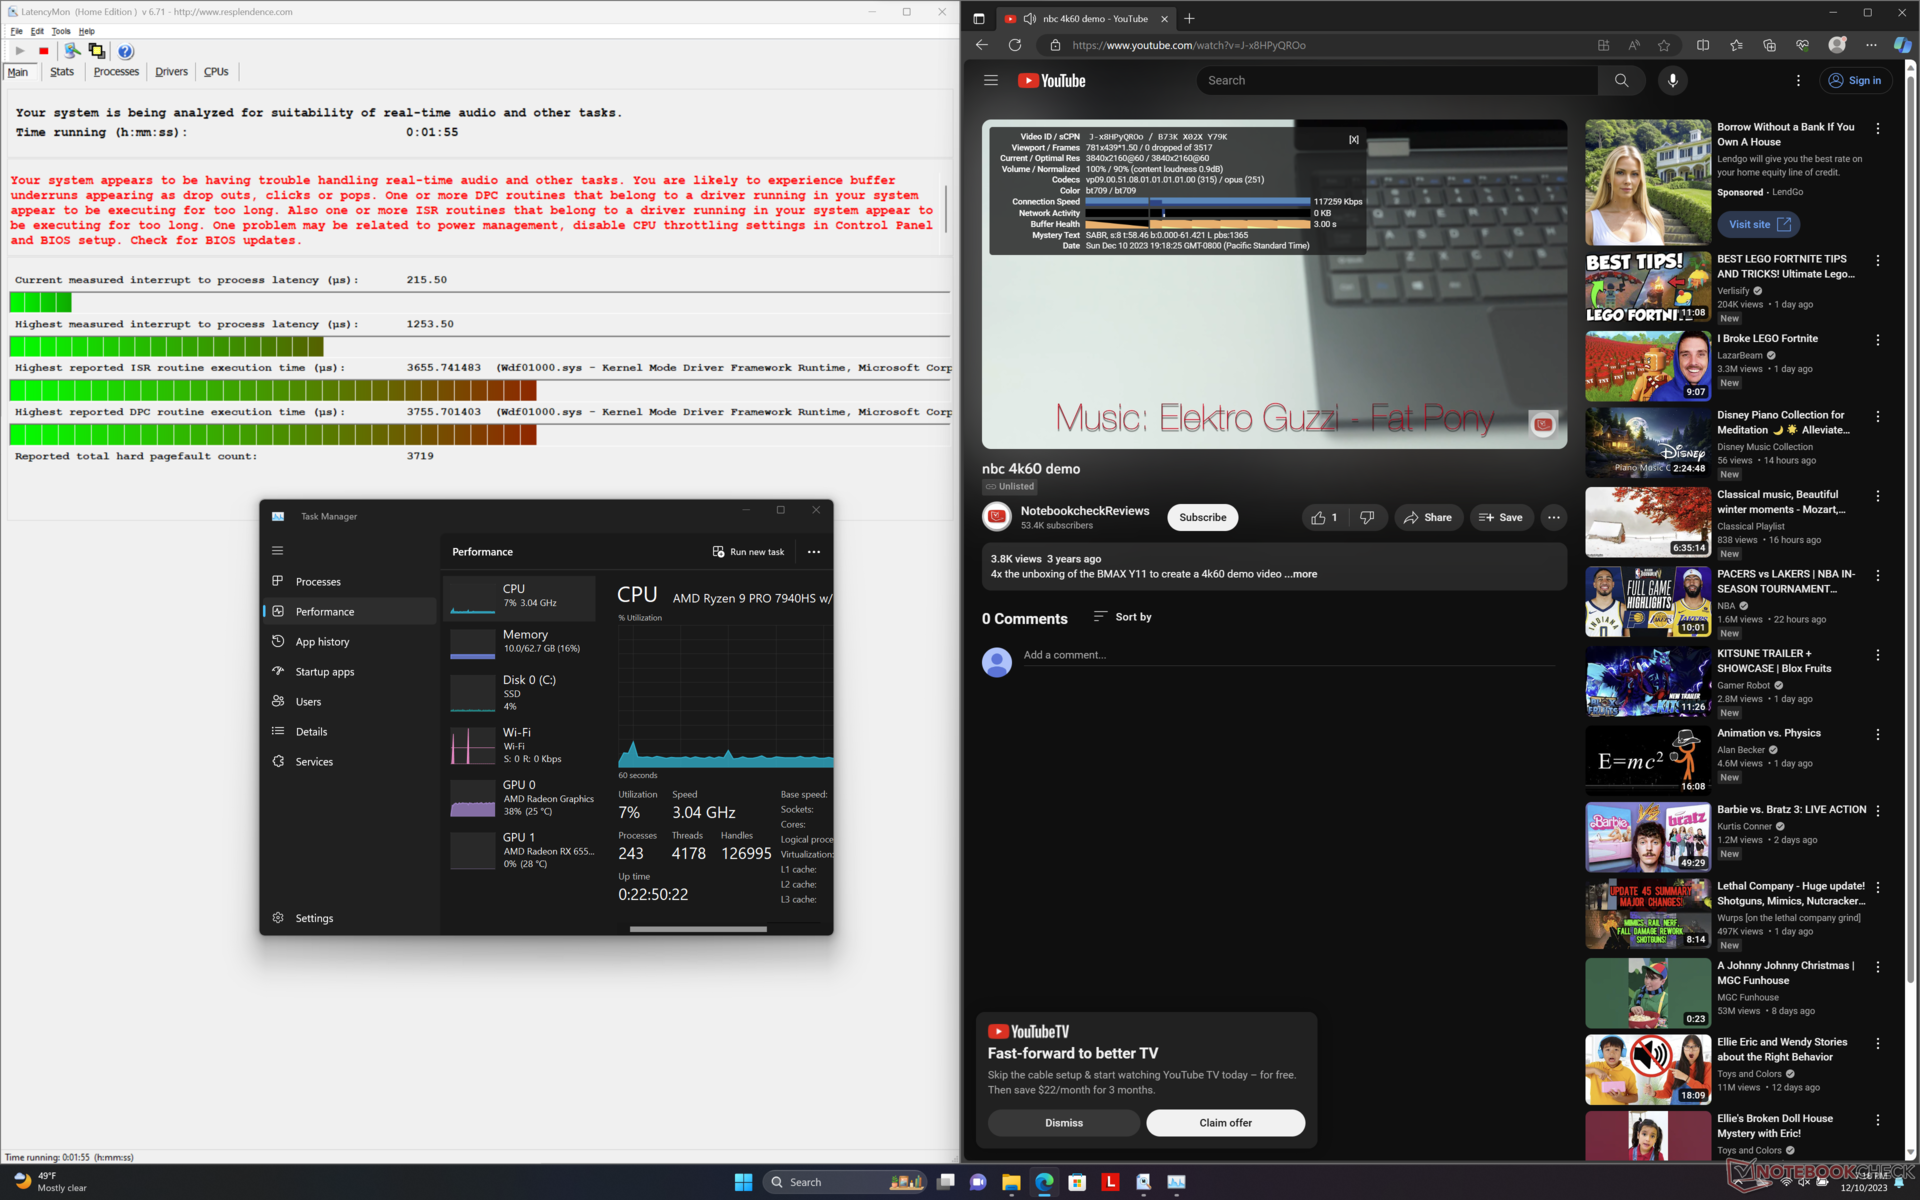
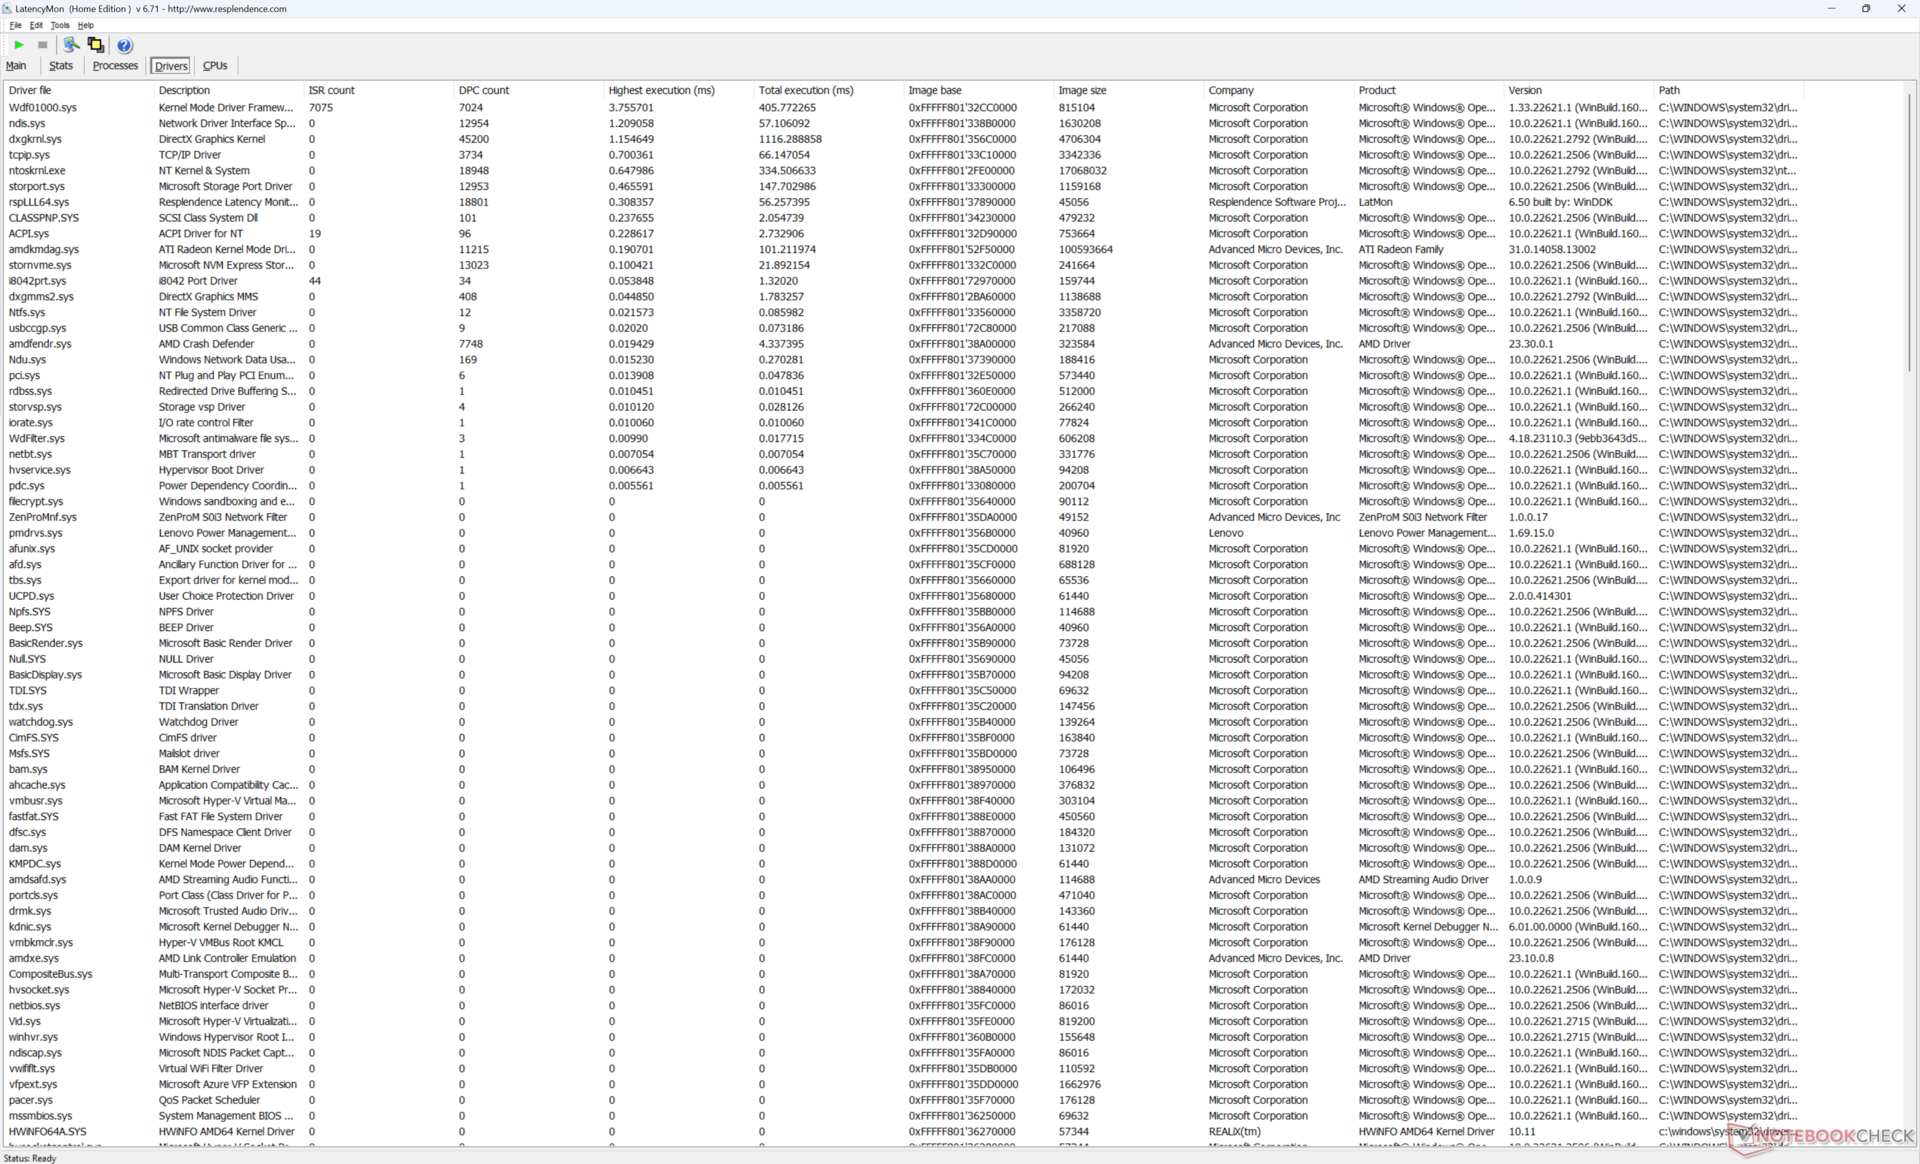
DPC Gecikme Süresi
LatencyMon, ana sayfamızın birden fazla tarayıcı sekmesini açarken küçük DPC sorunları gösteriyor. 60 FPS'de 4K video oynatımı, Intel-Nvidia destekli son modellerde yaşadığımızın aksine kaydedilen hiçbir kare düşmesi olmadan mükemmel ThinkPad P1 G6.
| DPC Latencies / LatencyMon - interrupt to process latency (max), Web, Youtube, Prime95 | |
| Asus Vivobook Pro 16X K6604JV-MX016W | |
| Lenovo ThinkPad Z16 Gen 2 | |
| Lenovo ThinkBook 16 G6 ABP | |
| MSI Creator Z16P B12UHST | |
| Lenovo ThinkPad Z16 G1 21D5S00T00 | |
* ... daha küçük daha iyidir
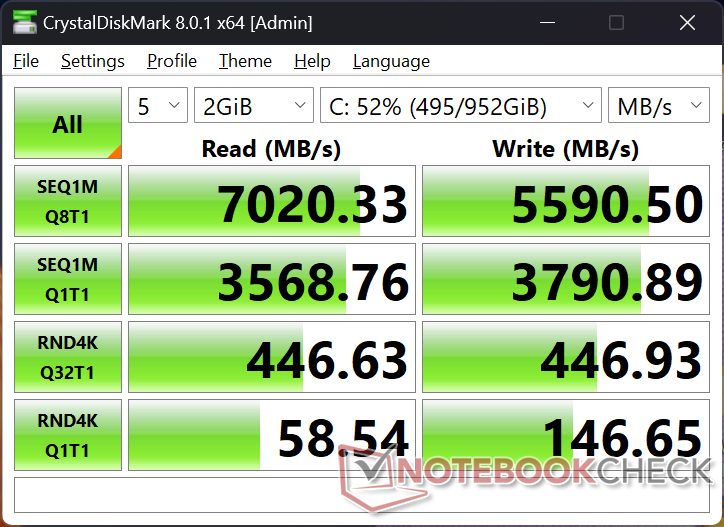
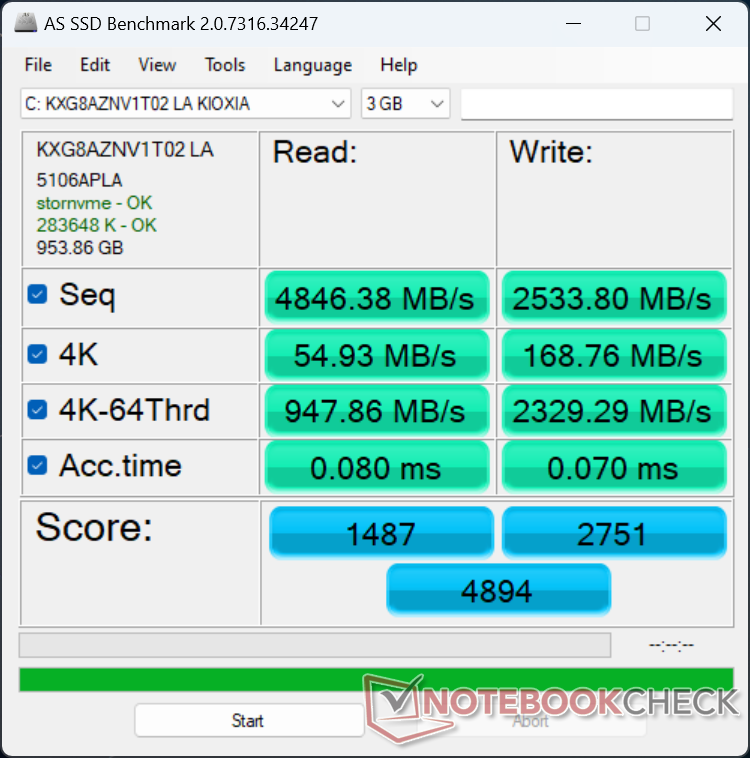
Depolama Cihazları
Test ünitemiz aşağıdakilerle birlikte gönderilir Kioxia XG8 oysa bizim eski ThinkPad Z16 Gen 1, Samsung PM9A1 ile gönderilirdi. Bununla birlikte, her iki SSD de her biri ~7000 MB/sn'lik benzer maksimum okuma hızlarına sahip üst düzey PCIe4 x4 NVMe sürücülerdir.
Ne yazık ki Kioxia sürücüsü de aşağıdaki karşılaştırma grafiğinde gösterildiği gibi ThinkPad Z16 Gen 1'deki Samsung sürücüsünde olduğu gibi birkaç dakikalık stres sonrasında performans düşüklüğü sorunları sergilemektedir. Okuma hızları, muhtemelen yetersiz ısı dağılımı nedeniyle zaman içinde ~7000 MB/s'den ~5800 MB/s'ye düşüyordu. SSD ile metal alt kapak arasına büyük bir termal ped eklenmesi performansa yardımcı olabilir.
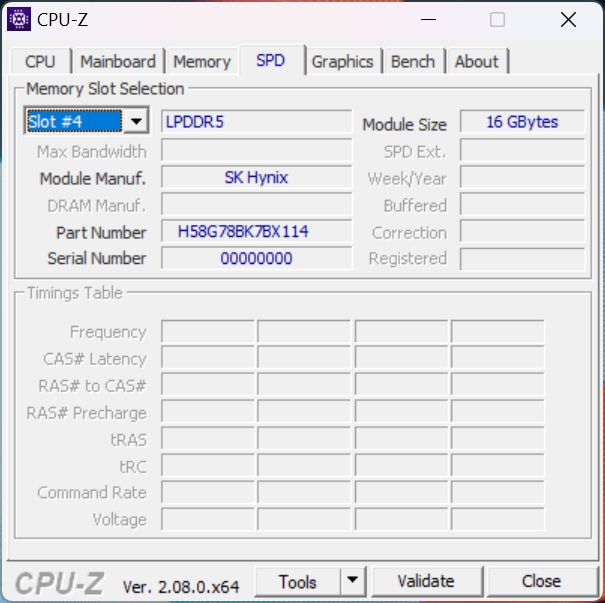
RAM lehimlenmiştir ve diğer SSD'lerden farklı olarak ikinci bir SSD desteği yoktur MSI Creator Z16P i̇ki RAM yuvası ve iki M.2 SSD yuvası entegre edilmiştir.

| Drive Performance rating - Percent | |
| MSI Creator Z16P B12UHST | |
| Lenovo ThinkPad Z16 G1 21D5S00T00 | |
| Lenovo ThinkPad Z16 Gen 2 | |
| Lenovo ThinkBook 16 G6 ABP | |
| Asus Vivobook Pro 16X K6604JV-MX016W | |
* ... daha küçük daha iyidir
Disk Throttling: DiskSpd Read Loop, Queue Depth 8
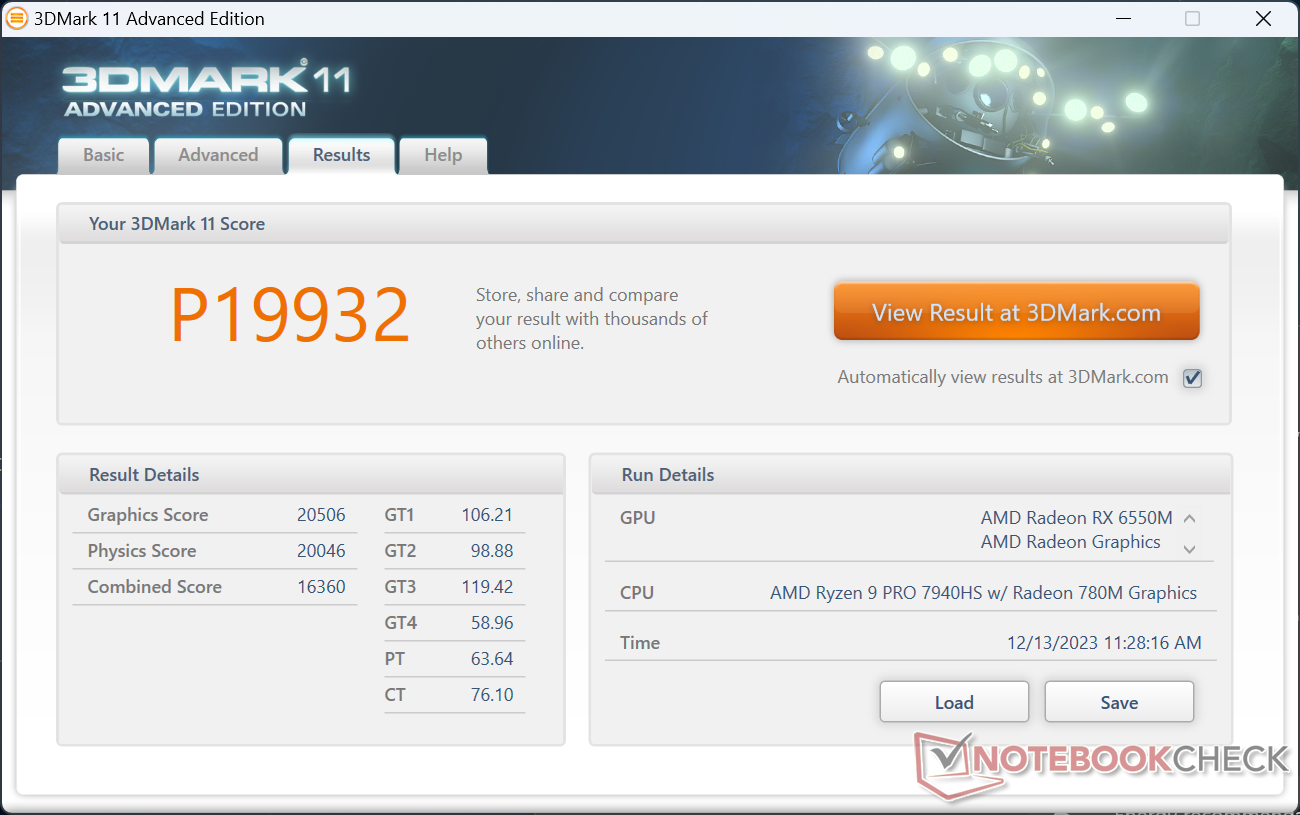
GPU Performansı
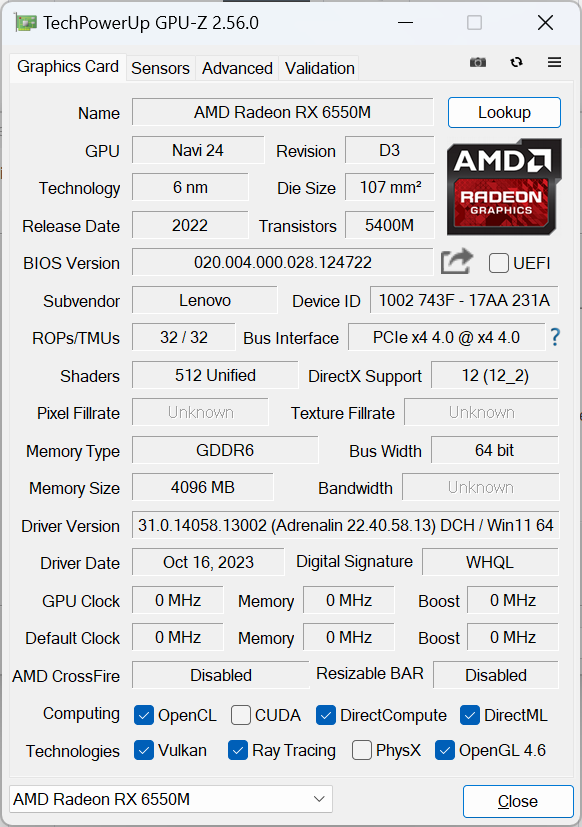
Radeon RX 6550M ve RX 6500M arasındaki ilişki GeForce RTX 3050 Ti ve RTX 3050 arasındaki ilişkiye benziyor; aralarındaki farklar küçük ve ortalama yüzde 10 puan. Gerçekten de iki Radeon GPU aynı 64 bit bellek veri yolu genişliğini, RDNA2 mimarisini, 1024 akış işlemcisini, 4 GB GDDR6 VRAM'i ve daha fazlasını paylaşıyor. Radeon RX 6550M, 6500M'den biraz daha yüksek hedef saat hızlarına (2560 MHz'e karşı 2191 MHz) ve maksimum TGP'ye (60 W'a karşı 55 W) ulaşıyor, ama hepsi bu.
Saat hızlarındaki küçük artış, aşağıdaki karşılaştırma tablosunda gösterildiği gibi kıyaslama puanlarında sadece küçük artışlara yol açmaktadır.
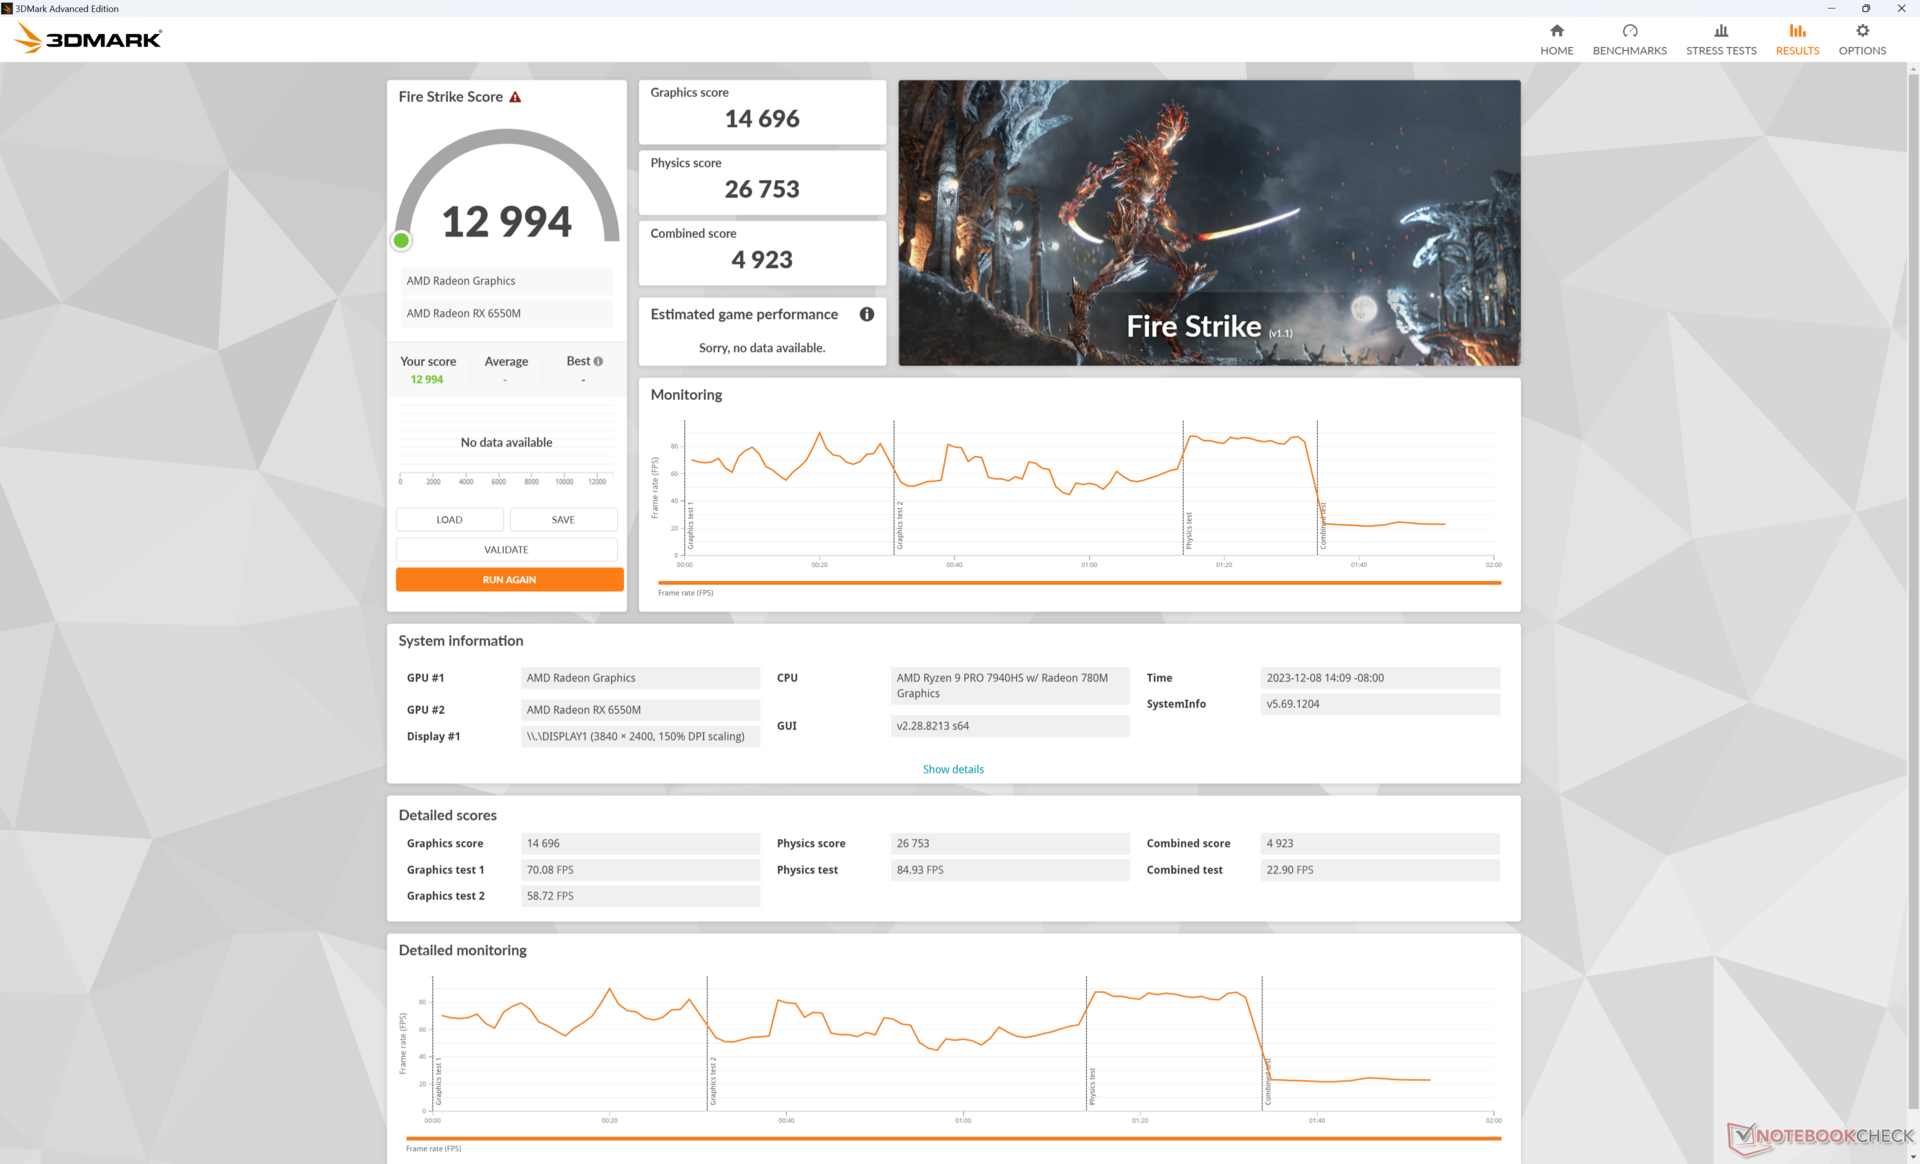
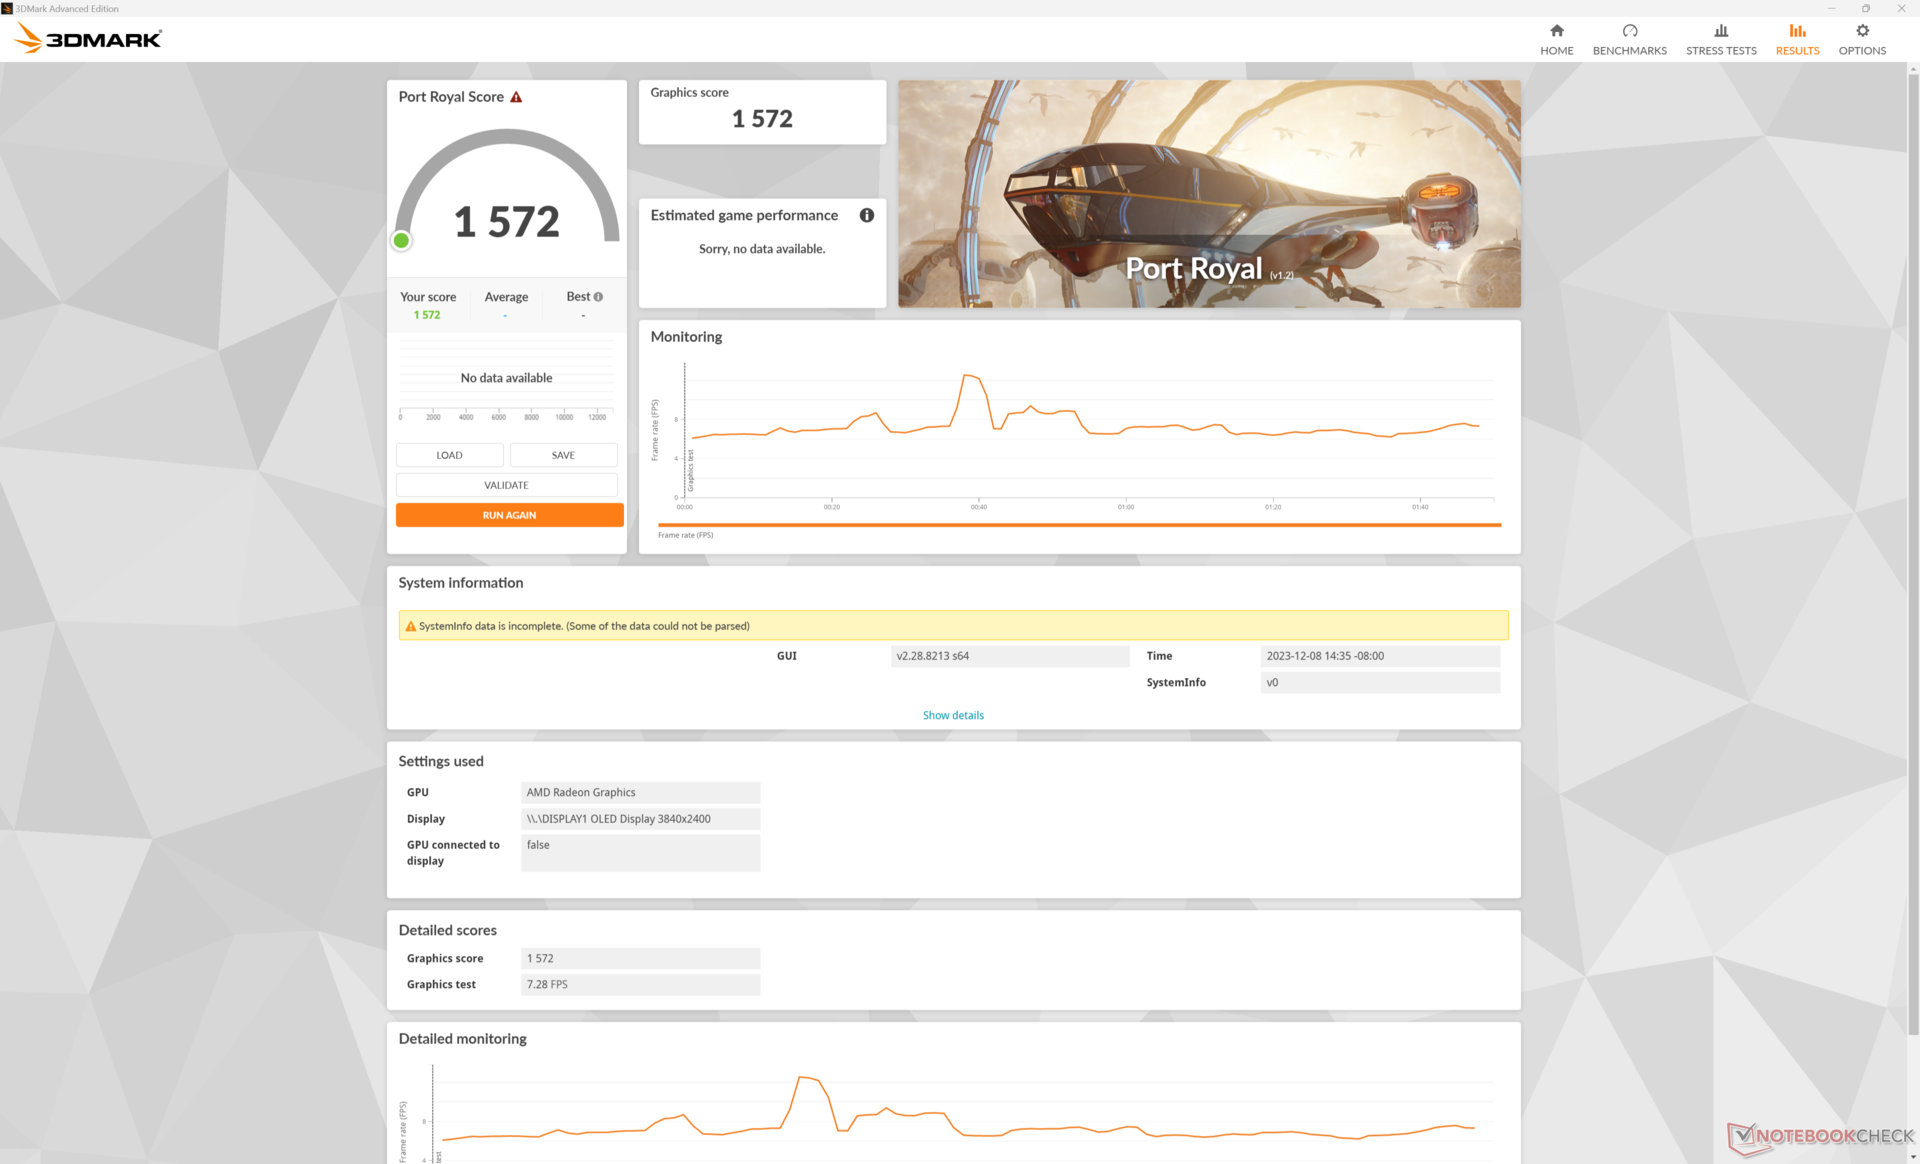
Performans modu yerine Dengeli modda çalıştırmak, aşağıdaki tabloda Fire Strike sonuçlarımızda gösterildiği gibi performansı çok az etkiler. Pil gücüyle çalıştırmak grafik performansını işlemci performansından çok daha fazla düşürecektir.
| Güç Profili | Fizik Puanı | Grafik Puanı | Birleşik Puan |
| Performans Modu | 26753 | 14696 | 4923 |
| Dengeli Mod | 26333 (-2%) | 13975 (-5%) | 4776 (-3%) |
| Akü Gücü | 25622 (-4%) | 9649 (-34%) | 3114 (-37%) |
RDNA2 tabanlı Radeon RX 6550M'nin, üst düzey RDNA3 tabanlı Radeon RX 7900M'nin piyasaya sürülmesinin hemen ardından geldiğini unutmayın; bu da daha fazla orta seviye RDNA3 GPU'nun yakında geleceği anlamına geliyor. RDNA3, performans, güç tüketimi, AI yükseltme desteği ve özellikle ışın izleme yetenekleri açısından RDNA2'ye göre önemli bir gelişmedir.
| 3DMark Performance rating - Percent | |
| Asus Zephyrus Duo 16 GX650PY-NM006W | |
| Alienware m16 R1 AMD | |
| Lenovo ThinkPad P1 G6 21FV001KUS | |
| MSI Raider GE68 HX 13VG, i7-13700HX | |
| MSI Raider GE68HX 13VF | |
| HP Victus 16-r0076TX -1! | |
| MSI Creator Z16P B12UHST -1! | |
| Lenovo ThinkPad Z16 G1 21D5S00T00 -1! | |
| Asus VivoBook Pro 16 -1! | |
| Lenovo ThinkPad Z16 Gen 2 | |
| Ortalama AMD Radeon RX 6550M | |
| HP Victus 15 fa0020nr | |
| Asus VivoBook Pro 16X OLED N7600PC-L2026X -1! | |
| LG Gram 2in1 16 16T90R - G.AA78G -1! | |
| 3DMark 11 - 1280x720 Performance GPU | |
| Asus Zephyrus Duo 16 GX650PY-NM006W | |
| Alienware m16 R1 AMD | |
| Lenovo ThinkPad P1 G6 21FV001KUS | |
| MSI Raider GE68 HX 13VG, i7-13700HX | |
| MSI Raider GE68HX 13VF | |
| HP Victus 16-r0076TX | |
| Lenovo ThinkPad Z16 Gen 2 | |
| Ortalama AMD Radeon RX 6550M (n=1) | |
| HP Victus 15 fa0020nr | |
| Asus VivoBook Pro 16 | |
| Lenovo ThinkPad Z16 G1 21D5S00T00 | |
| Asus VivoBook Pro 16X OLED N7600PC-L2026X | |
| MSI Creator Z16P B12UHST | |
| LG Gram 2in1 16 16T90R - G.AA78G | |
| 3DMark 11 Performance | 19932 puan | |
| 3DMark Fire Strike Score | 12994 puan | |
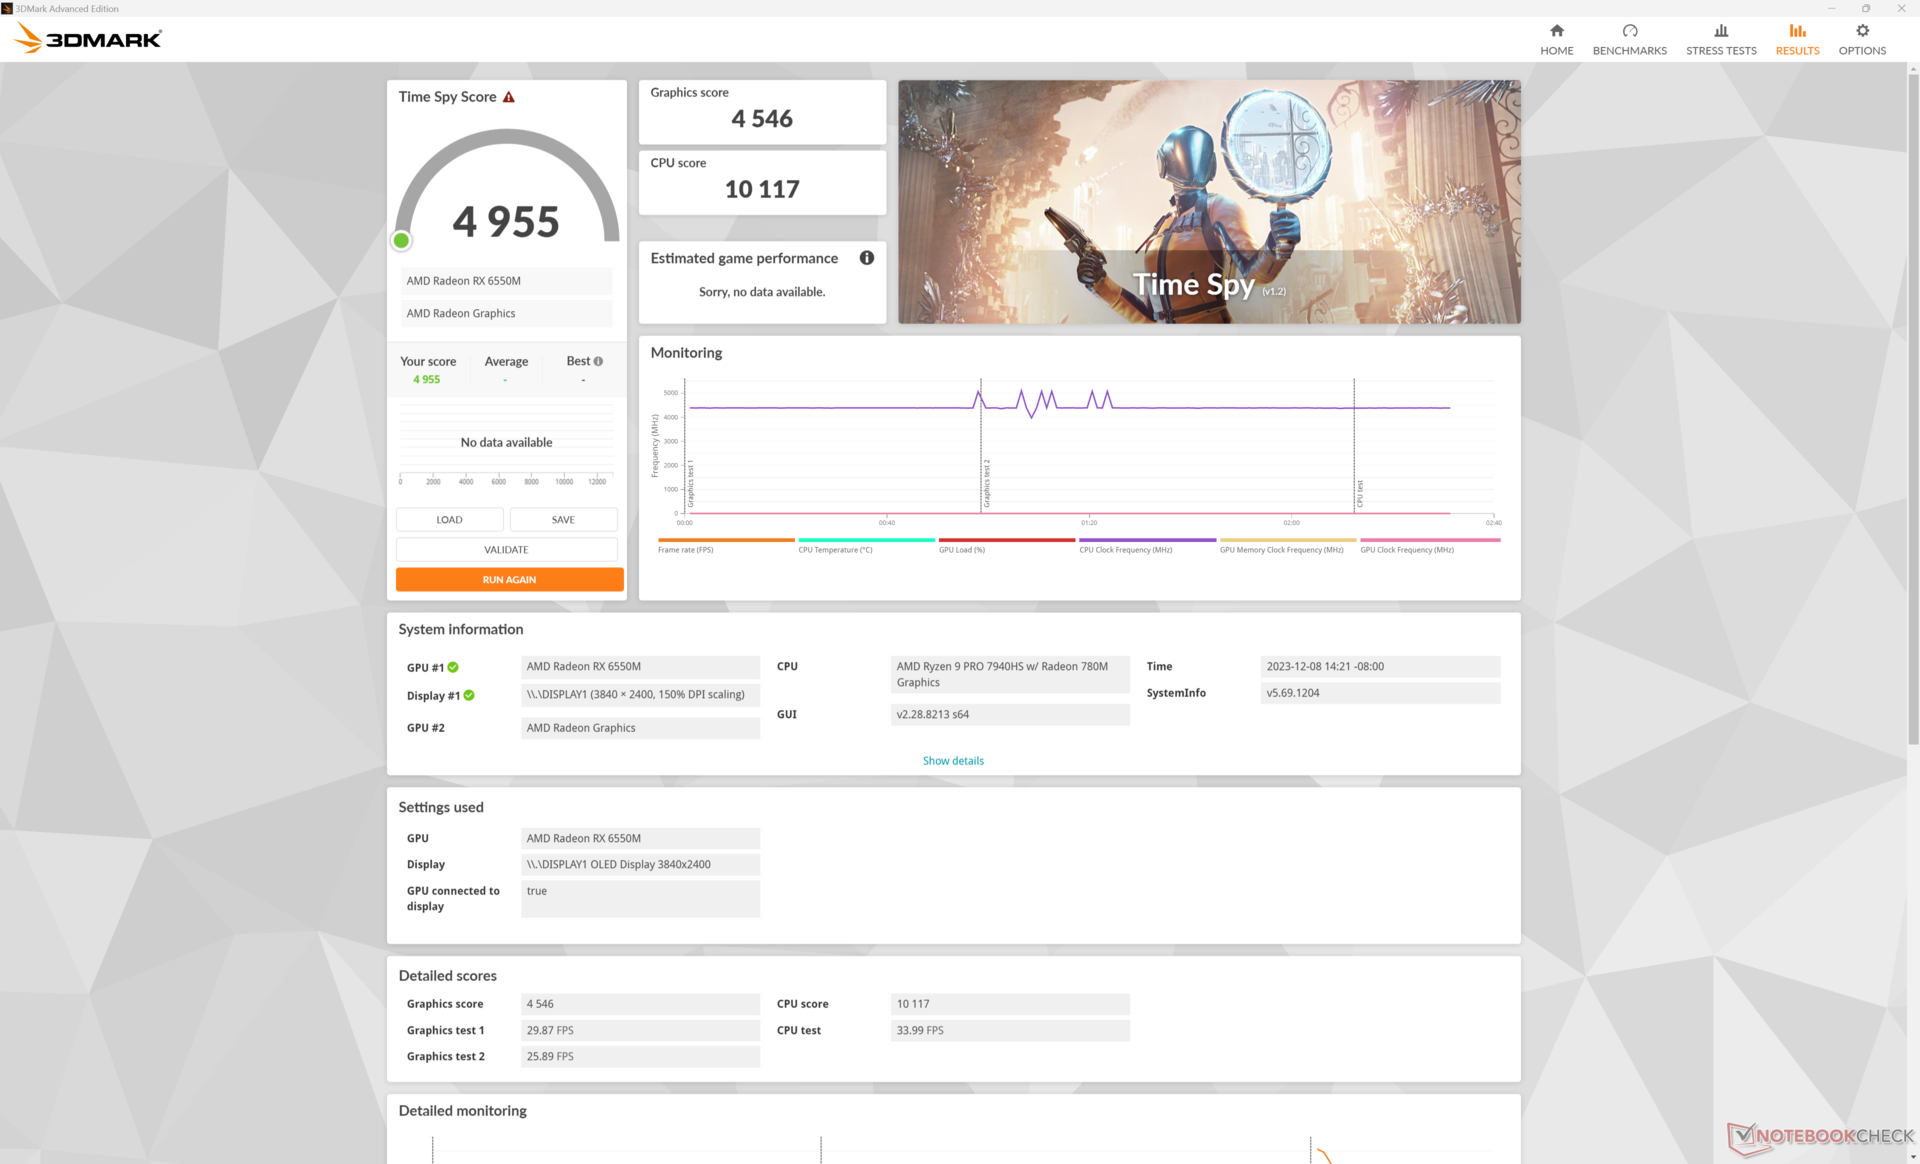
| 3DMark Time Spy Score | 4955 puan | |
Yardım | ||
| Blender | |
| v3.3 Classroom METAL | |
| Apple MacBook Pro 16 2023 M3 Pro | |
| v3.3 Classroom HIP/AMD | |
| Lenovo ThinkPad Z16 G1 21D5S00T00 | |
| v3.3 Classroom OPTIX/RTX | |
| Asus VivoBook Pro 16 | |
| HP Victus 16-r0076TX | |
| MSI Raider GE68HX 13VF | |
| MSI Raider GE68 HX 13VG, i7-13700HX | |
| Alienware m16 R1 AMD | |
| Lenovo ThinkPad P1 G6 21FV001KUS | |
| Asus Zephyrus Duo 16 GX650PY-NM006W | |
| v3.3 Classroom CUDA | |
| Asus VivoBook Pro 16 | |
| HP Victus 16-r0076TX | |
| MSI Raider GE68HX 13VF | |
| MSI Raider GE68 HX 13VG, i7-13700HX | |
| Lenovo ThinkPad P1 G6 21FV001KUS | |
| Alienware m16 R1 AMD | |
| Asus Zephyrus Duo 16 GX650PY-NM006W | |
| v3.3 Classroom CPU | |
| LG Gram 2in1 16 16T90R - G.AA78G | |
| Lenovo ThinkPad Z16 G1 21D5S00T00 | |
| Asus VivoBook Pro 16 | |
| HP Victus 16-r0076TX | |
| Lenovo ThinkPad P1 G6 21FV001KUS | |
| Apple MacBook Pro 16 2023 M3 Pro | |
| Lenovo ThinkPad Z16 Gen 2 | |
| Ortalama AMD Radeon RX 6550M (n=1) | |
| MSI Raider GE68 HX 13VG, i7-13700HX | |
| MSI Raider GE68HX 13VF | |
| Alienware m16 R1 AMD | |
| Asus Zephyrus Duo 16 GX650PY-NM006W | |
* ... daha küçük daha iyidir
Oyun Performansı
Oyun oynarken performans, başlığa ve ayarlara bağlı olarak Radeon RX 6500M ile neredeyse aynı olmaktan yüzde 30'a kadar daha hızlı olmaya kadar değişebilir. Örneğin Final Fantasy XV, Radeon RX 6550M ve 6500M modellerimiz arasında neredeyse aynı performansı gösterirken Far Cry 5 veya F1 22 gibi diğer oyunlar yüzde 15 ila 30 daha hızlı çalışabilir. Bu arada, Tiny Tina's Wonderlands yalnızca daha yüksek grafik ayarlarında yüzde 30'a kadar daha hızlı çalışabilir. Sonuçlar bu nedenle uygulamaya çok bağlıdır, ancak performans avantajları genellikle 3DMark puanlarının gösterdiğinden daha yüksektir ve bu da oyuncular için harika bir haberdir.
İlginç bir şekilde, genel performans MacBook Pro 16 M3 Procyberpunk 2077 ve Baldur's Gate 3 gibi yeni oyunları test ederken. Radeon'umuzun daha büyük bir ayrık GPU olduğu düşünüldüğünde, bu entegre Apple SoC çözümünün verimliliği hakkında çok şey anlatıyor.
| Performance rating - Percent | |
| Asus Zephyrus Duo 16 GX650PY-NM006W | |
| Alienware m16 R1 AMD -1! | |
| Lenovo ThinkPad P1 G6 21FV001KUS -1! | |
| MSI Raider GE68 HX 13VG, i7-13700HX | |
| MSI Raider GE68HX 13VF -1! | |
| MSI Creator Z16P B12UHST | |
| HP Victus 16-r0076TX -1! | |
| Lenovo ThinkPad Z16 Gen 2 -1! | |
| Apple MacBook Pro 16 2023 M3 Pro -4! | |
| Lenovo ThinkPad Z16 G1 21D5S00T00 | |
| LG Gram 2in1 16 16T90R - G.AA78G | |
| The Witcher 3 - 1920x1080 Ultra Graphics & Postprocessing (HBAO+) | |
| Asus Zephyrus Duo 16 GX650PY-NM006W | |
| Alienware m16 R1 AMD | |
| Lenovo ThinkPad P1 G6 21FV001KUS | |
| MSI Raider GE68 HX 13VG, i7-13700HX | |
| MSI Raider GE68HX 13VF | |
| HP Victus 16-r0076TX | |
| MSI Creator Z16P B12UHST | |
| Lenovo ThinkPad Z16 Gen 2 | |
| Apple MacBook Pro 16 2023 M3 Pro | |
| Lenovo ThinkPad Z16 G1 21D5S00T00 | |
| LG Gram 2in1 16 16T90R - G.AA78G | |
| GTA V - 1920x1080 Highest AA:4xMSAA + FX AF:16x | |
| Asus Zephyrus Duo 16 GX650PY-NM006W | |
| Lenovo ThinkPad P1 G6 21FV001KUS | |
| MSI Raider GE68 HX 13VG, i7-13700HX | |
| MSI Creator Z16P B12UHST | |
| Apple MacBook Pro 16 2023 M3 Pro | |
| Lenovo ThinkPad Z16 G1 21D5S00T00 | |
| LG Gram 2in1 16 16T90R - G.AA78G | |
| Final Fantasy XV Benchmark - 1920x1080 High Quality | |
| Asus Zephyrus Duo 16 GX650PY-NM006W | |
| Alienware m16 R1 AMD | |
| Lenovo ThinkPad P1 G6 21FV001KUS | |
| MSI Raider GE68 HX 13VG, i7-13700HX | |
| MSI Raider GE68HX 13VF | |
| MSI Creator Z16P B12UHST | |
| HP Victus 16-r0076TX | |
| Lenovo ThinkPad Z16 Gen 2 | |
| Lenovo ThinkPad Z16 G1 21D5S00T00 | |
| LG Gram 2in1 16 16T90R - G.AA78G | |
| Strange Brigade - 1920x1080 ultra AA:ultra AF:16 | |
| Alienware m16 R1 AMD | |
| Asus Zephyrus Duo 16 GX650PY-NM006W | |
| MSI Raider GE68 HX 13VG, i7-13700HX | |
| MSI Raider GE68HX 13VF | |
| MSI Creator Z16P B12UHST | |
| HP Victus 16-r0076TX | |
| Lenovo ThinkPad Z16 Gen 2 | |
| Lenovo ThinkPad Z16 G1 21D5S00T00 | |
| LG Gram 2in1 16 16T90R - G.AA78G | |
| Dota 2 Reborn - 1920x1080 ultra (3/3) best looking | |
| MSI Raider GE68HX 13VF | |
| Asus Zephyrus Duo 16 GX650PY-NM006W | |
| MSI Raider GE68 HX 13VG, i7-13700HX | |
| Alienware m16 R1 AMD | |
| MSI Creator Z16P B12UHST | |
| Lenovo ThinkPad P1 G6 21FV001KUS | |
| HP Victus 16-r0076TX | |
| Lenovo ThinkPad Z16 Gen 2 | |
| Lenovo ThinkPad Z16 G1 21D5S00T00 | |
| LG Gram 2in1 16 16T90R - G.AA78G | |
| X-Plane 11.11 - 1920x1080 high (fps_test=3) | |
| MSI Raider GE68HX 13VF | |
| MSI Raider GE68 HX 13VG, i7-13700HX | |
| Lenovo ThinkPad P1 G6 21FV001KUS | |
| Asus Zephyrus Duo 16 GX650PY-NM006W | |
| Alienware m16 R1 AMD | |
| HP Victus 16-r0076TX | |
| MSI Creator Z16P B12UHST | |
| LG Gram 2in1 16 16T90R - G.AA78G | |
| Lenovo ThinkPad Z16 G1 21D5S00T00 | |
| Lenovo ThinkPad Z16 Gen 2 | |
| Cyberpunk 2077 | |
| 1280x720 Low Preset (FSR off) | |
| Lenovo ThinkPad Z16 Gen 2 | |
| Ortalama AMD Radeon RX 6550M (n=1) | |
| LG Gram 2in1 16 16T90R - G.AA78G | |
| 1920x1080 Low Preset (FSR off) | |
| Lenovo ThinkPad Z16 Gen 2 | |
| Ortalama AMD Radeon RX 6550M (n=1) | |
| Apple MacBook Pro 16 2023 M3 Pro | |
| LG Gram 2in1 16 16T90R - G.AA78G | |
| 1920x1080 Medium Preset (FSR off) | |
| Lenovo ThinkPad Z16 Gen 2 | |
| Ortalama AMD Radeon RX 6550M (n=1) | |
| Apple MacBook Pro 16 2023 M3 Pro | |
| LG Gram 2in1 16 16T90R - G.AA78G | |
| 1920x1080 High Preset (FSR off) | |
| Lenovo ThinkPad P1 G6 21FV001KUS | |
| Apple MacBook Pro 16 2023 M3 Pro | |
| Lenovo ThinkPad Z16 Gen 2 | |
| Ortalama AMD Radeon RX 6550M (n=1) | |
| LG Gram 2in1 16 16T90R - G.AA78G | |
| 1920x1080 Ultra Preset (FSR off) | |
| Lenovo ThinkPad P1 G6 21FV001KUS | |
| Apple MacBook Pro 16 2023 M3 Pro | |
| Lenovo ThinkPad Z16 Gen 2 | |
| Ortalama AMD Radeon RX 6550M (n=1) | |
| LG Gram 2in1 16 16T90R - G.AA78G | |
| 2560x1440 Ultra Preset (FSR off) | |
| Lenovo ThinkPad P1 G6 21FV001KUS | |
| Lenovo ThinkPad Z16 Gen 2 | |
| Ortalama AMD Radeon RX 6550M (n=1) | |
| Far Cry 5 | |
| 1280x720 Low Preset AA:T | |
| MSI Raider GE68HX 13VF | |
| Alienware m16 R1 AMD | |
| HP Victus 16-r0076TX | |
| Lenovo ThinkPad Z16 Gen 2 | |
| Ortalama AMD Radeon RX 6550M (n=1) | |
| Lenovo ThinkPad Z16 G1 21D5S00T00 | |
| 1920x1080 Medium Preset AA:T | |
| MSI Raider GE68HX 13VF | |
| Alienware m16 R1 AMD | |
| HP Victus 16-r0076TX | |
| Lenovo ThinkPad Z16 Gen 2 | |
| Ortalama AMD Radeon RX 6550M (n=1) | |
| Lenovo ThinkPad Z16 G1 21D5S00T00 | |
| 1920x1080 High Preset AA:T | |
| MSI Raider GE68HX 13VF | |
| Alienware m16 R1 AMD | |
| MSI Creator Z16P B12UHST | |
| HP Victus 16-r0076TX | |
| Lenovo ThinkPad Z16 Gen 2 | |
| Ortalama AMD Radeon RX 6550M (n=1) | |
| Lenovo ThinkPad Z16 G1 21D5S00T00 | |
| LG Gram 2in1 16 16T90R - G.AA78G | |
| 1920x1080 Ultra Preset AA:T | |
| Lenovo ThinkPad P1 G6 21FV001KUS | |
| MSI Raider GE68HX 13VF | |
| Alienware m16 R1 AMD | |
| MSI Creator Z16P B12UHST | |
| HP Victus 16-r0076TX | |
| Lenovo ThinkPad Z16 Gen 2 | |
| Ortalama AMD Radeon RX 6550M (n=1) | |
| Lenovo ThinkPad Z16 G1 21D5S00T00 | |
| LG Gram 2in1 16 16T90R - G.AA78G | |
| Baldur's Gate 3 | |
| 1920x1080 Low Preset AA:SM | |
| Lenovo ThinkPad Z16 Gen 2 | |
| Ortalama AMD Radeon RX 6550M (n=1) | |
| 1920x1080 Medium Preset AA:T | |
| Lenovo ThinkPad Z16 Gen 2 | |
| Ortalama AMD Radeon RX 6550M (n=1) | |
| 1920x1080 High Preset AA:T | |
| Apple MacBook Pro 16 2023 M3 Pro | |
| Lenovo ThinkPad Z16 Gen 2 | |
| Ortalama AMD Radeon RX 6550M (n=1) | |
| 1920x1080 Ultra Preset AA:T | |
| Lenovo ThinkPad P1 G6 21FV001KUS | |
| Apple MacBook Pro 16 2023 M3 Pro | |
| Lenovo ThinkPad Z16 Gen 2 | |
| Ortalama AMD Radeon RX 6550M (n=1) | |
| 2560x1440 Ultra Preset AA:T | |
| Lenovo ThinkPad P1 G6 21FV001KUS | |
| Lenovo ThinkPad Z16 Gen 2 | |
| Ortalama AMD Radeon RX 6550M (n=1) | |
Witcher 3 FPS Chart
| düşük | orta | yüksek | ultra | QHD | |
|---|---|---|---|---|---|
| The Witcher 3 (2015) | 277.2 | 171.5 | 83.2 | 49.4 | |
| Dota 2 Reborn (2015) | 137.1 | 127.3 | 112.3 | 103 | |
| Final Fantasy XV Benchmark (2018) | 129.3 | 67.4 | 47.8 | 31.2 | |
| X-Plane 11.11 (2018) | 53.7 | 41.2 | 33 | ||
| Far Cry 5 (2018) | 115 | 91 | 84 | 79 | |
| Strange Brigade (2018) | 319 | 122.5 | 101.1 | 88.4 | |
| Tiny Tina's Wonderlands (2022) | 124.1 | 95.5 | 59.7 | 30.3 | 27.2 |
| F1 22 (2022) | 132.5 | 120.8 | 87.5 | 19.3 | 11.3 |
| Baldur's Gate 3 (2023) | 61.6 | 52.9 | 44.7 | 43 | 29 |
| Cyberpunk 2077 (2023) | 62.8 | 45.9 | 34.7 | 28.6 | 17.3 |
Emisyonlar
Sistem Gürültüsü
Fan gürültüsü davranışı büyük ölçüde seçilen güç profiline bağlıdır. Örneğin, fanlar yalnızca Güç Tasarrufu profilindeyken gerçekten sessizdir, aksi takdirde ekrandaki yük ne olursa olsun neredeyse 30 dB(A)'da her zaman aktiftirler. Benzer şekilde, Dengeli modda oyun oynarken fan gürültüsü 41 ila 45 dB(A) civarındayken Performans modunda 52 dB(A)'dır ve bu da yukarıda bahsedildiği gibi iki profil arasındaki küçük performans farklılıklarına rağmen önemli bir farktır. Özellikle Performans modu, diğer birçok 16 inç dizüstü bilgisayardan belirgin şekilde daha yüksektir MSI Creator Z16P veya MacBook Pro 16.
Bunun dışında fan titreşimi minimumda tutulmuştur. Örneğin 3DMark 06'yı çalıştırırken, fan gürültüsü ilk kıyaslama sahnesinin tamamında ani artışlar olmaksızın sabit 29,5 dB(A) seviyesindeydi.
Ses yüksekliği
| Boşta |
| 22.9 / 29.4 / 29.4 dB |
| Çalışırken |
| 29.5 / 52 dB |
 | ||
30 dB sessiz 40 dB(A) duyulabilirlik 50 dB(A) gürültülü |
||
min: | ||
| Lenovo ThinkPad Z16 Gen 2 Radeon RX 6550M, R9 PRO 7940HS, Kioxia XG8 KXG8AZNV1T02 | Lenovo ThinkPad Z16 G1 21D5S00T00 Radeon RX 6500M, R7 PRO 6850H, Samsung PM9A1 MZVL21T0HCLR | Lenovo ThinkBook 16 G6 ABP Vega 7, R5 7530U, SK hynix HFS512GEJ9X125N | MSI Creator Z16P B12UHST GeForce RTX 3080 Ti Laptop GPU, i9-12900H, Samsung PM9A1 MZVL22T0HBLB | Apple MacBook Pro 16 2023 M3 Pro M3 Pro 18-Core GPU, Apple M3 Pro 12-Core, Apple SSD AP0512Z | Asus Vivobook Pro 16X K6604JV-MX016W GeForce RTX 4060 Laptop GPU, i9-13980HX, Solidigm P41 Plus SSDPFKNU010TZ | |
|---|---|---|---|---|---|---|
| Noise | 9% | 11% | -8% | 12% | -18% | |
| kapalı / ortam * (dB) | 22.6 | 23.7 -5% | 24.3 -8% | 26 -15% | 24.4 -8% | 25.2 -12% |
| Idle Minimum * (dB) | 22.9 | 23.7 -3% | 24.3 -6% | 27 -18% | 24.4 -7% | 26.6 -16% |
| Idle Average * (dB) | 29.4 | 23.7 19% | 24.3 17% | 29 1% | 24.4 17% | 26.6 10% |
| Idle Maximum * (dB) | 29.4 | 23.7 19% | 24.3 17% | 31 -5% | 24.4 17% | 29.2 1% |
| Load Average * (dB) | 29.5 | 25.9 12% | 29.7 -1% | 43 -46% | 26.9 9% | 53.4 -81% |
| Witcher 3 ultra * (dB) | 52 | 46.9 10% | 32.1 38% | 43 17% | 25.1 52% | |
| Load Maximum * (dB) | 52 | 46.9 10% | 41.4 20% | 46 12% | 50.4 3% | 56.9 -9% |
* ... daha küçük daha iyidir
Sıcaklık
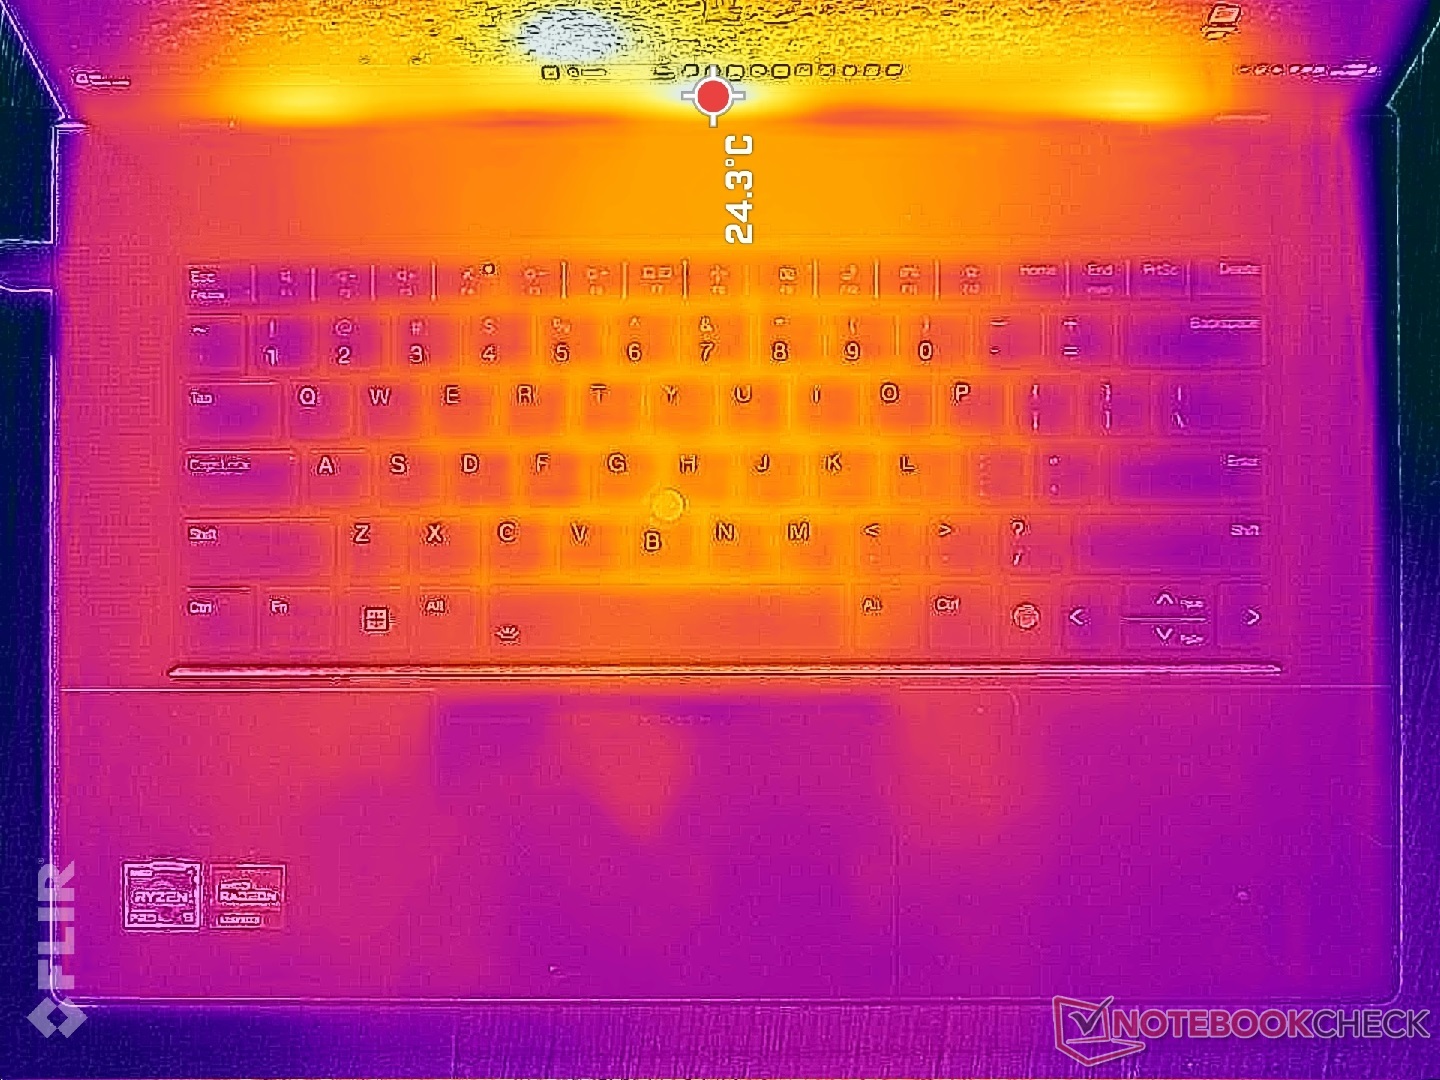
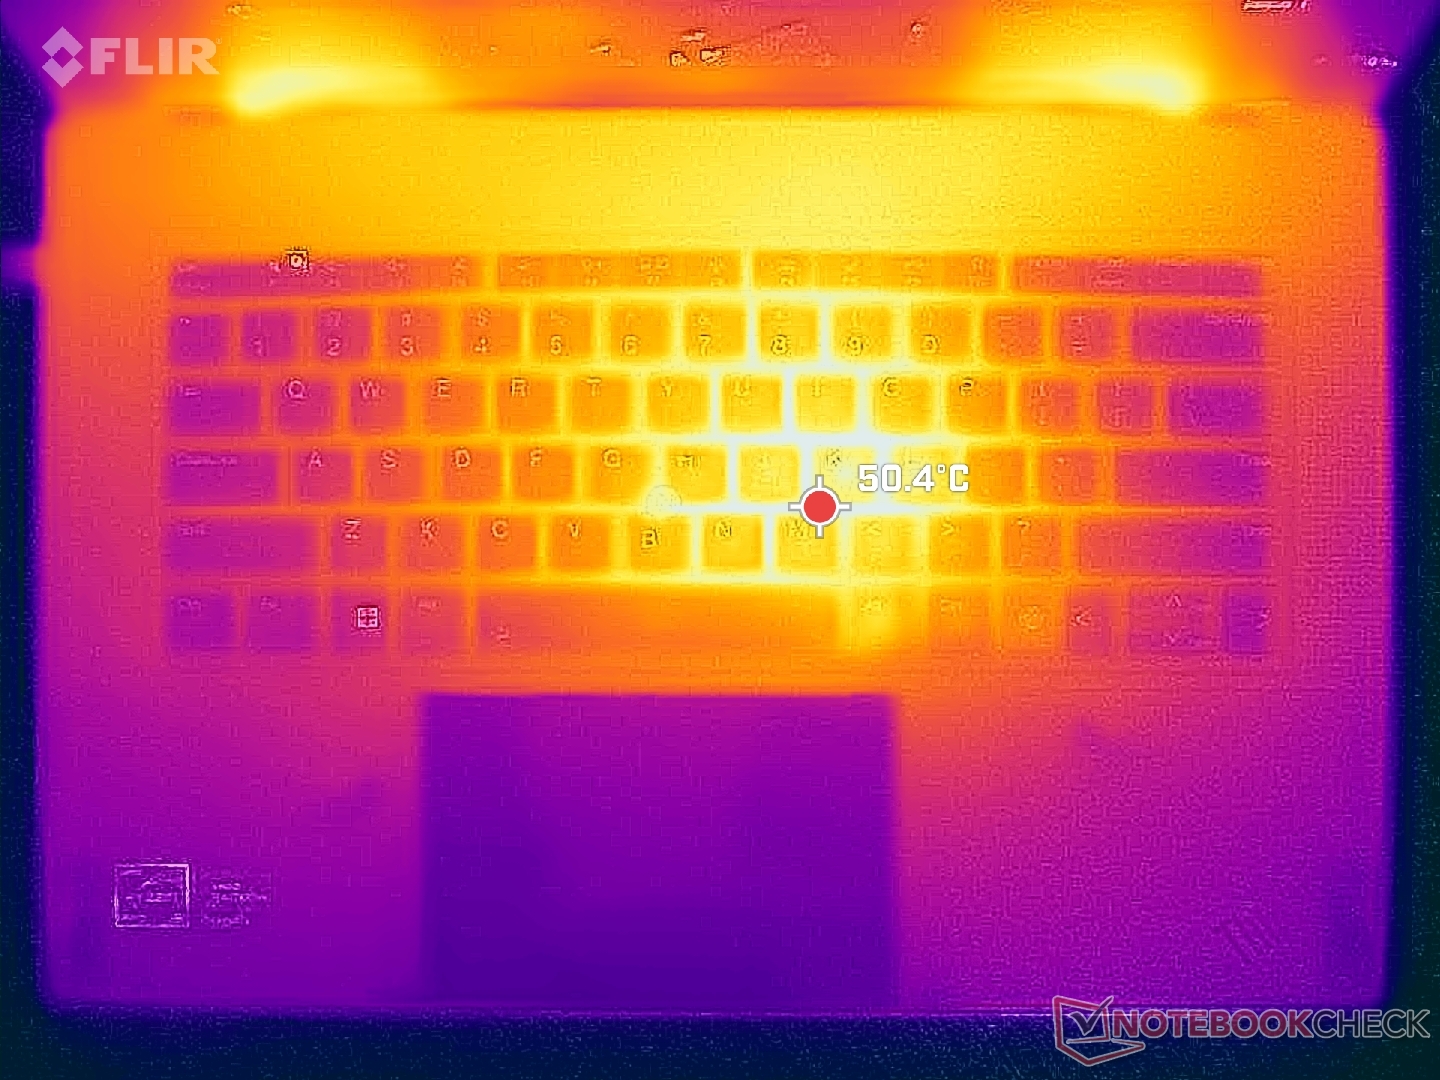
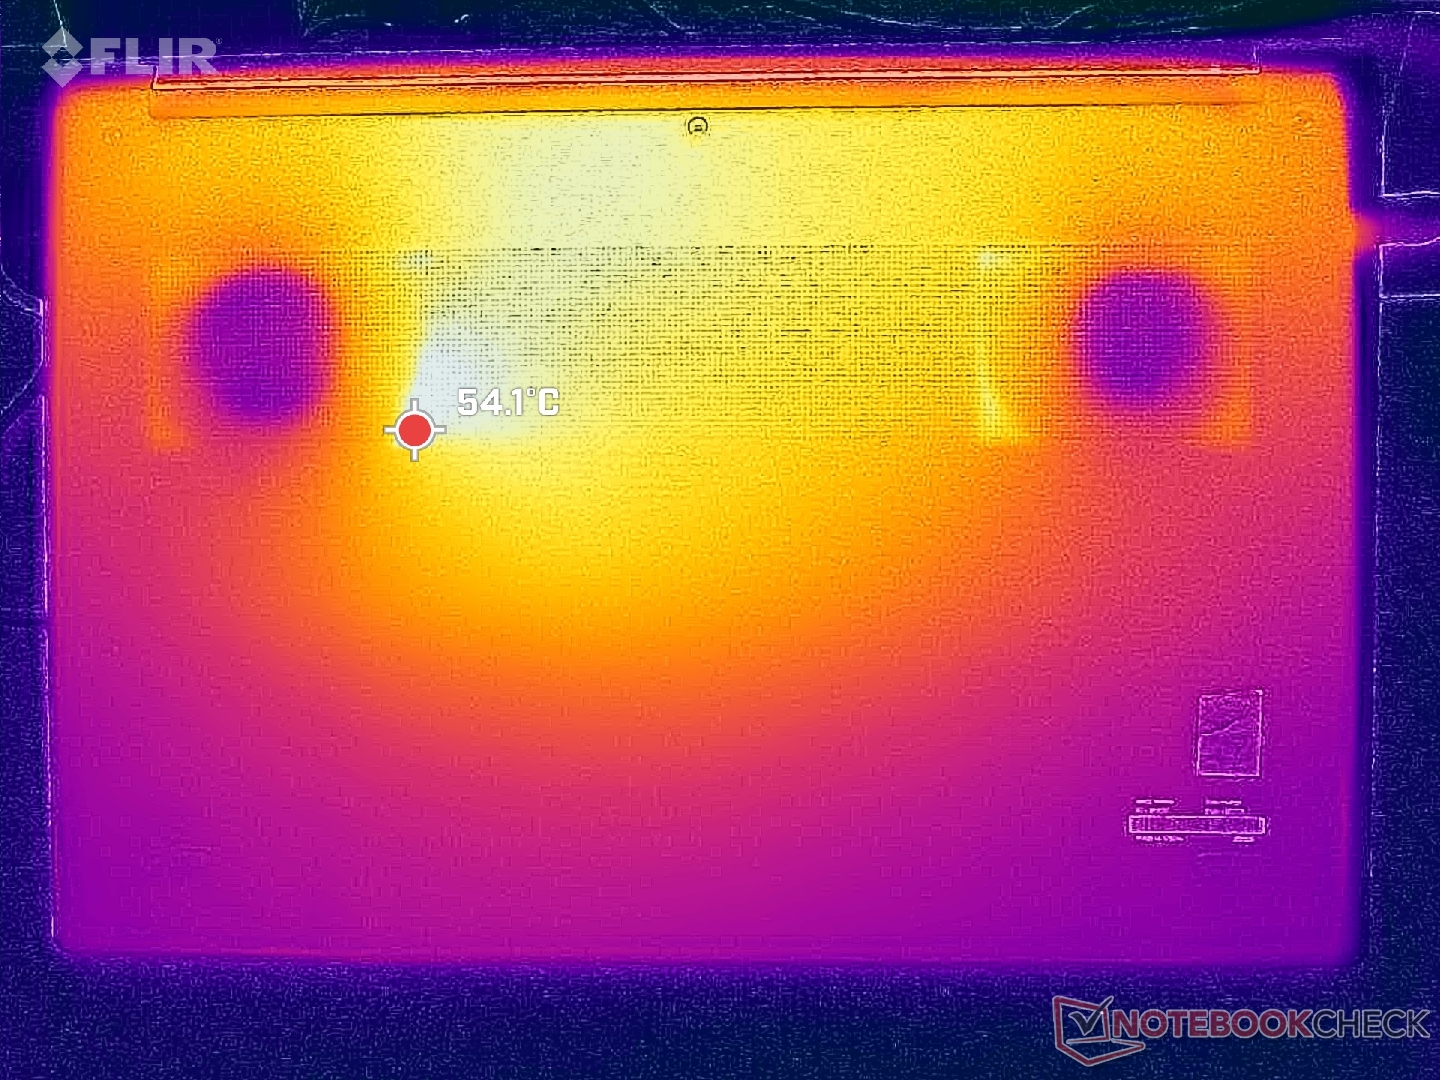
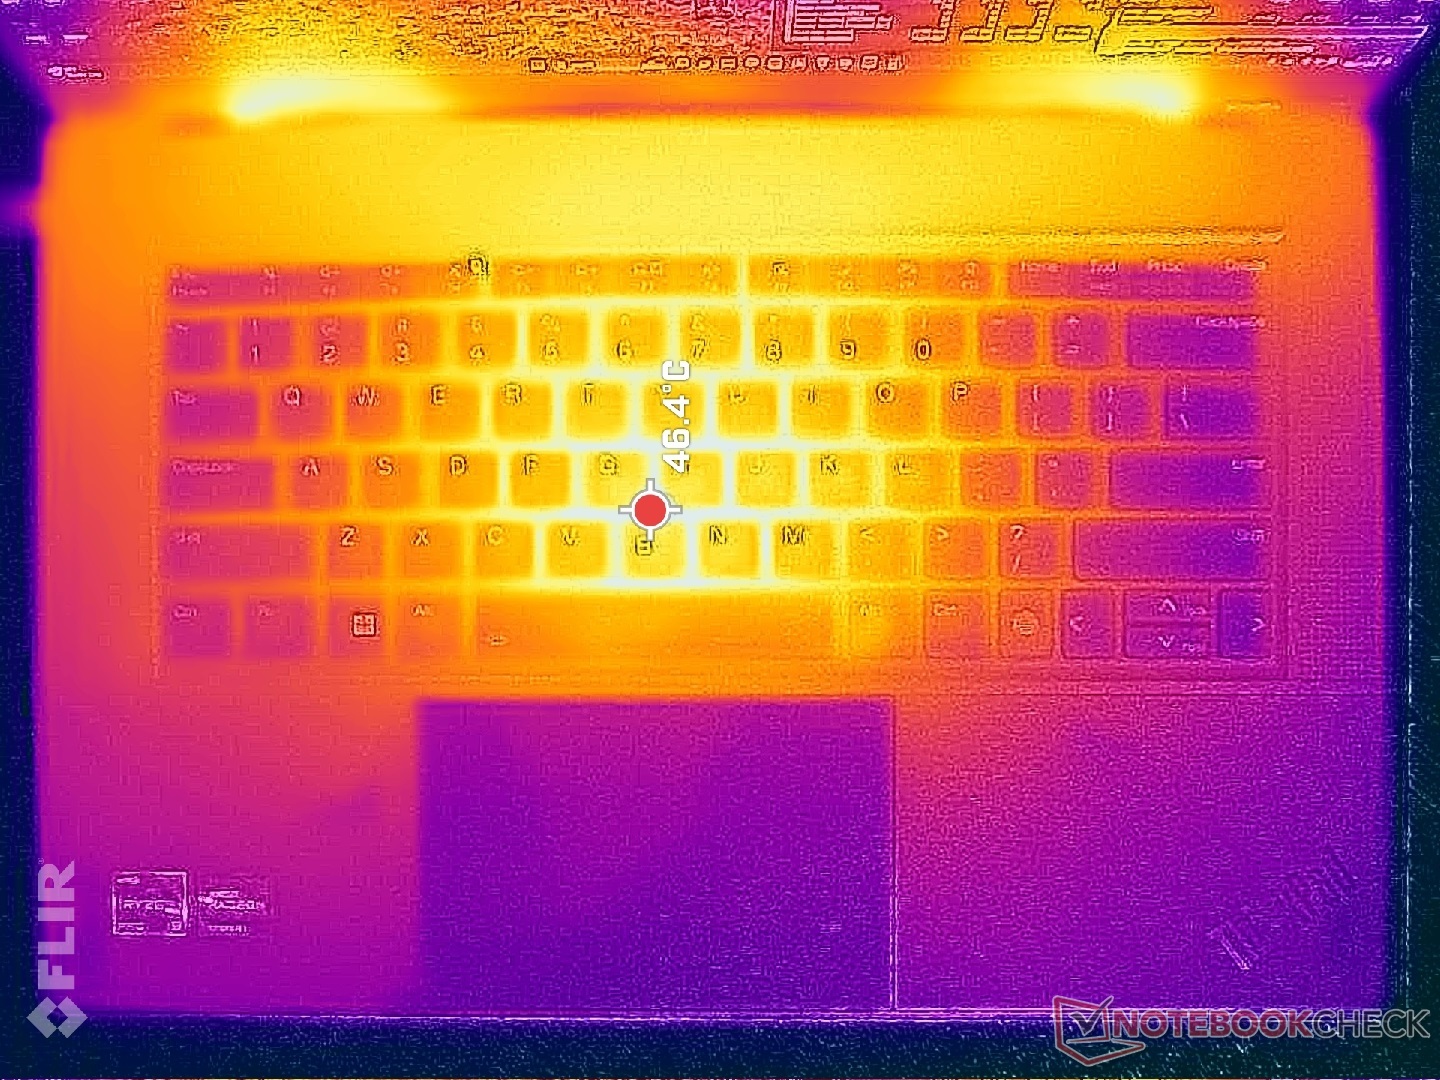
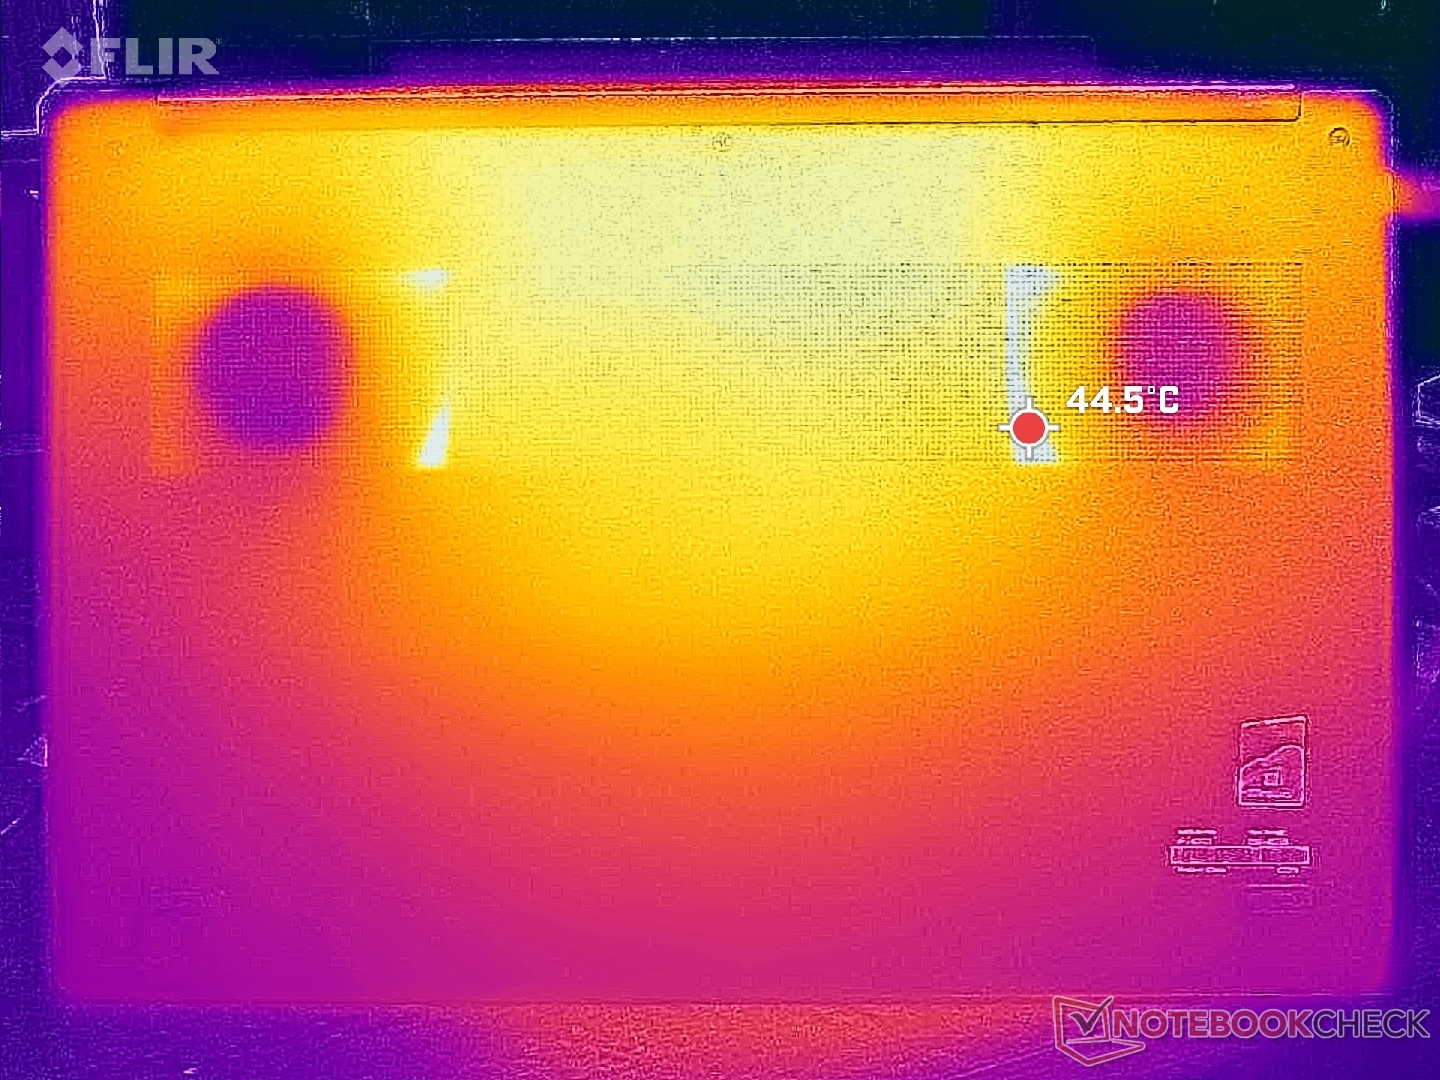
Kasanın çoğu metal olduğu için yüzey sıcaklıkları oldukça hızlı ve daha geniş uçlarda yükselir ve düşer. Oyunlar gibi zorlu yükleri çalıştırırken, sıcak noktalar klavye merkezinde ve alt plakada sırasıyla 47 C ve 43 C kadar sıcak olabilir, ancak bu, ThinkPad Z16 Gen 1'de gözlemlediğimiz gibi ortam sıcaklığına bağlı olarak 50 C'nin üzerinde daha da sıcak olabilir MSI Creator Z16P bu da kendi iyiliği için çok fazla ısınır.
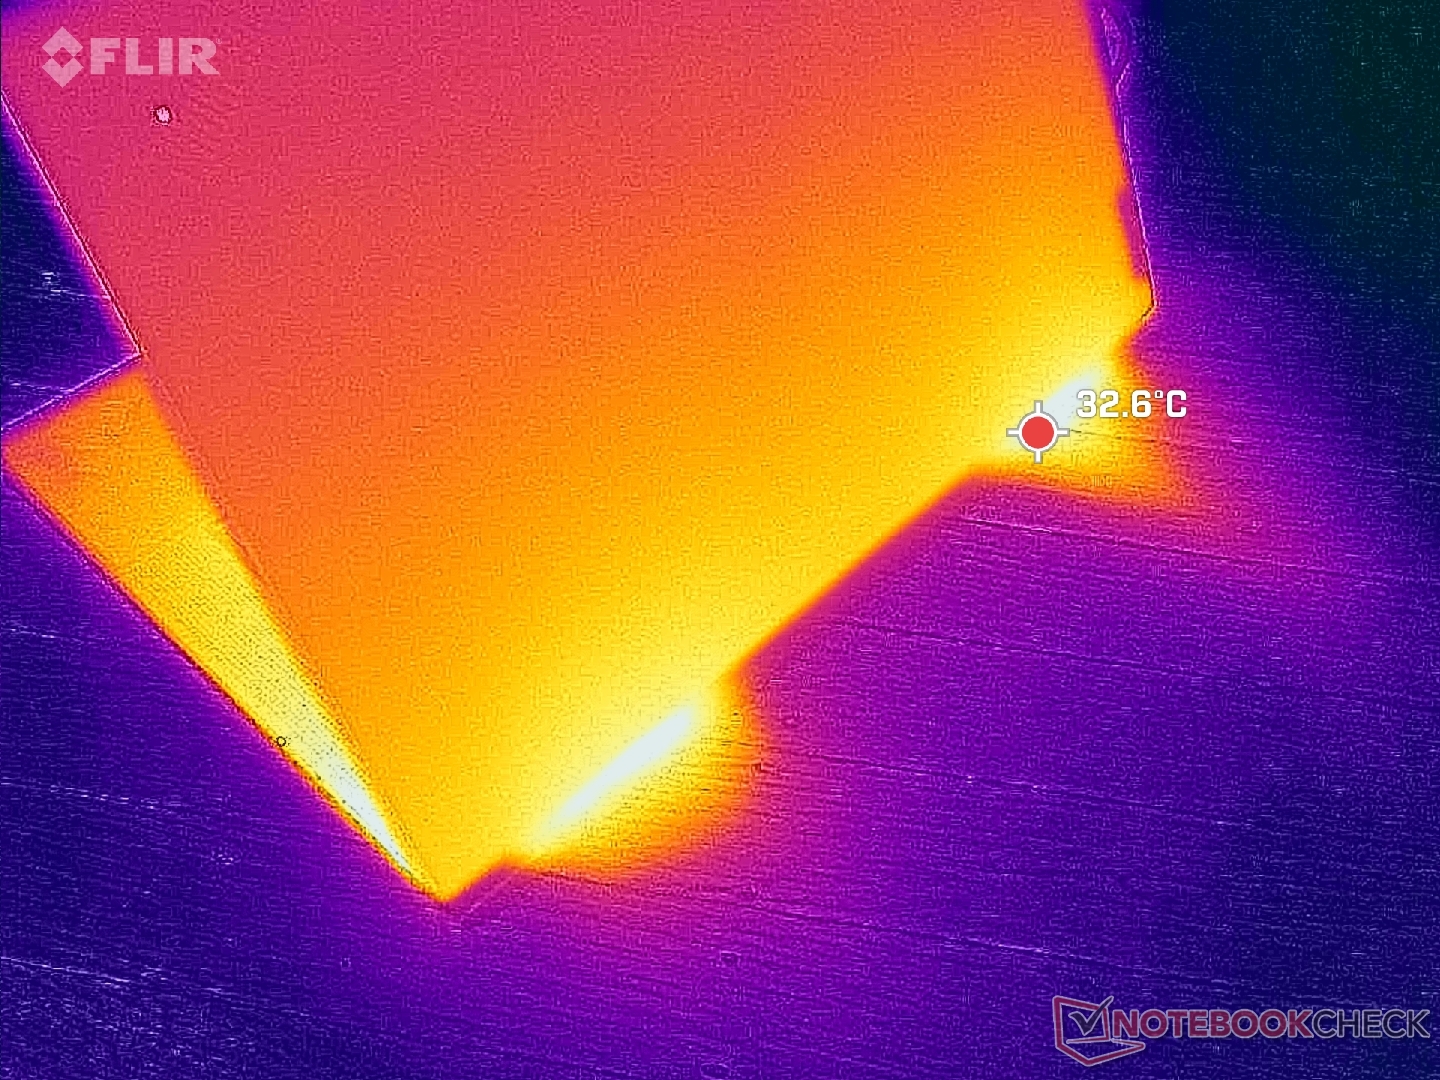
(±) Üst taraftaki maksimum sıcaklık, 36.8 °C / 98 F ortalamasına kıyasla 43 °C / 109 F'dir. , Multimedia sınıfı için 21 ile 71 °C arasında değişir.
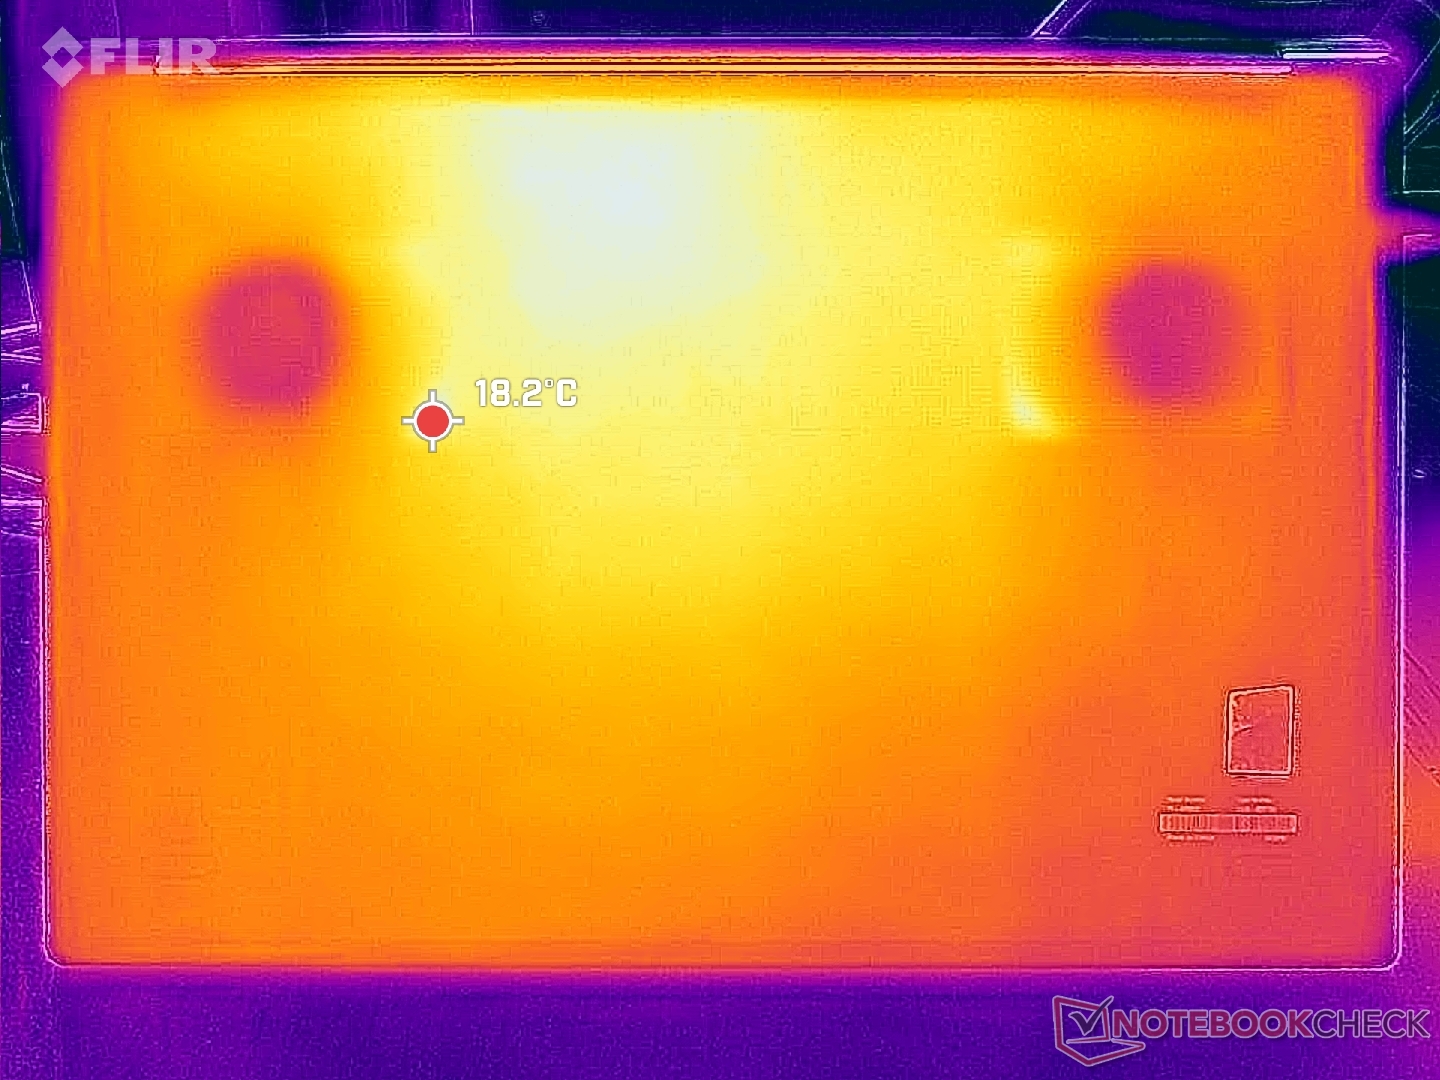
(±) Alt kısım, 39.1 °C / 102 F ortalamasına kıyasla maksimum 41.6 °C / 107 F'ye kadar ısınır
(+) Boşta kullanımda, üst tarafın ortalama sıcaklığı 20.3 °C / 69 F olup, cihazın 31.3 °C / 88 F.
(-) The Witcher 3 oynarken, üst tarafın ortalama sıcaklığı 38.1 °C / 101 F olup, cihazın 31.3 °C / 88 F.
(+) Avuç içi dayanakları ve dokunmatik yüzey, maksimum 30 °C / 86 F ile cilt sıcaklığından daha soğuktur ve bu nedenle dokunulduğunda soğuktur.
(±) Benzer cihazların avuç içi dayanağı alanının ortalama sıcaklığı 28.7 °C / 83.7 F (-1.3 °C / -2.3 F) idi.
| Lenovo ThinkPad Z16 Gen 2 AMD Ryzen 9 PRO 7940HS, AMD Radeon RX 6550M | Lenovo ThinkPad Z16 G1 21D5S00T00 AMD Ryzen 7 PRO 6850H, AMD Radeon RX 6500M | Lenovo ThinkBook 16 G6 ABP AMD Ryzen 5 7530U, AMD Radeon RX Vega 7 | MSI Creator Z16P B12UHST Intel Core i9-12900H, NVIDIA GeForce RTX 3080 Ti Laptop GPU | Apple MacBook Pro 16 2023 M3 Pro Apple M3 Pro 12-Core, Apple M3 Pro 18-Core GPU | Asus Vivobook Pro 16X K6604JV-MX016W Intel Core i9-13980HX, NVIDIA GeForce RTX 4060 Laptop GPU | |
|---|---|---|---|---|---|---|
| Heat | -33% | -30% | -49% | -2% | -36% | |
| Maximum Upper Side * (°C) | 43 | 56.8 -32% | 40.8 5% | 67 -56% | 38.1 11% | 39.7 8% |
| Maximum Bottom * (°C) | 41.6 | 53.3 -28% | 50.5 -21% | 69 -66% | 37 11% | 60 -44% |
| Idle Upper Side * (°C) | 21.2 | 28.2 -33% | 29.3 -38% | 29 -37% | 24.2 -14% | 30.9 -46% |
| Idle Bottom * (°C) | 21.4 | 29.4 -37% | 35.2 -64% | 29 -36% | 24.6 -15% | 34.7 -62% |
* ... daha küçük daha iyidir
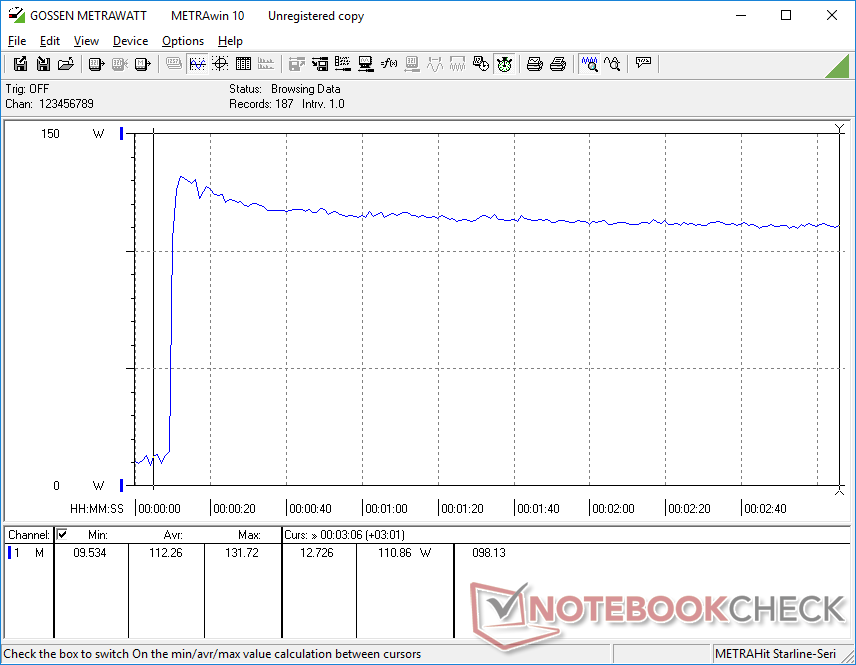
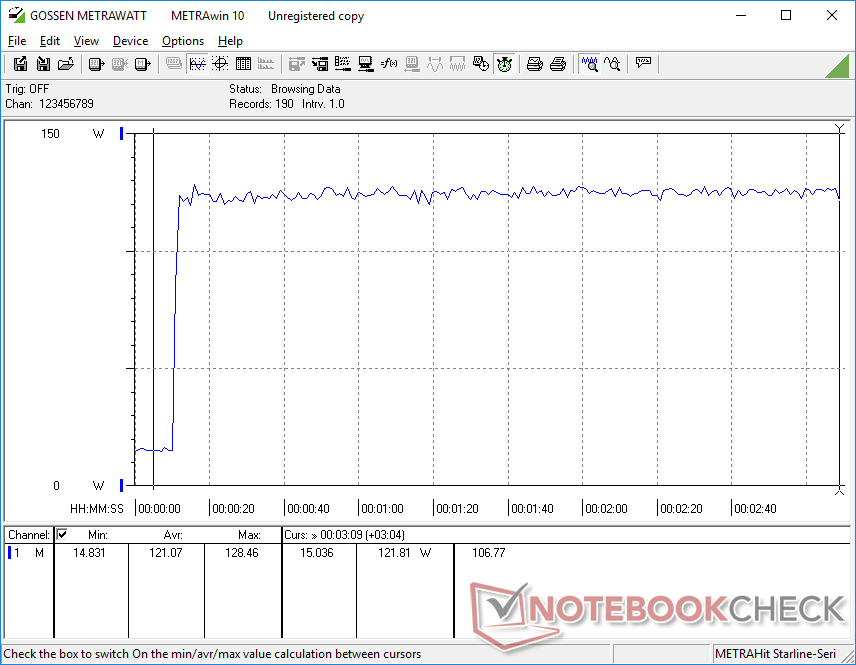
Stres Testi
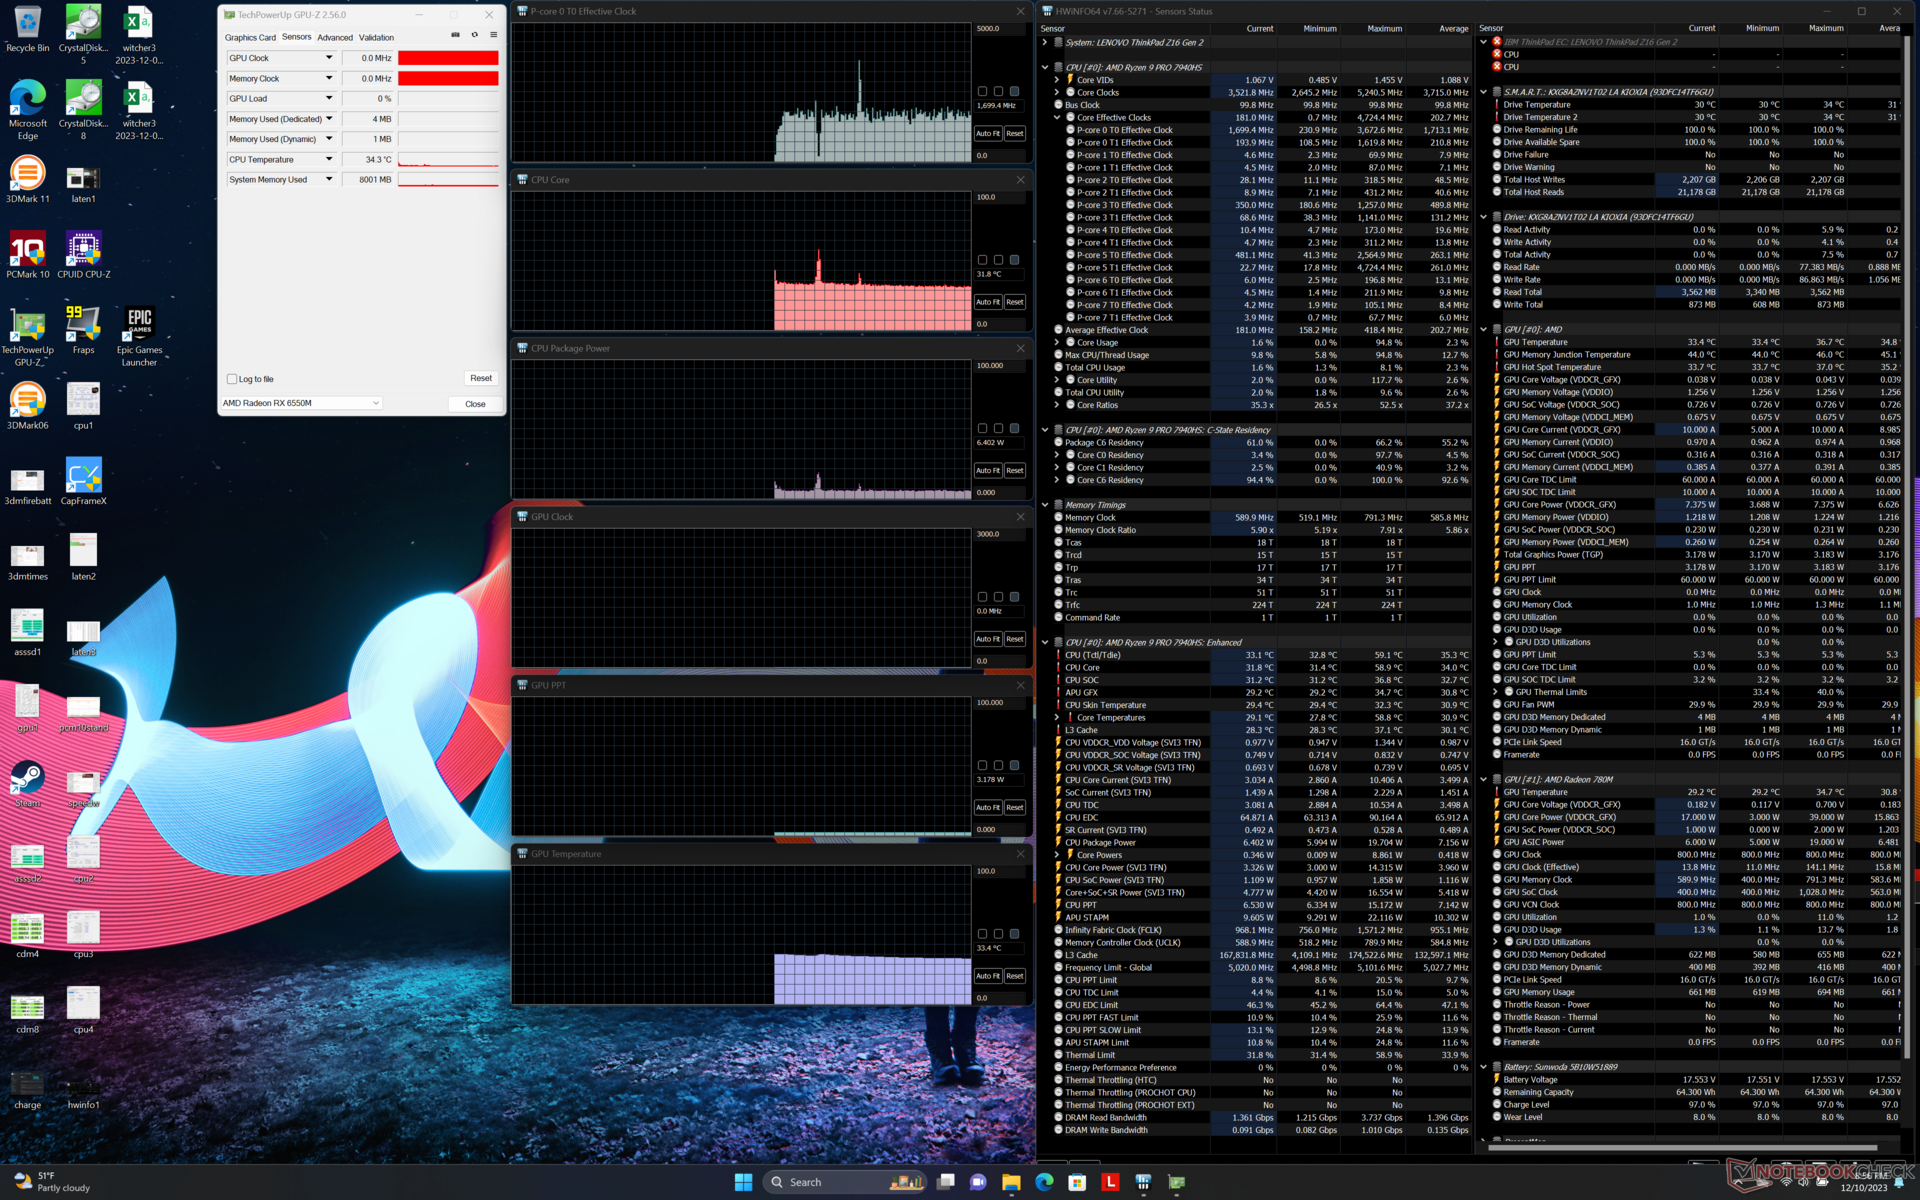
Prime95 stresini çalıştırırken CPU, 4,4 GHz, 69 W ve 100 C'de düşüp sabitlenmeden önce sadece birkaç saniye için 4,6 GHz ve 82 W'a yükselir. CPU'nun, üstteki soğutma çözümünün sınırları dahilinde olabildiğince hızlı çalıştığı açıktır.
Performans modunda çalışırken GPU saat hızları ve kart güç çekişi, Dengeli modda çalışırken 2133 MHz ve 39 W ile karşılaştırıldığında sırasıyla 2630 MHz ve 59 W'da sabitlenir. En önemlisi, çalıştırırken iki mod arasındaki performans açığı Witcher 3 fan gürültüsü farkları önemli olsa da sadece birkaç karede minimumdur. Bu nedenle, kullanıcılar çok daha sessiz fanlar ve biraz daha düşük çekirdek sıcaklıkları için Dengeli modda oyun oynamayı düşünebilirler.
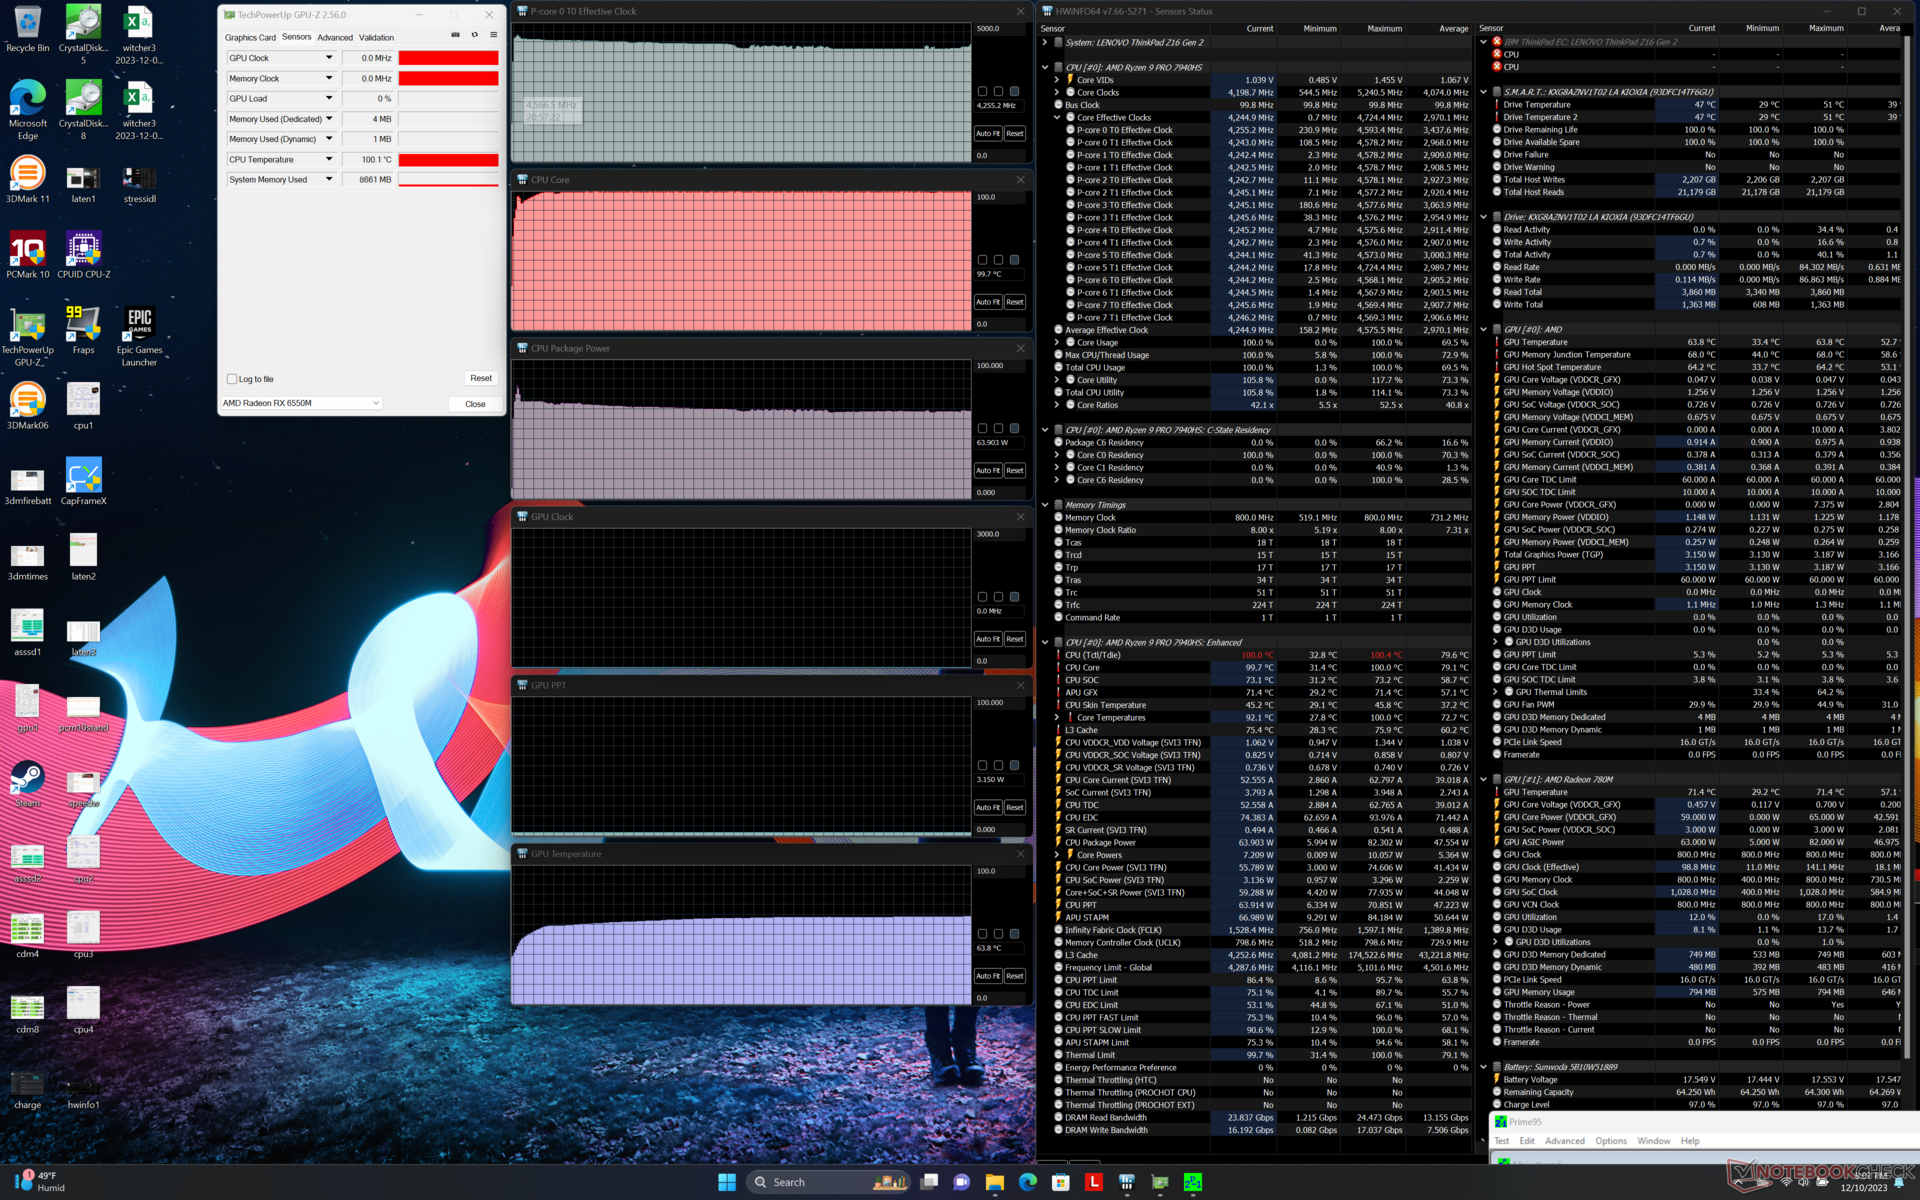
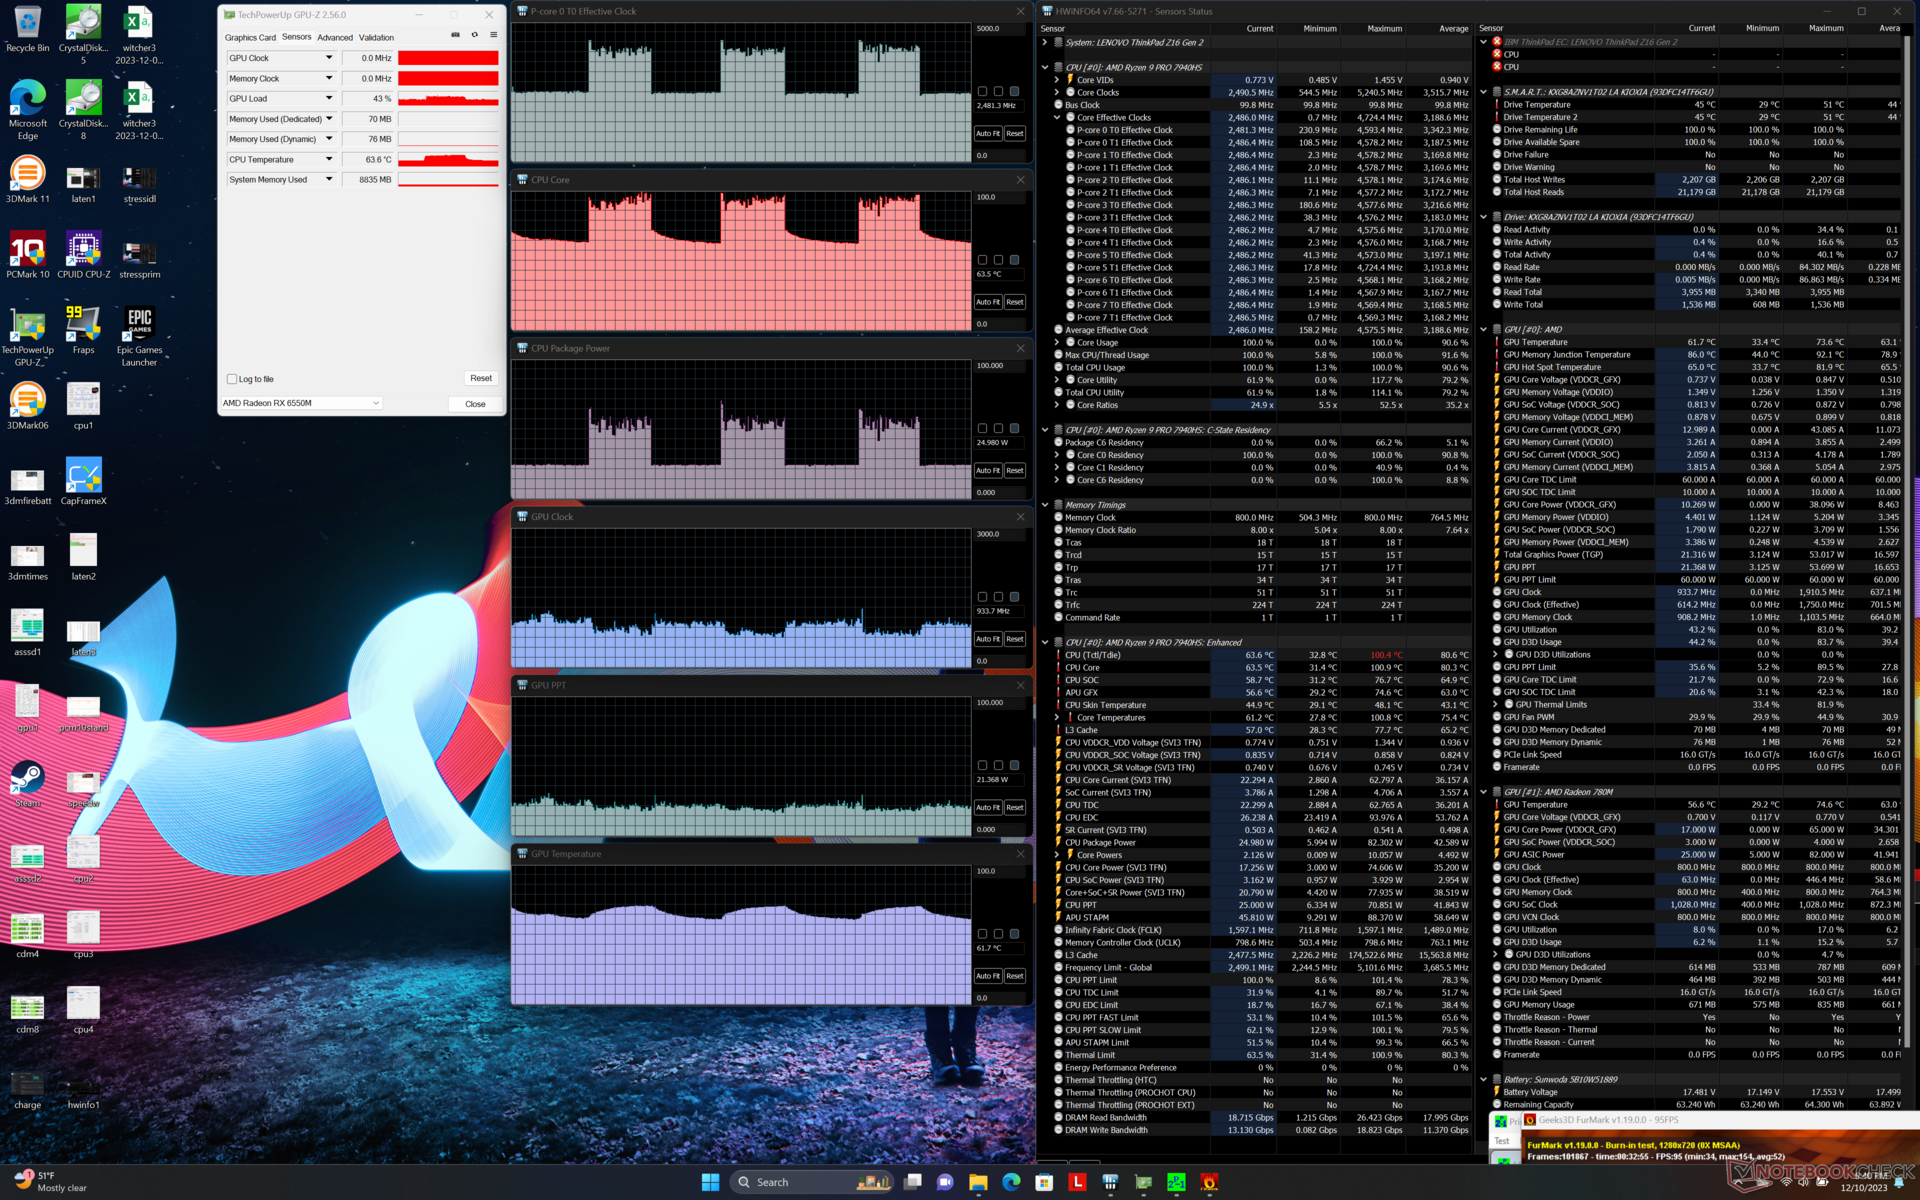
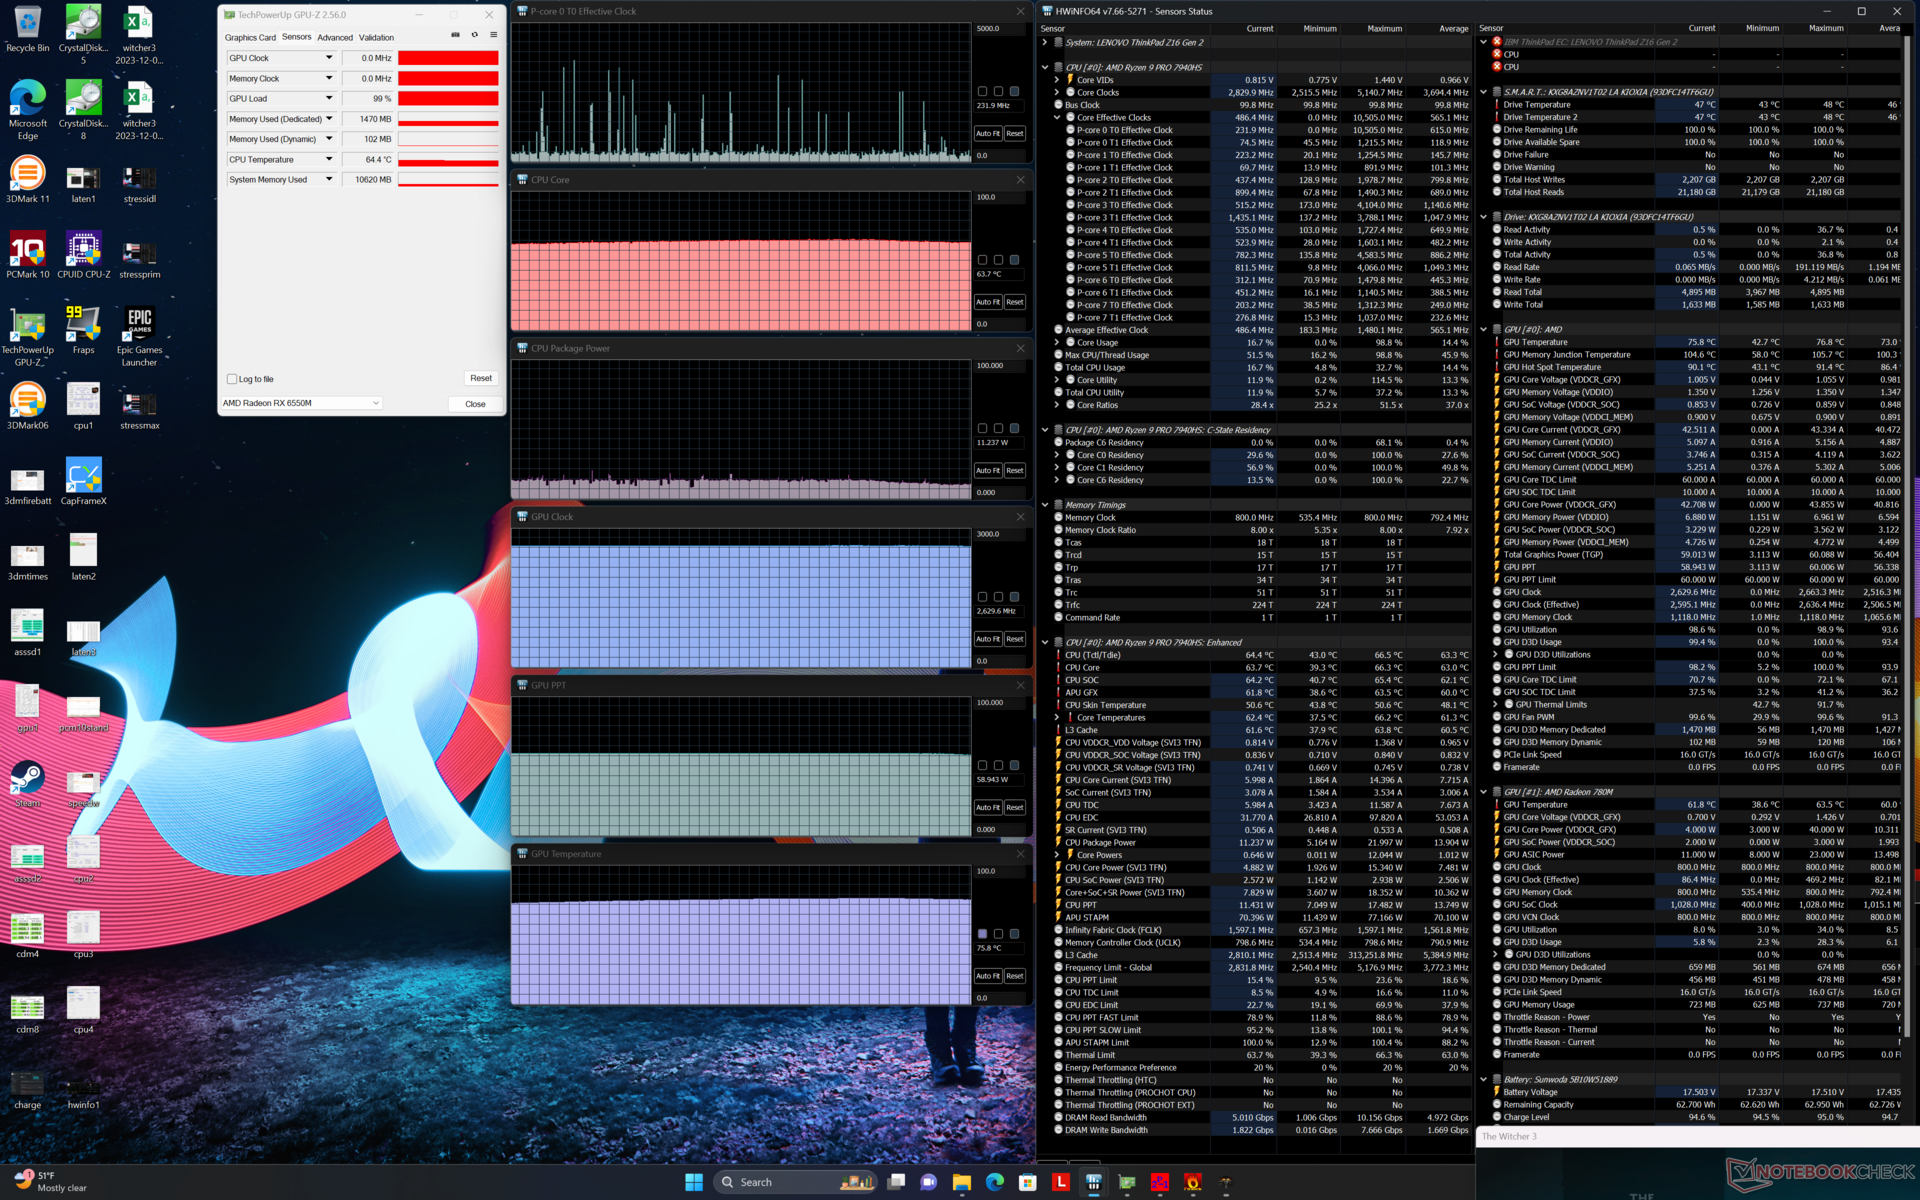
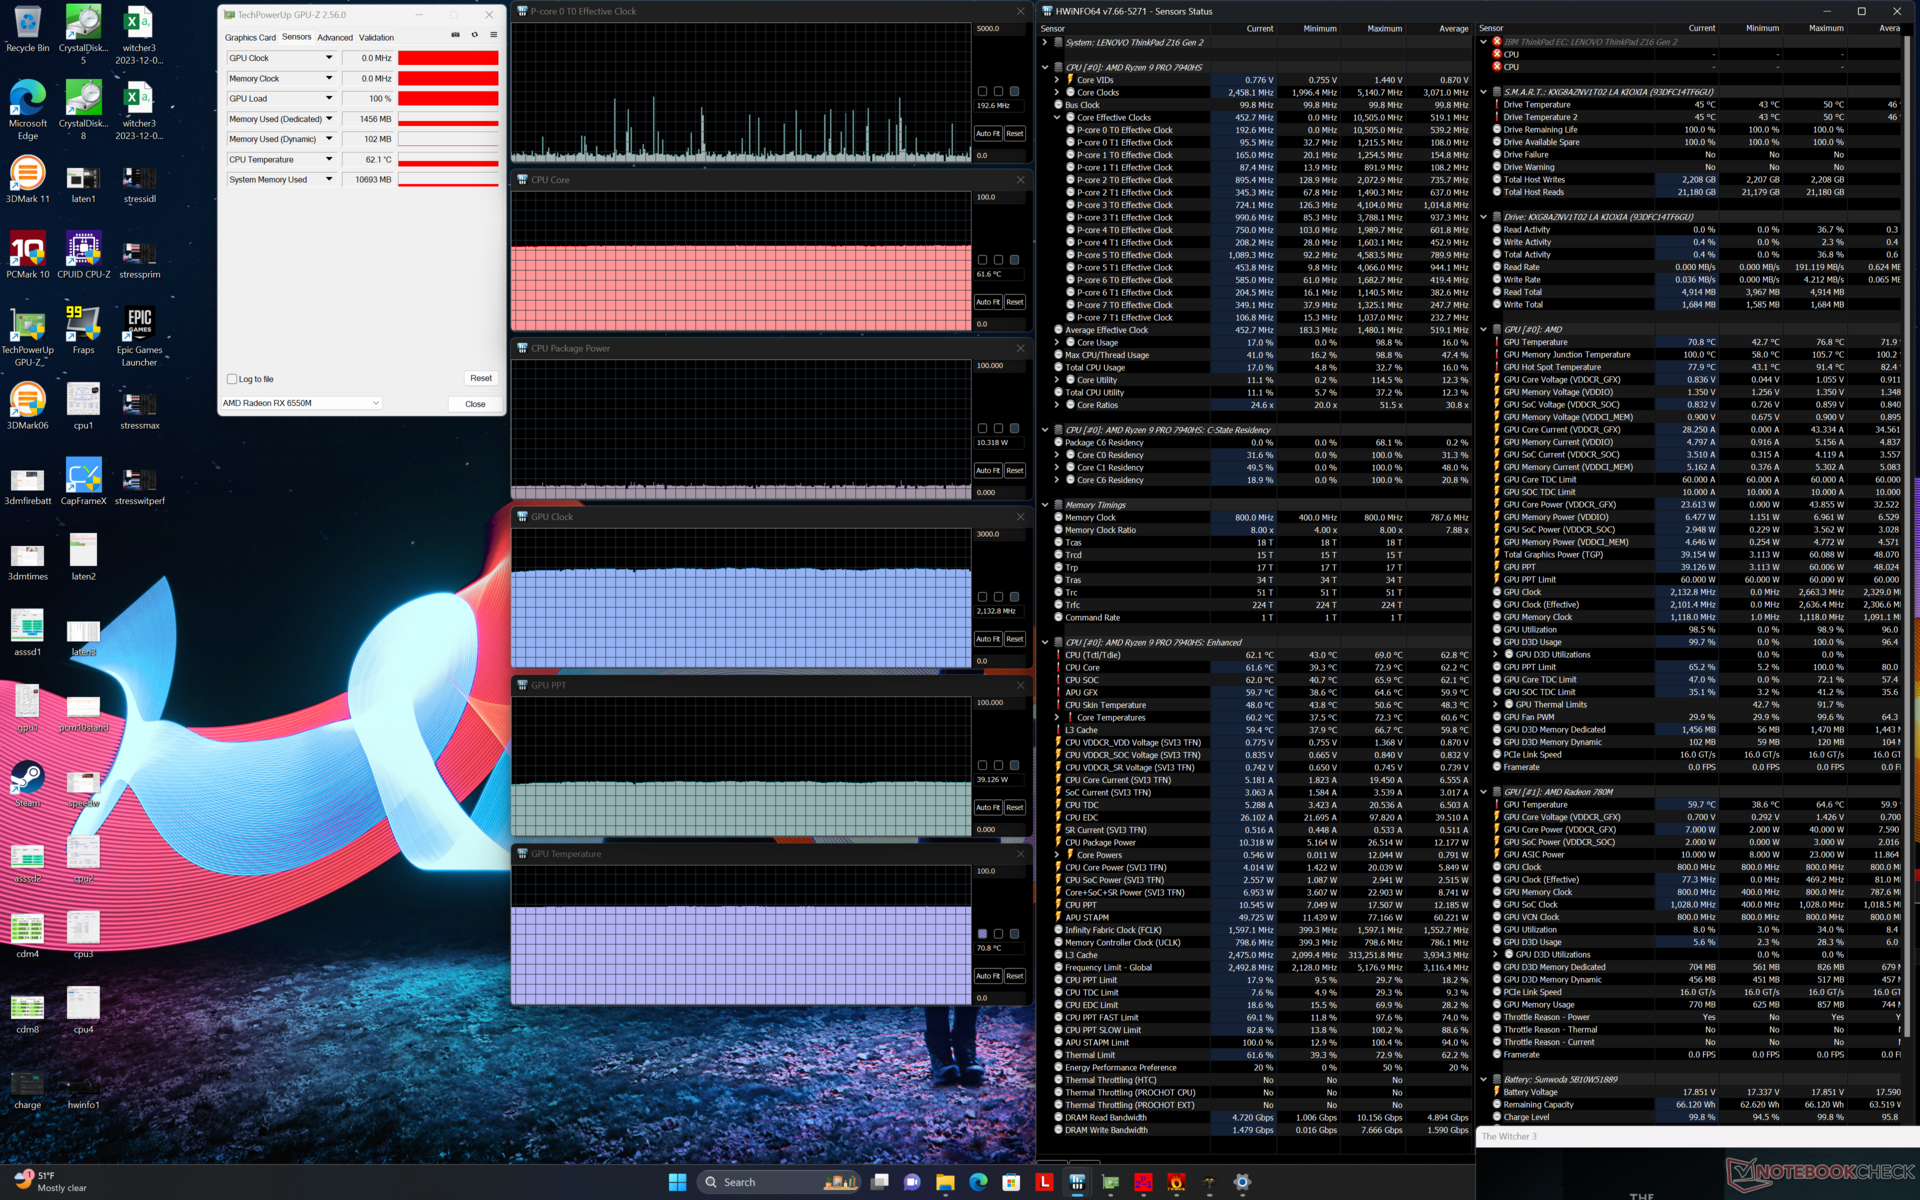
| CPU Saati (GHz) | GPU Saati (MHz) | Ortalama CPU Sıcaklığı (°C) | Ortalama GPU Sıcaklığı (°C) | |
| Sistem Boşta | -- | -- | 32 | 33 |
| Prime95 Stres | 4.2 | -- | 100 | 64 |
| Prime95 + FurMark Stres | 2,5 - 4,0 | 750 - 1000 | 64 - 100 | 62 - 72 |
| Witcher 3 Stres (Dengeli mod) | ~0,2 | 2133 | 62 | 71 |
| Witcher 3 Stres (Performans modu) | ~0.2 | 2630 | 64 | 76 |
Konuşmacılar
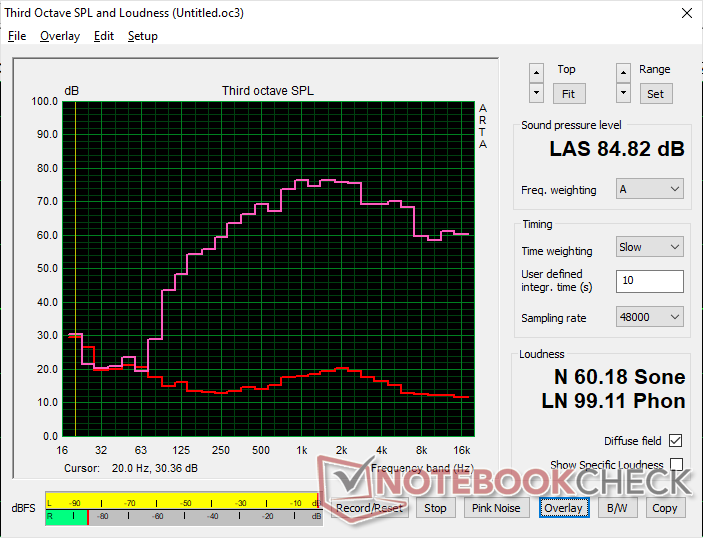
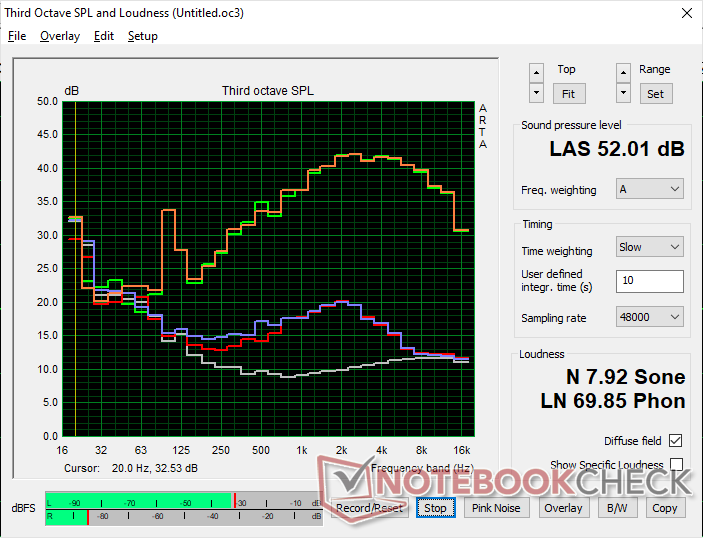
Lenovo ThinkPad Z16 Gen 2 ses analizi
(+) | hoparlörler nispeten yüksek sesle çalabilir (84.8 dB)
Bas 100 - 315Hz
(±) | azaltılmış bas - ortalama olarak medyandan 13% daha düşük
(±) | Bas doğrusallığı ortalamadır (11.1% delta - önceki frekans)
Ortalar 400 - 2000 Hz
(±) | daha yüksek ortalar - ortalama olarak medyandan 5.5% daha yüksek
(+) | orta frekanslar doğrusaldır (4.9% deltadan önceki frekansa)
Yüksekler 2 - 16 kHz
(+) | dengeli yüksekler - medyandan yalnızca 4.7% uzakta
(+) | yüksekler doğrusaldır (5.2% deltadan önceki frekansa)
Toplam 100 - 16.000 Hz
(+) | genel ses doğrusaldır (14.8% ortancaya göre fark)
Aynı sınıfla karşılaştırıldığında
» Bu sınıftaki tüm test edilen cihazların %35%'si daha iyi, 4% benzer, 61% daha kötüydü
» En iyisinin deltası 5% idi, ortalama 17% idi, en kötüsü 45% idi
Test edilen tüm cihazlarla karşılaştırıldığında
» Test edilen tüm cihazların %20'si daha iyi, 4 benzer, % 76 daha kötüydü
» En iyisinin deltası 4% idi, ortalama 23% idi, en kötüsü 134% idi
Apple MacBook Pro 16 2021 M1 Pro ses analizi
(+) | hoparlörler nispeten yüksek sesle çalabilir (84.7 dB)
Bas 100 - 315Hz
(+) | iyi bas - medyandan yalnızca 3.8% uzakta
(+) | bas doğrusaldır (5.2% delta ile önceki frekans)
Ortalar 400 - 2000 Hz
(+) | dengeli ortalar - medyandan yalnızca 1.3% uzakta
(+) | orta frekanslar doğrusaldır (2.1% deltadan önceki frekansa)
Yüksekler 2 - 16 kHz
(+) | dengeli yüksekler - medyandan yalnızca 1.9% uzakta
(+) | yüksekler doğrusaldır (2.7% deltadan önceki frekansa)
Toplam 100 - 16.000 Hz
(+) | genel ses doğrusaldır (4.6% ortancaya göre fark)
Aynı sınıfla karşılaştırıldığında
» Bu sınıftaki tüm test edilen cihazların %0%'si daha iyi, 0% benzer, 100% daha kötüydü
» En iyisinin deltası 5% idi, ortalama 17% idi, en kötüsü 45% idi
Test edilen tüm cihazlarla karşılaştırıldığında
» Test edilen tüm cihazların %0'si daha iyi, 0 benzer, % 100 daha kötüydü
» En iyisinin deltası 4% idi, ortalama 23% idi, en kötüsü 134% idi
Enerji Yönetimi
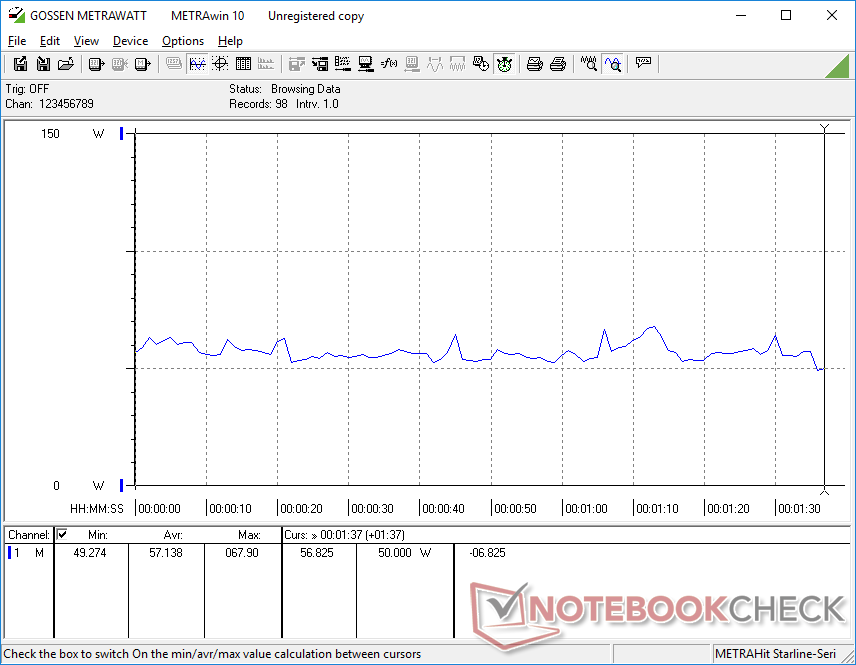
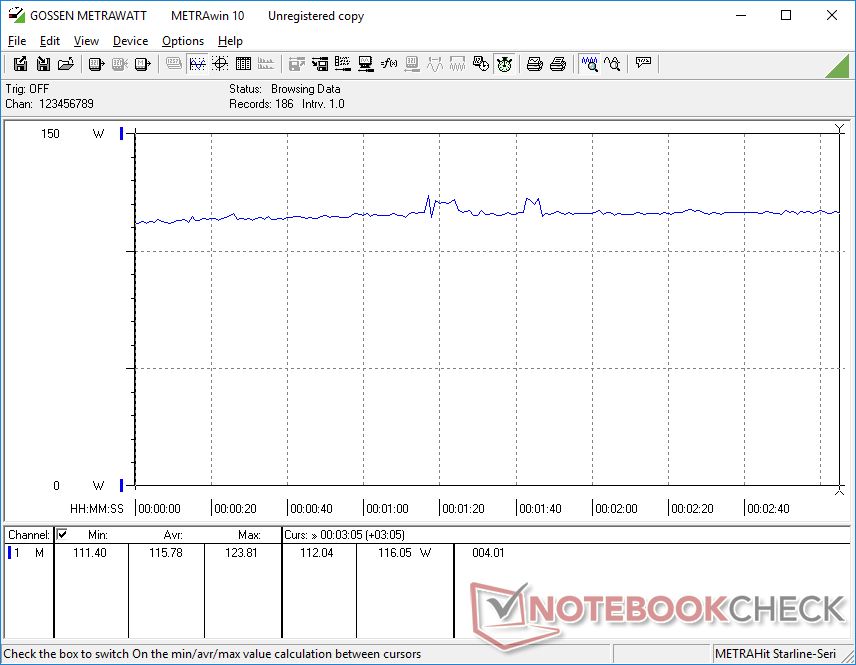
Güç Tüketimi
4K OLED panel güç tüketimini kayda değer miktarda etkiliyor. Örneğin, tamamen siyah bir ekranda boşta çalışırken güç tüketimi sadece 7 W olurken, maksimum parlaklıkta tamamen beyaz bir ekran, IPS yapılandırmasında sadece 10 W'a kıyasla neredeyse 19 W talep edebilir. IPS ve OLED arasındaki güç tüketimi farkları daha ayrıntılı olarak incelenmiştir burada.
CPU veya GPU yoğun görevleri çalıştırırken tüketim, daha zorlu OLED paneli hesaba kattıktan sonra bile ThinkPad Z16 Gen 1 'den biraz daha yüksektir. Bununla birlikte, Zen 4 Ryzen 9 CPU'nun sunduğu büyük performans artışlarına göre farklar küçüktür.
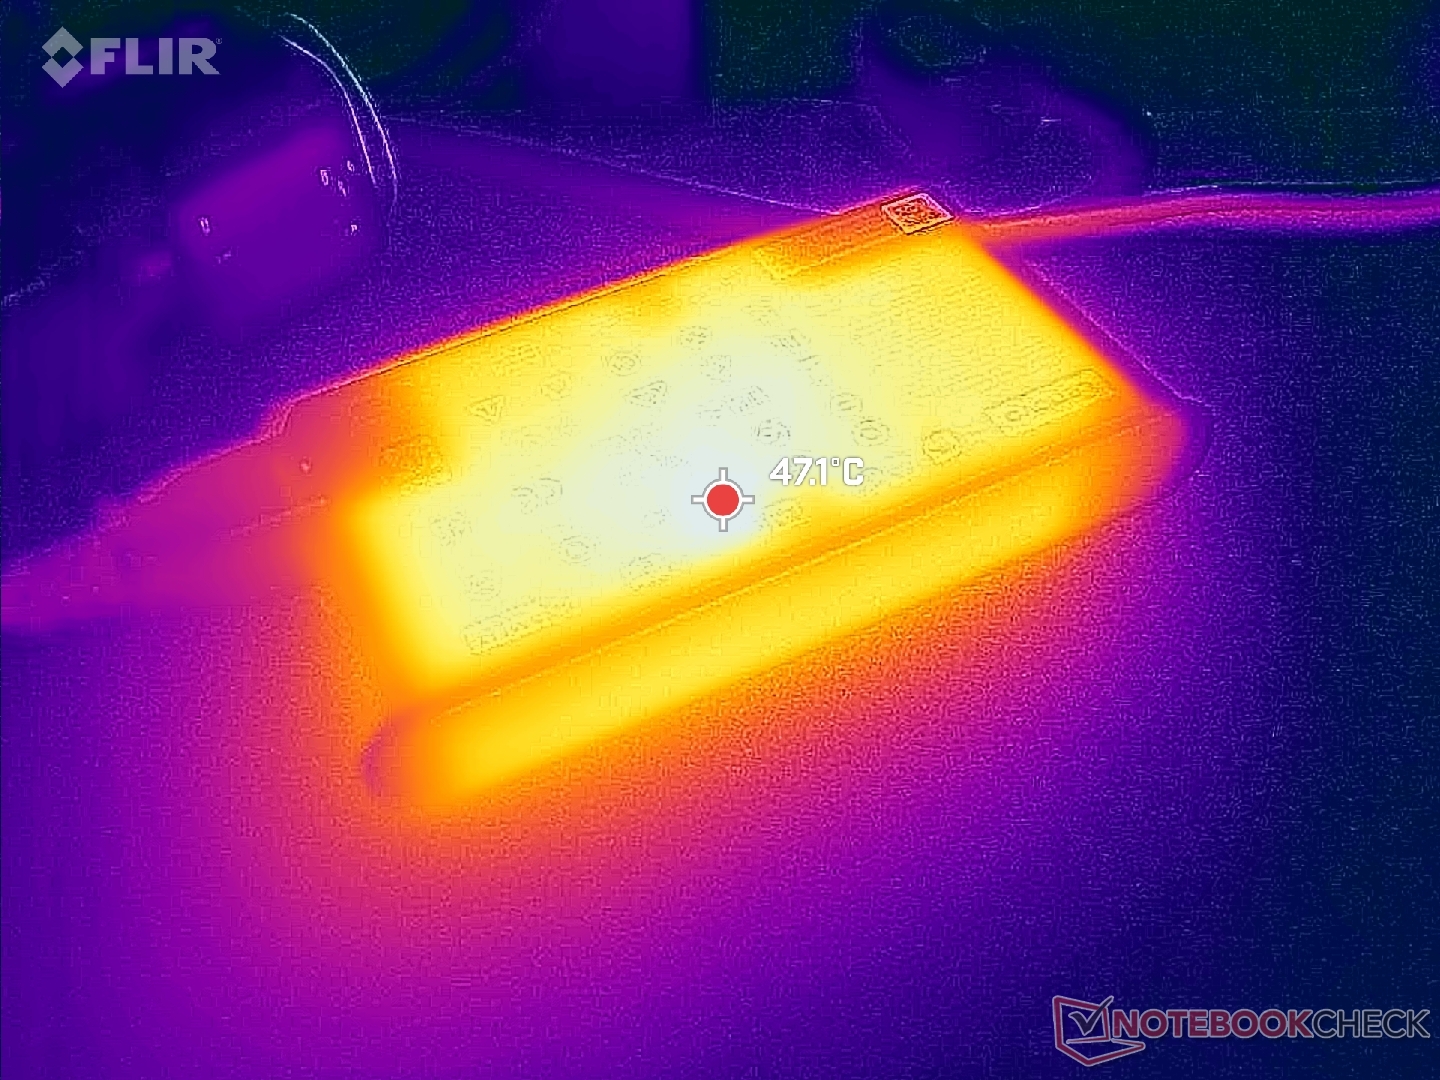
Orta büyüklükteki (~14,6 x 7,7 x 2,3 cm) 135 W USB-C AC adaptörden maksimum 132 W tüketim ölçebiliyoruz. Oyun oynamak zaten neredeyse 120 W gerektiriyor, bu da aynı anda zorlu yükler çalıştırıldığında şarj hızının yavaşlayacağı anlamına geliyor.
| Kapalı / Bekleme modu | |
| Boşta | |
| Çalışırken |
|
Key:
min: | |
| Lenovo ThinkPad Z16 Gen 2 R9 PRO 7940HS, Radeon RX 6550M, Kioxia XG8 KXG8AZNV1T02, OLED, 3840x2400, 16" | Lenovo ThinkPad Z16 G1 21D5S00T00 R7 PRO 6850H, Radeon RX 6500M, Samsung PM9A1 MZVL21T0HCLR, IPS LED, 1920x1200, 16" | Lenovo ThinkBook 16 G6 ABP R5 7530U, Vega 7, SK hynix HFS512GEJ9X125N, IPS, 1920x1200, 16" | MSI Creator Z16P B12UHST i9-12900H, GeForce RTX 3080 Ti Laptop GPU, Samsung PM9A1 MZVL22T0HBLB, IPS True Pixel (~100% DCI-P3), 2560x1600, 16" | Asus Vivobook Pro 16X K6604JV-MX016W i9-13980HX, GeForce RTX 4060 Laptop GPU, Solidigm P41 Plus SSDPFKNU010TZ, OLED, 3200x2000, 16" | Apple MacBook Pro 16 2023 M3 Max Apple M3 Max 16-Core, M3 Max 40-Core GPU, Apple SSD AP8192Z, Mini-LED, 3456x2234, 16" | |
|---|---|---|---|---|---|---|
| Power Consumption | 15% | 45% | -60% | -71% | -17% | |
| Idle Minimum * (Watt) | 7.5 | 5.3 29% | 3.7 51% | 11 -47% | 13.8 -84% | 5.2 31% |
| Idle Average * (Watt) | 9.6 | 8.6 10% | 7.1 26% | 17 -77% | 16 -67% | 16.9 -76% |
| Idle Maximum * (Watt) | 18.5 | 9.5 49% | 7.7 58% | 26 -41% | 19 -3% | 17.2 7% |
| Load Average * (Watt) | 57.1 | 65.2 -14% | 43.9 23% | 124 -117% | 147 -157% | 90.5 -58% |
| Witcher 3 ultra * (Watt) | 115.8 | 93.6 19% | 40.8 65% | 133.5 -15% | 147.8 -28% | 109 6% |
| Load Maximum * (Watt) | 131.7 | 133.81 -2% | 66.6 49% | 212 -61% | 244 -85% | 145.2 -10% |
* ... daha küçük daha iyidir
Power Consumption Witcher 3 / Stresstest
Power Consumption external Monitor
Pil Ömrü
Çalışma süreleri, büyük ölçüde daha zorlu OLED panelimiz nedeniyle geçen yılki modele göre genellikle daha kısadır. Çoğu web sayfası ağırlıklı olarak beyaz renkte olduğundan, yukarıdaki Güç Tüketimi bölümünde belirtildiği gibi aktif uygulamalar iddiasız olsa bile güç tüketimi 10 W daha yüksek olabilir. ThinkPad Z16 IPS konfigürasyonundaki 10 saat veya 16 saatin üzerindeki WLAN çalışma süresine kıyasla yalnızca 6 saatlik bir WLAN çalışma süresi kaydedebildik MacBook Pro 16.
Boş kapasiteden tam kapasiteye şarj etme, çoğu Ultrabook'taki 1,5 ila 2 saate kıyasla yaklaşık 2,5 saat ile normalden daha yavaştır. Bu, hem Ryzen 9 hem de USB-C ile çalışan ayrı grafiklere sahip birkaç dizüstü bilgisayardan biridir.
| Lenovo ThinkPad Z16 Gen 2 R9 PRO 7940HS, Radeon RX 6550M, 72 Wh | Lenovo ThinkPad Z16 G1 21D5S00T00 R7 PRO 6850H, Radeon RX 6500M, 72 Wh | Lenovo ThinkBook 16 G6 ABP R5 7530U, Vega 7, 45 Wh | MSI Creator Z16P B12UHST i9-12900H, GeForce RTX 3080 Ti Laptop GPU, 90 Wh | Asus Vivobook Pro 16X K6604JV-MX016W i9-13980HX, GeForce RTX 4060 Laptop GPU, 90 Wh | Apple MacBook Pro 16 2023 M3 Max Apple M3 Max 16-Core, M3 Max 40-Core GPU, 99.6 Wh | |
|---|---|---|---|---|---|---|
| Pil Çalışma Süresi | 45% | 68% | -27% | -2% | 75% | |
| Reader / Idle (h) | 10.2 | |||||
| WiFi v1.3 (h) | 6 | 9.9 65% | 10.1 68% | 5.2 -13% | 6.5 8% | 16.7 178% |
| Load (h) | 1.7 | 2.1 24% | 1 -41% | 1.5 -12% | 1.2 -29% | |
| H.264 (h) | 11.9 | 11.6 | 5.8 | 5.3 | 20.4 |
Artılar
Eksiler
Karar - Vasat Bir GPU Tarafından Engellenen Harika Tasarım
Orijinal Gen 1 modelini incelediğimizde ThinkPad Z16'yı sağlam ve çekici yapısı, rahat klavyesi ve trackpad'i ile övmüştük. Gen 2 modeli tüm bu avantajları korurken, sırasıyla çok daha hızlı bir Ryzen Pro CPU ve fark edilir derecede daha iyi performans ve renkler için yüksek kaliteli bir OLED dokunmatik ekran ekliyor. Bu iki ekleme, Gen 1 yerine Gen 2 versiyonunun seçilmesinin başlıca nedenleridir.
ThinkPad Z16 Gen 2 kesinlikle şık ve seksi ve yeni Zen 4 Pro CPU da hiç fena değil. Ancak Radeon RX 6550M, özellikle bu fiyat aralığında çok az çok geç.
Yeni Radeon RX 6550M ayrıca iki model versiyonu arasında ayrım yapılmasına yardımcı olur, ancak performansı özellikle 1600 $ + 'lık yüksek fiyatı hesaba kattığınızda etkileyici değildir. GPU'nun daha eski bir AMD mimarisine sahip olmasının yanı sıra, GeForce RTX 3050 Ti'li dizüstü bilgisayarlar benzer bir performans sunarken bin doların altında bir fiyata bulunabiliyor. Radeon GPU kesinlikle ThinkPad Z16 serisinin şimdiye kadarki en zayıf yönlerinden biri.
Eğer Ryzen Pro ile ilgilenmiyorsanız, o zaman
Asus Vivobook Pro 16X ya da hatta HP Spectre x360 16 serisi her biri ince kasa tasarımlarında benzer OLED ve ayrık grafik seçenekleri sunduğundan ThinkPad Z16 Gen 2'ye mükemmel alternatifler olarak hizmet edebilir. Umarım Lenovo'nun gelecekteki revizyonları GeForce RTX veya daha yeni RDNA3 seçeneklerini içerir.Fiyat ve Bulunabilirlik
Lenovo şu anda ThinkPad Z16 Gen 2'yi Ryzen 5, entegre GPU ve 1200p IPS konfigürasyonu için 1600 USD'den başlayıp incelendiği gibi 2600 USD'nin üzerine kadar gönderiyor.
Lenovo ThinkPad Z16 Gen 2
- 12/16/2023 v7 (old)
Allen Ngo
Şeffaflık
İncelenecek cihazların seçimi editör ekibimiz tarafından yapılır. Test örneği, bu incelemenin amacı doğrultusunda üretici veya perakendeci tarafından yazara ödünç olarak sağlanmıştır. Borç verenin bu inceleme üzerinde herhangi bir etkisi olmadığı gibi, üretici de yayınlanmadan önce bu incelemenin bir kopyasını almamıştır. Bu incelemeyi yayınlama zorunluluğu yoktu. Bağımsız bir medya şirketi olarak Notebookcheck, üreticilerin, perakendecilerin veya yayıncıların otoritesine tabi değildir.
Notebookcheck bu şekilde test yapıyor
Notebookcheck, tüm sonuçların karşılaştırılabilir olmasını sağlamak için her yıl yüzlerce dizüstü bilgisayarı ve akıllı telefonu standart prosedürler kullanarak bağımsız olarak inceliyor. Yaklaşık 20 yıldır test yöntemlerimizi sürekli olarak geliştirdik ve bu süreçte endüstri standartlarını belirledik. Test laboratuvarlarımızda deneyimli teknisyenler ve editörler tarafından yüksek kaliteli ölçüm ekipmanları kullanılmaktadır. Bu testler çok aşamalı bir doğrulama sürecini içerir. Karmaşık derecelendirme sistemimiz, nesnelliği koruyan yüzlerce sağlam temellere dayanan ölçüm ve kıyaslamaya dayanmaktadır.Price comparison

