Karar - Dengeli Performans ve Taşınabilirlik
ZBook X G1i 16, daha yavaş ZBook 8 serisi ile daha hızlı ancak daha ağır ZBook Fury serisinin ortasında rahatça oturuyor. Dışarıdan bakıldığında, geçen yıla göre neredeyse hiçbir şey değişmemiş ZBook Power 16 G11 böylece zengin özelliklere sahip bağlantı noktaları ve rahat tuşlar da dahil olmak üzere kullanıcı deneyimi aynı kalmıştır. Hem pil ömrü hem de performans iyileşmiştir, ancak zorlu yükleri çalıştırırken güç tüketimi de biraz daha yüksektir.
Makinede bazı özellikler eksik kalıyor. Üst düzey CPU ve GPU seçeneklerine beklenildiği gibi ulaşılamazken, modelde OLED, HDR ve ECC RAM desteği bulunmuyor, bu da küçük bir kullanıcı alt kümesini rahatsız edebilir. Özellikle sağ kenarda USB-C bağlantı noktası bulunmadığı için bağlantı noktaları sol kenar boyunca kalabalık hissediliyor. CPU ve GPU'yu zorlamayı seven kullanıcılar, sistemin son nesil muadilinden daha sessiz çalışmayacağını da göreceklerdir.
Gelecek modeller için, ZBook X serisinin daha iyi CPU Turbo Boost performansı sunarken tescilli AC varil şarjından uzaklaştığını görmek istiyoruz. İşlemci zorlandığında oldukça hızlı bir şekilde 100 C'nin üzerine çıkmaktadır, bu da daha güçlü bir soğutma çözümünün faydalı olabileceğini göstermektedir.
Artılar
Eksiler
Fiyat ve Bulunabilirlik
İncelenen konfigürasyon şu anda HP.com'da diğer birçok seçenekle birlikte 2900$'a satılmaktadır. Core Ultra 9 ve 2400p yapılandırması Amazon'da 3500$'a satılmaktadır.
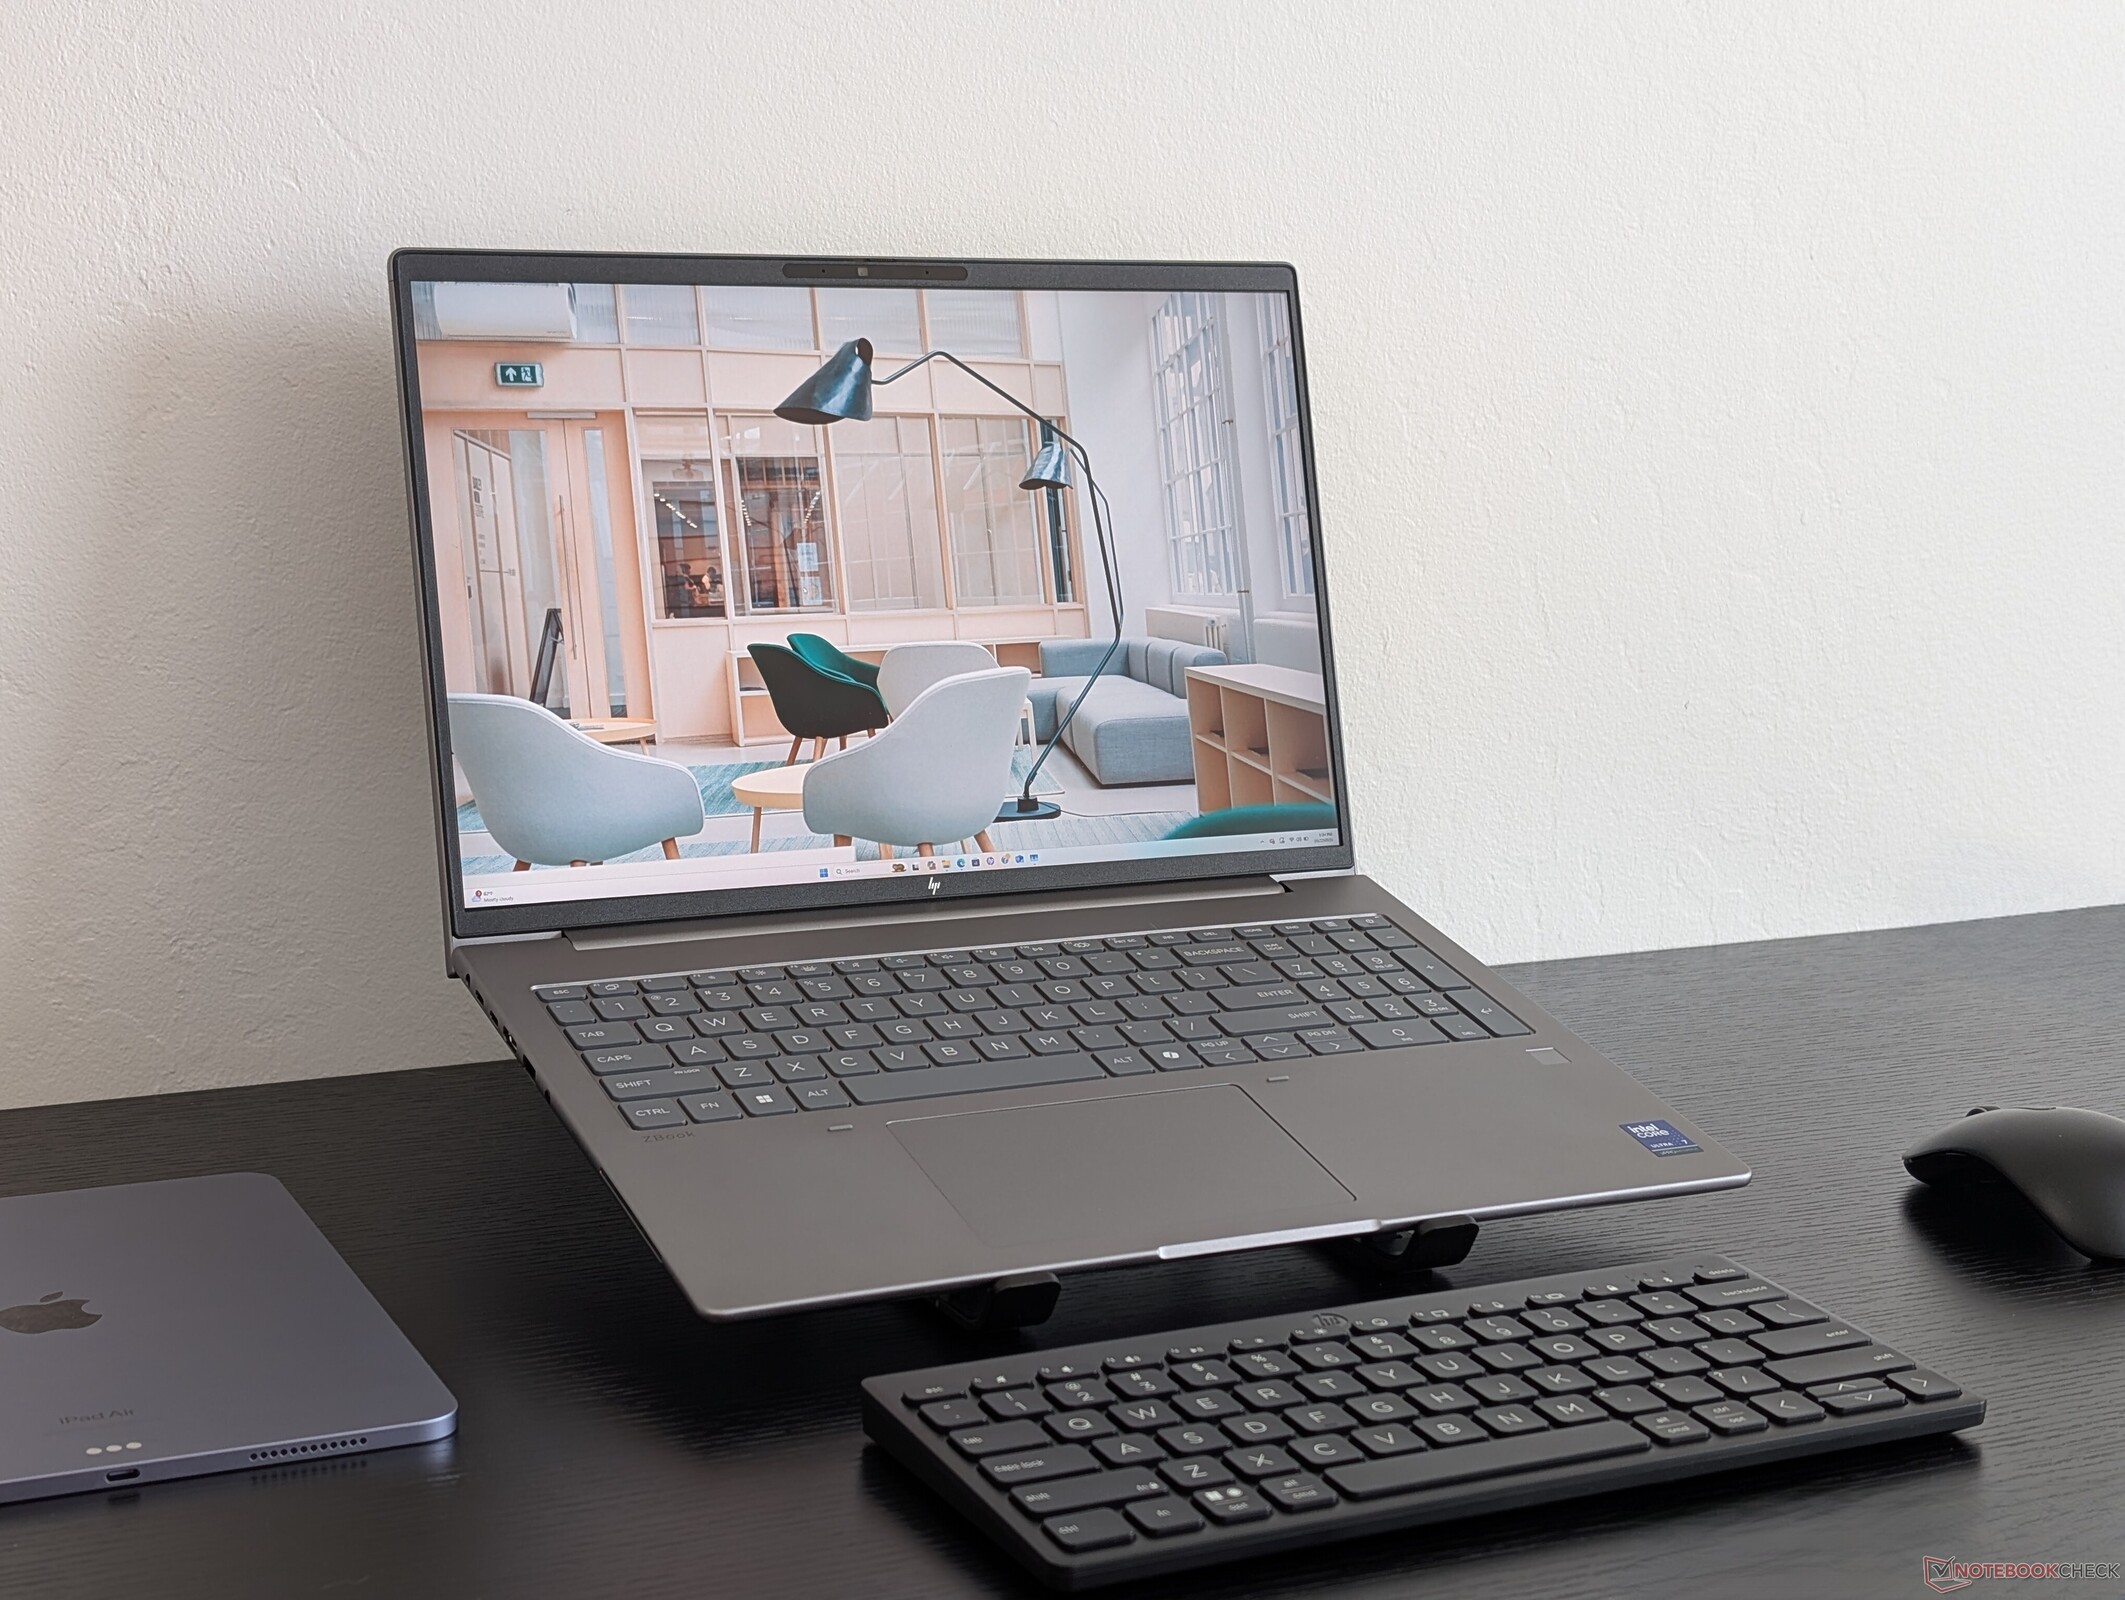
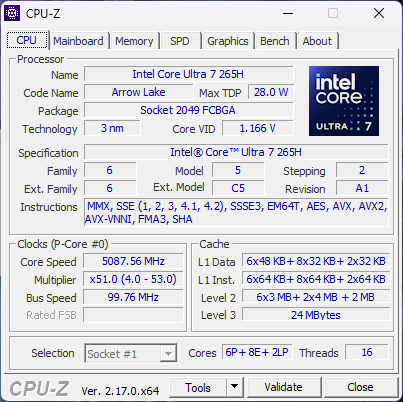
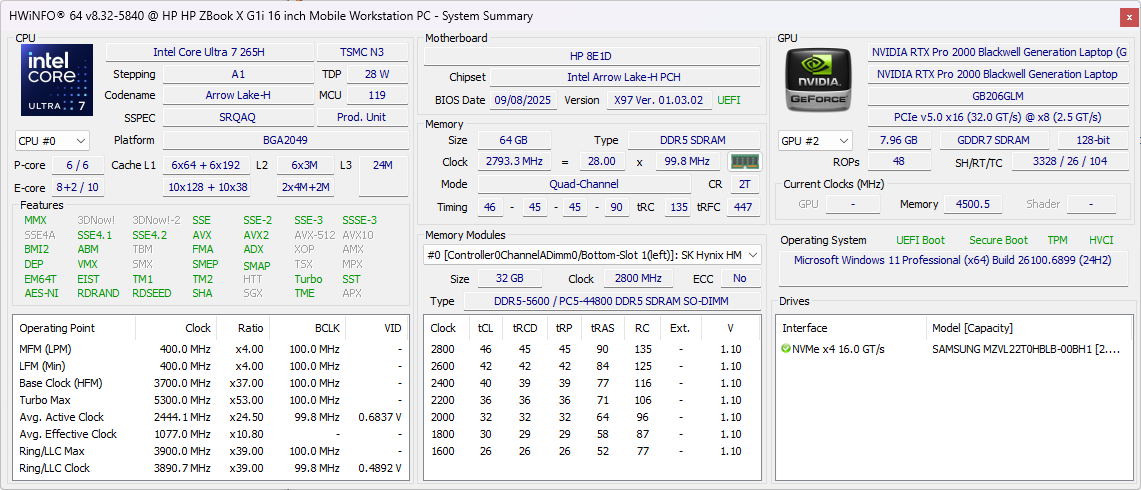
HP ZBook X G1i 16, orta seviye Arrow Lake-H işlemcilere ve Nvidia RTX Pro Blackwell GPU grafiklere sahip ultra ince bir mobil iş istasyonudur. Core Ultra 9 285H CPU ve RTX Pro 2000 GPU ile en üst seviyeye çıkarken, daha kalın ZBook Fury G1i 16 daha hızlı Arrow Lake-HX ve RTX Pro 5000 grafiklerle donatılabilir.
Test ünitemiz Core Ultra 7 265H, 2K 1600p120 ekran ve RTX Pro 2000 GPU ile yaklaşık 2700 USD'ye orta konfigürasyondur. Mevcut konfigürasyonların tam listesi adresinde görülebilir.
ZBook X G1i 16'nın alternatifleri arasında 16 inçlik diğer ultra ince iş istasyonları da yer alıyor Dell Precision 5690, Lenovo ThinkPad P16s G2veya MSI CreatorPro serisi. ZBook X G1i 16, daha yavaş RTX Pro 500 GPU'ya sahip daha düşük kaliteli bir sürüm olan ZBook 8 G1i 16 ile karıştırılmamalıdır.
Daha fazla HP incelemesi:
Teknik Özellikler
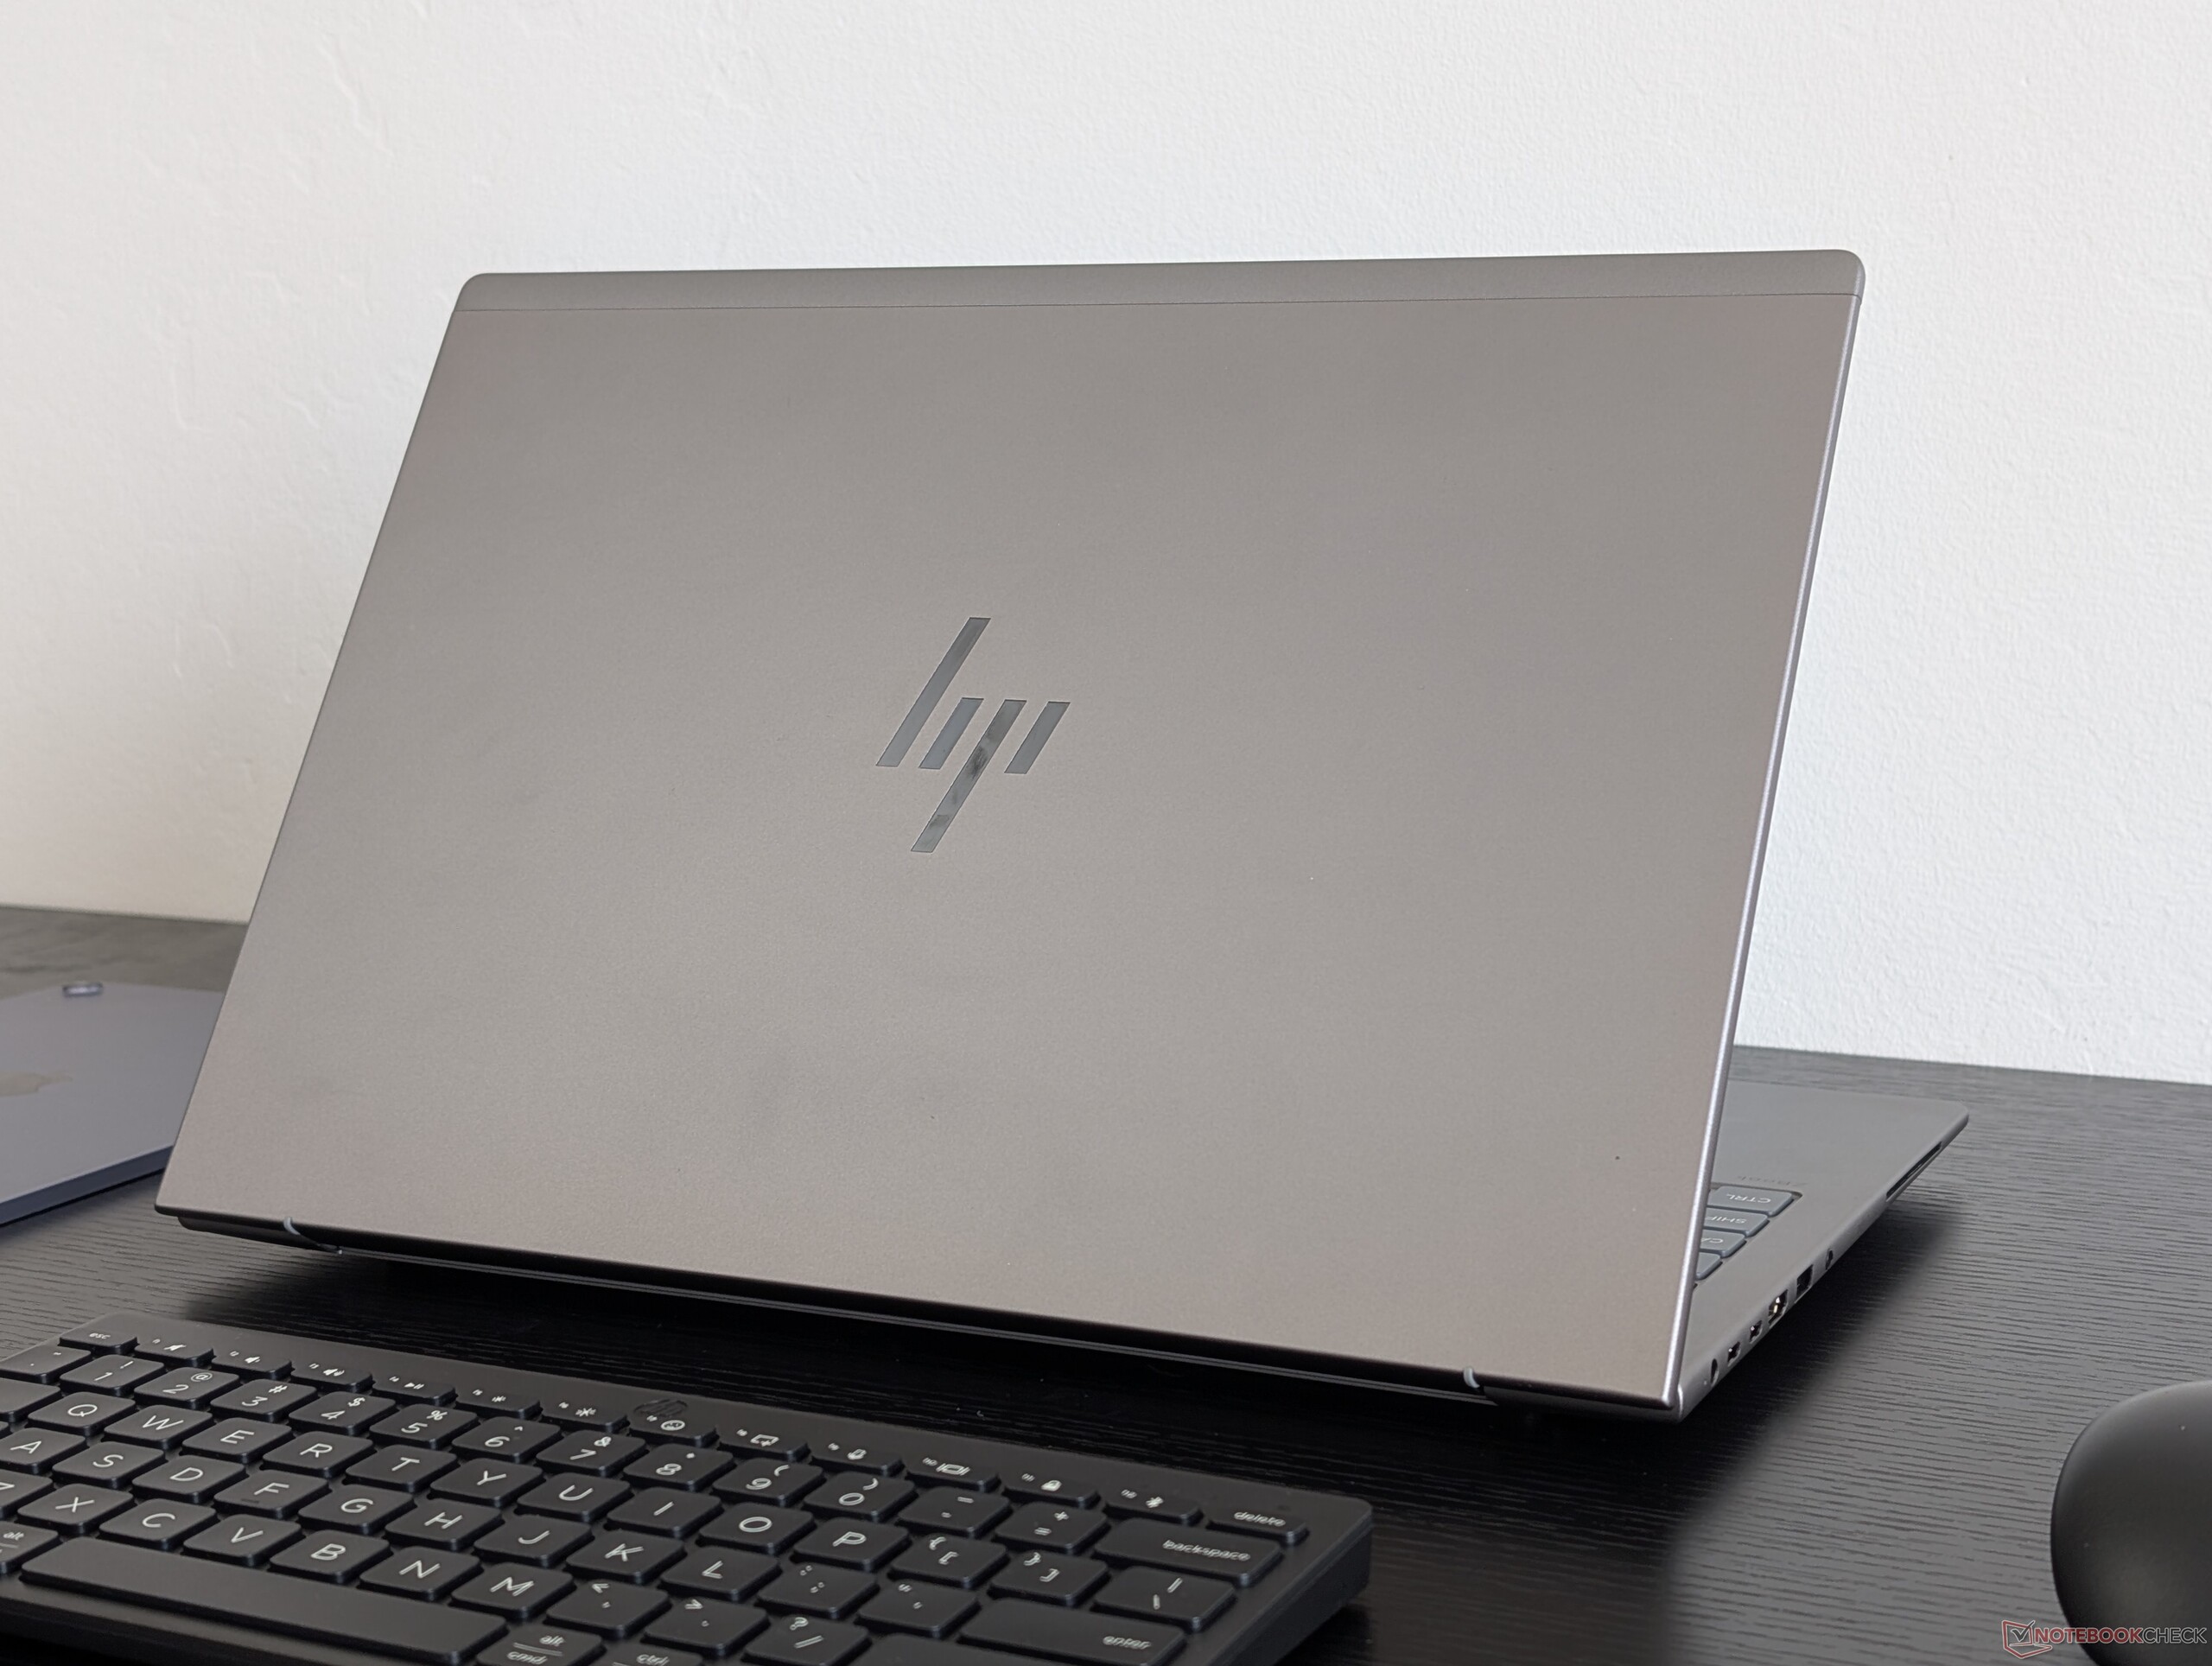
Dava
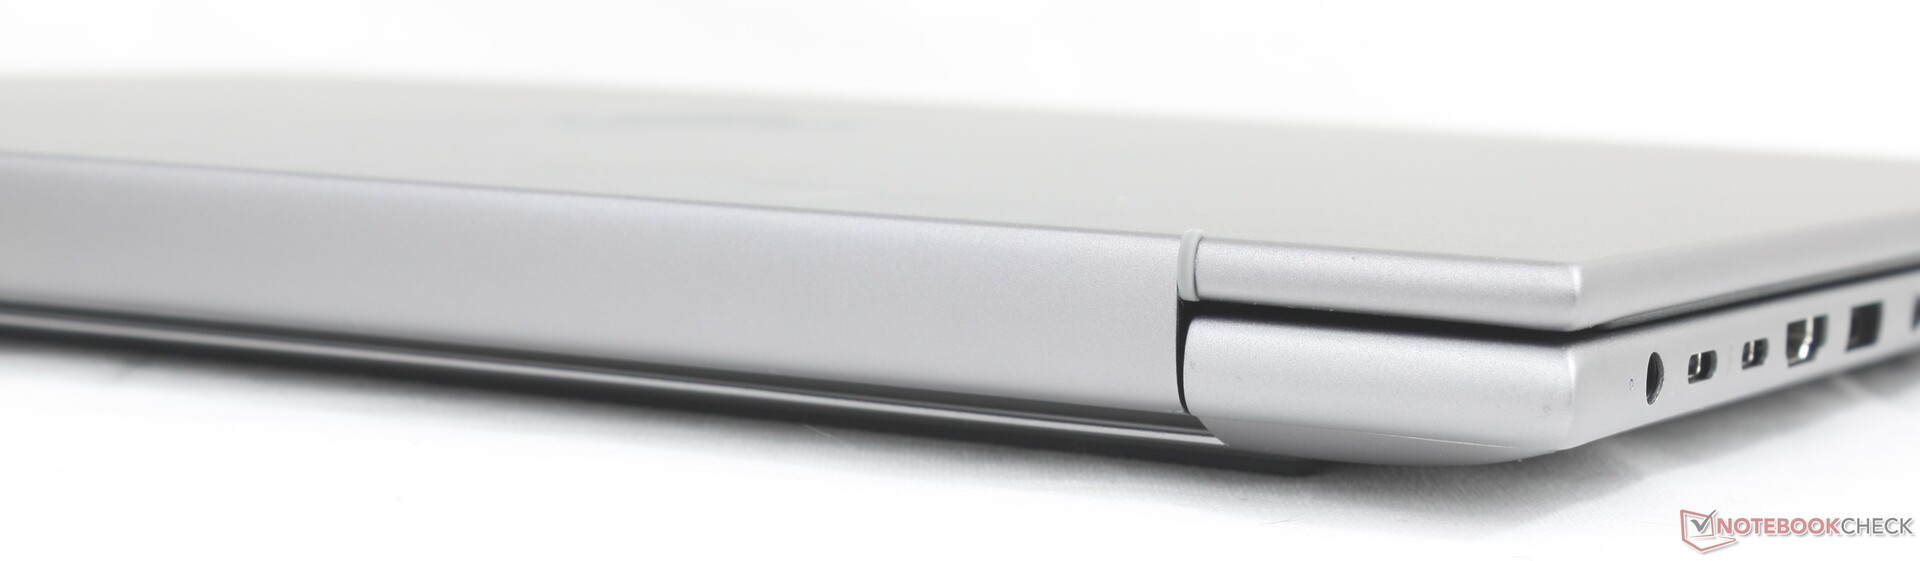
ZBook X G1i 16 doğrudan geçen yılki modelin yerini alıyor ZBook Power 16 G11 ve isim değişikliğine rağmen, iki model görsel olarak neredeyse aynıdır. Ağırlık, boyutlar ve bağlantı noktaları dahil olmak üzere fiziksel özellikler neredeyse aynı kalır ve bu nedenle ZBook Power 16 G11 hakkındaki yorumlarımız burada ZBook X G1i 16 için hala geçerlidir.
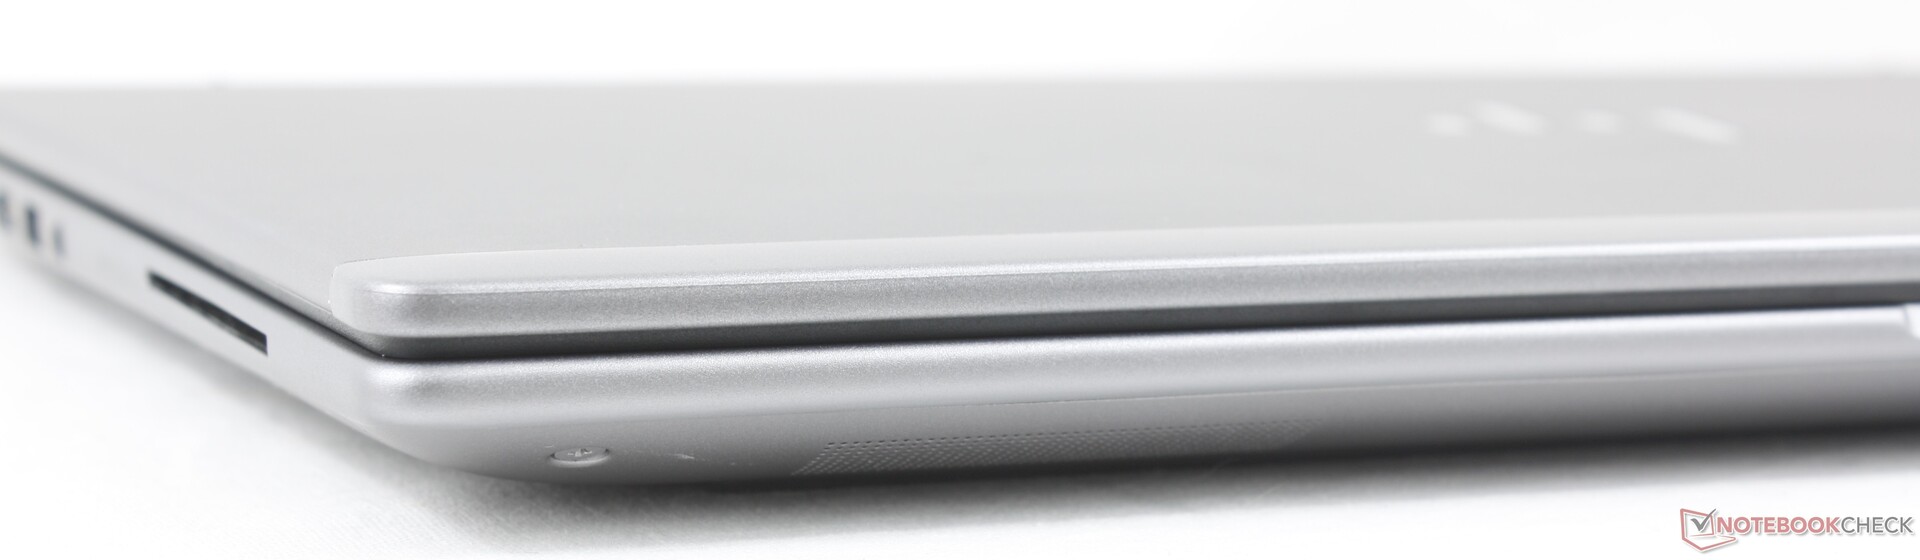
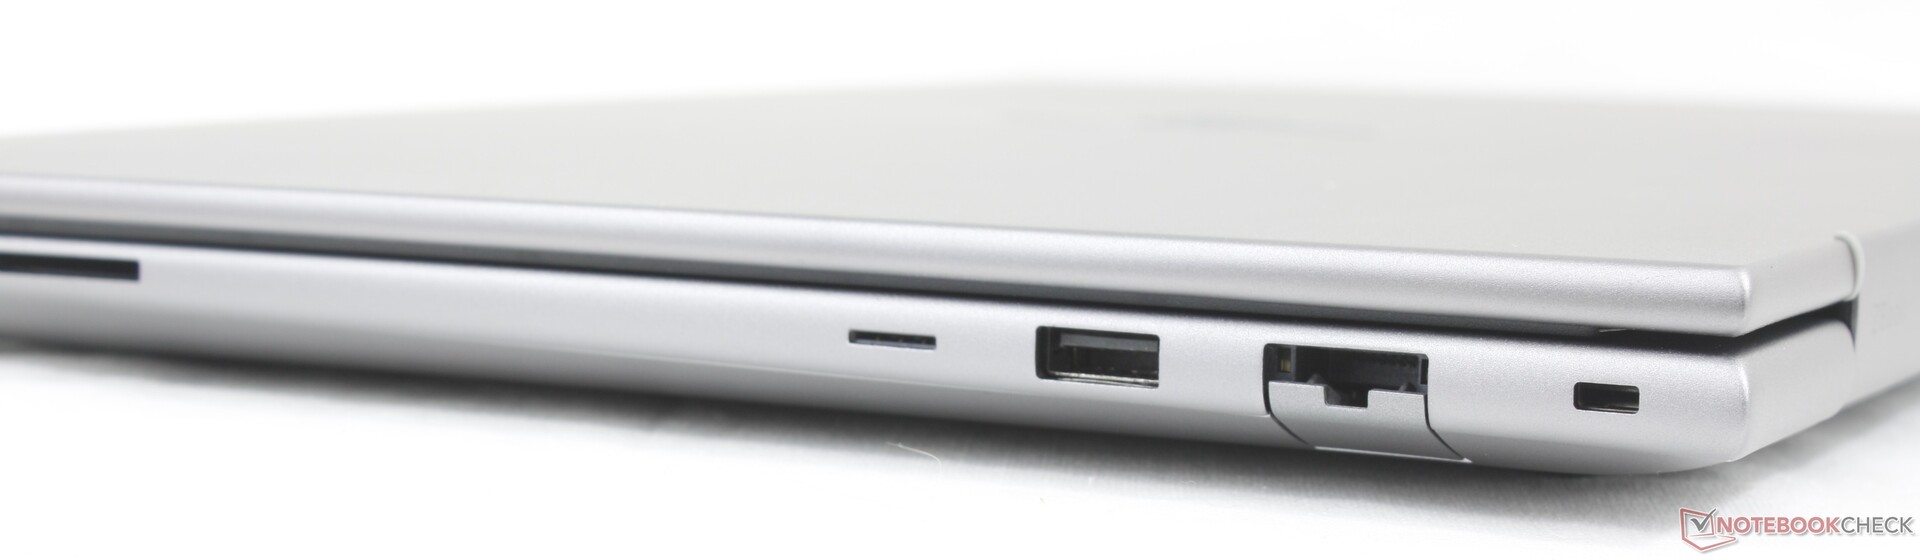
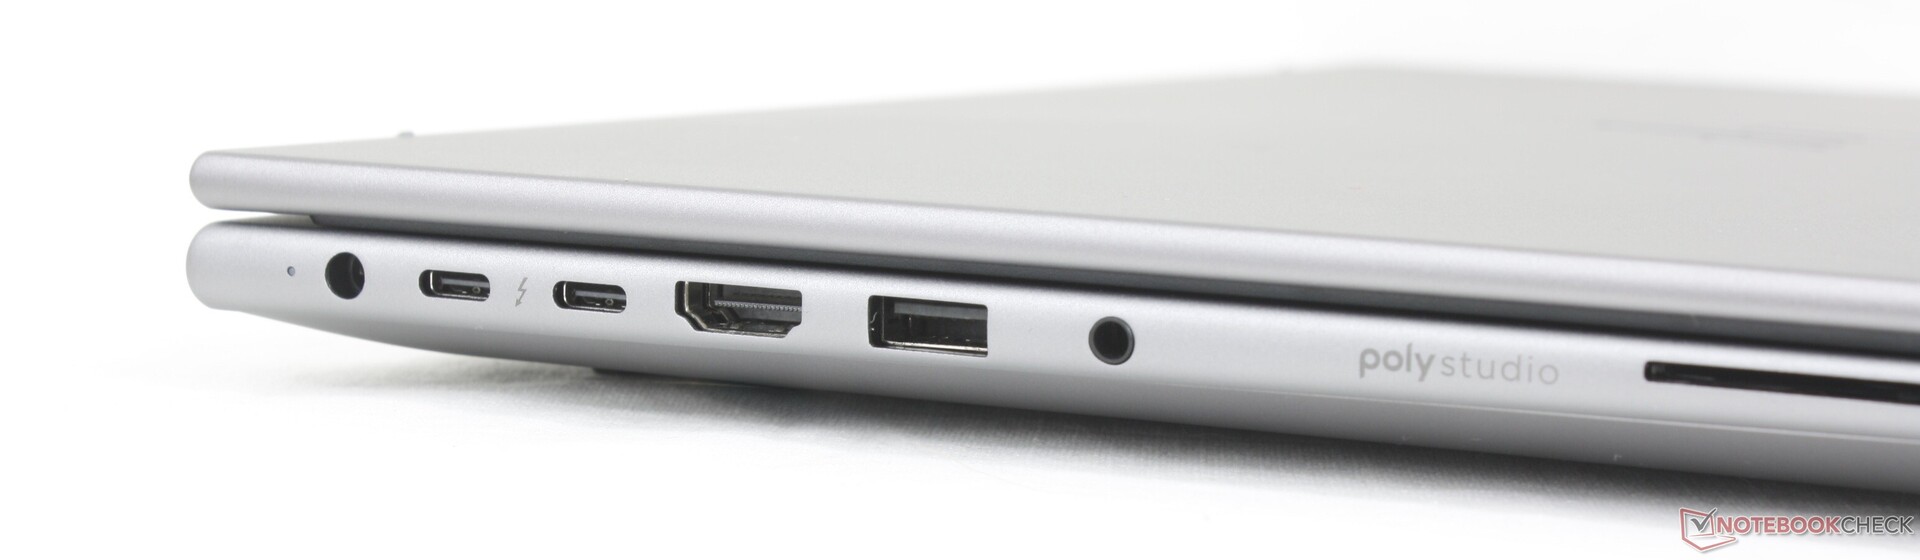
Bağlanabilirlik
Liman seçenekleri geçen yıla göre iyileştirildi ZBook Studio 16 G11 bir istisna dışında. ZBook X G1i 16 RJ-45, HDMI ve daha fazla USB-A bağlantı noktası gibi ek bağlantı noktaları içerirken, USB-C bağlantı noktalarından birini kaldırmıştır. Ayrıca, yakın zamandakine benzer şekilde USB-C şarjına tam bir geçiş görmek istiyoruz Dell Pro Max 16 Plus.
SD Kart Okuyucu
| SD Card Reader | |
| average JPG Copy Test (av. of 3 runs) | |
| HP ZBook X G1i 16 (Toshiba Exceria Pro SDXC 64 GB UHS-II) | |
| HP ZBook Power 16 G11 A (Toshiba Exceria Pro SDXC 64 GB UHS-II) | |
| Lenovo ThinkPad P16 Gen 2 (Toshiba Exceria Pro SDXC 64 GB UHS-II) | |
| Dell Pro Max 16 Plus (Toshiba Exceria Pro SDXC 64 GB UHS-II) | |
| maximum AS SSD Seq Read Test (1GB) | |
| HP ZBook Power 16 G11 A (Toshiba Exceria Pro SDXC 64 GB UHS-II) | |
| HP ZBook X G1i 16 (Toshiba Exceria Pro SDXC 64 GB UHS-II) | |
| Dell Pro Max 16 Plus (Toshiba Exceria Pro SDXC 64 GB UHS-II) | |
| Lenovo ThinkPad P16 Gen 2 (Toshiba Exceria Pro SDXC 64 GB UHS-II) | |
İletişim
Web kamerası
Web kamerası seçenekleri arasında IR ve fiziksel deklanşörlü 2 MP veya 5 MP bulunur.


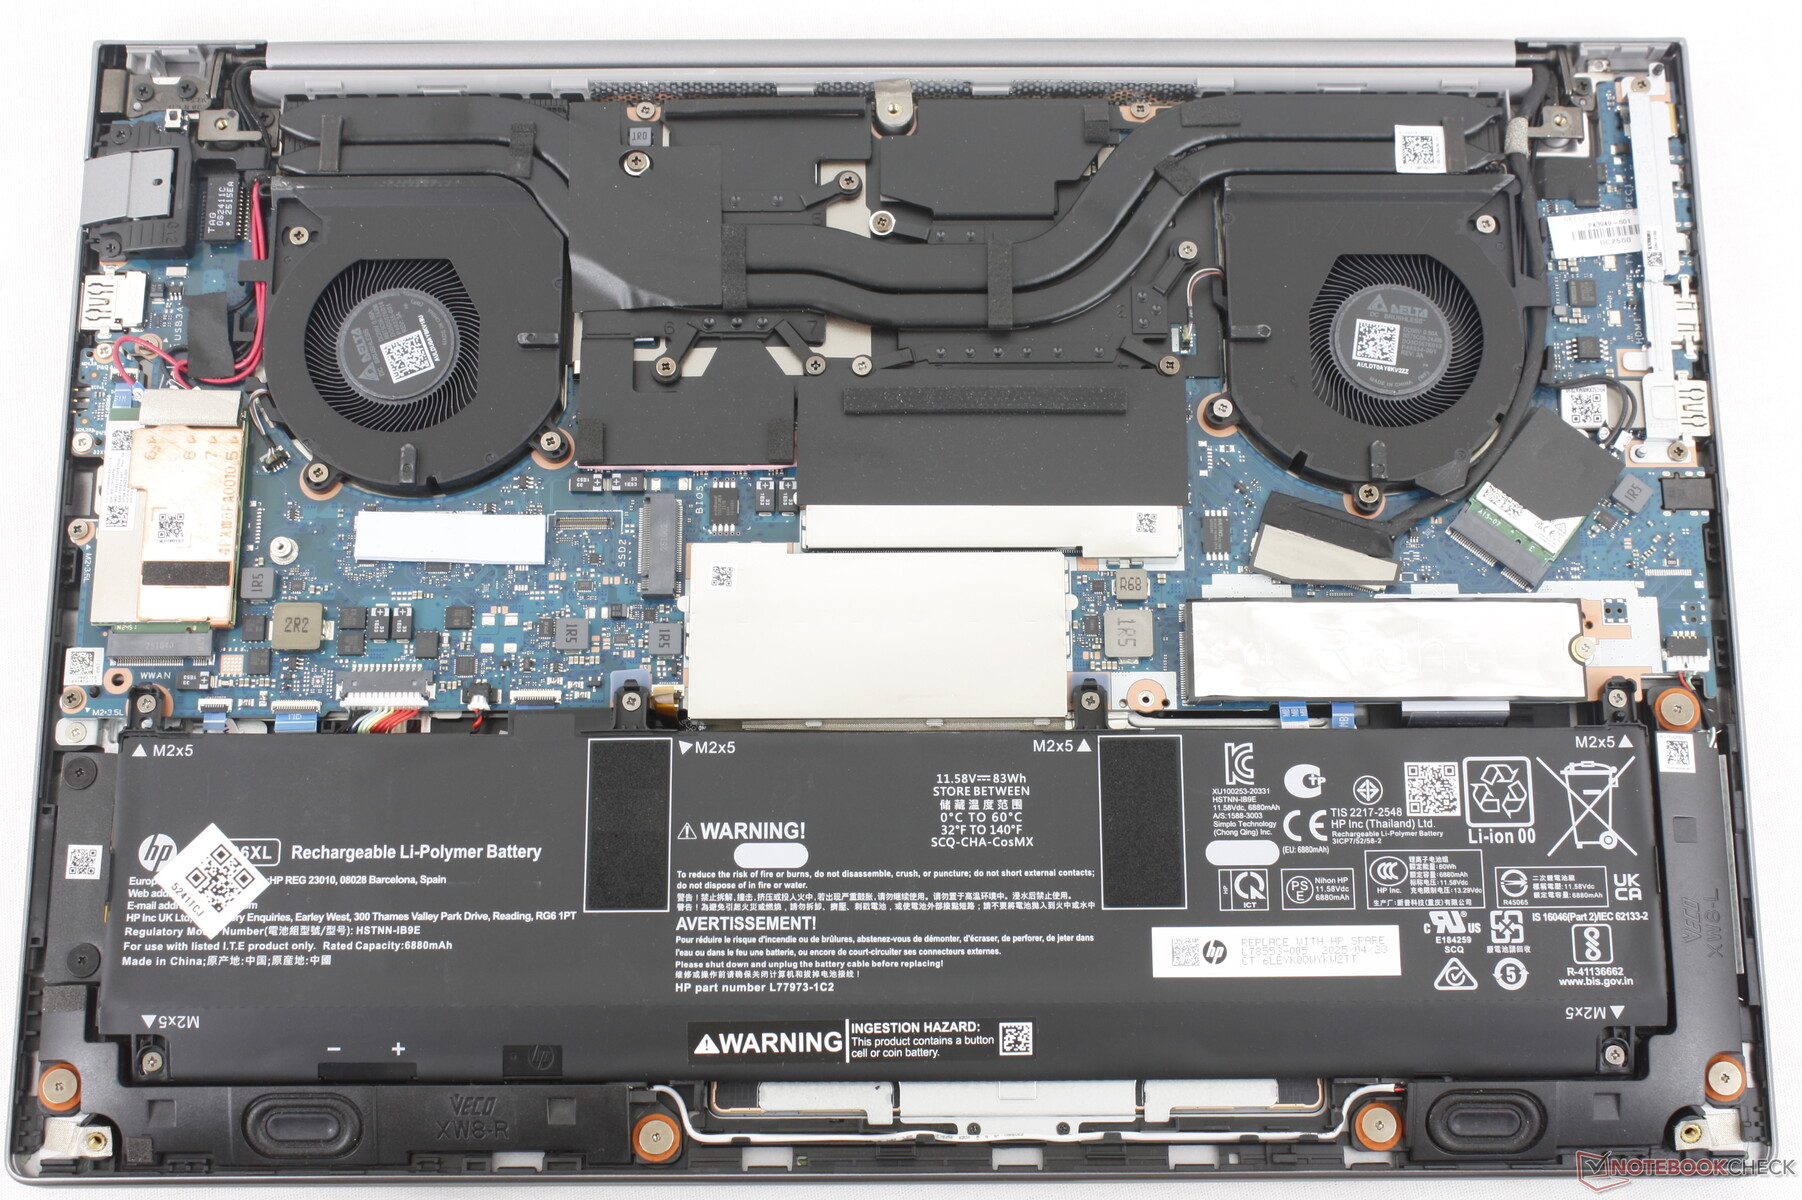
Bakım
HP, sökme videoları sağlar ve yazılı kılavuzlar zBook X G1i 16'nın bakımı için.
Sürdürülebilirlik
Tüm HP Z iş istasyonları EPEAT Gold veya Silver sertifikalıdır ve üretim sürecinde okyanusa bağlı ve geri dönüştürülmüş plastikler veya metaller kullanılır.
Aksesuarlar ve Garanti
Kutuda AC adaptörü ve evraklar dışında ekstra bir şey yoktur. Üretici web sitesi üzerinden satın alındığında üç yıllık sınırlı garanti standarttır.
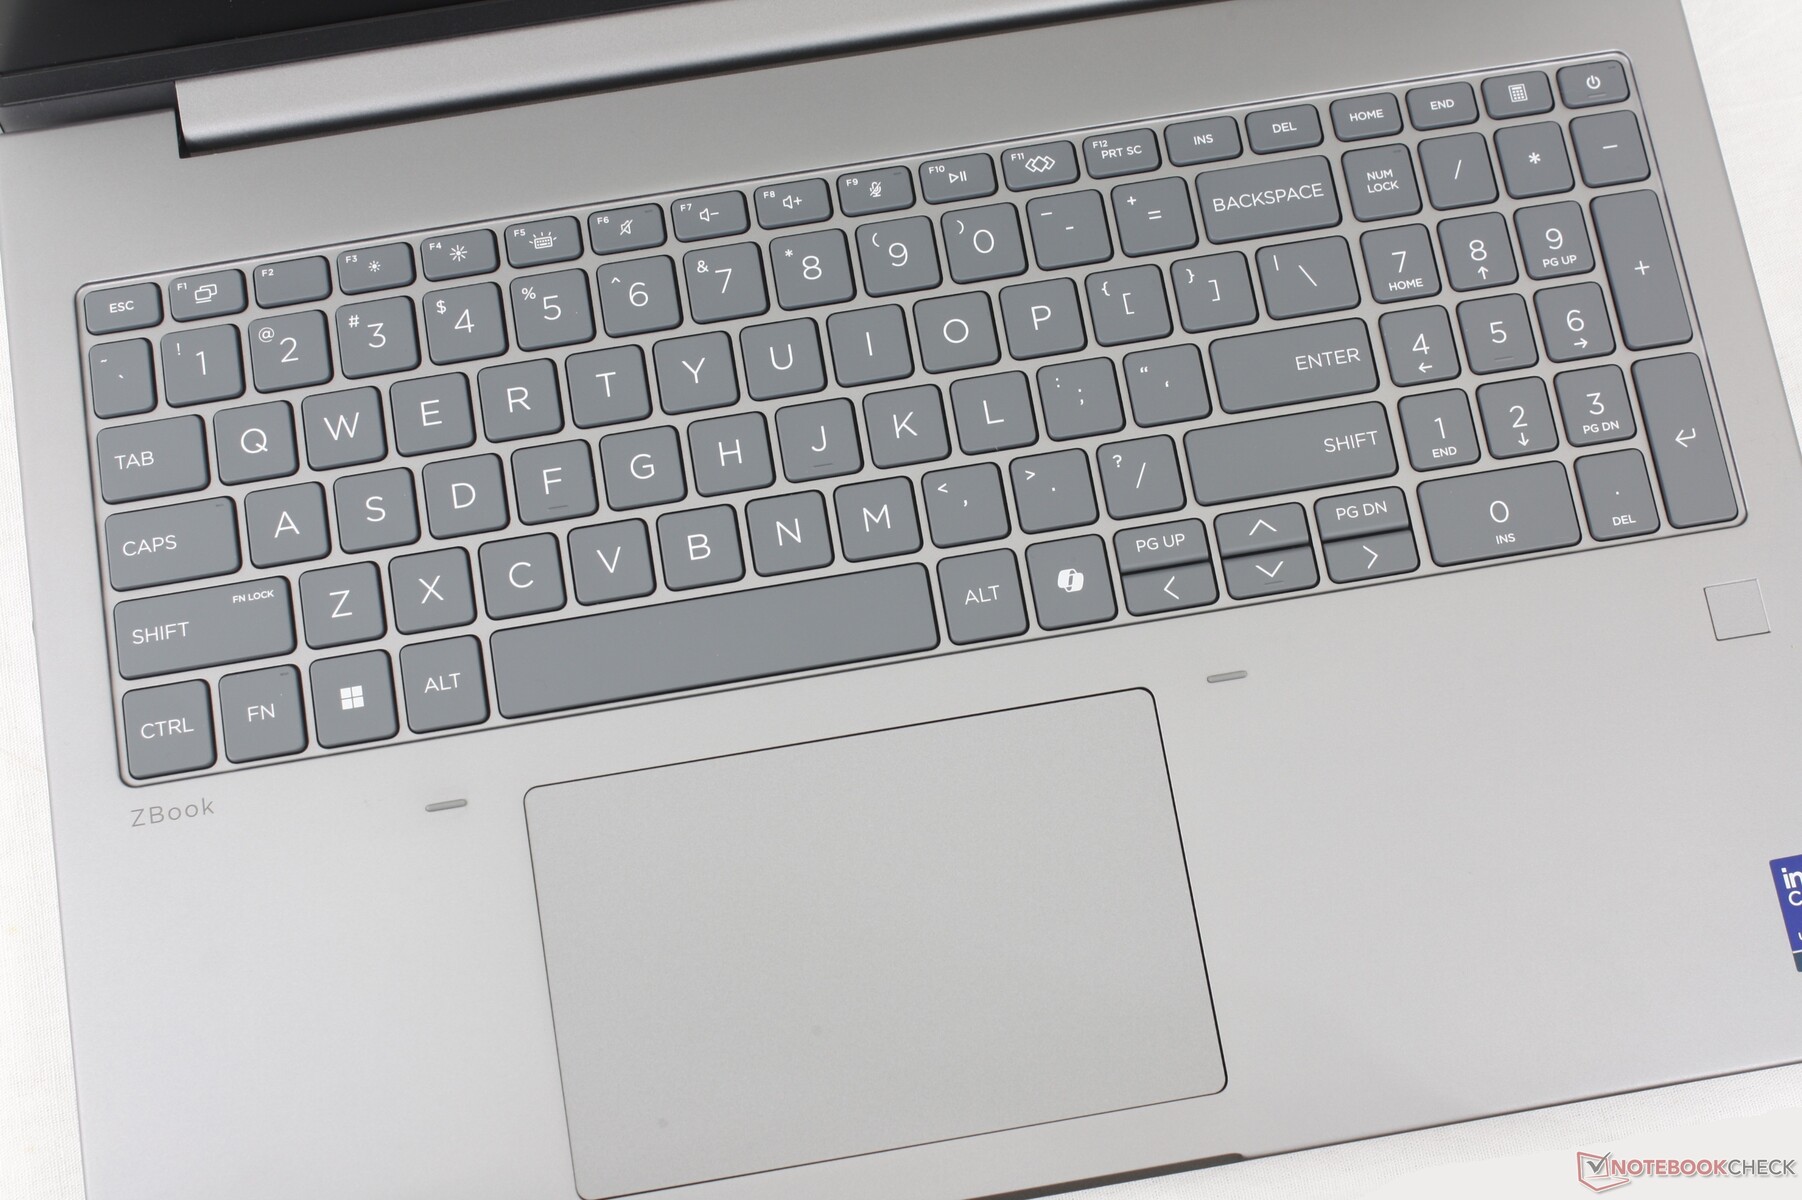
Giriş Aygıtları
Yazma deneyimi eski modellere benzer ZBook Fury 16 G9 klavye düzeni ZBook nesilleri boyunca çok az değişmiştir. Ancak ZBook X G1i 16'da HP, yüzey alanını artırmadan özel fare düğmelerini kaldırmıştır (ZBook Fury 16 G9'da 12,4 x 8,3 cm'ye karşılık 12 x 8 cm).
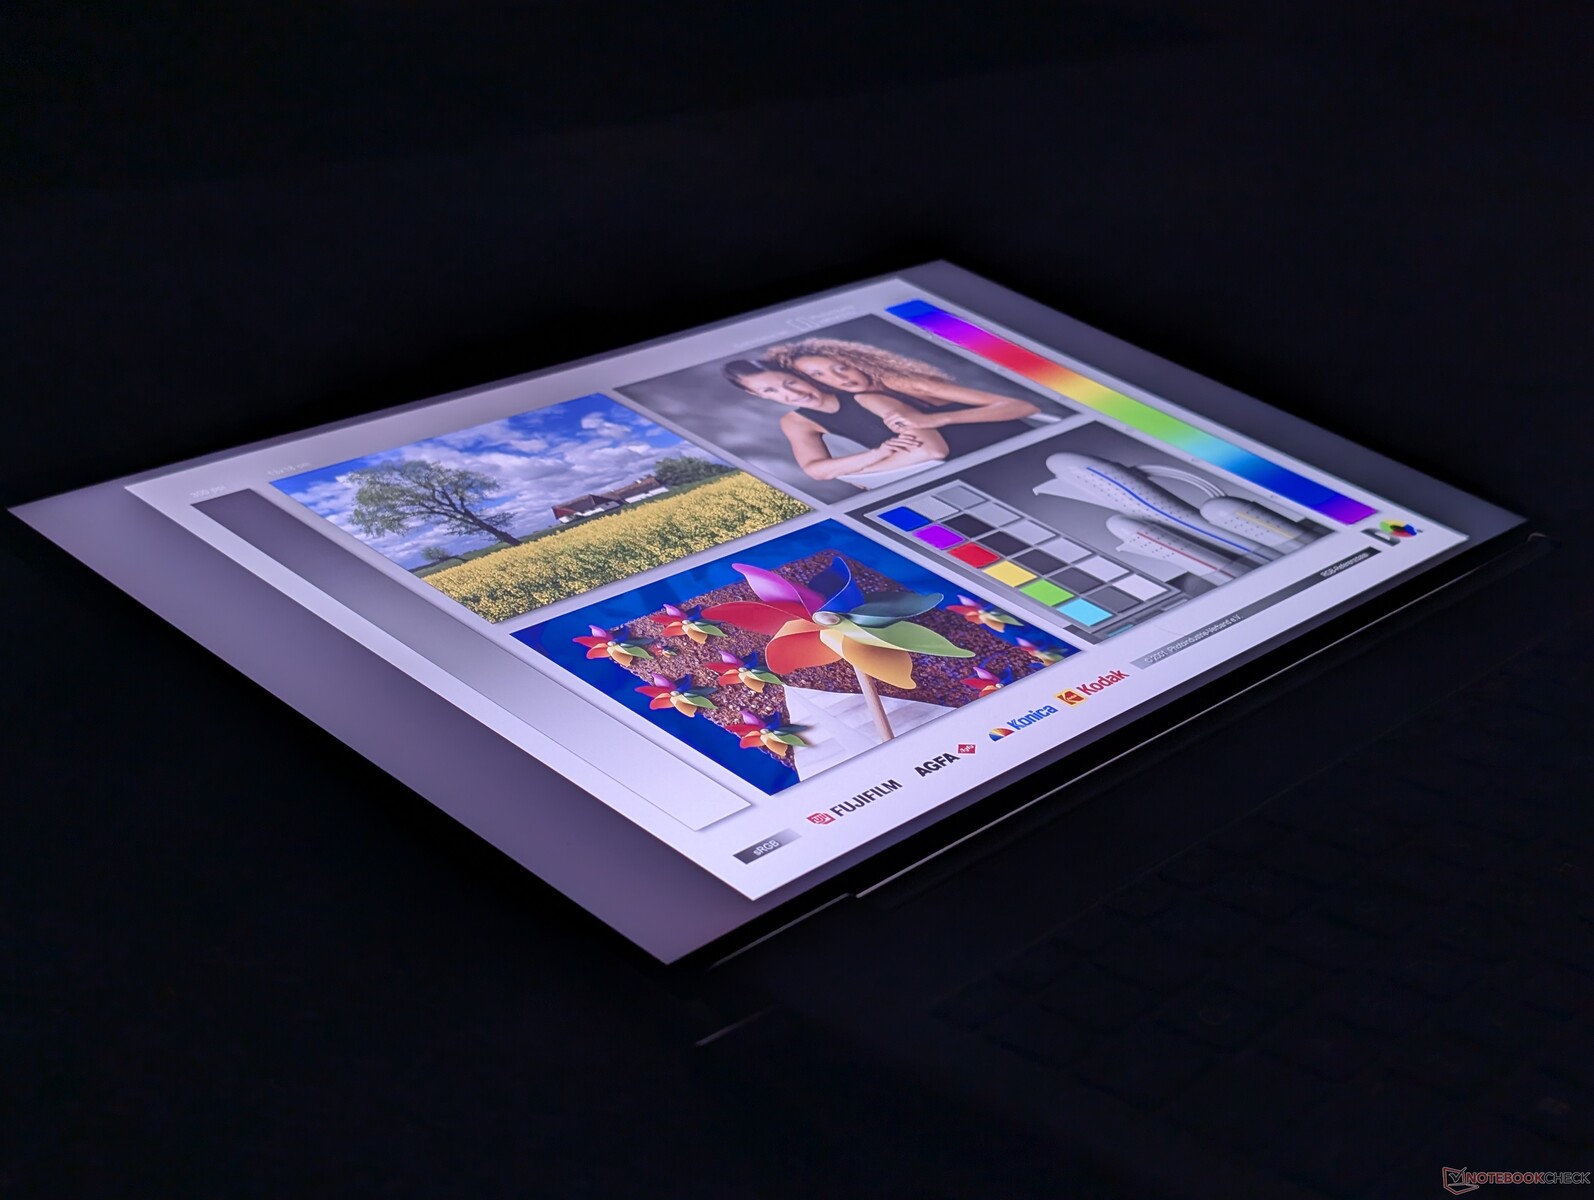
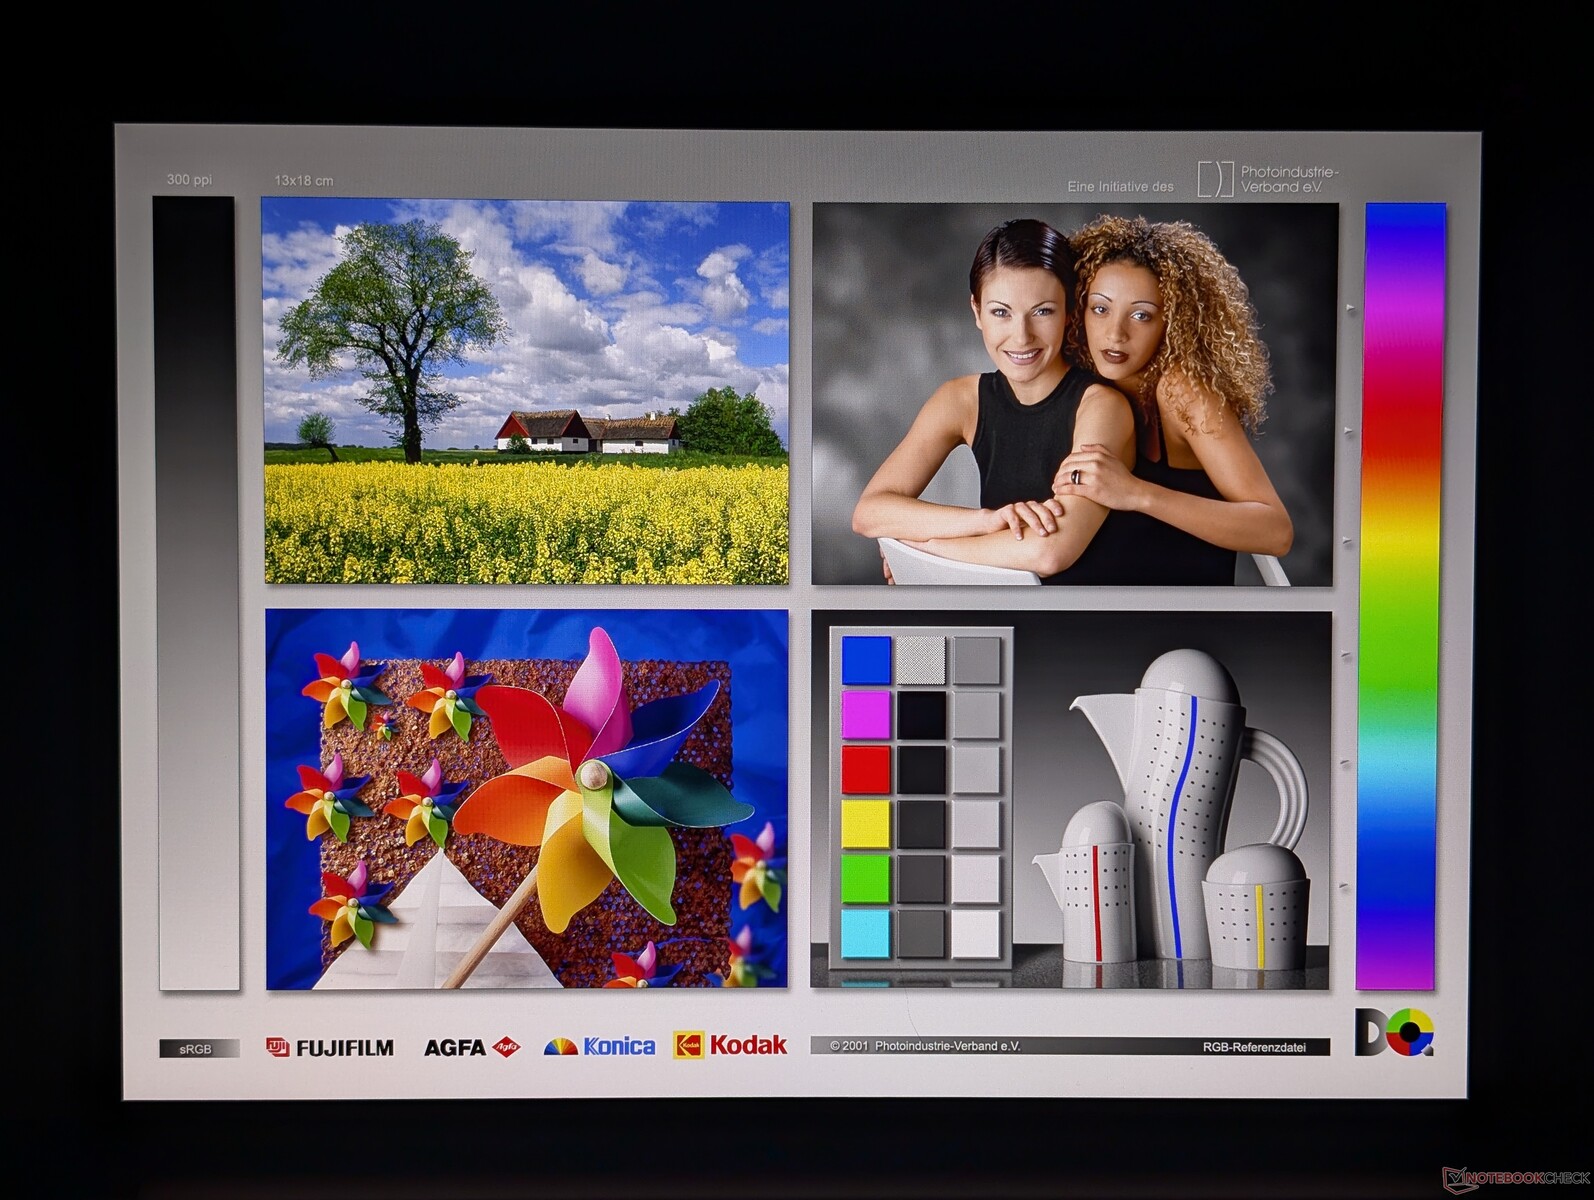
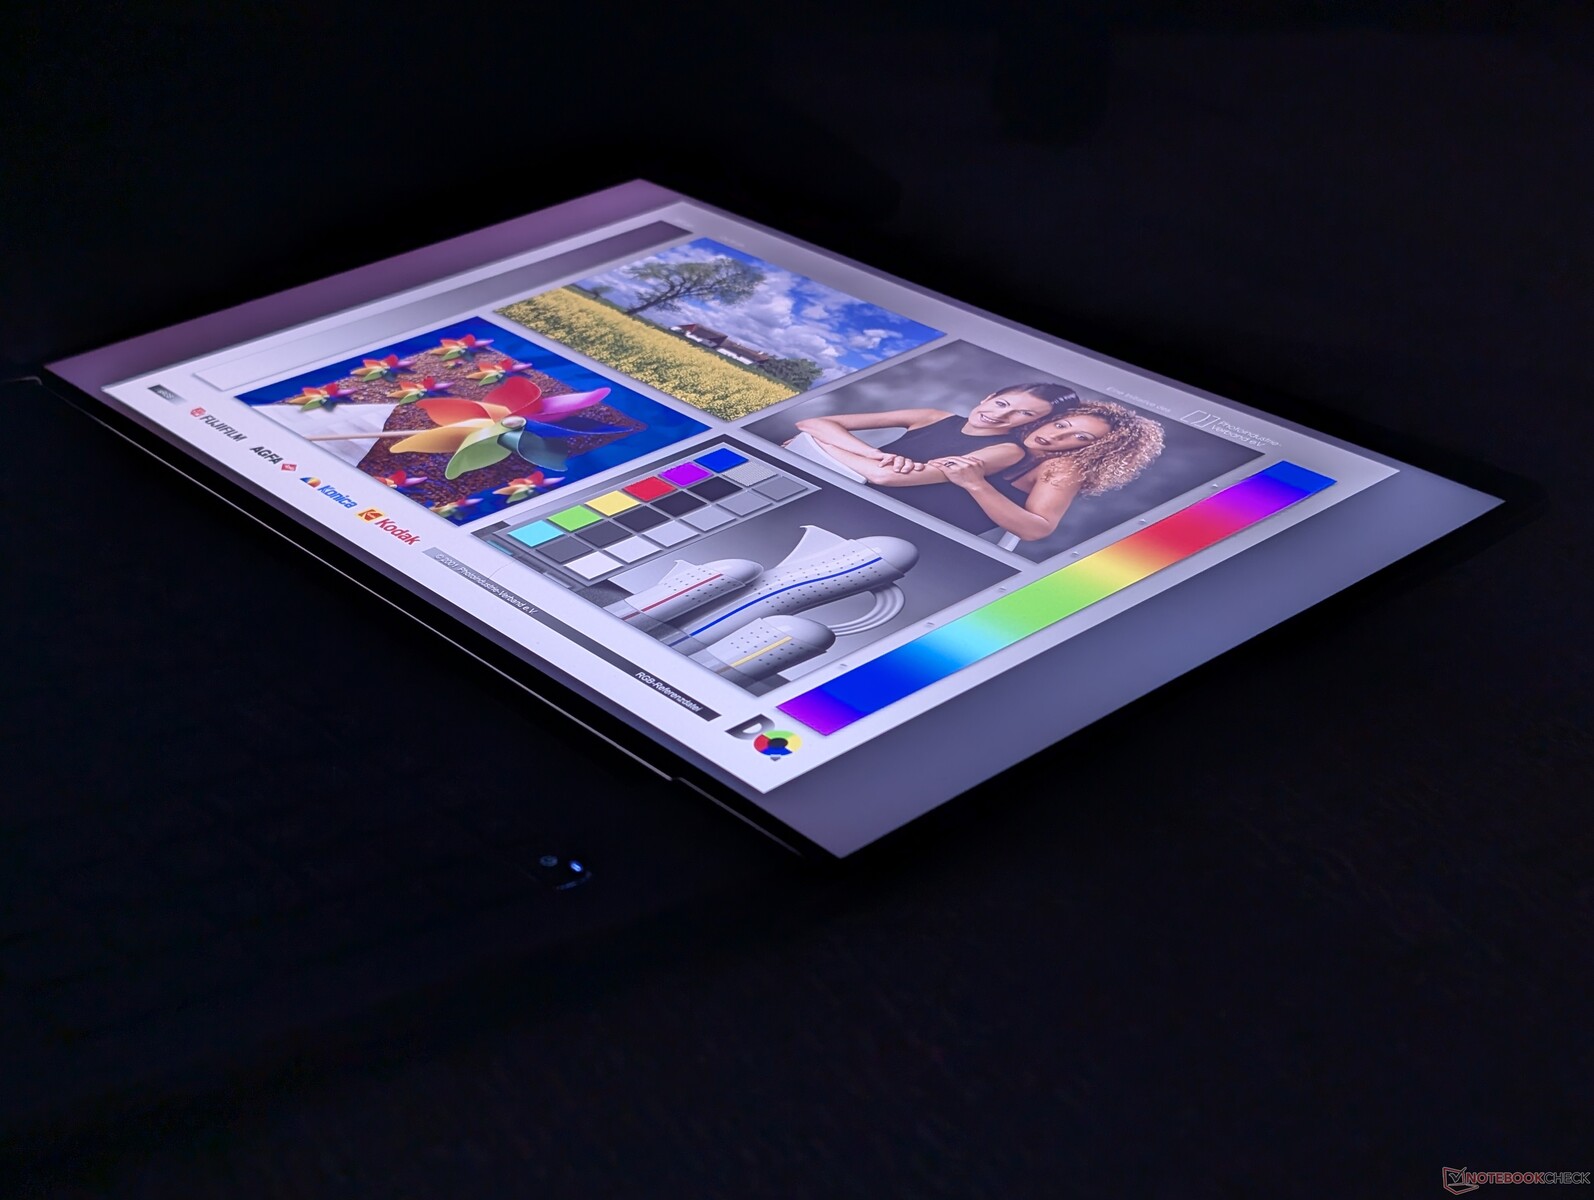
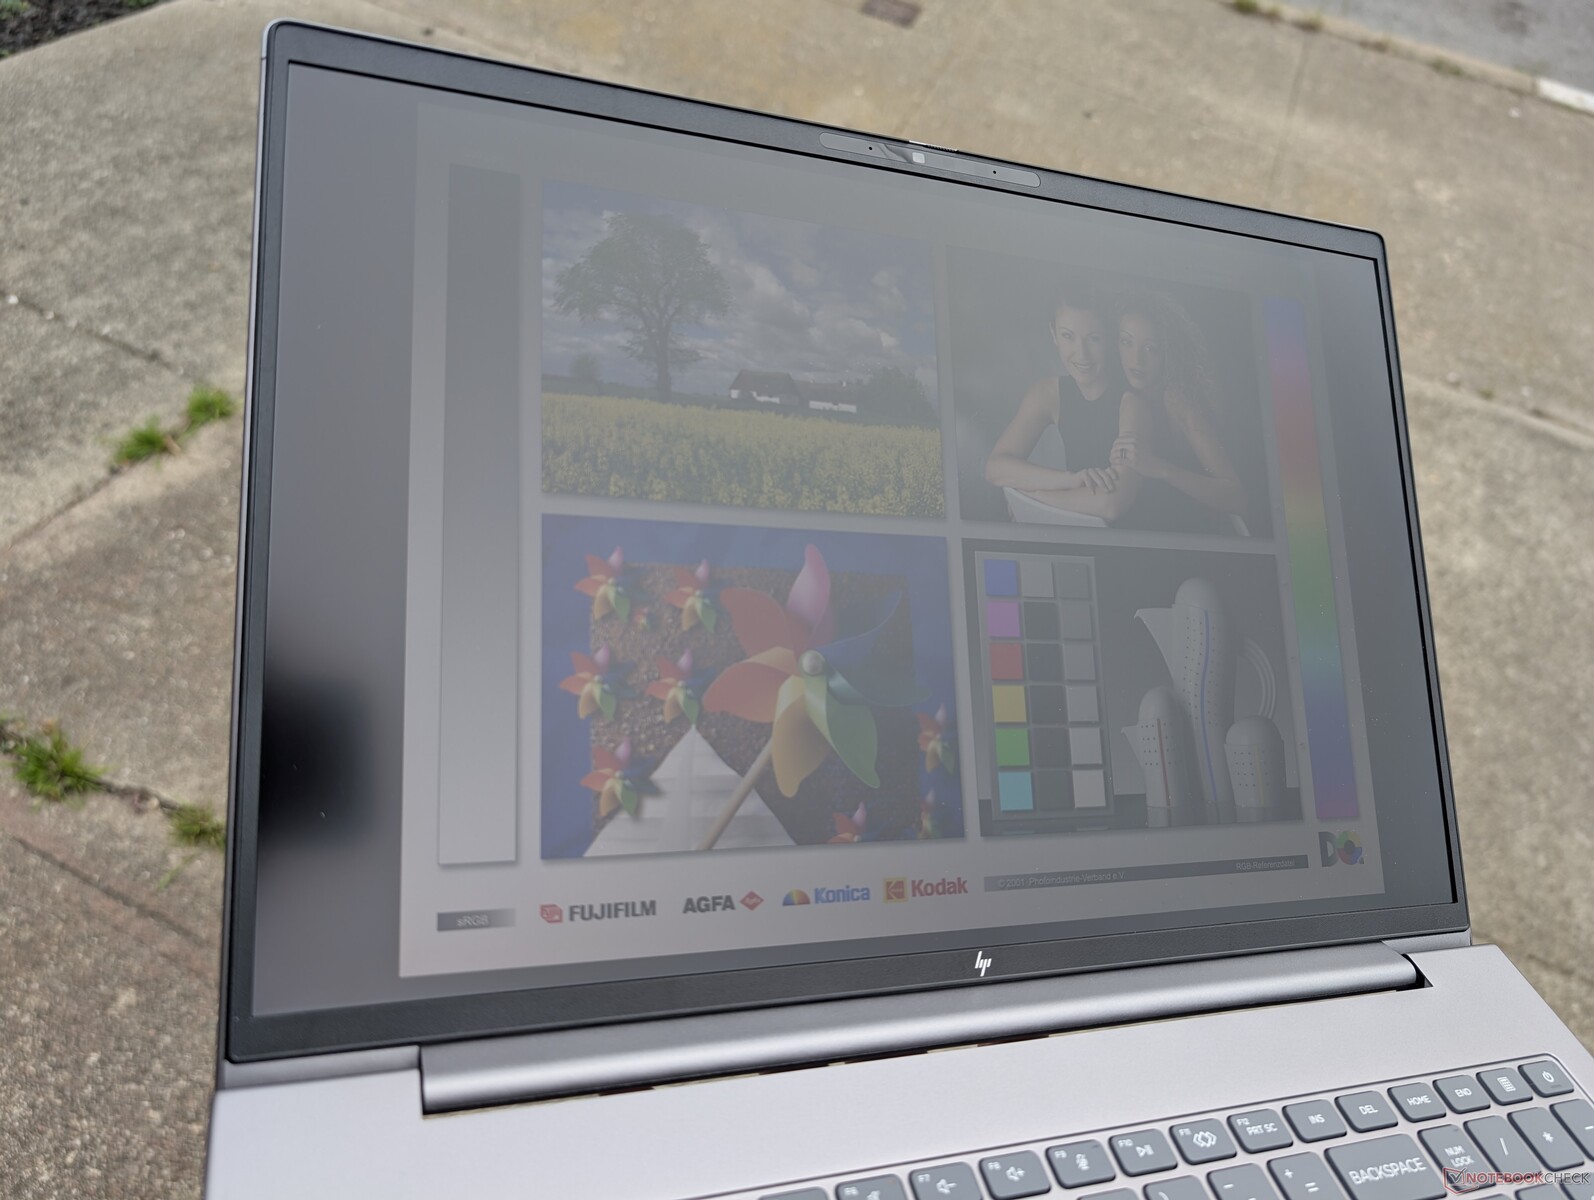
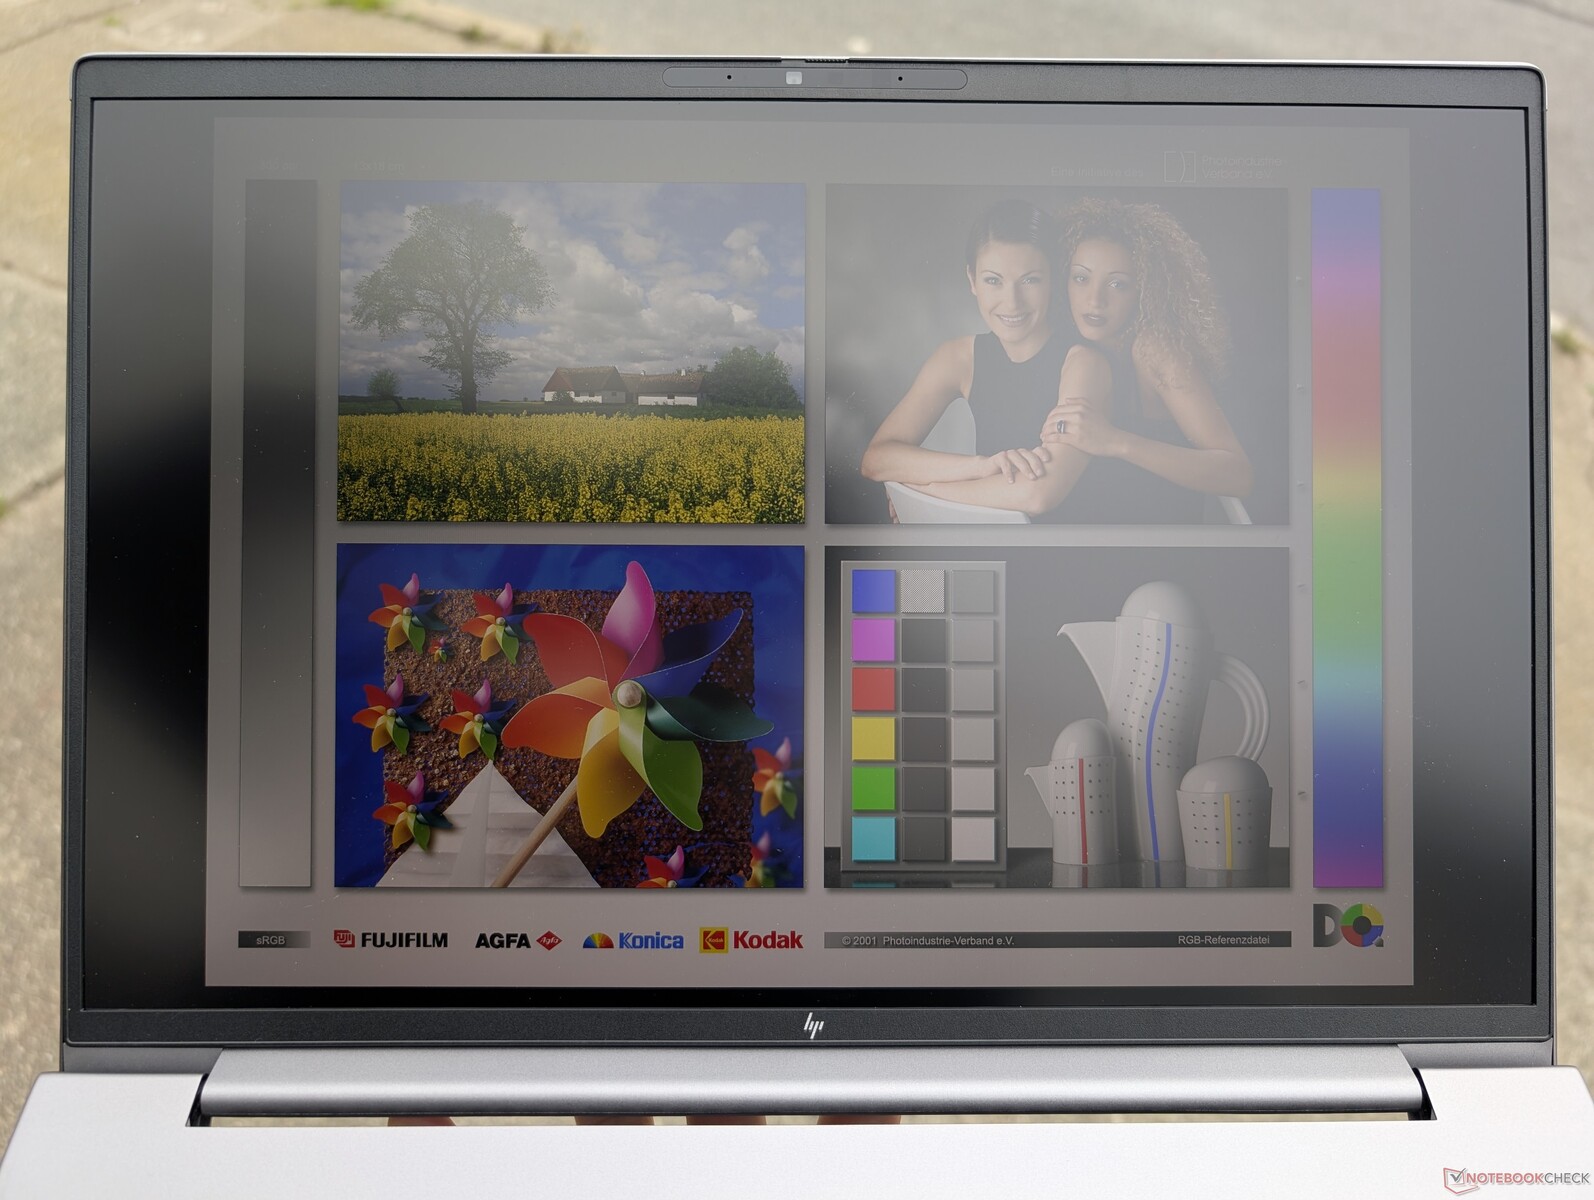
Ekran
Tam DCI-P3 renkleriyle 1200p60 ve 300 nitten 2400p120 ve 500 nite kadar değişen altı IPS ekran seçeneği mevcuttur. Test ünitemiz, hala P3 renkleri sunan ancak dokunmatik ekran veya Sure View özellikleri olmayan orta 1600p 120 Hz mat seçenekle birlikte gönderiliyor. Aslında, ikincisi yalnızca 1200p dokunmatik olmayan panelde mevcuttur.
Bu model için OLED seçenekleri veya HDR desteği bulunmadığını unutmayın. Renk doğruluğu önemliyse, sRGB renklerinin yalnızca ~%60'ını sundukları için bazı alt uç 1200p seçeneklerinden kaçınmanızı öneririz.


| |||||||||||||||||||||||||
Aydınlatma: 88 %
Batarya modunda parlaklık: 461.8 cd/m²
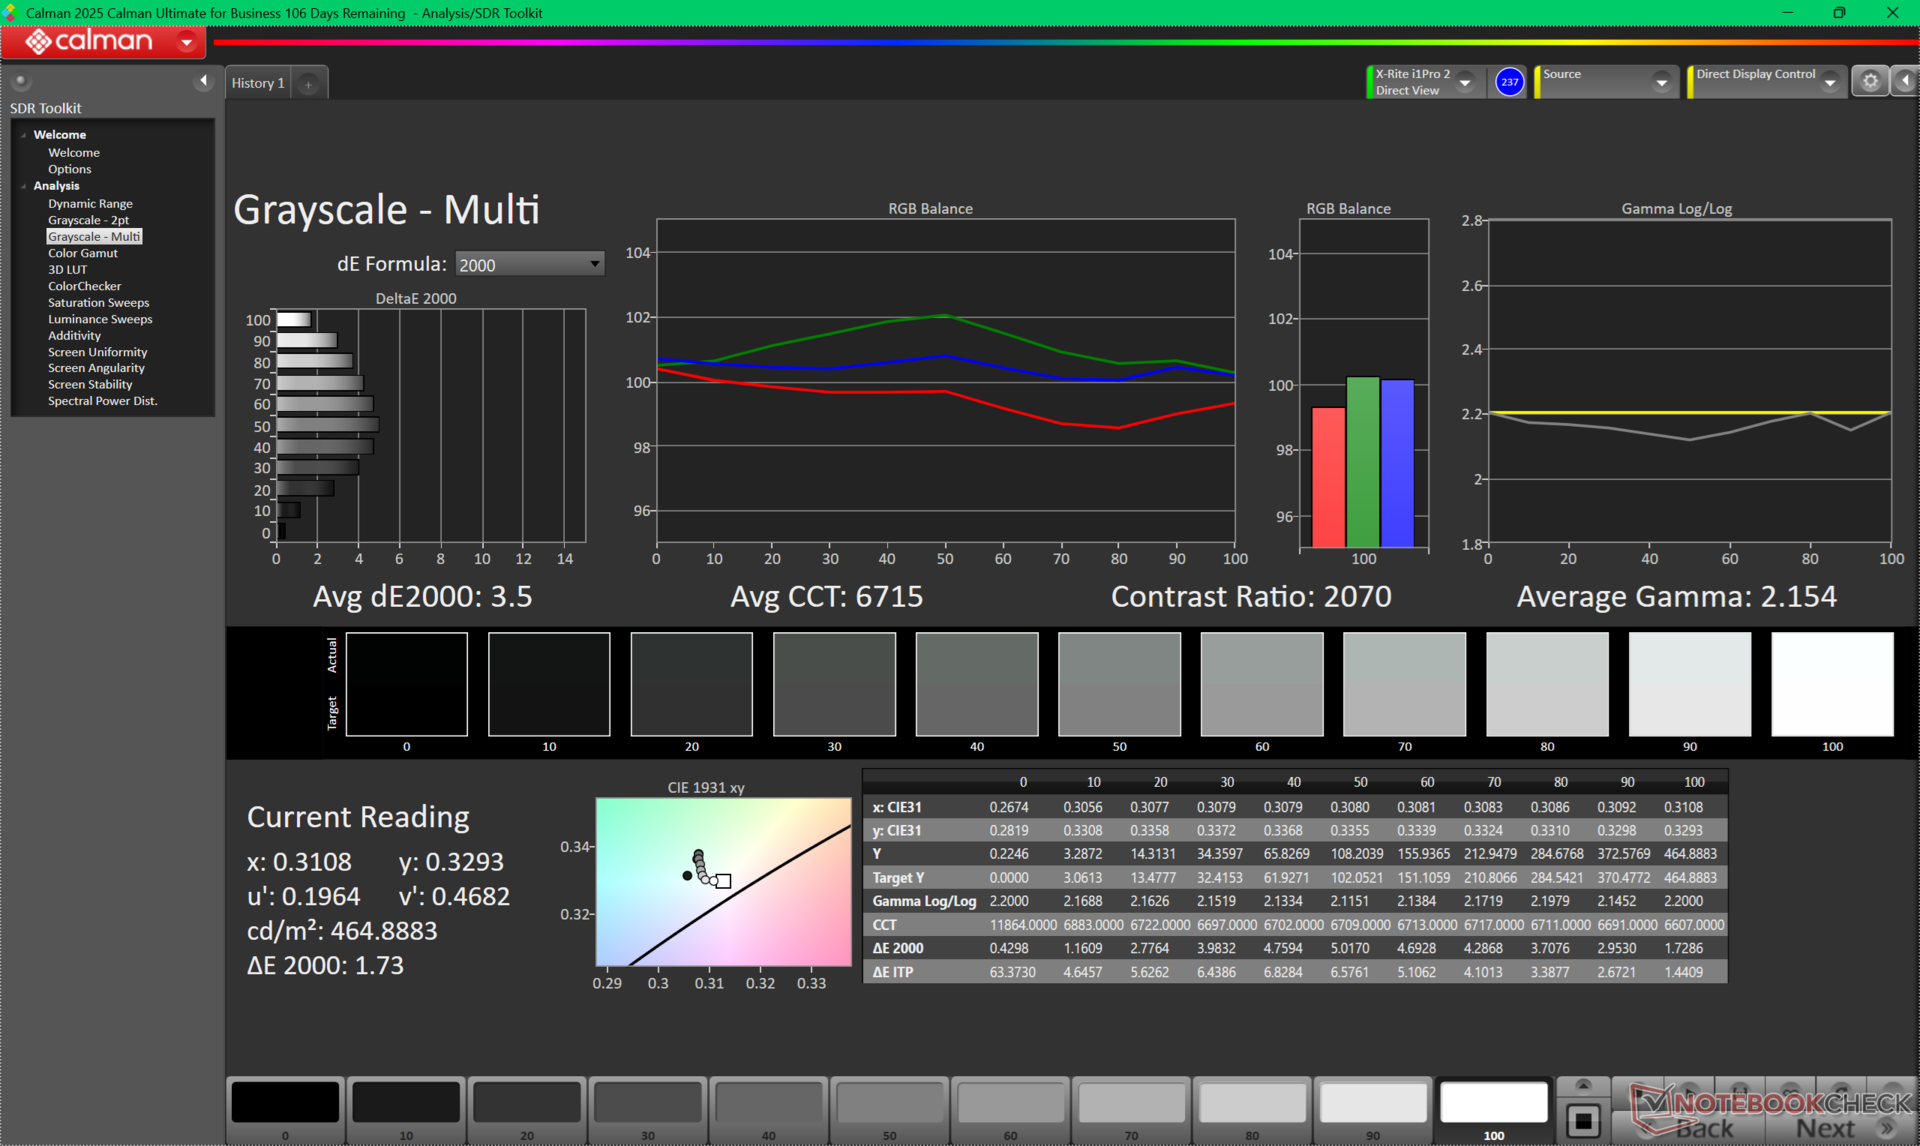
Kontrast: 1004:1 (Siyah: 0.46 cd/m²)
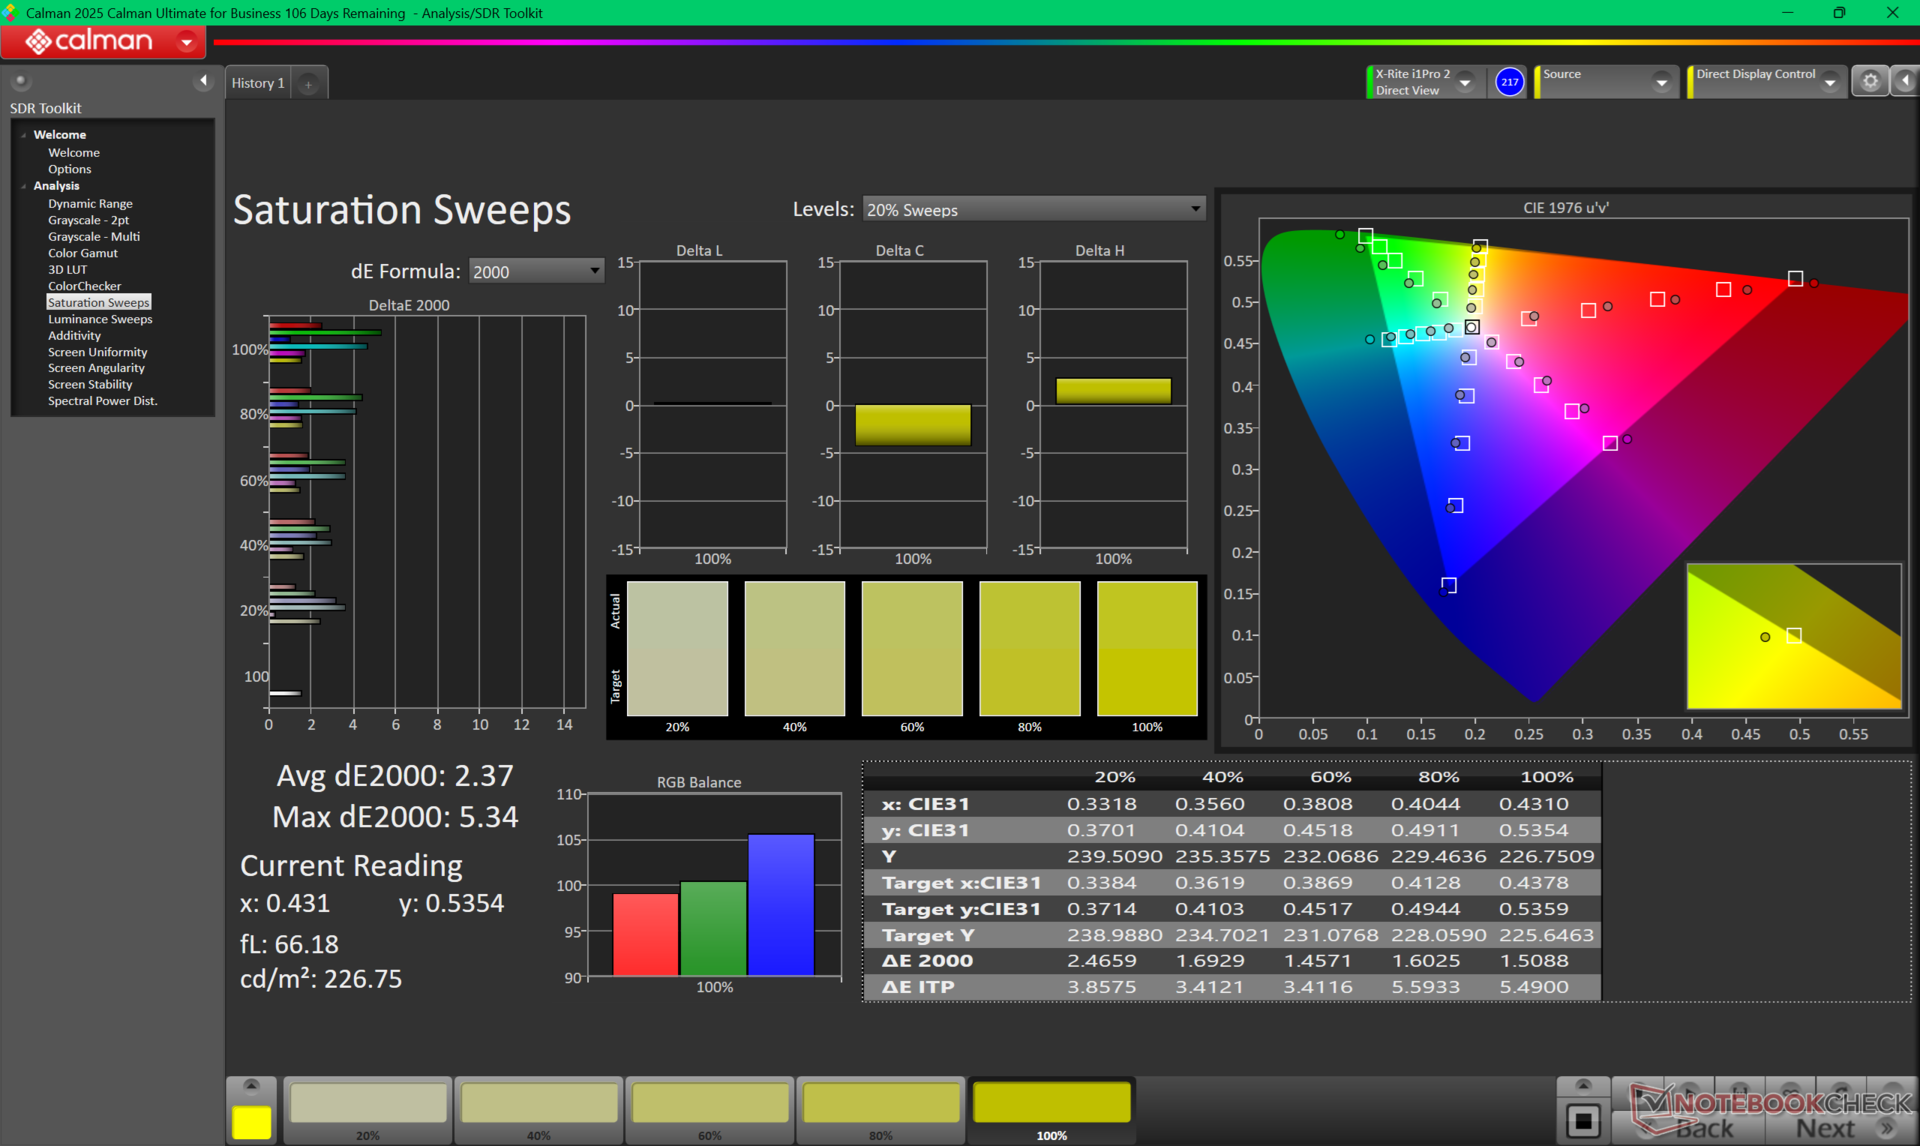
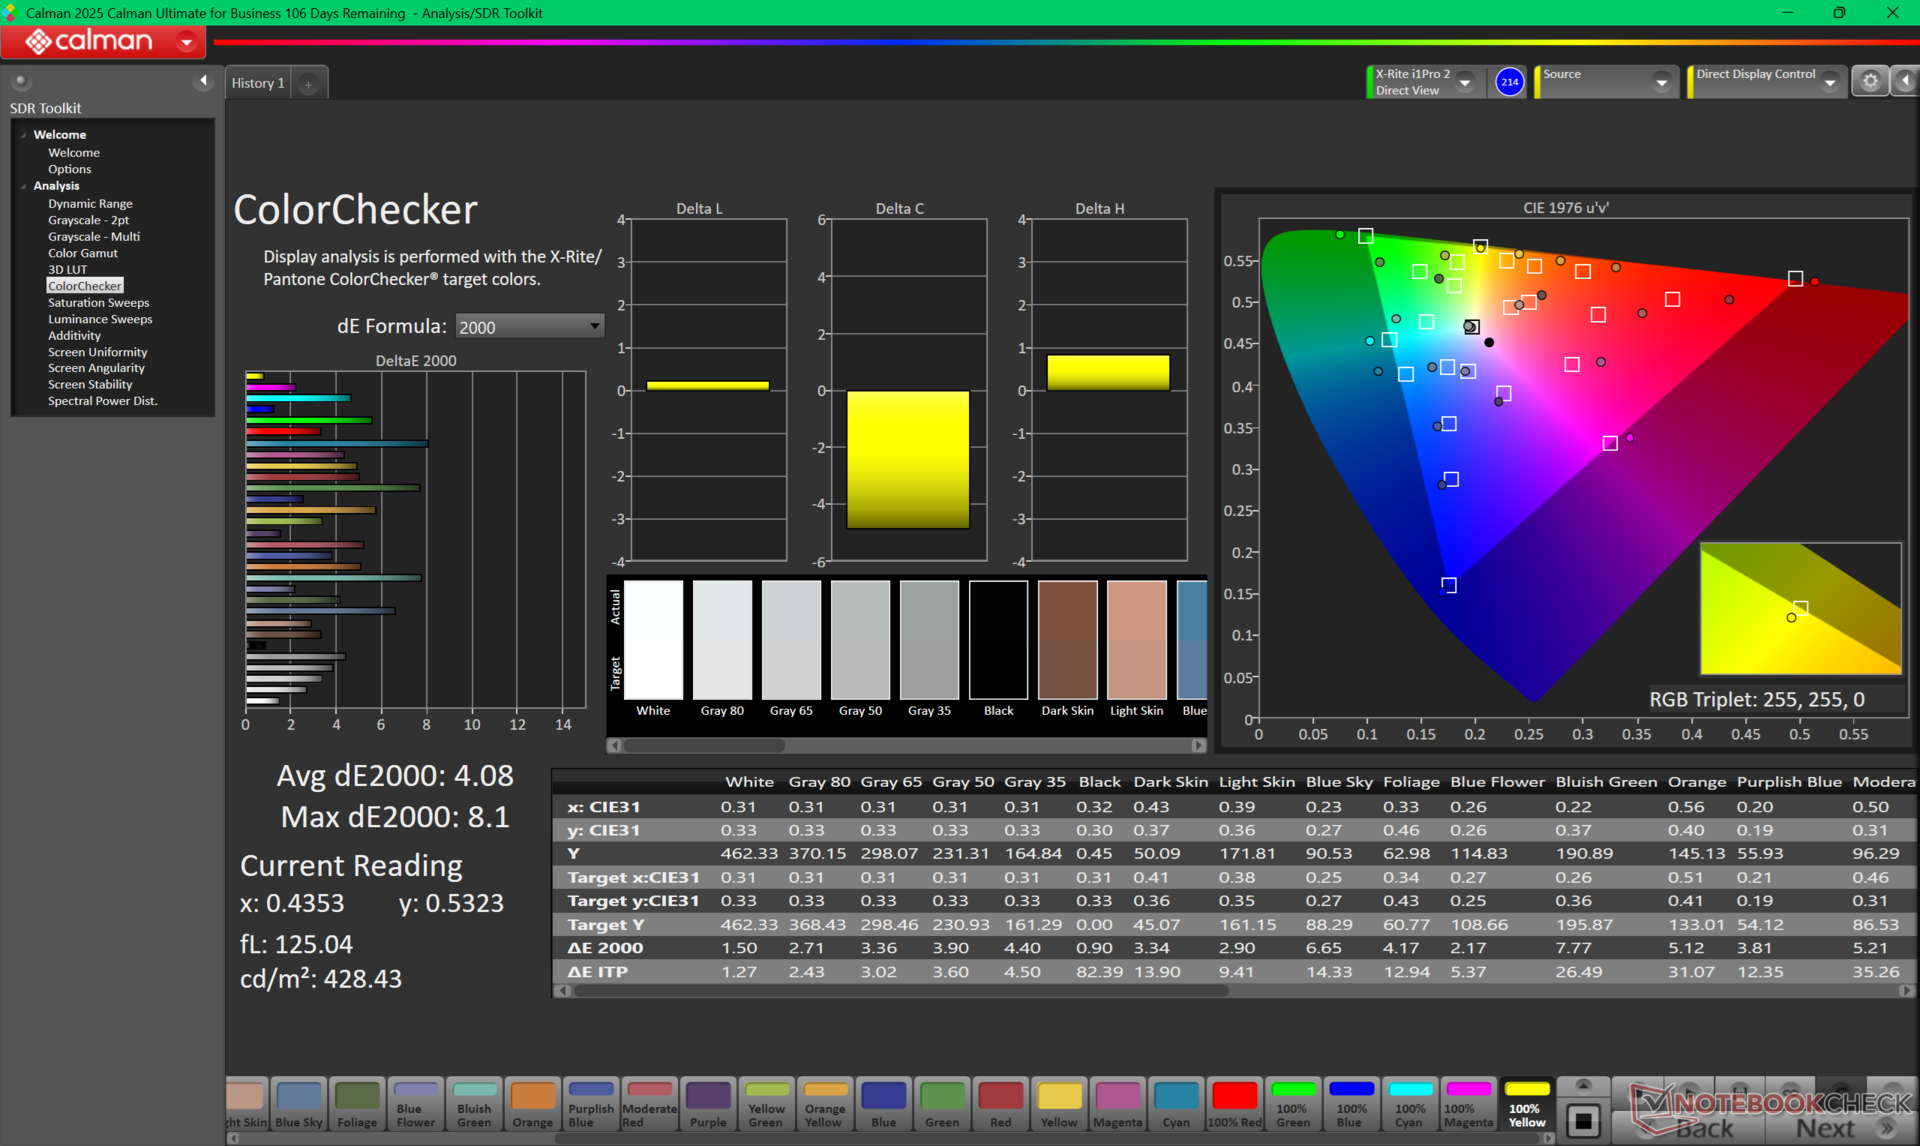
ΔE ColorChecker Calman: 4.08 | ∀{0.5-29.43 Ø4.72}
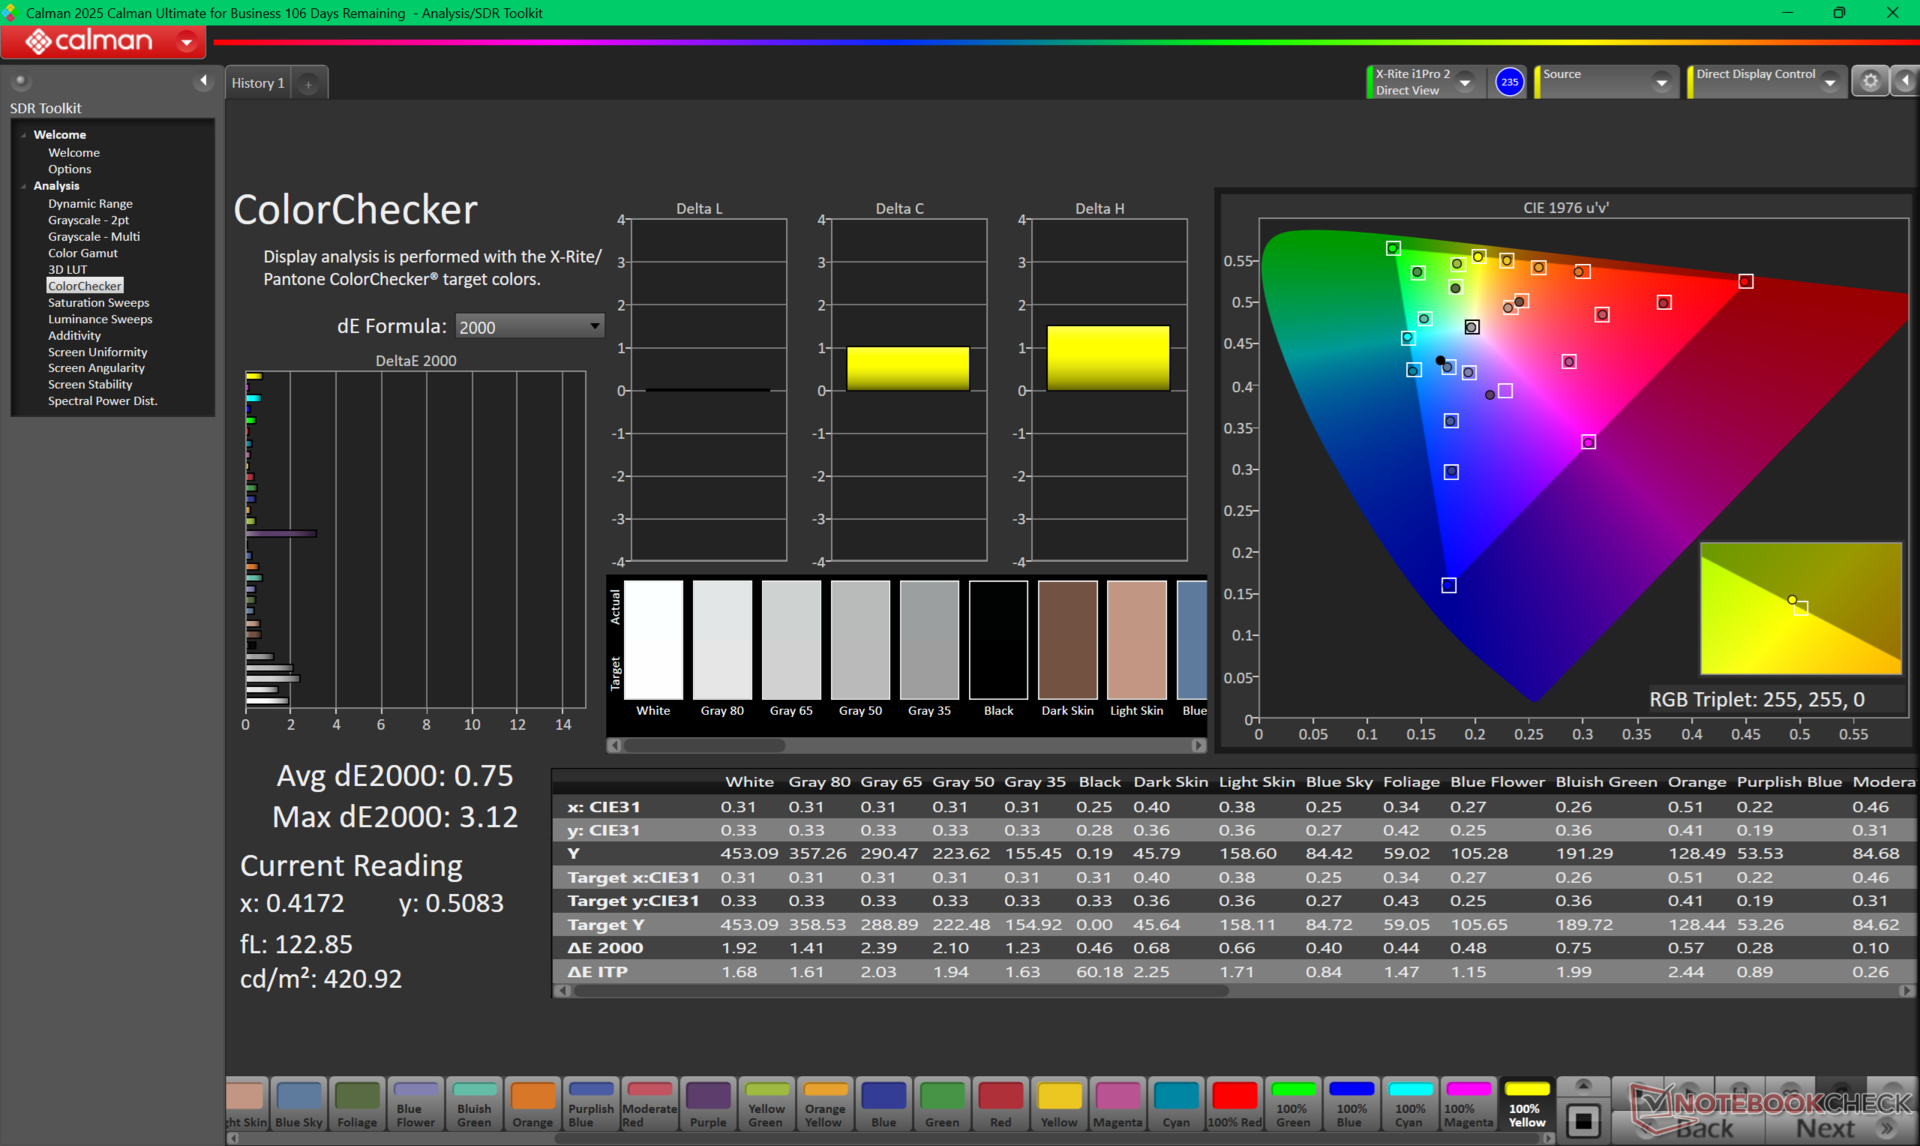
calibrated: 0.75
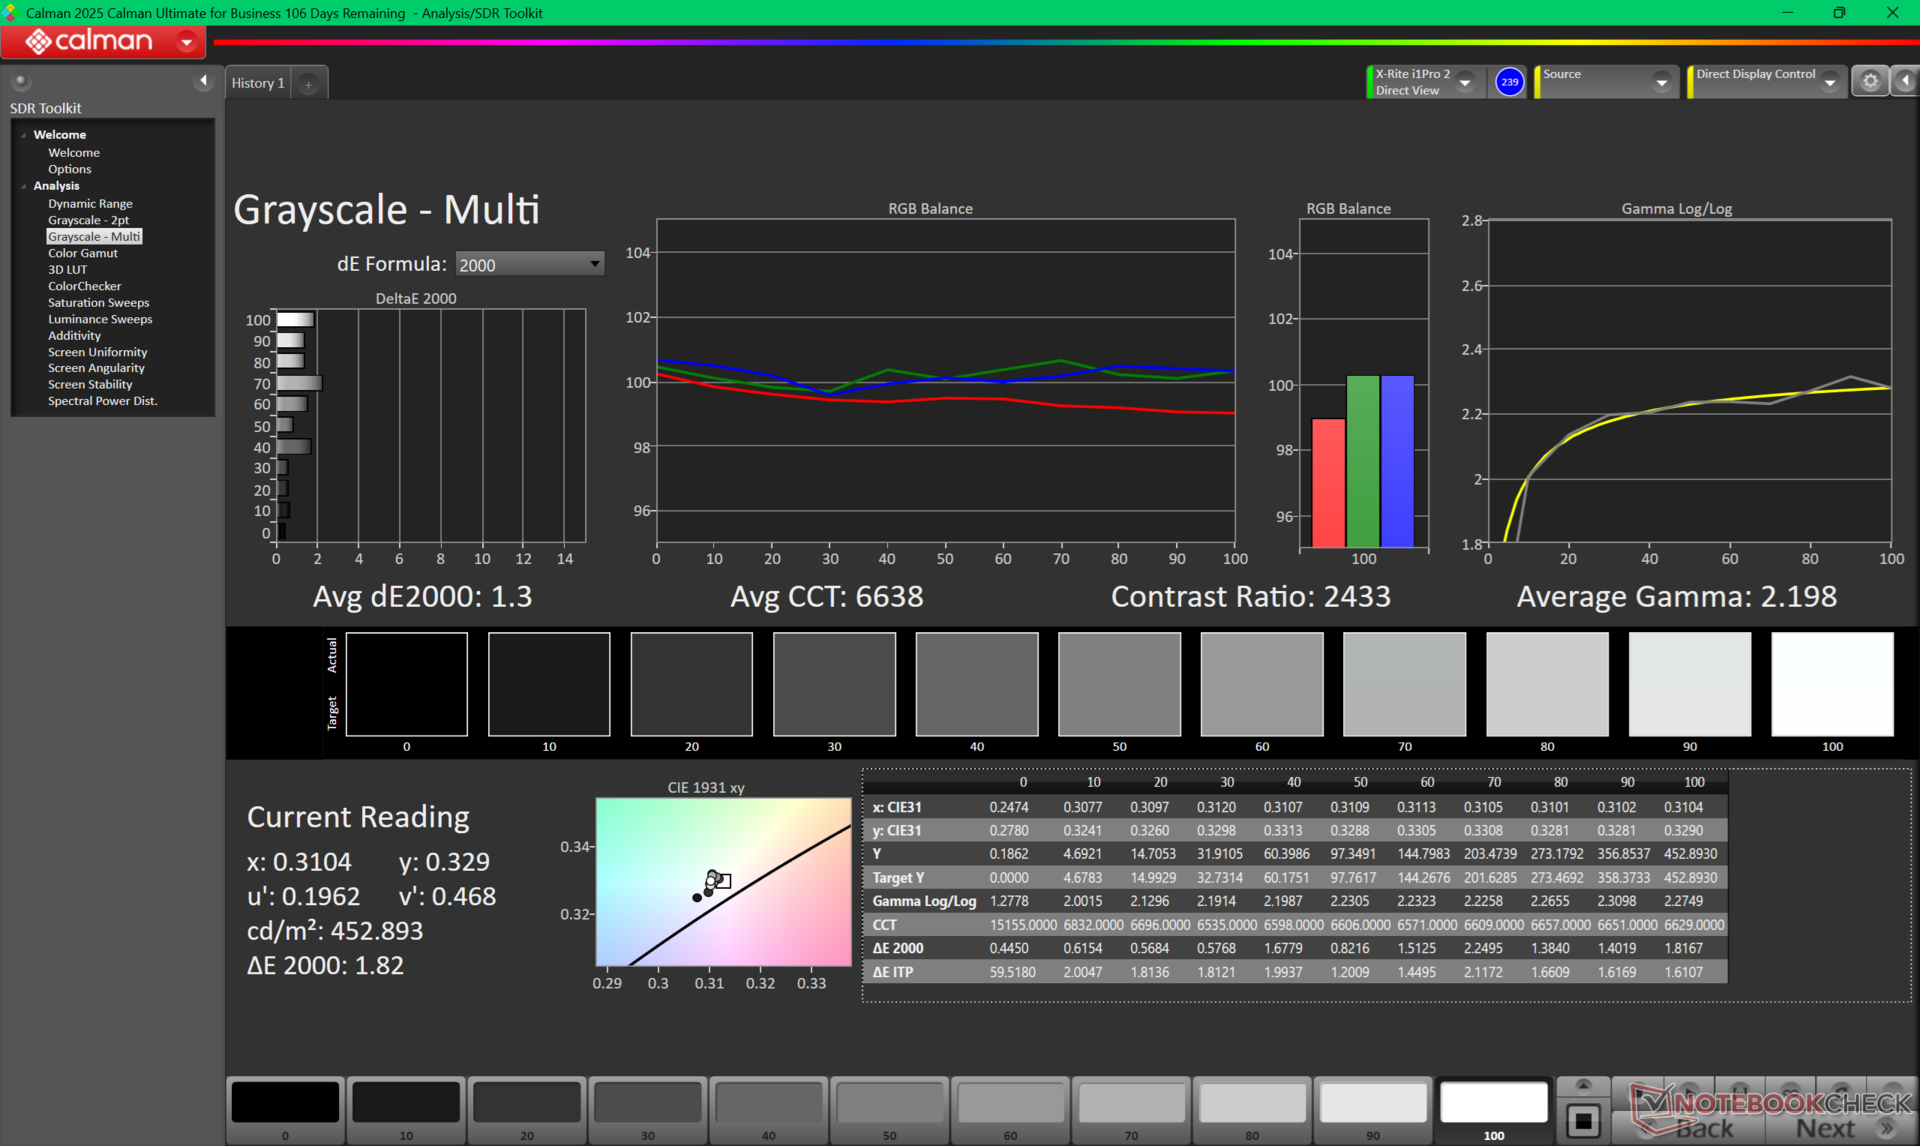
ΔE Greyscale Calman: 3.5 | ∀{0.09-98 Ø4.97}
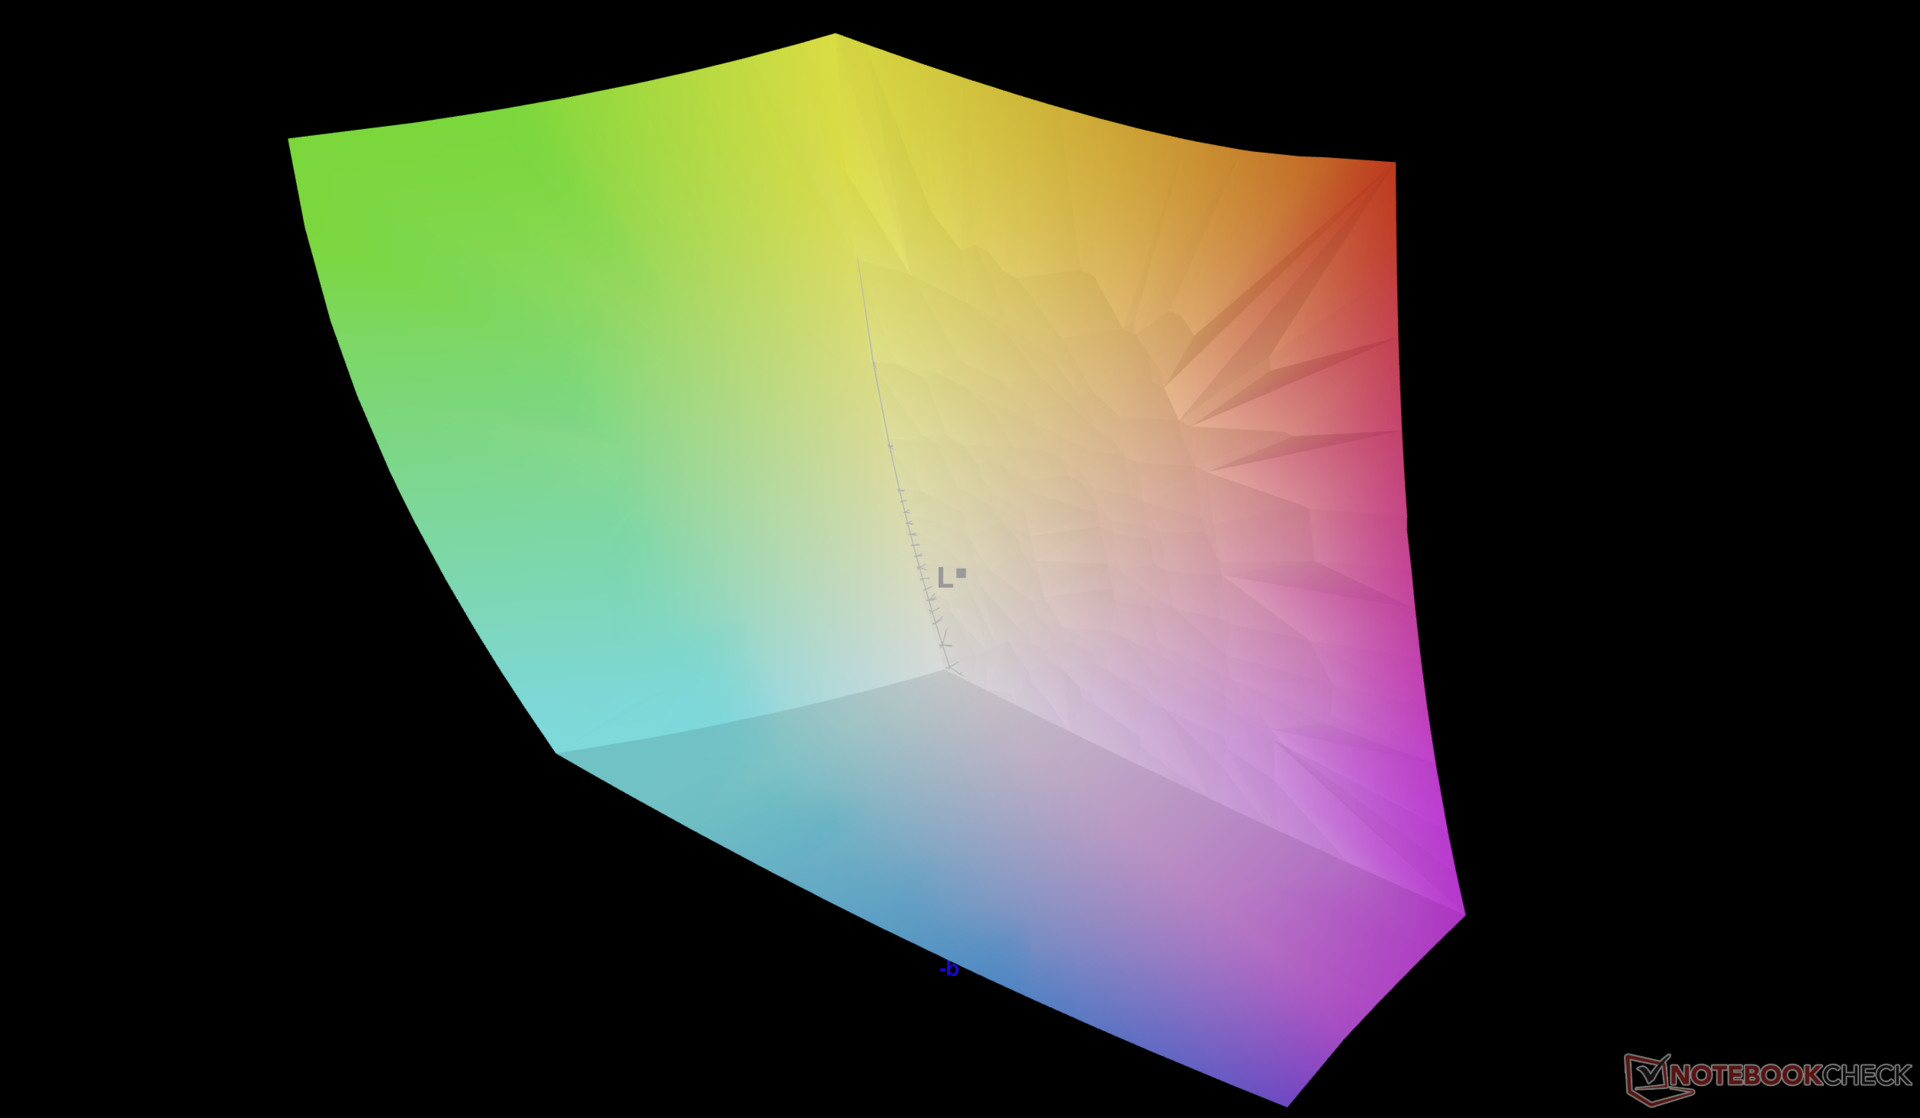
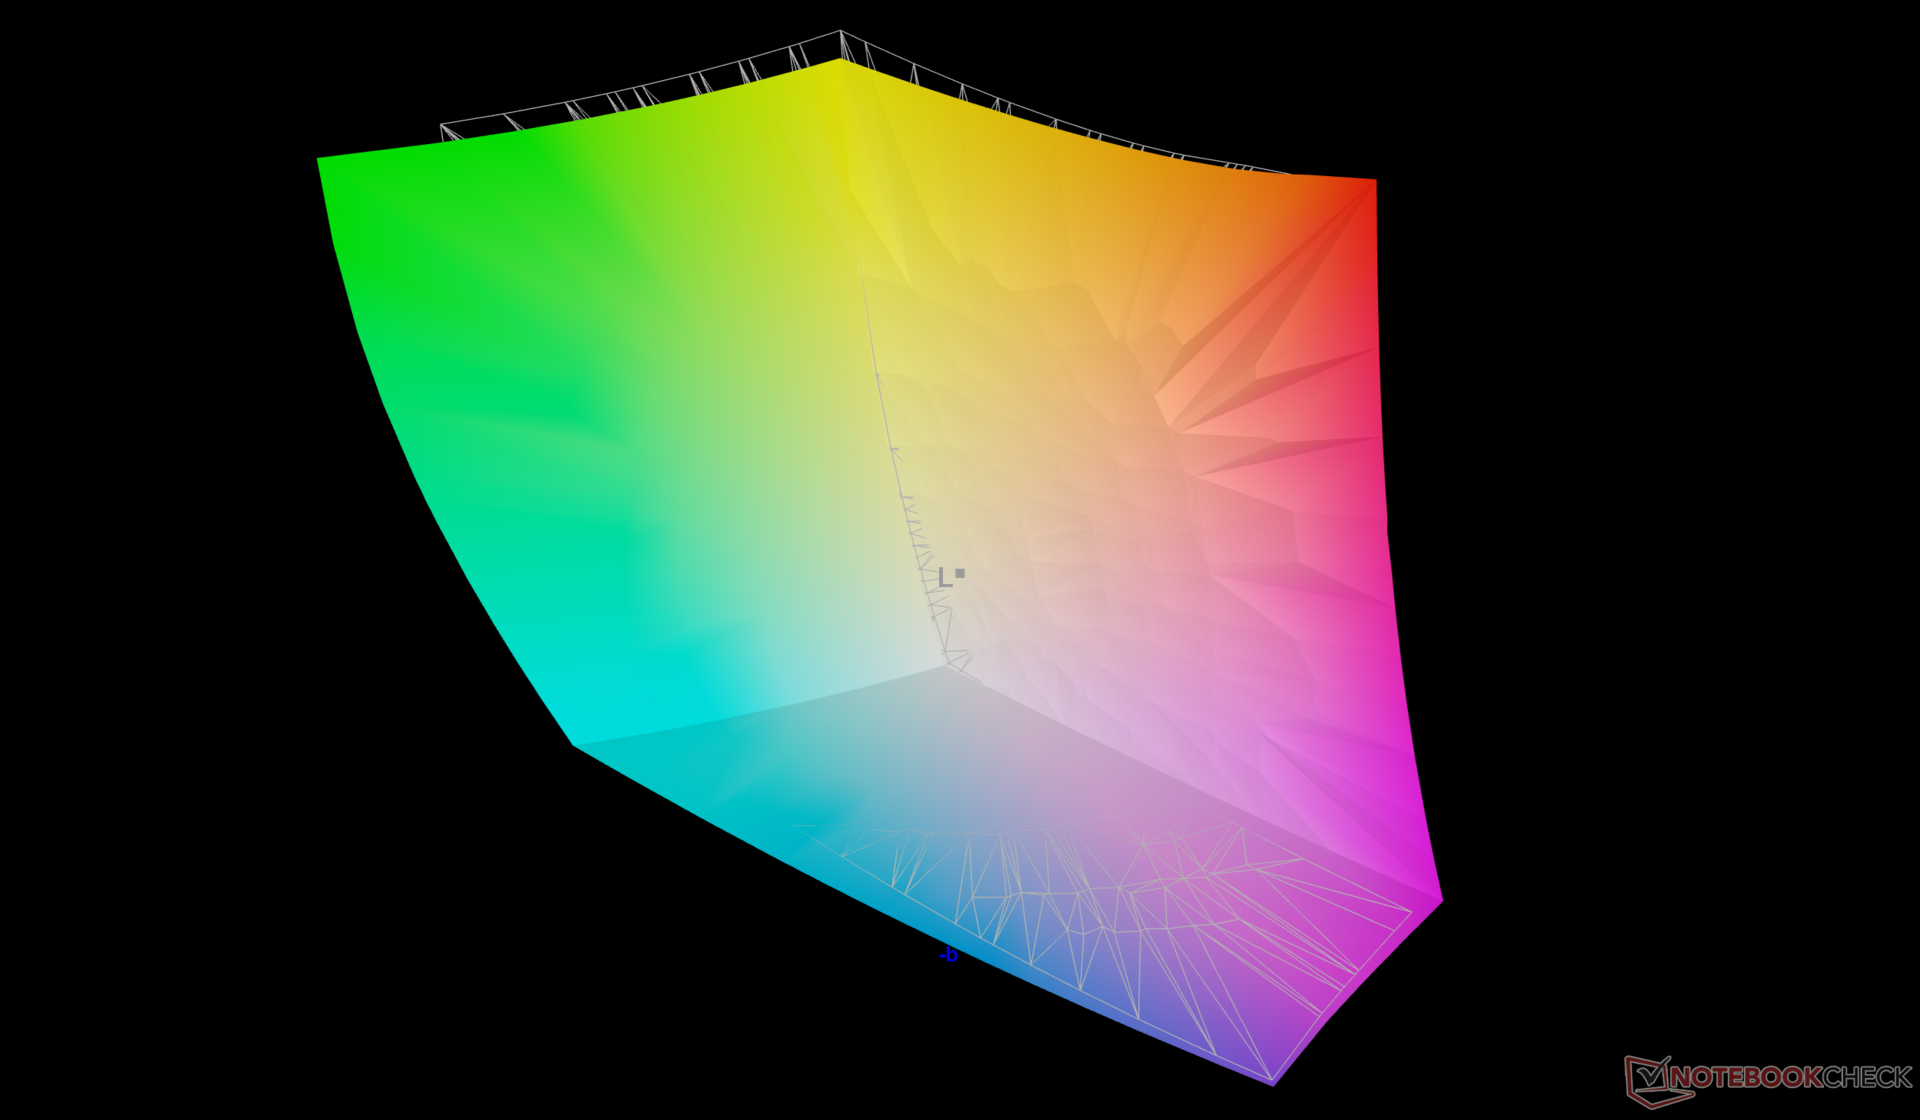
99.9% AdobeRGB 1998 (Argyll 3D)
100% sRGB (Argyll 3D)
97.2% Display P3 (Argyll 3D)
Gamma: 2.15
CCT: 6715 K
| HP ZBook X G1i 16 LG Philips LGD07B3, IPS, 2560x1600, 16", 120 Hz | HP ZBook Power 16 G11 A AUOA0A9, IPS, 2560x1600, 16", 120 Hz | HP ZBook Studio 16 G11 AUO87A8, IPS, 3840x2400, 16", 120 Hz | Lenovo ThinkPad P16 Gen 2 NE160QDM-NY1, IPS, 2560x1600, 16", 165 Hz | Dell Pro Max 16 Plus Samsung 160HC01, OLED, 3840x2400, 16", 120 Hz | Dell Precision 5690 Samsung 160YV03, OLED, 3840x2400, 16", 60 Hz | |
|---|---|---|---|---|---|---|
| Display | -20% | -4% | -21% | -4% | 0% | |
| Display P3 Coverage (%) | 97.2 | 69.1 -29% | 97.7 1% | 68.4 -30% | 97.3 0% | 99.8 3% |
| sRGB Coverage (%) | 100 | 97.7 -2% | 99.9 0% | 96.9 -3% | 100 0% | 100 0% |
| AdobeRGB 1998 Coverage (%) | 99.9 | 71 -29% | 85.7 -14% | 70.6 -29% | 88.8 -11% | 96.6 -3% |
| Response Times | 69% | 64% | 66% | 79% | 95% | |
| Response Time Grey 50% / Grey 80% * (ms) | 45.5 ? | 13.6 ? 70% | 14.2 ? 69% | 14.1 ? 69% | 0.63 ? 99% | 1.7 ? 96% |
| Response Time Black / White * (ms) | 26.1 ? | 8.4 ? 68% | 10.6 ? 59% | 9.9 ? 62% | 0.89 ? 97% | 1.7 ? 93% |
| PWM Frequency (Hz) | 26536 ? | 479.9 ? | 60 ? | |||
| PWM Amplitude * (%) | 47 | 28 40% | ||||
| Screen | -4% | 11% | 31% | 29% | 1% | |
| Brightness middle (cd/m²) | 461.8 | 470.7 2% | 404.3 -12% | 531.5 15% | 530.9 15% | 348.1 -25% |
| Brightness (cd/m²) | 427 | 431 1% | 405 -5% | 499 17% | 540 26% | 351 -18% |
| Brightness Distribution (%) | 88 | 88 0% | 92 5% | 89 1% | 95 8% | 97 10% |
| Black Level * (cd/m²) | 0.46 | 0.57 -24% | 0.28 39% | 0.38 17% | ||
| Contrast (:1) | 1004 | 826 -18% | 1444 44% | 1399 39% | ||
| Colorchecker dE 2000 * | 4.08 | 2.16 47% | 2.63 36% | 1.82 55% | 2.42 41% | 4.18 -2% |
| Colorchecker dE 2000 max. * | 8.1 | 4.39 46% | 4.48 45% | 4.1 49% | 5.76 29% | 6.68 18% |
| Colorchecker dE 2000 calibrated * | 0.75 | 1.37 -83% | 1.46 -95% | 0.63 16% | 0.7 7% | 0.97 -29% |
| Greyscale dE 2000 * | 3.5 | 3.7 -6% | 2.1 40% | 1.2 66% | 0.8 77% | 1.7 51% |
| Gamma | 2.15 102% | 2.38 92% | 2.3 96% | 2.15 102% | 2.23 99% | 2.2 100% |
| CCT | 6715 97% | 6765 96% | 6810 95% | 6484 100% | 6488 100% | 6198 105% |
| Toplam Ortalama (Program / Ayarlar) | 15% /
3% | 24% /
15% | 25% /
25% | 35% /
33% | 32% /
16% |
* ... daha küçük daha iyidir
Yanıt Sürelerini Görüntüle
| ↔ Tepki Süresi Siyahtan Beyaza | ||
|---|---|---|
| 26.1 ms ... yükseliş ↗ ve sonbahar↘ birleşimi | ↗ 11.8 ms yükseliş | 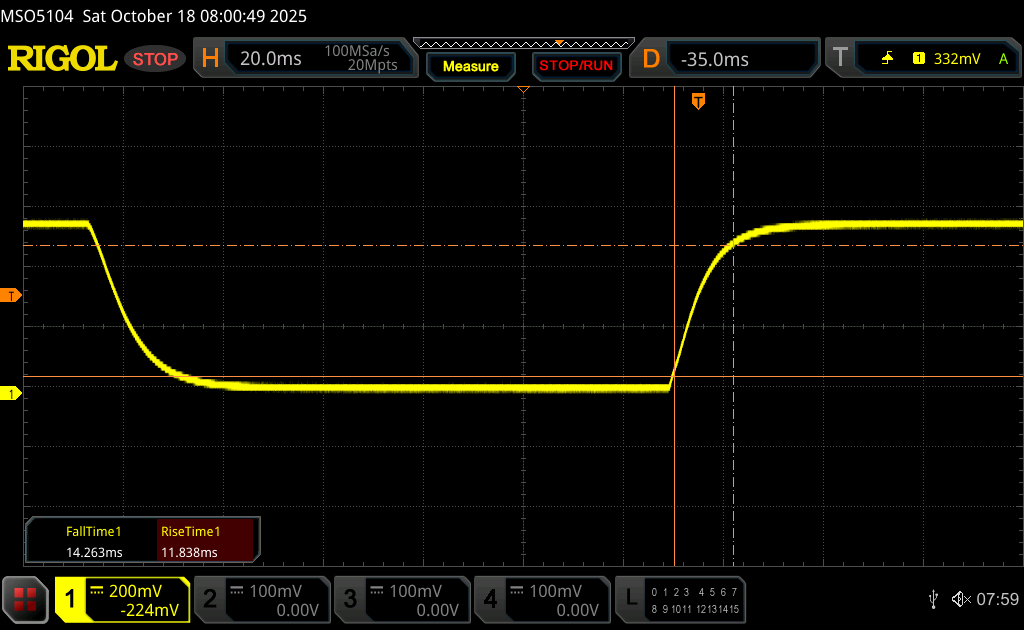 |
| ↘ 14.3 ms sonbahar | ||
| Ekran, testlerimizde nispeten yavaş yanıt oranları gösteriyor ve oyuncular için çok yavaş olabilir. Karşılaştırıldığında, test edilen tüm cihazlar 0.1 (minimum) ile 240 (maksimum) ms arasında değişir. » Tüm cihazların 65 %'si daha iyi. Bu, ölçülen yanıt süresinin test edilen tüm cihazların ortalamasından (19.8 ms) daha kötü olduğu anlamına gelir. | ||
| ↔ Tepki Süresi %50 Griden %80 Griye | ||
| 45.5 ms ... yükseliş ↗ ve sonbahar↘ birleşimi | ↗ 21.1 ms yükseliş | 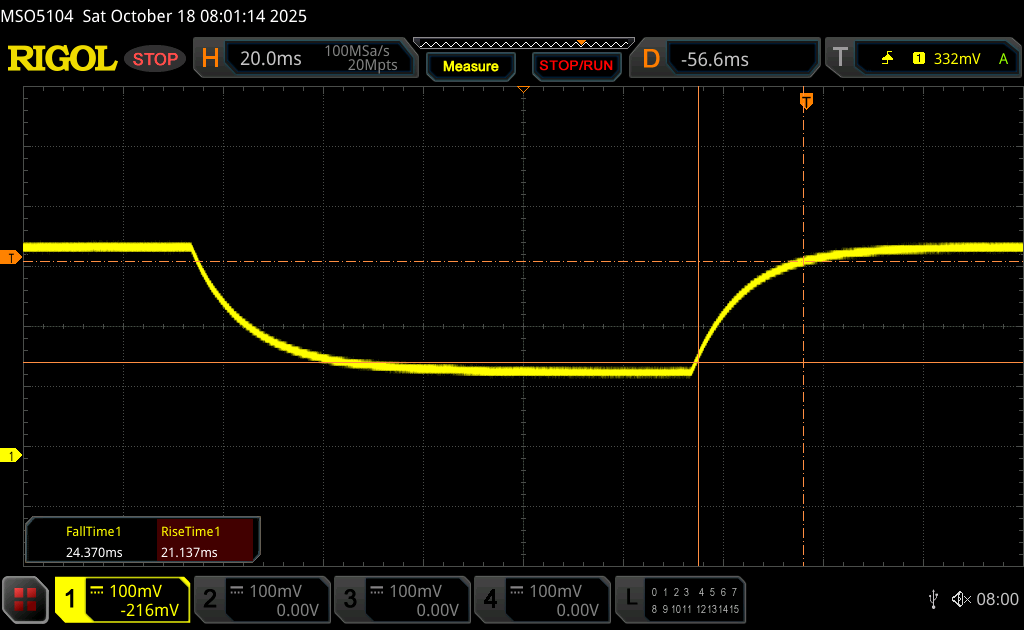 |
| ↘ 24.4 ms sonbahar | ||
| Ekran, testlerimizde yavaş yanıt oranları gösteriyor ve oyuncular için yetersiz olacaktır. Karşılaştırıldığında, test edilen tüm cihazlar 0.165 (minimum) ile 636 (maksimum) ms arasında değişir. » Tüm cihazların 78 %'si daha iyi. Bu, ölçülen yanıt süresinin test edilen tüm cihazların ortalamasından (31 ms) daha kötü olduğu anlamına gelir. | ||
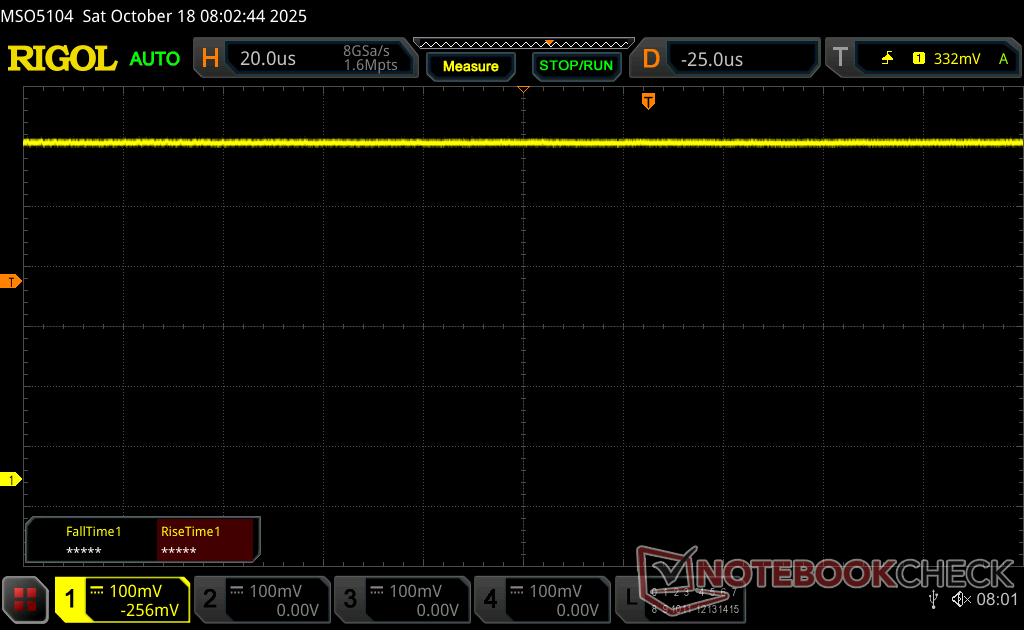
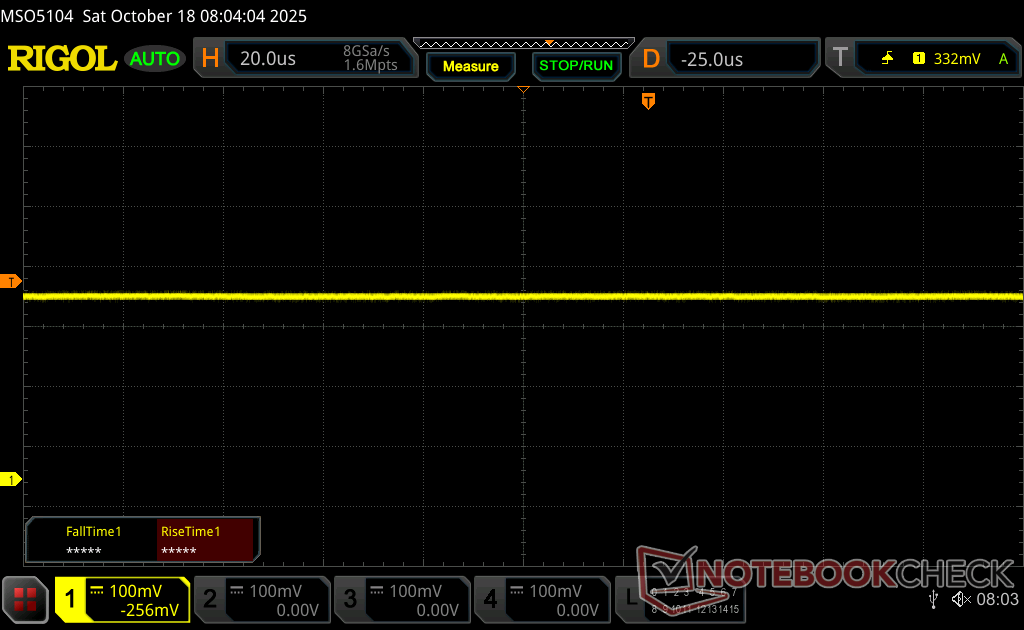
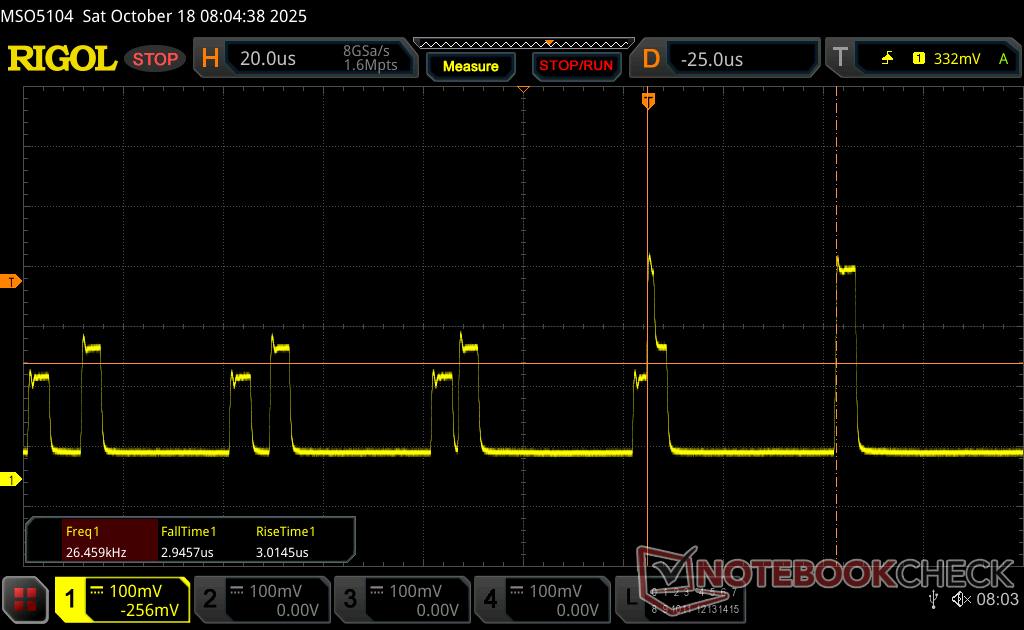
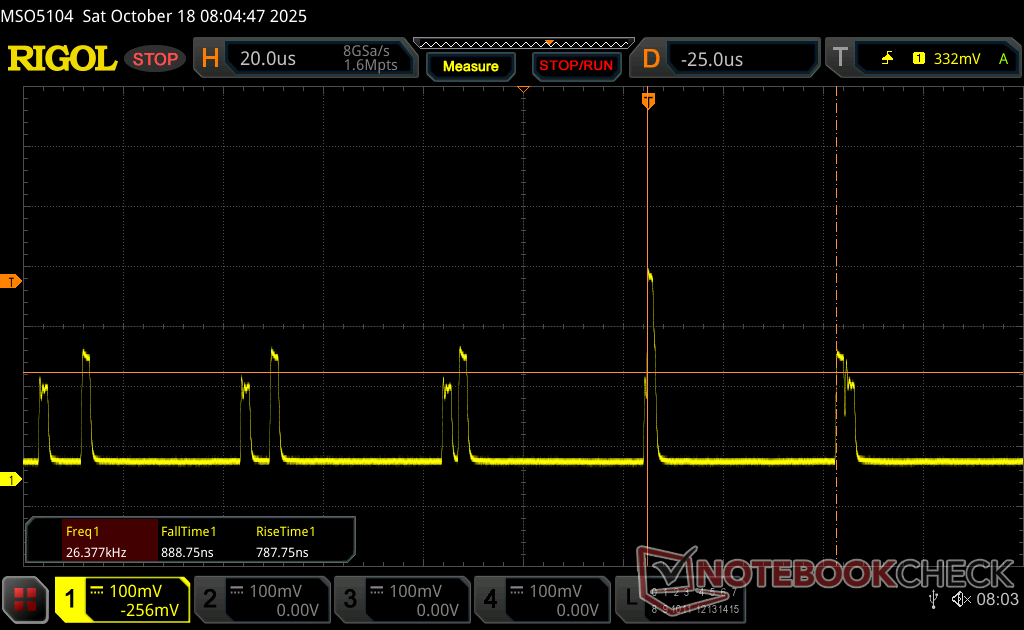
Ekran Titremesi / PWM (Darbe Genişliği Modülasyonu)
| Ekran titriyor / PWM algılandı | 26536 Hz Amplitude: 47 % | ≤ 74 % parlaklık ayarı | 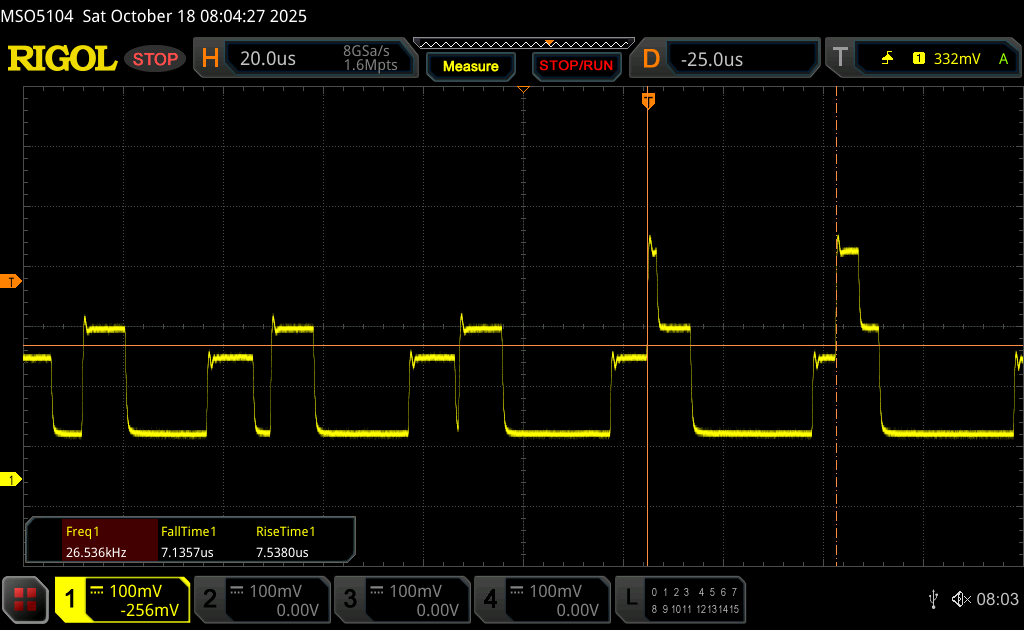 |
Ekran arka ışığı 26536 Hz'de titriyor (en kötü durum, örneğin PWM kullanılması) 74 % ve altındaki parlaklık ayarında titreme algılandı. Bu parlaklık ayarının üzerinde titreme veya PWM olmamalıdır. 26536 Hz frekansı oldukça yüksektir, bu nedenle PWM'ye duyarlı çoğu kullanıcı herhangi bir titremeyi fark etmemelidir. Karşılaştırıldığında: Test edilen tüm cihazların %52 %'si ekranı karartmak için PWM kullanmıyor. PWM tespit edilirse, ortalama 7747 (minimum: 5 - maksimum: 343500) Hz ölçüldü. | |||

Performans
Test Koşulları
Aşağıdaki kıyaslamaları çalıştırmadan önce Windows'u Performans moduna ayarladık.
İşlemci
Bu Core Ultra 7 265H geçen yıla göre sadece nispeten küçük bir performans artışı sunuyor Core Ultra 7 155H yaklaşık yüzde 15 oranında. HP ZBook Studio 16 G9 gibi çok daha eski bir modelden yükseltme yapan kullanıcılar yaklaşık yüzde 30'luk daha önemli bir artış göreceklerdir.
Aşağıdaki Stres Testi bölümümüzde ayrıntılı olarak açıklandığı gibi Turbo Boost sınırlamaları nedeniyle döngüsel CineBench R15 xT stres testimizi çalıştırırken performans yaklaşık yüzde 10 düşer.
Cinebench R15 Çoklu Döngü
Cinebench R23: Multi Core | Single Core
Cinebench R20: CPU (Multi Core) | CPU (Single Core)
Cinebench R15: CPU Multi 64Bit | CPU Single 64Bit
Blender: v2.79 BMW27 CPU
7-Zip 18.03: 7z b 4 | 7z b 4 -mmt1
Geekbench 6.7: Multi-Core | Single-Core
Geekbench 5.5: Multi-Core | Single-Core
HWBOT x265 Benchmark v2.2: 4k Preset
LibreOffice : 20 Documents To PDF
R Benchmark 2.5: Overall mean
* ... daha küçük daha iyidir
Sistem Performansı
PCMark 10, SpecViewPerf 13 Maya ve AIDA64 Engineer dahil olmak üzere test ünitemizde az sayıda kıyaslama çöküyor veya tamamlanamıyordu.
CrossMark: Overall | Productivity | Creativity | Responsiveness
WebXPRT 3: Overall
WebXPRT 4: Overall
Mozilla Kraken 1.1: Total
| Performance rating | |
| Dell Pro Max 16 Plus | |
| Lenovo ThinkPad P16 Gen 2 | |
| HP ZBook X G1i 16 | |
| Ortalama Intel Core Ultra 7 265H, NVIDIA RTX PRO 2000 Blackwell Generation Laptop | |
| Dell Precision 5690 | |
| HP ZBook Studio 16 G11 | |
| HP ZBook Power 16 G11 A | |
| CrossMark / Overall | |
| Dell Pro Max 16 Plus | |
| Lenovo ThinkPad P16 Gen 2 | |
| HP ZBook X G1i 16 | |
| Ortalama Intel Core Ultra 7 265H, NVIDIA RTX PRO 2000 Blackwell Generation Laptop (n=1) | |
| Dell Precision 5690 | |
| HP ZBook Power 16 G11 A | |
| HP ZBook Studio 16 G11 | |
| CrossMark / Productivity | |
| Dell Pro Max 16 Plus | |
| HP ZBook X G1i 16 | |
| Ortalama Intel Core Ultra 7 265H, NVIDIA RTX PRO 2000 Blackwell Generation Laptop (n=1) | |
| Lenovo ThinkPad P16 Gen 2 | |
| Dell Precision 5690 | |
| HP ZBook Power 16 G11 A | |
| HP ZBook Studio 16 G11 | |
| CrossMark / Creativity | |
| Dell Pro Max 16 Plus | |
| Lenovo ThinkPad P16 Gen 2 | |
| HP ZBook X G1i 16 | |
| Ortalama Intel Core Ultra 7 265H, NVIDIA RTX PRO 2000 Blackwell Generation Laptop (n=1) | |
| HP ZBook Power 16 G11 A | |
| Dell Precision 5690 | |
| HP ZBook Studio 16 G11 | |
| CrossMark / Responsiveness | |
| Dell Pro Max 16 Plus | |
| Lenovo ThinkPad P16 Gen 2 | |
| Dell Precision 5690 | |
| HP ZBook X G1i 16 | |
| Ortalama Intel Core Ultra 7 265H, NVIDIA RTX PRO 2000 Blackwell Generation Laptop (n=1) | |
| HP ZBook Studio 16 G11 | |
| HP ZBook Power 16 G11 A | |
| WebXPRT 3 / Overall | |
| Lenovo ThinkPad P16 Gen 2 | |
| Dell Pro Max 16 Plus | |
| HP ZBook X G1i 16 | |
| Ortalama Intel Core Ultra 7 265H, NVIDIA RTX PRO 2000 Blackwell Generation Laptop (n=1) | |
| HP ZBook Power 16 G11 A | |
| HP ZBook Studio 16 G11 | |
| Dell Precision 5690 | |
| WebXPRT 4 / Overall | |
| Dell Pro Max 16 Plus | |
| Lenovo ThinkPad P16 Gen 2 | |
| HP ZBook X G1i 16 | |
| Ortalama Intel Core Ultra 7 265H, NVIDIA RTX PRO 2000 Blackwell Generation Laptop (n=1) | |
| Dell Precision 5690 | |
| HP ZBook Studio 16 G11 | |
| HP ZBook Power 16 G11 A | |
| Mozilla Kraken 1.1 / Total | |
| HP ZBook Power 16 G11 A | |
| HP ZBook Studio 16 G11 | |
| Dell Precision 5690 | |
| HP ZBook X G1i 16 | |
| Ortalama Intel Core Ultra 7 265H, NVIDIA RTX PRO 2000 Blackwell Generation Laptop (n=1) | |
| Lenovo ThinkPad P16 Gen 2 | |
| Dell Pro Max 16 Plus | |
* ... daha küçük daha iyidir
» No benchmarks for this notebook found!
DPC Gecikme Süresi
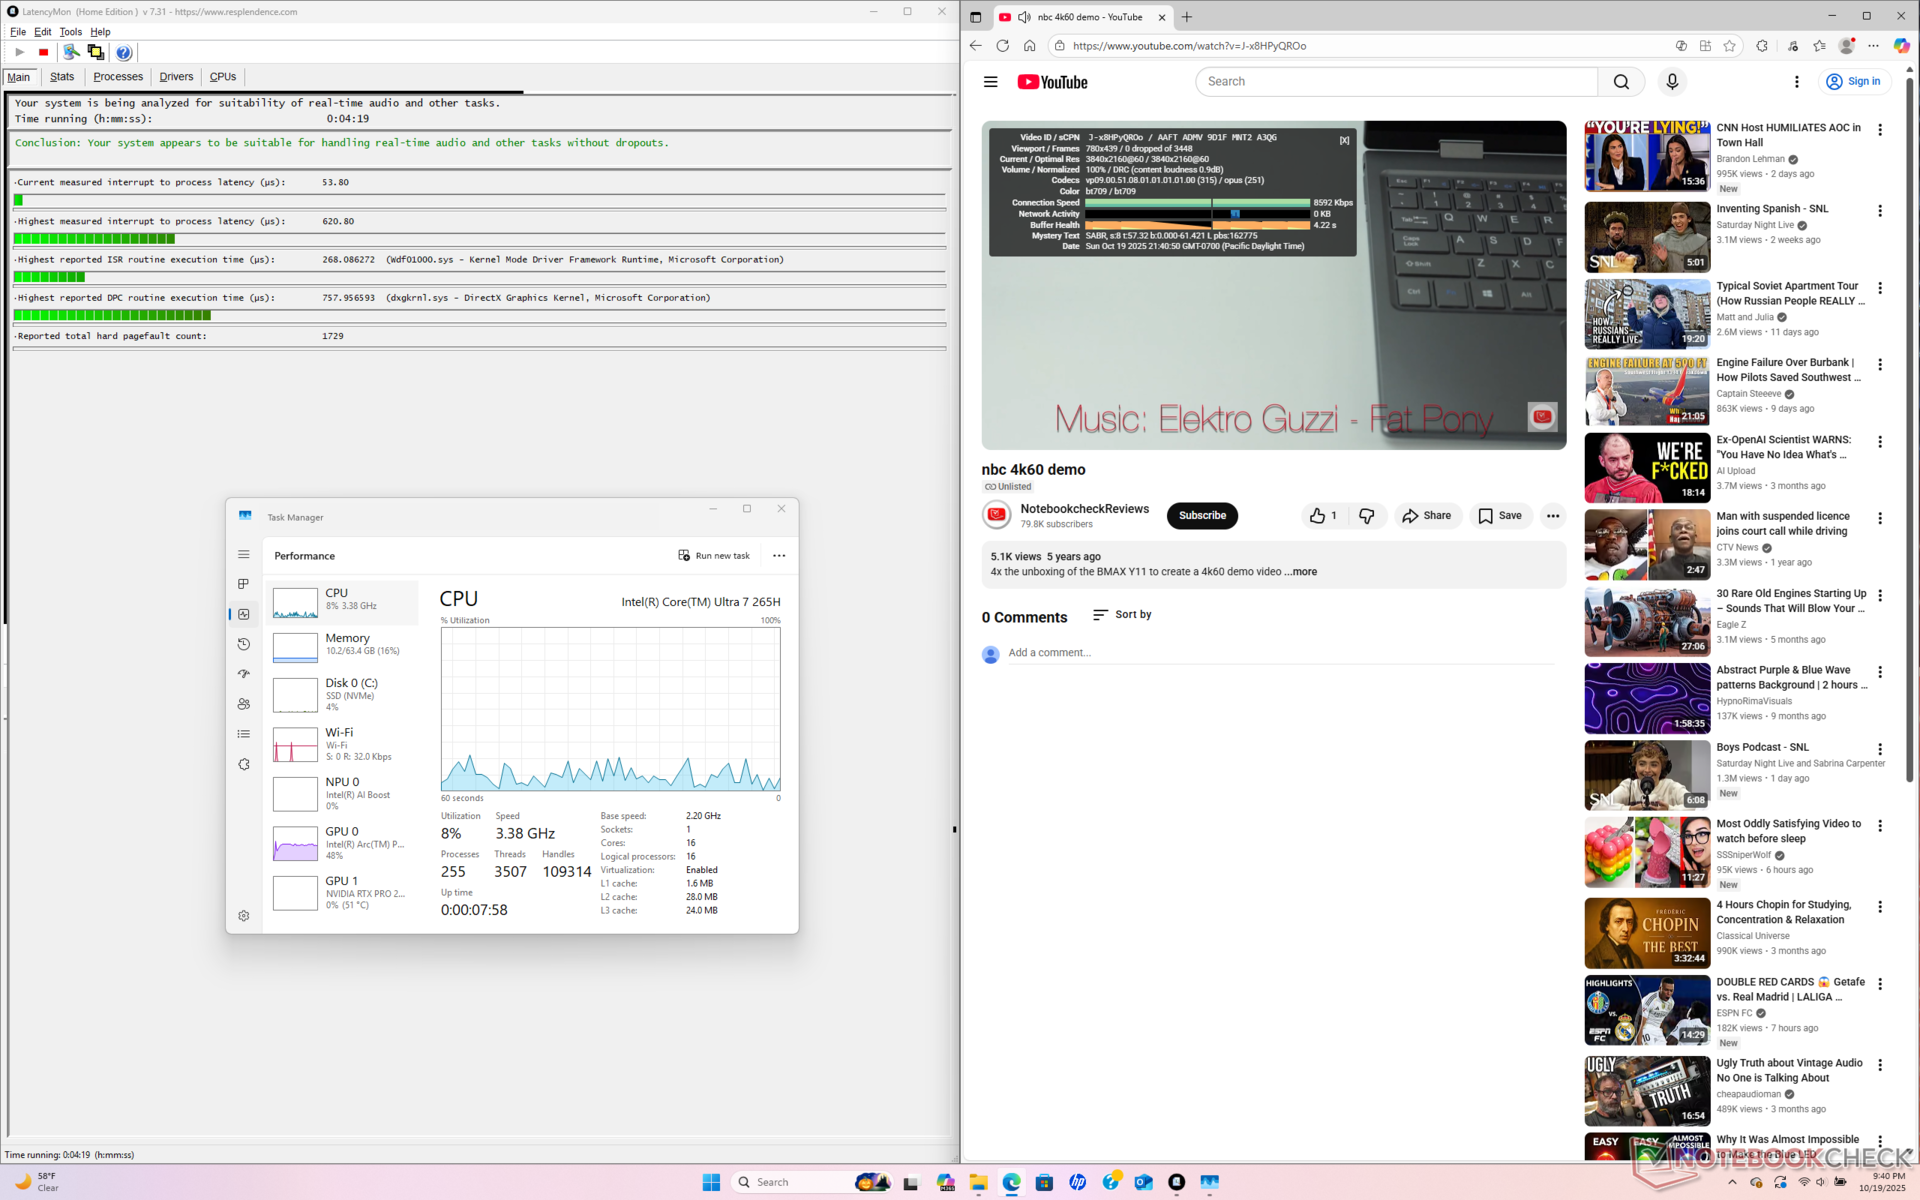
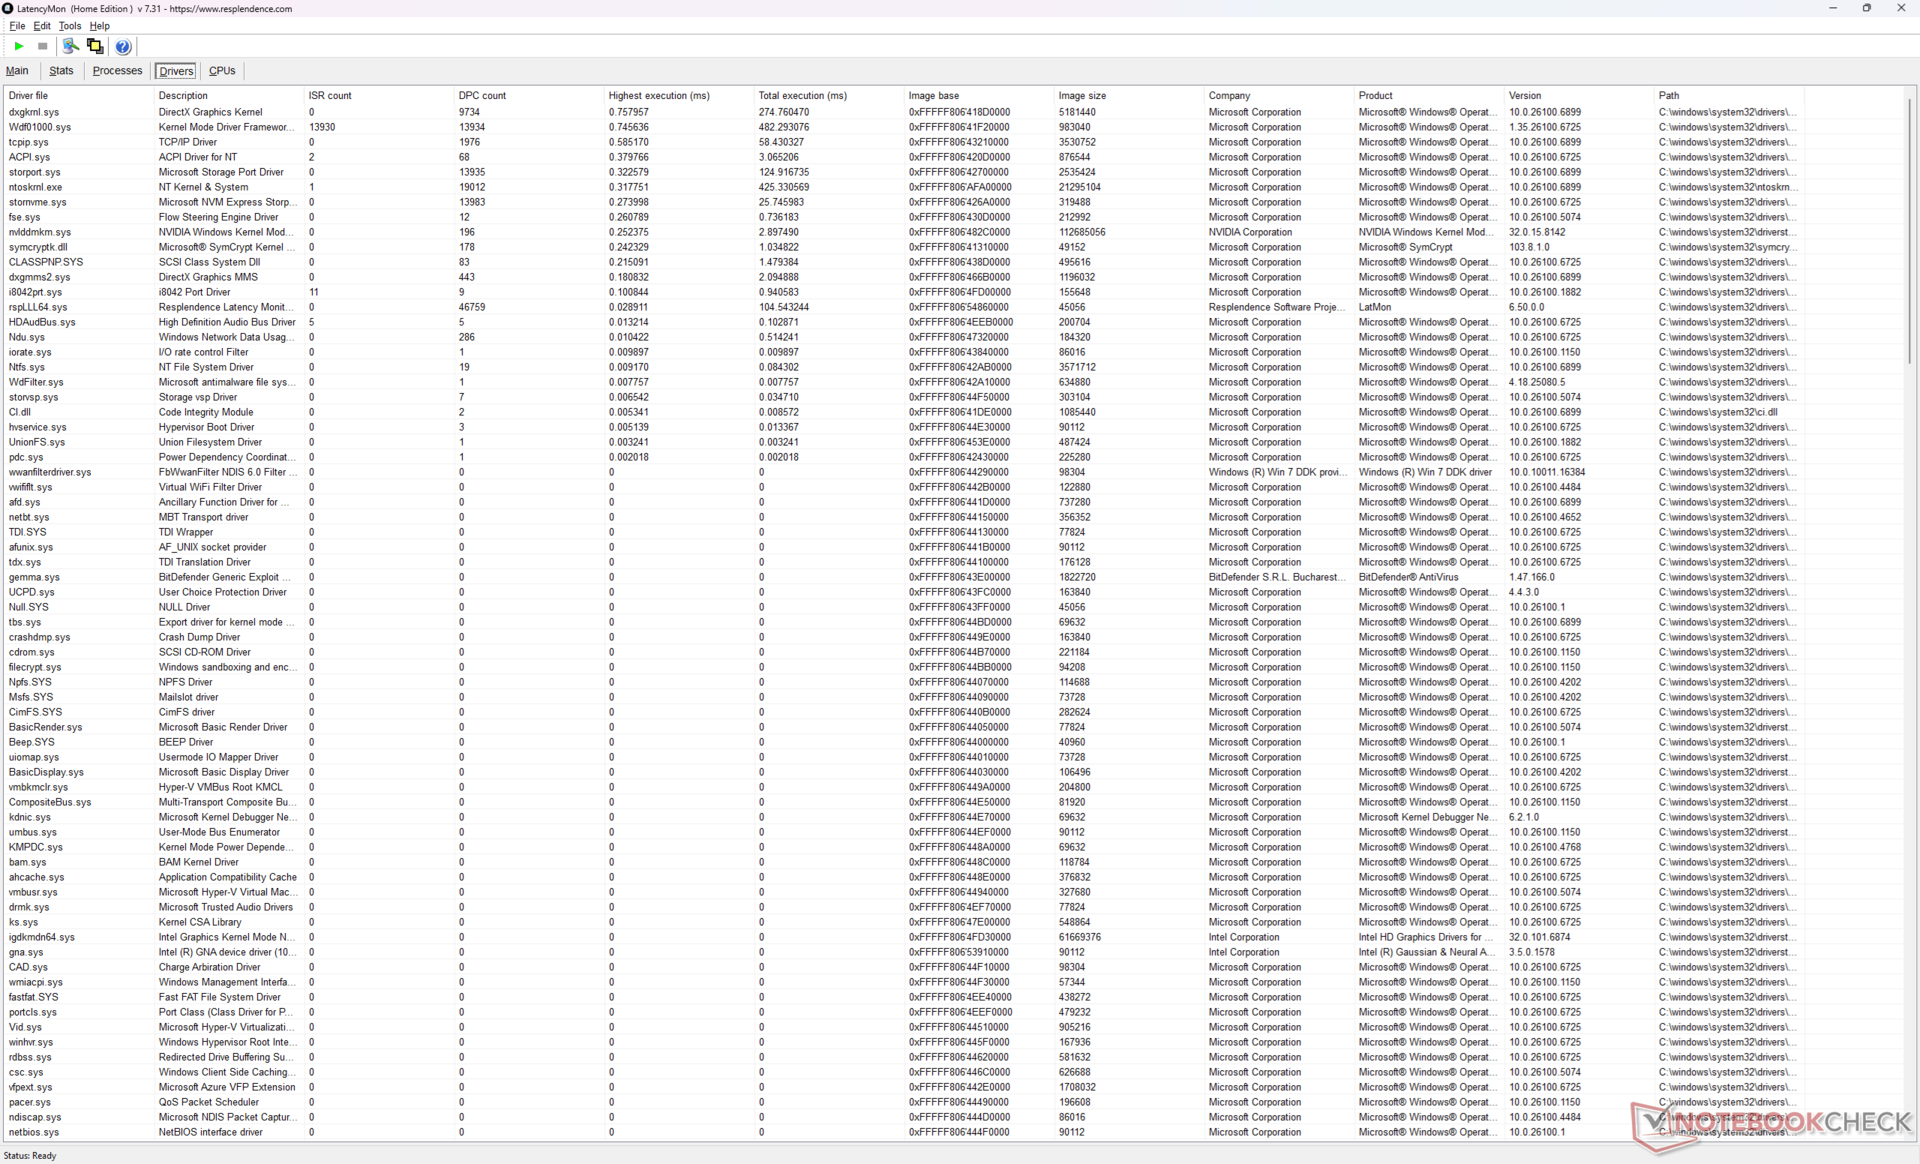
| DPC Latencies / LatencyMon - interrupt to process latency (max), Web, Youtube, Prime95 | |
| HP ZBook Power 16 G11 A | |
| Dell Pro Max 16 Plus | |
| HP ZBook Studio 16 G11 | |
| Lenovo ThinkPad P16 Gen 2 | |
| HP ZBook X G1i 16 | |
| Dell Precision 5690 | |
* ... daha küçük daha iyidir
Depolama Cihazları
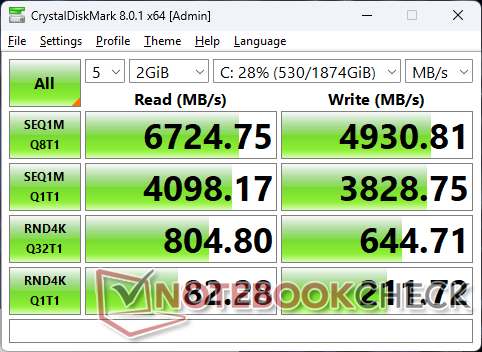
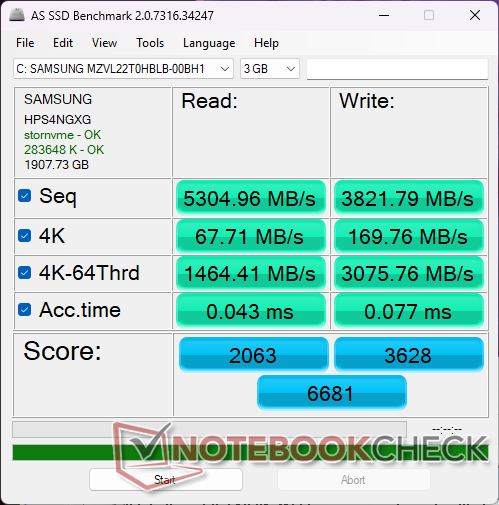

| Drive Performance rating - Percent | |
| HP ZBook X G1i 16 | |
| Dell Pro Max 16 Plus | |
| Dell Precision 5690 | |
| Lenovo ThinkPad P16 Gen 2 | |
| HP ZBook Power 16 G11 A | |
| HP ZBook Studio 16 G11 | |
* ... daha küçük daha iyidir
Disk Daraltma: DiskSpd Okuma Döngüsü, Kuyruk Derinliği 8
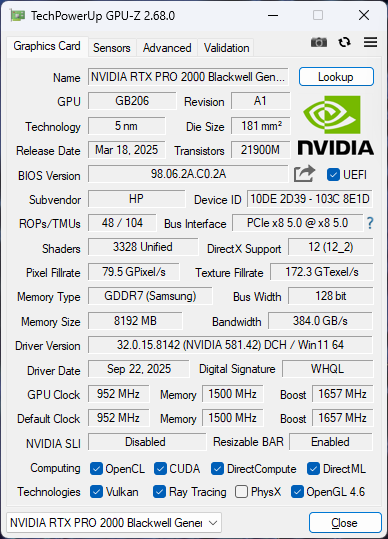
GPU Performansı
Bu RTX Pro 2000 Blackwell hP'de son nesilden biraz daha yüksek bir ham performans seviyesi için 60 W hedefleniyor RTX 2000 Ada Lovelace. Bu arada, çok daha eski sürümden yükseltme yapan kullanıcılar RTX A2000 2022 ZBook Studio 16 G9 gibi modellerde 1,5x ila 1,9x arasında daha önemli artışlar görecektir.
Performans modu yerine Dengeli modda çalıştırmak, aşağıdaki Fire Strike sonuç tablomuzda gösterildiği gibi grafik performansını yaklaşık yüzde 5 oranında etkileyecektir. Eğer oyun oynanıyorsa, RTX Pro 2000 en çok şu özelliklere benzer bir performans sergiliyor mobil GeForce RTX 4060 veya 5060.
| Güç Profili | Grafik Puanı | Fizik Puanı | Birleşik Puan |
| Performans Modu | 25085 | 33858 | 11010 |
| Dengeli Mod | 23771 (-5%) | 35309 (+4%) | 9366 (-15%) |
| Akü Gücü | 18195 (-27%) | 25739 (-24%) | 5646 (-49%) |
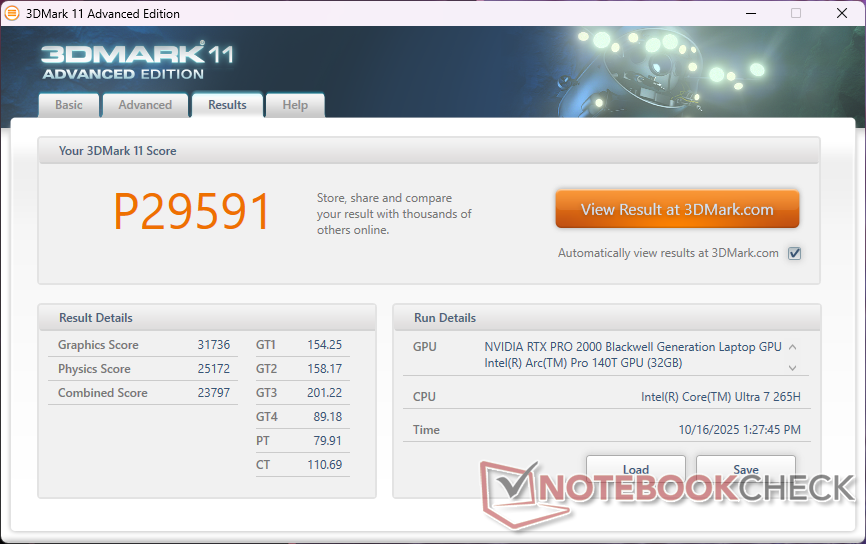

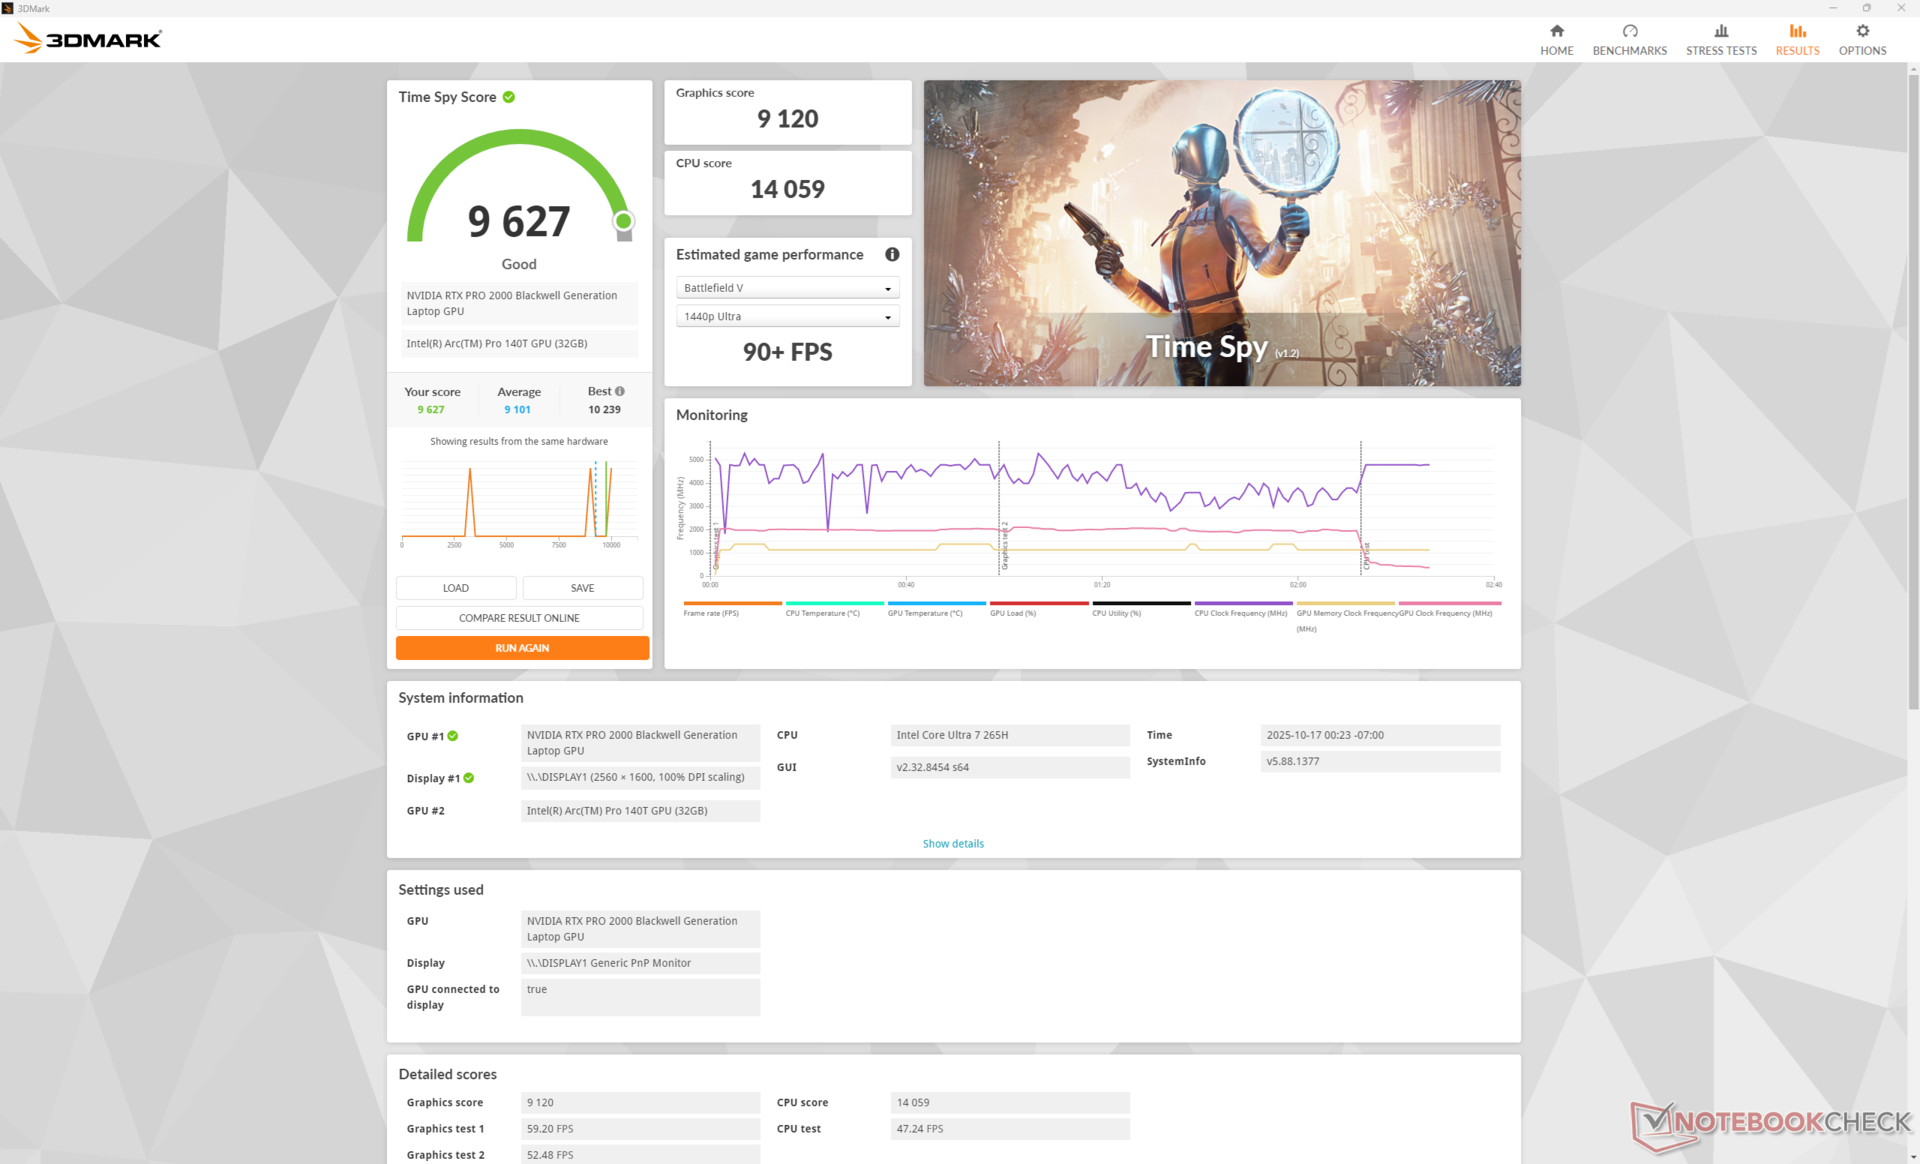
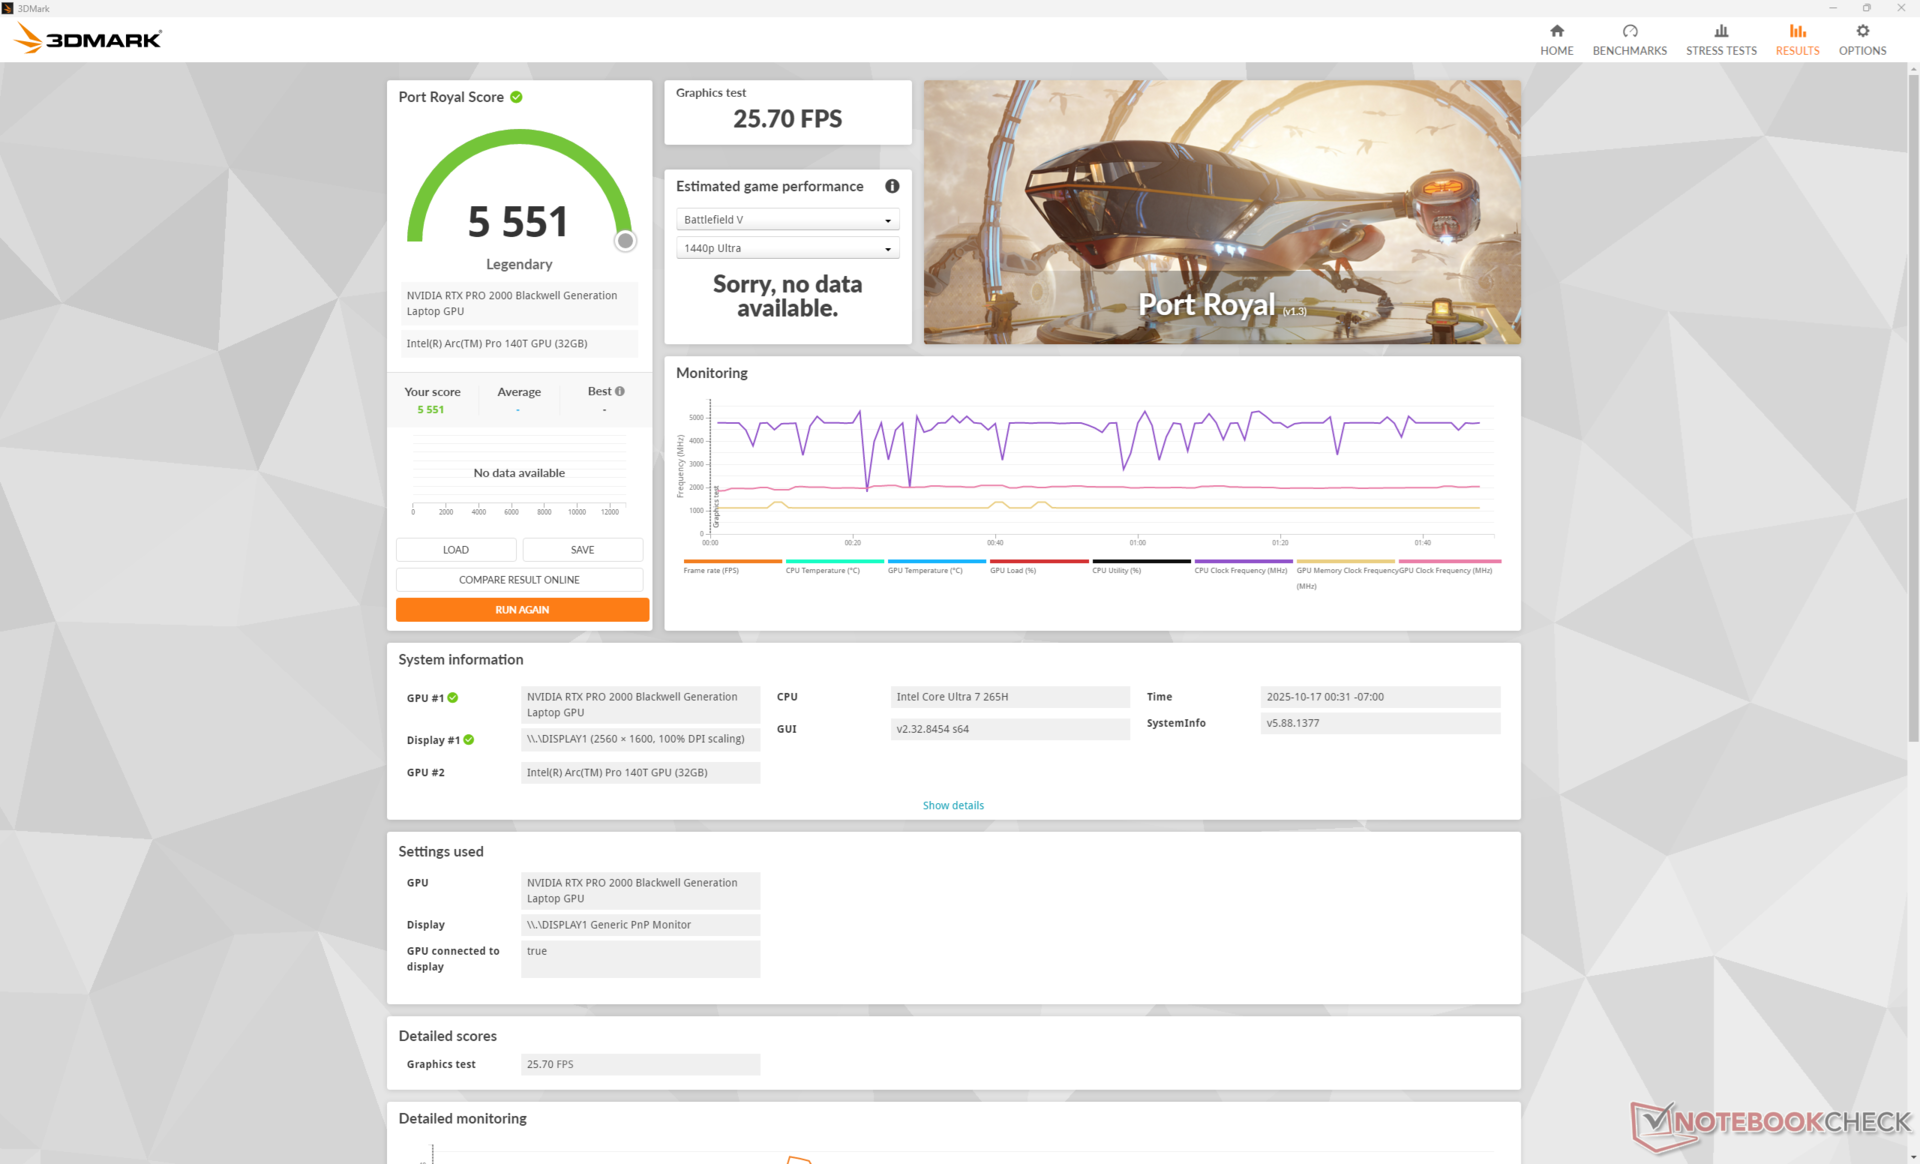
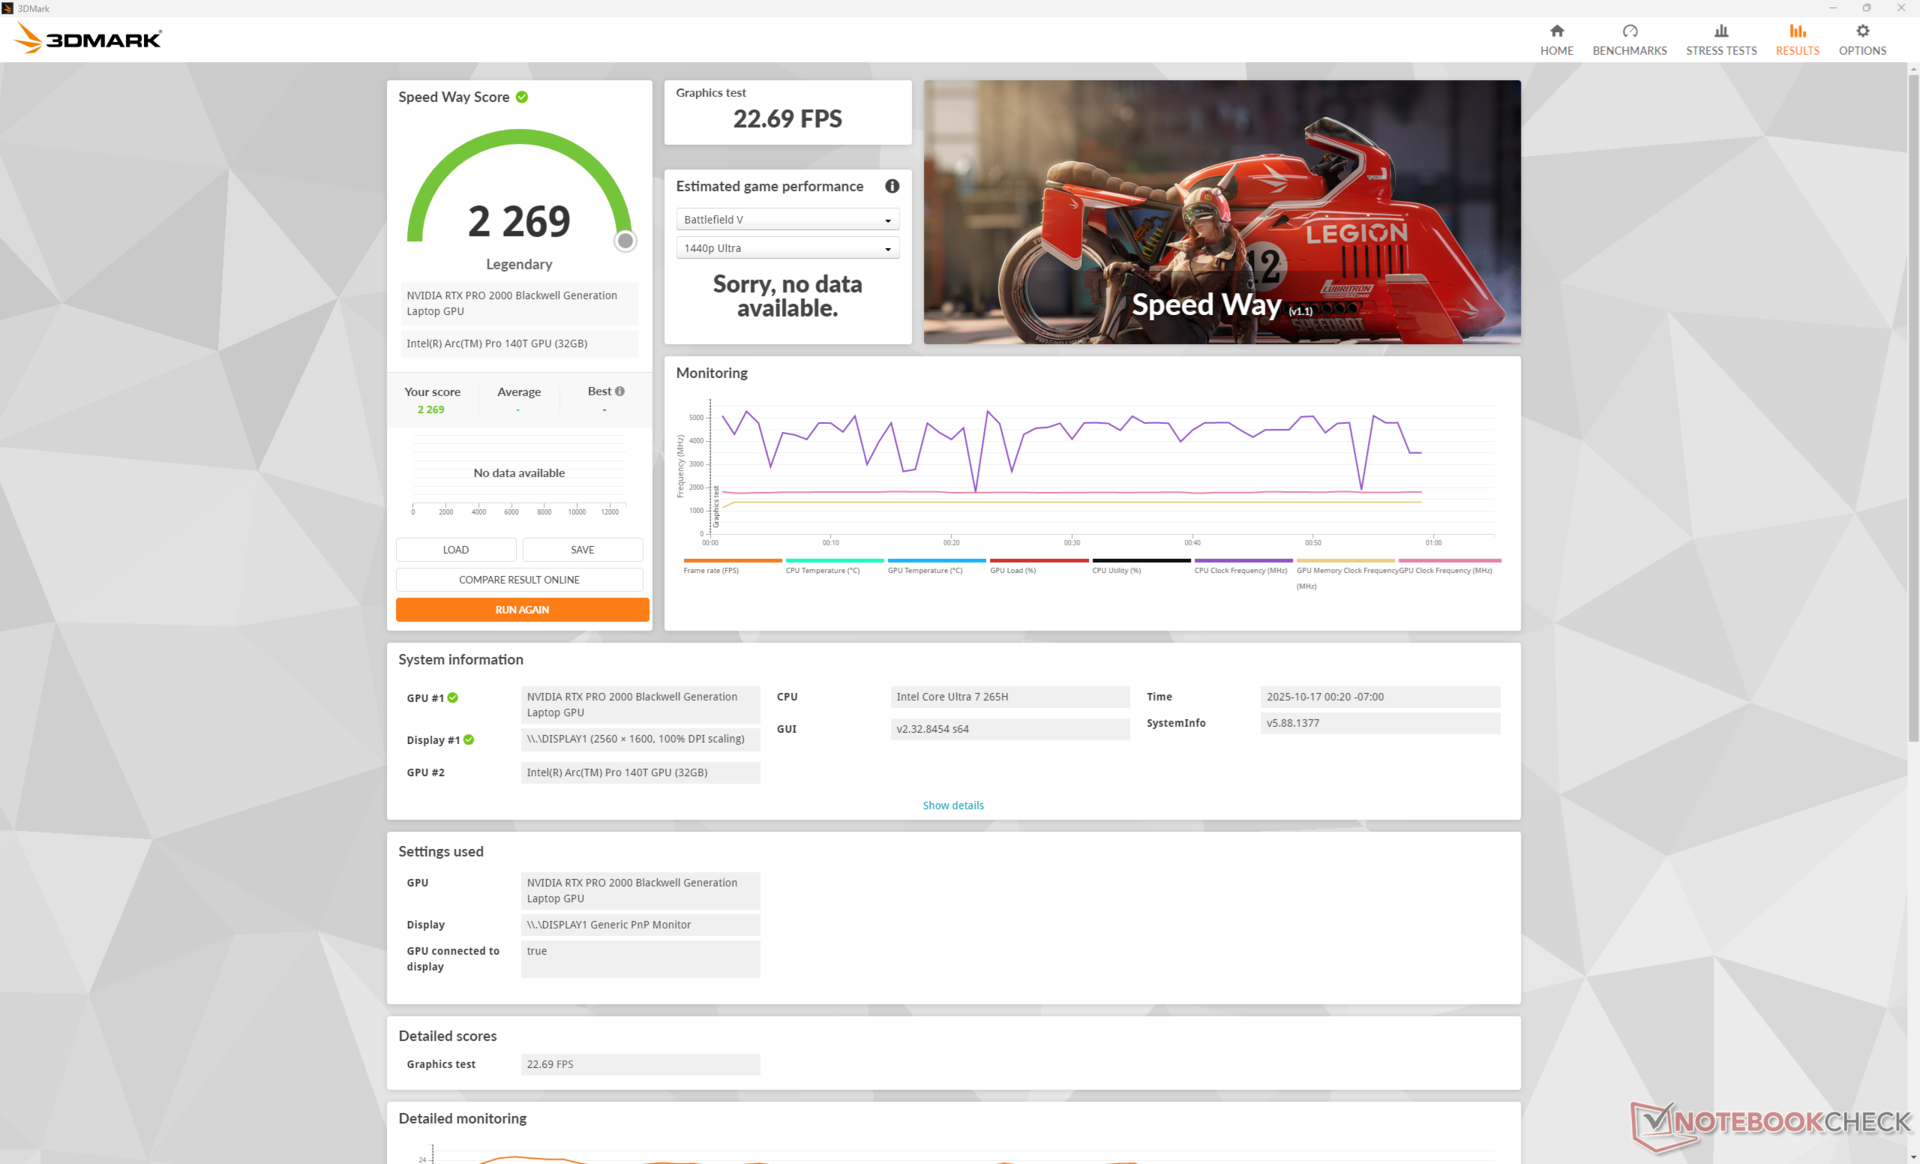
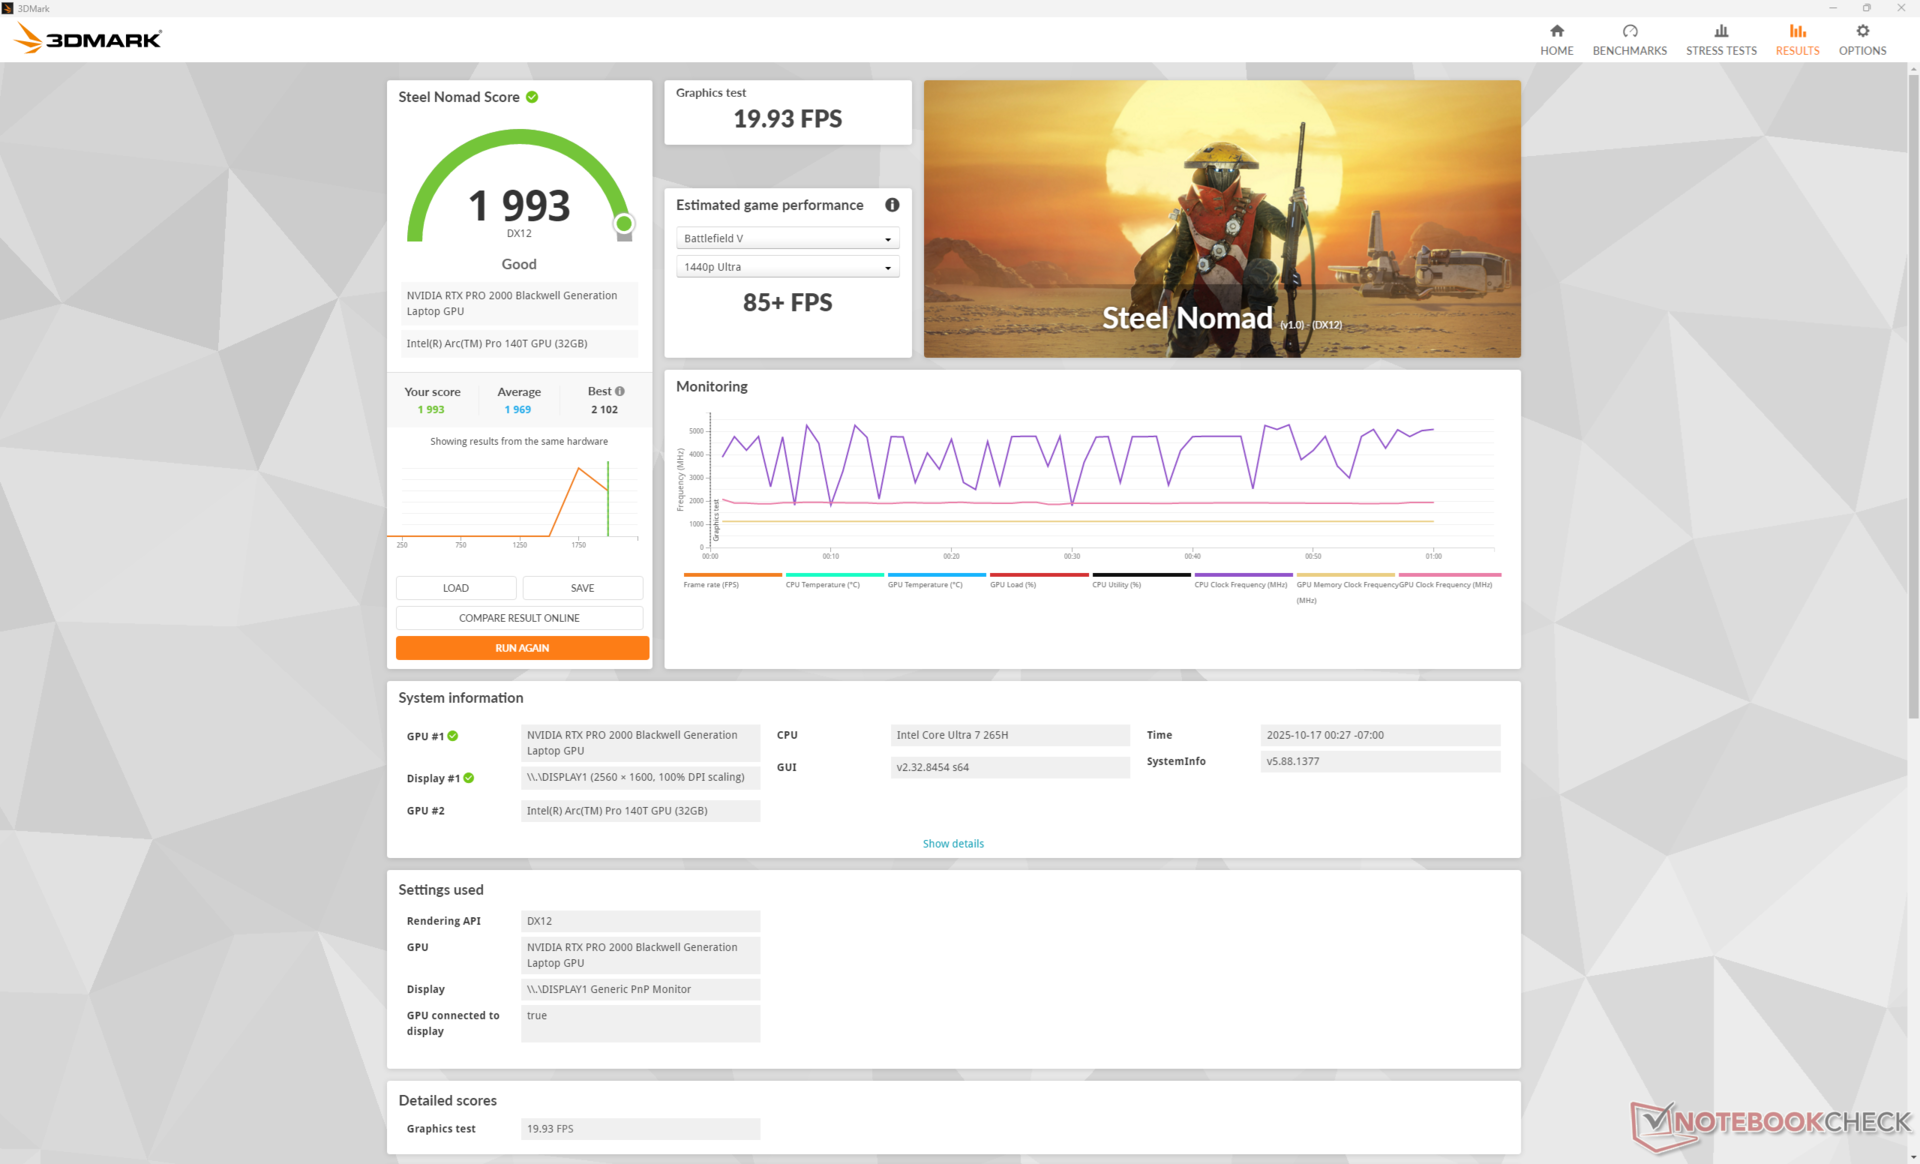
| 3DMark 11 Performance | 29591 puan | |
| 3DMark Cloud Gate Standard Score | 60675 puan | |
| 3DMark Fire Strike Score | 23035 puan | |
| 3DMark Time Spy Score | 9627 puan | |
| 3DMark Steel Nomad Score | 1993 puan | |
Yardım | ||
* ... daha küçük daha iyidir
| Performance rating - Percent | |
| Dell Pro Max 16 Plus | |
| Lenovo ThinkPad P16 Gen 2 | |
| Dell Precision 5690 -1! | |
| HP ZBook X G1i 16 | |
| HP ZBook Studio 16 G11 | |
| HP ZBook Power 16 G11 A | |
| Cyberpunk 2077 - 1920x1080 Ultra Preset (FSR off) | |
| Dell Pro Max 16 Plus | |
| Dell Precision 5690 | |
| Lenovo ThinkPad P16 Gen 2 | |
| HP ZBook X G1i 16 | |
| HP ZBook Studio 16 G11 | |
| HP ZBook Power 16 G11 A | |
| Baldur's Gate 3 - 1920x1080 Ultra Preset AA:T | |
| Dell Pro Max 16 Plus | |
| Lenovo ThinkPad P16 Gen 2 | |
| Dell Precision 5690 | |
| HP ZBook Studio 16 G11 | |
| HP ZBook X G1i 16 | |
| HP ZBook Power 16 G11 A | |
| GTA V - 1920x1080 Highest AA:4xMSAA + FX AF:16x | |
| Dell Pro Max 16 Plus | |
| Lenovo ThinkPad P16 Gen 2 | |
| HP ZBook X G1i 16 | |
| HP ZBook Studio 16 G11 | |
| HP ZBook Power 16 G11 A | |
| Final Fantasy XV Benchmark - 1920x1080 High Quality | |
| Dell Pro Max 16 Plus | |
| Lenovo ThinkPad P16 Gen 2 | |
| Dell Precision 5690 | |
| HP ZBook X G1i 16 | |
| HP ZBook Studio 16 G11 | |
| HP ZBook Power 16 G11 A | |
| Strange Brigade - 1920x1080 ultra AA:ultra AF:16 | |
| Lenovo ThinkPad P16 Gen 2 | |
| Dell Pro Max 16 Plus | |
| Dell Precision 5690 | |
| HP ZBook Studio 16 G11 | |
| HP ZBook X G1i 16 | |
| HP ZBook Power 16 G11 A | |
| Dota 2 Reborn - 1920x1080 ultra (3/3) best looking | |
| Dell Pro Max 16 Plus | |
| Lenovo ThinkPad P16 Gen 2 | |
| HP ZBook Studio 16 G11 | |
| HP ZBook X G1i 16 | |
| Dell Precision 5690 | |
| HP ZBook Power 16 G11 A | |
| X-Plane 11.11 - 1920x1080 high (fps_test=3) | |
| Lenovo ThinkPad P16 Gen 2 | |
| Dell Pro Max 16 Plus | |
| Dell Precision 5690 | |
| HP ZBook Studio 16 G11 | |
| HP ZBook X G1i 16 | |
| HP ZBook Power 16 G11 A | |
Cyberpunk 2077 ultra FPS Tablosu
| düşük | orta | yüksek | ultra | QHD DLSS | QHD | |
|---|---|---|---|---|---|---|
| GTA V (2015) | 186.2 | 183.1 | 177.8 | 112.7 | 88.4 | |
| Dota 2 Reborn (2015) | 170.1 | 158.1 | 151.1 | 141.8 | ||
| Final Fantasy XV Benchmark (2018) | 206 | 129.5 | 100.2 | 71 | ||
| X-Plane 11.11 (2018) | 102 | 92.2 | 80.6 | |||
| Strange Brigade (2018) | 480 | 252 | 198.7 | 171.3 | 119.2 | |
| Baldur's Gate 3 (2023) | 116.1 | 99.7 | 89.6 | 89.5 | 90 | 60.4 |
| Cyberpunk 2077 (2023) | 112.5 | 93.5 | 80 | 72.1 | 52.4 | 43.6 |
| F1 24 (2024) | 214 | 205 | 161.4 | 48.2 | 48.8 | 32.2 |
Emisyonlar
Sistem Gürültüsü
Fanlar iddiasız yükleri çalıştırırken uyuşuktur, ancak Cyberpunk 2077 gibi daha zorlu yükleri uzun süre çalıştırırken 50 dB(A)'nın biraz üzerinde oldukça gürültülü olabilirler.
Ses yüksekliği
| Boşta |
| 23.7 / 23.7 / 23.7 dB |
| Çalışırken |
| 32.7 / 48 dB |
 | ||
30 dB sessiz 40 dB(A) duyulabilirlik 50 dB(A) gürültülü |
||
min: | ||
| HP ZBook X G1i 16 RTX PRO 2000 Blackwell Generation Laptop, Ultra 7 265H, Samsung PM9A1 MZVL22T0HBLB | HP ZBook Power 16 G11 A RTX 2000 Ada Generation Laptop, R7 8845HS, Samsung PM9A1 MZVL22T0HBLB | HP ZBook Studio 16 G11 RTX 3000 Ada Generation Laptop, Ultra 9 185H, Kioxia XG8 KXG80ZNV1T02 | Lenovo ThinkPad P16 Gen 2 RTX 4000 Ada Generation Laptop, i7-14700HX, SK hynix PC801 HFS001TEJ9X162N | Dell Pro Max 16 Plus RTX PRO 5000 Blackwell Generation Laptop, Ultra 9 285HX, SK hynix PCB01 HFS001TFM9X186N | Dell Precision 5690 RTX 5000 Ada Generation Laptop, Ultra 9 185H, 2x Samsung PM9A1 1TB (RAID 0) | |
|---|---|---|---|---|---|---|
| Noise | 6% | -4% | -16% | -18% | -11% | |
| kapalı / ortam * (dB) | 23.7 | 23.5 1% | 23.8 -0% | 23.9 -1% | 23.2 2% | 23.4 1% |
| Idle Minimum * (dB) | 23.7 | 23.8 -0% | 23.8 -0% | 29.1 -23% | 26.7 -13% | 23.6 -0% |
| Idle Average * (dB) | 23.7 | 24.2 -2% | 26.4 -11% | 29.1 -23% | 30.5 -29% | 24.9 -5% |
| Idle Maximum * (dB) | 23.7 | 24.2 -2% | 26.4 -11% | 29.1 -23% | 34 -43% | 30.9 -30% |
| Load Average * (dB) | 32.7 | 25.4 22% | 33.7 -3% | 41 -25% | 39.8 -22% | 40.4 -24% |
| Cyberpunk 2077 ultra * (dB) | 50.9 | 43 16% | 46.1 9% | 52.8 -4% | 54.3 -7% | |
| Load Maximum * (dB) | 48 | 45 6% | 53.2 -11% | 52.9 -10% | 54.3 -13% | 51.9 -8% |
| Witcher 3 ultra * (dB) | 48.3 |
* ... daha küçük daha iyidir
Sıcaklık
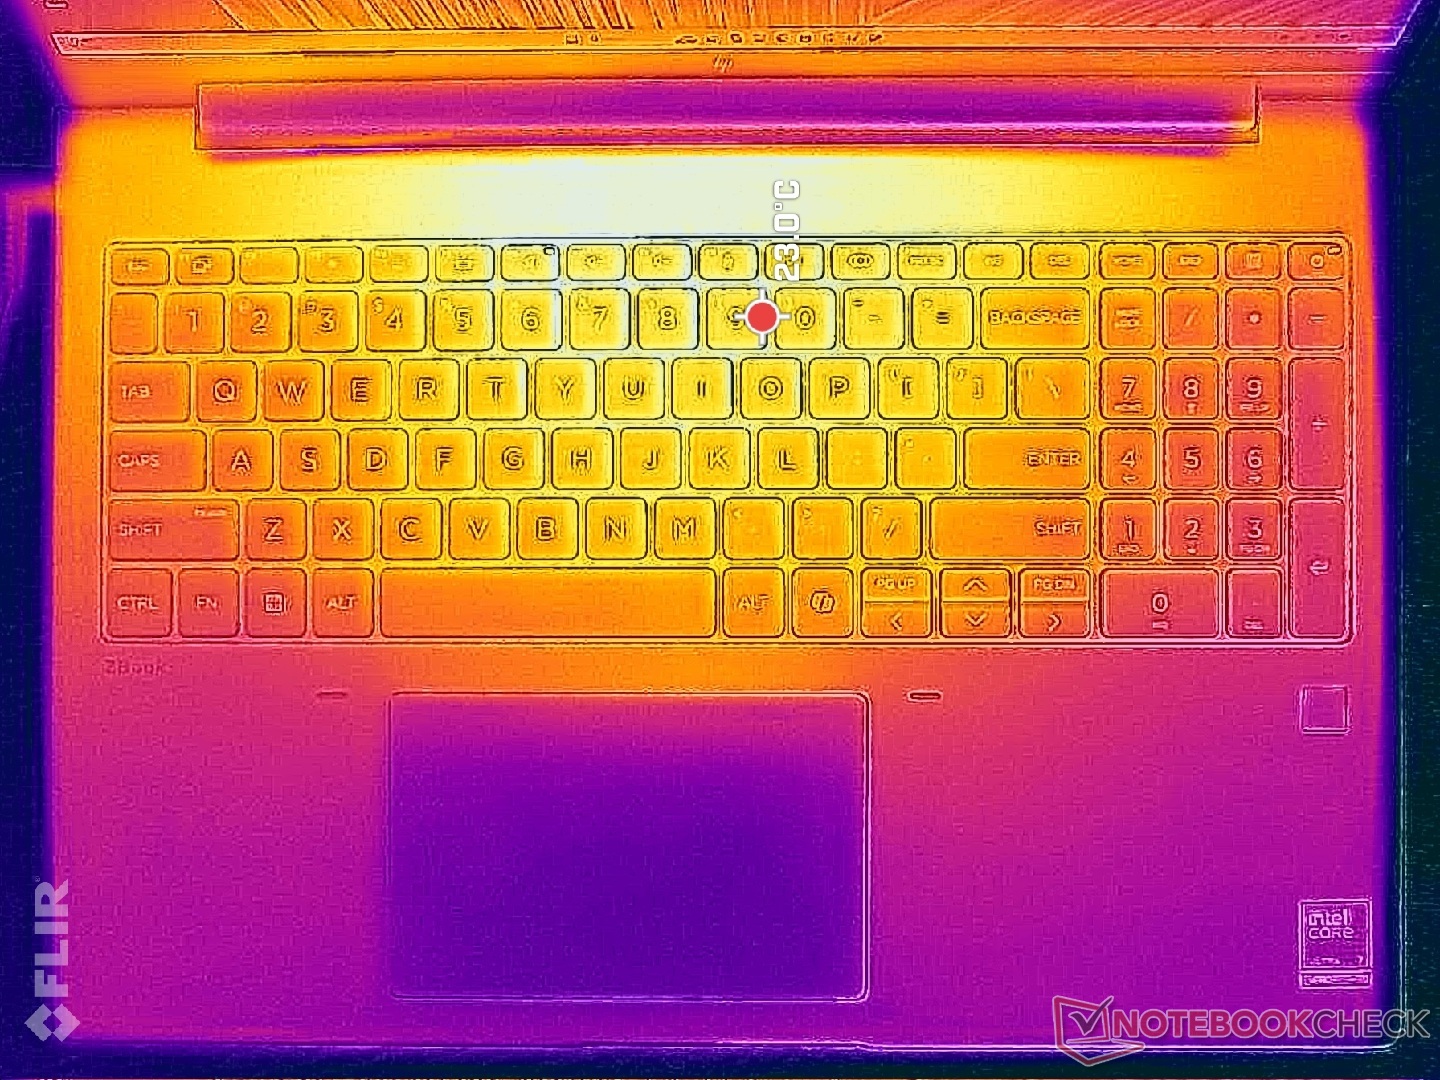
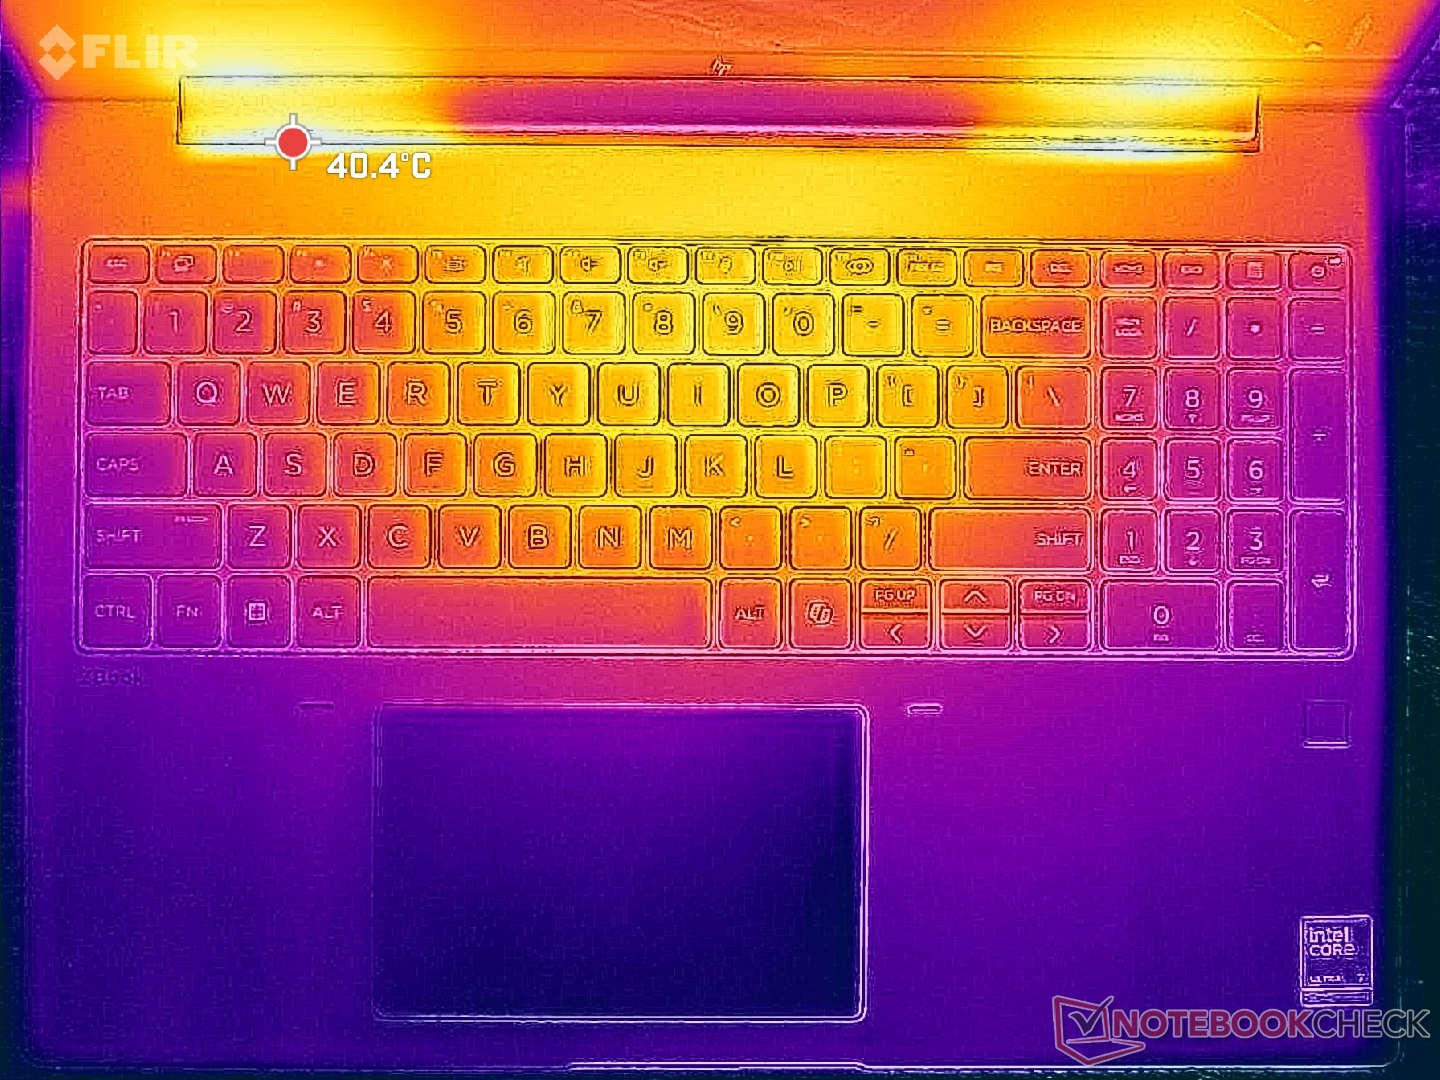
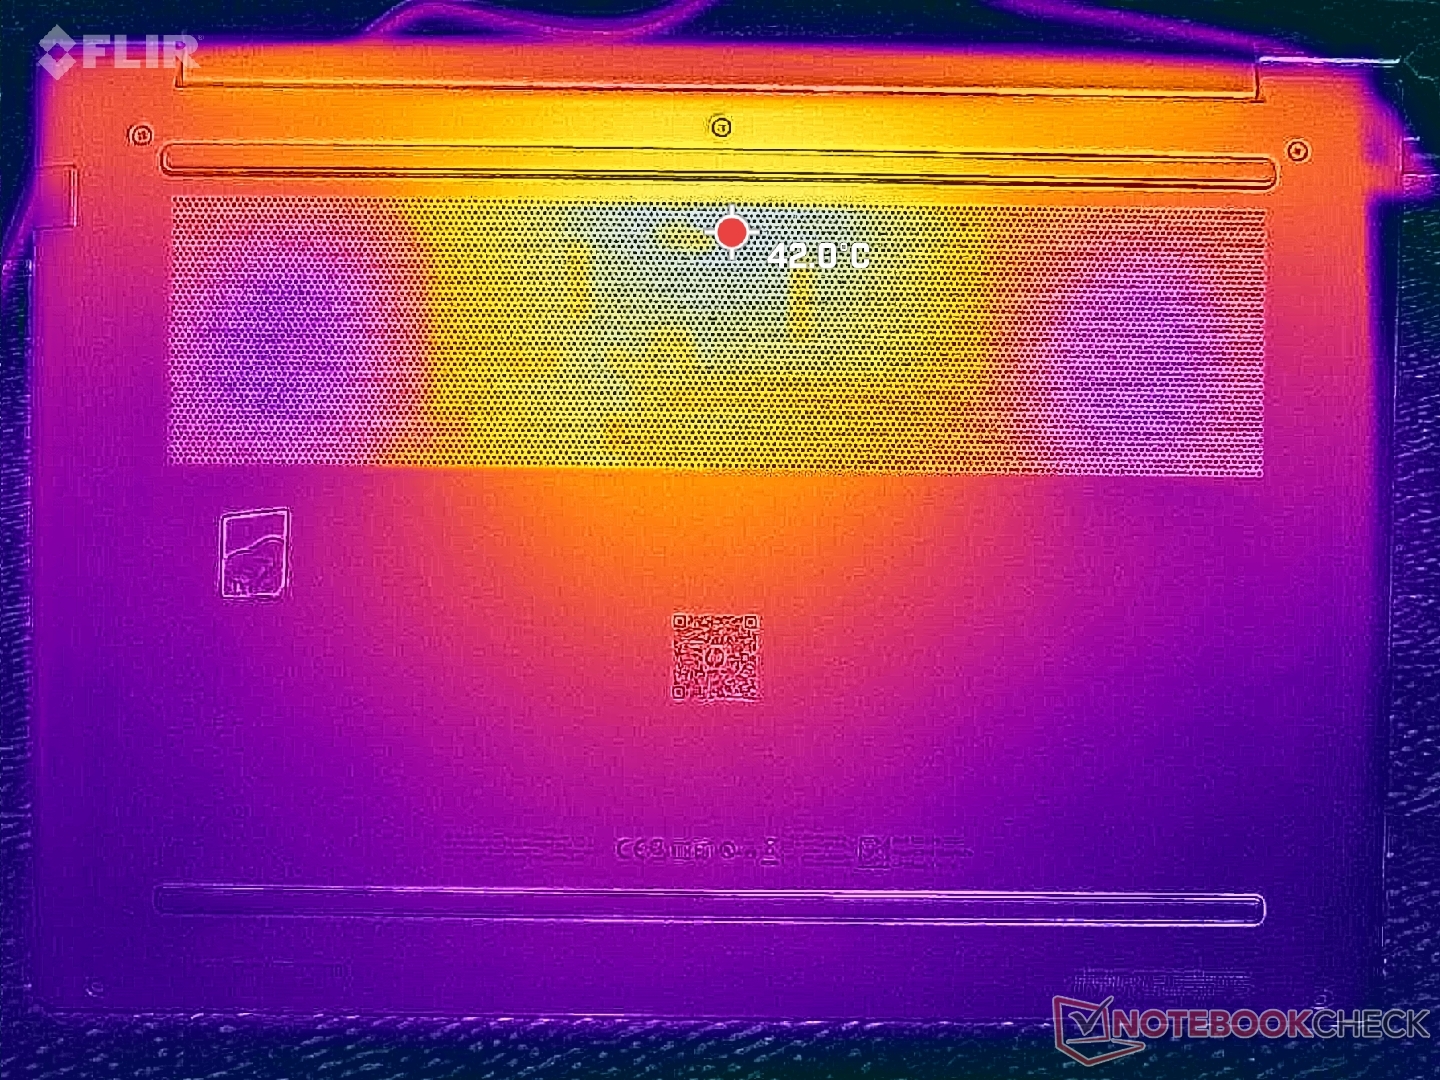
Yüzey sıcaklığı gelişimi en sıcak merkeze doğru olup, zorlu yükleri çalıştırırken 36 C'nin üzerine çıkabilmektedir ki bu da bizim kaydettiğimizden önemli ölçüde daha soğuktur ThinkPad P16 Gen 2 veya Dell Precision 5690.
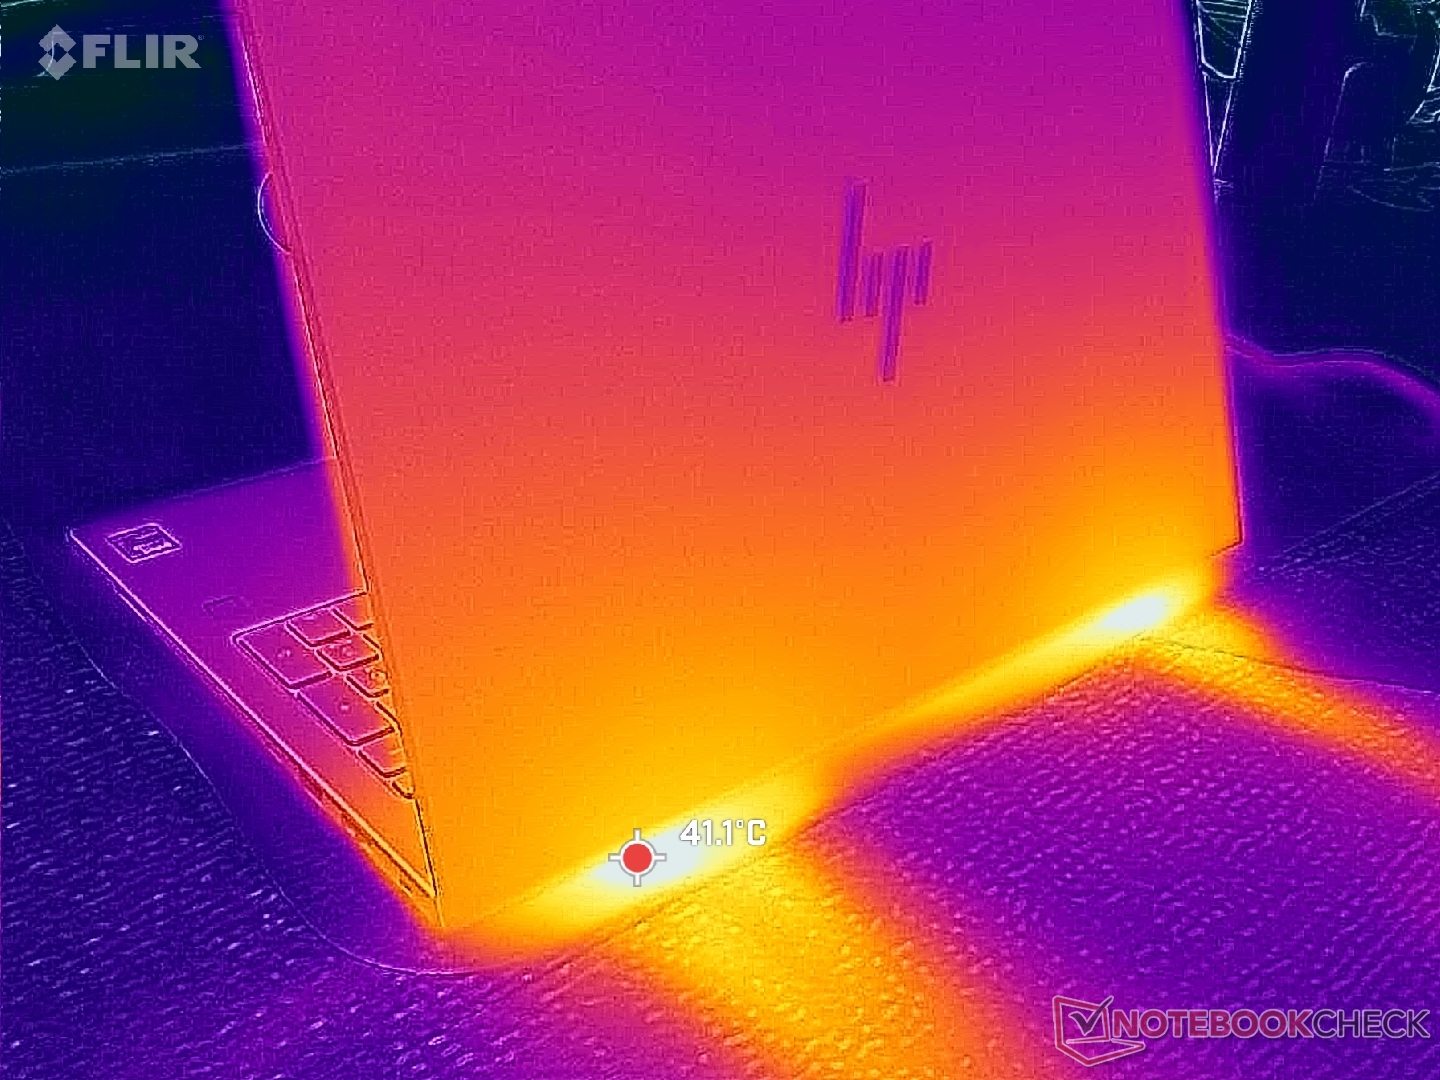
(+) Üst taraftaki maksimum sıcaklık, 38.2 °C / 101 F ortalamasına kıyasla 36 °C / 97 F'dir. , Workstation sınıfı için 22.2 ile 69.8 °C arasında değişir.
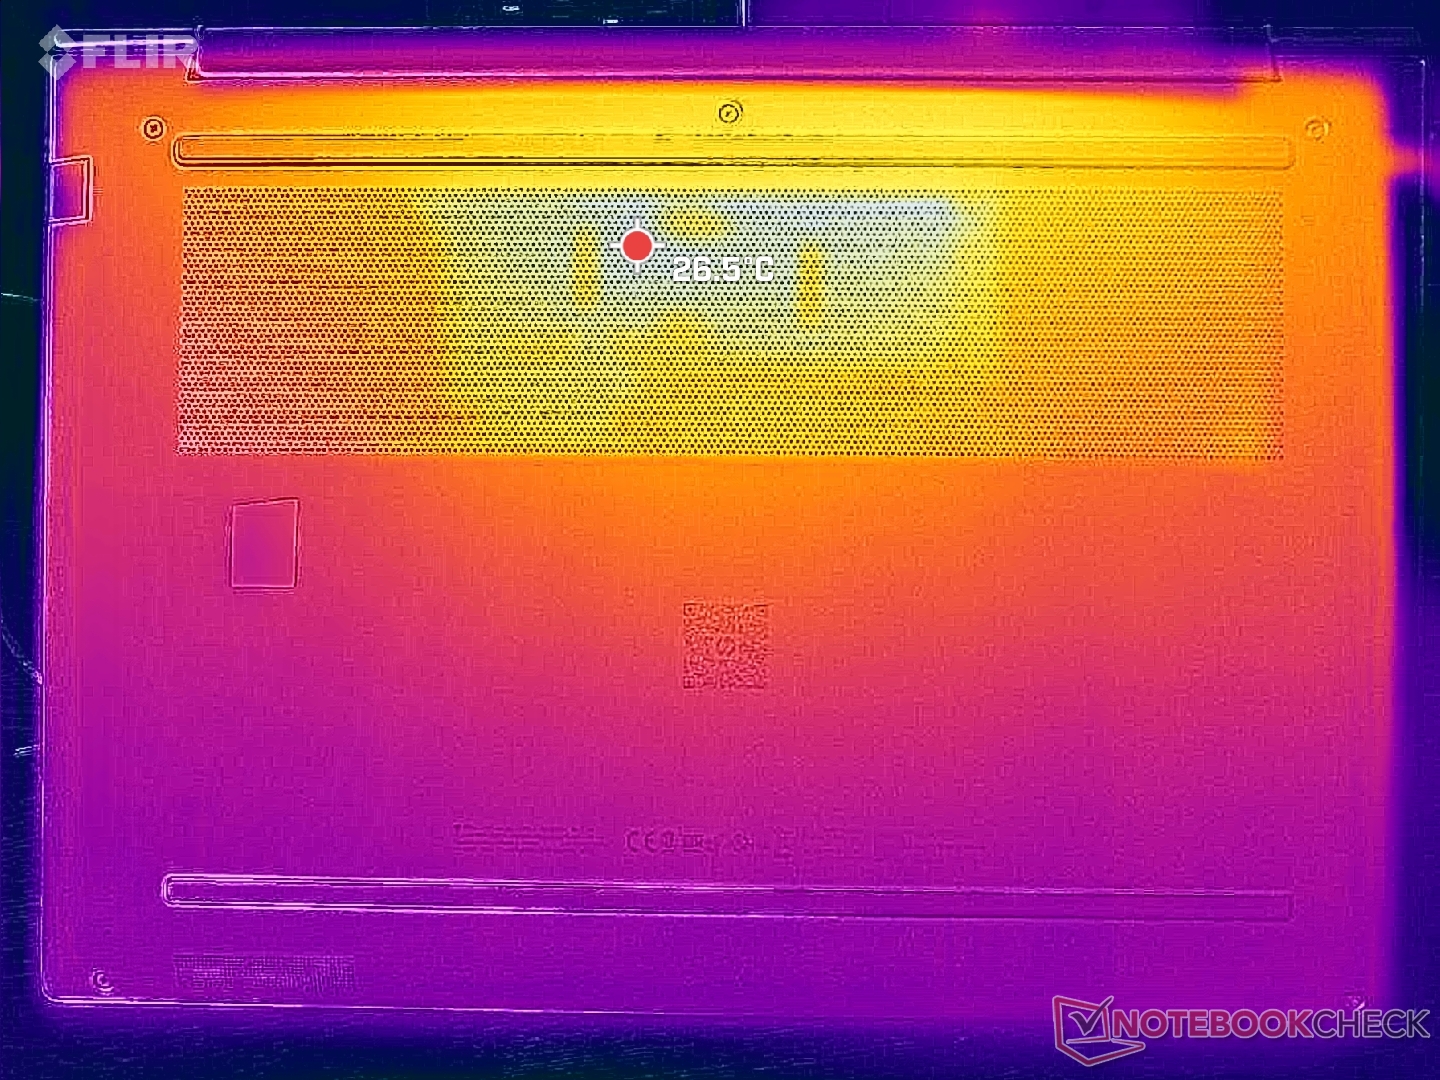
(+) Alt kısım, 41.1 °C / 106 F ortalamasına kıyasla maksimum 39.4 °C / 103 F'ye kadar ısınır
(+) Boşta kullanımda, üst tarafın ortalama sıcaklığı 26.9 °C / 80 F olup, cihazın 32 °C / 90 F.
(+) Avuç içi dayanakları ve dokunmatik yüzey, maksimum 24.2 °C / 75.6 F ile cilt sıcaklığından daha soğuktur ve bu nedenle dokunulduğunda soğuktur.
(+) Benzer cihazların avuç içi dayanağı alanının ortalama sıcaklığı 27.8 °C / 82 F (+3.6 °C / 6.4 F) idi.
| HP ZBook X G1i 16 Intel Core Ultra 7 265H, NVIDIA RTX PRO 2000 Blackwell Generation Laptop | HP ZBook Power 16 G11 A AMD Ryzen 7 8845HS, NVIDIA RTX 2000 Ada Generation Laptop | HP ZBook Studio 16 G11 Intel Core Ultra 9 185H, NVIDIA RTX 3000 Ada Generation Laptop | Lenovo ThinkPad P16 Gen 2 Intel Core i7-14700HX, NVIDIA RTX 4000 Ada Generation Laptop | Dell Pro Max 16 Plus Intel Core Ultra 9 285HX, NVIDIA RTX PRO 5000 Blackwell Generation Laptop | Dell Precision 5690 Intel Core Ultra 9 185H, NVIDIA RTX 5000 Ada Generation Laptop | |
|---|---|---|---|---|---|---|
| Heat | 4% | -10% | -5% | -10% | -3% | |
| Maximum Upper Side * (°C) | 36 | 40.6 -13% | 36.6 -2% | 46.6 -29% | 40.4 -12% | 46.6 -29% |
| Maximum Bottom * (°C) | 39.4 | 40.6 -3% | 47.8 -21% | 51 -29% | 45.6 -16% | 33 16% |
| Idle Upper Side * (°C) | 30.4 | 26 14% | 31.4 -3% | 24.8 18% | 32.8 -8% | 32.4 -7% |
| Idle Bottom * (°C) | 31.8 | 26.6 16% | 35.6 -12% | 25.6 19% | 33 -4% | 29.4 8% |
* ... daha küçük daha iyidir
Stres Testi
CPU, Prime95 stresini başlatırken 3,6 GHz, 108 W ve 104 C'ye yükseliyor ve birkaç dakika sonra 3,0 GHz, 62 W ve 88 C'ye düşüp sabitlenerek sınırlı maksimum Turbo Boost sürdürülebilirliğini temsil ediyordu. İlginç bir şekilde, Prime95 ve FurMark aynı anda çalıştırıldığında CPU saat hızları dönerken GPU saat hızları sabit kalıyordu.
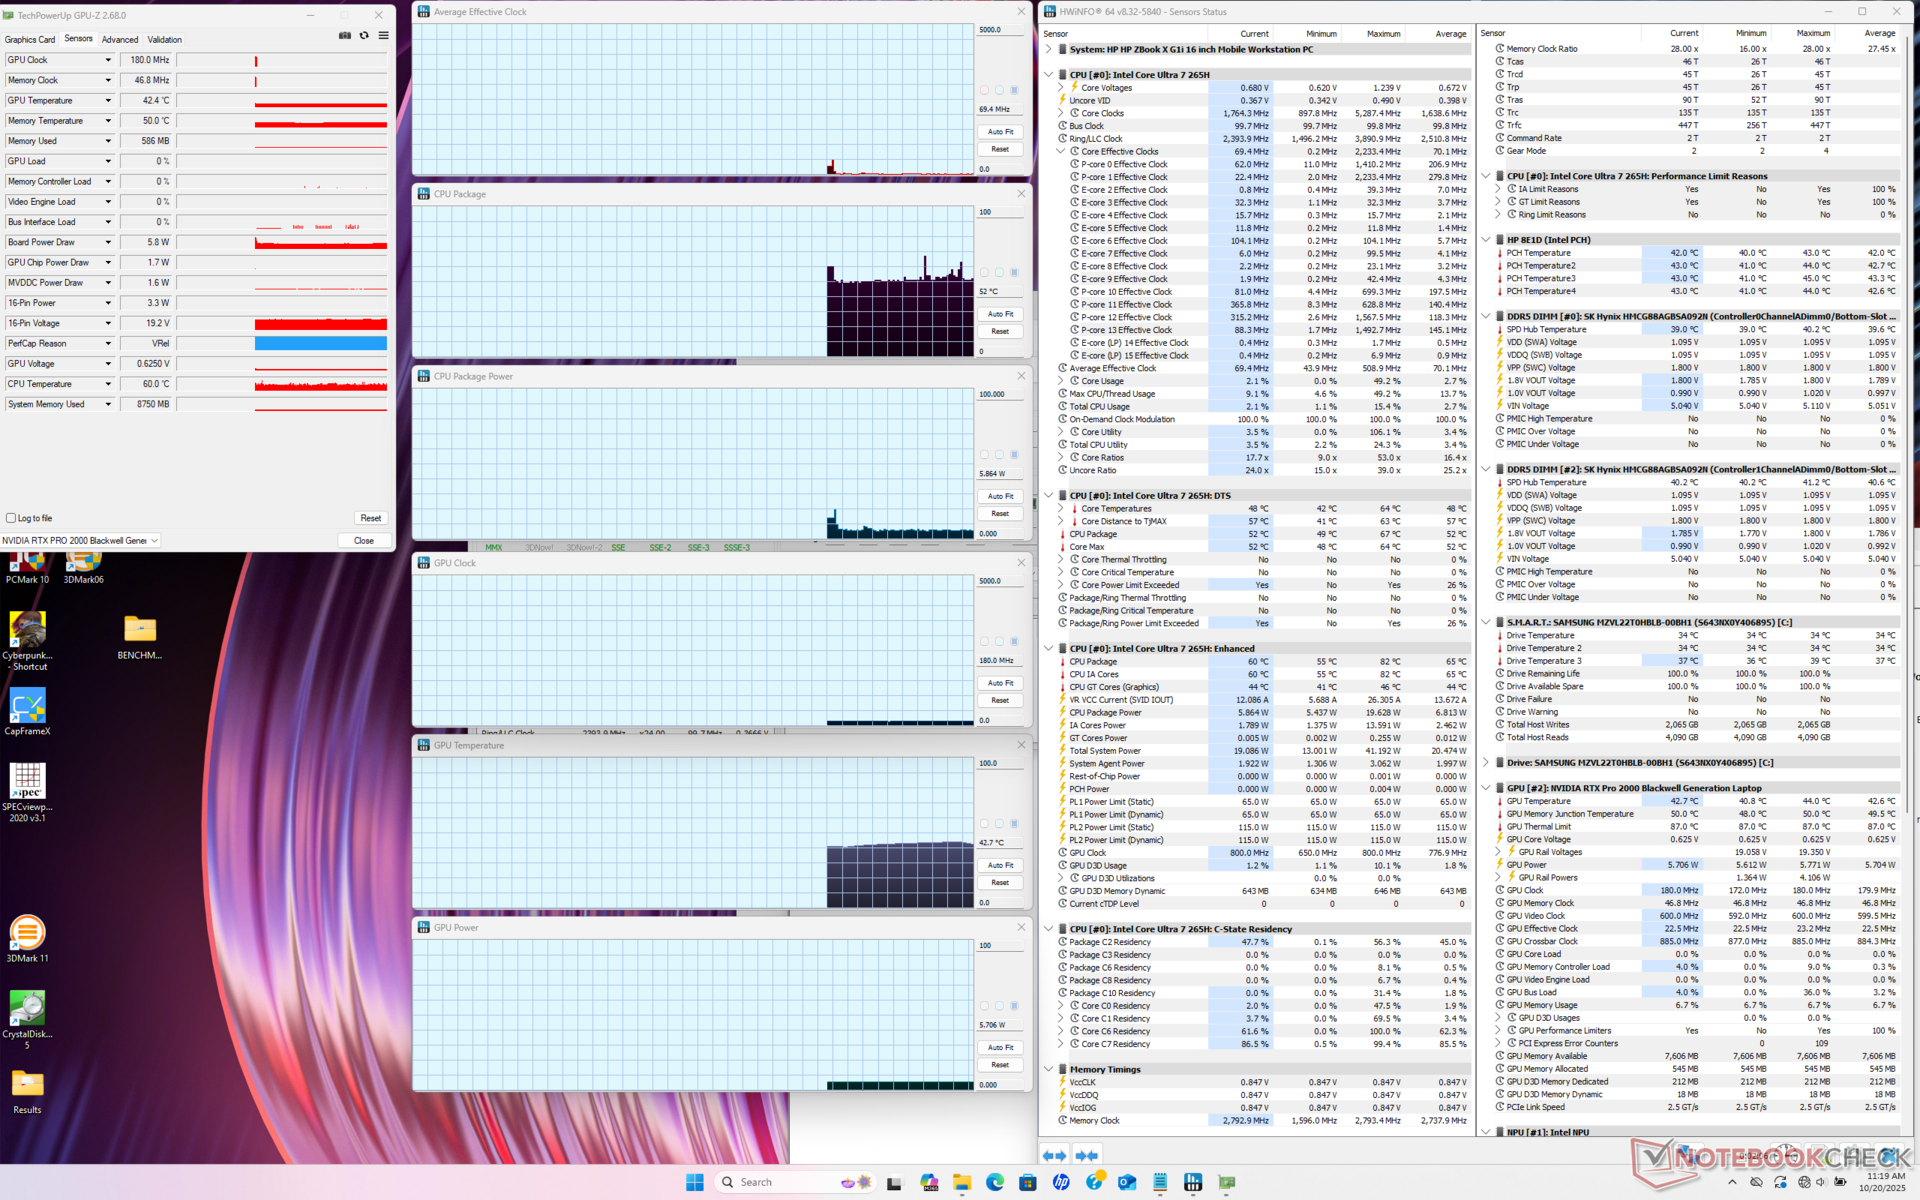
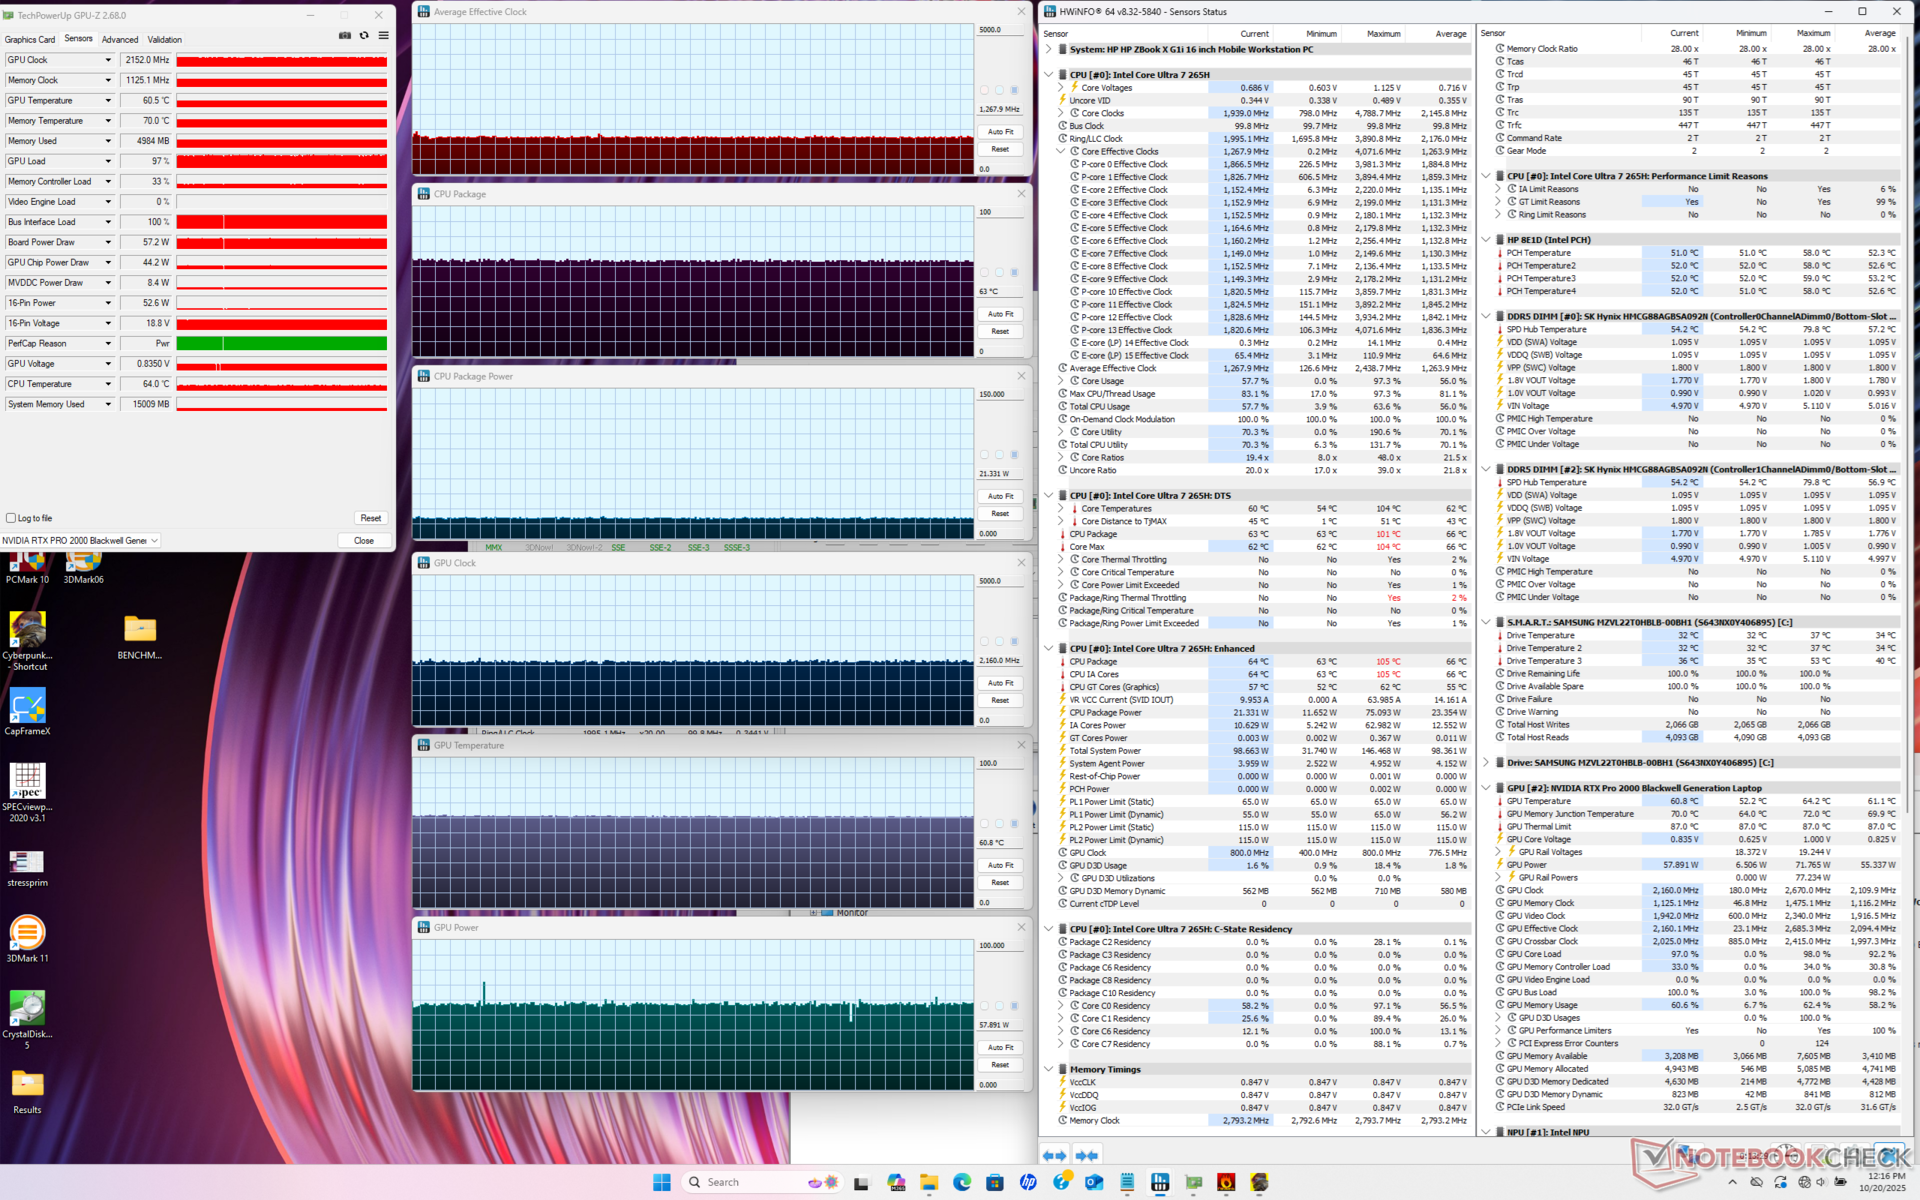
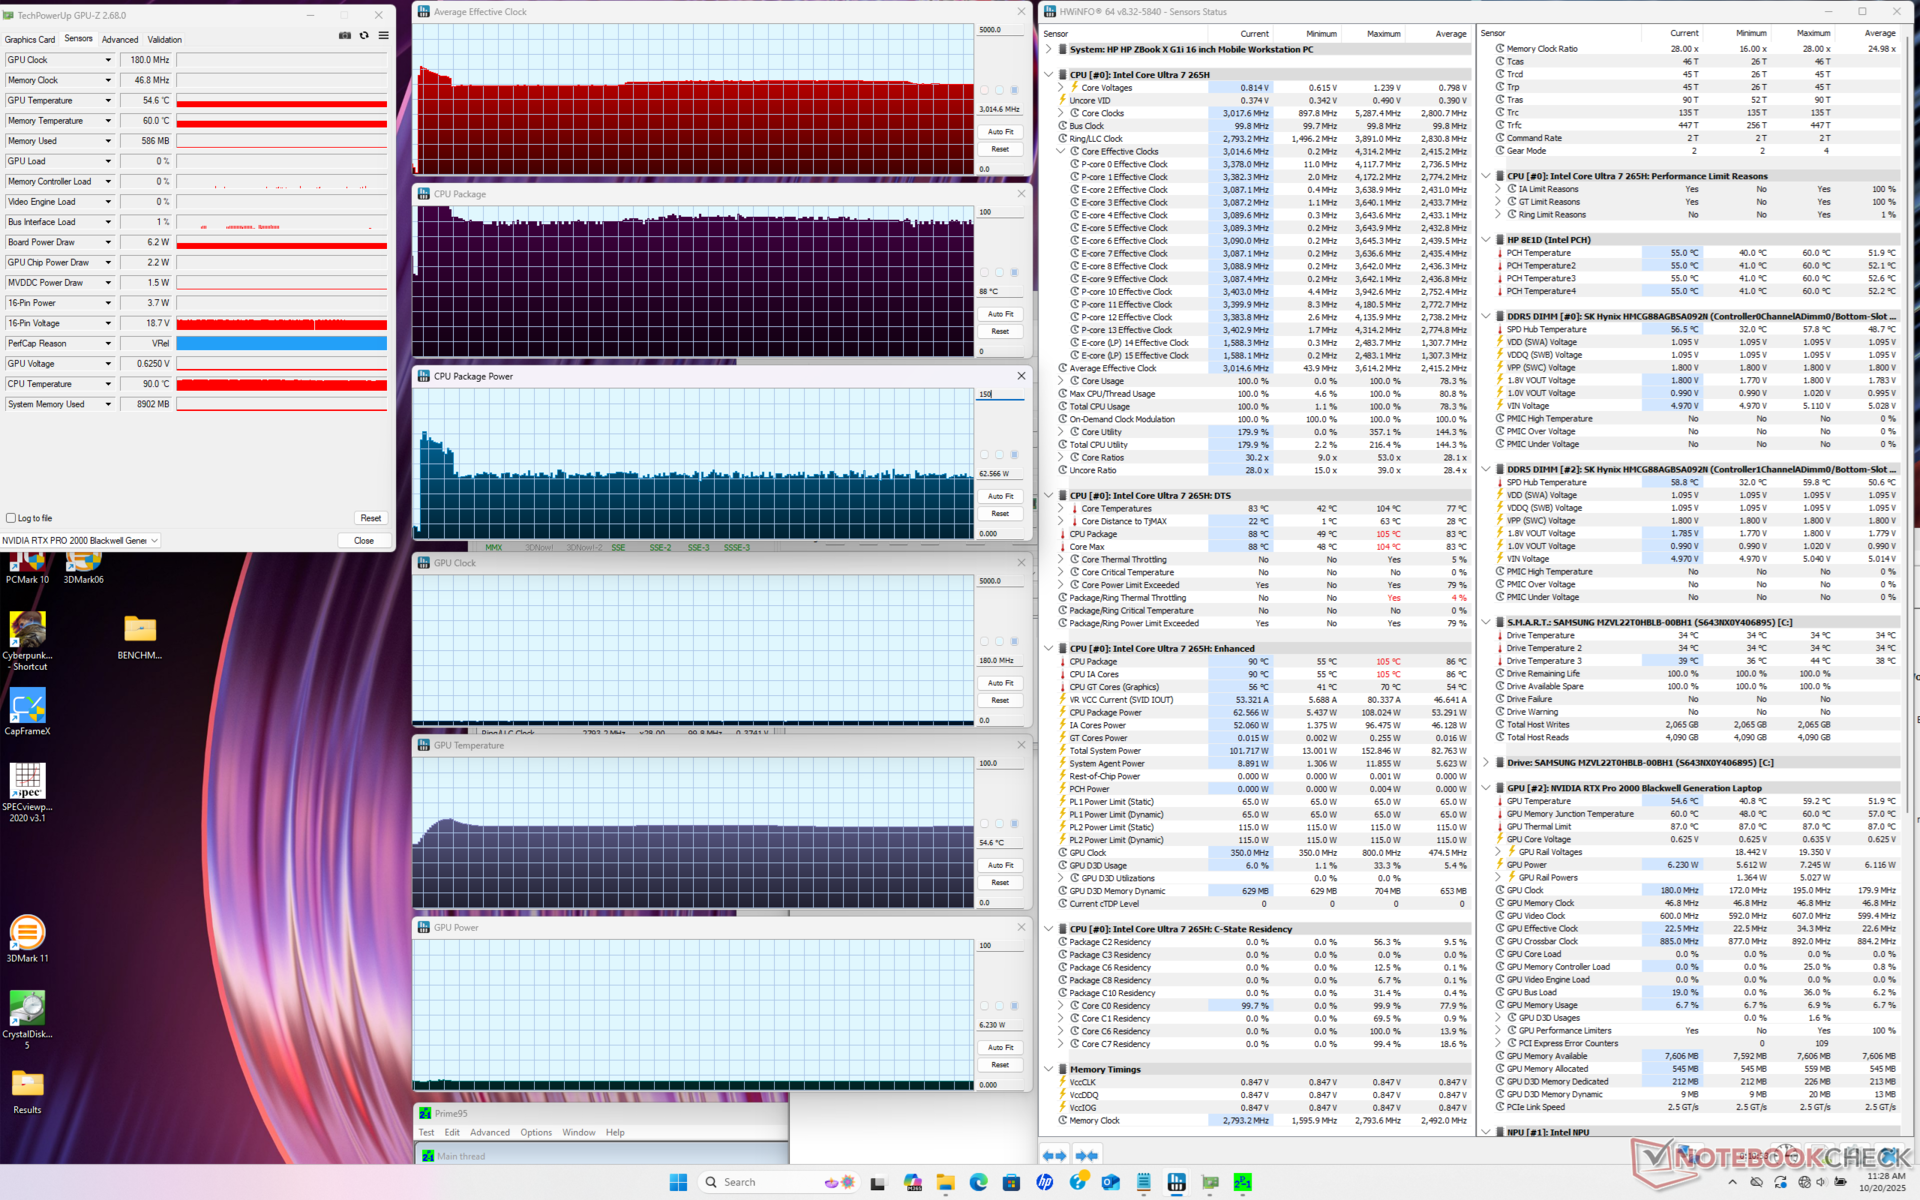

| Ortalama CPU Saati (GHz) | GPU Saati (MHz) | Ortalama CPU Sıcaklığı (°C) | Ortalama GPU Sıcaklığı (°C) | |
| Sistem Boşta | -- | -- | 52 | 43 |
| Prime95 Stres | 3.0 | -- | 88 | 55 |
| Prime95 + FurMark Stres | 2,5 - 2,9 | 1215 | 83 - 91 | 65 |
| Cyberpunk 2077 Stres | 1.3 | 2160 | 63 | 61 |
Konuşmacılar
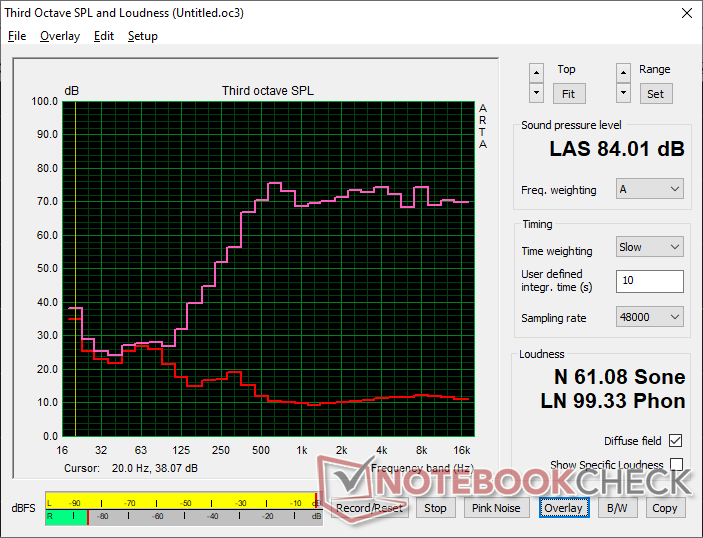
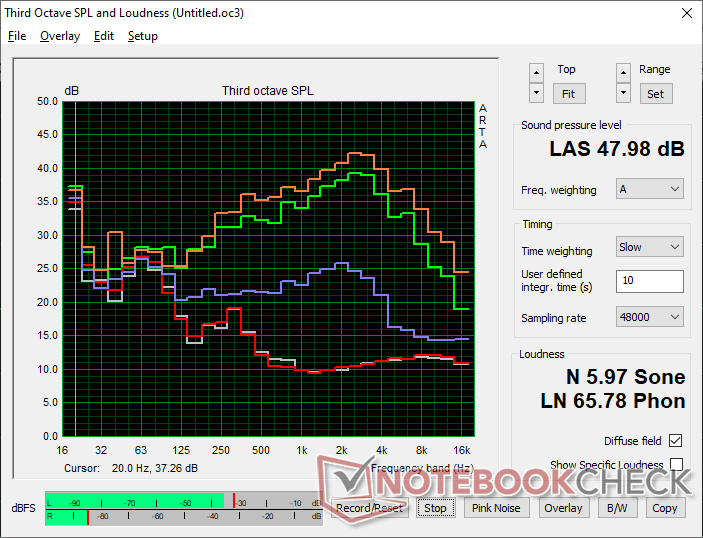
HP ZBook X G1i 16 ses analizi
(+) | hoparlörler nispeten yüksek sesle çalabilir (84 dB)
Bas 100 - 315Hz
(-) | neredeyse hiç bas yok - ortalama olarak medyandan 28% daha düşük
(±) | Bas doğrusallığı ortalamadır (8.8% delta - önceki frekans)
Ortalar 400 - 2000 Hz
(+) | dengeli ortalar - medyandan yalnızca 1.9% uzakta
(+) | orta frekanslar doğrusaldır (6.1% deltadan önceki frekansa)
Yüksekler 2 - 16 kHz
(+) | dengeli yüksekler - medyandan yalnızca 2.9% uzakta
(+) | yüksekler doğrusaldır (5.1% deltadan önceki frekansa)
Toplam 100 - 16.000 Hz
(±) | Genel sesin doğrusallığı ortalamadır (15.6% ortancaya göre fark)
Aynı sınıfla karşılaştırıldığında
» Bu sınıftaki tüm test edilen cihazların %35%'si daha iyi, 11% benzer, 54% daha kötüydü
» En iyisinin deltası 7% idi, ortalama 17% idi, en kötüsü 35% idi
Test edilen tüm cihazlarla karşılaştırıldığında
» Test edilen tüm cihazların %23'si daha iyi, 5 benzer, % 72 daha kötüydü
» En iyisinin deltası 4% idi, ortalama 23% idi, en kötüsü 134% idi
Apple MacBook Pro 16 2021 M1 Pro ses analizi
(+) | hoparlörler nispeten yüksek sesle çalabilir (84.7 dB)
Bas 100 - 315Hz
(+) | iyi bas - medyandan yalnızca 3.8% uzakta
(+) | bas doğrusaldır (5.2% delta ile önceki frekans)
Ortalar 400 - 2000 Hz
(+) | dengeli ortalar - medyandan yalnızca 1.3% uzakta
(+) | orta frekanslar doğrusaldır (2.1% deltadan önceki frekansa)
Yüksekler 2 - 16 kHz
(+) | dengeli yüksekler - medyandan yalnızca 1.9% uzakta
(+) | yüksekler doğrusaldır (2.7% deltadan önceki frekansa)
Toplam 100 - 16.000 Hz
(+) | genel ses doğrusaldır (4.6% ortancaya göre fark)
Aynı sınıfla karşılaştırıldığında
» Bu sınıftaki tüm test edilen cihazların %0%'si daha iyi, 0% benzer, 100% daha kötüydü
» En iyisinin deltası 5% idi, ortalama 17% idi, en kötüsü 45% idi
Test edilen tüm cihazlarla karşılaştırıldığında
» Test edilen tüm cihazların %0'si daha iyi, 0 benzer, % 100 daha kötüydü
» En iyisinin deltası 4% idi, ortalama 23% idi, en kötüsü 134% idi
Enerji Yönetimi
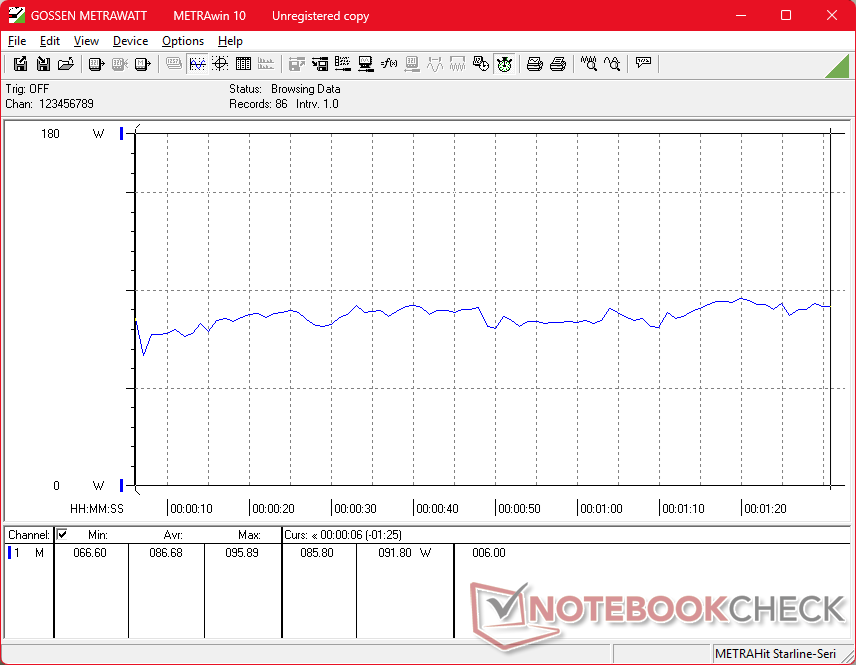
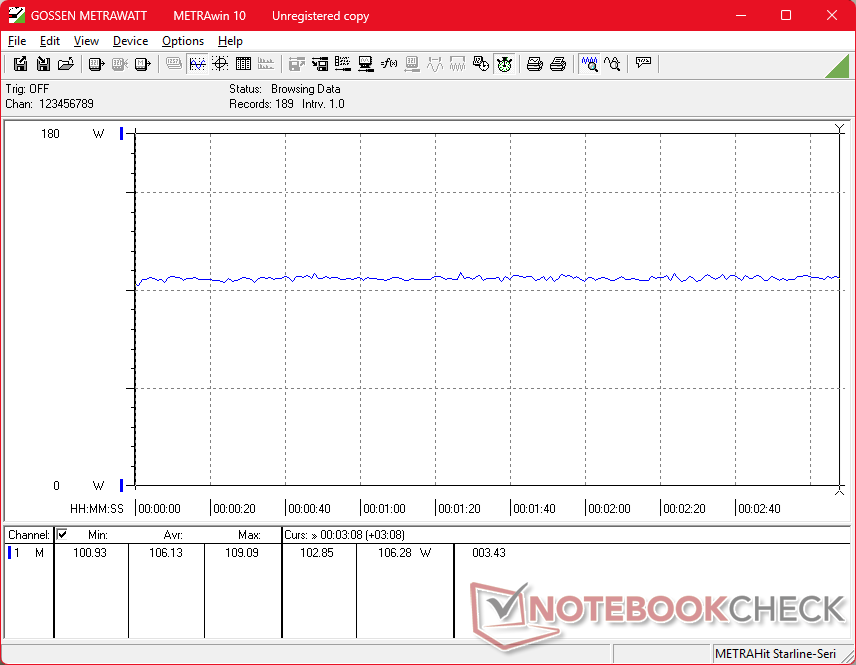
Güç Tüketimi
Yük altındayken tüketim, AMD destekli eski modellerde kaydettiğimiz tüketimden ortalama olarak biraz daha yüksektir ZBook Power 16 G11 A. Bununla birlikte, ZBook X G1i 16 aynı zamanda daha hızlı ve daha yalın bir makinedir ve bu nedenle watt başına yüksek performans korunur.
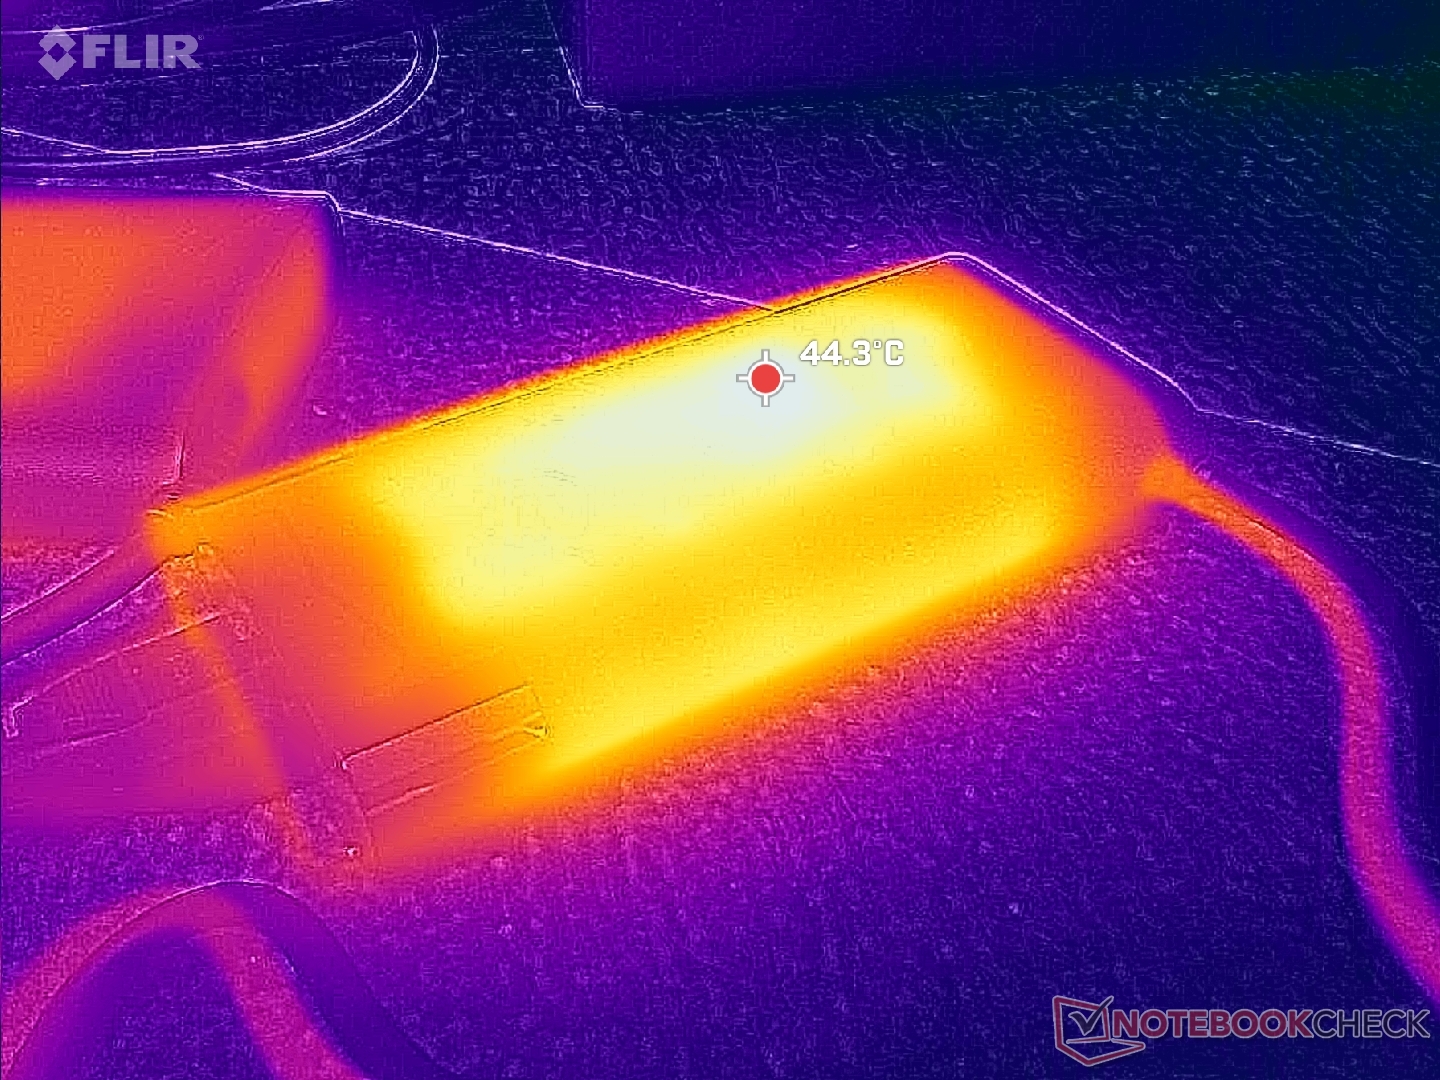
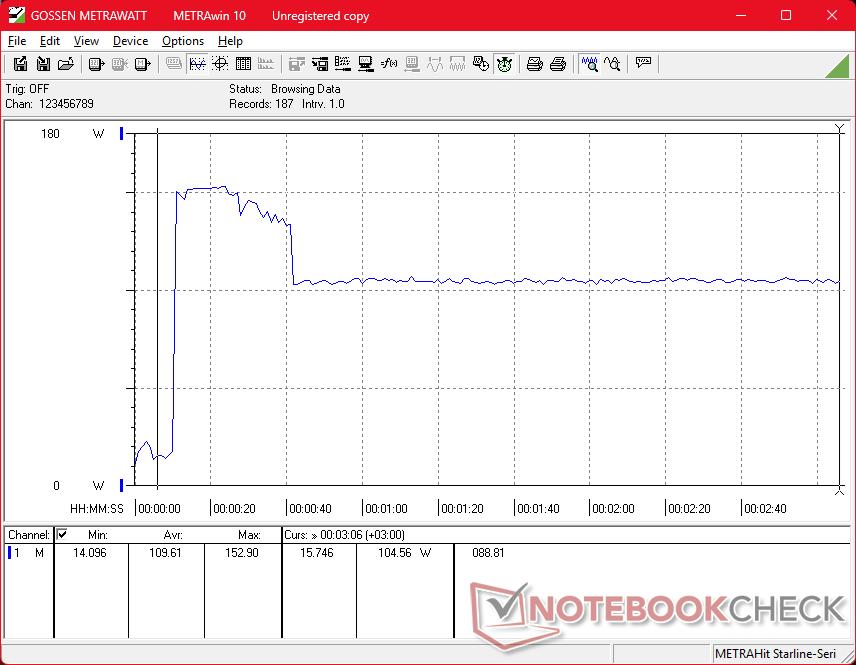
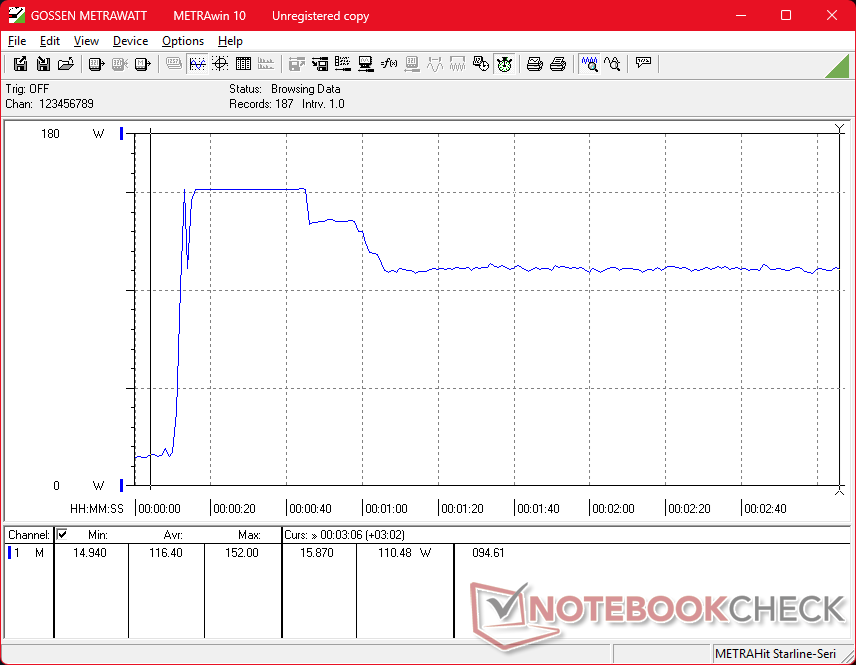
CPU ve GPU tamamen zorlandığında küçük (~13,8 x 6,5 x 2,2 cm) 150 W AC adaptörden geçici olarak 153 W maksimum çekişi ölçebiliyoruz.
| Kapalı / Bekleme modu | |
| Boşta | |
| Çalışırken |
|
Key:
min: | |
| HP ZBook X G1i 16 Ultra 7 265H, RTX PRO 2000 Blackwell Generation Laptop, Samsung PM9A1 MZVL22T0HBLB, IPS, 2560x1600, 16" | HP ZBook Power 16 G11 A R7 8845HS, RTX 2000 Ada Generation Laptop, Samsung PM9A1 MZVL22T0HBLB, IPS, 2560x1600, 16" | HP ZBook Studio 16 G11 Ultra 9 185H, RTX 3000 Ada Generation Laptop, Kioxia XG8 KXG80ZNV1T02, IPS, 3840x2400, 16" | Lenovo ThinkPad P16 Gen 2 i7-14700HX, RTX 4000 Ada Generation Laptop, SK hynix PC801 HFS001TEJ9X162N, IPS, 2560x1600, 16" | Dell Pro Max 16 Plus Ultra 9 285HX, RTX PRO 5000 Blackwell Generation Laptop, SK hynix PCB01 HFS001TFM9X186N, OLED, 3840x2400, 16" | Dell Precision 5690 Ultra 9 185H, RTX 5000 Ada Generation Laptop, 2x Samsung PM9A1 1TB (RAID 0), OLED, 3840x2400, 16" | |
|---|---|---|---|---|---|---|
| Power Consumption | 2% | -85% | -90% | -279% | -72% | |
| Idle Minimum * (Watt) | 4.1 | 4.6 -12% | 14 -241% | 7.9 -93% | 35.1 -756% | 7.9 -93% |
| Idle Average * (Watt) | 9 | 10 -11% | 22.4 -149% | 13.1 -46% | 39.2 -336% | 12 -33% |
| Idle Maximum * (Watt) | 9.4 | 10.6 -13% | 25.7 -173% | 24.2 -157% | 56 -496% | 28.6 -204% |
| Load Average * (Watt) | 86.7 | 60.9 30% | 90.2 -4% | 127.4 -47% | 130.2 -50% | 98.8 -14% |
| Cyberpunk 2077 ultra external monitor * (Watt) | 102 | 92.8 9% | 120.3 -18% | 219 -115% | 213 -109% | |
| Cyberpunk 2077 ultra * (Watt) | 106.1 | 96.8 9% | 125.4 -18% | 225 -112% | 229 -116% | |
| Load Maximum * (Watt) | 152.9 | 154.8 -1% | 142 7% | 248.5 -63% | 285.2 -87% | 174.8 -14% |
| Witcher 3 ultra * (Watt) | 144.5 |
* ... daha küçük daha iyidir
Güç Tüketimi Cyberpunk / Stres Testi
Güç Tüketimi harici Monitör
Pil Ömrü
WLAN çalışma süresi 12,5 saat ile mükemmeldir ve son nesil Precision 5690 veya ZBook Power 16 G11 A'dan birkaç saat daha uzun ömürlüdür.
| HP ZBook X G1i 16 Ultra 7 265H, RTX PRO 2000 Blackwell Generation Laptop, 83 Wh | HP ZBook Power 16 G11 A R7 8845HS, RTX 2000 Ada Generation Laptop, 83 Wh | HP ZBook Studio 16 G11 Ultra 9 185H, RTX 3000 Ada Generation Laptop, 86 Wh | Lenovo ThinkPad P16 Gen 2 i7-14700HX, RTX 4000 Ada Generation Laptop, 94 Wh | Dell Pro Max 16 Plus Ultra 9 285HX, RTX PRO 5000 Blackwell Generation Laptop, 96 Wh | Dell Precision 5690 Ultra 9 185H, RTX 5000 Ada Generation Laptop, 98 Wh | |
|---|---|---|---|---|---|---|
| Pil Çalışma Süresi | -22% | -62% | -80% | -71% | -26% | |
| WiFi v1.3 (h) | 12.5 | 9.7 -22% | 4.8 -62% | 2.5 -80% | 3.6 -71% | 9.2 -26% |
| Reader / Idle (h) | 26.1 | |||||
| Load (h) | 1.7 |
Notebookcheck Değerlendirmesi
Orta seviye performansa sahip yüksek kaliteli ve yalın mobil iş istasyonu.
HP ZBook X G1i 16
- 10/22/2025 v8
Allen Ngo
 Total Sustainability Score:
 Karşılaştırmada Potansiyel Rakipler
Resim | Modeli / incelemeler | Fiyat | Ağırlık | Yükseklik | Ekran |
|---|---|---|---|---|---|
1. 87.4%  | HP ZBook X G1i 16 Intel Core Ultra 7 265H ⎘ NVIDIA RTX PRO 2000 Blackwell Generation Laptop ⎘ 64 GB Bellek, 2048 GB SSD | Amazon: Liste fiyatı: 2700 USD | 2.2 kg | 23 mm | 16.00" 2560x1600 189 PPI IPS |
2. 85.4%  | HP ZBook Power 16 G11 A AMD Ryzen 7 8845HS ⎘ NVIDIA RTX 2000 Ada Generation Laptop ⎘ 64 GB Bellek, 2048 GB SSD | Amazon: Liste fiyatı: 2100 USD | 2.2 kg | 22.9 mm | 16.00" 2560x1600 189 PPI IPS |
3. 84.2%  | HP ZBook Studio 16 G11 Intel Core Ultra 9 185H ⎘ NVIDIA RTX 3000 Ada Generation Laptop ⎘ 64 GB Bellek, 1024 GB SSD | Amazon: Liste fiyatı: 4300 USD | 1.8 kg | 19 mm | 16.00" 3840x2400 283 PPI IPS |
4. 85.9%  | Lenovo ThinkPad P16 Gen 2 Intel Core i7-14700HX ⎘ NVIDIA RTX 4000 Ada Generation Laptop ⎘ 32 GB Bellek, 1024 GB SSD | Amazon: Liste fiyatı: 3500 USD | 3.1 kg | 30.23 mm | 16.00" 2560x1600 189 PPI IPS |
5. 88.4%  | Dell Pro Max 16 Plus Intel Core Ultra 9 285HX ⎘ NVIDIA RTX PRO 5000 Blackwell Generation Laptop ⎘ 128 GB Bellek, SSD | Amazon: Liste fiyatı: 5000 USD | 2.8 kg | 30.9 mm | 16.00" 3840x2400 283 PPI OLED |
6. 88.3% v7 (old)  | Dell Precision 5690 Intel Core Ultra 9 185H ⎘ NVIDIA RTX 5000 Ada Generation Laptop ⎘ 32 GB Bellek, 2048 GB SSD | Amazon: Liste fiyatı: 5900 USD | 2.3 kg | 22.17 mm | 16.00" 3840x2400 283 PPI OLED |
Şeffaflık
İncelenecek cihazların seçimi editör ekibimiz tarafından yapılır. Test örneği, bu incelemenin amacı doğrultusunda üretici veya perakendeci tarafından yazara ödünç olarak sağlanmıştır. Borç verenin bu inceleme üzerinde herhangi bir etkisi olmadığı gibi, üretici de yayınlanmadan önce bu incelemenin bir kopyasını almamıştır. Bu incelemeyi yayınlama zorunluluğu yoktu. Bağımsız bir medya şirketi olarak Notebookcheck, üreticilerin, perakendecilerin veya yayıncıların otoritesine tabi değildir.
Notebookcheck bu şekilde test yapıyor
Notebookcheck, tüm sonuçların karşılaştırılabilir olmasını sağlamak için her yıl yüzlerce dizüstü bilgisayarı ve akıllı telefonu standart prosedürler kullanarak bağımsız olarak inceliyor. Yaklaşık 20 yıldır test yöntemlerimizi sürekli olarak geliştirdik ve bu süreçte endüstri standartlarını belirledik. Test laboratuvarlarımızda deneyimli teknisyenler ve editörler tarafından yüksek kaliteli ölçüm ekipmanları kullanılmaktadır. Bu testler çok aşamalı bir doğrulama sürecini içerir. Karmaşık derecelendirme sistemimiz, nesnelliği koruyan yüzlerce sağlam temellere dayanan ölçüm ve kıyaslamaya dayanmaktadır.
