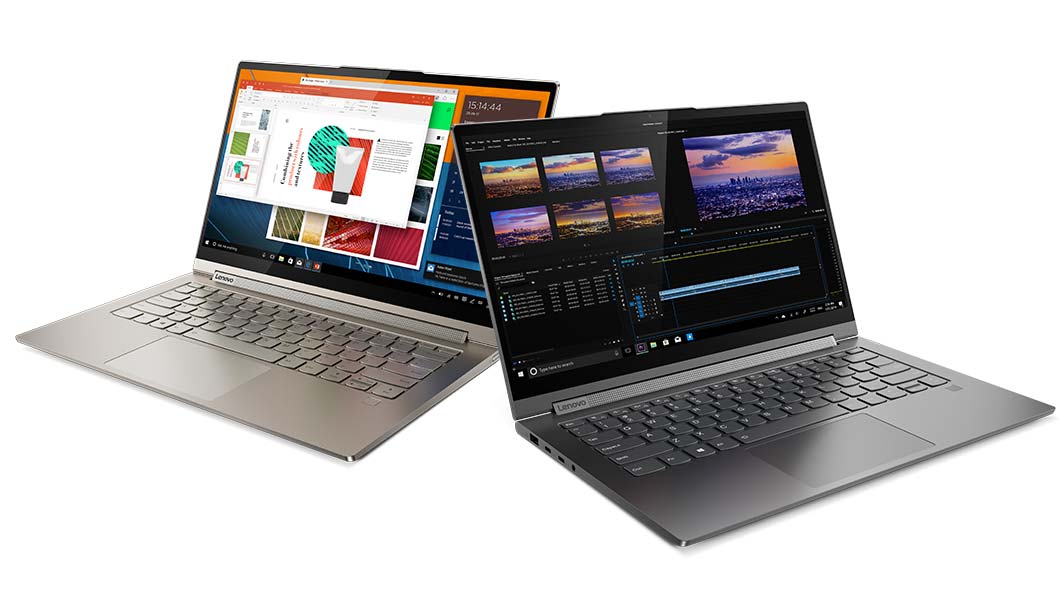
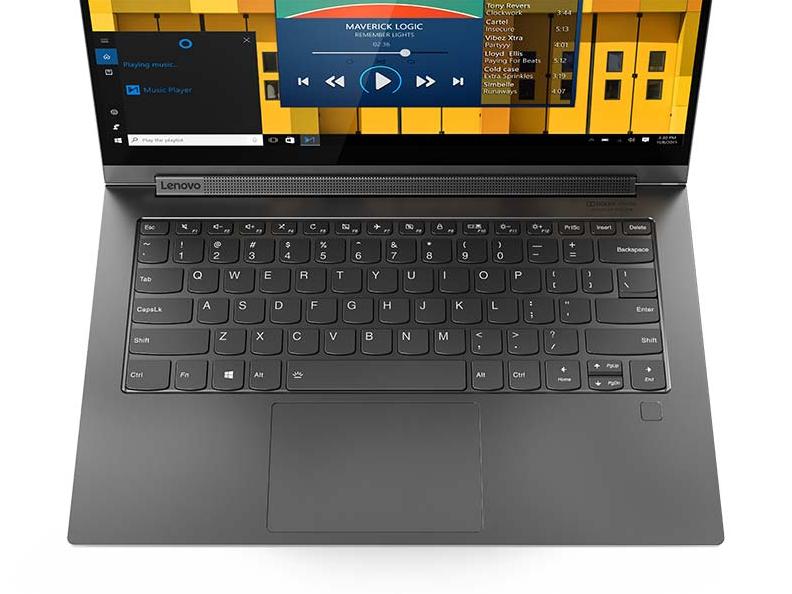
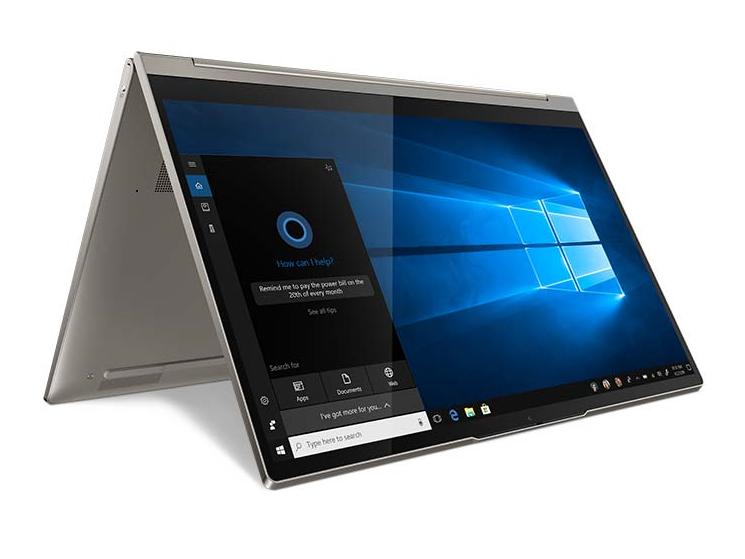
İnceleme: Lenovo Yoga C940-14IIL, yenilmesi zor müşteri dönüştürülebilir modeli
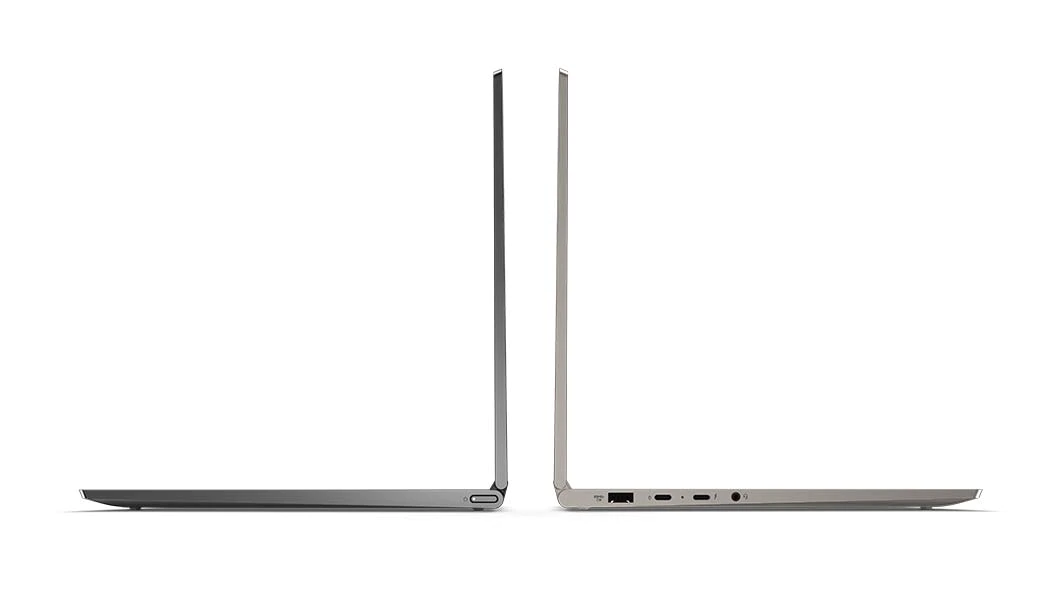
14 inç Yoga C940, geçen yılki 13.9 inç Yoga C930'un doğrudan ardılı. Ekran boyutundaki küçük yumru dışında, yeni model, burada FHD SKU'yu ilk incelememizde ayrıntılı olarak açıklandığı gibi bir dizi küçük değişiklik getiriyor. Bu inceleme, FHD ve 4K seçenekleri arasında ne tür iyileştirmeler veya farklılıklar bekleyebileceğimizi görmek için 4K UHD SKU'ya odaklanacak. Ekran farklılıklarından başka, 4K SKU'muzla ilgili her şey FHD SKU ile aynı kalıyor ve bu yüzden kontrol etmenizi öneririz şasi ve özellikleri hakkında daha fazla bilgi edinmek için mevcut incelememizi inceleyin. Yoga C940'ın 15.6 inçlik sürümü daha hızlı Core H serisi CPU'lar ve GeForce Max-Q grafikleriyle de kullanılabilir. 14 inç Yoga C940, HP Spectre x360 13, Dell XPS 13 gibi diğer amiral gemisi alt defterleri ve dönüştürülebilirleriyle doğrudan rekabet eder 7390 2'si 1 arada, Asus ZenBook Flip 14 ve Microsoft Surface Book serisi.Daha fazla Lenovo yorumu: Lenovo Yoga C940-14 (FHD) Lenovo Yoga C940-15Lenovo Yoga C930Lenovo ThinkPad P53Lenovo Legion Y740
Derecelendirme | Tarih | Modeli | Ağırlık | Yükseklik | Boyut | Çözünürlük | Fiyat |
|---|---|---|---|---|---|---|---|
| 87 % v7 (old) | 12/2019 | Lenovo Yoga C940-14IIL 81Q9 i7-1065G7, Iris Plus Graphics G7 (Ice Lake 64 EU) | 1.4 kg | 15.7 mm | 14.00" | 3840x2160 | |
| 86.3 % v7 (old) | 10/2019 | Dell XPS 13 7390 2-in-1 Core i7 i7-1065G7, Iris Plus Graphics G7 (Ice Lake 64 EU) | 1.3 kg | 13 mm | 13.40" | 1920x1200 | |
| 87.6 % v6 (old) | 05/2018 | Huawei Matebook X Pro i5 i5-8250U, GeForce MX150 | 1.3 kg | 14.6 mm | 13.90" | 3000x2000 | |
| 85.2 % v7 (old) | 12/2019 | MSI Prestige 15 A10SC i7-10710U, GeForce GTX 1650 Max-Q | 1.7 kg | 16 mm | 15.60" | 3840x2160 | |
| 86.3 % v7 (old) | 10/2019 | Razer Blade Stealth i7-1065G7 Iris Plus i7-1065G7, Iris Plus Graphics G7 (Ice Lake 64 EU) | 1.4 kg | 15.3 mm | 13.30" | 1920x1080 |
Durum
İletişim
Intel AX201, Wi-Fi 6 bağlantısının, Wi-Fi 6 uyumlu bir yönlendiriciniz varsa Wi-Fi 5'in aktarım hızlarının iki katından daha fazlasını sunmasını sağlar. AX201 işlevsel olarak AX200 ile aynıdır ancak bazı donanım değişiklikleri vardır.
| Networking | |
| iperf3 transmit AX12 | |
| MSI Prestige 15 A10SC | |
| Lenovo Yoga C930-13IKB 81C4 | |
| Asus ZenBook S13 UX392FN | |
| iperf3 receive AX12 | |
| MSI Prestige 15 A10SC | |
| Asus ZenBook S13 UX392FN | |
| Lenovo Yoga C930-13IKB 81C4 | |
Bakım
Alt panel T5 Torx vidalarla sabitlenmiştir ve şasiye zarar vermeden çıkarılması çok zordur. Keskin kenarlar keskin bir kenarla bile çok sıkıdır ve son kullanıcı için düşmanca servis sağlar.
Görüntüle
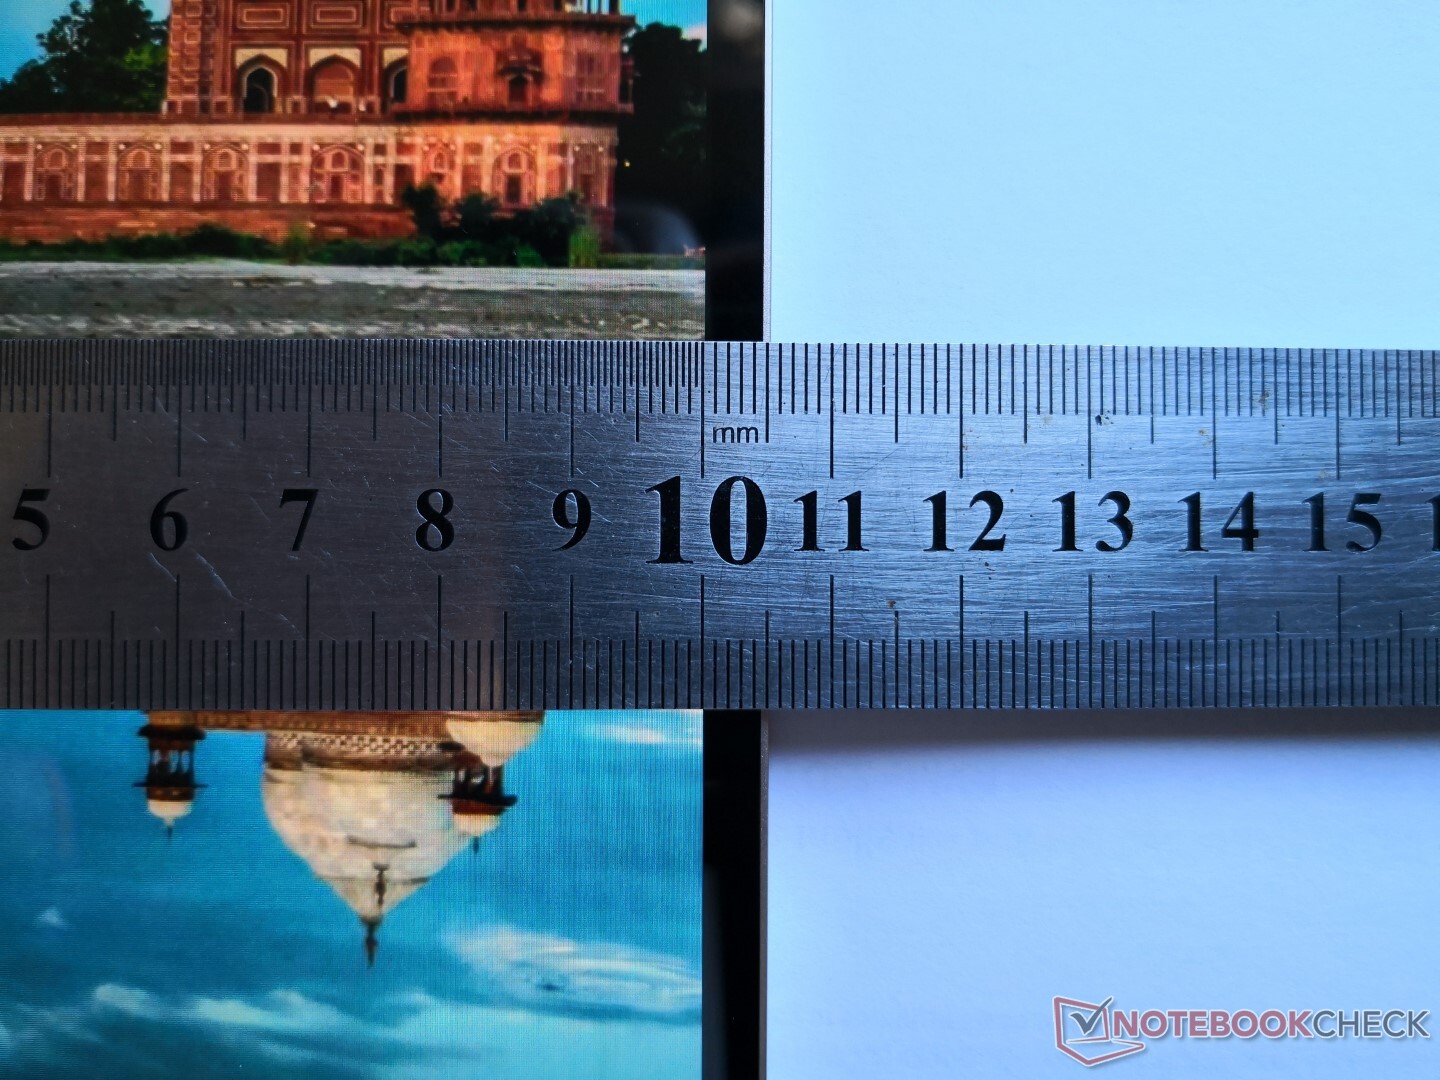
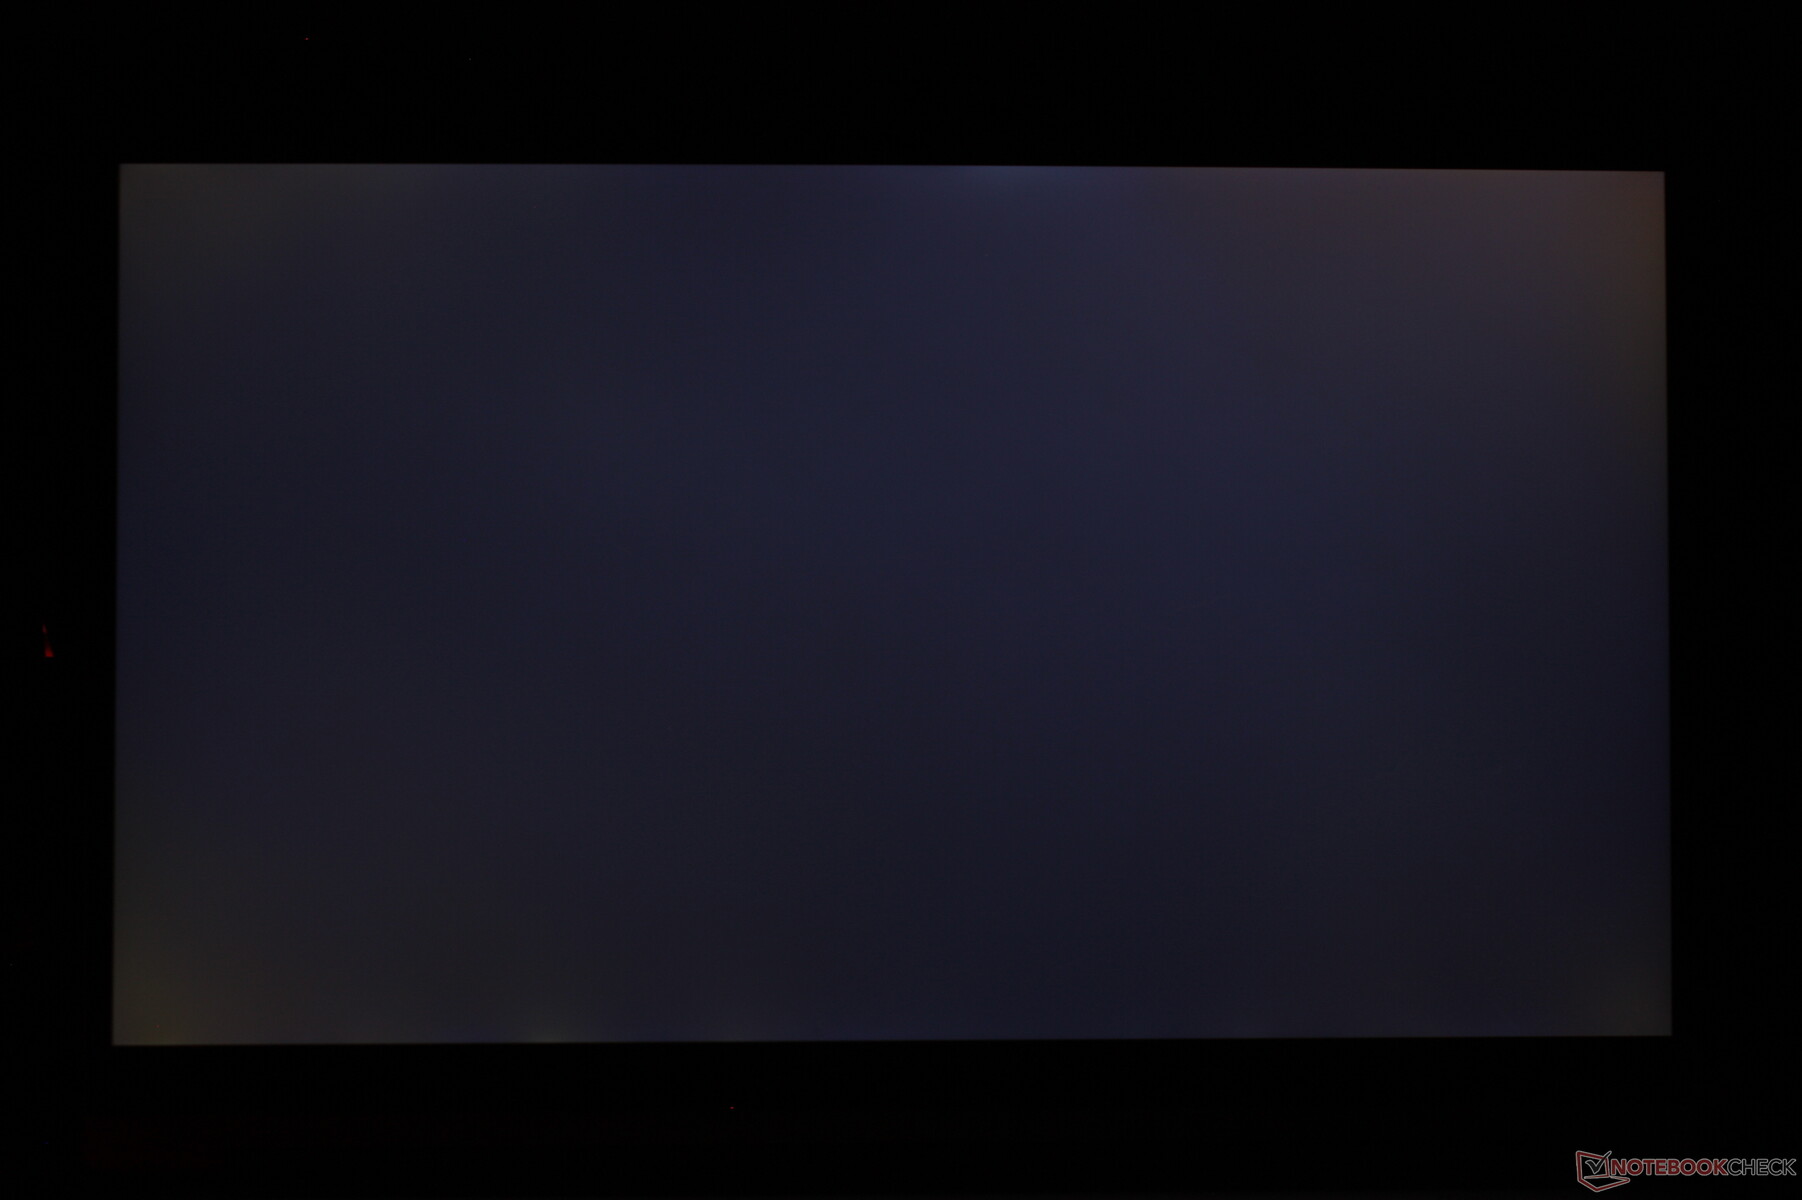
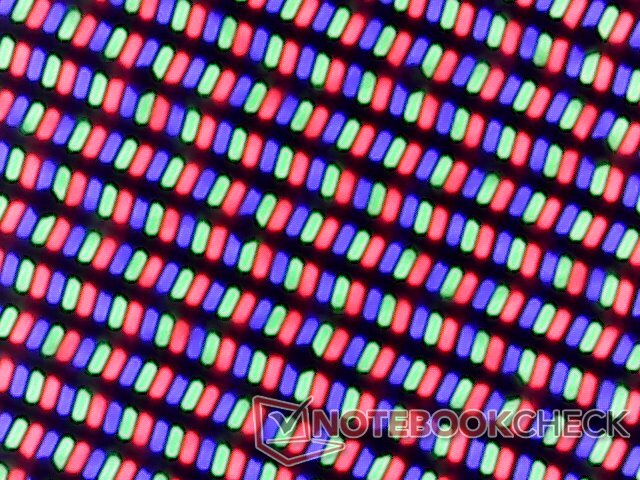
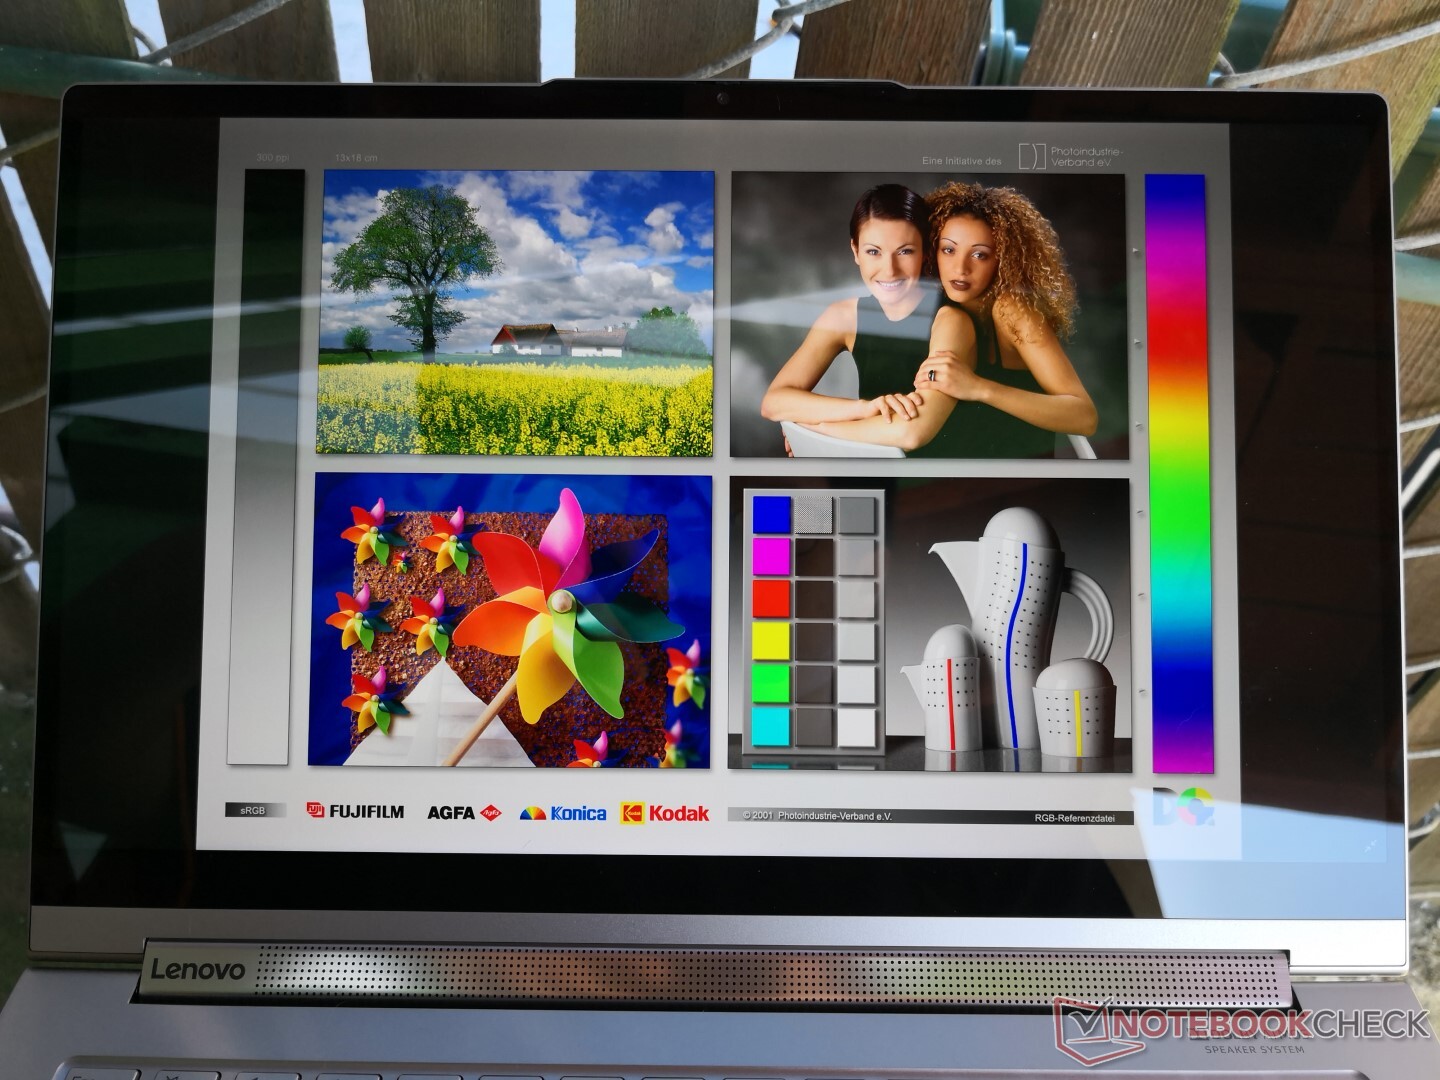
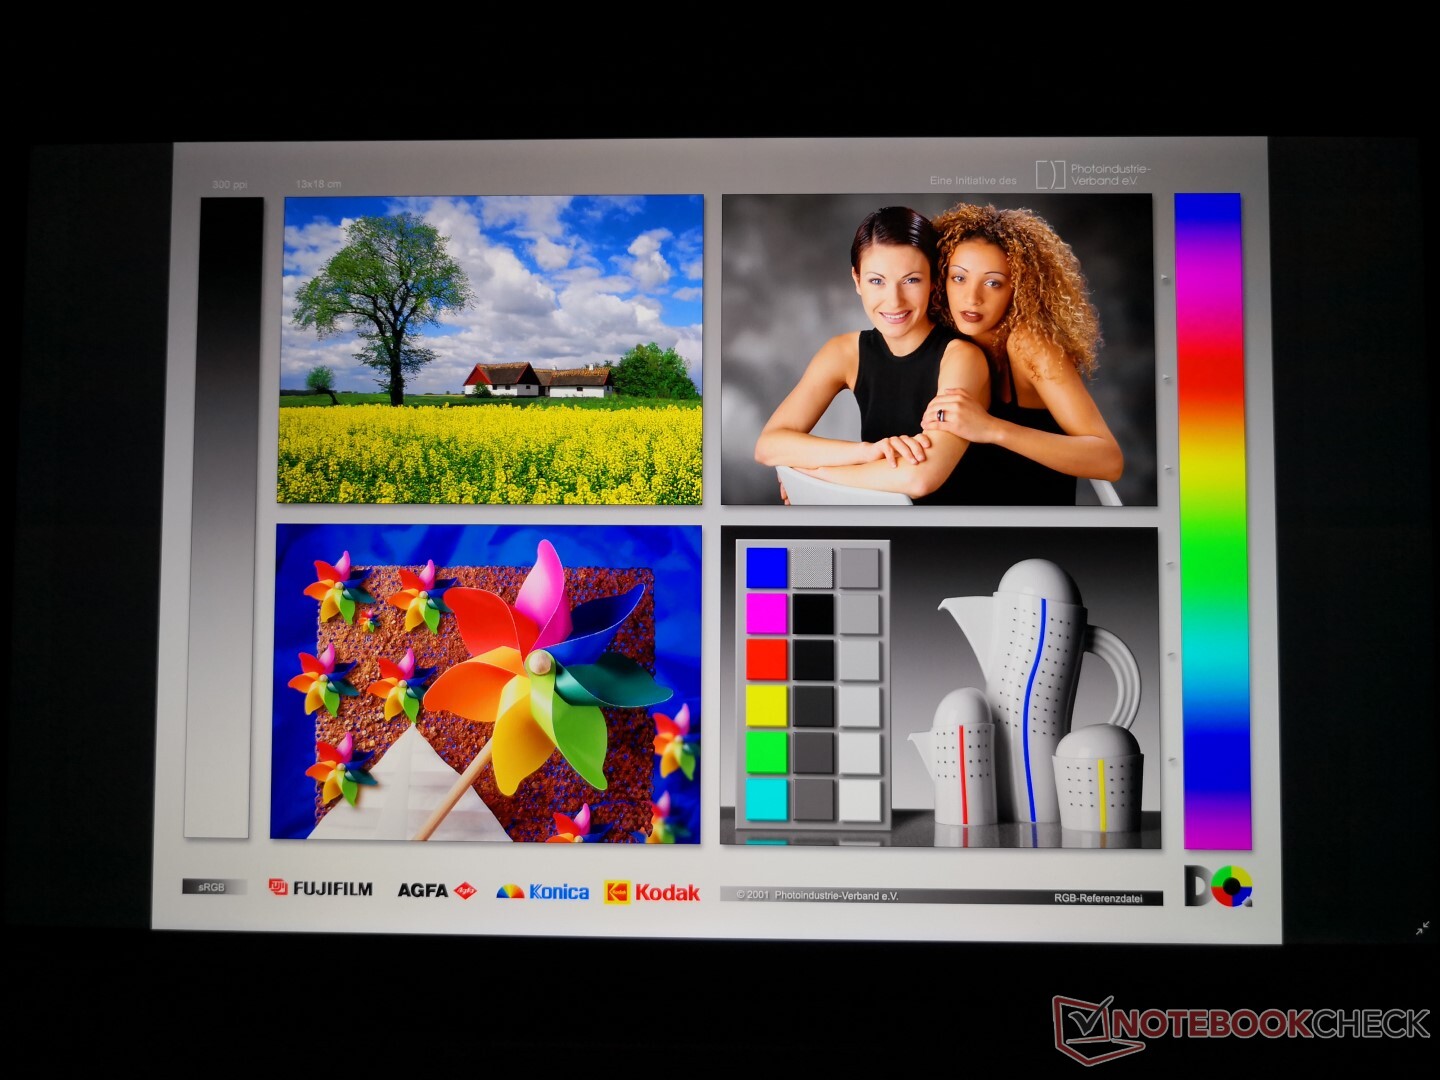
Yerel 4K UHD çözünürlüğe sahip 14 inç ekranlar nadirdir ve bu nedenle bu Lenovo'daki BOE HF NV140QUM-N54 IPS panelinin şu ana kadar veritabanımızda başka hiçbir dizüstü bilgisayarda bulunmaması şaşırtıcı değildir. Bununla birlikte, panel diğer Ultrabook'ların çoğunda daha yaygın olan Sharp, AU Optronics veya LG Philips panellerine kıyasla daha iyi bir şekilde karşılaştırır. Kontrast gibi temel özellikler, derin renkler, net metinler ve makul yanıt süreleri ile 1500: 1'den fazla mükemmeldir. Tek büyük şikayetimiz, HP EliteBook 1040 G5'te 120 Hz ile karşılaştırıldığında 60 Hz yenileme hızı ile sınırlı olmasıdır. Belki de ekranın en önemli özelliği parlaklığıdır. Lenovo, hem FHD hem de 4K UHD SKU'ları için 500 nit talep ederken, FHD test birimimizde sadece 384 nit ölçebildik. Neyse ki, bu 4K UHD birimi, Lenovo'nun geçen yılki Yoga C930'un çok üstünde ve rakip XPS 13 7390 2'si 1 arada ile eşit olduğunu iddia ettiği kadar parlak.
| |||||||||||||||||||||||||
Aydınlatma: 82 %
Batarya modunda parlaklık: 501.7 cd/m²
Kontrast: 1568:1 (Siyah: 0.32 cd/m²)
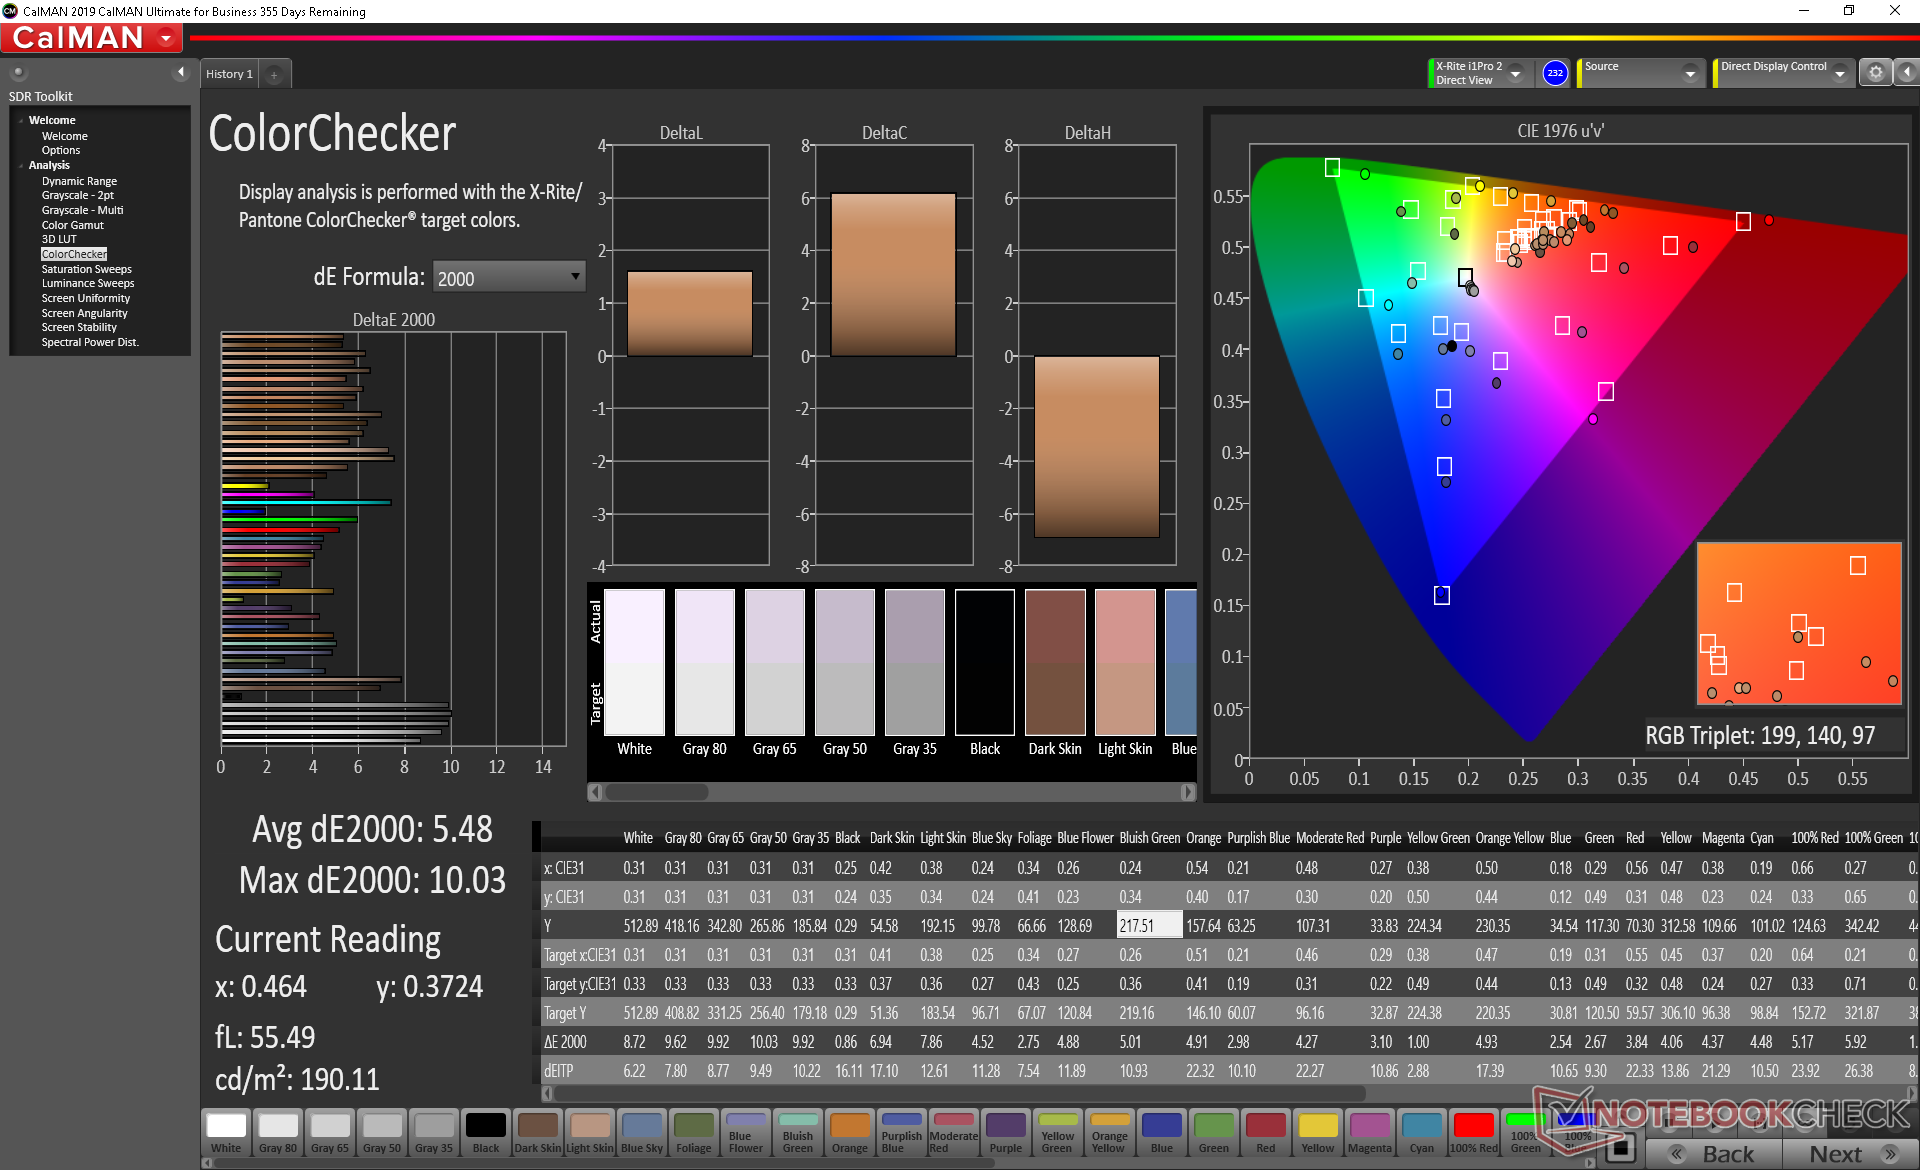
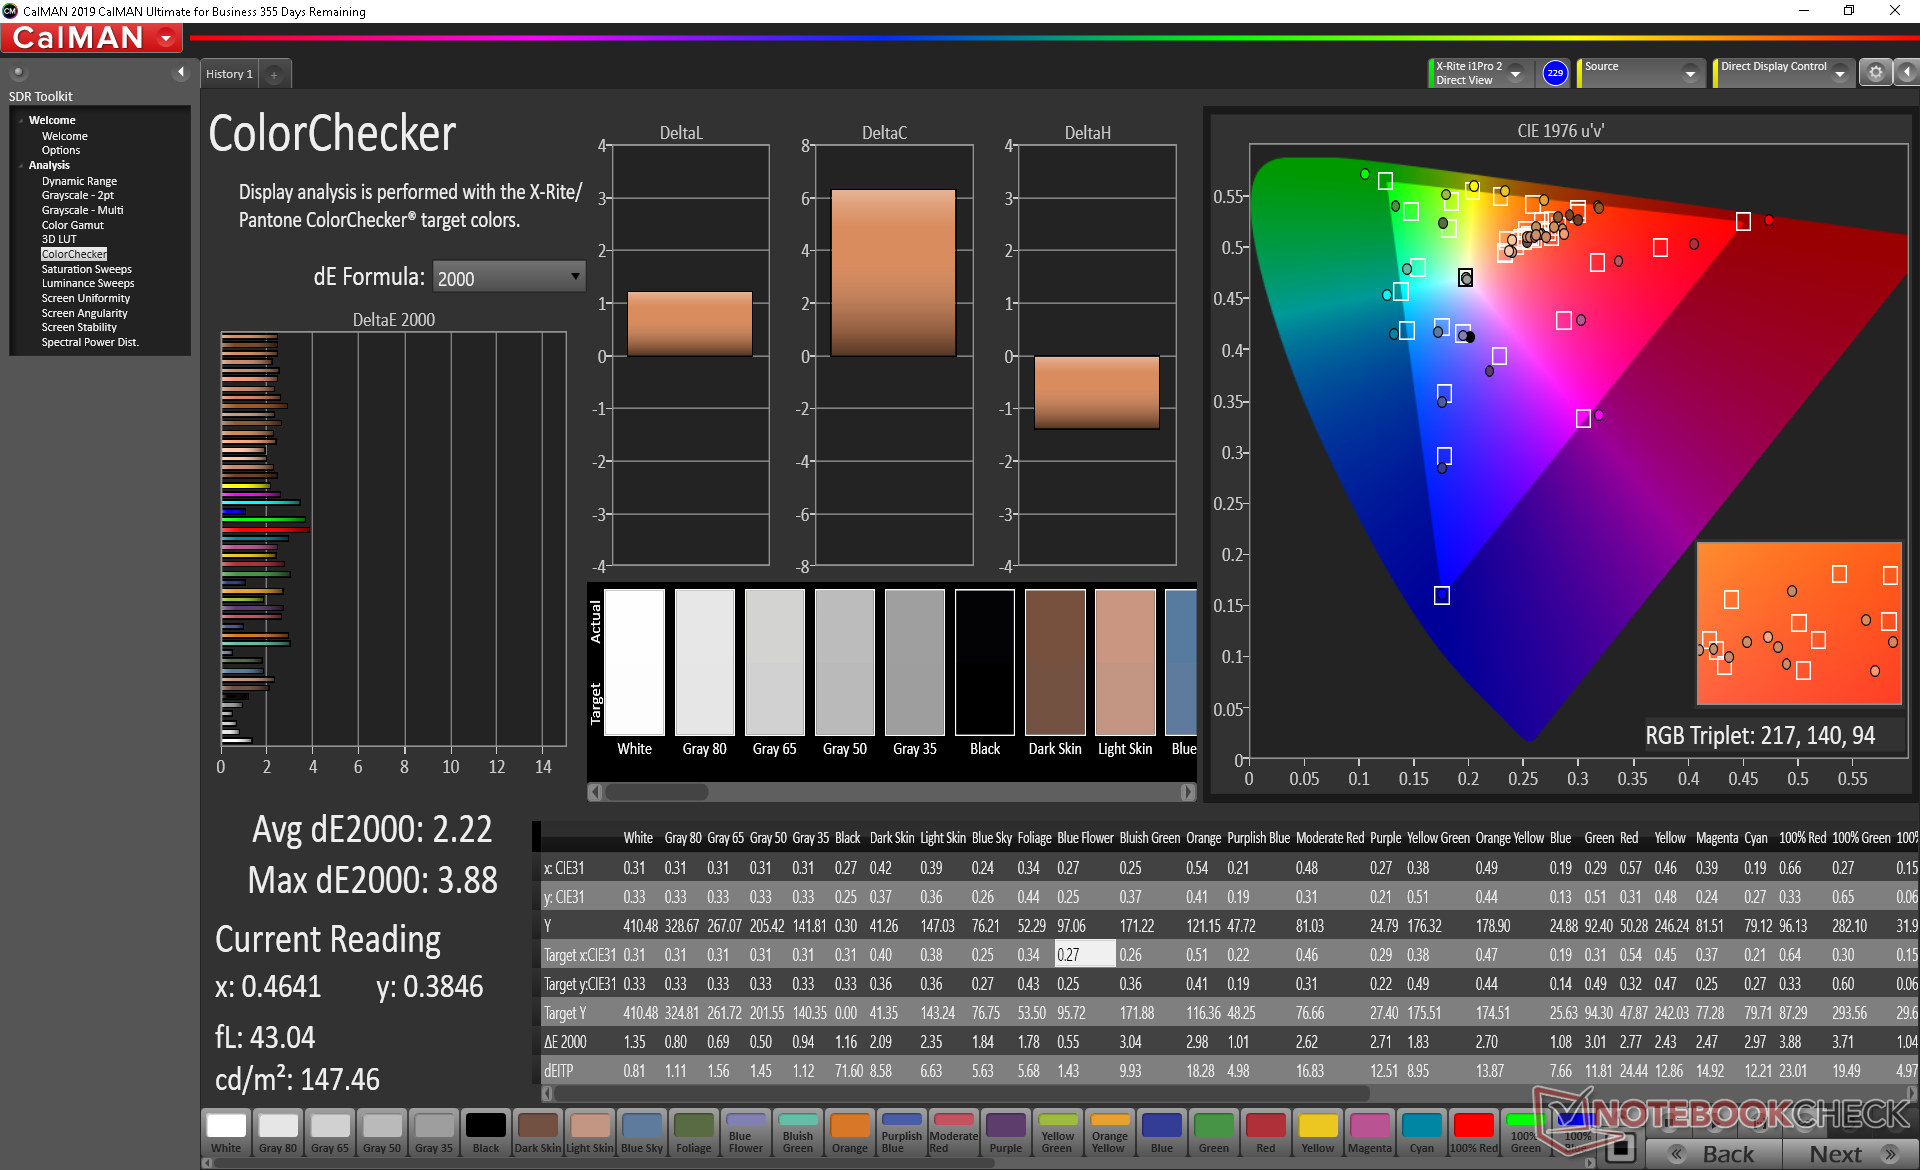
ΔE ColorChecker Calman: 5.48 | ∀{0.5-29.43 Ø4.73}
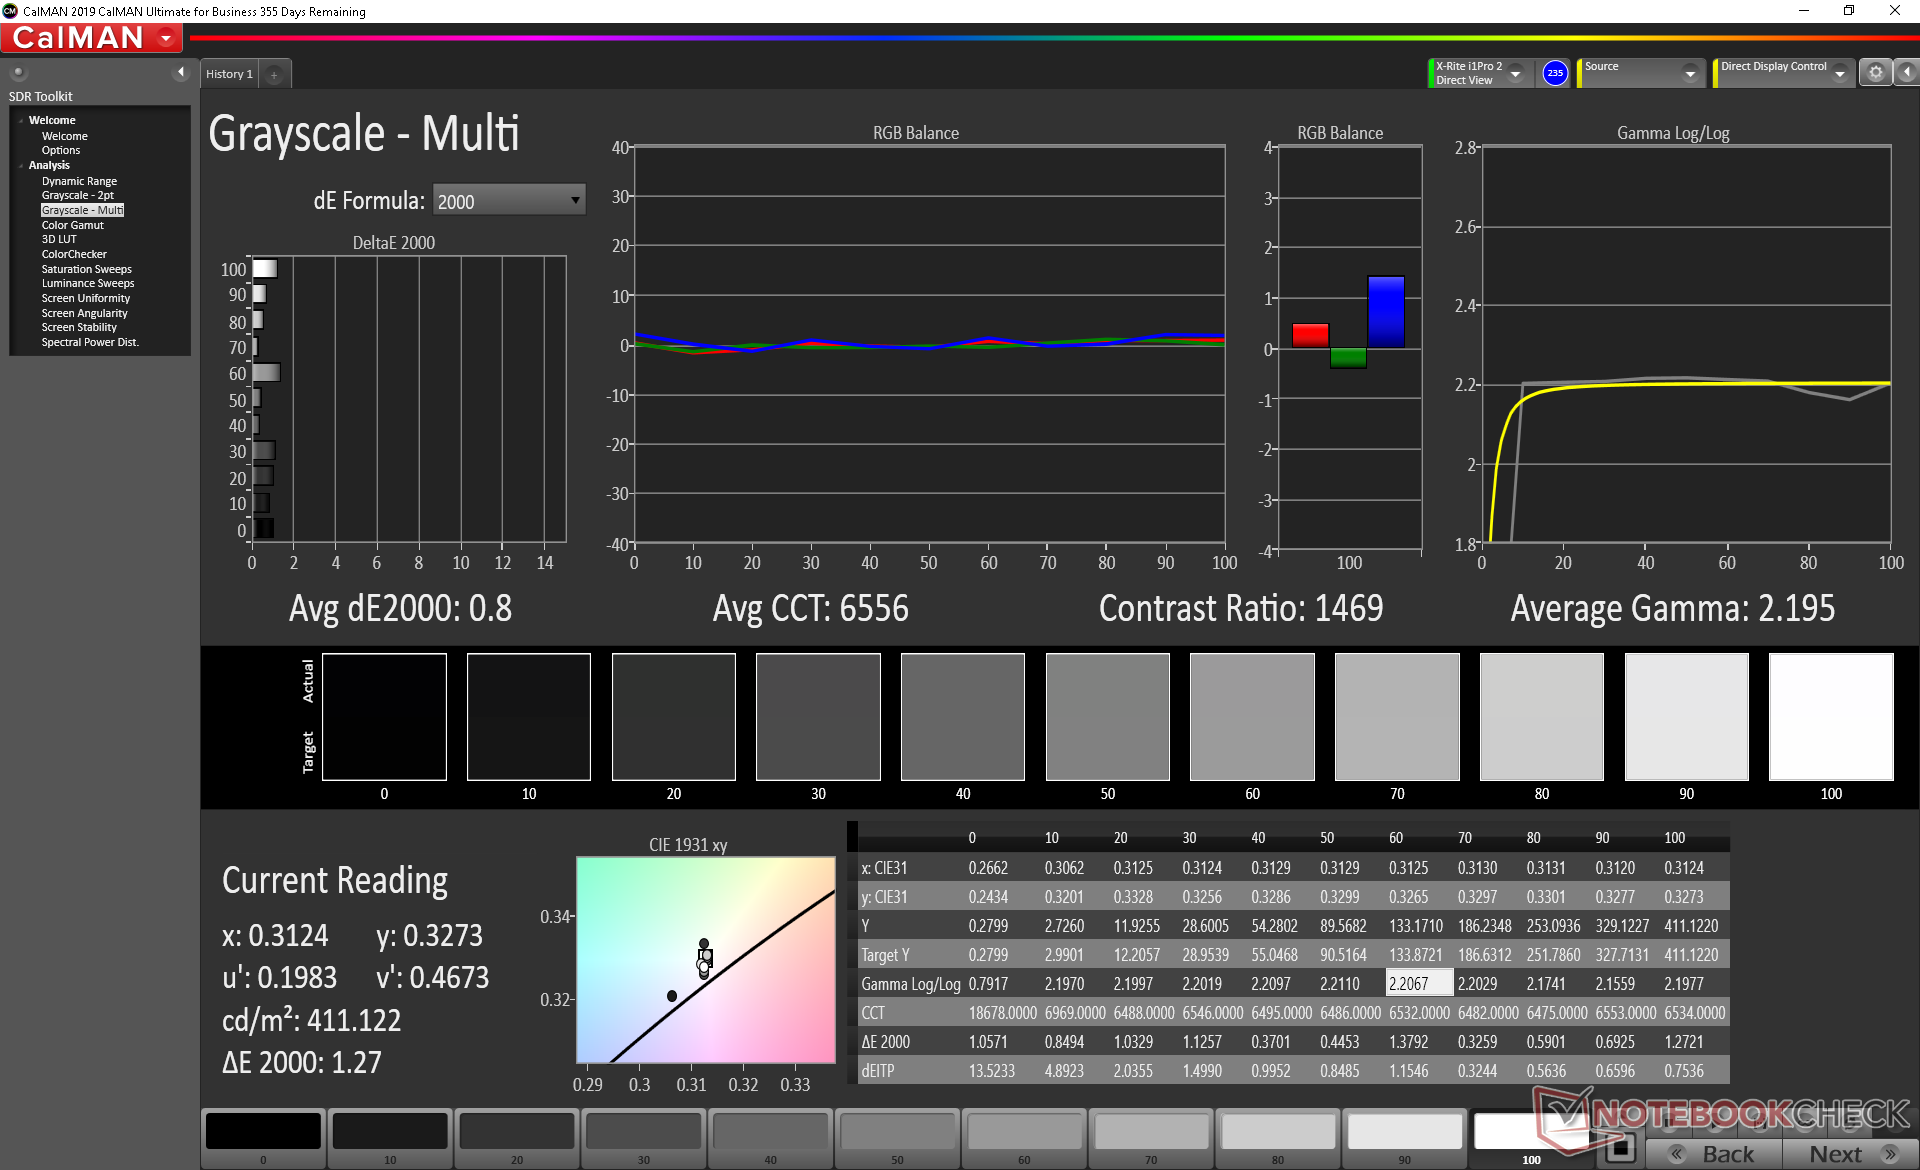
calibrated: 2.22
ΔE Greyscale Calman: 8.1 | ∀{0.09-98 Ø4.97}
100% sRGB (Argyll 1.6.3 3D)
74.1% AdobeRGB 1998 (Argyll 1.6.3 3D)
83.3% AdobeRGB 1998 (Argyll 3D)
99.9% sRGB (Argyll 3D)
83.8% Display P3 (Argyll 3D)
Gamma: 2.07
CCT: 6730 K
| Lenovo Yoga C940-14IIL 81Q9 BOE HF NV140QUM-N54, IPS, 14", 3840x2160 | Lenovo Yoga C930-13IKB 81C4 AUO B139HAN03_0, IPS, 13.9", 1920x1080 | Lenovo Yoga C940-14IIL LP140WF9-SPE2, IPS LED, 14", 1920x1080 | Dell XPS 13 7390 2-in-1 Core i7 Sharp LQ134N1, IPS, 13.4", 1920x1200 | Razer Blade Stealth i7-1065G7 Iris Plus Sharp LQ133M1JW41, IPS, 13.3", 1920x1080 | Asus ZenBook S13 UX392FN Tianma XM, IPS, 13.9", 1920x1080 | |
|---|---|---|---|---|---|---|
| Display | -18% | -14% | -11% | -14% | -13% | |
| Display P3 Coverage (%) | 83.8 | 62.7 -25% | 66 -21% | 69.9 -17% | 66.2 -21% | 67.5 -19% |
| sRGB Coverage (%) | 99.9 | 92.6 -7% | 97.9 -2% | 99.2 -1% | 97.2 -3% | 95.8 -4% |
| AdobeRGB 1998 Coverage (%) | 83.3 | 64.7 -22% | 67.3 -19% | 71.5 -14% | 67.1 -19% | 69 -17% |
| Response Times | 15% | -11% | -7% | -12% | 2% | |
| Response Time Grey 50% / Grey 80% * (ms) | 44.4 ? | 34.4 ? 23% | 49.6 ? -12% | 47.6 ? -7% | 45.2 ? -2% | 47.2 ? -6% |
| Response Time Black / White * (ms) | 27.2 ? | 25.6 ? 6% | 30 ? -10% | 29.2 ? -7% | 33.2 ? -22% | 24.8 ? 9% |
| PWM Frequency (Hz) | 2500 ? | 22730 ? | ||||
| Screen | -25% | 19% | 19% | 20% | 16% | |
| Brightness middle (cd/m²) | 501.7 | 312 -38% | 384 -23% | 549.8 10% | 422.6 -16% | 466 -7% |
| Brightness (cd/m²) | 501 | 295 -41% | 363 -28% | 520 4% | 404 -19% | 462 -8% |
| Brightness Distribution (%) | 82 | 87 6% | 90 10% | 86 5% | 87 6% | 90 10% |
| Black Level * (cd/m²) | 0.32 | 0.43 -34% | 0.17 47% | 0.39 -22% | 0.35 -9% | 0.33 -3% |
| Contrast (:1) | 1568 | 726 -54% | 2259 44% | 1410 -10% | 1207 -23% | 1412 -10% |
| Colorchecker dE 2000 * | 5.48 | 7.6 -39% | 3.5 36% | 2.12 61% | 1.02 81% | 1.93 65% |
| Colorchecker dE 2000 max. * | 10.03 | 15.06 -50% | 5.5 45% | 3.66 64% | 3.06 69% | 4.26 58% |
| Colorchecker dE 2000 calibrated * | 2.22 | 1.96 12% | 1 55% | 1.37 38% | 0.95 57% | 1.99 10% |
| Greyscale dE 2000 * | 8.1 | 8.8 -9% | 4.6 43% | 2.6 68% | 1 88% | 1.7 79% |
| Gamma | 2.07 106% | 2.01 109% | 2.32 95% | 2.3 96% | 2.21 100% | 2.15 102% |
| CCT | 6730 97% | 6874 95% | 6884 94% | 6884 94% | 6502 100% | 6382 102% |
| Color Space (Percent of AdobeRGB 1998) (%) | 74.1 | 59.1 -20% | 62 -16% | 65.4 -12% | 62.1 -16% | 62.2 -16% |
| Color Space (Percent of sRGB) (%) | 100 | 92.3 -8% | 97.7 -2% | 99.7 0% | 97.1 -3% | 95.7 -4% |
| Toplam Ortalama (Program / Ayarlar) | -9% /
-19% | -2% /
9% | 0% /
10% | -2% /
9% | 2% /
9% |
* ... daha küçük daha iyidir
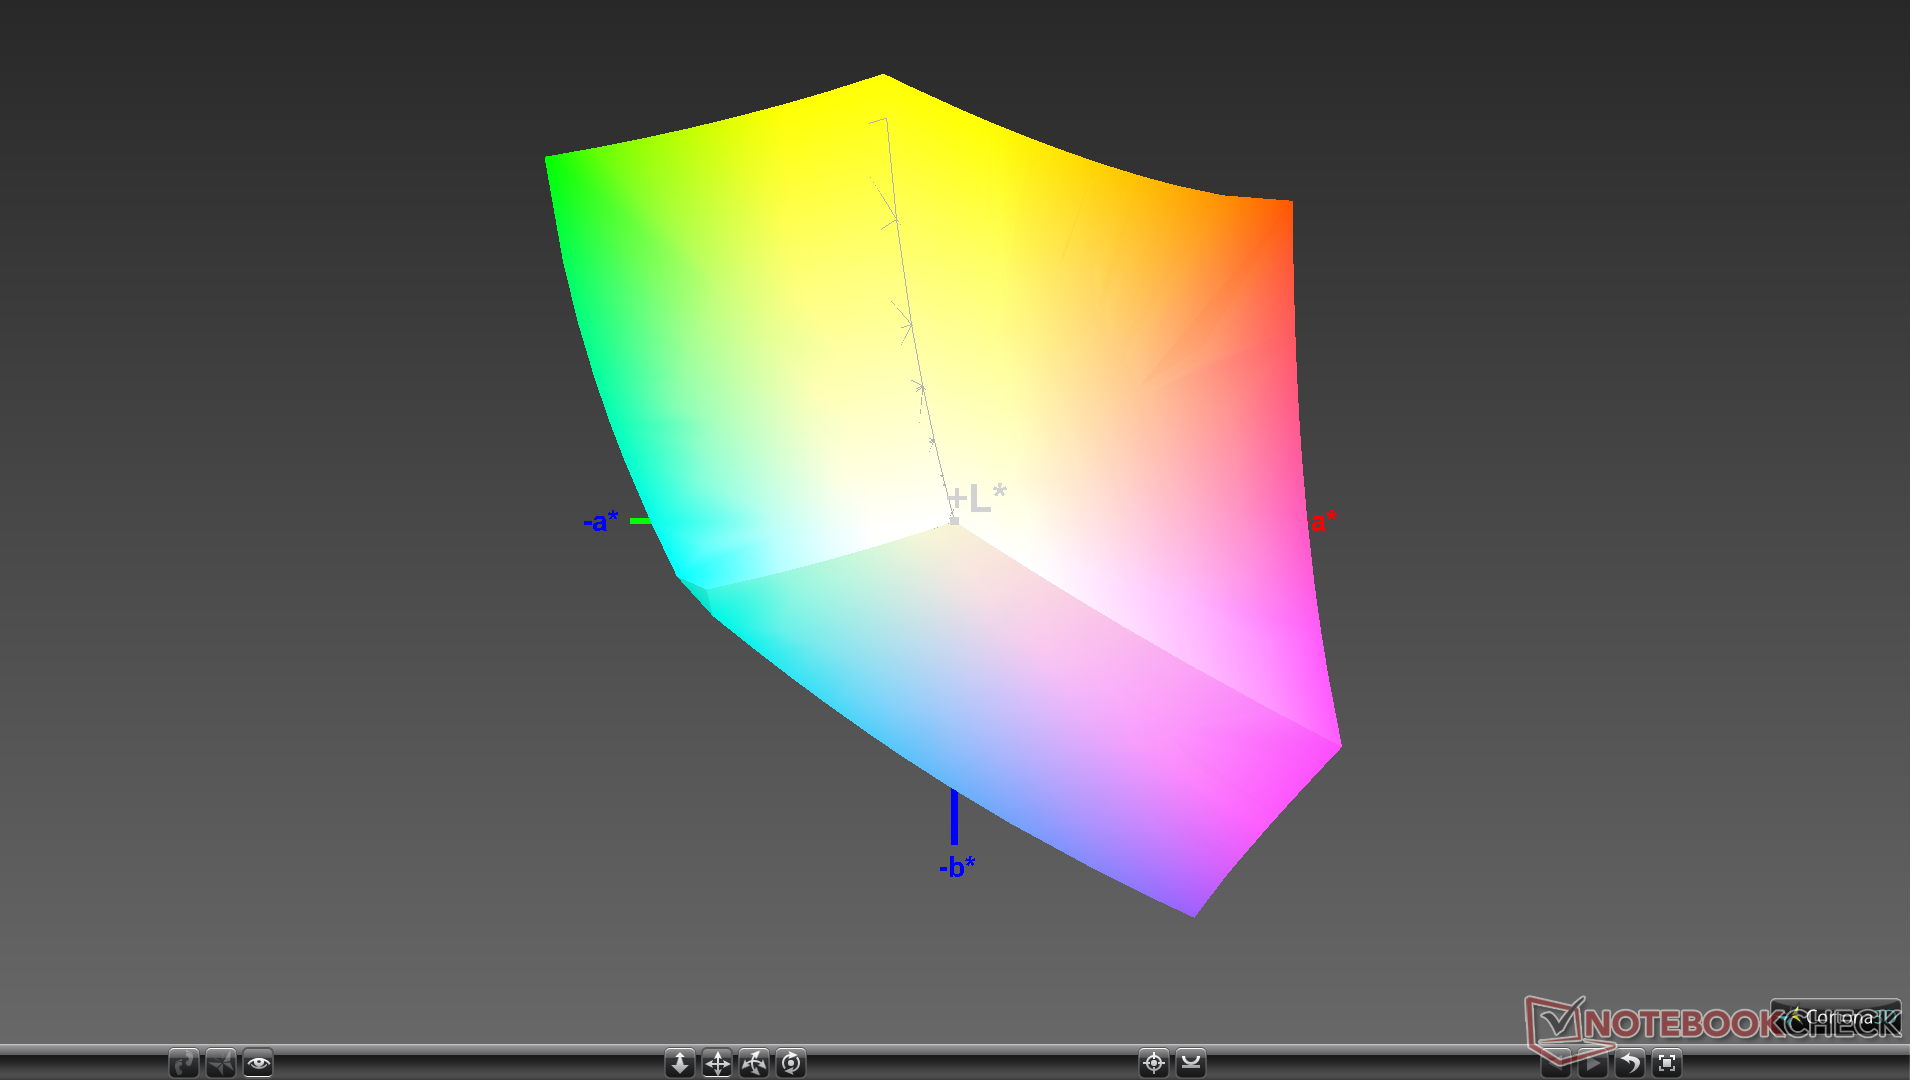
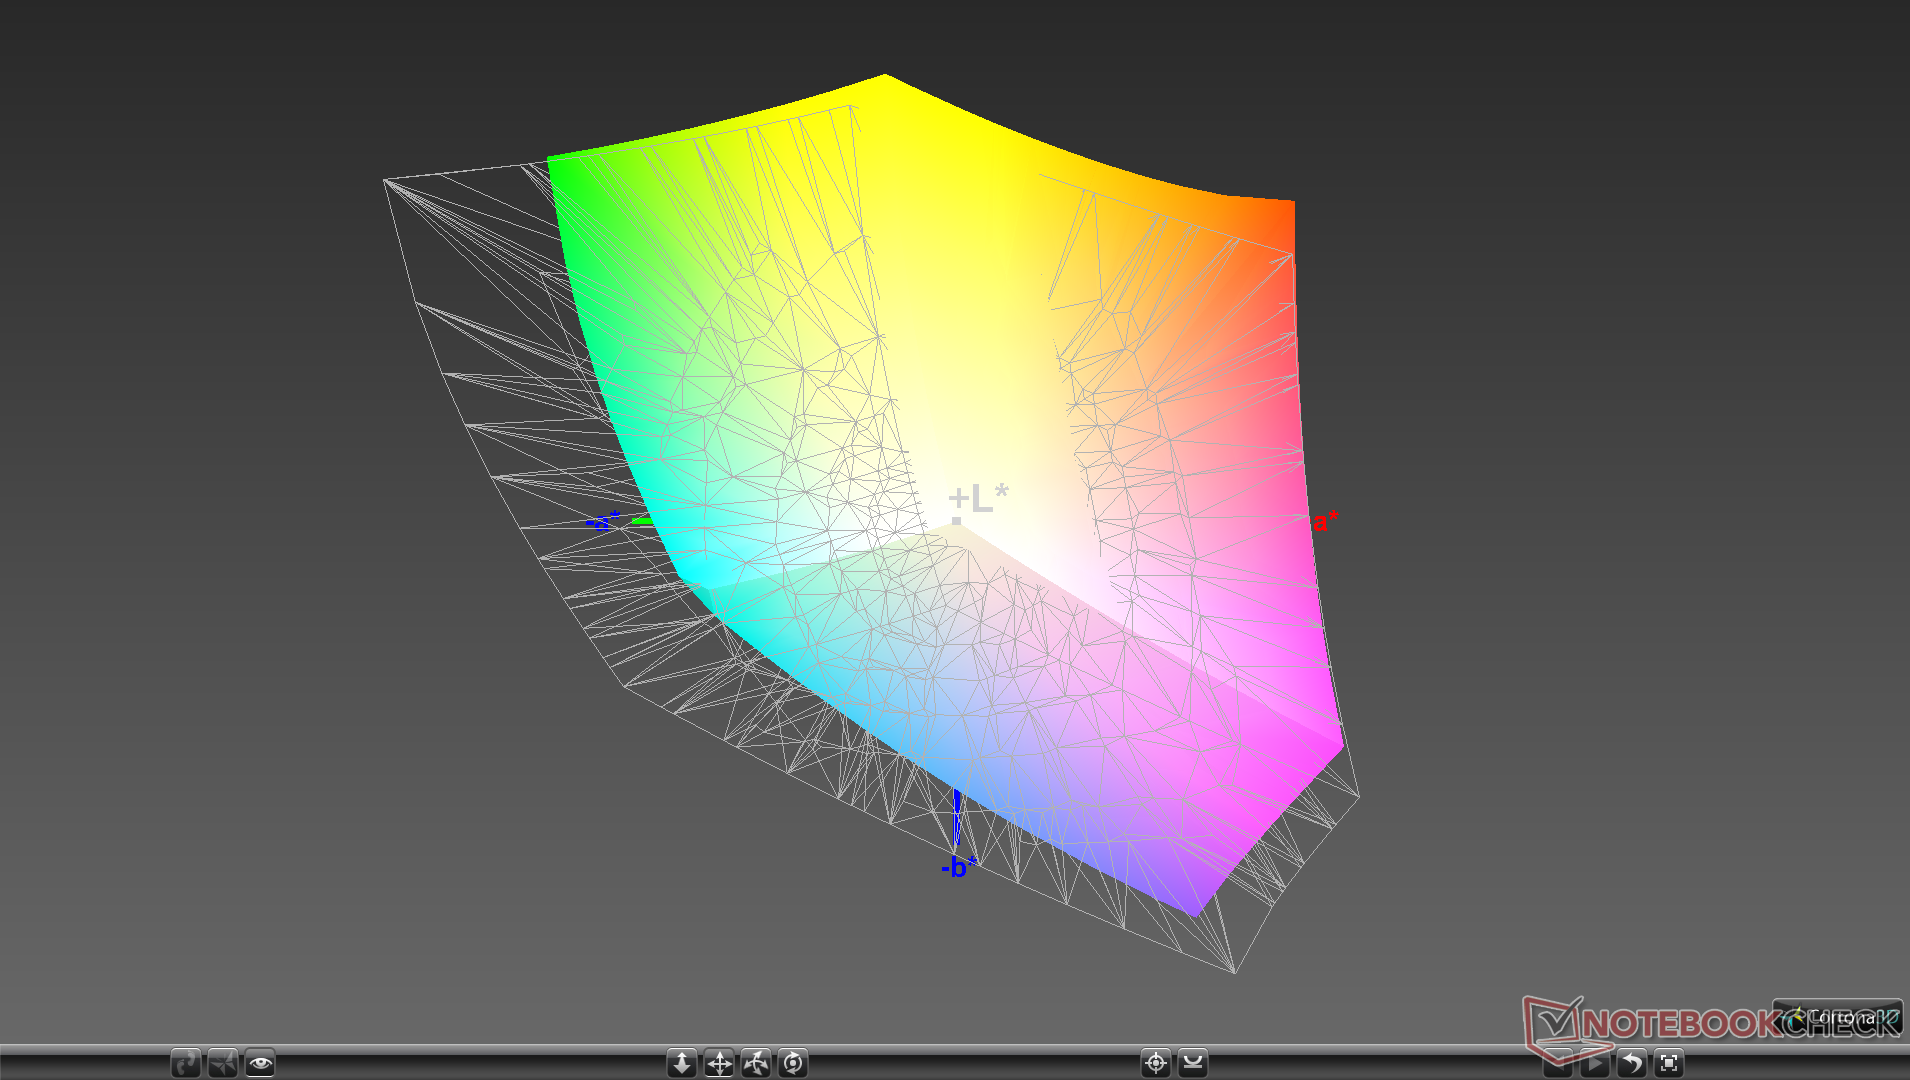
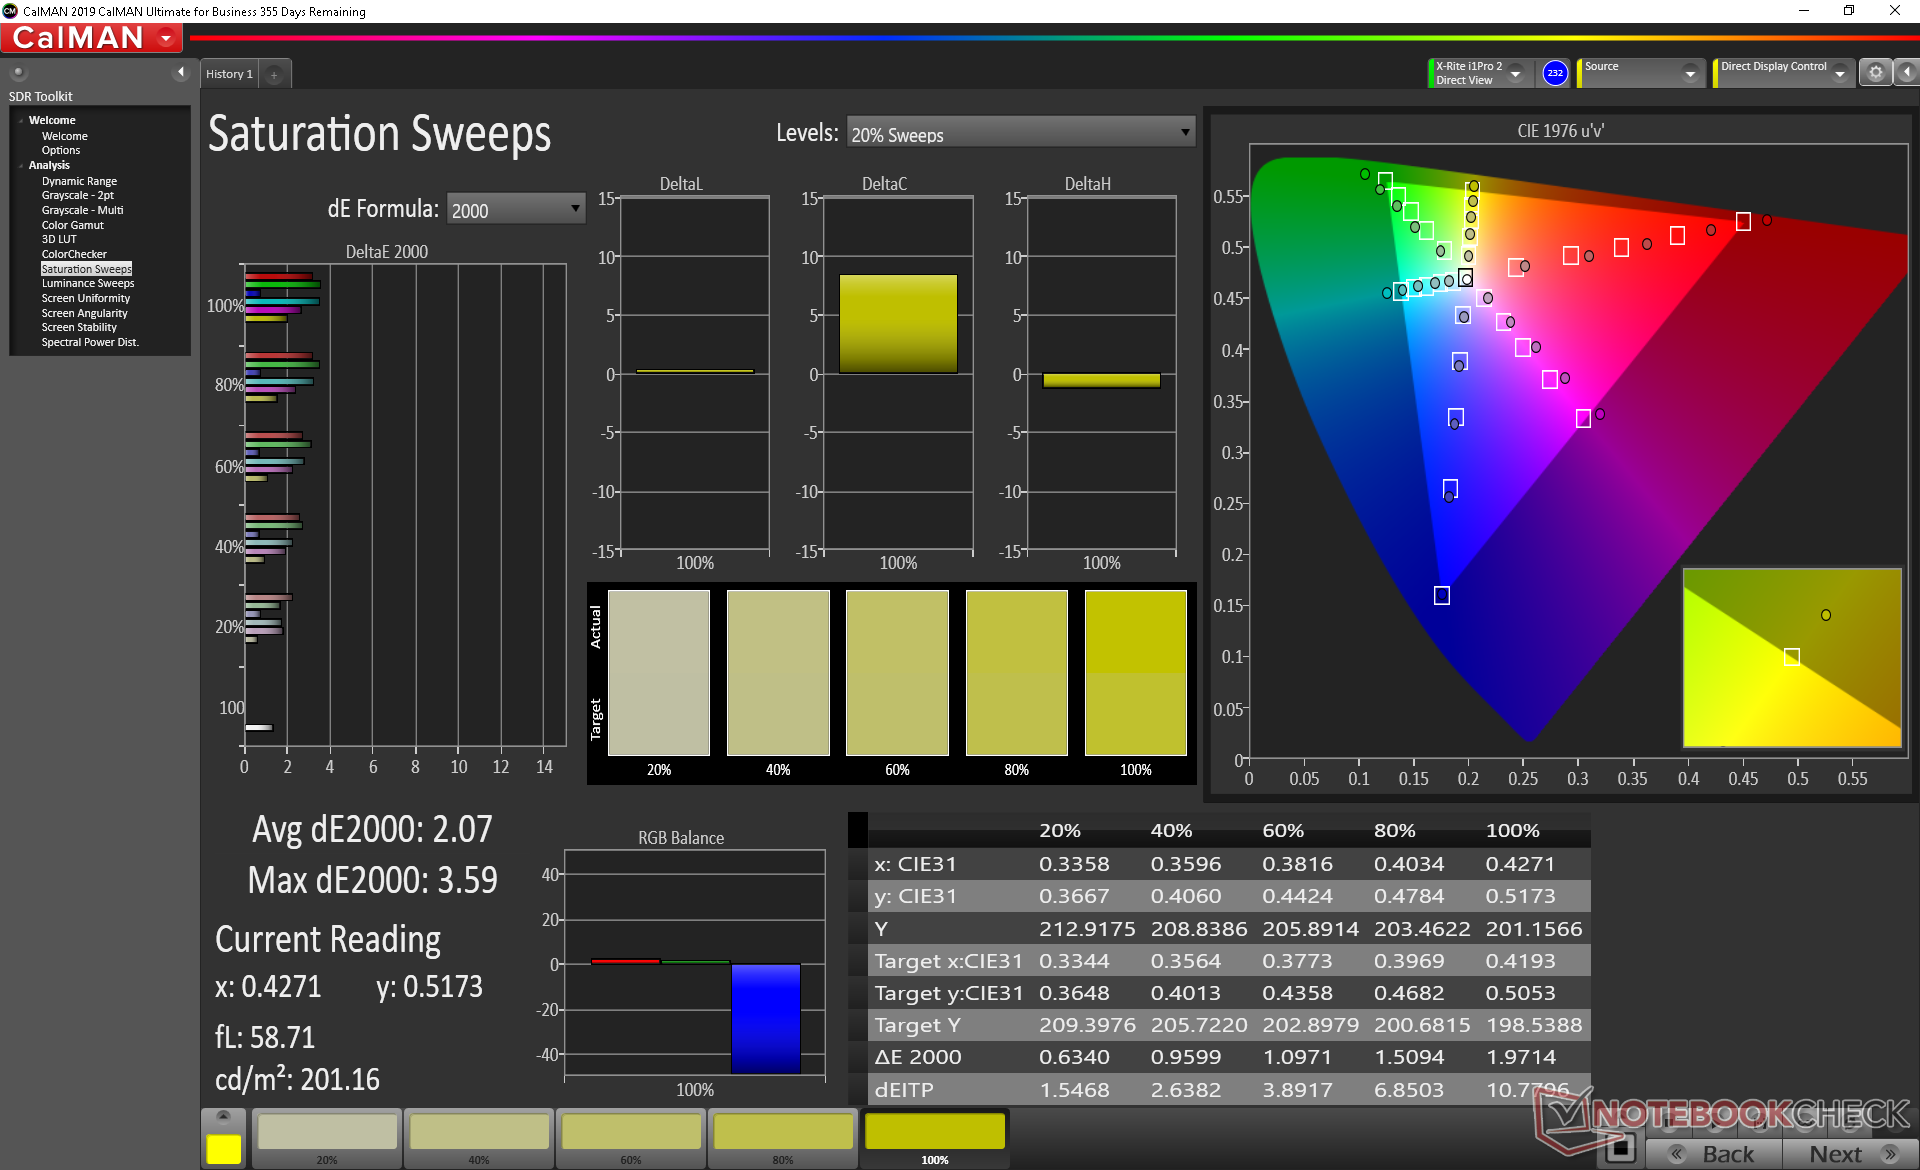
Tam AdobeRGB kapsamının mümkün olduğu Sharp IGZO panelleri kadar geniş olmasa da, renk alanı FHD panelinden daha geniş (yüzde 74'e karşılık yüzde 62 AdobeRGB). Yoga C940 SKU'sundan bağımsız olarak tam sRGB kapsama alanı sağlandığından, biraz daha derin renkler günlük kullanımı önemli bir şekilde etkilemez.
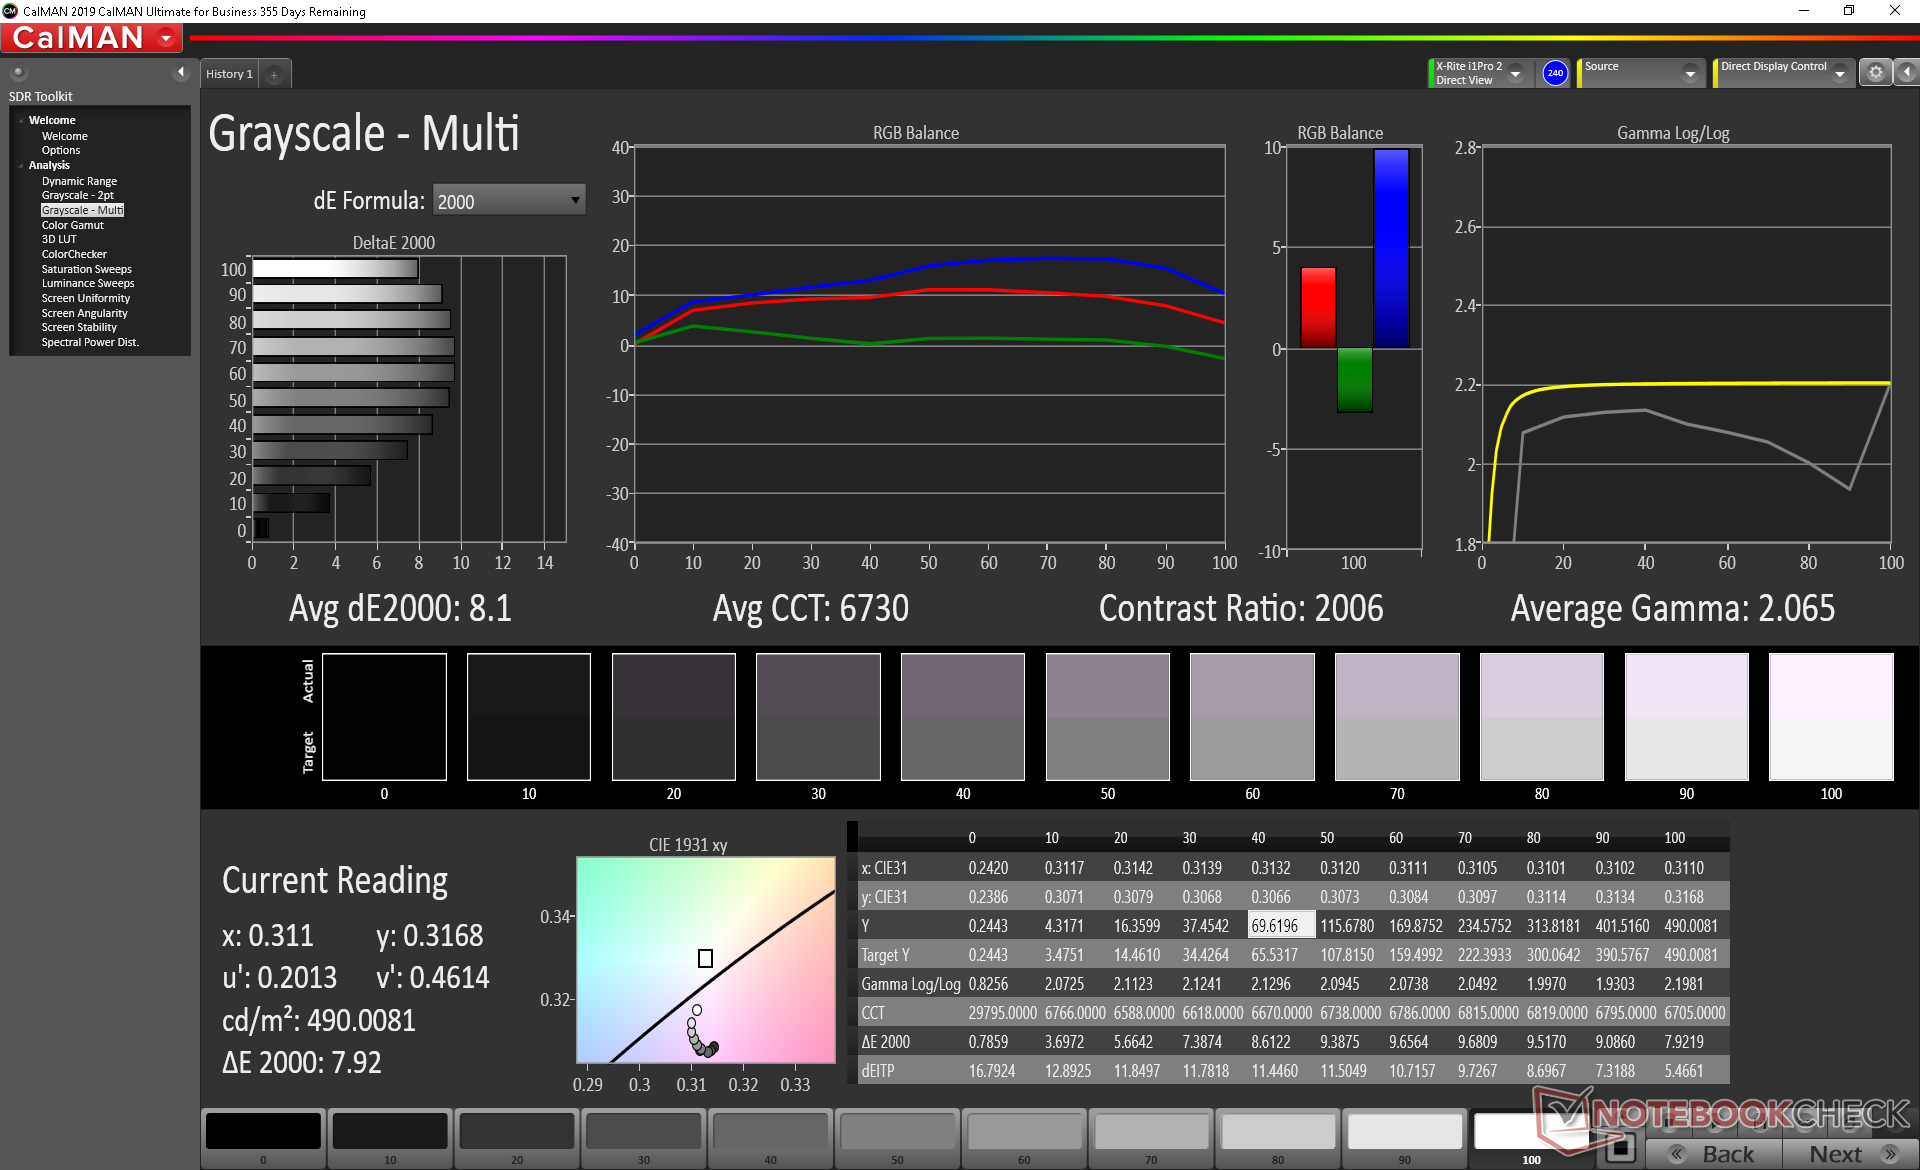
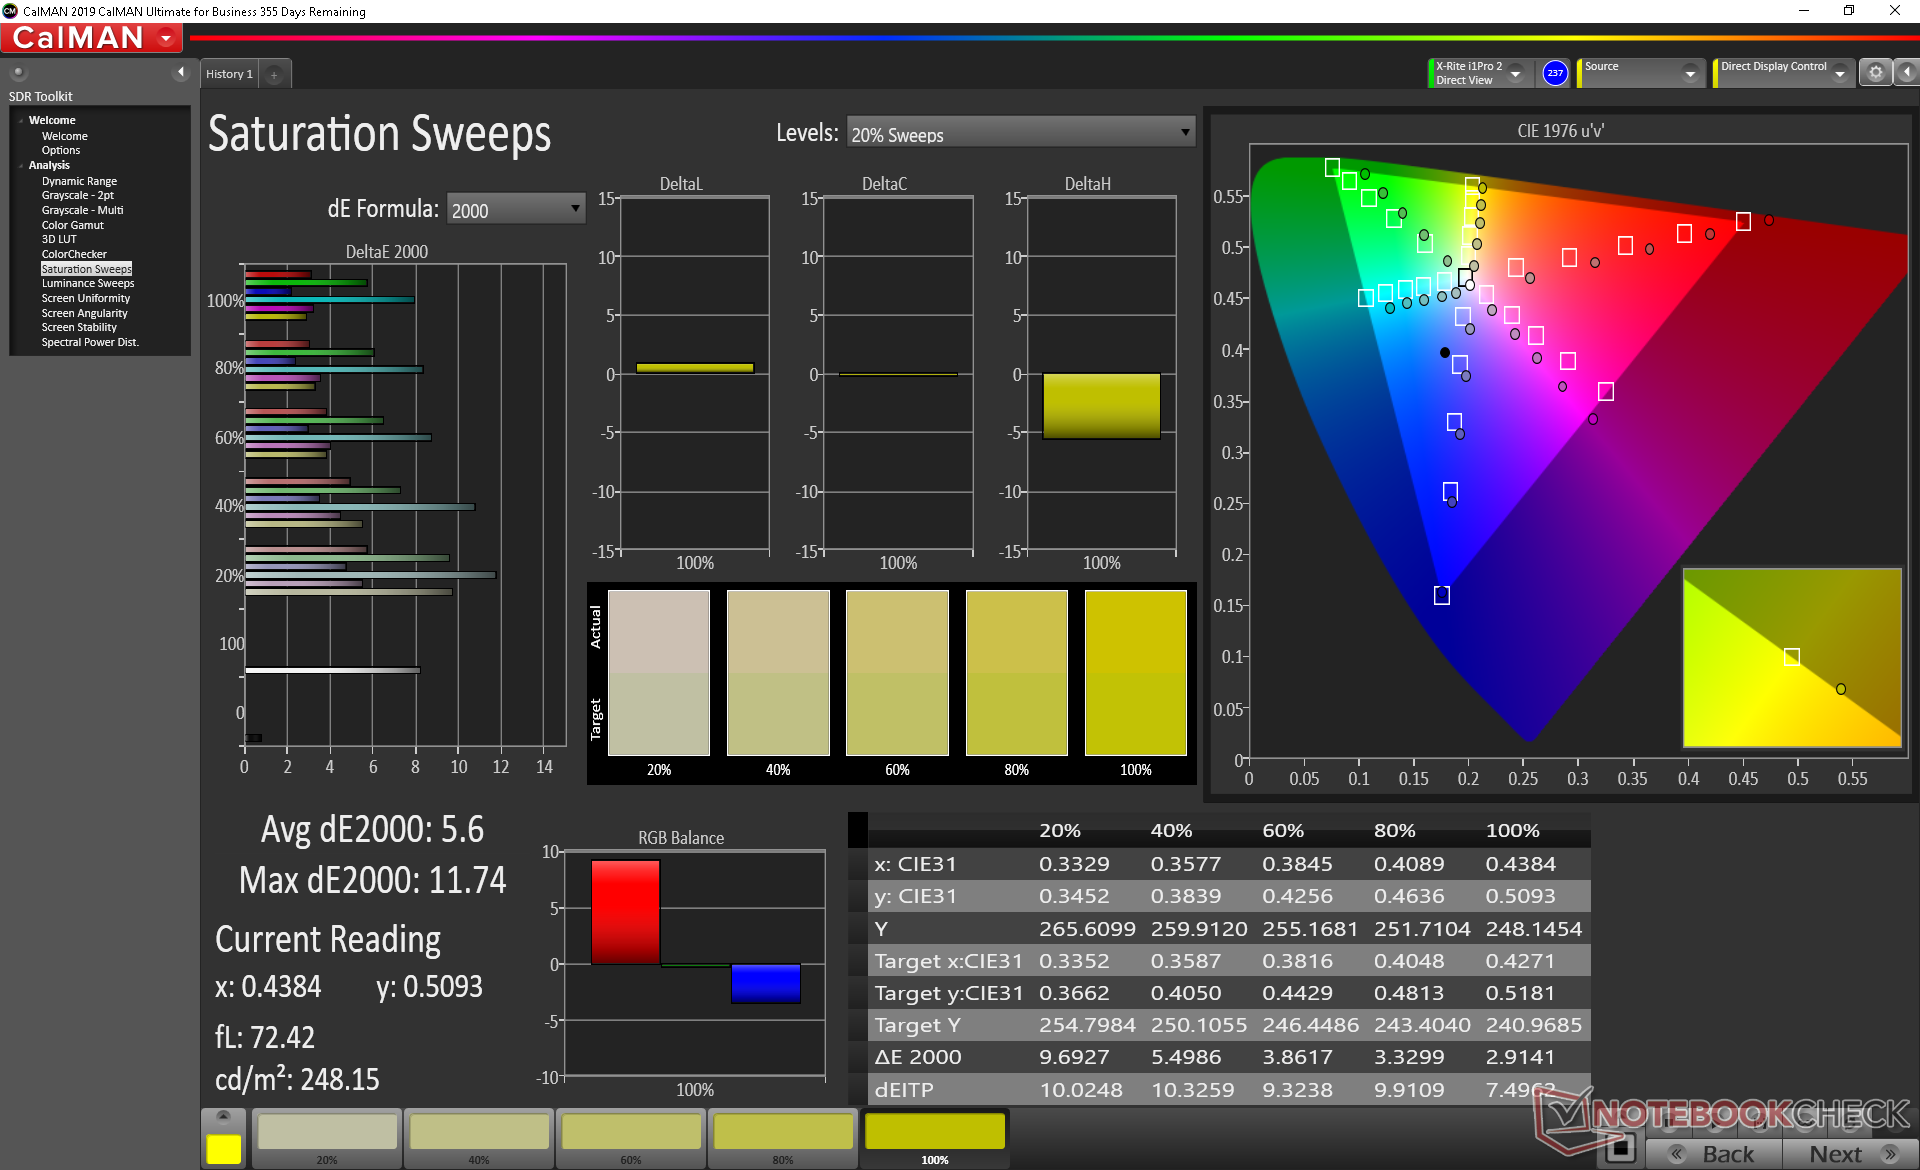
X-Rite kolorimetresi ile yapılan diğer ölçümler, aşırı sıcak bir renk sıcaklığı ve kutunun dışında zayıf RGB dengesini ortaya çıkarır, bu da panelin daha doğru renkler yapabileceğini biliyoruz. Ekranı kendimiz kalibre etmek hem gri tonlamayı hem de renkleri sırasıyla 8.1 ve 5.48 ortalama DeltaE değerlerinden sırasıyla 0.8 ve 2.22'ye önemli ölçüde geliştirir. Dizüstü bilgisayardan en iyi şekilde yararlanmak için ekranı kalibre etmenizi veya yukarıdaki ICM profilimizi uygulamanızı öneririz.
Yanıt Sürelerini Görüntüle
| ↔ Tepki Süresi Siyahtan Beyaza | ||
|---|---|---|
| 27.2 ms ... yükseliş ↗ ve sonbahar↘ birleşimi | ↗ 15.6 ms yükseliş | 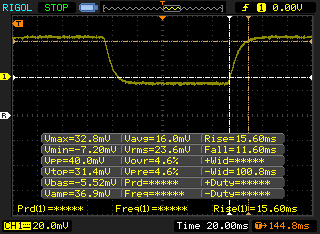 |
| ↘ 11.6 ms sonbahar | ||
| Ekran, testlerimizde nispeten yavaş yanıt oranları gösteriyor ve oyuncular için çok yavaş olabilir. Karşılaştırıldığında, test edilen tüm cihazlar 0.1 (minimum) ile 240 (maksimum) ms arasında değişir. » Tüm cihazların 69 %'si daha iyi. Bu, ölçülen yanıt süresinin test edilen tüm cihazların ortalamasından (19.9 ms) daha kötü olduğu anlamına gelir. | ||
| ↔ Tepki Süresi %50 Griden %80 Griye | ||
| 44.4 ms ... yükseliş ↗ ve sonbahar↘ birleşimi | ↗ 22.4 ms yükseliş | 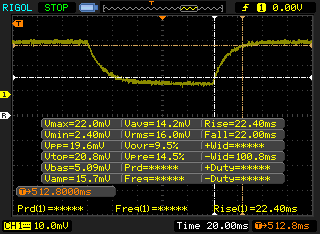 |
| ↘ 22 ms sonbahar | ||
| Ekran, testlerimizde yavaş yanıt oranları gösteriyor ve oyuncular için yetersiz olacaktır. Karşılaştırıldığında, test edilen tüm cihazlar 0.165 (minimum) ile 636 (maksimum) ms arasında değişir. » Tüm cihazların 76 %'si daha iyi. Bu, ölçülen yanıt süresinin test edilen tüm cihazların ortalamasından (31.1 ms) daha kötü olduğu anlamına gelir. | ||
Ekran Titremesi / PWM (Darbe Genişliği Modülasyonu)
| Ekran titriyor / PWM algılanmadı | 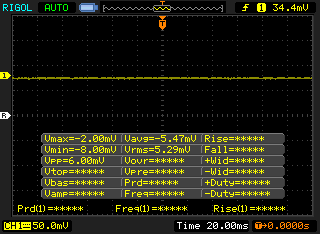 | ||
Karşılaştırıldığında: Test edilen tüm cihazların %52 %'si ekranı karartmak için PWM kullanmıyor. PWM tespit edilirse, ortalama 7798 (minimum: 5 - maksimum: 343500) Hz ölçüldü. | |||
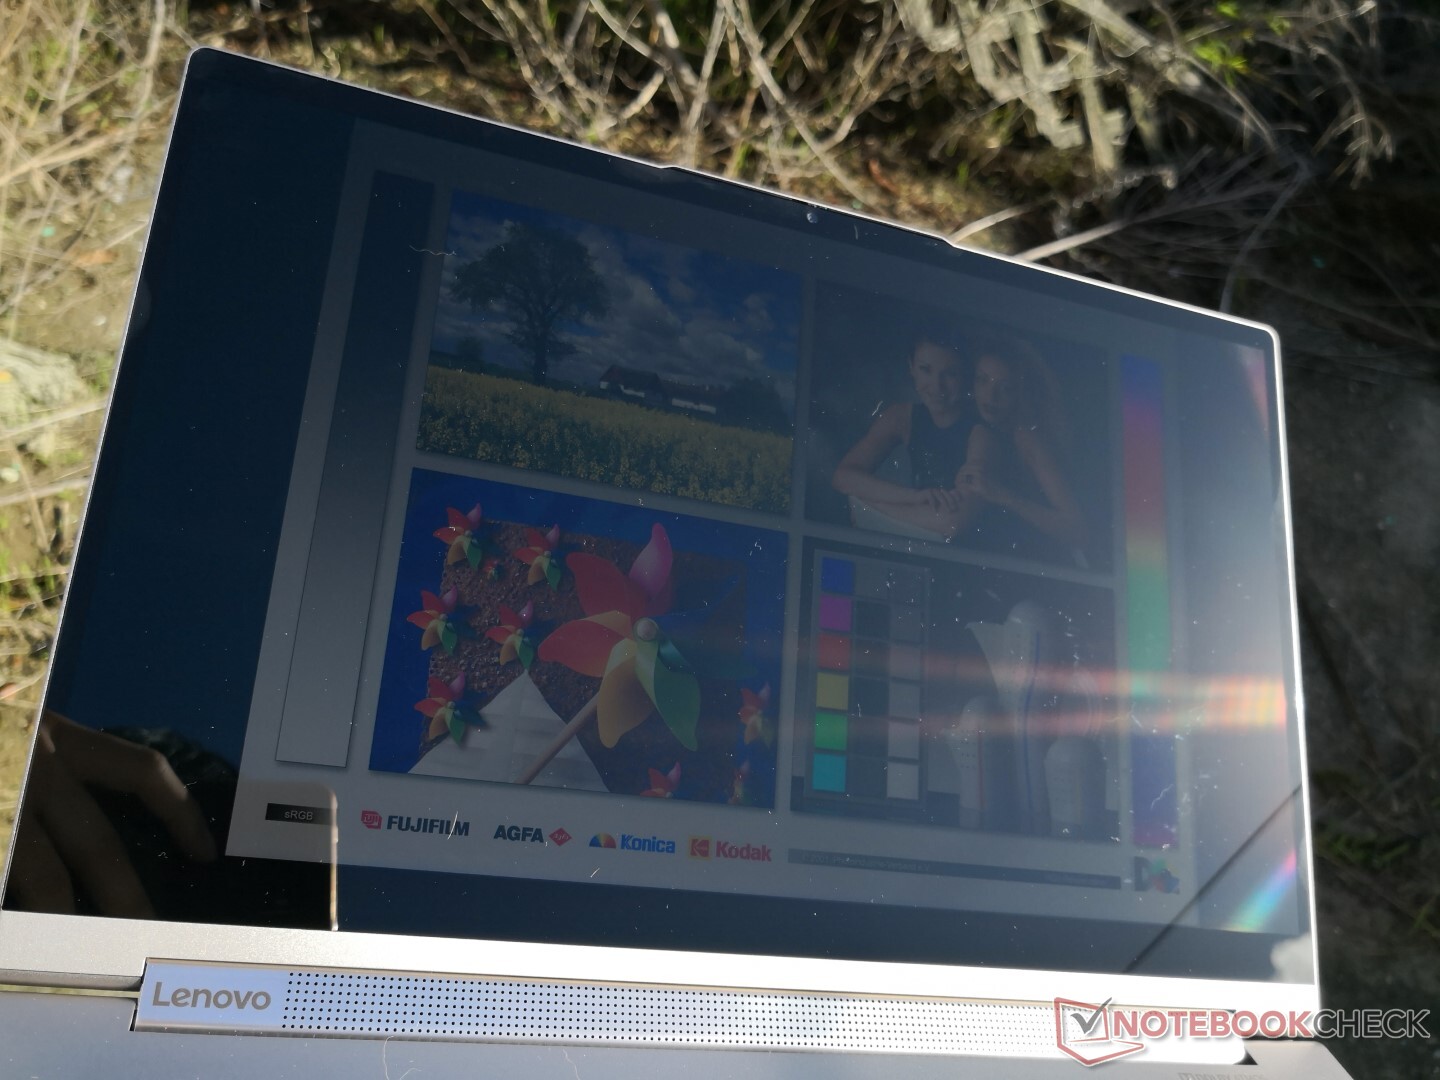
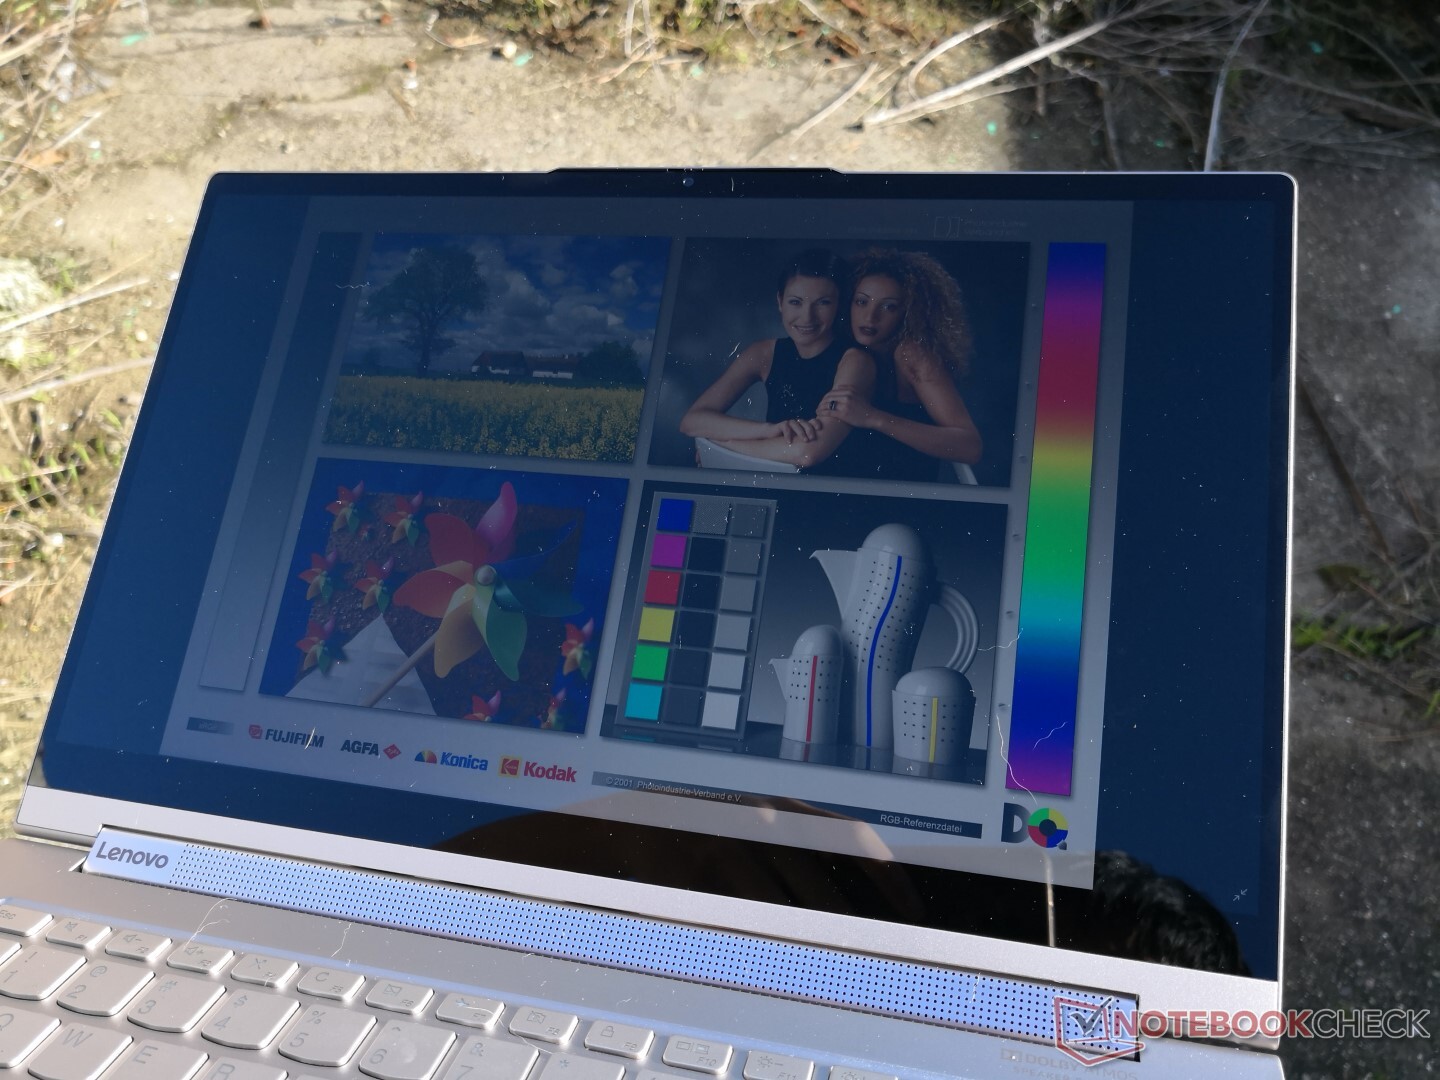
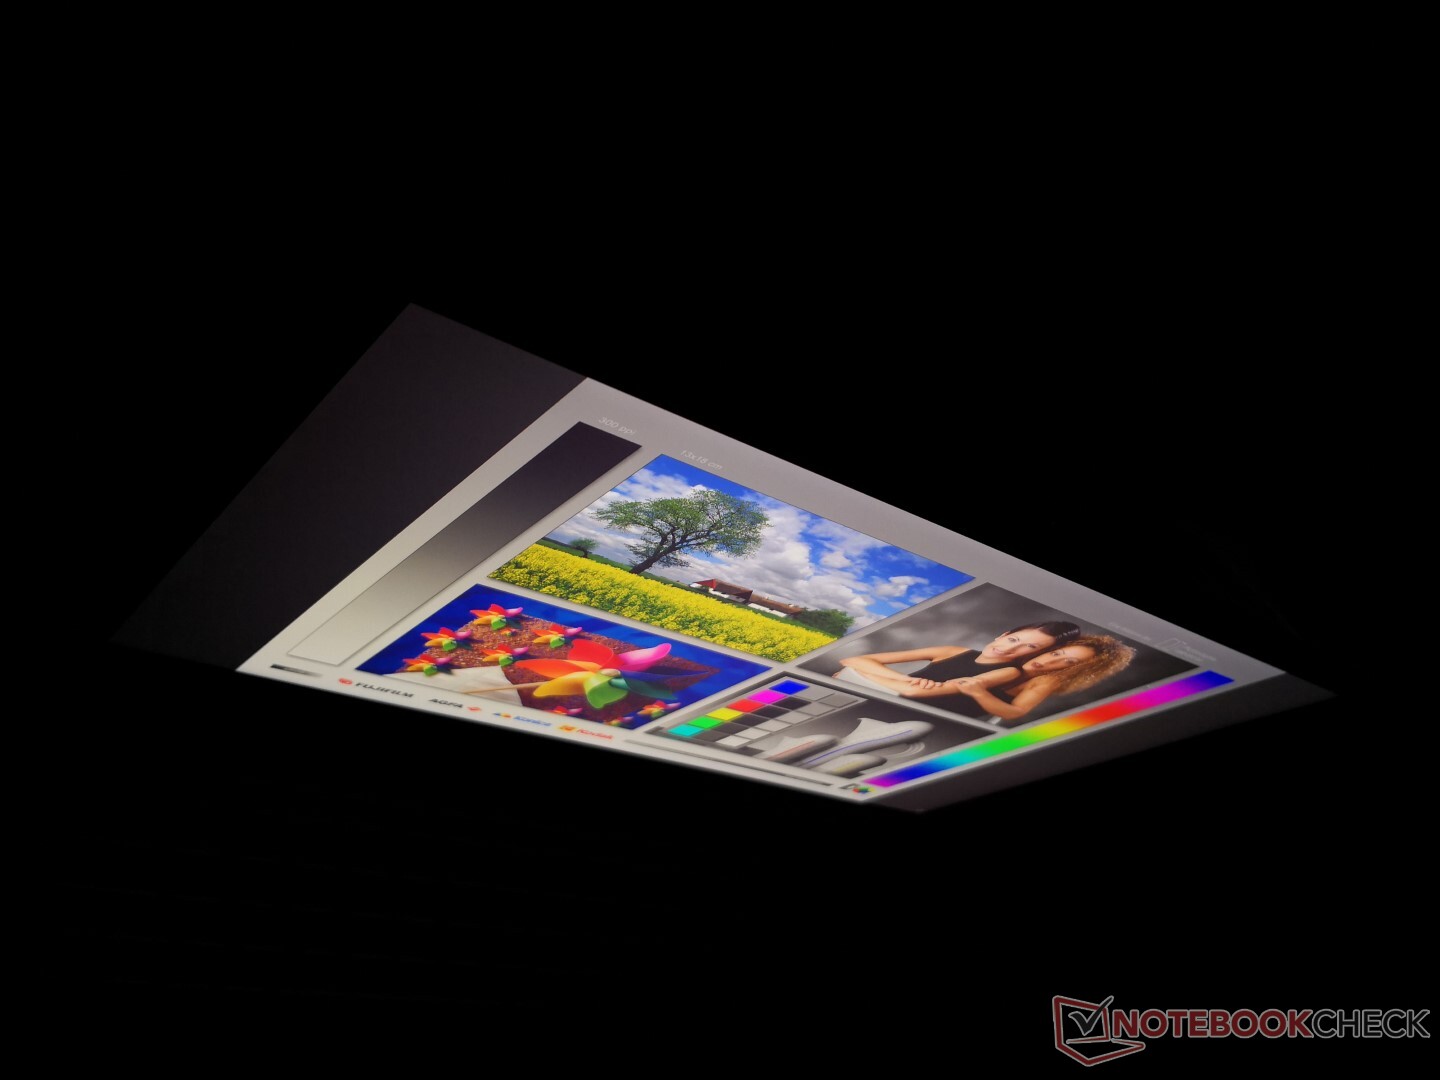
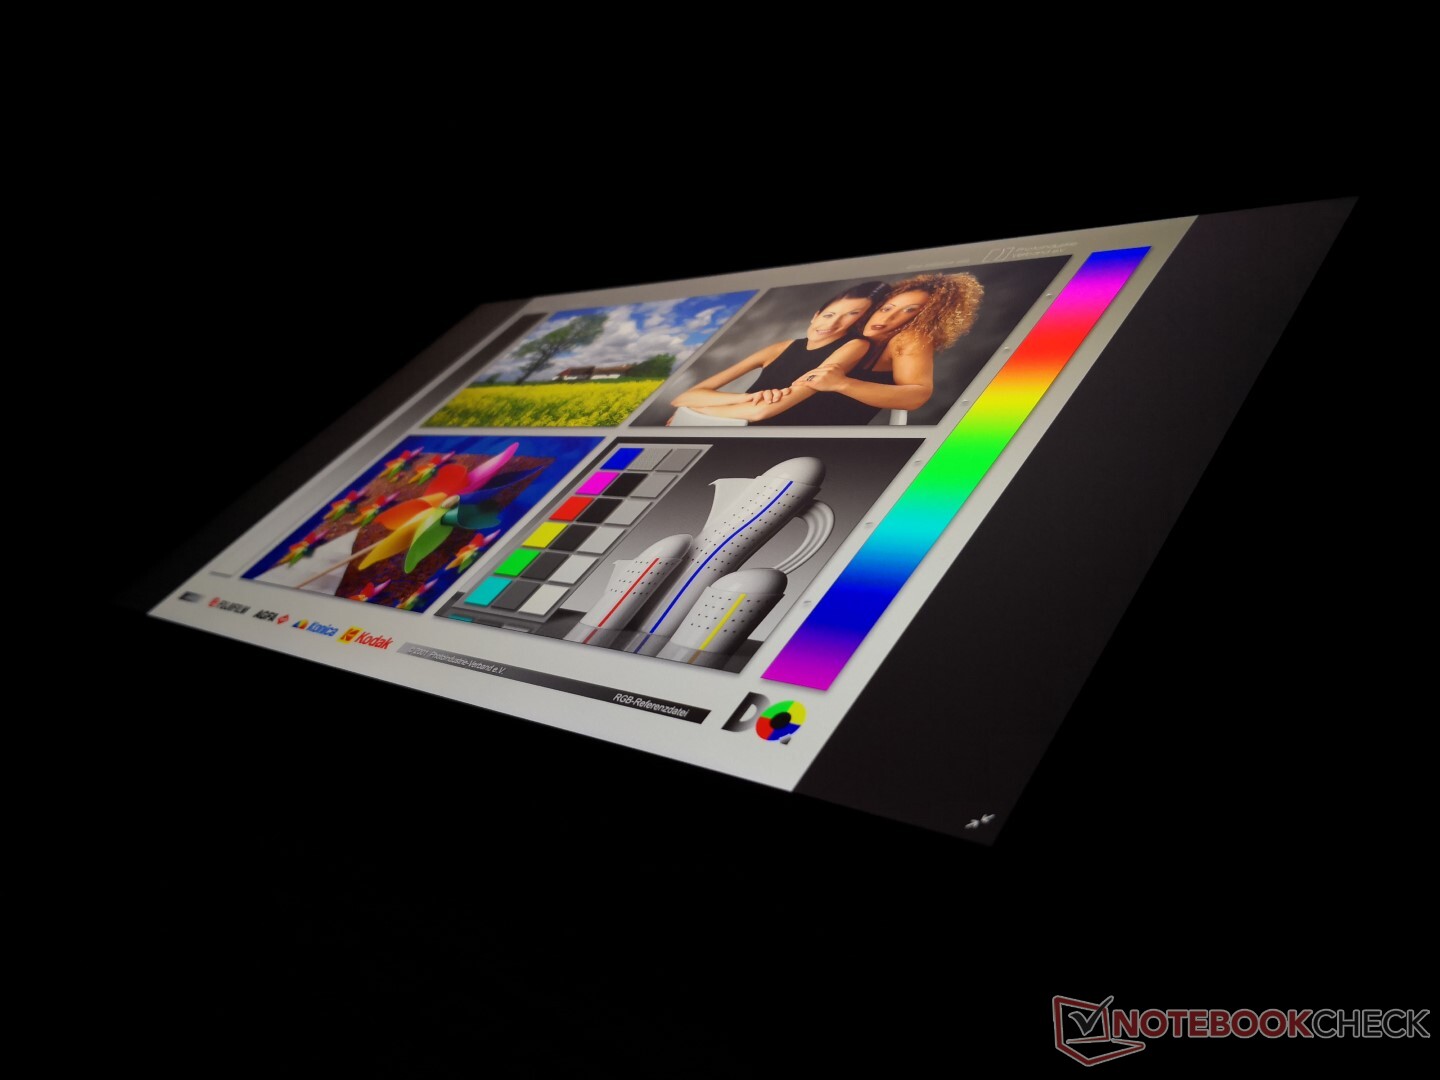
4K test ünitemiz, daha iyi dış mekan arkadaşı olmak için son FHD ünitemizden daha parlaktır. Yine de, parlak ekran nedeniyle doğrudan güneş ışığından kaçınmak ve yazı tipi ölçeklendirmesini artırmak en iyisidir. Dönüştürülebilir açık havada sık sık kullanmak istiyorsanız 1000 nit HP EliteBook veya Dragonfly'i düşünün. Görüş açıları, bir IPS panelinde olduğu gibi geniştir. Portre modundayken daha büyük 15,6 inç Yoga C940'a kıyasla renklerin ve parlaklığın daha kararlı olduğunu unutmayın.
Verim
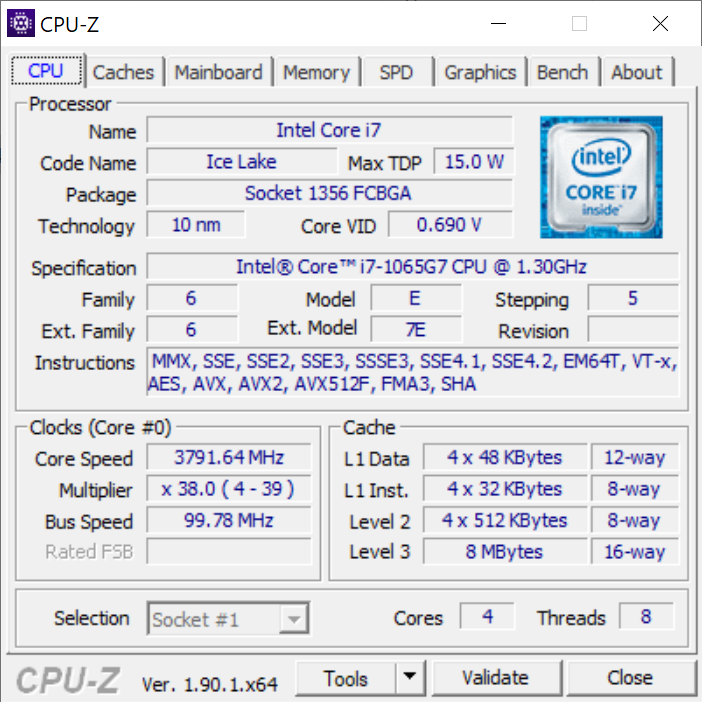
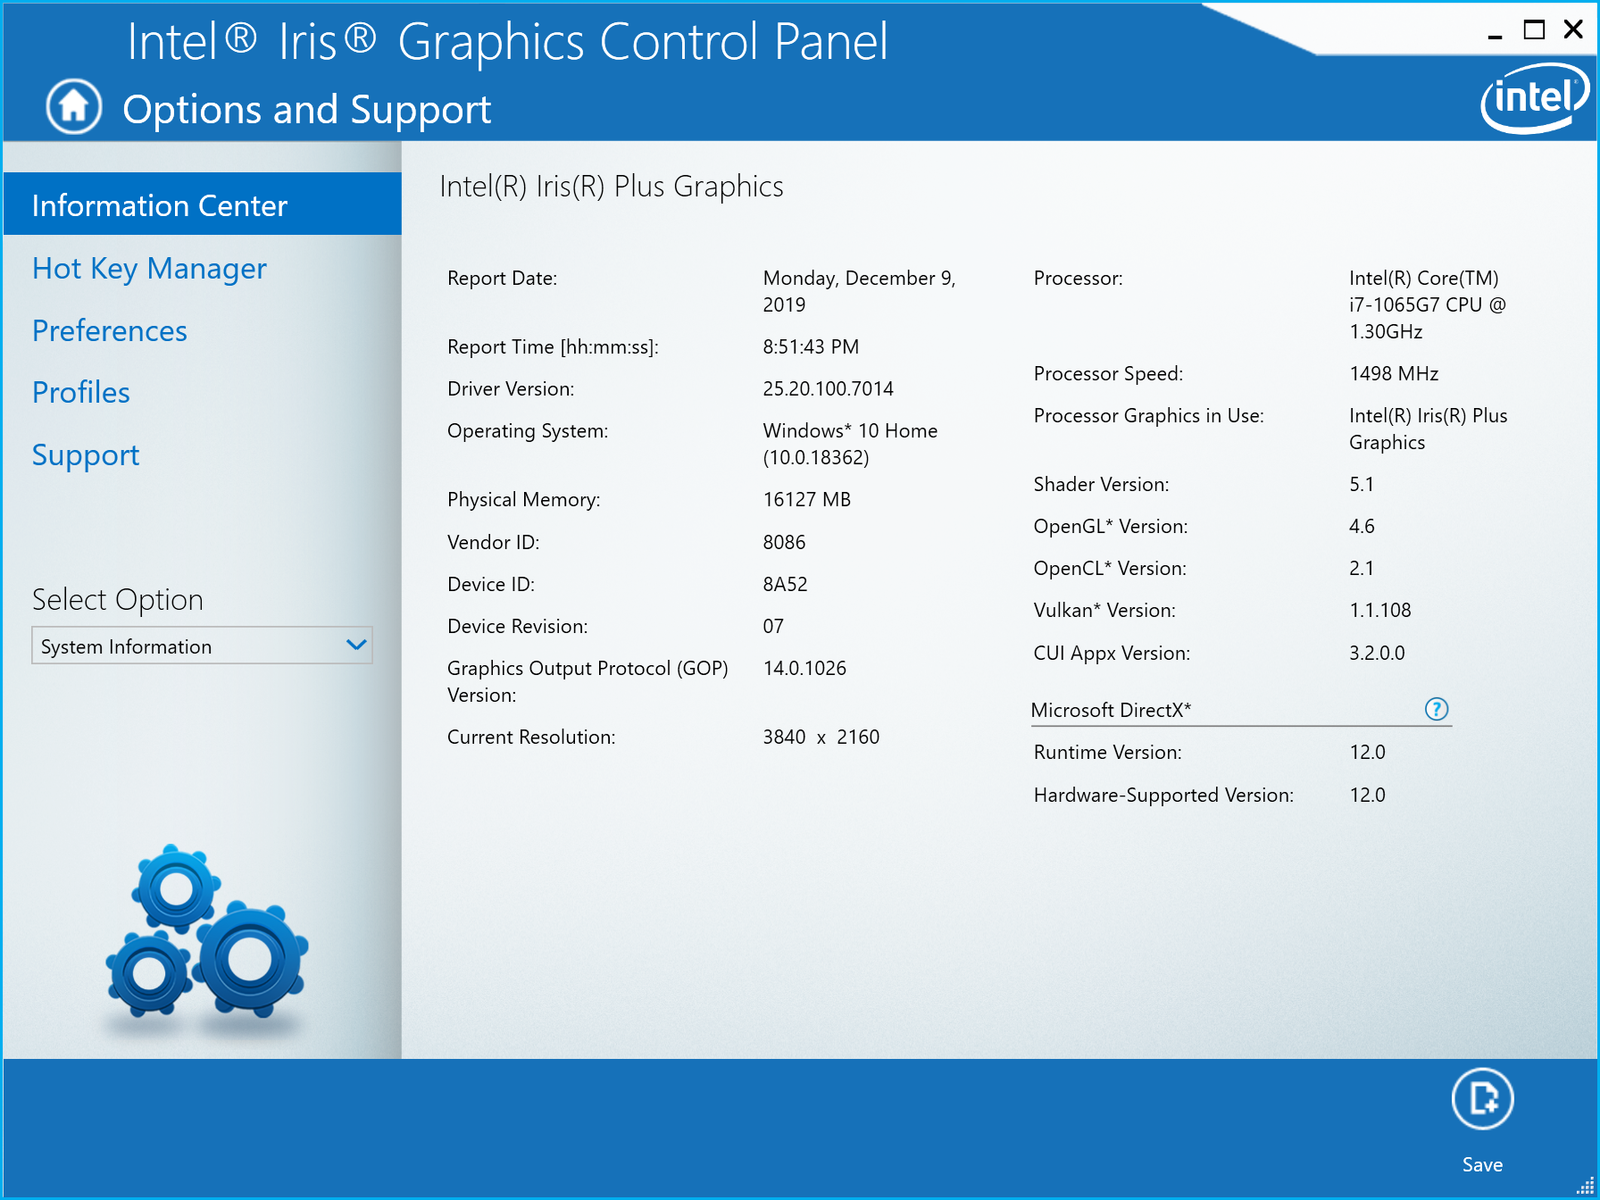
CPU ve RAM FHD SKU'muzla aynı kalırken, bazı 3DMark sorunlarını çözmek için Intel grafik sürücüsünü 25.20.100.7014 DCH olarak güncelledik. Bu nedenle, bu sefer 25 W Core i7-1065G7'nin ham performansının daha eksiksiz bir resmini çizebiliyoruz.
İşlemci
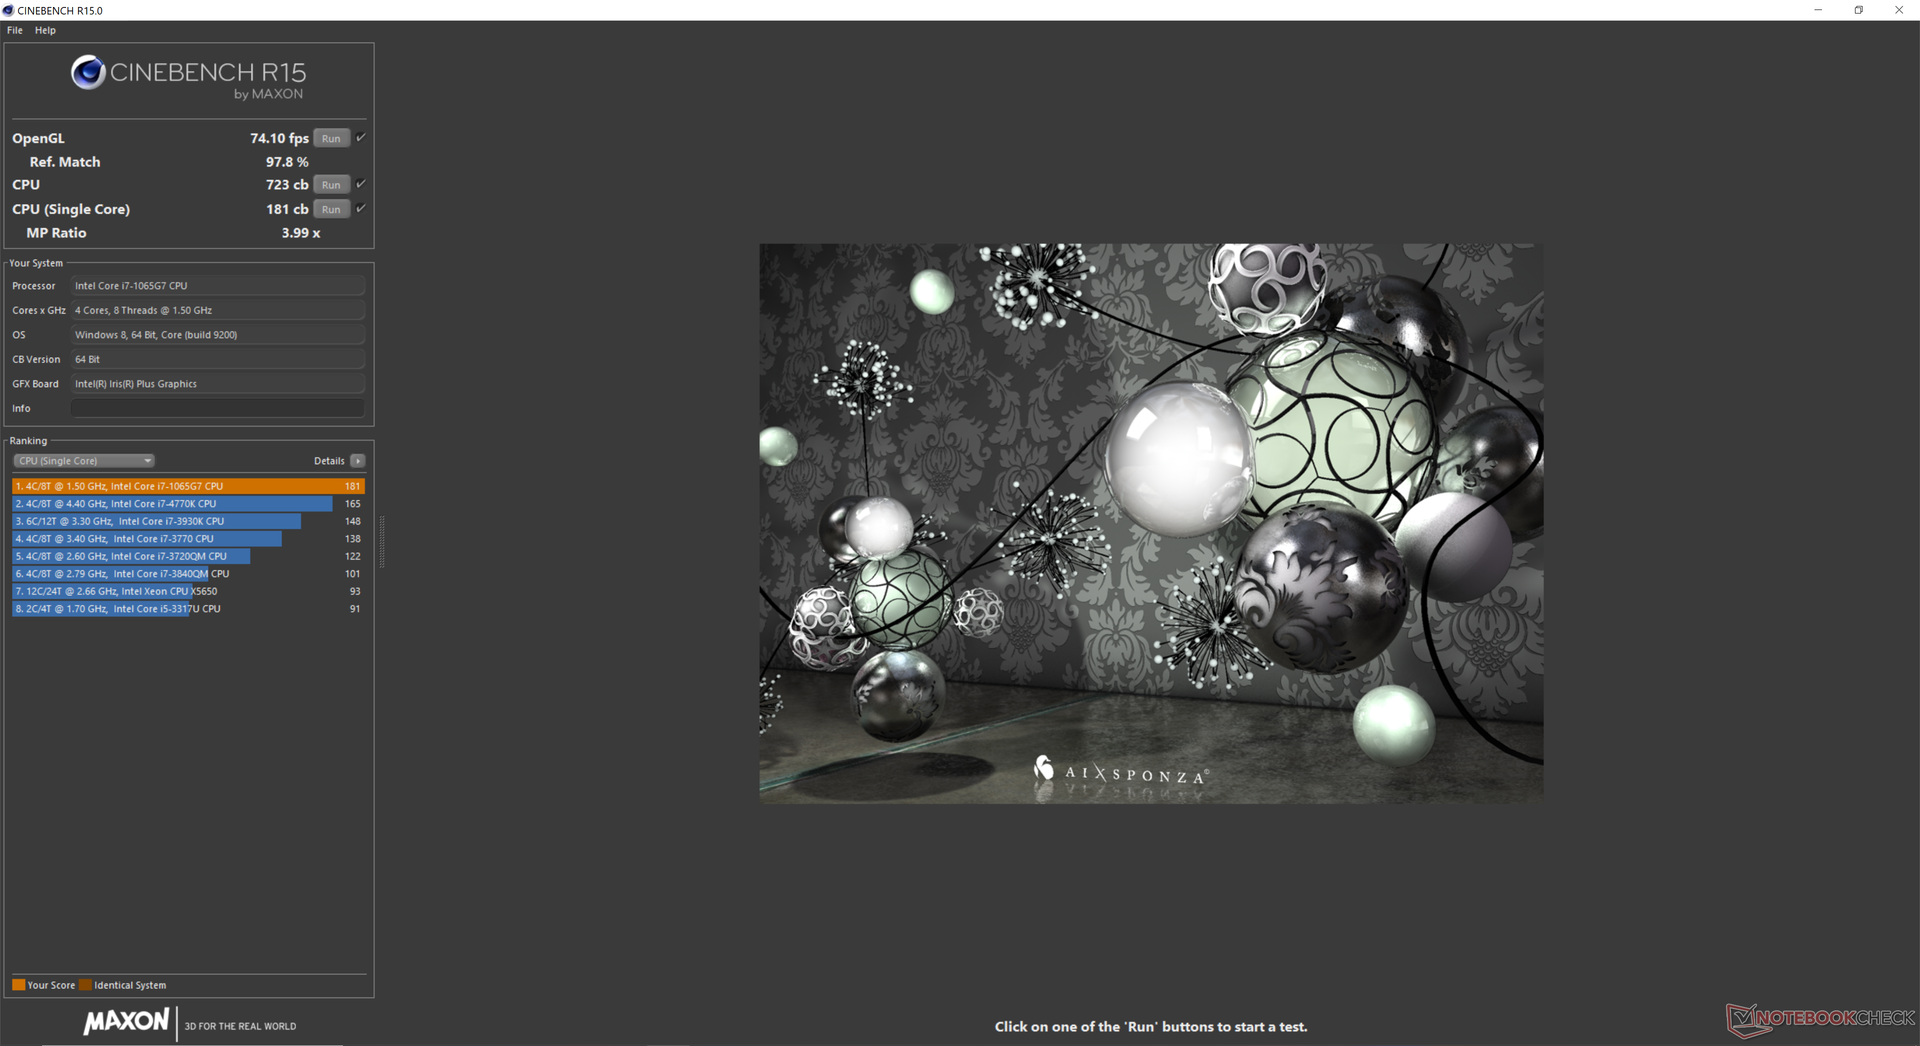
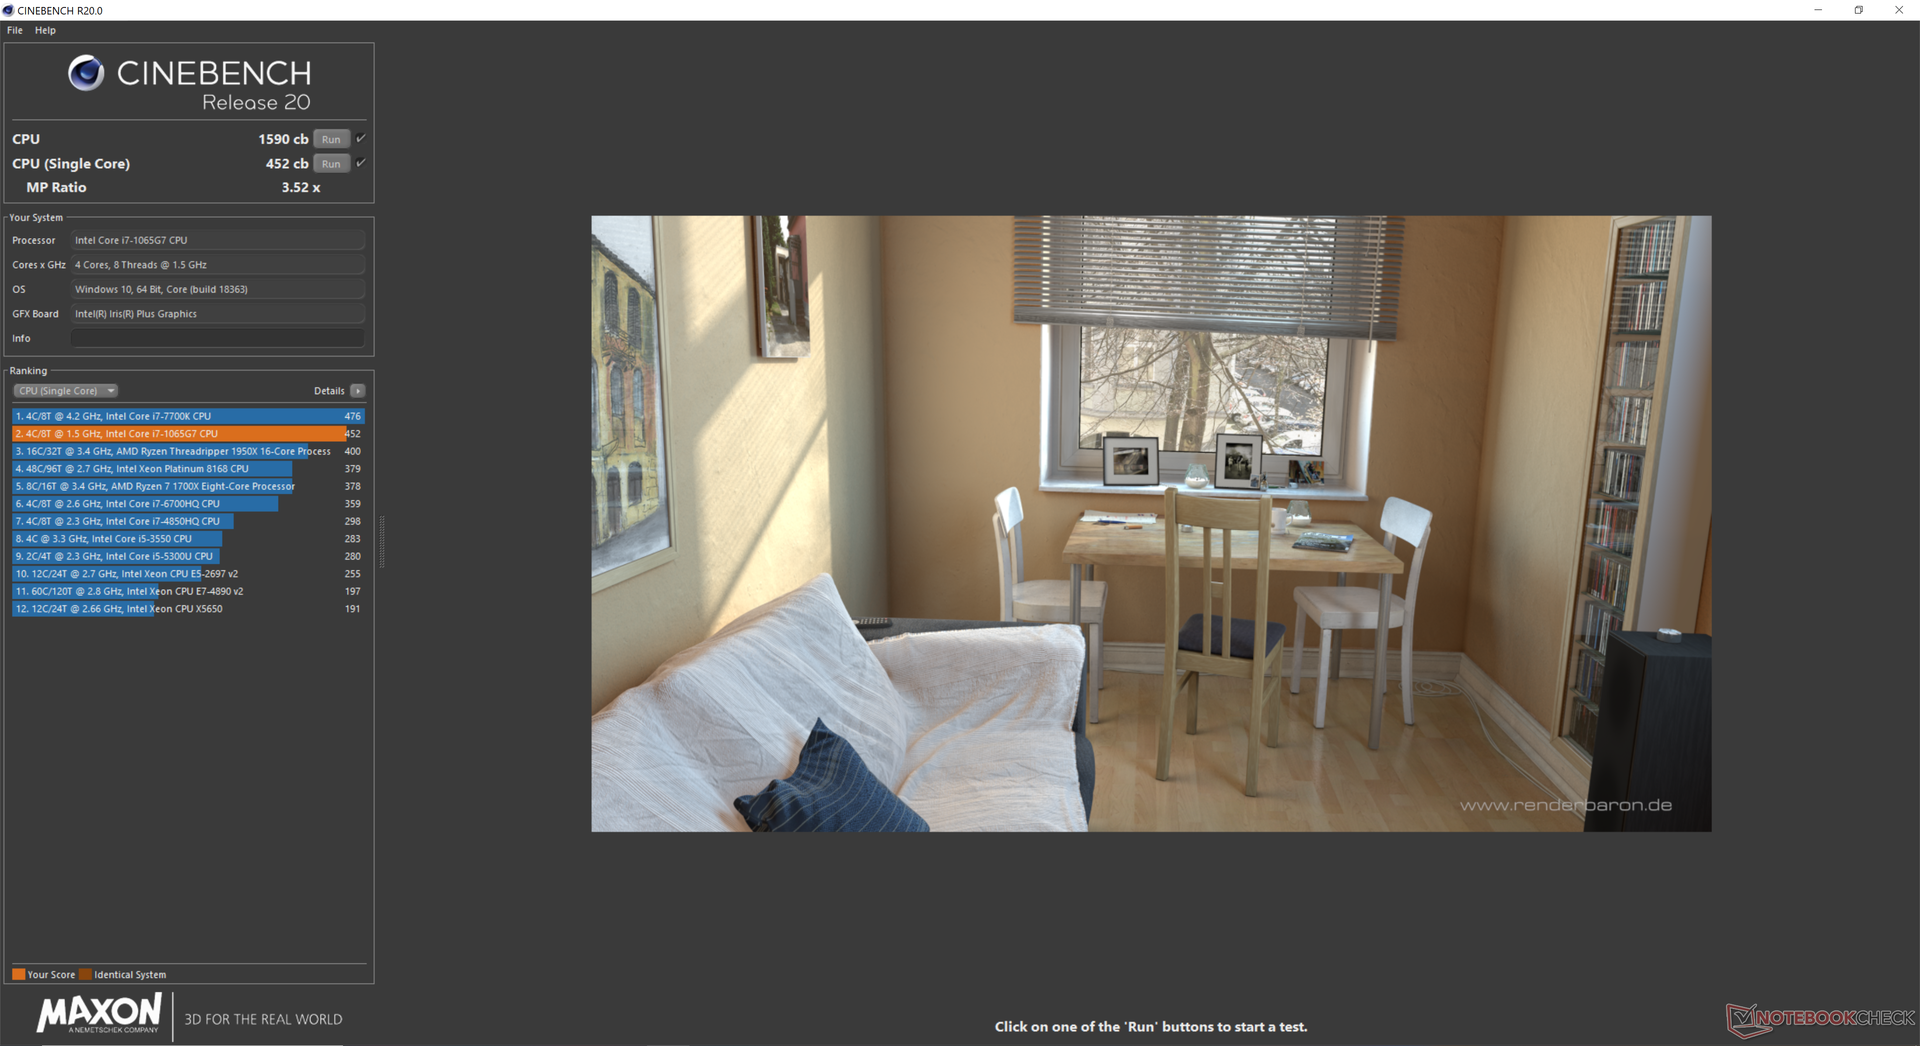
İşlemci performansı en çok son nesil Core i7-8565U veya mevcut Zen Ryzen 7 3700U'ya benziyor, çünkü Ice Lake ham CPU performansı yerine gen-gen GPU iyileştirmelerine odaklanıyor. Ancak, performans sürdürülebilirliği biraz daha iyi olabilir; CineBench R15 Multi-Thread'ı bir döngüde çalıştırırken, puanlar yüzde 18'lik bir performans düşüşünü temsil etmek için zamanla 750 puandan 615 puana kadar düşecektir. Sonuçlar hala Razer Blade Stealth GTX 1650 Max-Q'da bulunan aynı CPU'nun 15 W sürümünden çok daha iyi. Daha fazla teknik bilgi ve kıyaslama için Core i7-1065G7'deki özel sayfamıza bakın.
| Cinebench R20 | |
| CPU (Single Core) | |
| MSI Prestige 15 A10SC | |
| Lenovo Yoga C940-14IIL 81Q9 | |
| Ortalama Intel Core i7-1065G7 (358 - 474, n=31) | |
| MSI PS63 Modern 8SC | |
| Lenovo Yoga C940-15IRH | |
| Lenovo Legion Y540-17IRH | |
| Dell G5 15 5590 | |
| Dell XPS 13 7390 2-in-1 Core i3 | |
| Lenovo ThinkPad L590-20Q70019GE | |
| Dynabook Portege A30-E-174 | |
| Dell Latitude 14 5495 | |
| Dell Latitude 13 3390 | |
| Dell Inspiron 15 5000 5585 | |
| CPU (Multi Core) | |
| Dell G5 15 5590 | |
| Lenovo Yoga C940-15IRH | |
| MSI Prestige 15 A10SC | |
| Lenovo Legion Y540-17IRH | |
| Lenovo Yoga C940-14IIL 81Q9 | |
| MSI PS63 Modern 8SC | |
| Ortalama Intel Core i7-1065G7 (1081 - 2024, n=31) | |
| Dell Inspiron 15 5000 5585 | |
| Dell Latitude 14 5495 | |
| Lenovo ThinkPad L590-20Q70019GE | |
| Dynabook Portege A30-E-174 | |
| Dell Latitude 13 3390 | |
| Dell XPS 13 7390 2-in-1 Core i3 | |
| Cinebench R15 | |
| CPU Single 64Bit | |
| MSI Prestige 15 A10SC | |
| Lenovo Yoga C940-15IRH | |
| MSI PS63 Modern 8SC | |
| Lenovo Yoga C940-14IIL 81Q9 | |
| Ortalama Intel Core i7-1065G7 (141 - 190, n=35) | |
| Lenovo Legion Y540-17IRH | |
| Dell G5 15 5590 | |
| Lenovo ThinkPad L590-20Q70019GE | |
| Dell XPS 13 7390 2-in-1 Core i3 | |
| Dynabook Portege A30-E-174 | |
| Dell Latitude 14 5495 | |
| Dell Latitude 13 3390 | |
| Dell Inspiron 15 5000 5585 | |
| CPU Multi 64Bit | |
| Lenovo Yoga C940-15IRH | |
| Dell G5 15 5590 | |
| MSI Prestige 15 A10SC | |
| Lenovo Legion Y540-17IRH | |
| Lenovo Yoga C940-14IIL 81Q9 | |
| MSI PS63 Modern 8SC | |
| Dell Inspiron 15 5000 5585 | |
| Dell Latitude 14 5495 | |
| Ortalama Intel Core i7-1065G7 (288 - 836, n=36) | |
| Dell Latitude 13 3390 | |
| Lenovo ThinkPad L590-20Q70019GE | |
| Dynabook Portege A30-E-174 | |
| Dell XPS 13 7390 2-in-1 Core i3 | |
| Cinebench R11.5 | |
| CPU Single 64Bit | |
| Ortalama Intel Core i7-1065G7 (2.09 - 2.17, n=4) | |
| Dell XPS 13 7390 2-in-1 Core i3 | |
| Dell Latitude 13 3390 | |
| Dell Inspiron 15 5000 5585 | |
| CPU Multi 64Bit | |
| Dell Inspiron 15 5000 5585 | |
| Ortalama Intel Core i7-1065G7 (5.69 - 9.37, n=4) | |
| Dell Latitude 13 3390 | |
| Dell XPS 13 7390 2-in-1 Core i3 | |
| Cinebench R10 | |
| Rendering Multiple CPUs 32Bit | |
| Dell G5 15 5590 | |
| Lenovo Legion Y540-17IRH | |
| Ortalama Intel Core i7-1065G7 (16551 - 26481, n=4) | |
| Dynabook Portege A30-E-174 | |
| Dell XPS 13 7390 2-in-1 Core i3 | |
| Rendering Single 32Bit | |
| Ortalama Intel Core i7-1065G7 (7083 - 7390, n=4) | |
| Dell XPS 13 7390 2-in-1 Core i3 | |
| Lenovo Legion Y540-17IRH | |
| Dell G5 15 5590 | |
| Dynabook Portege A30-E-174 | |
| wPrime 2.10 - 1024m | |
| Dell XPS 13 7390 2-in-1 Core i3 | |
| Ortalama Intel Core i7-1065G7 (233 - 354, n=3) | |
* ... daha küçük daha iyidir
Sistem performansı
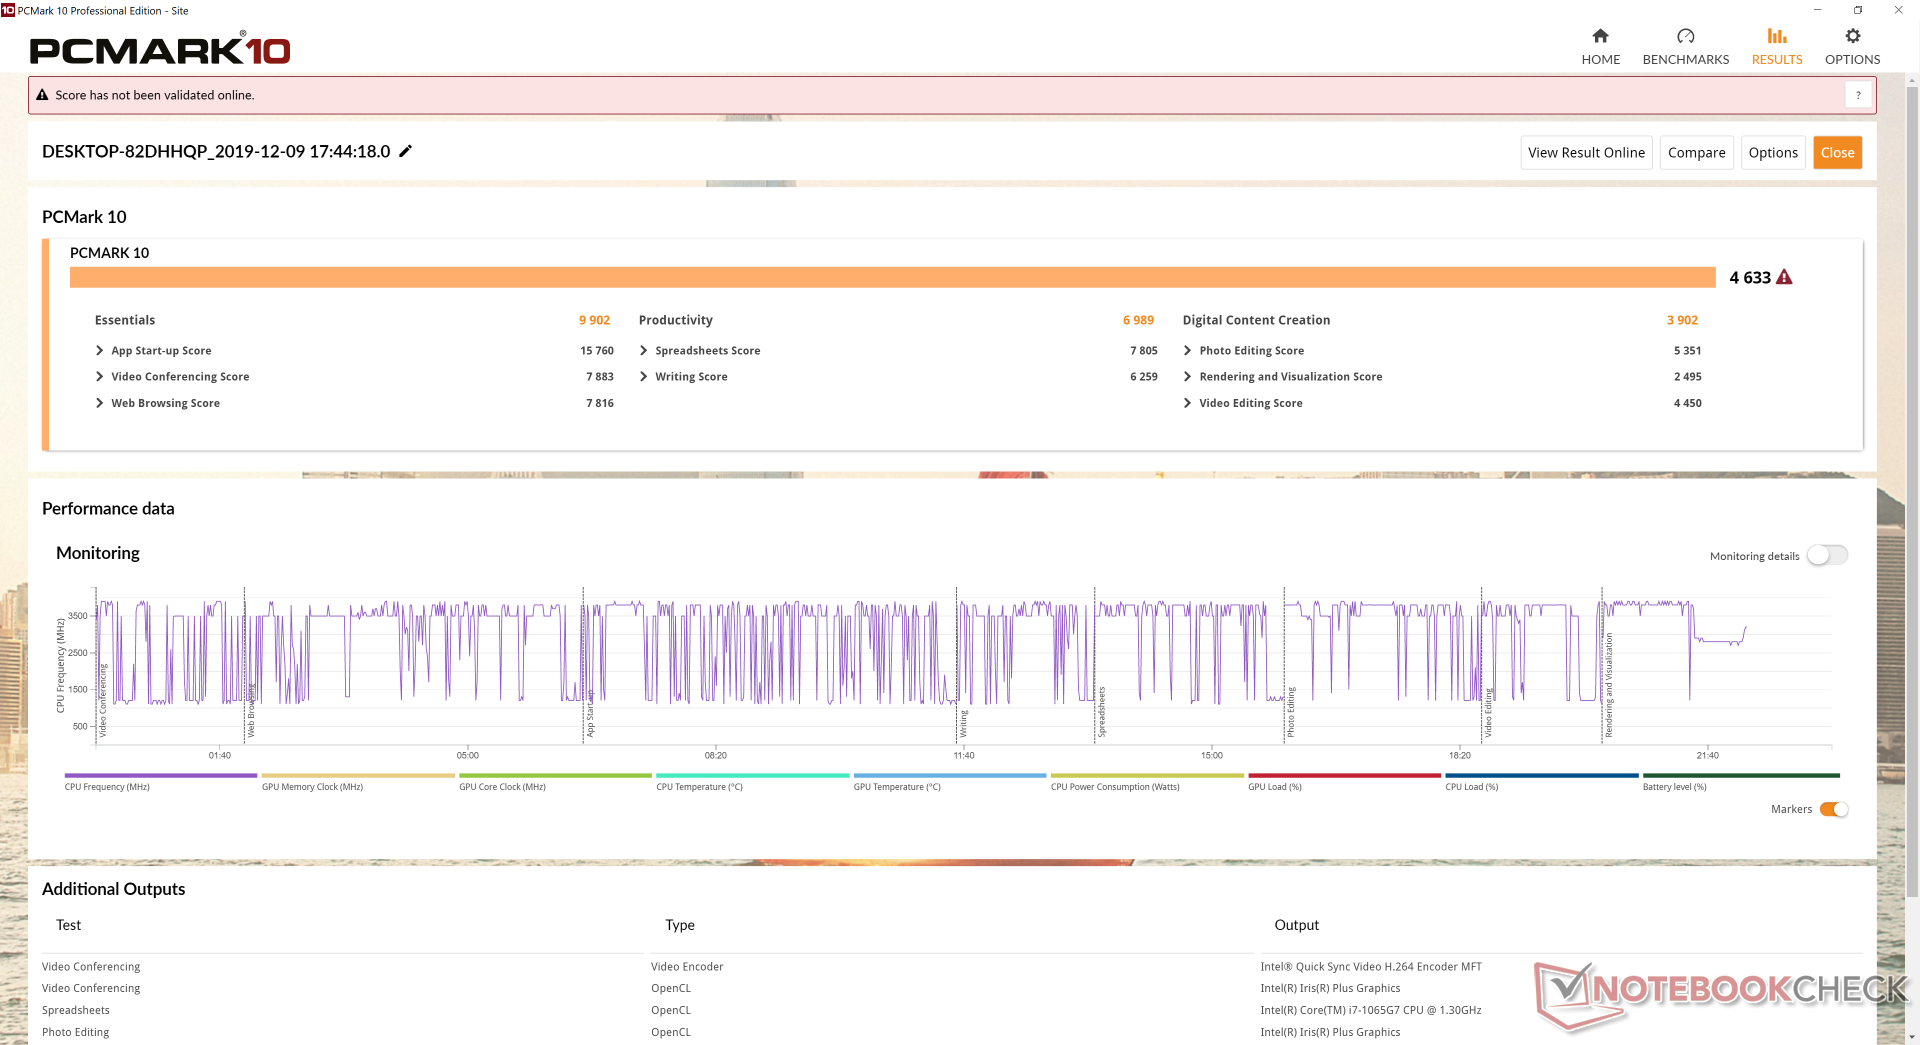
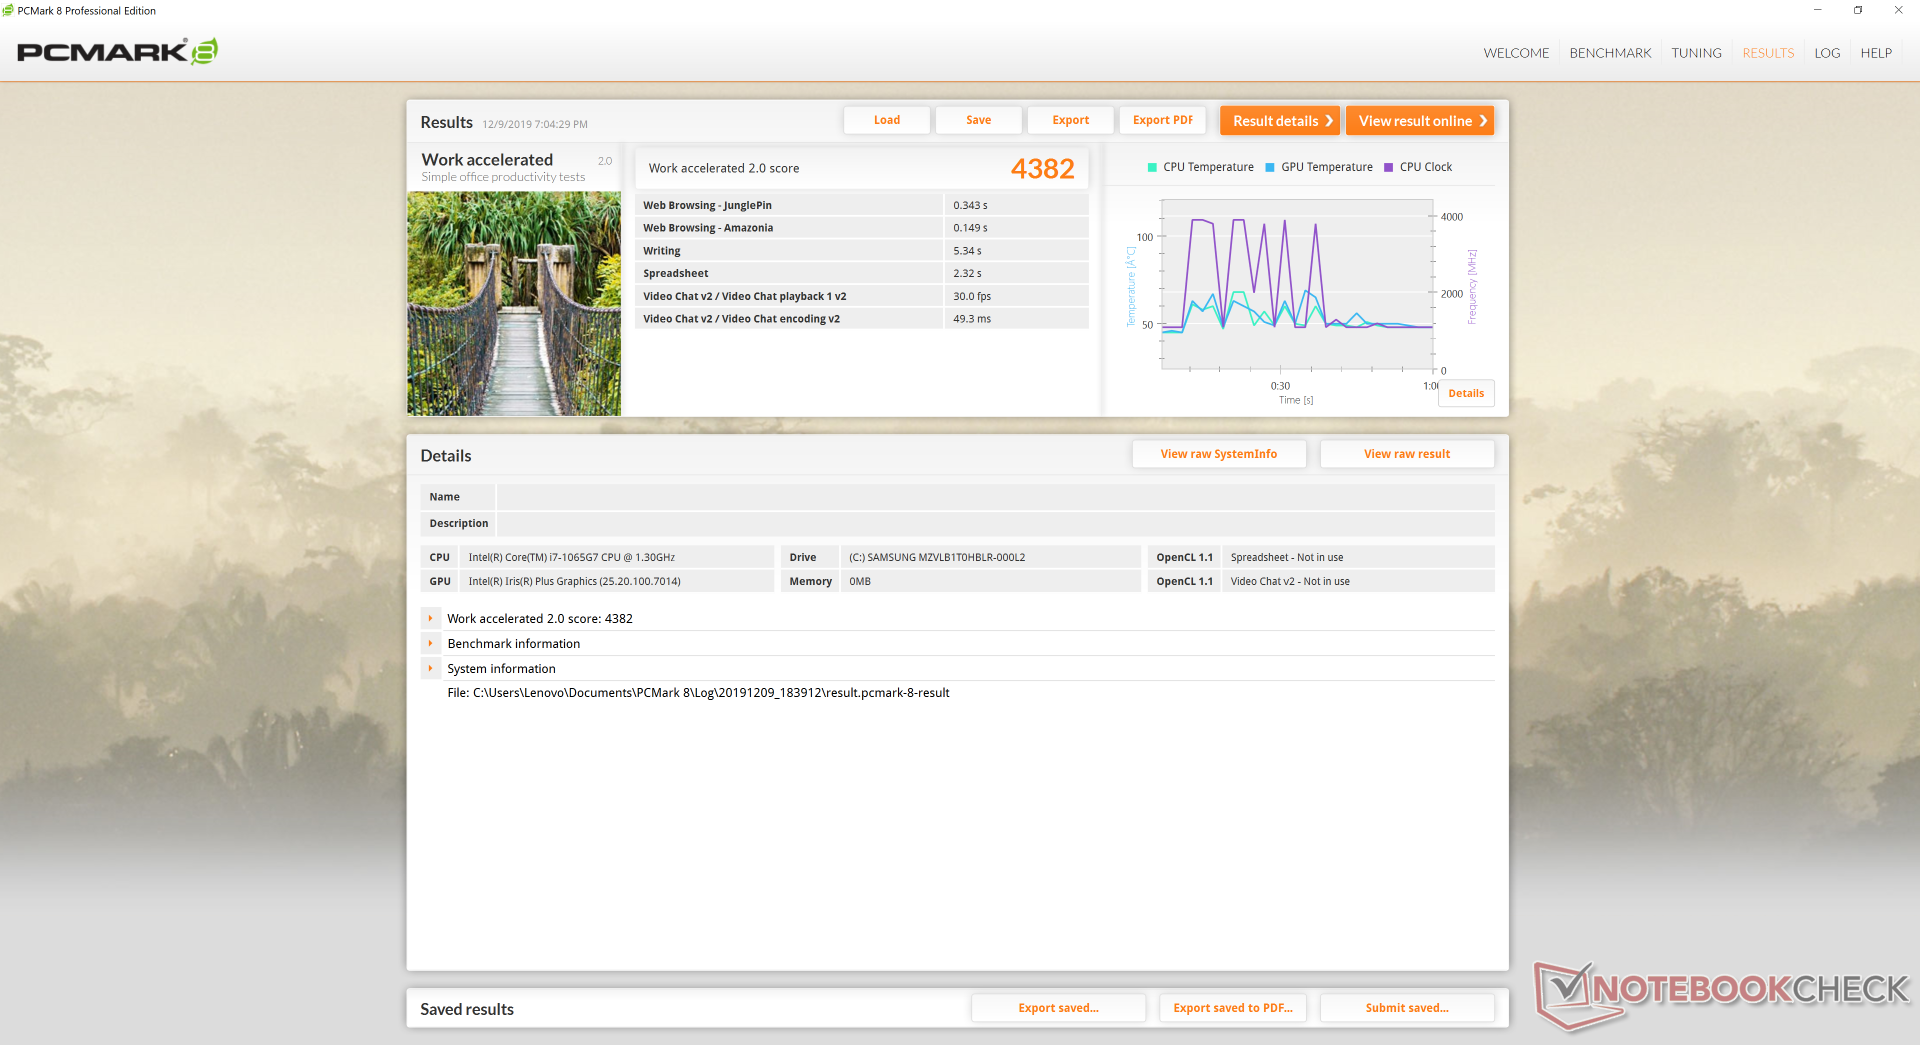
PCMark sonuçları, doğal çözünürlük farklılıklarına rağmen son Yoga C940'ımızla özdeştir.
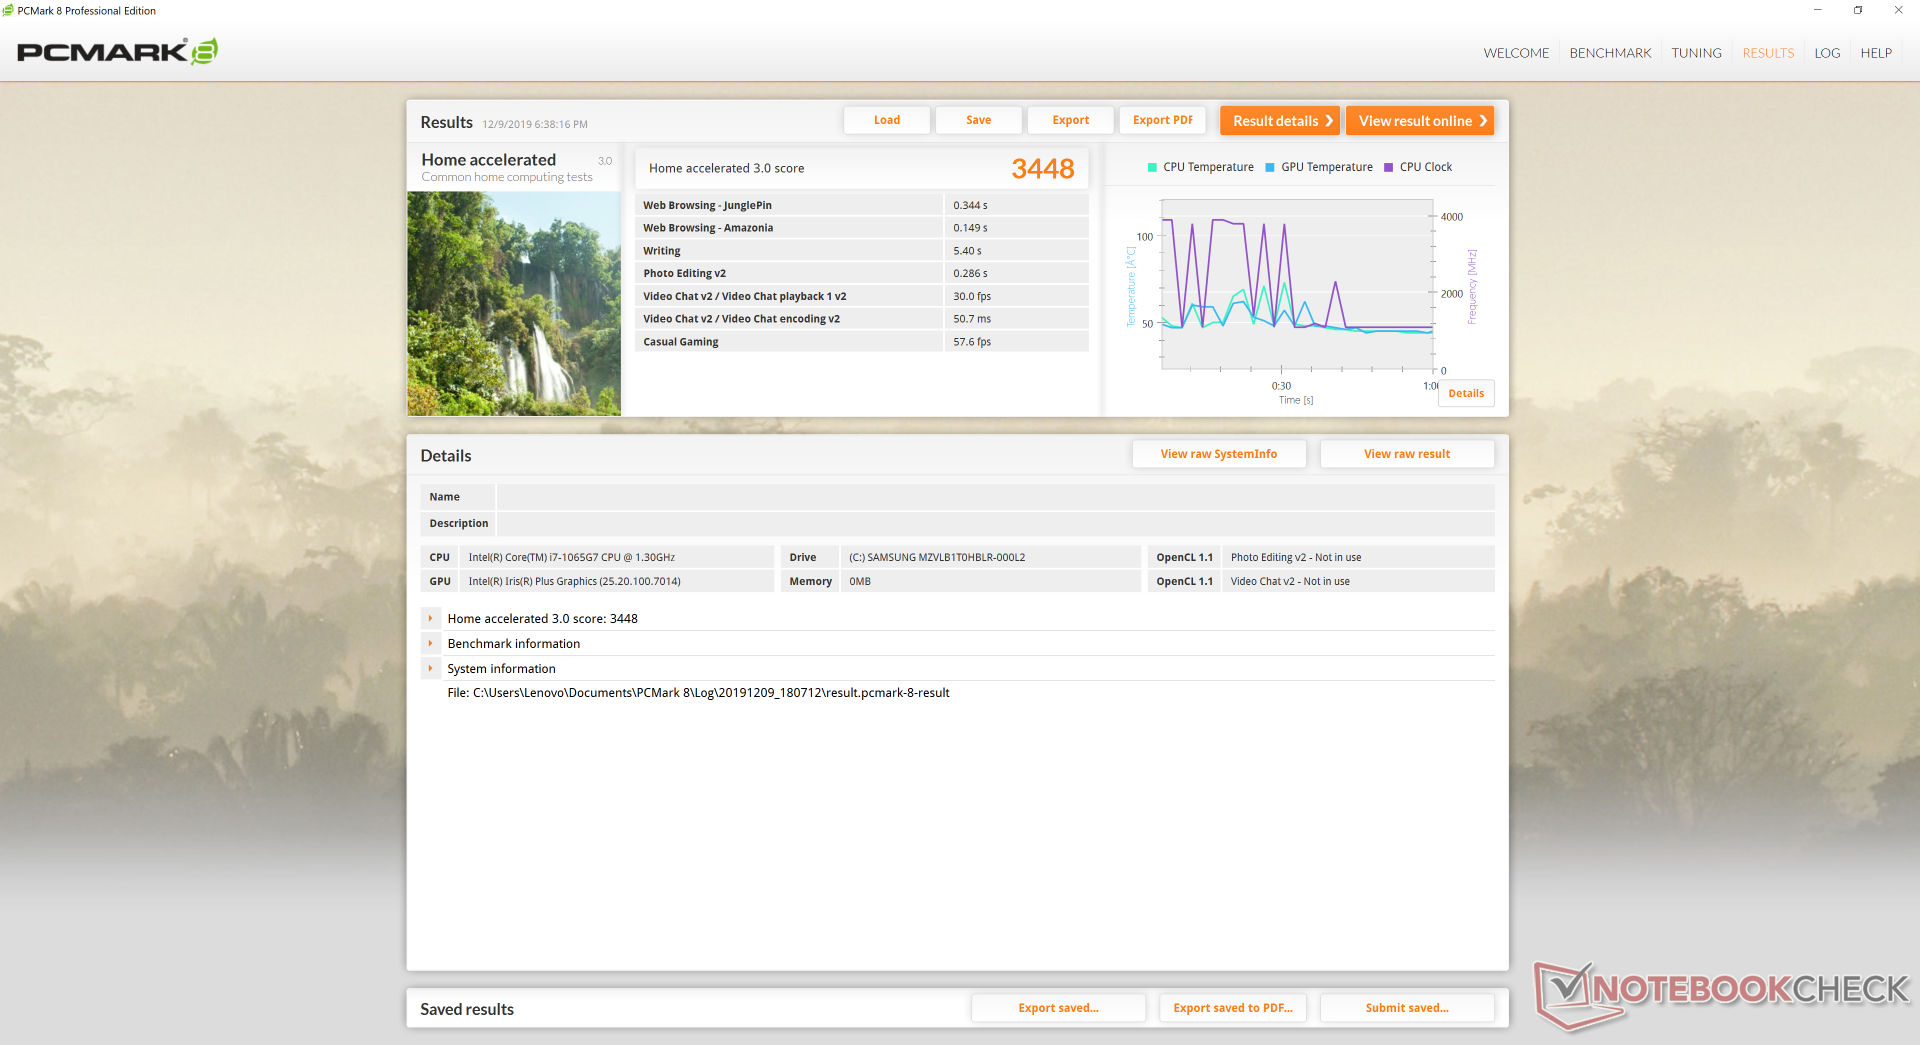
| PCMark 8 Home Score Accelerated v2 | 3448 puan | |
| PCMark 8 Work Score Accelerated v2 | 4382 puan | |
| PCMark 10 Score | 4633 puan | |
Yardım | ||
Storage Devices
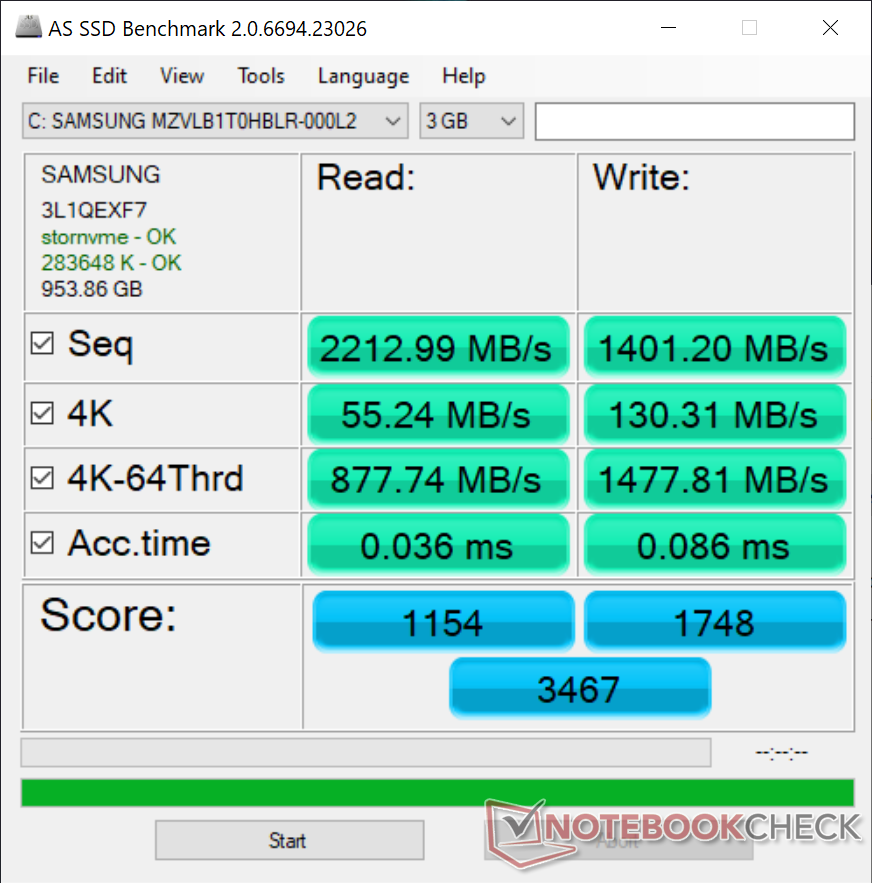
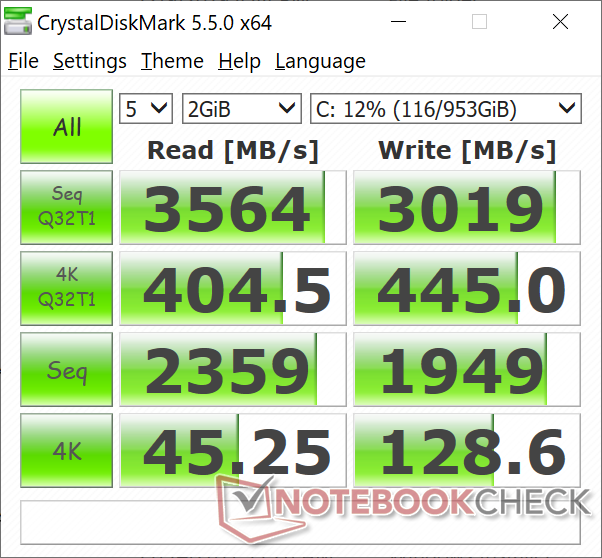
Whereas our Yoga C940 FHD SKU comes equipped with a 512 GB Samsung PM981, our Yoga C940 4K SKU comes with the larger 1 TB version. Performance is otherwise very similar between them with average sequential read and write rates reaching more than 2200 MB/s and 1200 MB/s each, respectively. See our table of HDDs and SSDs for more comparisons between drives.
| Lenovo Yoga C940-14IIL 81Q9 Samsung PM981a MZVLB1T0HBLR | Lenovo Yoga C930-13IKB 81C4 SK hynix PC401 HFS256GD9TNG | Lenovo Yoga C940-14IIL Samsung SSD PM981 MZVLB512HAJQ | Dell XPS 13 7390 2-in-1 Core i7 Toshiba BG4 KBG40ZPZ512G | Razer Blade Stealth i7-1065G7 Iris Plus Samsung SSD PM981 MZVLB256HAHQ | Asus ZenBook S13 UX392FN WDC PC SN520 SDAPNUW-512G | |
|---|---|---|---|---|---|---|
| AS SSD | -162% | 3% | -74% | -45% | -15% | |
| Seq Read (MB/s) | 2213 | 1228 -45% | 2525 14% | 1801 -19% | 1989 -10% | 1224 -45% |
| Seq Write (MB/s) | 1401 | 544 -61% | 1253 -11% | 1125 -20% | 827 -41% | 907 -35% |
| 4K Read (MB/s) | 55.2 | 39.16 -29% | 59.1 7% | 39.7 -28% | 40.12 -27% | 41.46 -25% |
| 4K Write (MB/s) | 130.3 | 106.5 -18% | 134.1 3% | 67 -49% | 135.1 4% | 126.2 -3% |
| 4K-64 Read (MB/s) | 878 | 466.4 -47% | 1010 15% | 1253 43% | 531 -40% | 1021 16% |
| 4K-64 Write (MB/s) | 1478 | 305.1 -79% | 1461 -1% | 209 -86% | 309.9 -79% | 1251 -15% |
| Access Time Read * (ms) | 0.036 | 0.46 -1178% | 0.052 -44% | 0.069 -92% | 0.085 -136% | 0.053 -47% |
| Access Time Write * (ms) | 0.086 | 0.51 -493% | 0.029 66% | 0.625 -627% | 0.09 -5% | 0.027 69% |
| Score Read (Points) | 1154 | 628 -46% | 1322 15% | 1472 28% | 770 -33% | 1185 3% |
| Score Write (Points) | 1748 | 466 -73% | 1721 -2% | 388 -78% | 528 -70% | 1468 -16% |
| Score Total (Points) | 3467 | 1394 -60% | 3670 6% | 2583 -25% | 1644 -53% | 3250 -6% |
| Copy ISO MB/s (MB/s) | 2161 | 628 -71% | 2016 -7% | 1293 -40% | 1418 -34% | 1404 -35% |
| Copy Program MB/s (MB/s) | 572 | 540 -6% | 542 -5% | 560 -2% | 382.7 -33% | 402.4 -30% |
| Copy Game MB/s (MB/s) | 1433 | 533 -63% | 1278 -11% | 927 -35% | 334.2 -77% | 902 -37% |
* ... daha küçük daha iyidir

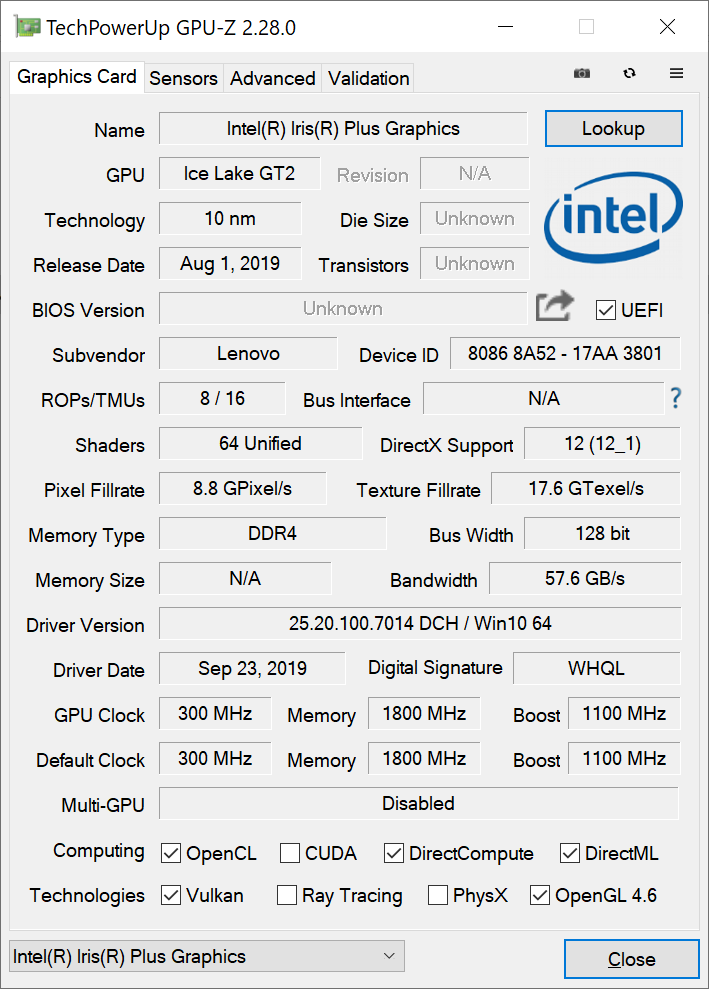
GPU Performance
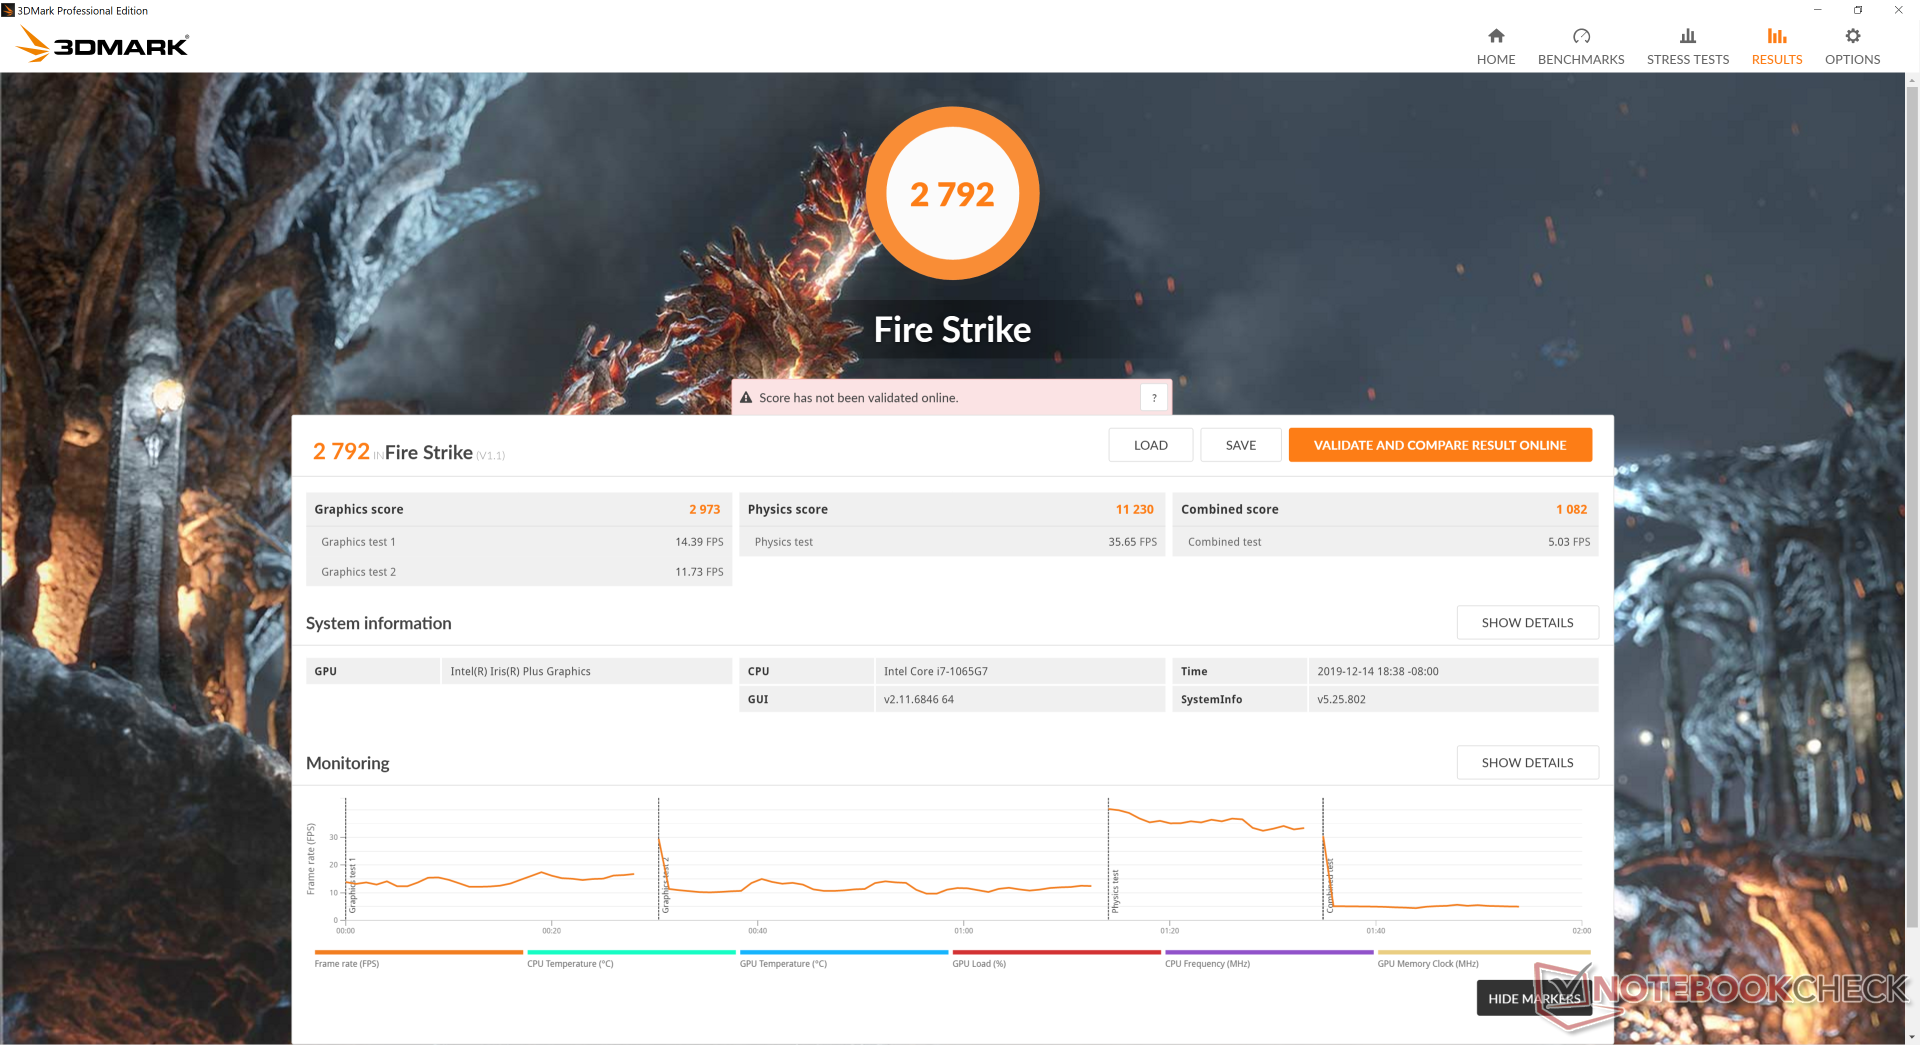
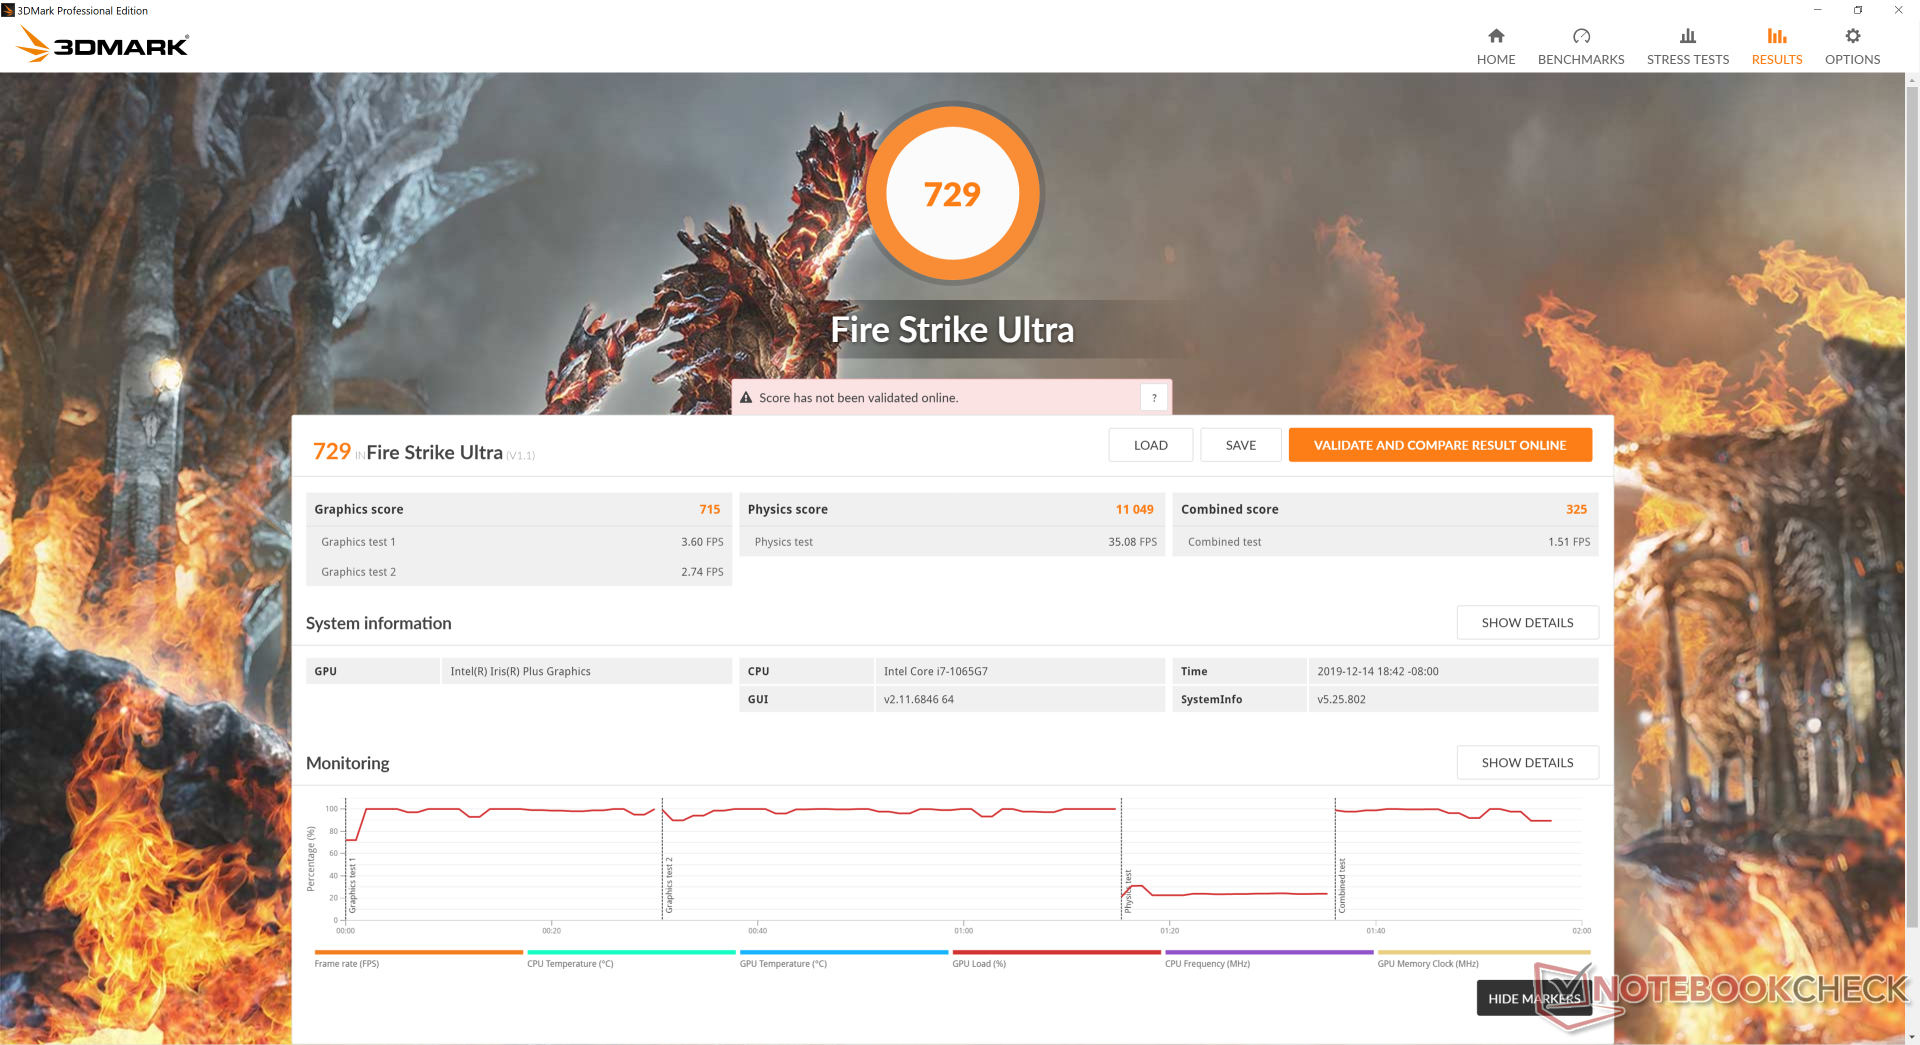
As mentioned before, 3DMark benchmarks paint a very different picture from real-world gaming performance. While 3DMark scores are within single-digit percentage points of the Radeon RX Vega 10 and about 20 to 27 percent behind the GeForce MX250, performance in games can vary wildly. Shadow of the Tomb Raider, for example, is 30 to 40 percent slower than the RX Vega 10 and MX250 while frame rates in Rocket League are more comparable. If you plan on doing any gaming at all, then your best bet is to stick with undemanding titles like Rocket League, Fortnite, or LoL where performance will be more reliable.
Performance will always be significantly faster than the last generation UHD Graphics 620 that the Ice Lake series replaces by at least 2x in most cases.
See our dedicated page on the Iris Plus G7 for more benchmark comparisons.
| 3DMark 11 | |
| 1280x720 Performance GPU | |
| Asus Zephyrus S GX531GM | |
| Asus ZenBook 15 UX534FT-DB77 | |
| MSI GL62M 7RD-077 | |
| Lenovo Yoga C940-14IIL 81Q9 | |
| Huawei MateBook 14 KLV-W29 | |
| Microsoft Surface Laptop 3 15 Ryzen 5 3580U | |
| Asus VivoBook 15 X512FL-EJ205T | |
| Dell Inspiron 15 5000 5585 | |
| Ortalama Intel Iris Plus Graphics G7 (Ice Lake 64 EU) (2112 - 4630, n=28) | |
| Acer Swift 3 SF314-41-R8HZ | |
| Asus Zenbook 14 UX433FN-A6023T | |
| Lenovo Yoga S730-13IWL | |
| 1280x720 Performance Combined | |
| Asus ZenBook 15 UX534FT-DB77 | |
| MSI GL62M 7RD-077 | |
| Asus Zephyrus S GX531GM | |
| Huawei MateBook 14 KLV-W29 | |
| Lenovo Yoga C940-14IIL 81Q9 | |
| Asus VivoBook 15 X512FL-EJ205T | |
| Asus Zenbook 14 UX433FN-A6023T | |
| Dell Inspiron 15 5000 5585 | |
| Ortalama Intel Iris Plus Graphics G7 (Ice Lake 64 EU) (1319 - 4163, n=28) | |
| Microsoft Surface Laptop 3 15 Ryzen 5 3580U | |
| Acer Swift 3 SF314-41-R8HZ | |
| Lenovo Yoga S730-13IWL | |
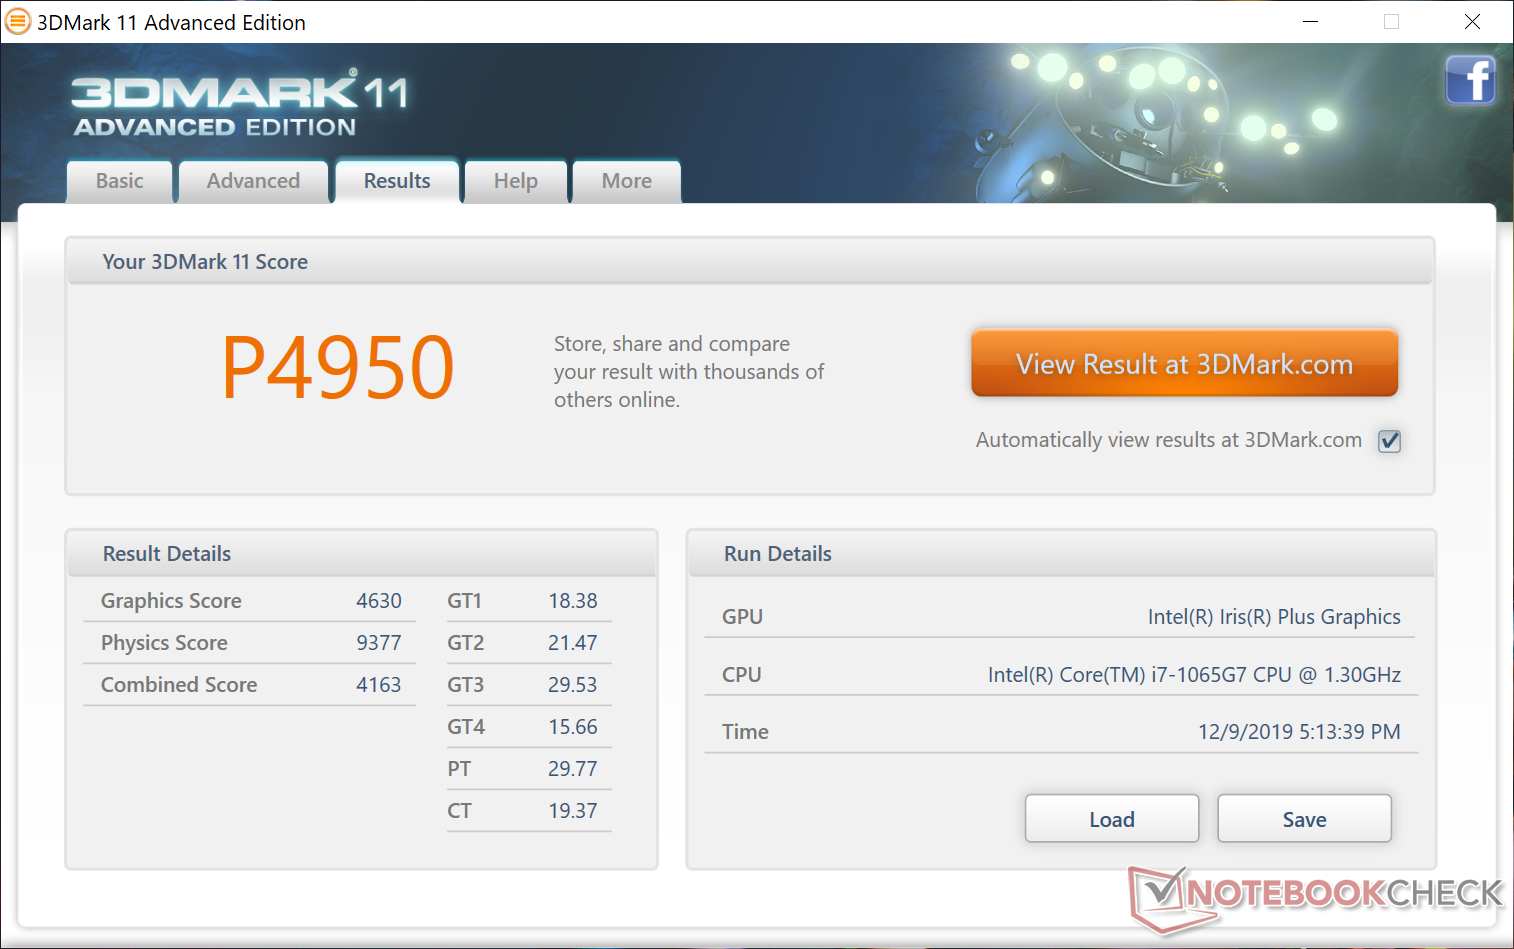
| 3DMark 11 Performance | 4950 puan | |
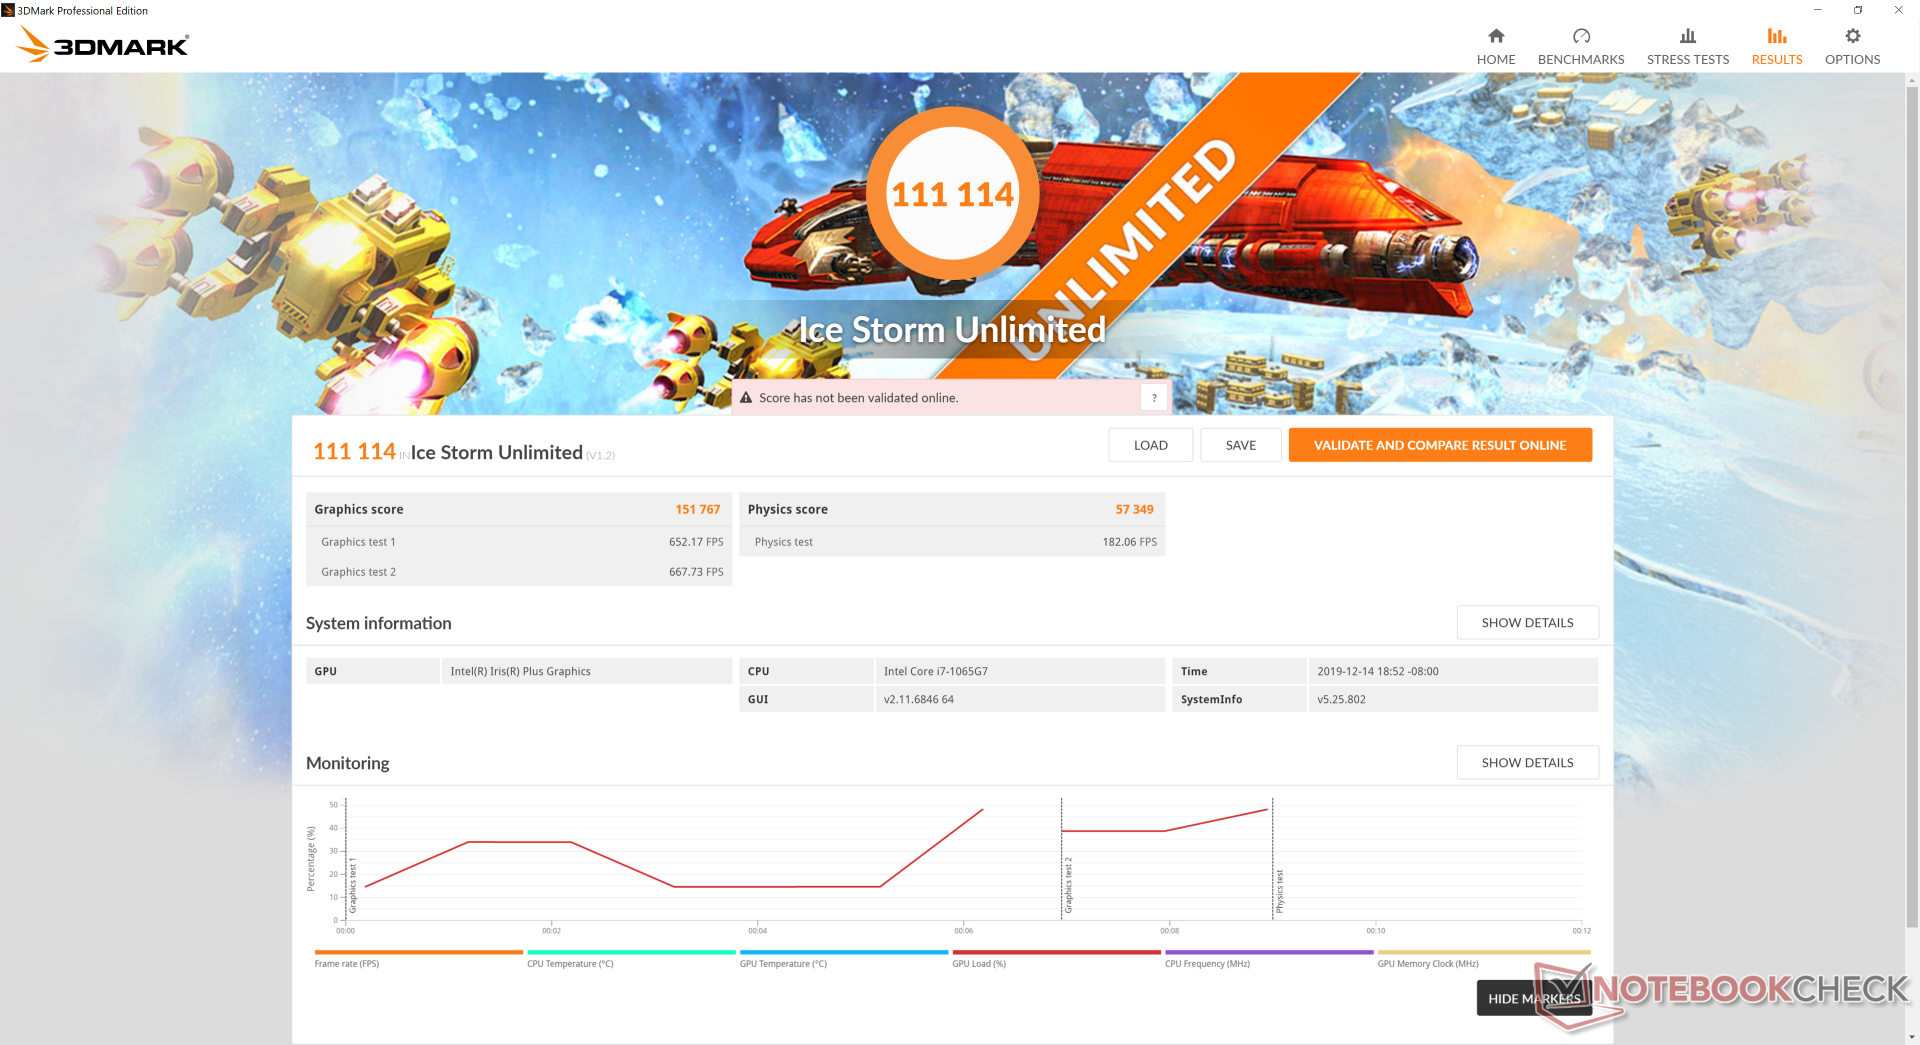
| 3DMark Ice Storm Standard Score | 58009 puan | |
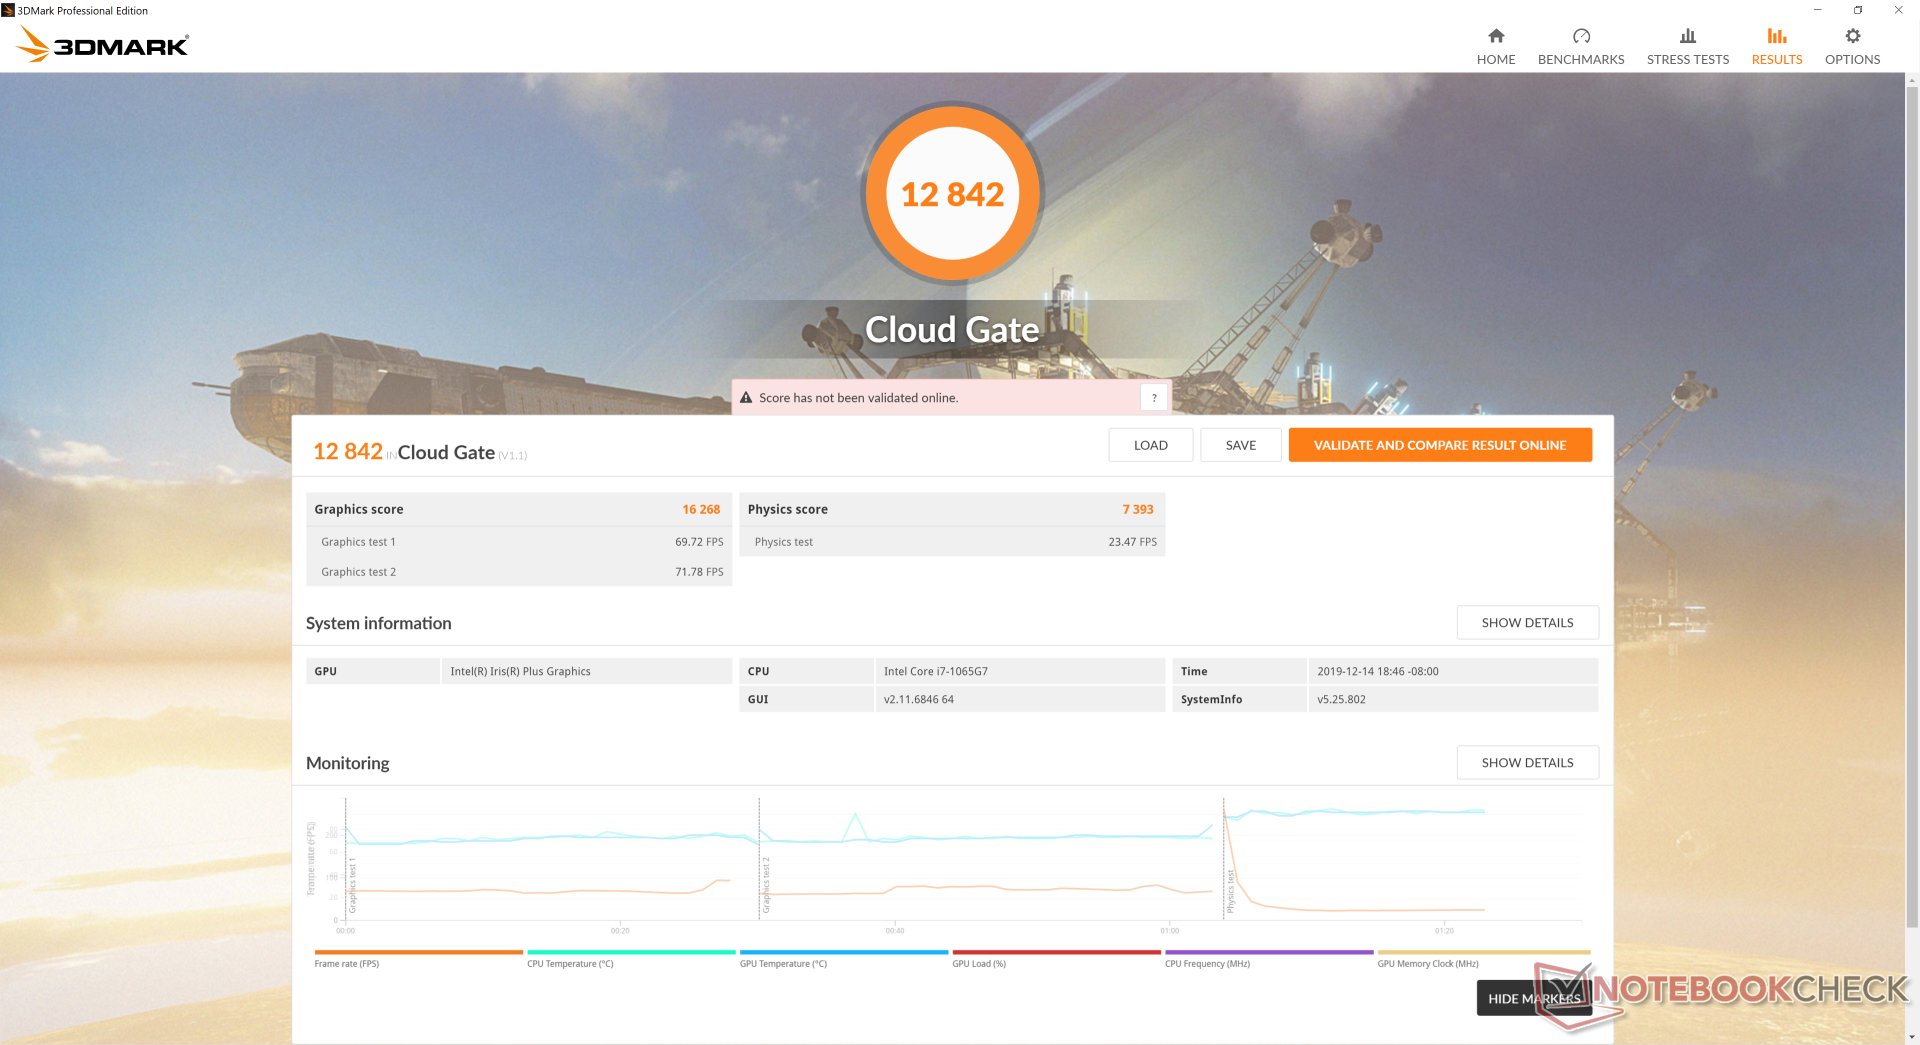
| 3DMark Cloud Gate Standard Score | 12842 puan | |
| 3DMark Fire Strike Score | 2792 puan | |
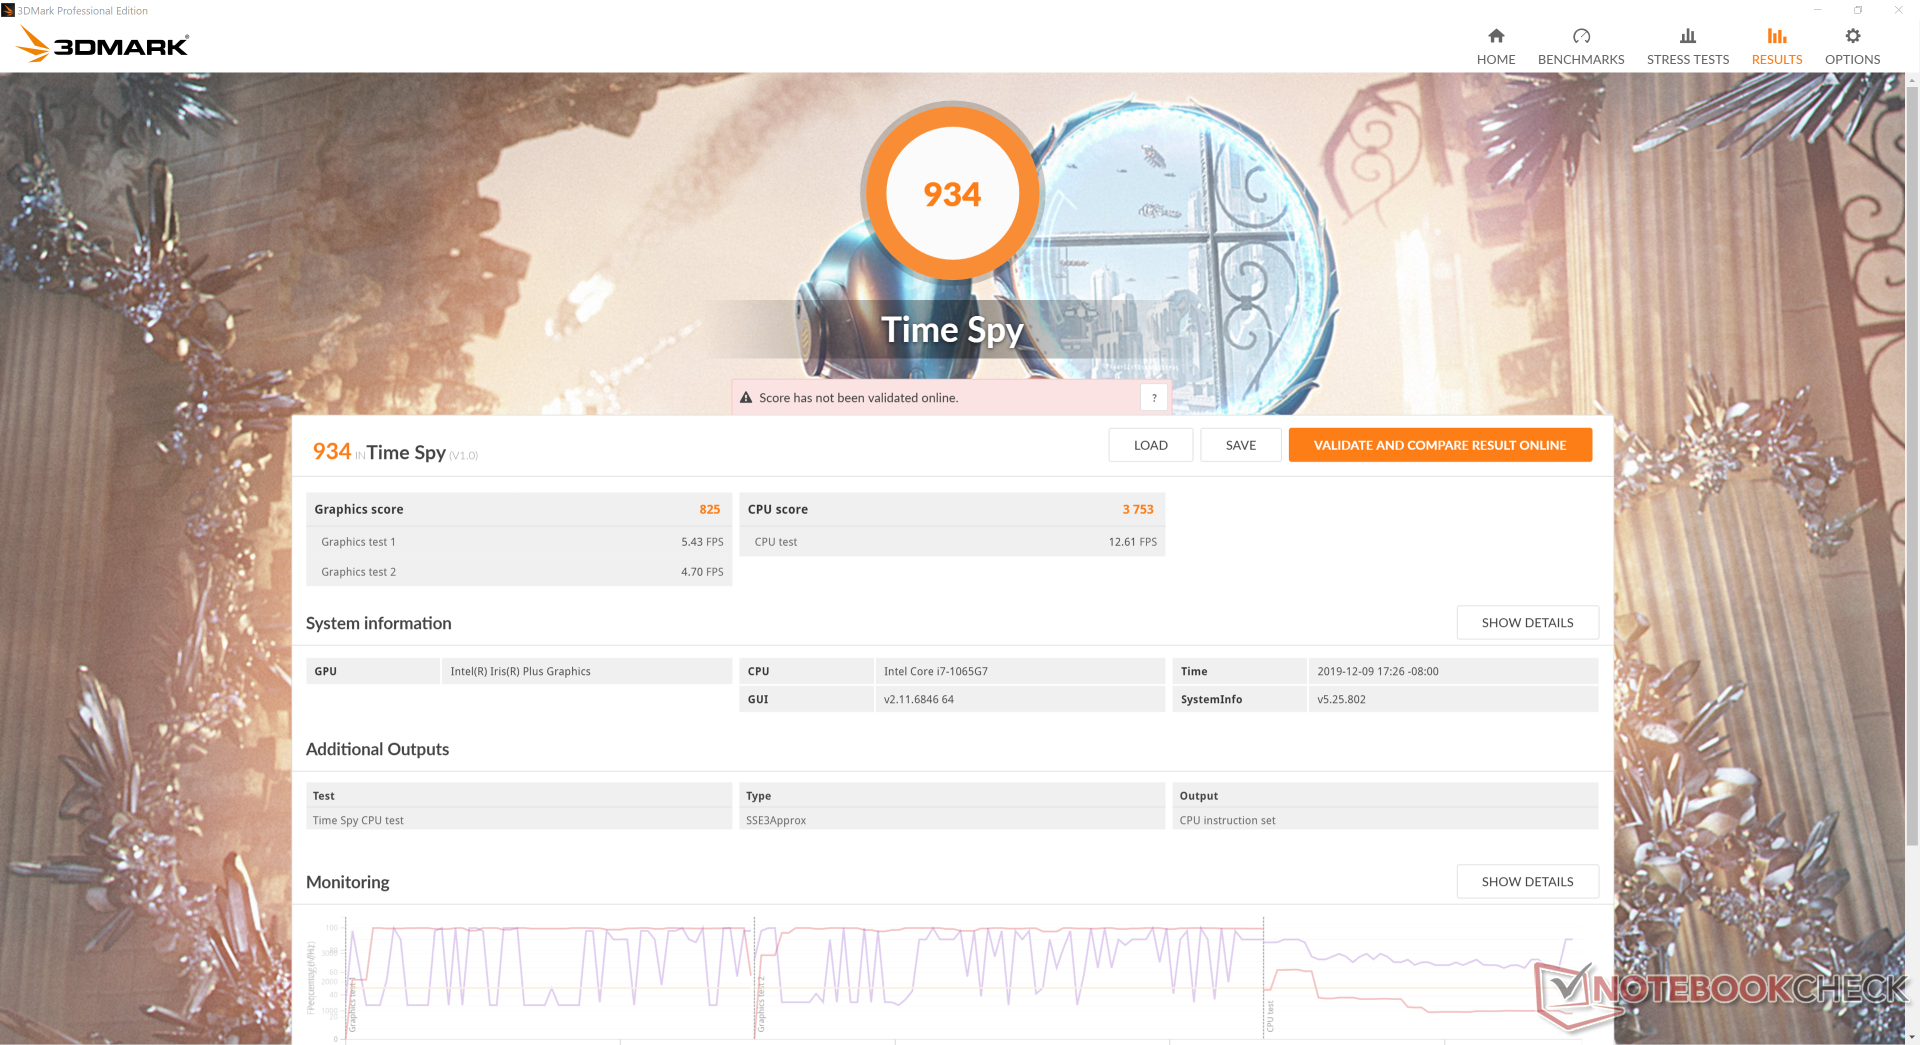
| 3DMark Time Spy Score | 934 puan | |
Yardım | ||
| Rocket League | |
| 1280x720 Performance | |
| Acer Nitro 5 AN515-42-R6V0 | |
| Acer Aspire 5 A515-52G-723L | |
| Xiaomi Mi Notebook Air 13.3 2018 | |
| Huawei MateBook 13 i7 | |
| Dell Inspiron 15 5000 5585 | |
| Lenovo Yoga C940-14IIL 81Q9 | |
| Ortalama Intel Iris Plus Graphics G7 (Ice Lake 64 EU) (22.1 - 123, n=16) | |
| Dell XPS 13 7390 Core i7-10710U | |
| HP ProBook 440 G6-5TK01EA | |
| 1920x1080 Quality AA:Medium FX | |
| Acer Nitro 5 AN515-42-R6V0 | |
| Acer Aspire 5 A515-52G-723L | |
| Huawei MateBook 13 i7 | |
| Lenovo Yoga C940-14IIL 81Q9 | |
| Dell Inspiron 15 5000 5585 | |
| Xiaomi Mi Notebook Air 13.3 2018 | |
| Ortalama Intel Iris Plus Graphics G7 (Ice Lake 64 EU) (24.9 - 71.3, n=16) | |
| Dell XPS 13 7390 Core i7-10710U | |
| HP ProBook 440 G6-5TK01EA | |
| 1920x1080 High Quality AA:High FX | |
| Acer Nitro 5 AN515-42-R6V0 | |
| Acer Aspire 5 A515-52G-723L | |
| Huawei MateBook 13 i7 | |
| Lenovo Yoga C940-14IIL 81Q9 | |
| Xiaomi Mi Notebook Air 13.3 2018 | |
| Dell Inspiron 15 5000 5585 | |
| Ortalama Intel Iris Plus Graphics G7 (Ice Lake 64 EU) (21.1 - 48.5, n=15) | |
| Dell XPS 13 7390 Core i7-10710U | |
| Shadow of the Tomb Raider - 1280x720 Lowest Preset | |
| Acer Nitro 5 AN515-42-R6V0 | |
| Acer Aspire 5 A515-52G-723L | |
| Dell Inspiron 15 5000 5585 | |
| Ortalama Intel Iris Plus Graphics G7 (Ice Lake 64 EU) (15.6 - 33, n=13) | |
| Lenovo Yoga C940-14IIL 81Q9 | |
| Dell XPS 13 7390 Core i7-10710U | |
| düşük | orta | yüksek | ultra | |
|---|---|---|---|---|
| BioShock Infinite (2013) | 104.2 | 68.3 | 59.9 | 22.1 |
| The Witcher 3 (2015) | 52.7 | 36.3 | 19.6 | 9.9 |
| Rocket League (2017) | 119 | 68.5 | 44.3 | |
| Shadow of the Tomb Raider (2018) | 26 |
Emissions
System Noise
Fan noise is generally quiet at about 29 to 33 dB(A) when under most conditions. However, an annoying pulsing behavior occurs when under higher loads like gaming. For example, fan noise will steadily rise and fall between 31 dB(A) and 40.7 dB(A) when running Witcher 3. We would have preferred a fixed RPM to be more inconspicuous during gameplay.
Our unit exhibits slight electronic noise when placing an ear near the keyboard keys.
| Lenovo Yoga C940-14IIL 81Q9 Iris Plus Graphics G7 (Ice Lake 64 EU), i7-1065G7, Samsung PM981a MZVLB1T0HBLR | MSI Prestige 15 A10SC GeForce GTX 1650 Max-Q, i7-10710U, Samsung SSD PM981 MZVLB1T0HALR | Asus ZenBook S13 UX392FN GeForce MX150, i7-8565U, WDC PC SN520 SDAPNUW-512G | Lenovo Yoga C930-13IKB 81C4 UHD Graphics 620, i5-8550U, SK hynix PC401 HFS256GD9TNG | Razer Blade Stealth i7-1065G7 Iris Plus Iris Plus Graphics G7 (Ice Lake 64 EU), i7-1065G7, Samsung SSD PM981 MZVLB256HAHQ | Dell XPS 13 7390 2-in-1 Core i7 Iris Plus Graphics G7 (Ice Lake 64 EU), i7-1065G7, Toshiba BG4 KBG40ZPZ512G | |
|---|---|---|---|---|---|---|
| Noise | -3% | -4% | 2% | -1% | -1% | |
| kapalı / ortam * (dB) | 28.5 | 29.3 -3% | 28.1 1% | 27.9 2% | 28.3 1% | 28.1 1% |
| Idle Minimum * (dB) | 28.5 | 30.1 -6% | 28.1 1% | 27.9 2% | 28.3 1% | 28.1 1% |
| Idle Average * (dB) | 28.5 | 30.2 -6% | 28.1 1% | 27.9 2% | 28.3 1% | 28.1 1% |
| Idle Maximum * (dB) | 29 | 30.2 -4% | 29 -0% | 29.3 -1% | 28.3 2% | 28.1 3% |
| Load Average * (dB) | 33 | 31.5 5% | 41.1 -25% | 32 3% | 33.5 -2% | 31.7 4% |
| Witcher 3 ultra * (dB) | 40.7 | 37 9% | 41.1 -1% | 34.5 15% | 43.4 -7% | |
| Load Maximum * (dB) | 39.5 | 47 -19% | 41.1 -4% | 39.3 1% | 49.4 -25% | 43.4 -10% |
* ... daha küçük daha iyidir
Ses yüksekliği
| Boşta |
| 28.5 / 28.5 / 29 dB |
| Çalışırken |
| 33 / 39.5 dB |
 | ||
30 dB sessiz 40 dB(A) duyulabilirlik 50 dB(A) gürültülü |
||
min: | ||
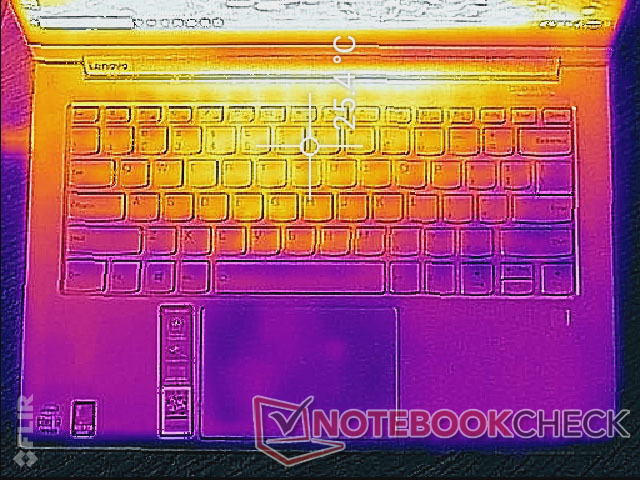
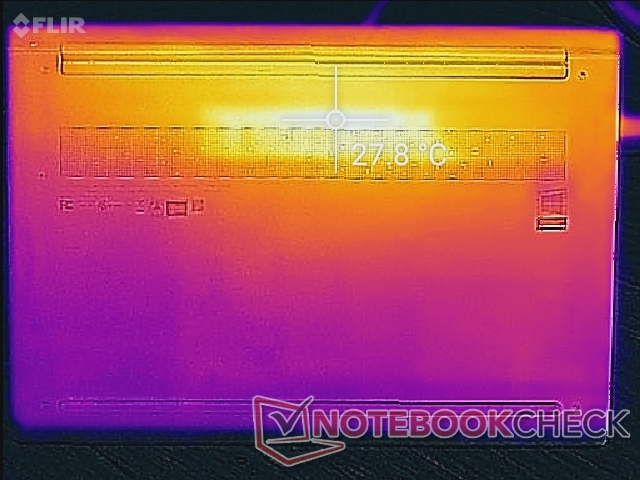
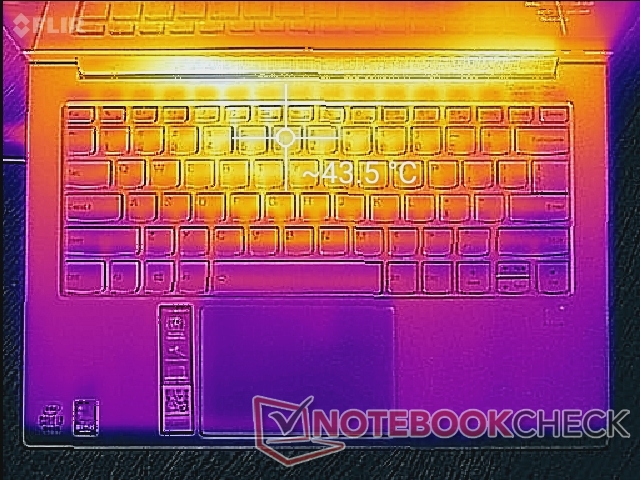
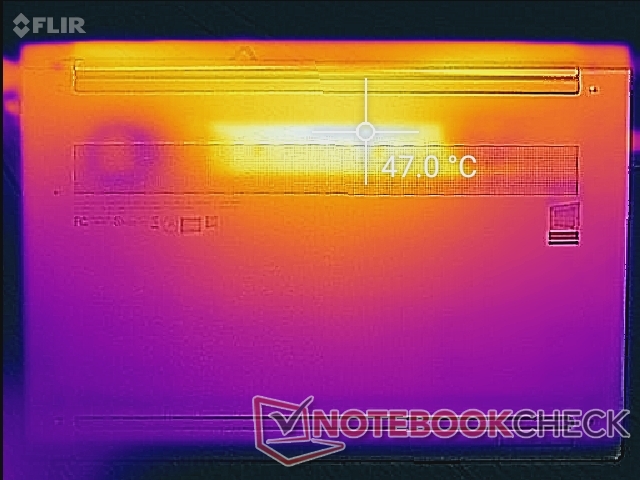
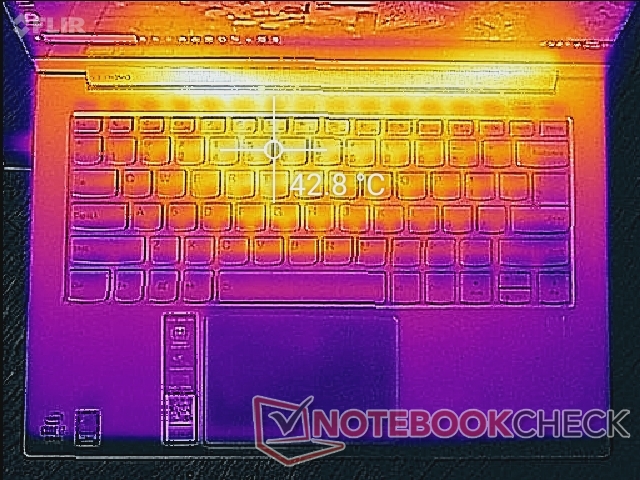
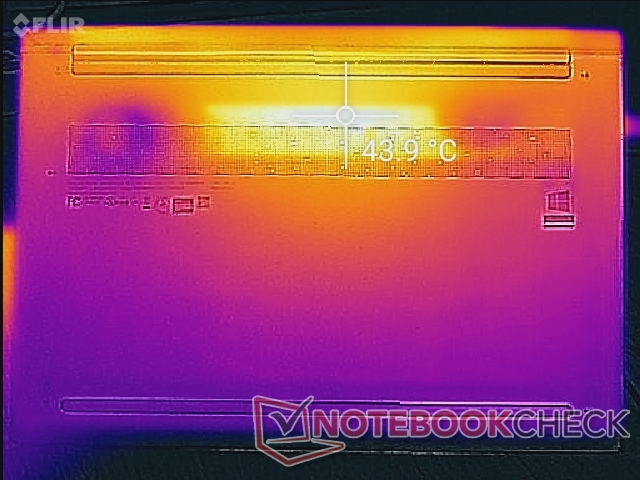
Temperature
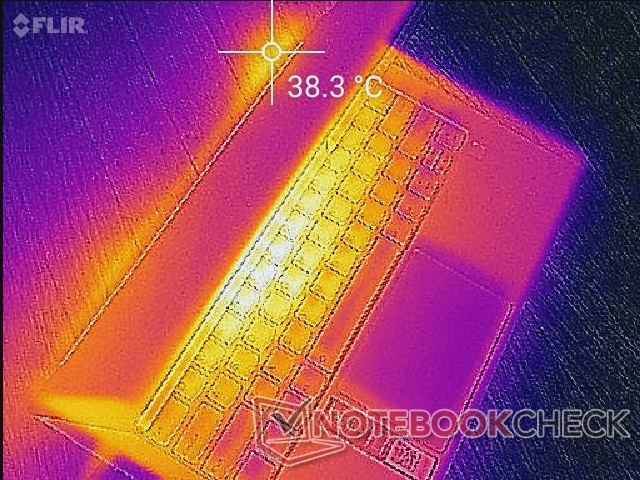
(±) Üst taraftaki maksimum sıcaklık, 35.4 °C / 96 F ortalamasına kıyasla 42.6 °C / 109 F'dir. , Convertible sınıfı için 19.6 ile 60 °C arasında değişir.
(±) Alt kısım, 36.9 °C / 98 F ortalamasına kıyasla maksimum 43.8 °C / 111 F'ye kadar ısınır
(+) Boşta kullanımda, üst tarafın ortalama sıcaklığı 23.7 °C / 75 F olup, cihazın 30.3 °C / 87 F.
(±) The Witcher 3 oynarken, üst tarafın ortalama sıcaklığı 34.2 °C / 94 F olup, cihazın 30.3 °C / 87 F.
(+) Avuç içi dayanakları ve dokunmatik yüzey, maksimum 29.6 °C / 85.3 F ile cilt sıcaklığından daha soğuktur ve bu nedenle dokunulduğunda soğuktur.
(±) Benzer cihazların avuç içi dayanağı alanının ortalama sıcaklığı 28 °C / 82.4 F (-1.6 °C / -2.9 F) idi.
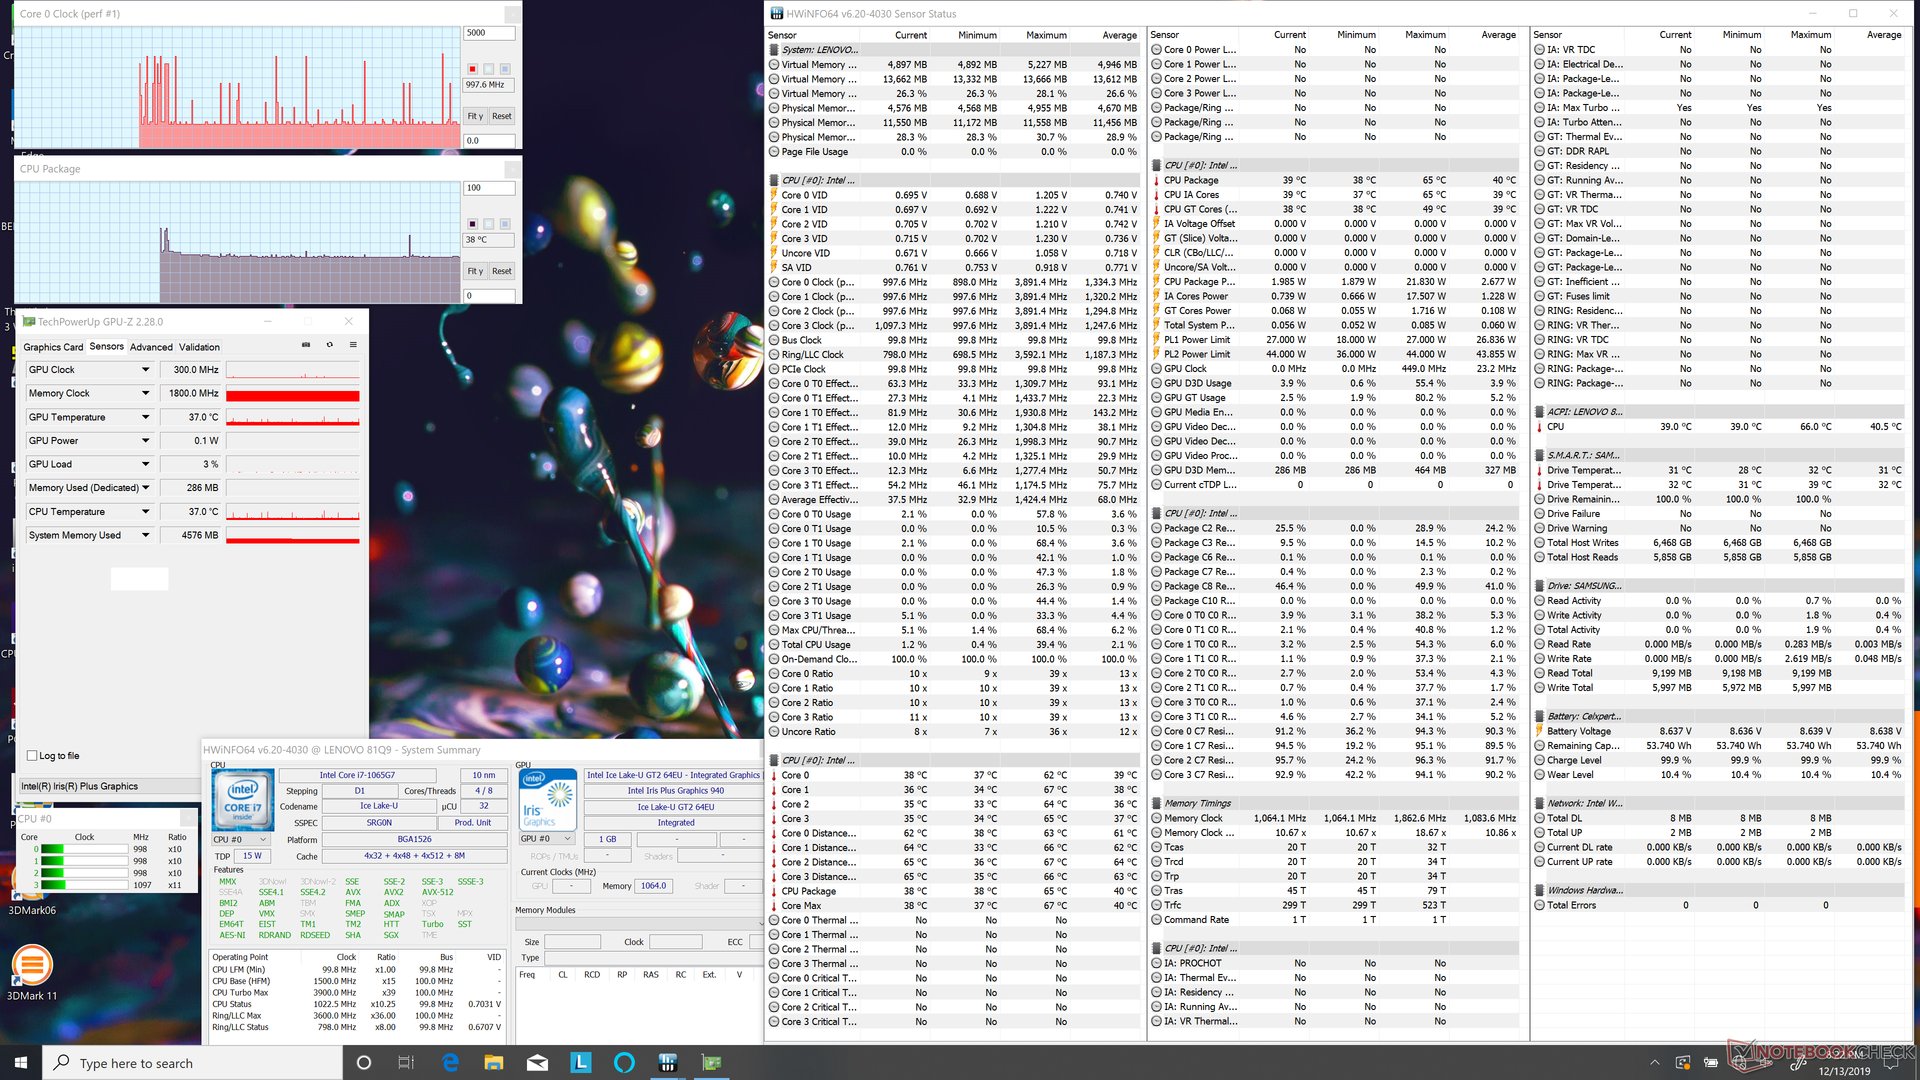
Stress Test
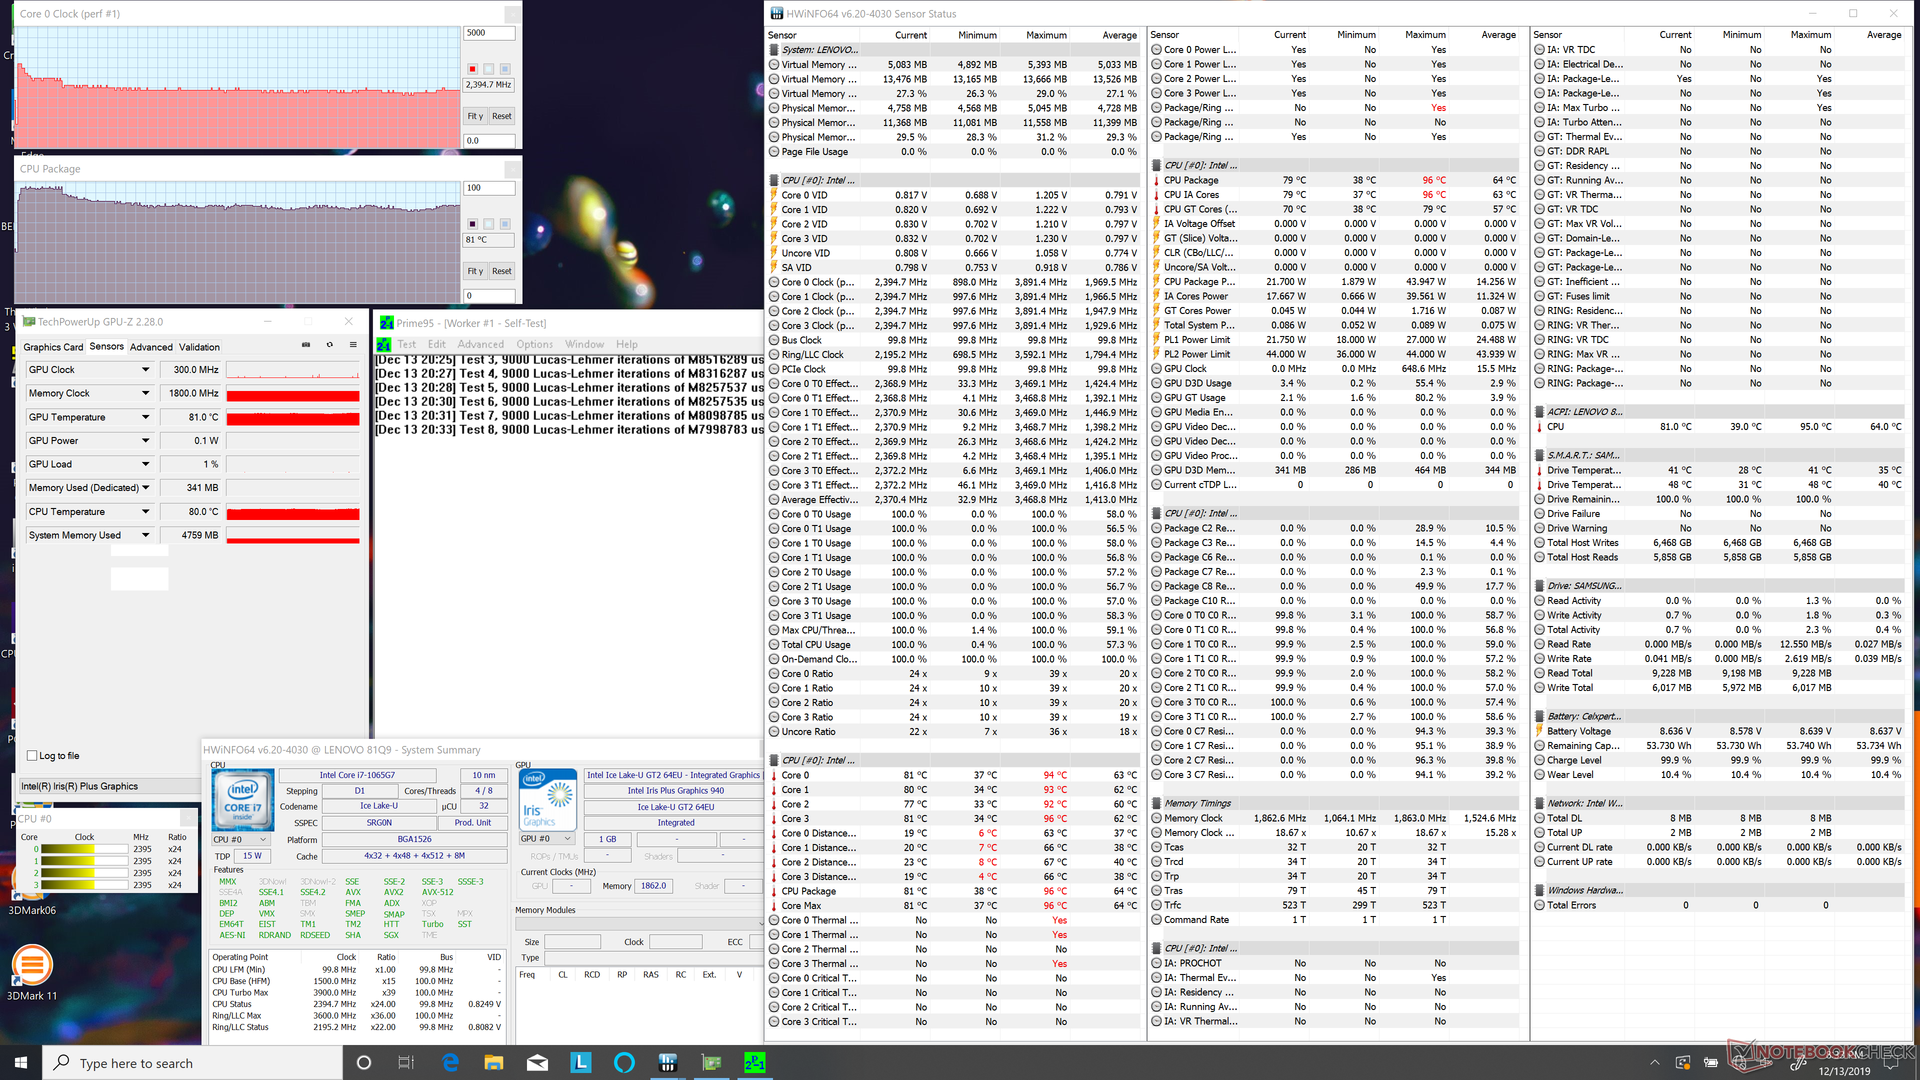
We stress the system to identify for any potential throttling or stability issues. When running Prime95, the CPU can be observed boosting up to 3.5 GHz for the first few seconds before eventually falling to 2.9 GHz for the next 30 seconds. CPU temperature would remain stable at about 96 C during this period. Thereafter, clock rates and temperature would drop and cycle indefinitely between 2.3 to 2.4 GHz and 77 C to 81 C, respectively. It's not surprising that the convertible is unable to maintain very high Turbo Boost clock rates for very long periods considering the form factor and what we observed during our CineBench R15 loop test above.
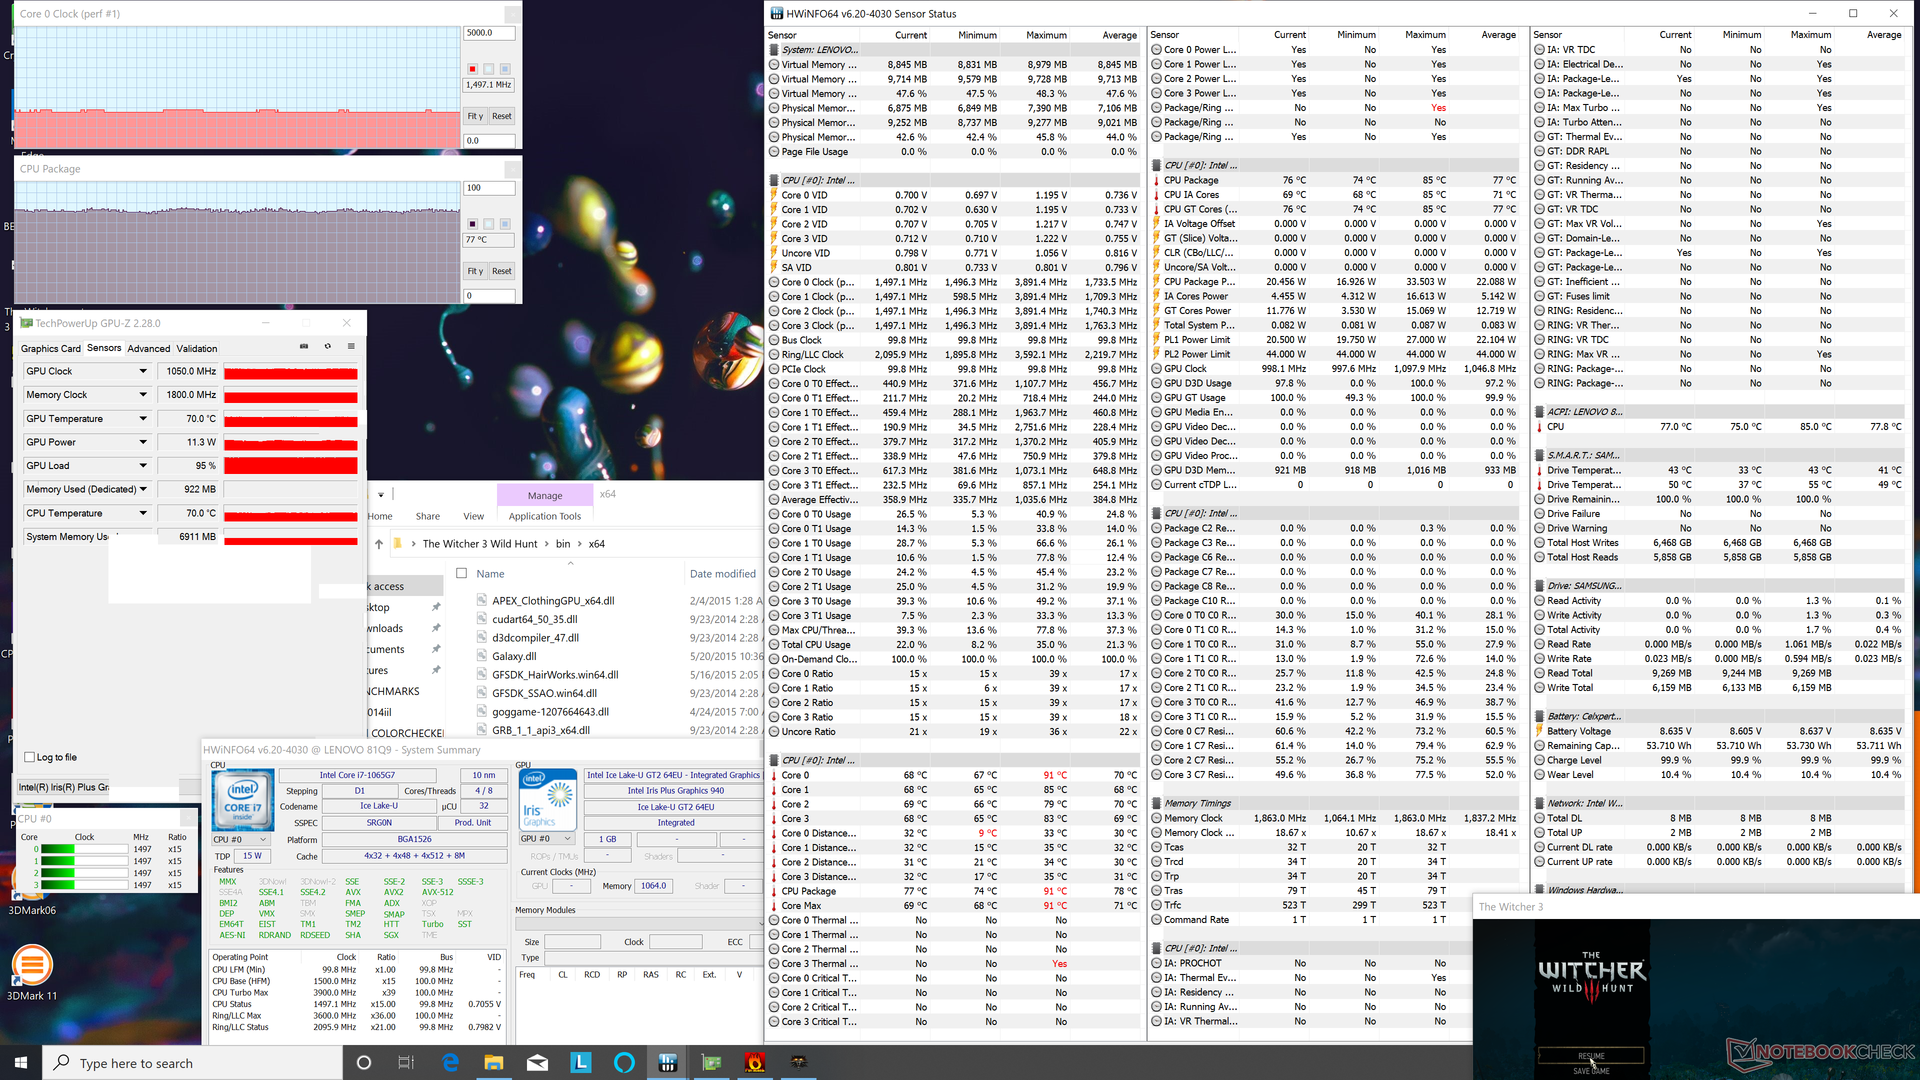
Running Witcher 3 results in a stable GPU clock rate of 1050 Hz and a core temperature of 77 C compared to 85 C on the XPS 13 7390 2-in-1 with the same CPU. Running on battery power will reduce performance just slightly; a 3DMark 11 run on batteries returns Physics and Graphics scores of 9687 and 4502 points, respectively, compared to 10494 and 4594 points when on mains.
| CPU Clock (GHz) | GPU Clock (MHz) | Average CPU Temperature (°C) | |
| System Idle | -- | -- | 38 |
| Prime95 Stress | 2.3 - 2.4 | -- | 77 - 81 |
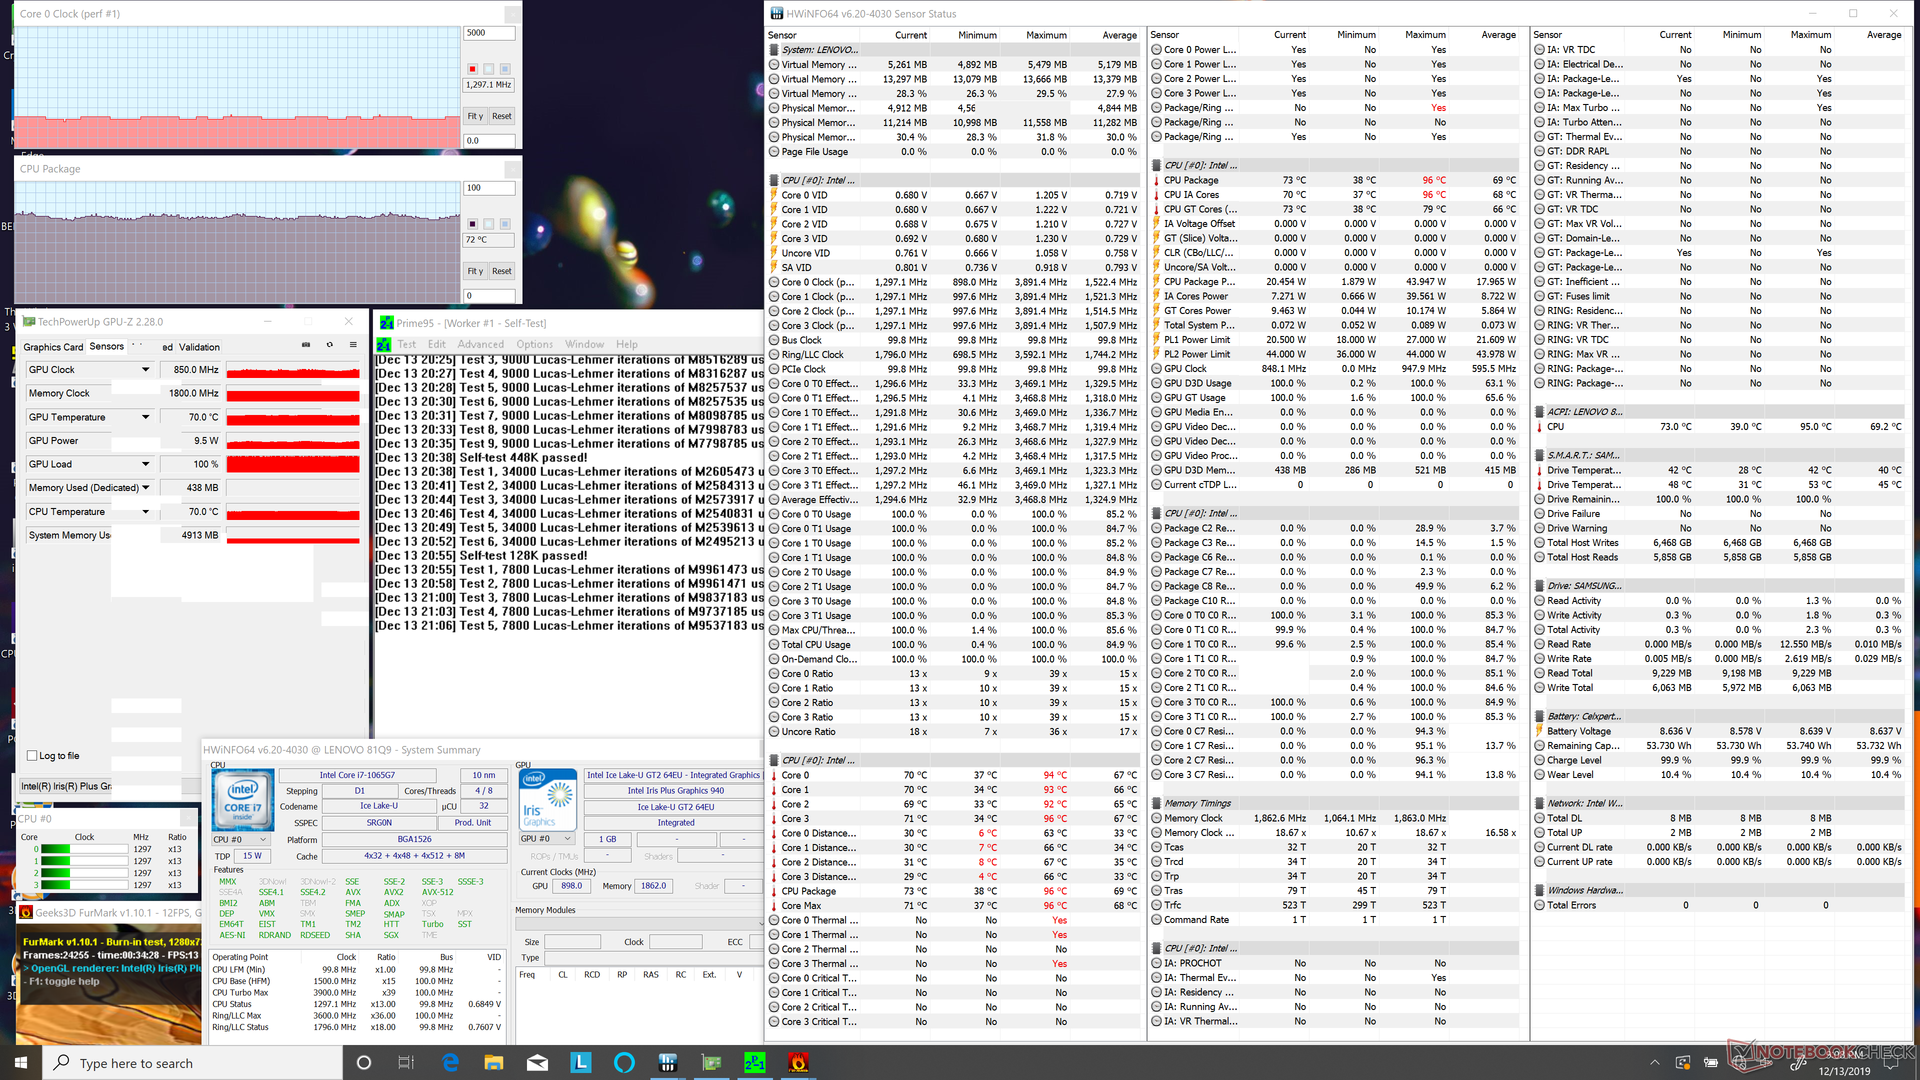
| Prime95 + FurMark Stress | 1.2 - 1.3 | 850 | 70 - 72 |
| Witcher 3 Stress | 1.5 | 1050 | 77 |
Speakers

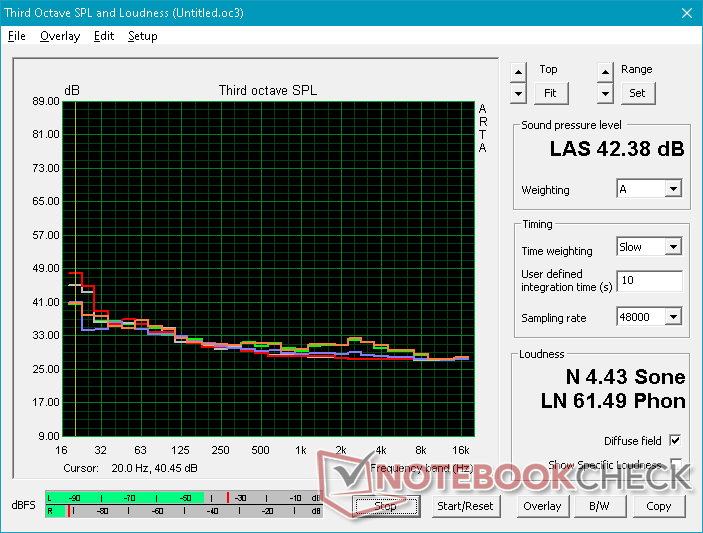
Lenovo Yoga C940-14IIL 81Q9 ses analizi
(+) | hoparlörler nispeten yüksek sesle çalabilir (90.3 dB)
Bas 100 - 315Hz
(±) | azaltılmış bas - ortalama olarak medyandan 11.2% daha düşük
(±) | Bas doğrusallığı ortalamadır (10.9% delta - önceki frekans)
Ortalar 400 - 2000 Hz
(+) | dengeli ortalar - medyandan yalnızca 2.2% uzakta
(+) | orta frekanslar doğrusaldır (3.2% deltadan önceki frekansa)
Yüksekler 2 - 16 kHz
(±) | azaltılmış yüksekler - ortalama olarak medyandan 6% daha düşük
(±) | Yükseklerin doğrusallığı ortalamadır (8.9% delta - önceki frekans)
Toplam 100 - 16.000 Hz
(+) | genel ses doğrusaldır (14.9% ortancaya göre fark)
Aynı sınıfla karşılaştırıldığında
» Bu sınıftaki tüm test edilen cihazların %23%'si daha iyi, 5% benzer, 72% daha kötüydü
» En iyisinin deltası 6% idi, ortalama 20% idi, en kötüsü 57% idi
Test edilen tüm cihazlarla karşılaştırıldığında
» Test edilen tüm cihazların %20'si daha iyi, 4 benzer, % 76 daha kötüydü
» En iyisinin deltası 4% idi, ortalama 24% idi, en kötüsü 134% idi
Apple MacBook 12 (Early 2016) 1.1 GHz ses analizi
(+) | hoparlörler nispeten yüksek sesle çalabilir (83.6 dB)
Bas 100 - 315Hz
(±) | azaltılmış bas - ortalama olarak medyandan 11.3% daha düşük
(±) | Bas doğrusallığı ortalamadır (14.2% delta - önceki frekans)
Ortalar 400 - 2000 Hz
(+) | dengeli ortalar - medyandan yalnızca 2.4% uzakta
(+) | orta frekanslar doğrusaldır (5.5% deltadan önceki frekansa)
Yüksekler 2 - 16 kHz
(+) | dengeli yüksekler - medyandan yalnızca 2% uzakta
(+) | yüksekler doğrusaldır (4.5% deltadan önceki frekansa)
Toplam 100 - 16.000 Hz
(+) | genel ses doğrusaldır (10.2% ortancaya göre fark)
Aynı sınıfla karşılaştırıldığında
» Bu sınıftaki tüm test edilen cihazların %7%'si daha iyi, 2% benzer, 91% daha kötüydü
» En iyisinin deltası 5% idi, ortalama 18% idi, en kötüsü 53% idi
Test edilen tüm cihazlarla karşılaştırıldığında
» Test edilen tüm cihazların %5'si daha iyi, 1 benzer, % 94 daha kötüydü
» En iyisinin deltası 4% idi, ortalama 24% idi, en kötüsü 134% idi
Energy Management
Power Consumption
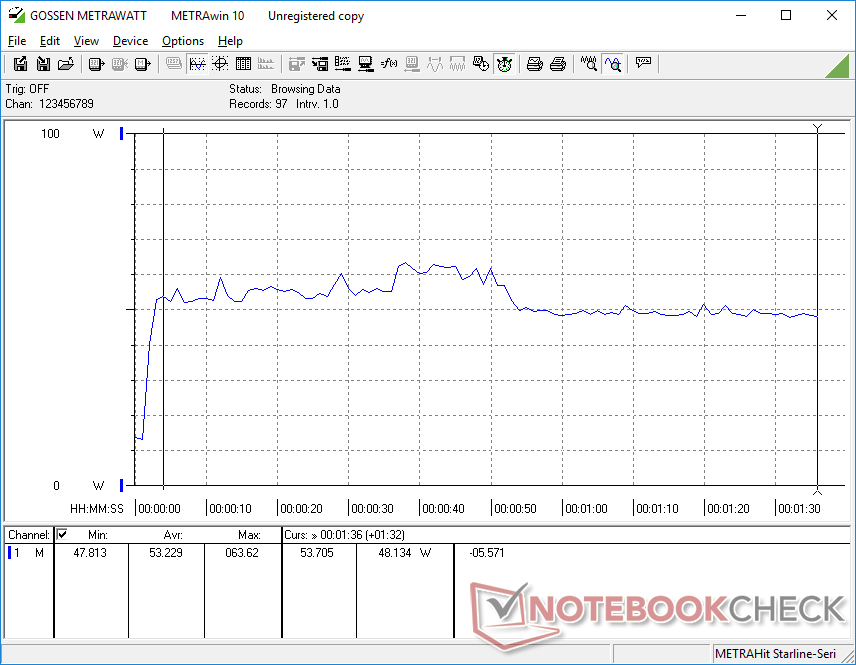
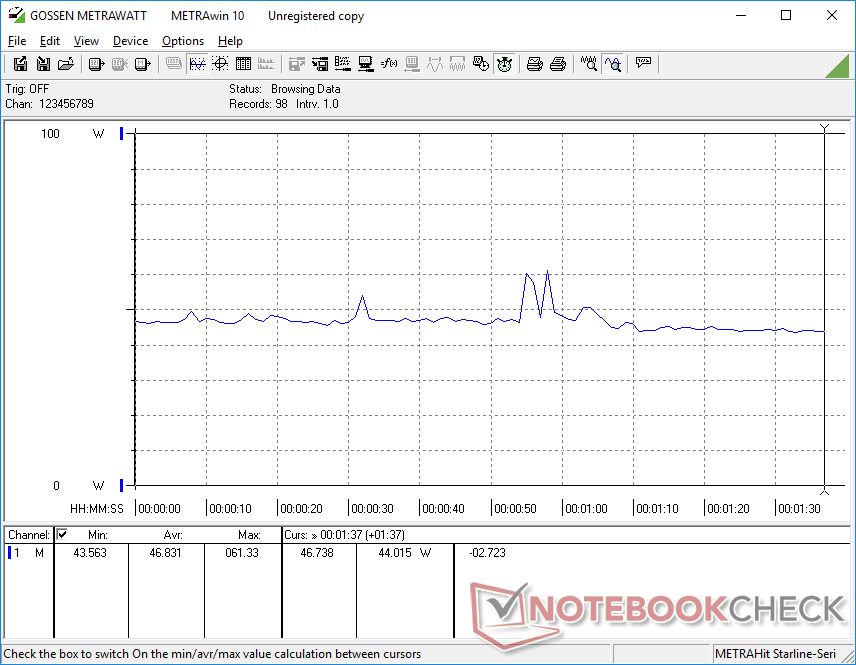
Idling on desktop will demand between 5 W and 12 W compared to just 3 W and 9 W on the FHD option likely due to both the brighter display and higher native resolution of our 4K unit. Consumption is consistently higher during higher processing loads as well which will impact battery life as shown in our next section.
It's worth noting that power consumption when gaming on the Lenovo is about 16 percent less than the Huawei MateBook 14 with GeForce MX250 graphics while GPU performance is roughly 20 to 27 percent behind according to 3DMark benchmarks. In other words, performance-per-Watt is not necessarily greater on Intel's integrated chipset when compared to the more common discrete Nvidia and Intel solution especially since gaming performance is generally more inconsistent on the Ice Lake Iris platform.
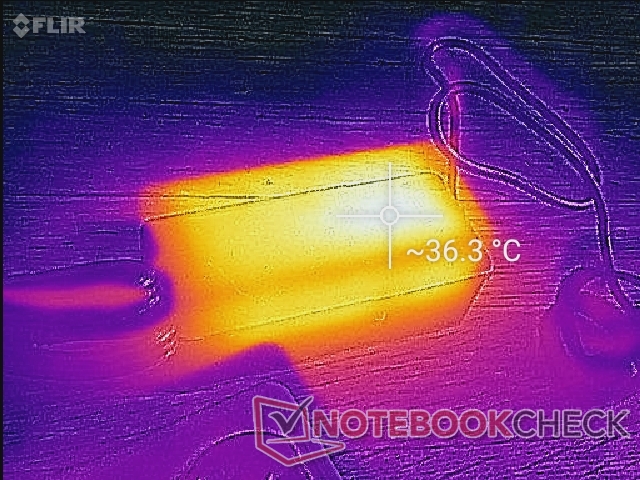
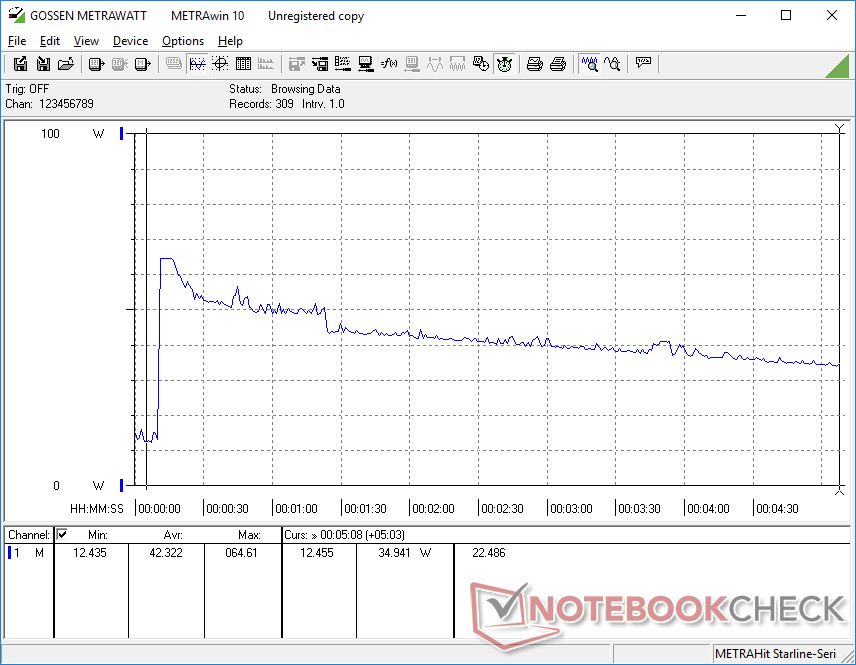
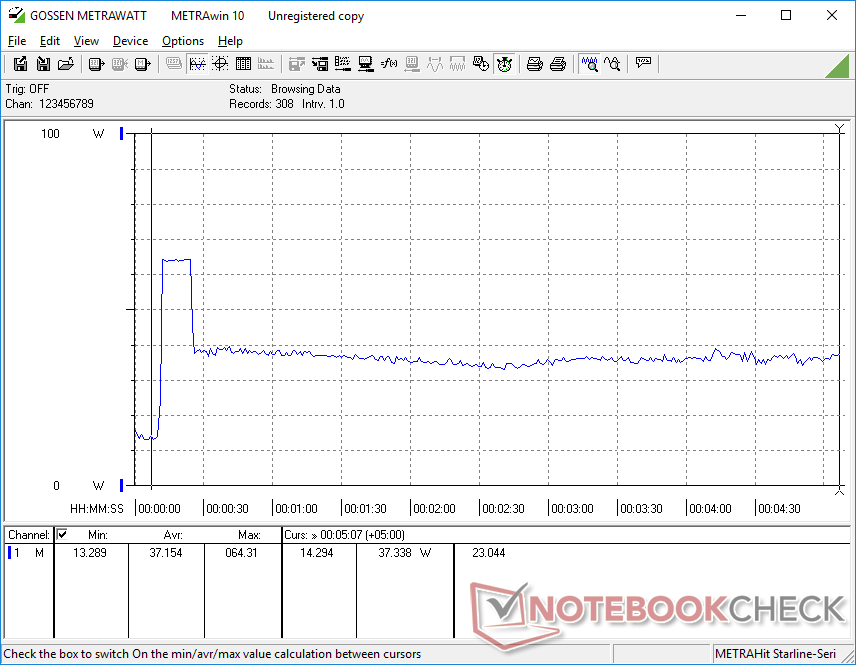
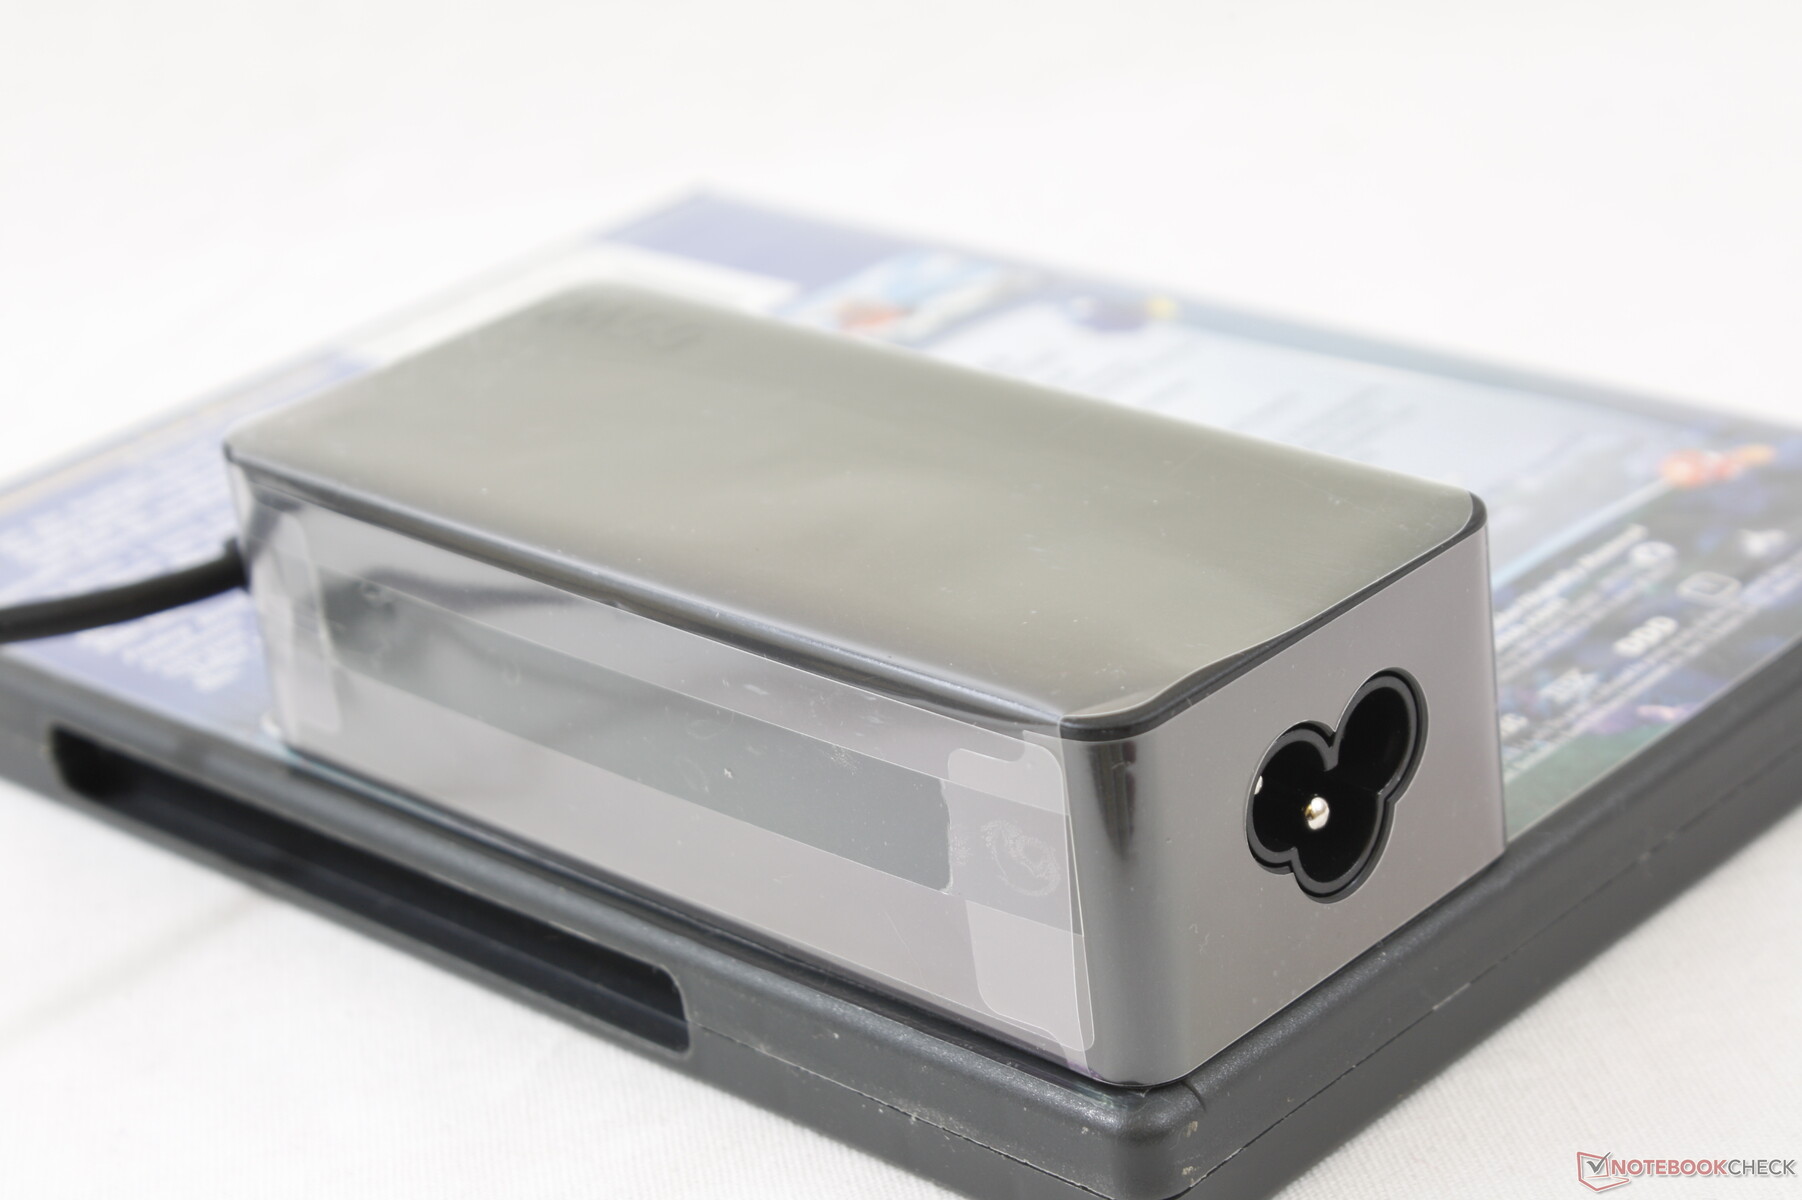
We're able to measure a maximum consumption of 64.6 W from the small (~10.8 x 4.7 x 3 cm) 65 W AC adapter immediately after initiating Prime95 for 100 percent CPU utilization. This high of a consumption is sustainable for just a few seconds before falling to just 35 W after 5 full minutes of stress as shown by our graphs below. We wouldn't be observing declining power consumption over time had the laptop been able to maintain maximum Turbo Boost indefinitely.
| Kapalı / Bekleme modu | |
| Boşta | |
| Çalışırken |
|
Key:
min: | |
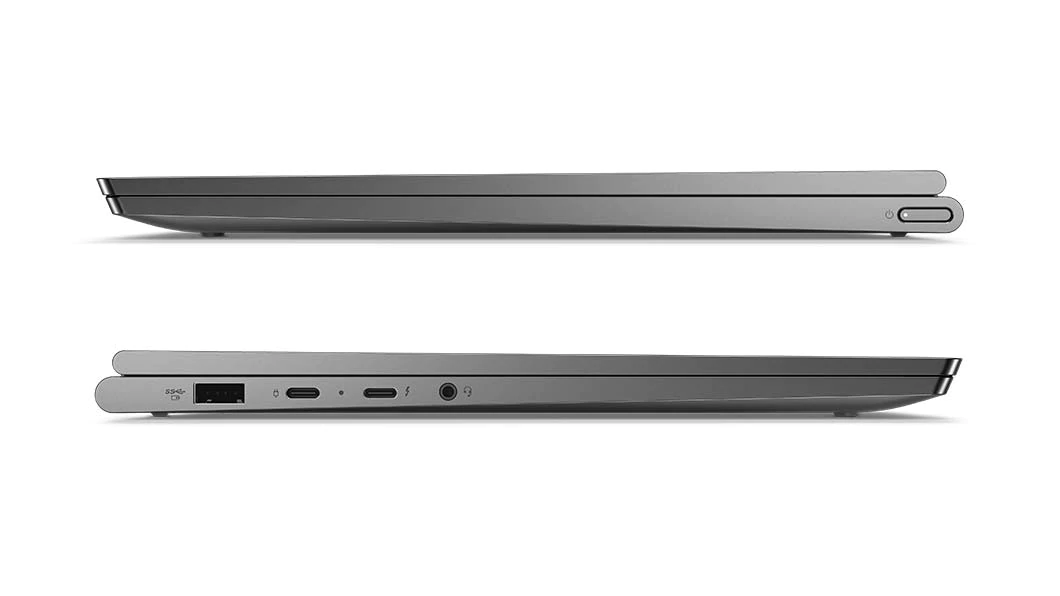
| Lenovo Yoga C940-14IIL 81Q9 i7-1065G7, Iris Plus Graphics G7 (Ice Lake 64 EU), Samsung PM981a MZVLB1T0HBLR, IPS, 3840x2160, 14" | Asus ZenBook S13 UX392FN i7-8565U, GeForce MX150, WDC PC SN520 SDAPNUW-512G, IPS, 1920x1080, 13.9" | Lenovo Yoga C930-13IKB 81C4 i5-8550U, UHD Graphics 620, SK hynix PC401 HFS256GD9TNG, IPS, 1920x1080, 13.9" | Lenovo Yoga C940-14IIL i7-1065G7, Iris Plus Graphics G7 (Ice Lake 64 EU), Samsung SSD PM981 MZVLB512HAJQ, IPS LED, 1920x1080, 14" | Razer Blade Stealth 13, Core i7-1065G7 i7-1065G7, GeForce GTX 1650 Max-Q, Lite-On CA3-8D512, IPS LED, 3840x2160, 13.3" | Dell XPS 13 7390 2-in-1 Core i7 i7-1065G7, Iris Plus Graphics G7 (Ice Lake 64 EU), Toshiba BG4 KBG40ZPZ512G, IPS, 1920x1200, 13.4" | Huawei MateBook 14 KLV-W29 i7-8565U, GeForce MX250, Samsung SSD PM981 MZVLB512HAJQ, IPS, 2160x1440, 14" | |
|---|---|---|---|---|---|---|---|
| Power Consumption | 19% | 17% | 23% | -35% | 33% | 1% | |
| Idle Minimum * (Watt) | 5.6 | 3.4 39% | 3.4 39% | 3.2 43% | 10.7 -91% | 2.6 54% | 3.7 34% |
| Idle Average * (Watt) | 10.5 | 6.3 40% | 7.5 29% | 7 33% | 13.6 -30% | 5.3 50% | 9.3 11% |
| Idle Maximum * (Watt) | 12 | 10.4 13% | 11.8 2% | 8.9 26% | 15.7 -31% | 7 42% | 12.8 -7% |
| Load Average * (Watt) | 53.3 | 51 4% | 47.7 11% | 47.6 11% | 60 -13% | 43.1 19% | 58.8 -10% |
| Witcher 3 ultra * (Watt) | 46.9 | 39 17% | 64 -36% | 43.1 8% | 55.8 -19% | ||
| Load Maximum * (Watt) | 64.6 | 62.7 3% | 63.2 2% | 63.1 2% | 71 -10% | 49 24% | 65 -1% |
* ... daha küçük daha iyidir
Battery Life
A battery deficit is expected when compared to the FHD SKU. Our 4K unit would shut down after approximately 7 hours of real-world WLAN use to be about 3 hours shorter than the FHD version. Both laptops were subjected to the same 150-nit brightness setting and Balanced power profile while looping various web pages at identical intervals.
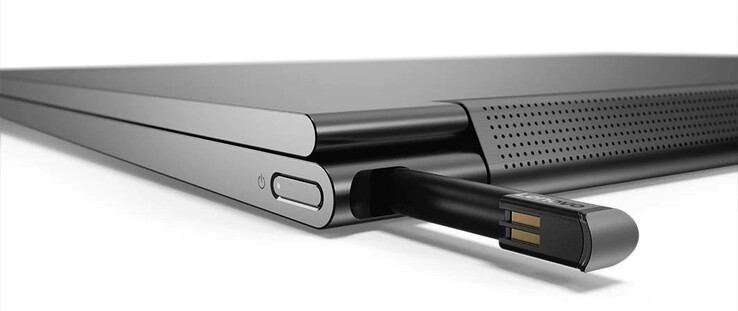
Charging from empty to full capacity takes about 2.5 hours to be slower than most Ultrabooks where 1.5 hours is more common. The included USB Type-C charger can also be used to charge smartphones, Switch consoles, and other compatible laptops.
| Lenovo Yoga C940-14IIL 81Q9 i7-1065G7, Iris Plus Graphics G7 (Ice Lake 64 EU), 60 Wh | Asus ZenBook S13 UX392FN i7-8565U, GeForce MX150, 50 Wh | Lenovo Yoga C930-13IKB 81C4 i5-8550U, UHD Graphics 620, 60 Wh | Lenovo Yoga C940-14IIL i7-1065G7, Iris Plus Graphics G7 (Ice Lake 64 EU), 60 Wh | Razer Blade Stealth i7-1065G7 Iris Plus i7-1065G7, Iris Plus Graphics G7 (Ice Lake 64 EU), 53.1 Wh | Dell XPS 13 7390 2-in-1 Core i7 i7-1065G7, Iris Plus Graphics G7 (Ice Lake 64 EU), 51 Wh | |
|---|---|---|---|---|---|---|
| Pil Çalışma Süresi | 15% | 52% | 45% | 33% | 23% | |
| WiFi v1.3 (h) | 7.3 | 8.4 15% | 11.1 52% | 10.6 45% | 9.7 33% | 9 23% |
| Reader / Idle (h) | 28.5 | |||||
| Load (h) | 1.7 | 1.1 |
Artılar
Eksiler
Verdict
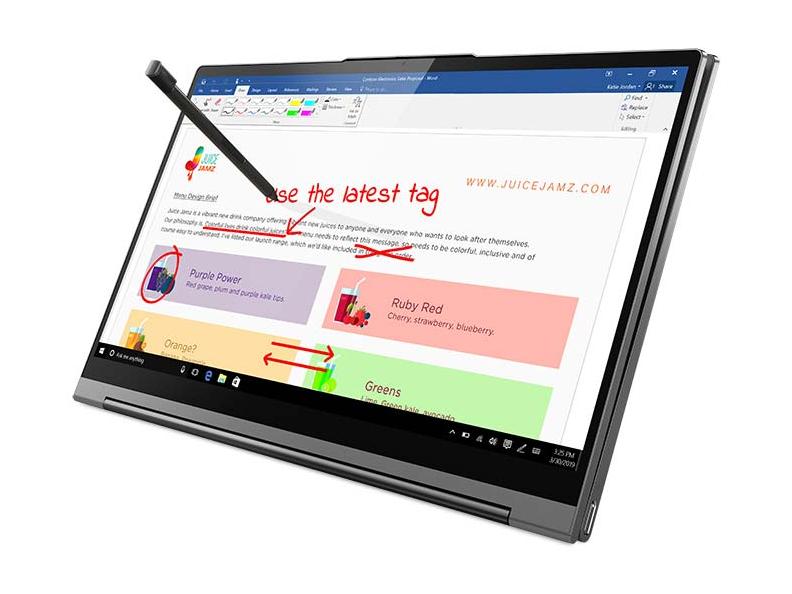
Opting for the 4K UHD Yoga C940 instead of the less expensive FHD SKU will bring some advantages and disadvantages. The good news is that the higher native resolution allows for finer pen inputs, slightly deeper colors, and a measurably brighter backlight than the FHD SKU without impacting response times or contrast by very much. Colors and grayscale are curiously not as accurate out of the box, but an end-user calibration addresses this.
The main drawback of the 4K option is its shorter battery life by about 3 hours according to our measurements and slightly higher power consumption levels. Even so, 7 hours of real-world WLAN use should be more than enough for most users. All Yoga C940-14 SKUs share the same disadvantages when it comes to the difficult serviceability, pulsing fans when gaming, and highly variable gaming performance of Ice Lake.
The business-centric HP EliteBook x360 1040 series has more connectivity options, brighter displays, and slimmer designs for a higher starting price than the Lenovo Yoga C940-14. If you want a more balanced 14-inch consumer convertible without settling for the smaller 13.3-inch Spectre x360 or 13.4-inch Dell XPS 2-in-1, then the Yoga C940 should be on the top of your list.
Lenovo Yoga C940-14IIL 81Q9
- 12/19/2019 v7 (old)
Allen Ngo
Price comparison
