Aorus 15 YE5 incelemesi: Para biriktirenler için üst düzey oyun dizüstü bilgisayarı

Sadece düşük fiyatı sayesinde Aorus 15 YE zaten ilginç bir oyun dizüstü bilgisayarı. Dışarıdan bakıldığında modern ve ince görünüyor - uygun fiyatlı paket Thunderbolt 4 ve DDR5 bile içeriyor. Buna karşılık içeride (güçlü) son nesil donanım, yani pek de üst düzey olmayan bir Core i5-12500H ve önceki Nvidia amiral gemisi modeli RTX 3080 Ti. Tüm bunlar Aorus 15 YE5'i 1.500 ABD dolarına alabileceğiniz en güçlü oyun dizüstü bilgisayarlarından biri haline getiriyor.
CPU ve GPU'su bir önceki nesilden olmasına rağmen, Aorus'un güncel rakiplerine karşı kendini savunması ve paranızın karşılığını gerçekten verip veremediğini göstermesi gerekiyor. Daha sonra, RTX 4060 veya RTX 4070, Aorus 15 BSF (RTX 4070) gibi mevcut dizüstü bilgisayarlarla karşı karşıya getireceğiz, Captiva Advanced Gaming I74-121 (RTX 4060), HP Victus 16 (RTX 4070), HP Omen 16 (RTX 4080) ve çok daha pahalı olan Dell XPS 15 9530 (RTX 4070).
Karşılaştırmalı olarak olası rakipler
Derecelendirme | Tarih | Modeli | Ağırlık | Yükseklik | Boyut | Çözünürlük | Fiyat |
|---|---|---|---|---|---|---|---|
| 86.6 % v7 (old) | 12/2023 | Aorus 15 YE5-54DEB34SH i5-12500H, GeForce RTX 3080 Ti Laptop GPU | 2.3 kg | 27 mm | 15.60" | 2560x1440 | |
| 85.7 % v7 (old) | Aorus 15 BSF i7-13700H, GeForce RTX 4070 Laptop GPU | 2.4 kg | 20.9 mm | 15.60" | 2560x1440 | ||
| 85.7 % v7 (old) | 09/2023 | Captiva Advanced Gaming I74-121 i5-13500H, GeForce RTX 4060 Laptop GPU | 2.3 kg | 29 mm | 15.60" | 1920x1080 | |
| 85.1 % v7 (old) | 09/2023 | HP Victus 16-r0077ng i7-13700H, GeForce RTX 4070 Laptop GPU | 2.4 kg | 24 mm | 16.10" | 1920x1080 | |
| 90.3 % v7 (old) | 06/2023 | Dell XPS 15 9530 RTX 4070 i7-13700H, GeForce RTX 4070 Laptop GPU | 1.9 kg | 18 mm | 15.60" | 3456x2160 | |
| 87.4 % v7 (old) | 09/2023 | HP Omen 16-wf000 i7-13700HX, GeForce RTX 4080 Laptop GPU | 2.4 kg | 23.6 mm | 16.10" | 2560x1440 |
Kasa ve bağlantı: Modern, ancak minimum düzeyde tutulmuş
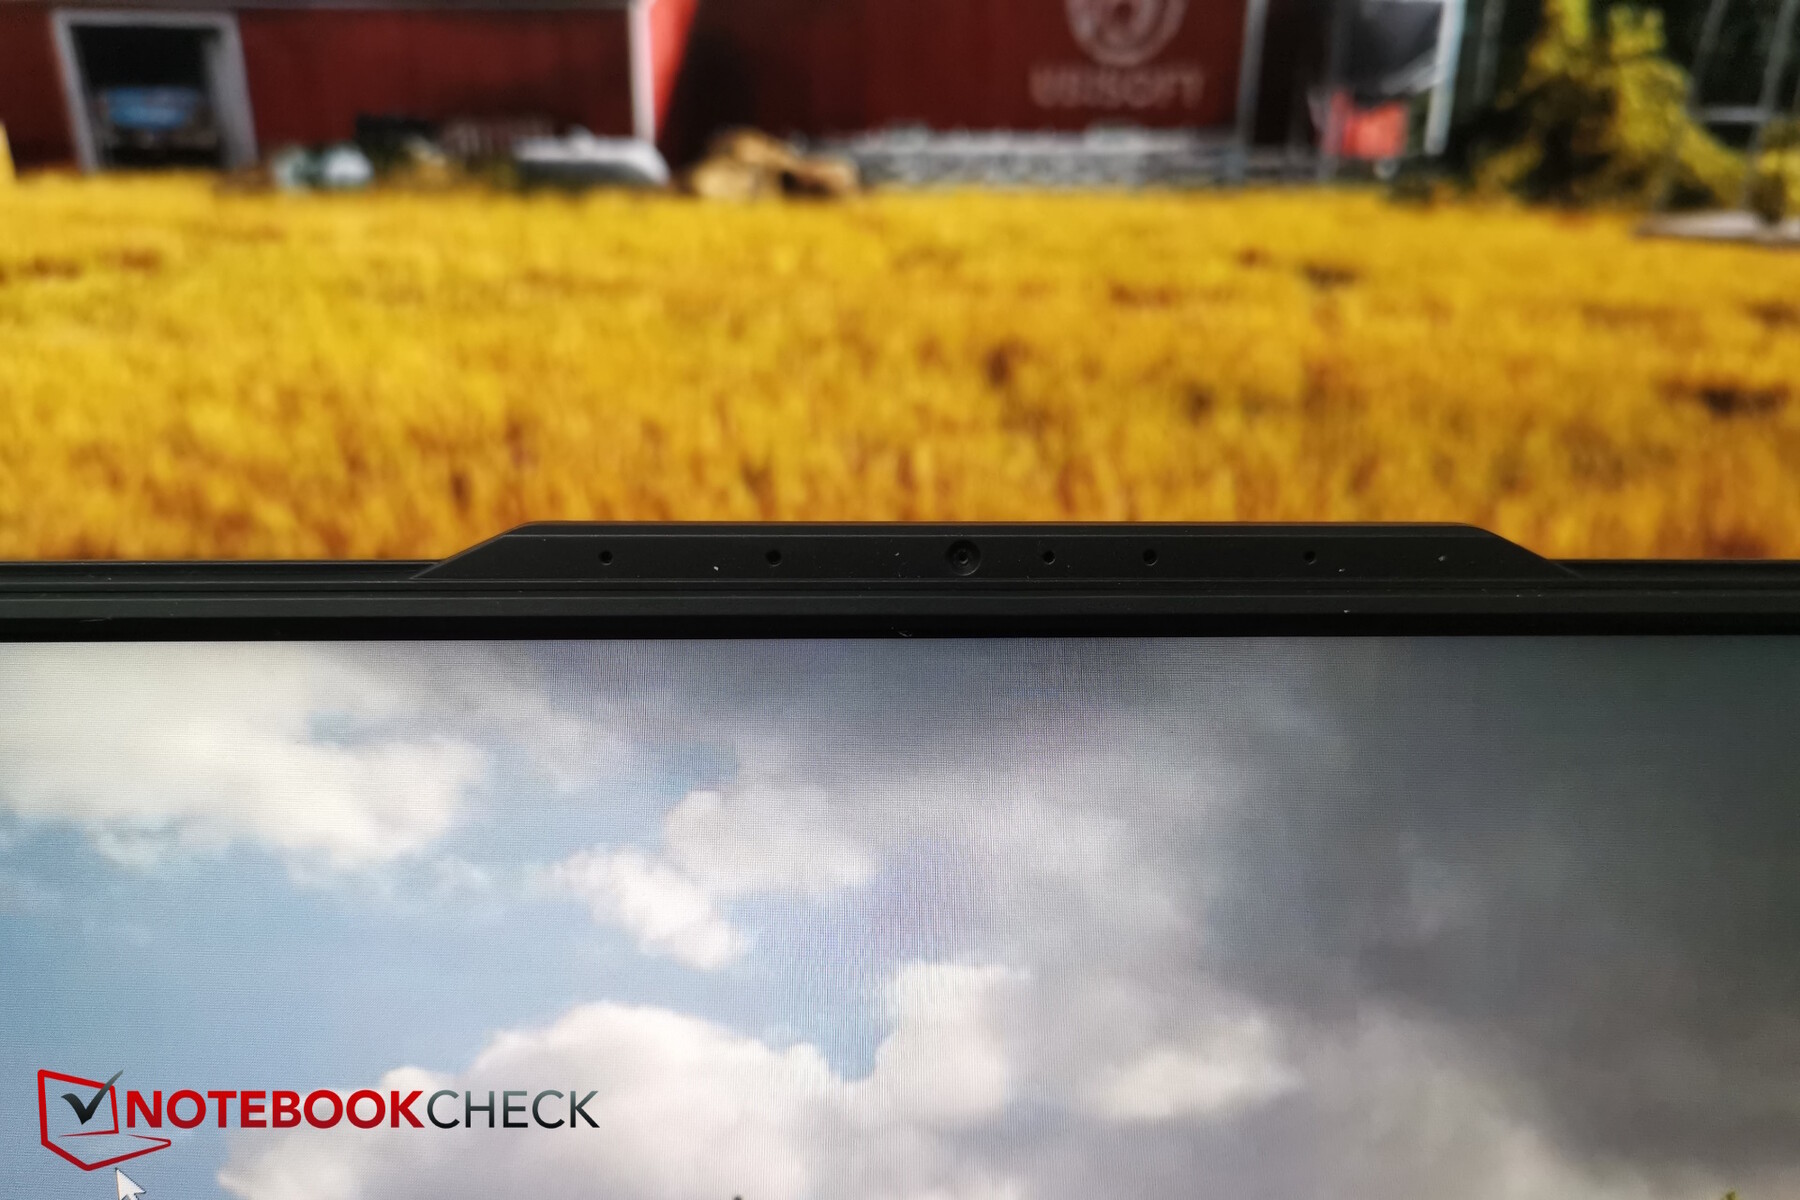
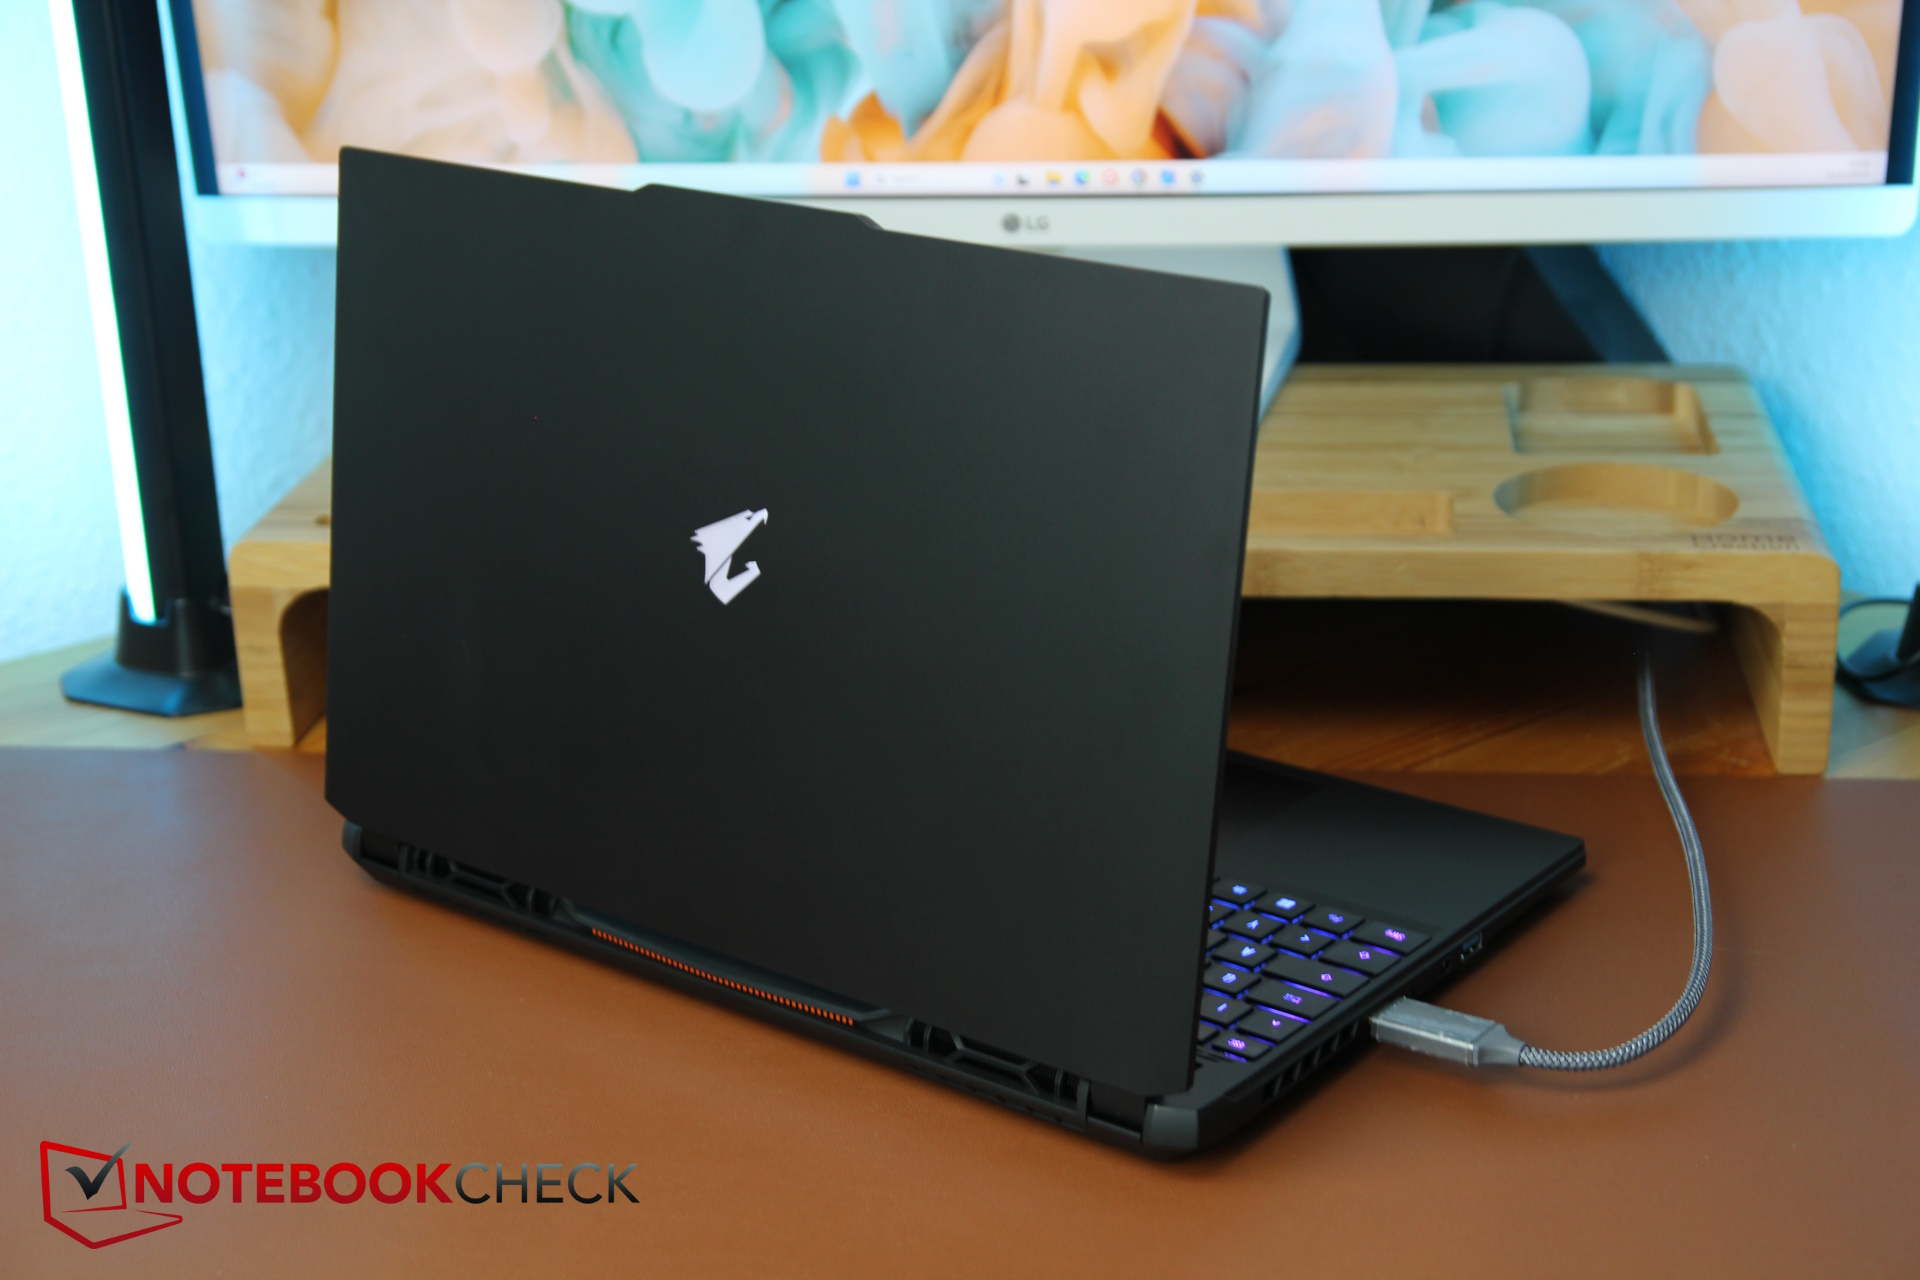
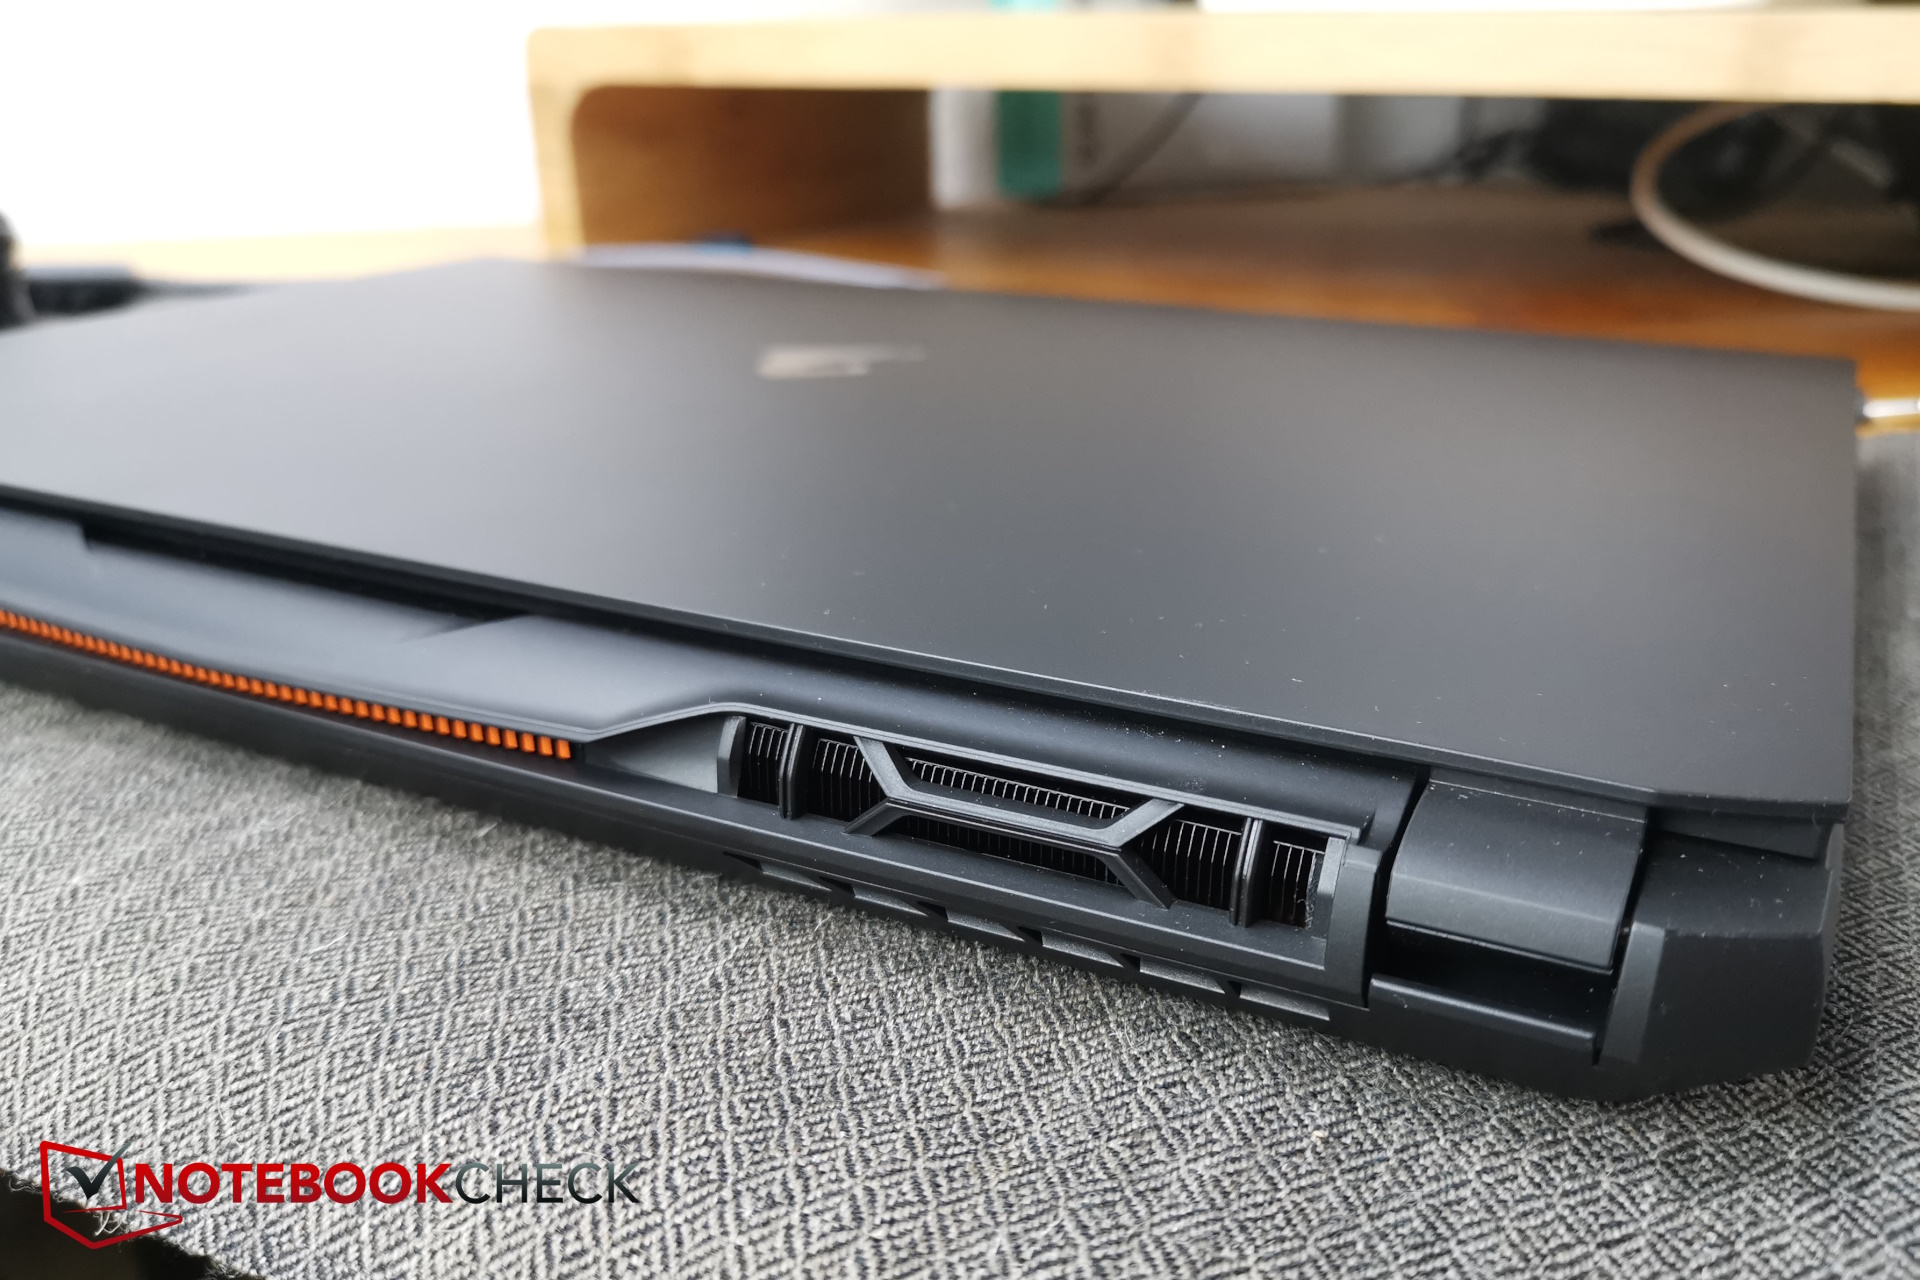
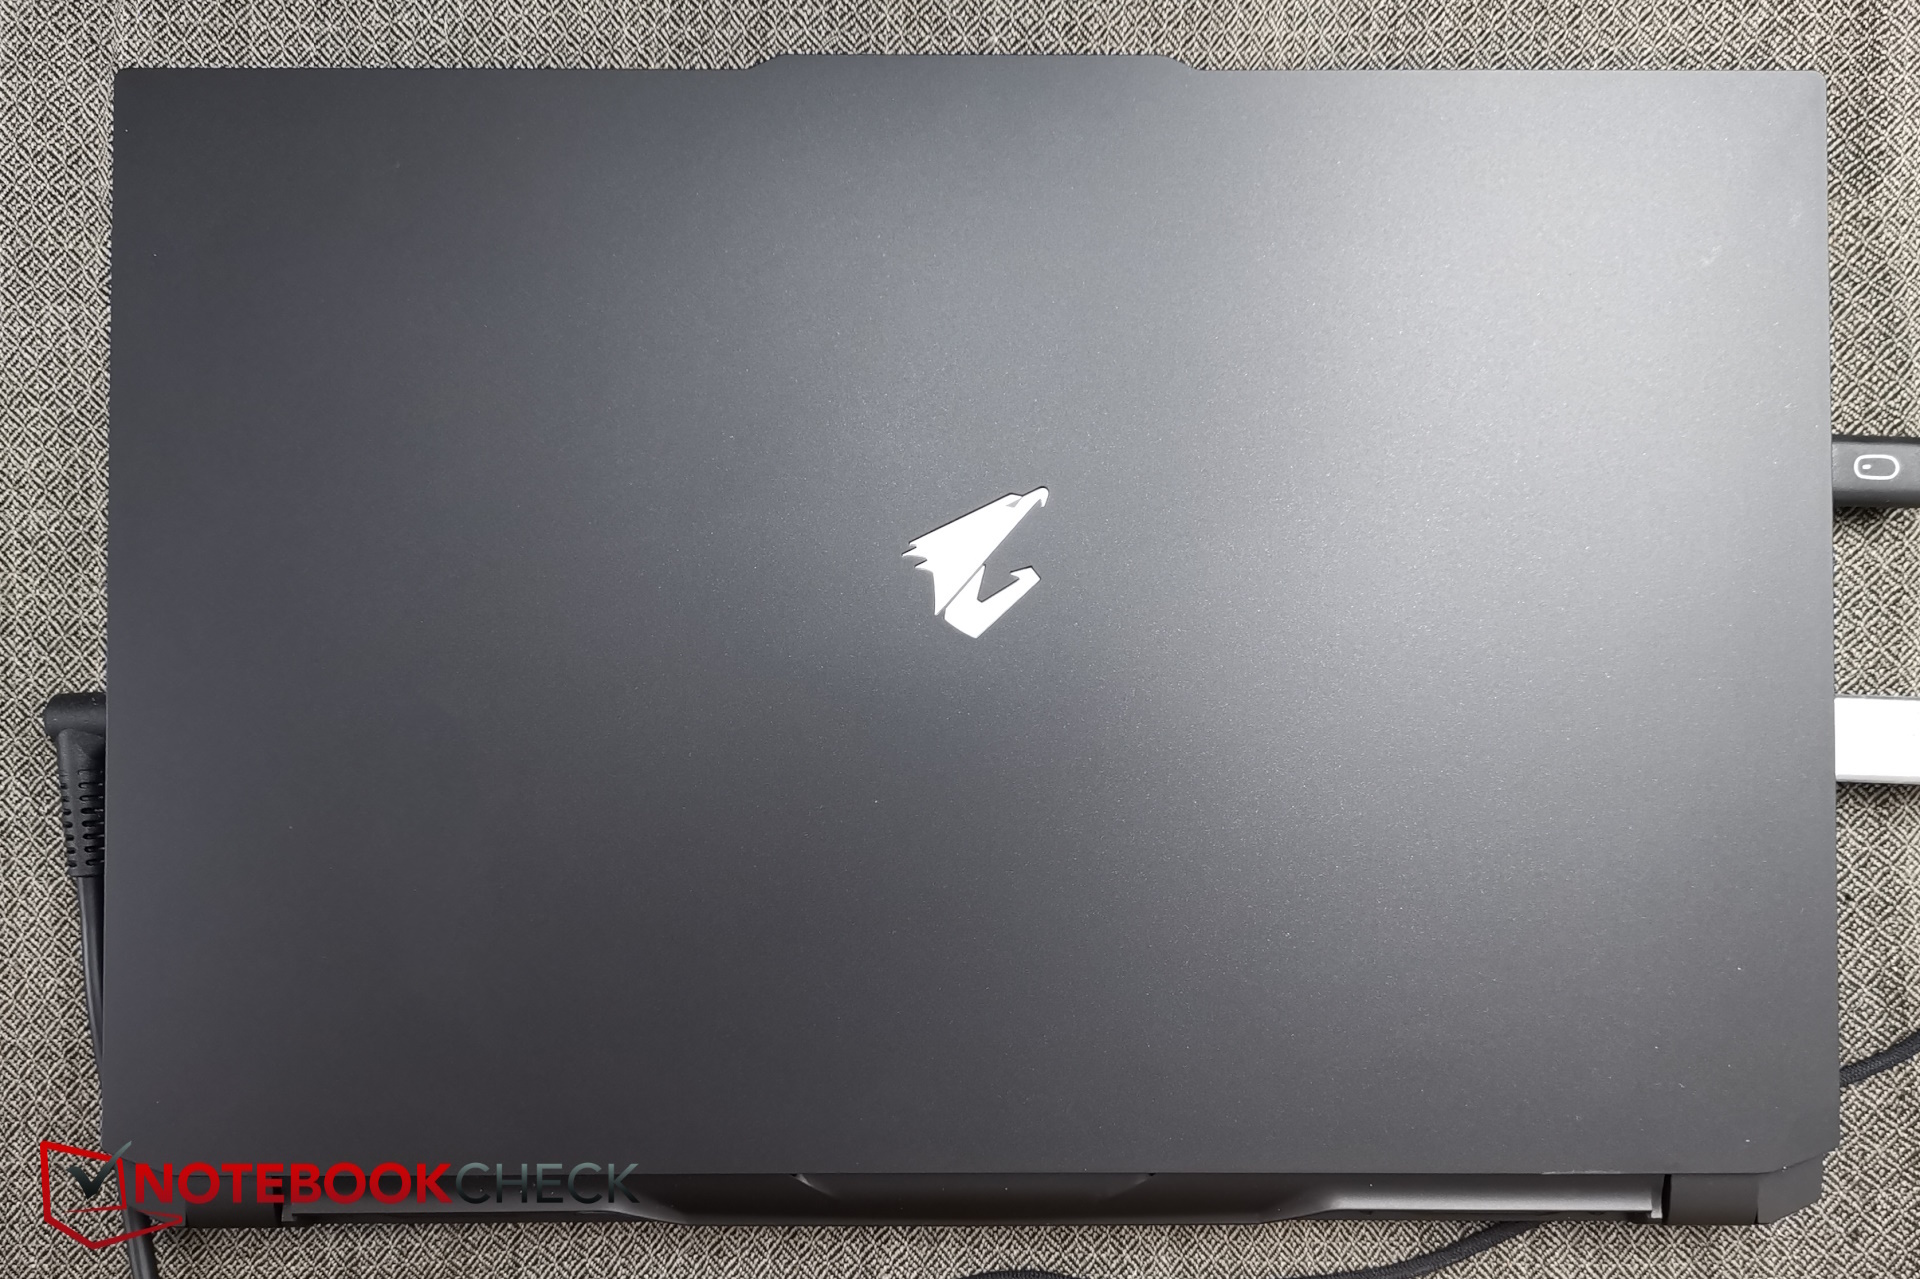
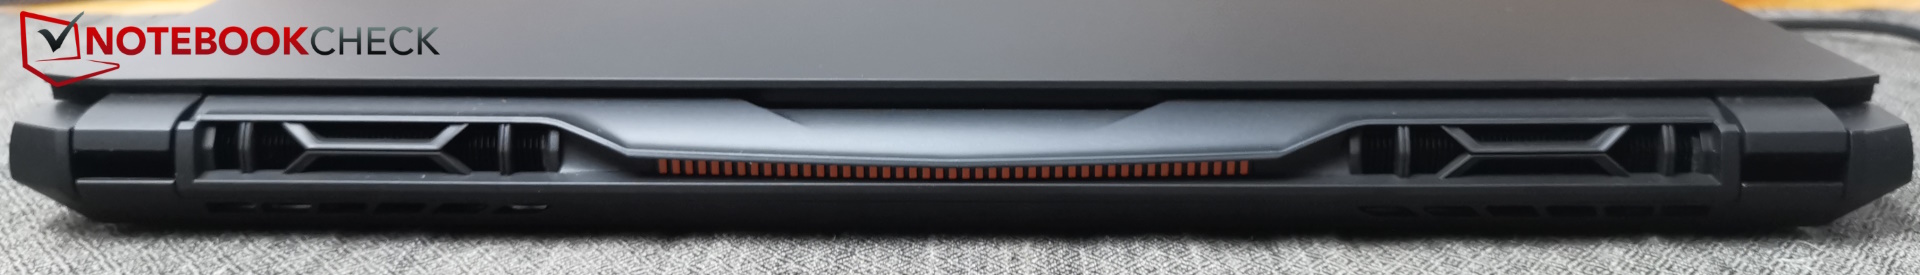
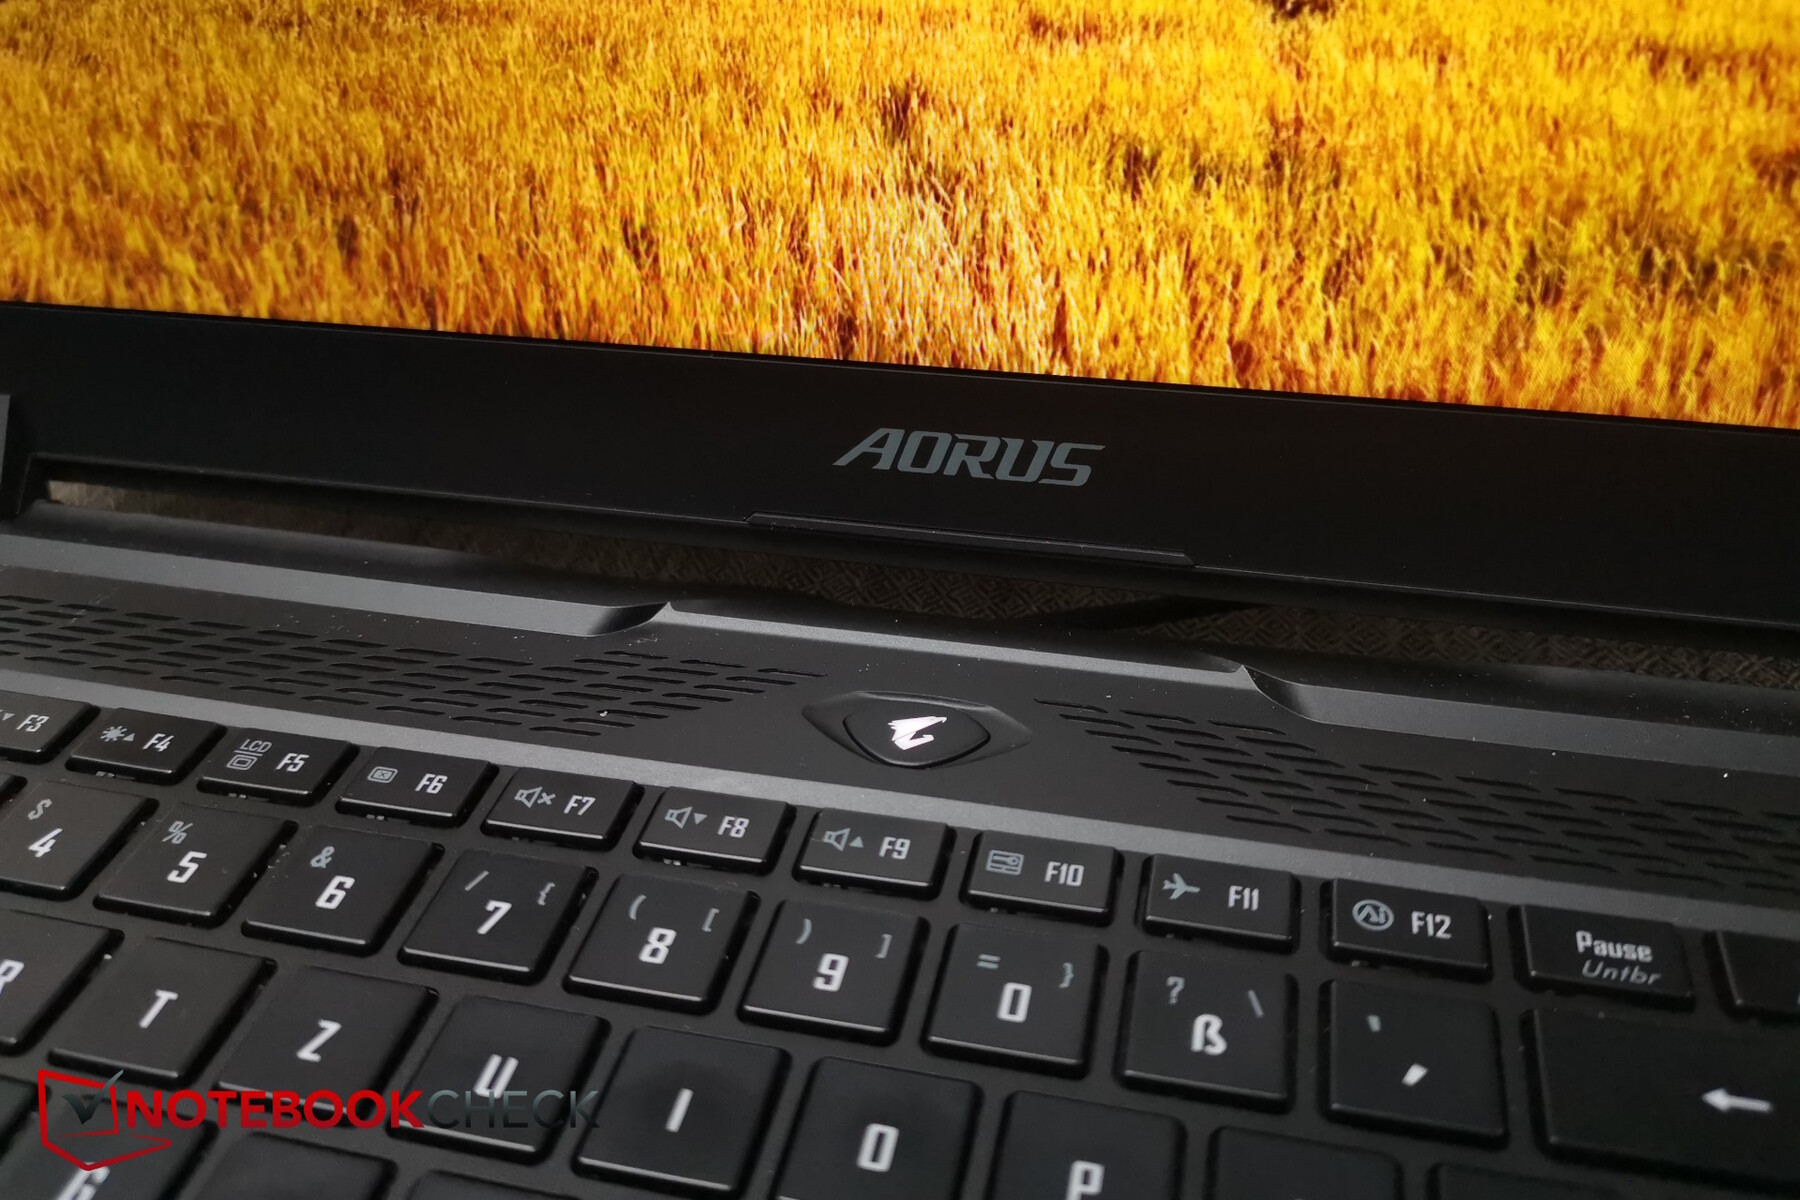
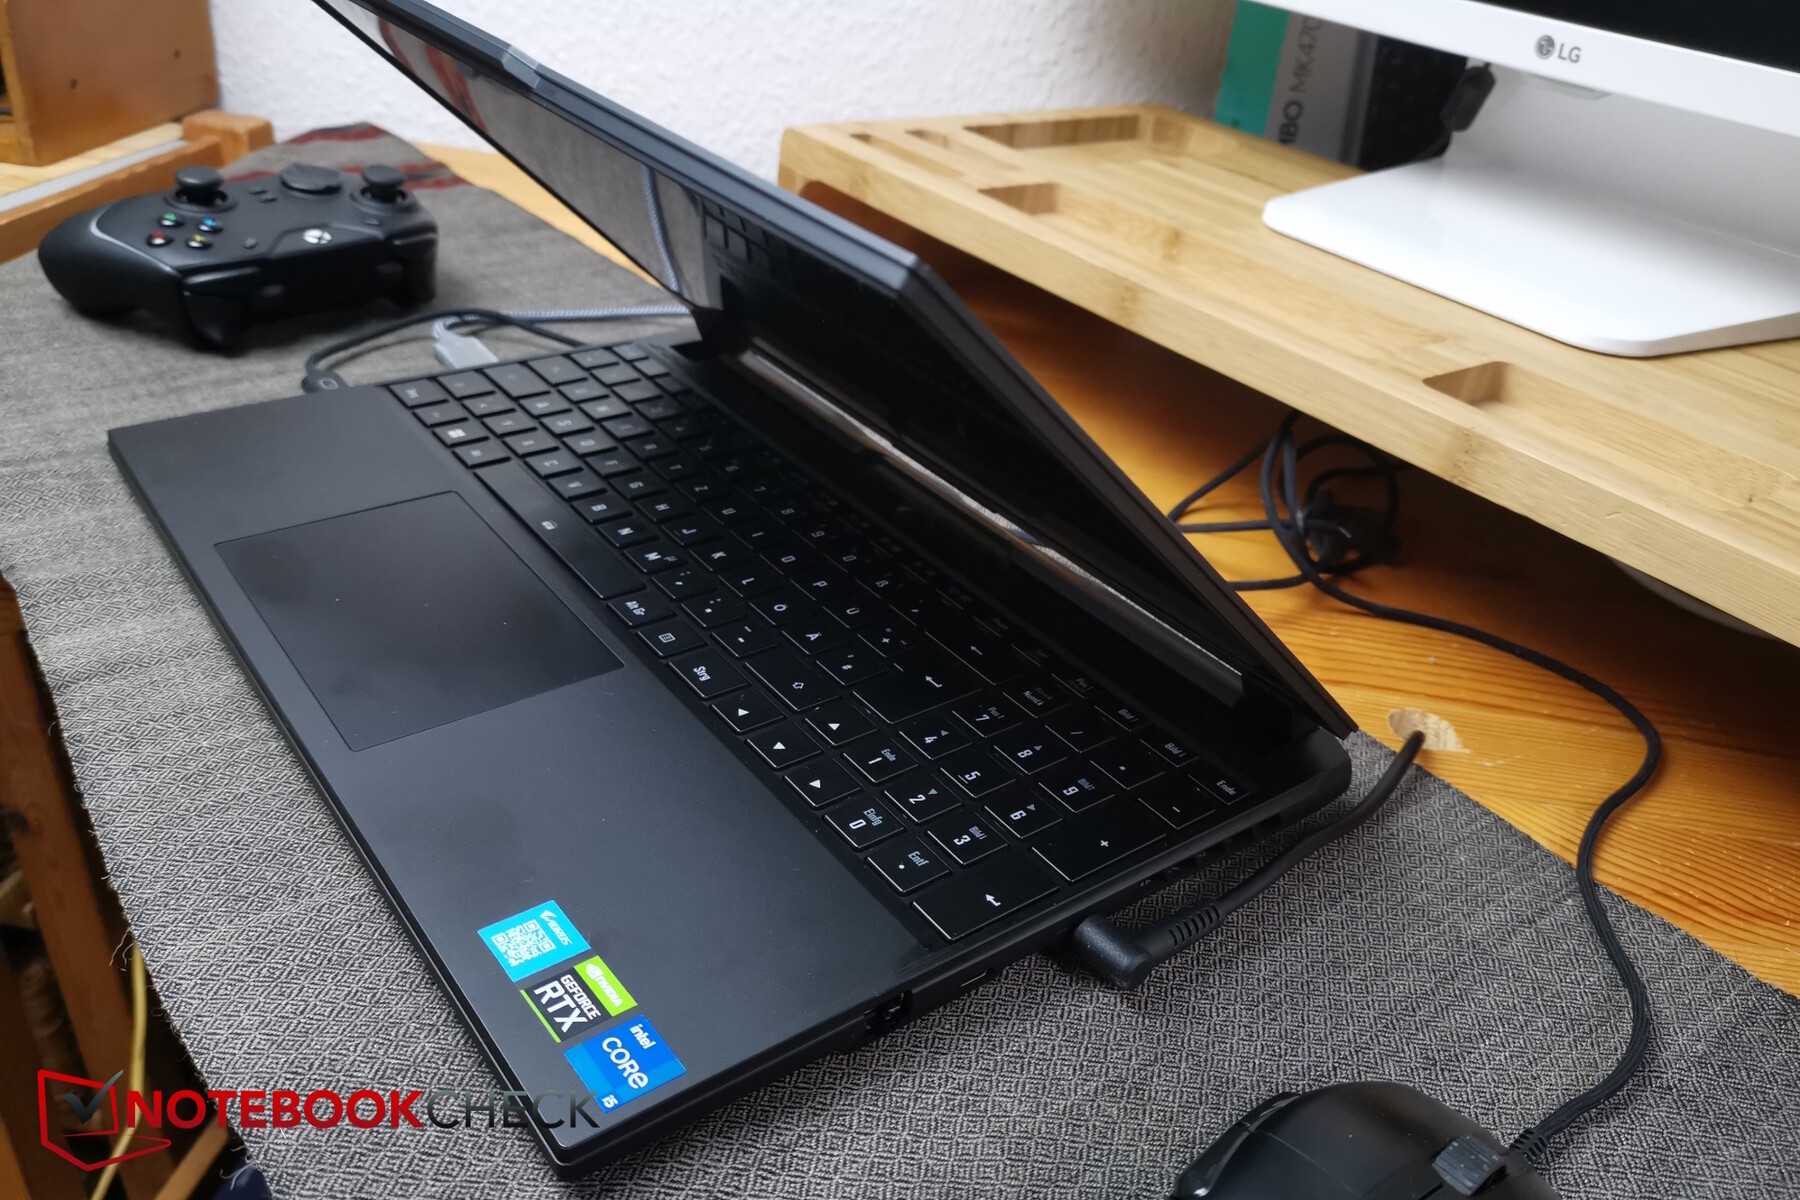
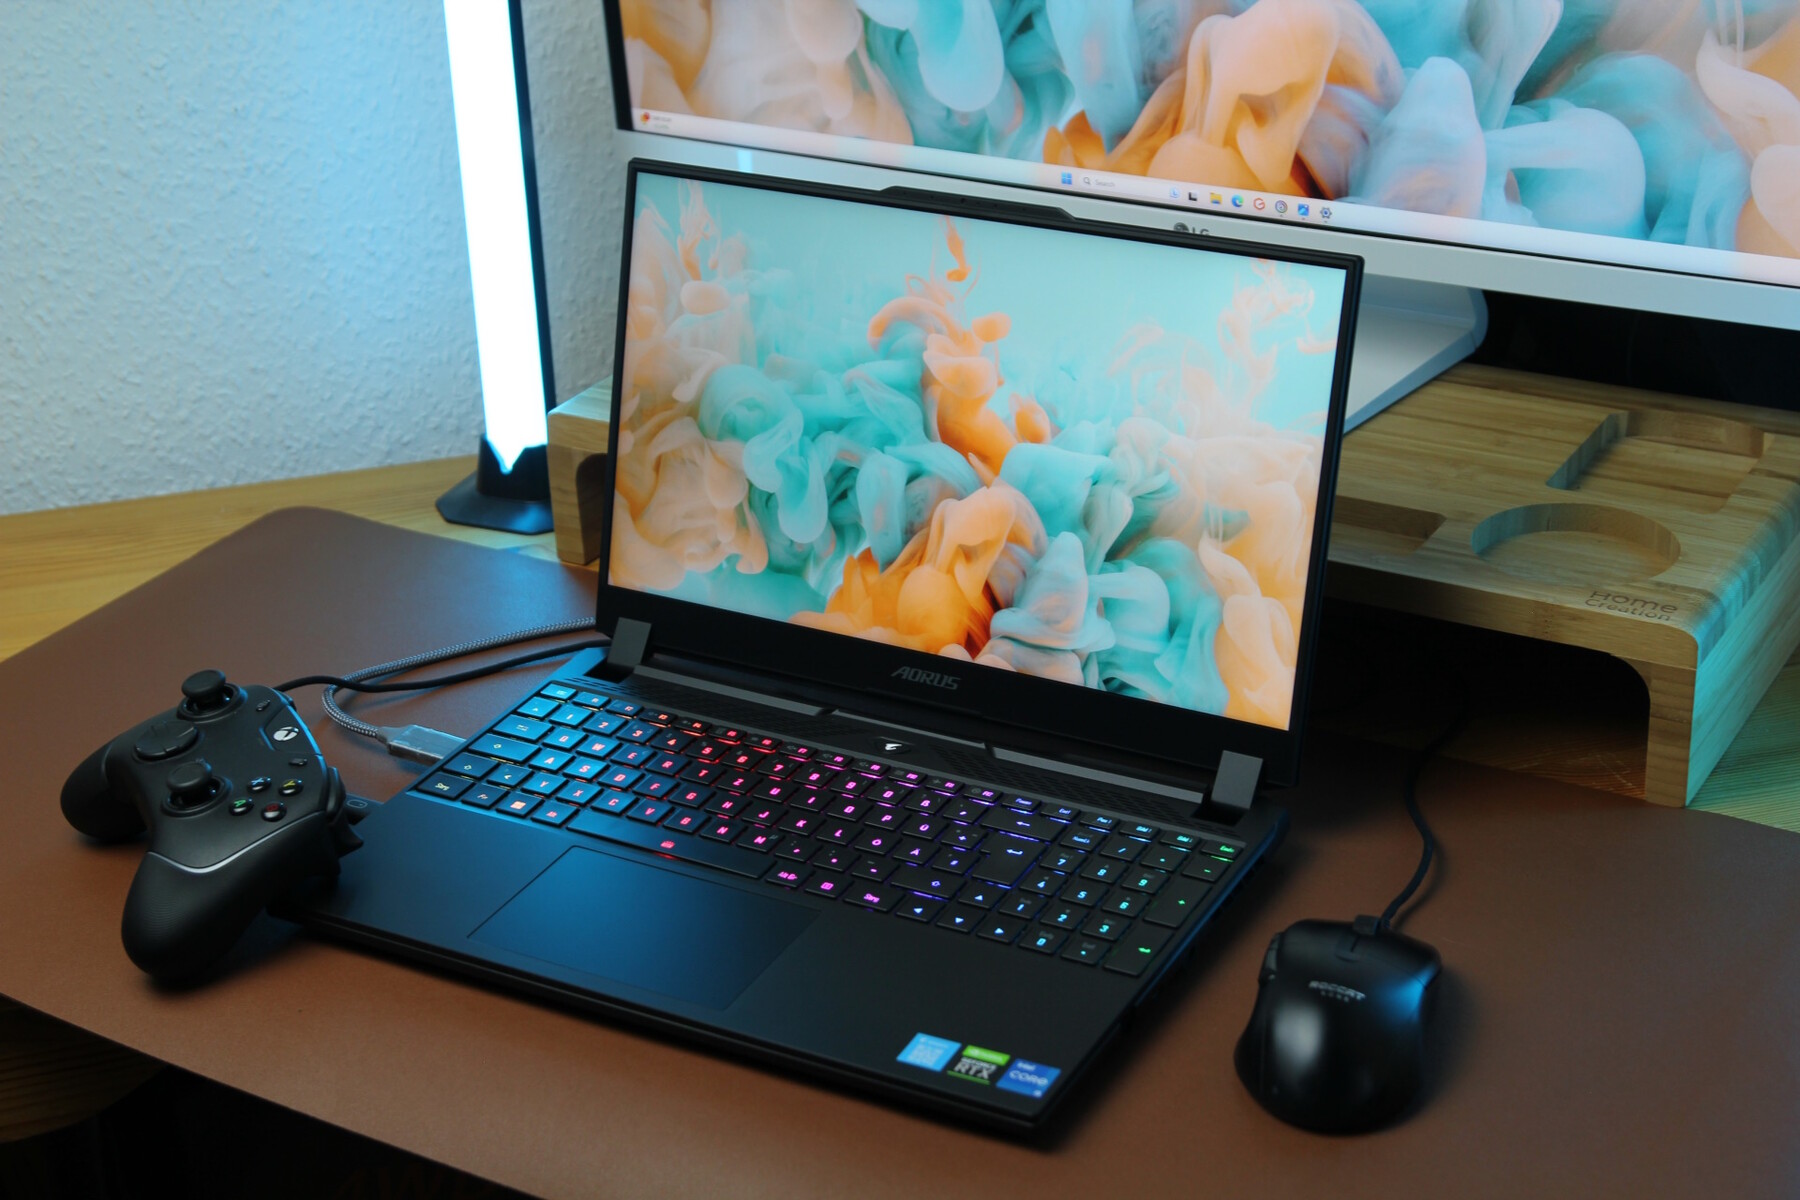
Görsel olarak Aorus oldukça modern ve çekici görünüyor. Bu, mat siyah, ince görünümlü tasarımı sayesinde - dizüstü bilgisayar gerçekte o kadar ince olmasa da (27 mm'ye kadar). Aynı zamanda, örneğin arka fan ızgarası boyunca uzanan yapısı ve burada beliren küçük, turuncu renklendirmeler ya da özel olarak tasarlanmış eğimli kenarları sayesinde şık ama yine de benzersiz. Gümüş Aorus logosu dikkatinizi cihazın üst kısmına çekiyor. Kapağın ön üst kenarı boyunca web kamerası ve hoparlörleri barındıran küçük bir çentik var - ayrıca dizüstü bilgisayarı tek elle açarken size gerçekten iyi bir tutuş sağlıyor.
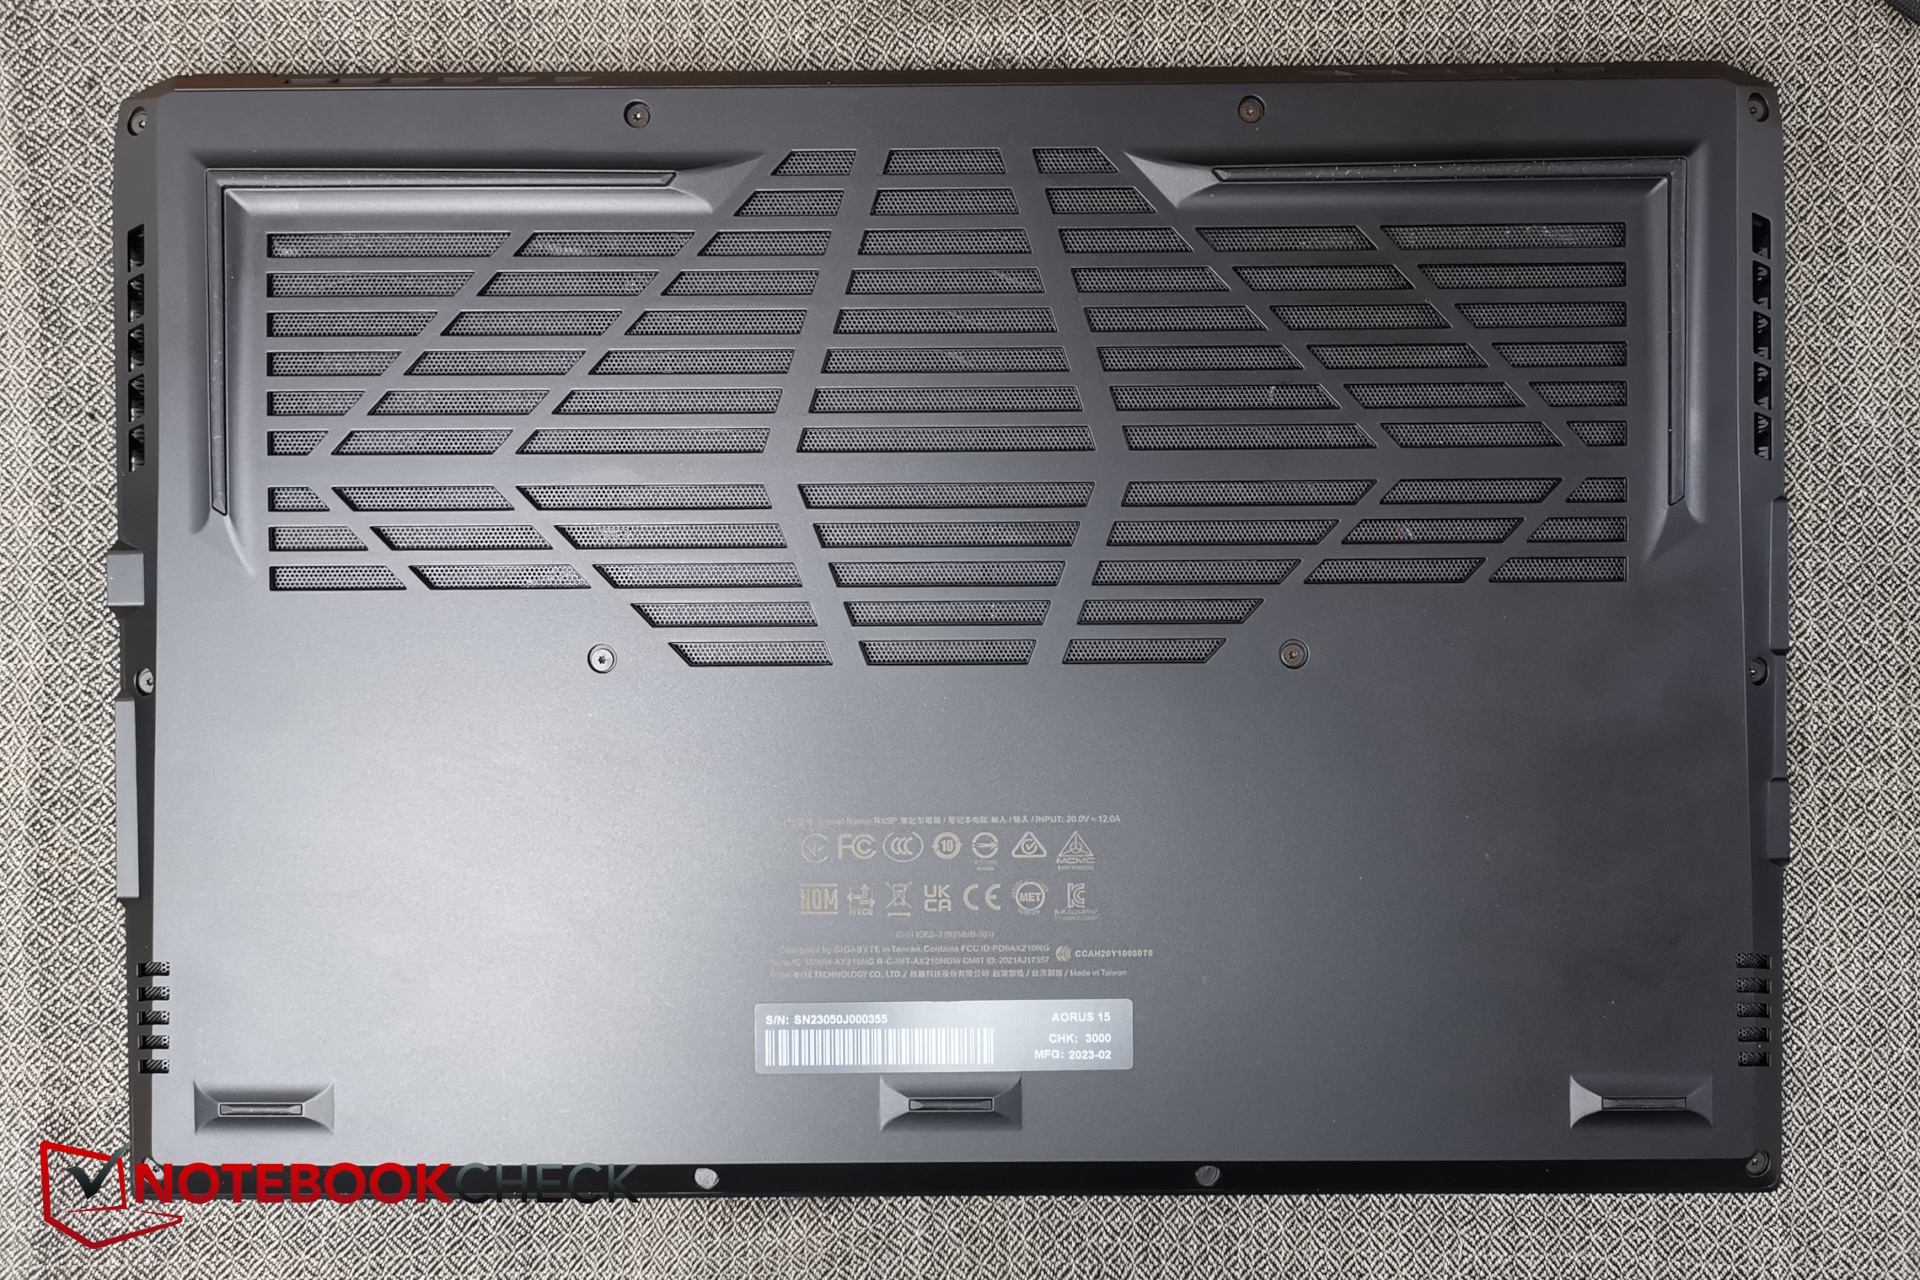
Kasanın tüm kenarları pürüzsüz plastikten yapılmıştır. Bu harika görünüyor ancak bazı rakiplerine kıyasla bükülmeye karşı o kadar dayanıklı değil. Klavyede yazı yazarken herhangi bir esneme yok, bu da stabilitesinin toplamda iyi olduğu anlamına geliyor.
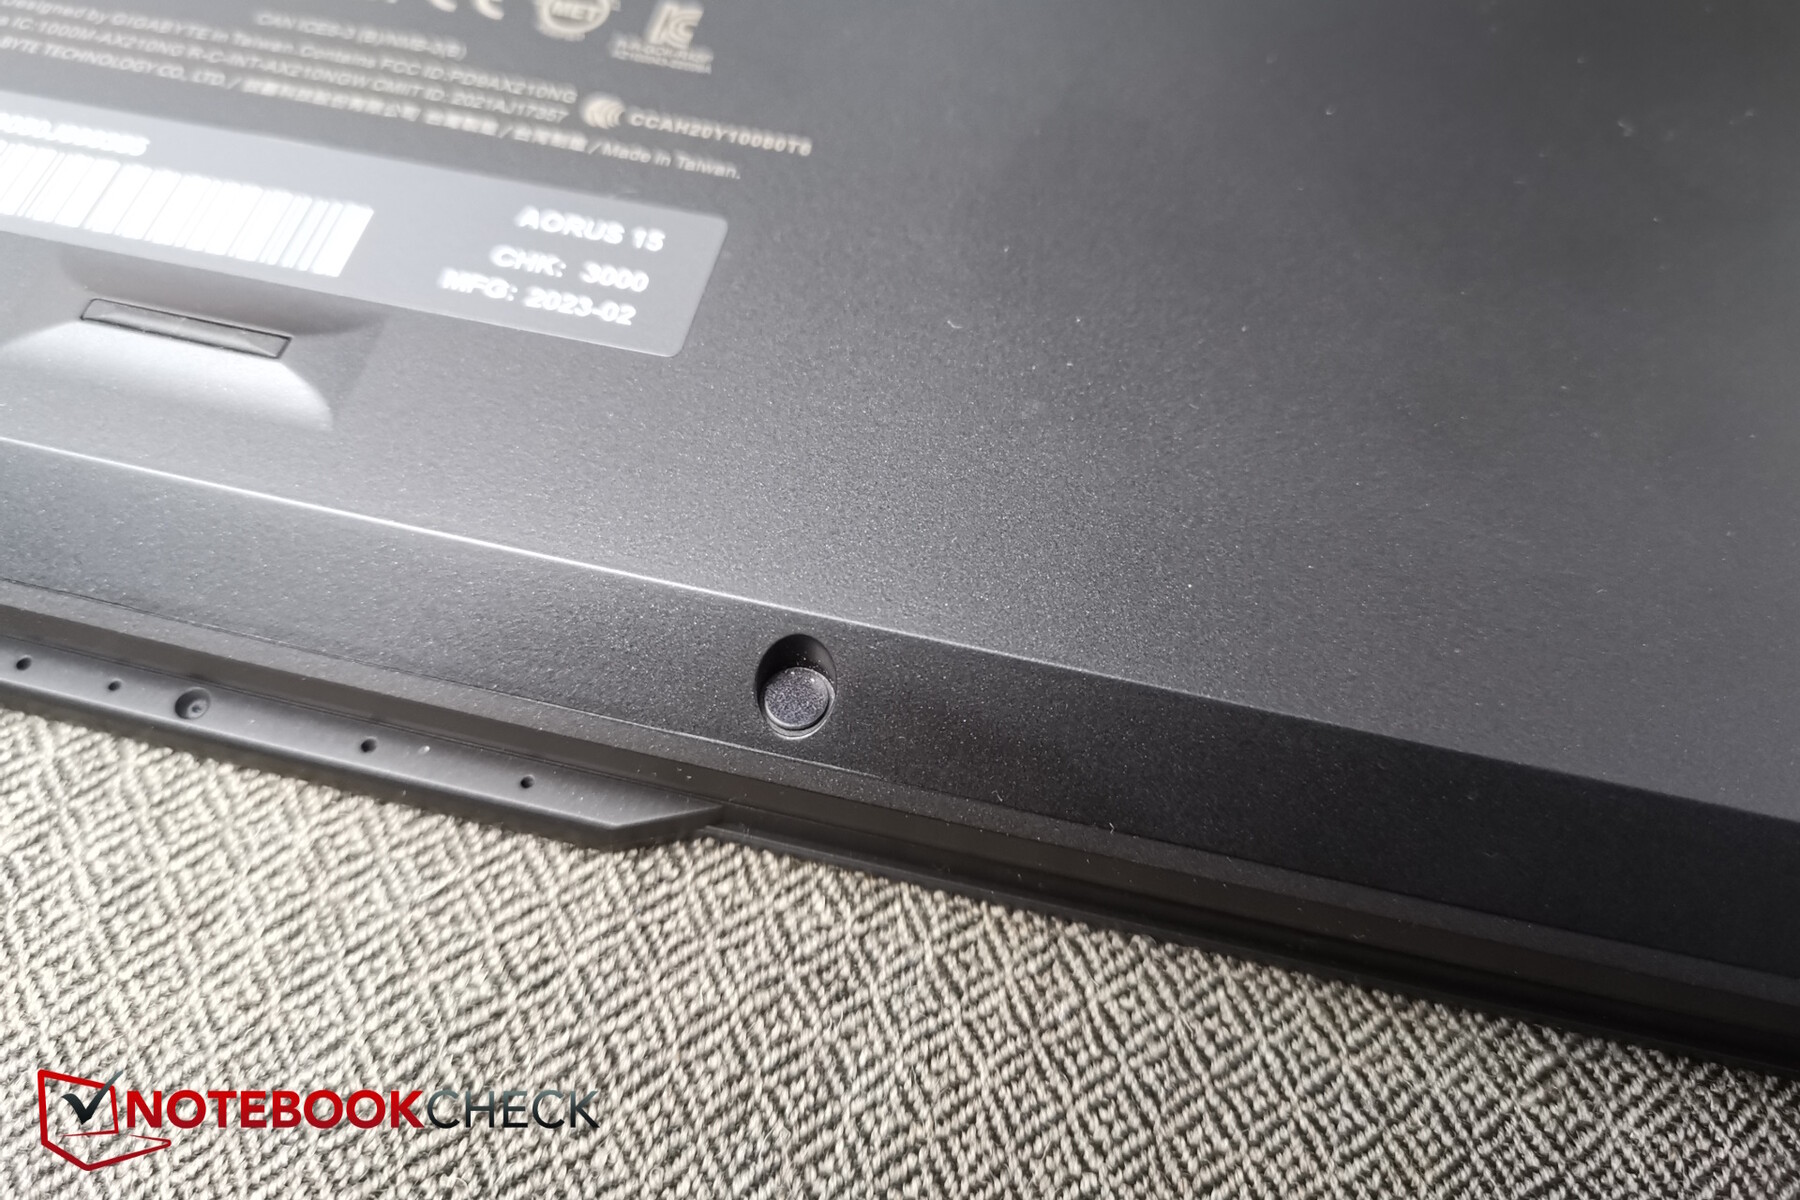
Aorus'u açmadık, çünkü iki Torx vidası bir etiketle kaplanmıştı ve ödünç aldığımız Cyberport'un çıkarları için bunlara zarar vermek istemedik.
Bağlanabilirlik
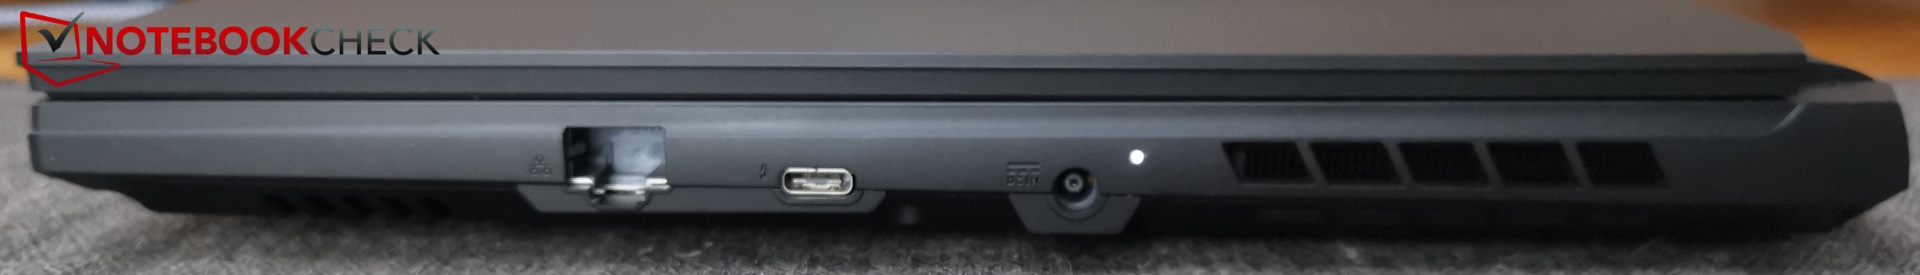
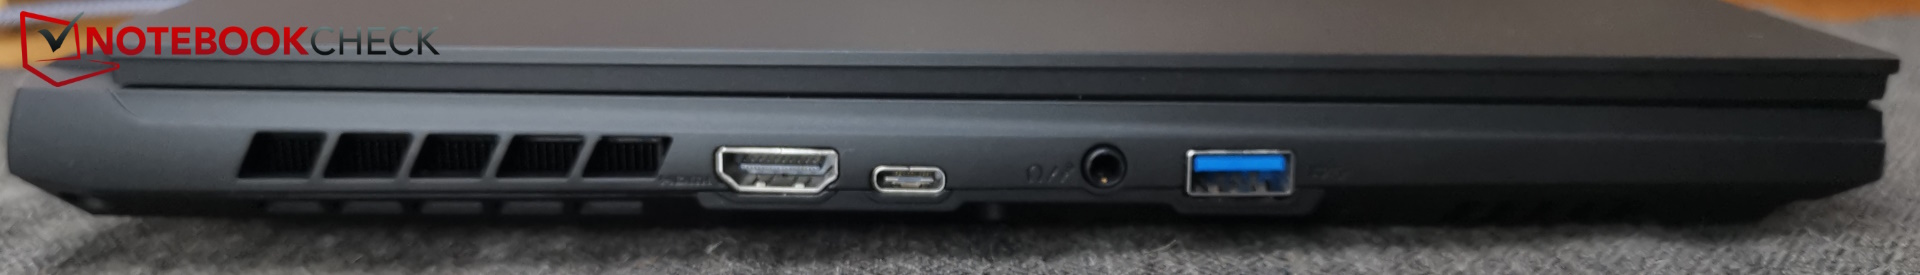
Aorus dizüstü bilgisayarın bağlantı seçenekleri modern olmakla birlikte minimum düzeyde tutulmuştur. Üç USB bağlantı noktasından yalnızca biri Tip-A, ki bu yeterli değil. Buna karşılık, iki Type-C bağlantı noktasından biri Thunderbolt 4 desteğine sahip. Dördüncü bir USB bağlantısının yanı sıra cihazda SD kart okuyucu, Kensington kilidi ve özel bir DisplayPort (USB-C üzerinden 2 kez kullanılabilir) da eksik.
Az sayıda bağlantı noktası olmasına rağmen, bunlar çok iyi yerleştirilmemiştir - sert LAN kabloları için RJ45 bağlantı noktası sağda ve öne doğru konumlandırılmıştır. Aorus'un arkasındaki alan her zamanki gibi kullanılmamış. Sadece fan çıkışlarını barındırıyor.
WiFi ve Web Kamerası
WLAN aktarım hızları hem 6 GHz (WiFi 6E) hem de 5 GHz ağlarda karşılaştırma alanındaki en yüksek hızlar arasında yer alıyor.
Ne yazık ki, cihazın web kamerası hala son nesil: Sadece 720p çözünürlüğe sahip, renk sapmaları oldukça yüksek ve Kontrol Merkezinde deklanşör yok.


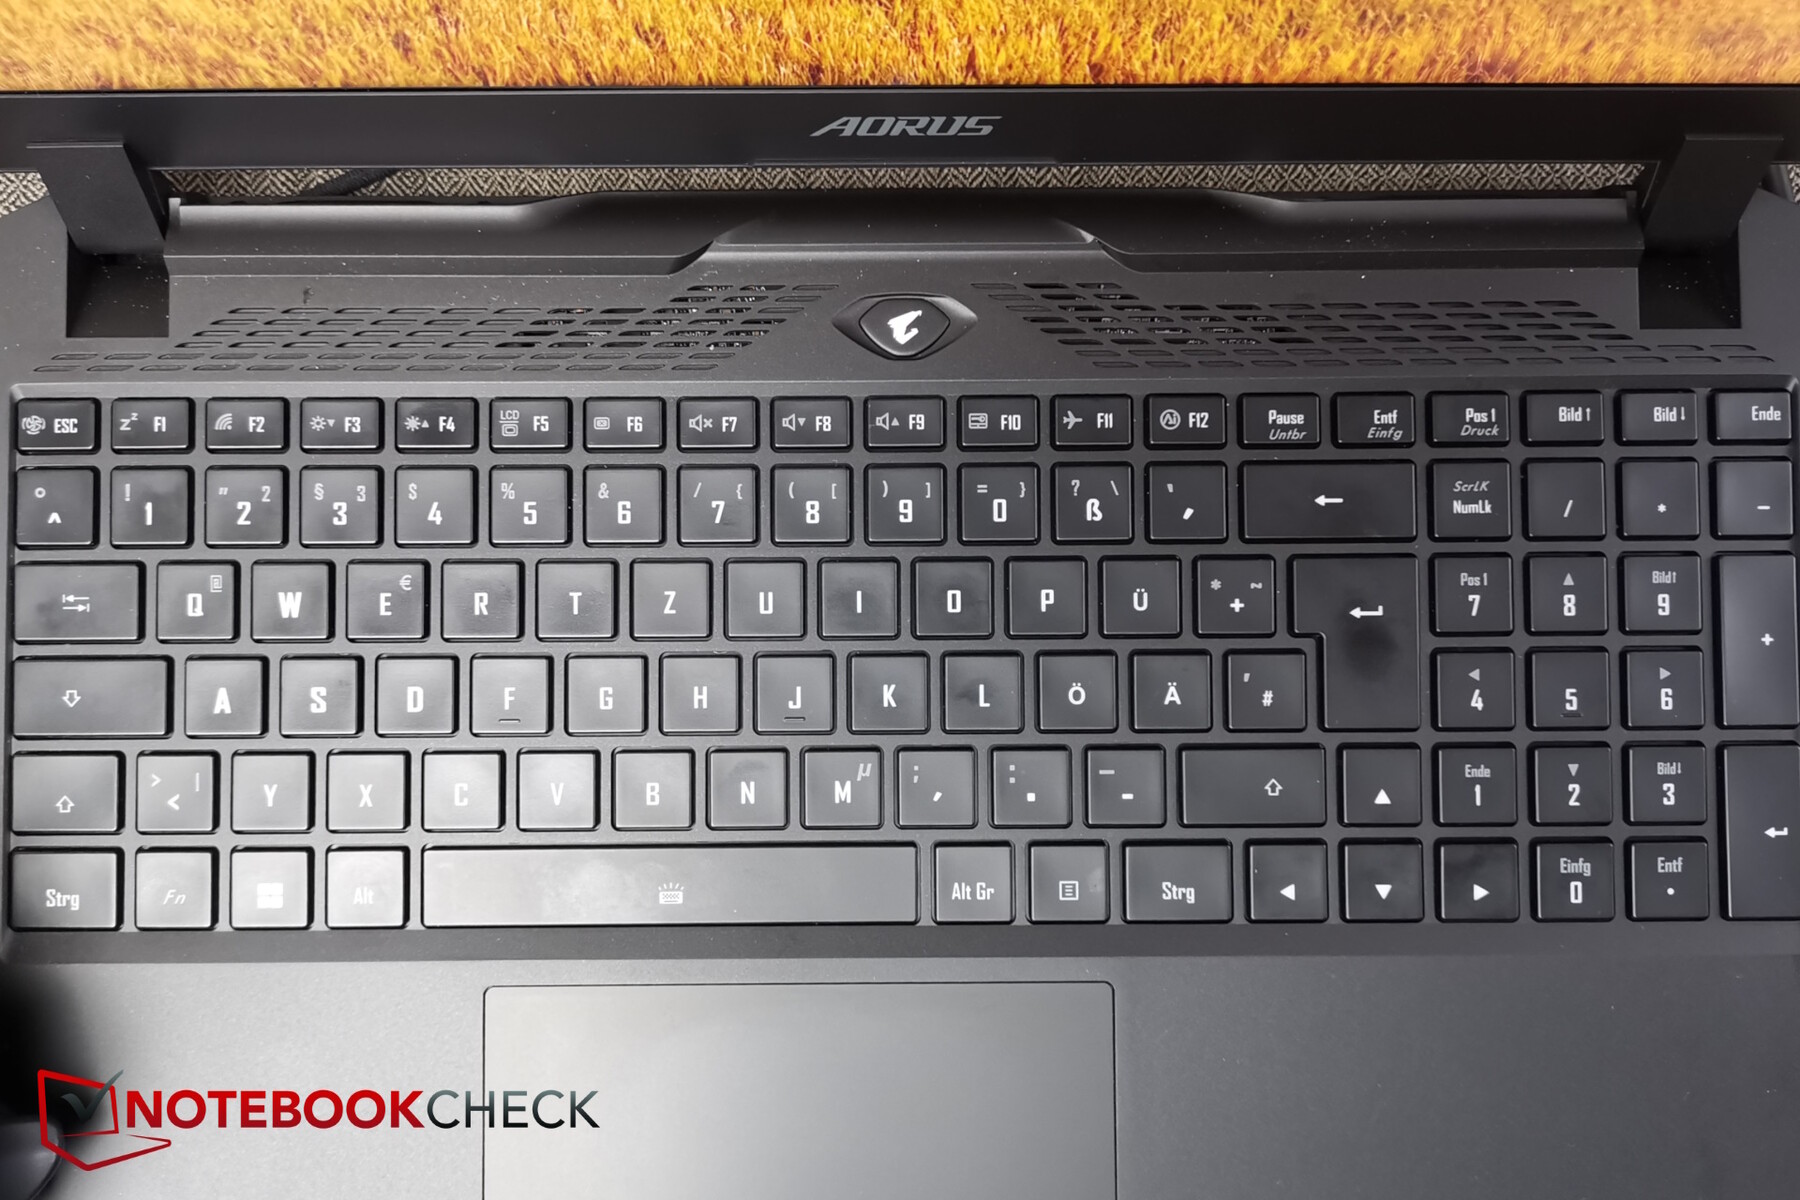
Giriş cihazları - Sağlamdan daha fazlası, ancak koyu renkli özel tuş etiketlemesi
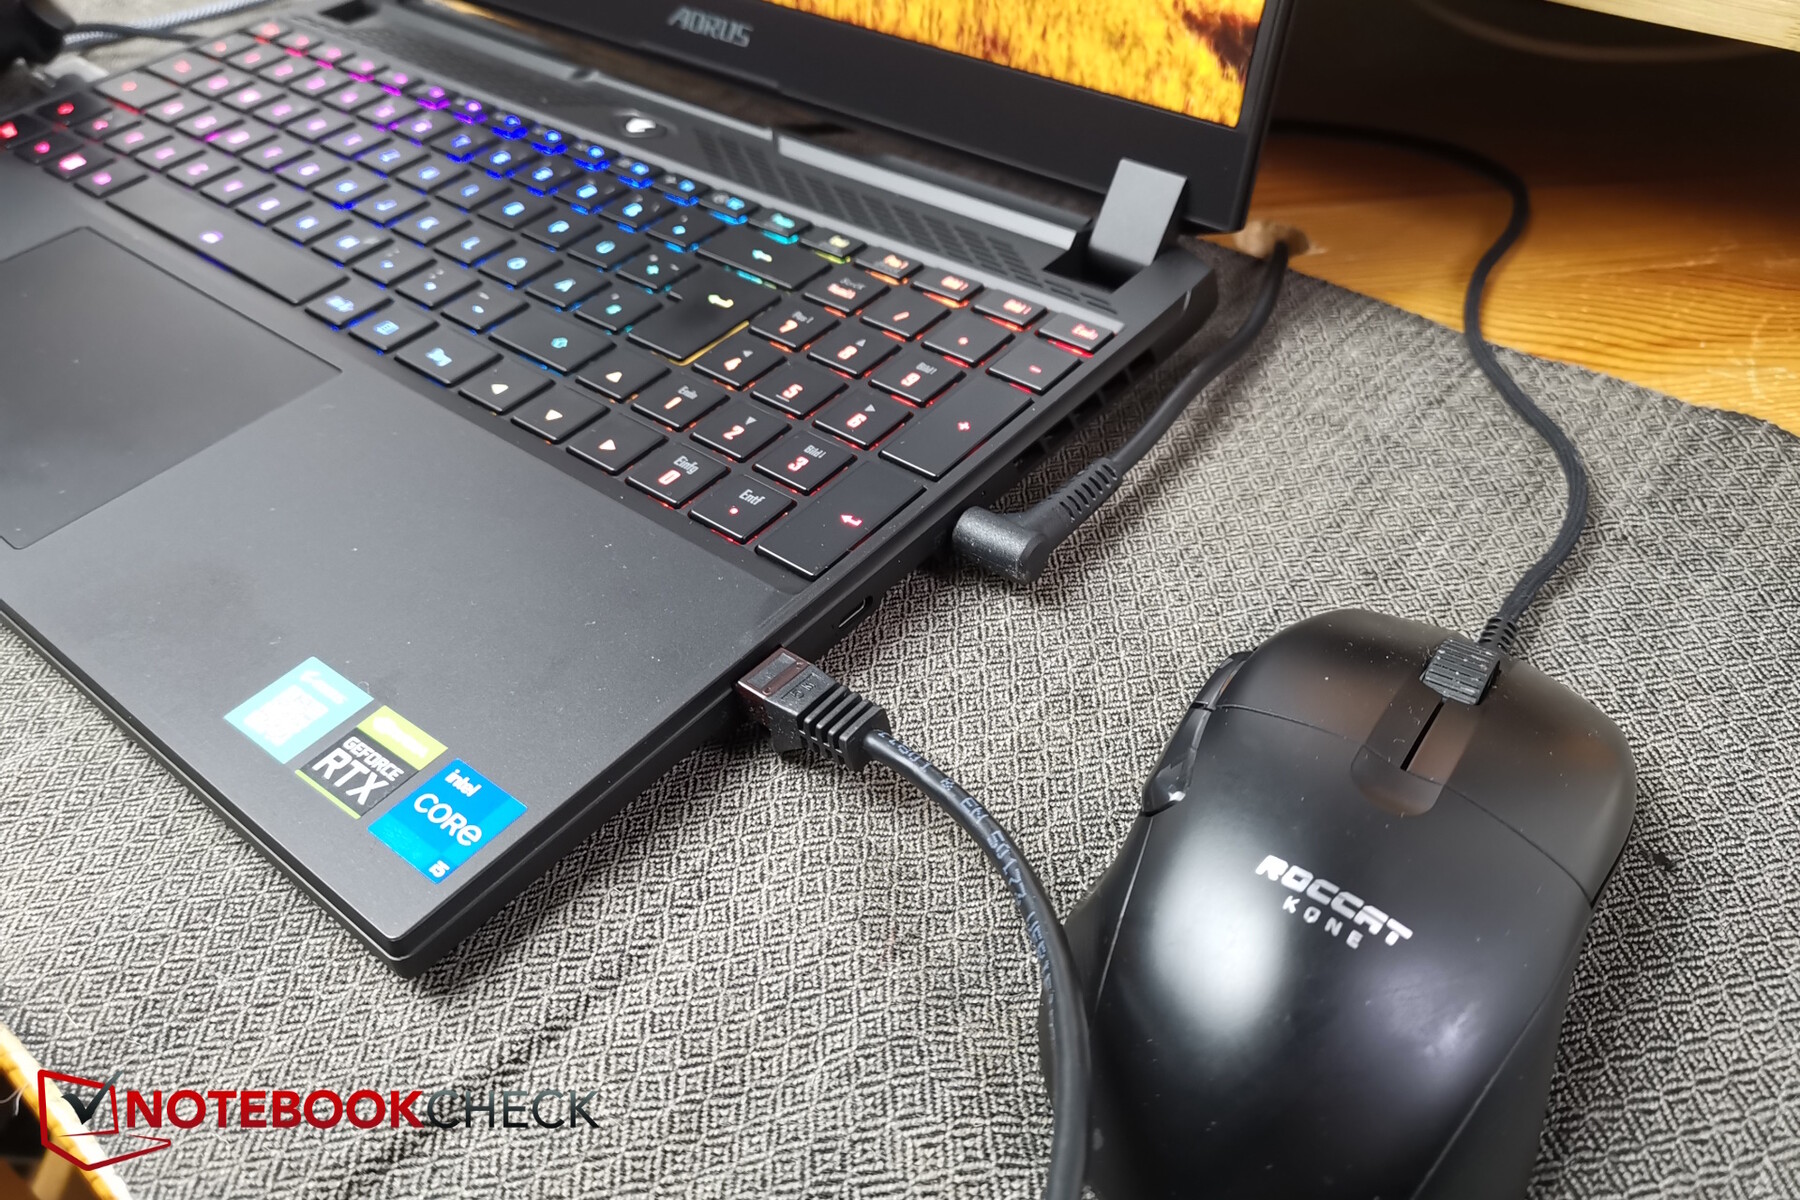
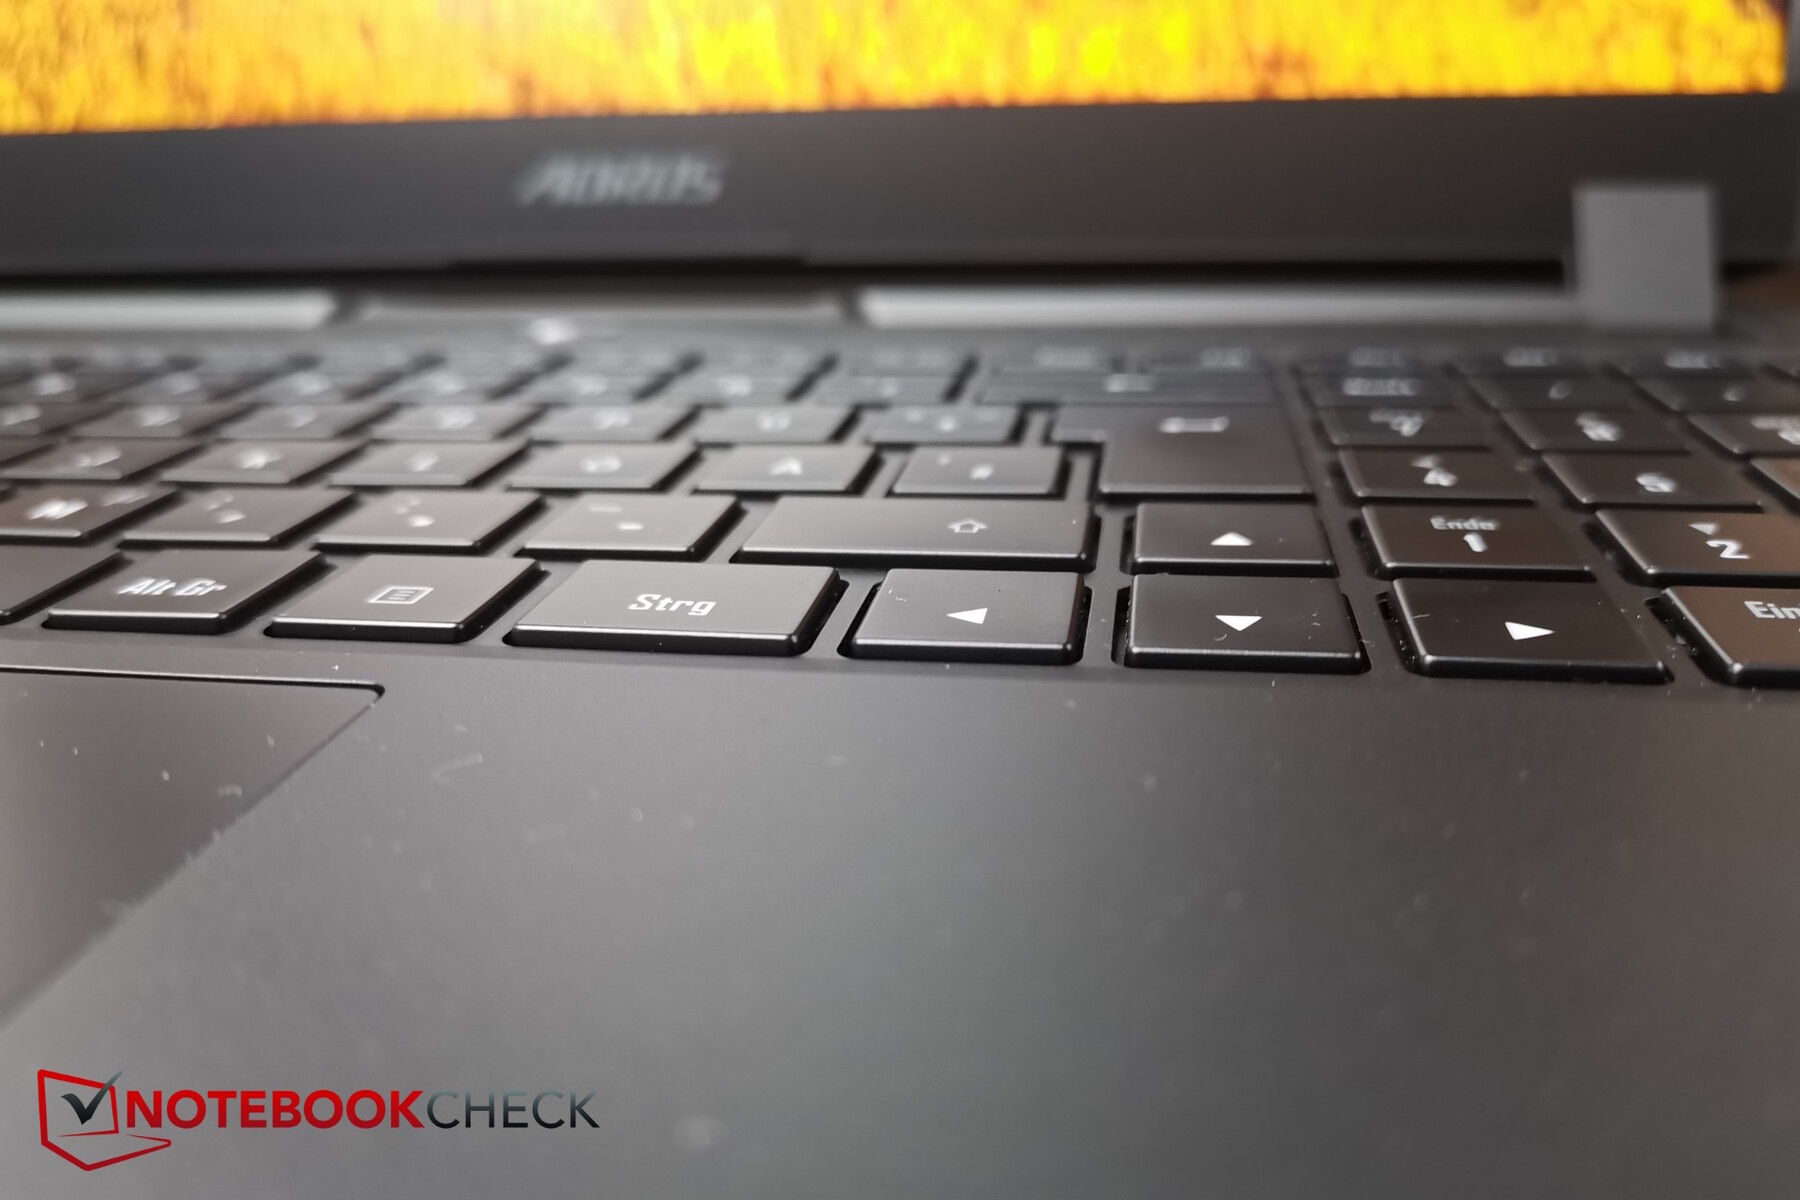
Tuş düzeni çok düzenli - klavye dizüstü bilgisayarın tabanına doğru hafifçe alçaltılmış. Ok tuşları da normal boyuttadır ve doğrudan sağda bir sayısal tuş takımı vardır.
Tuşlar yalnızca düşük ila orta bir kaldırmaya sahip, ancak yine de yazarken şaşırtıcı derecede rahat hissediyorlar, bu da iyi geri bildirimlerinden kaynaklanıyor. Yazarken çıkardıkları sesler daha sessizdir, bu nedenle düşük gürültülü ortamlar için de uygundurlar.
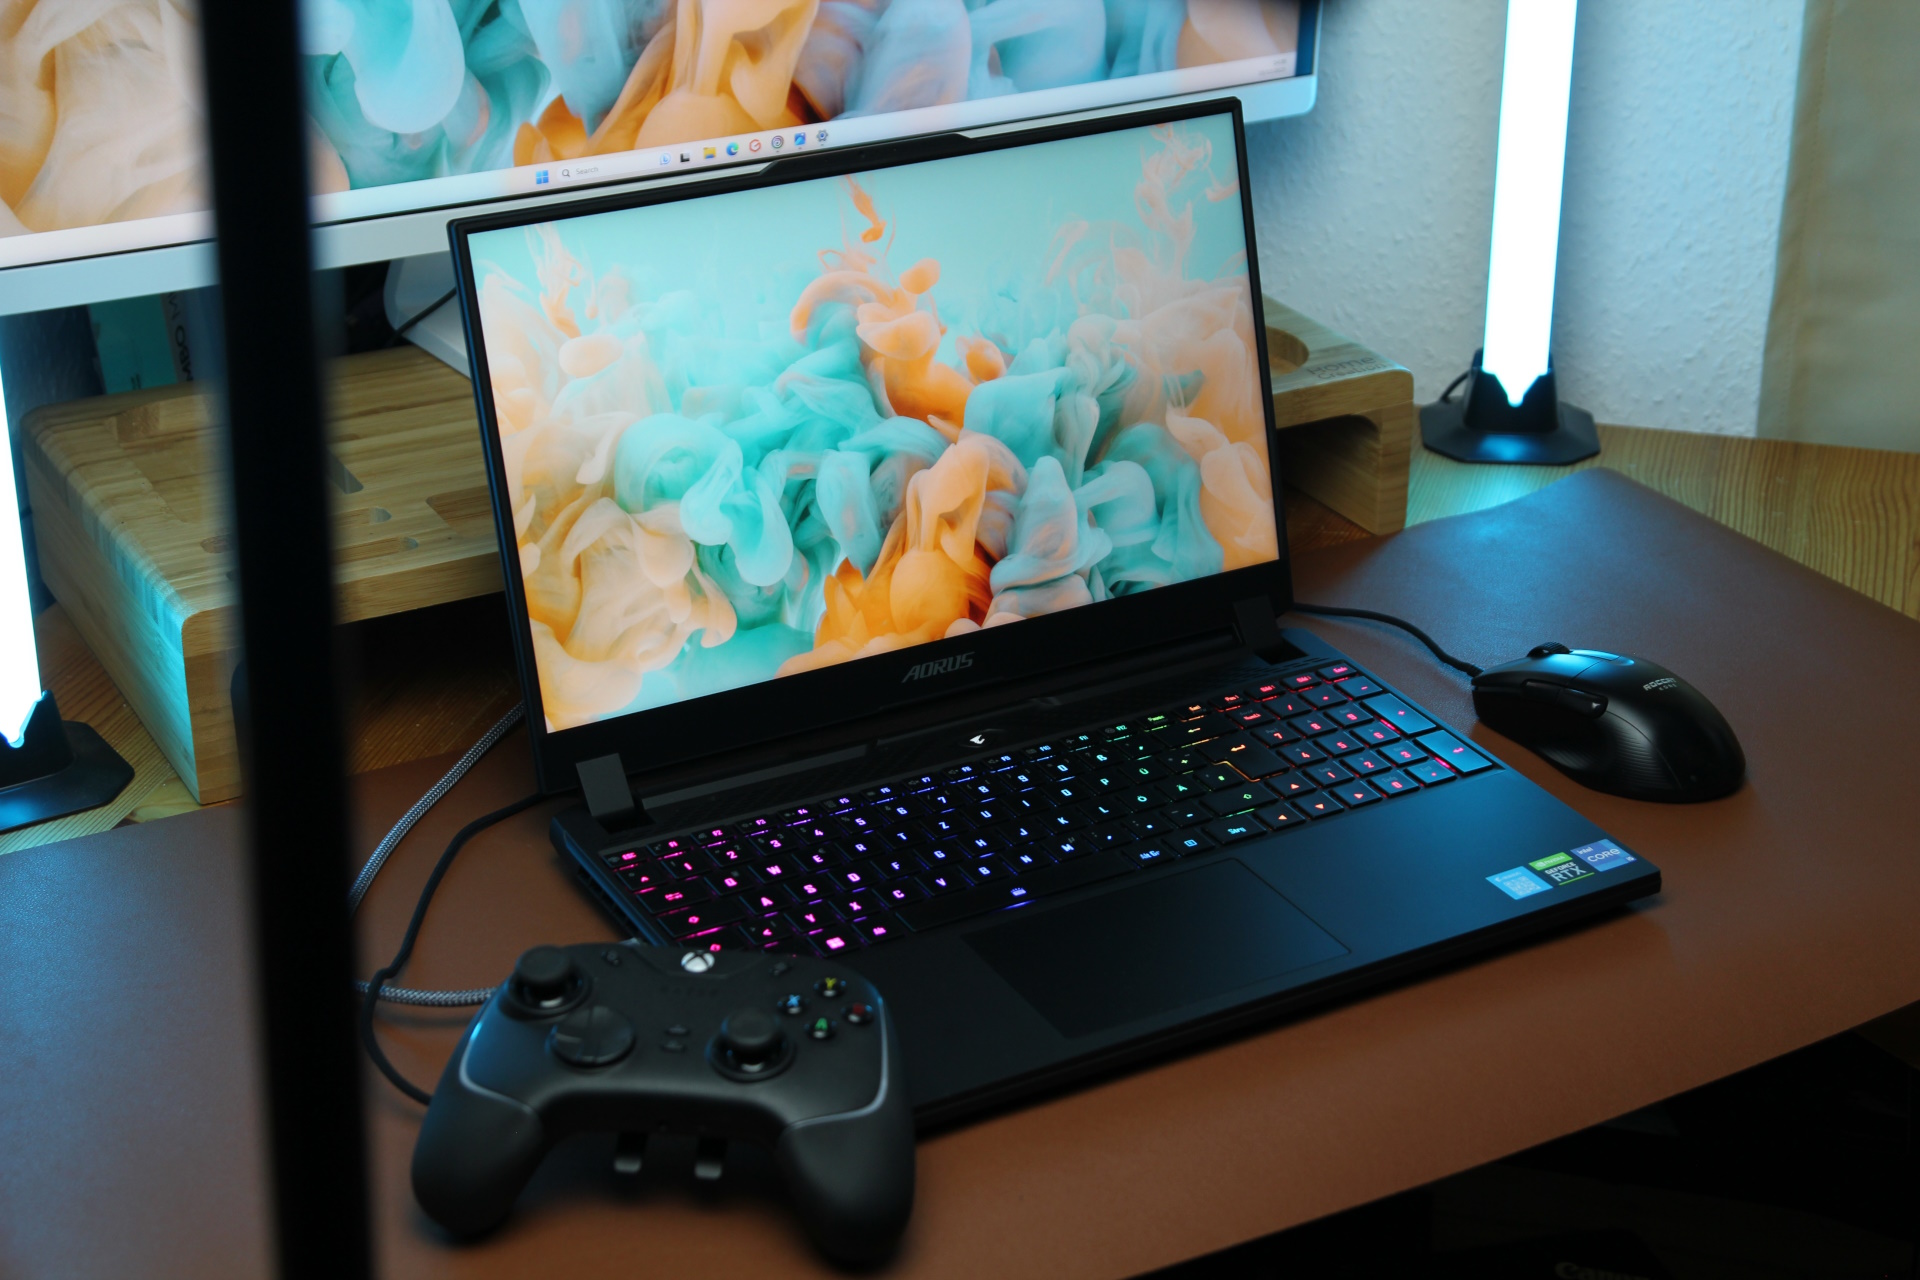
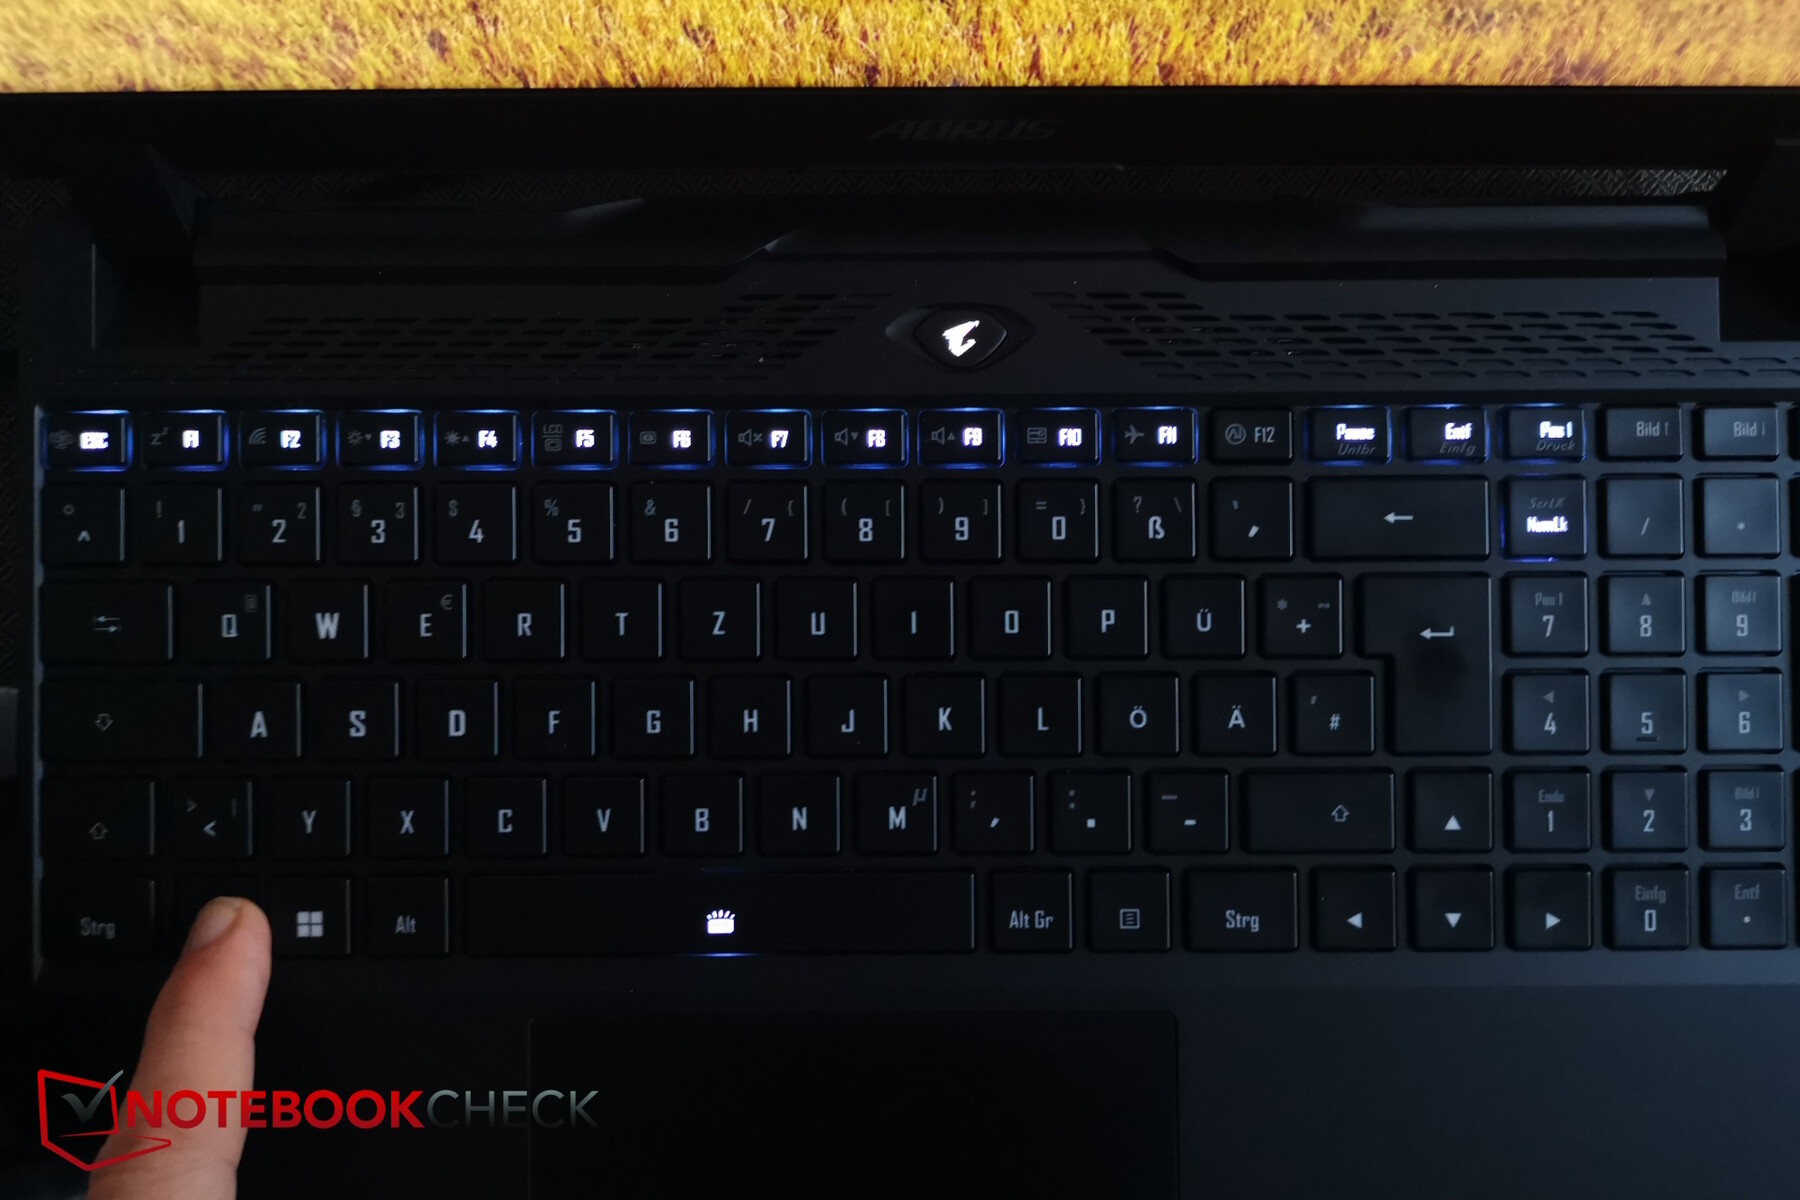
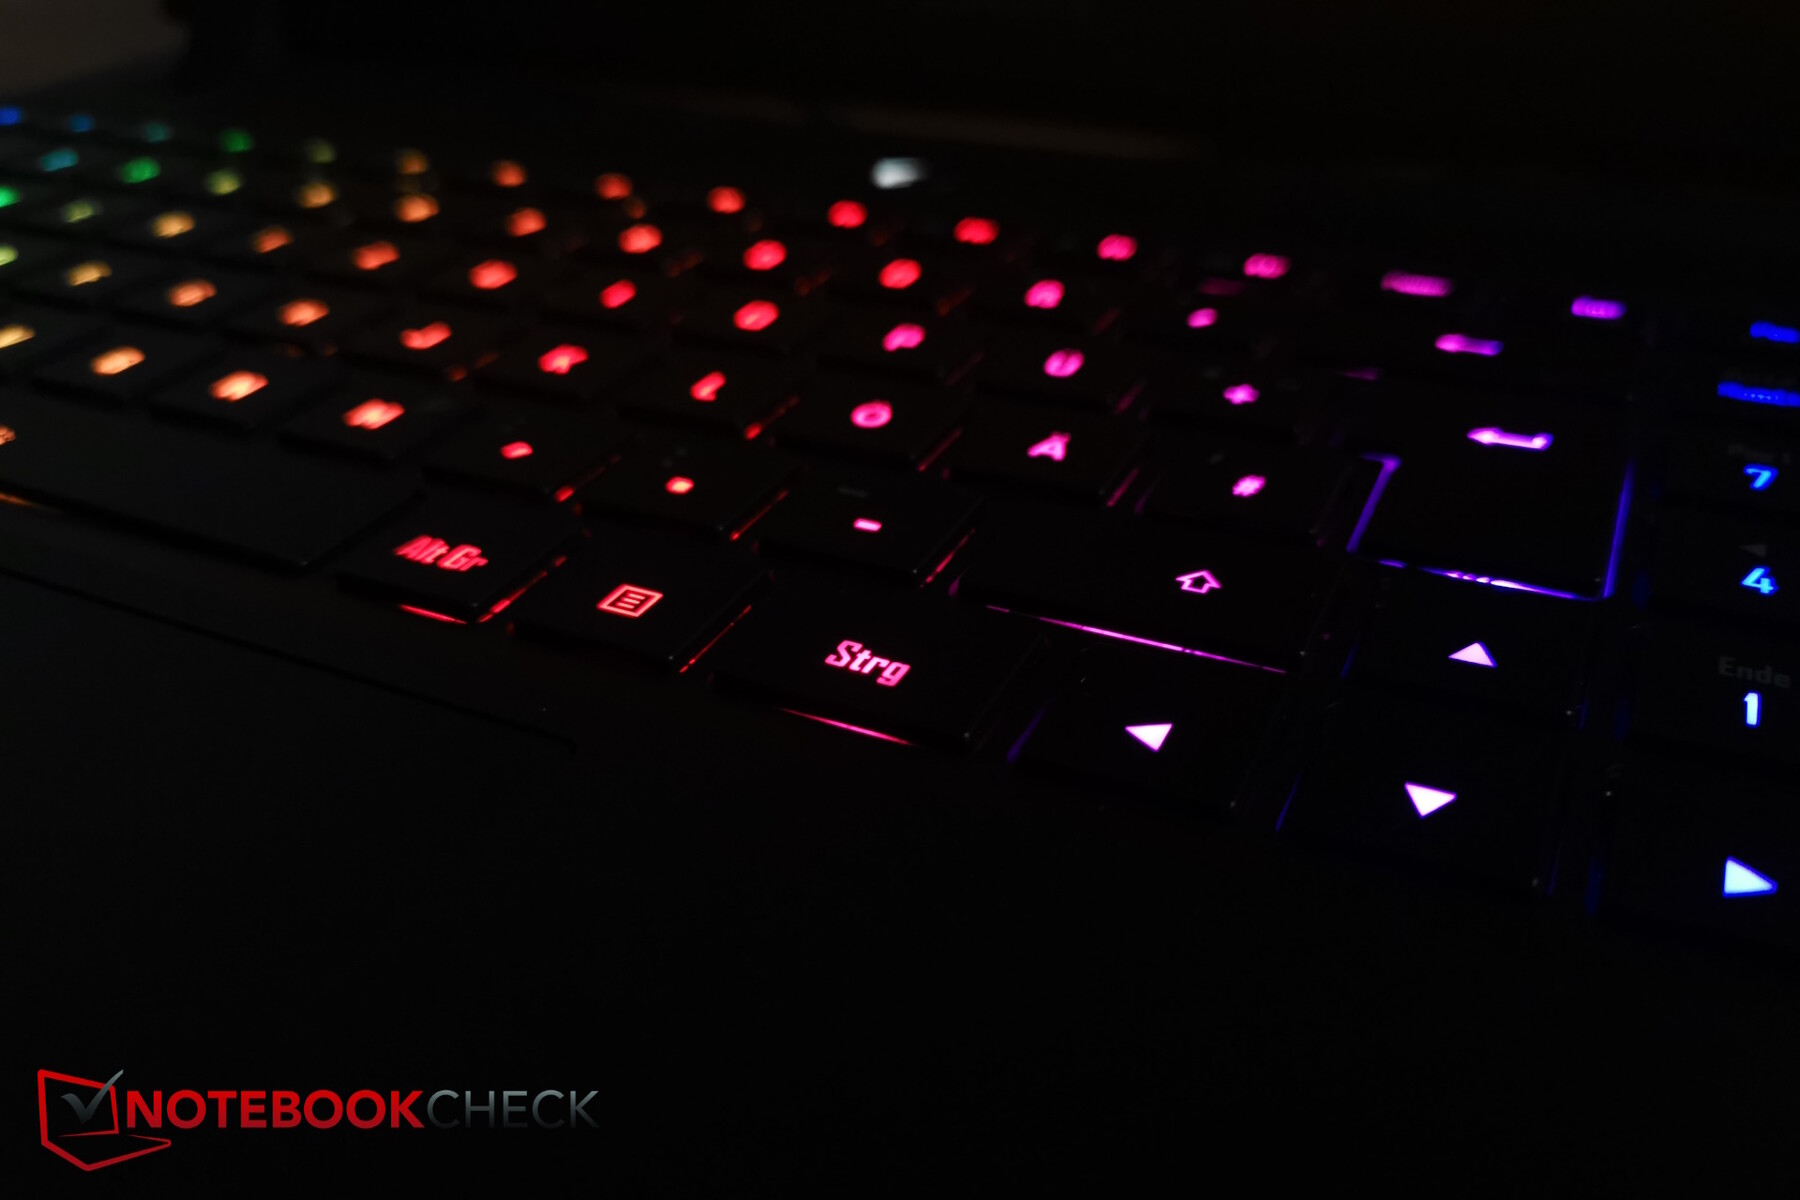
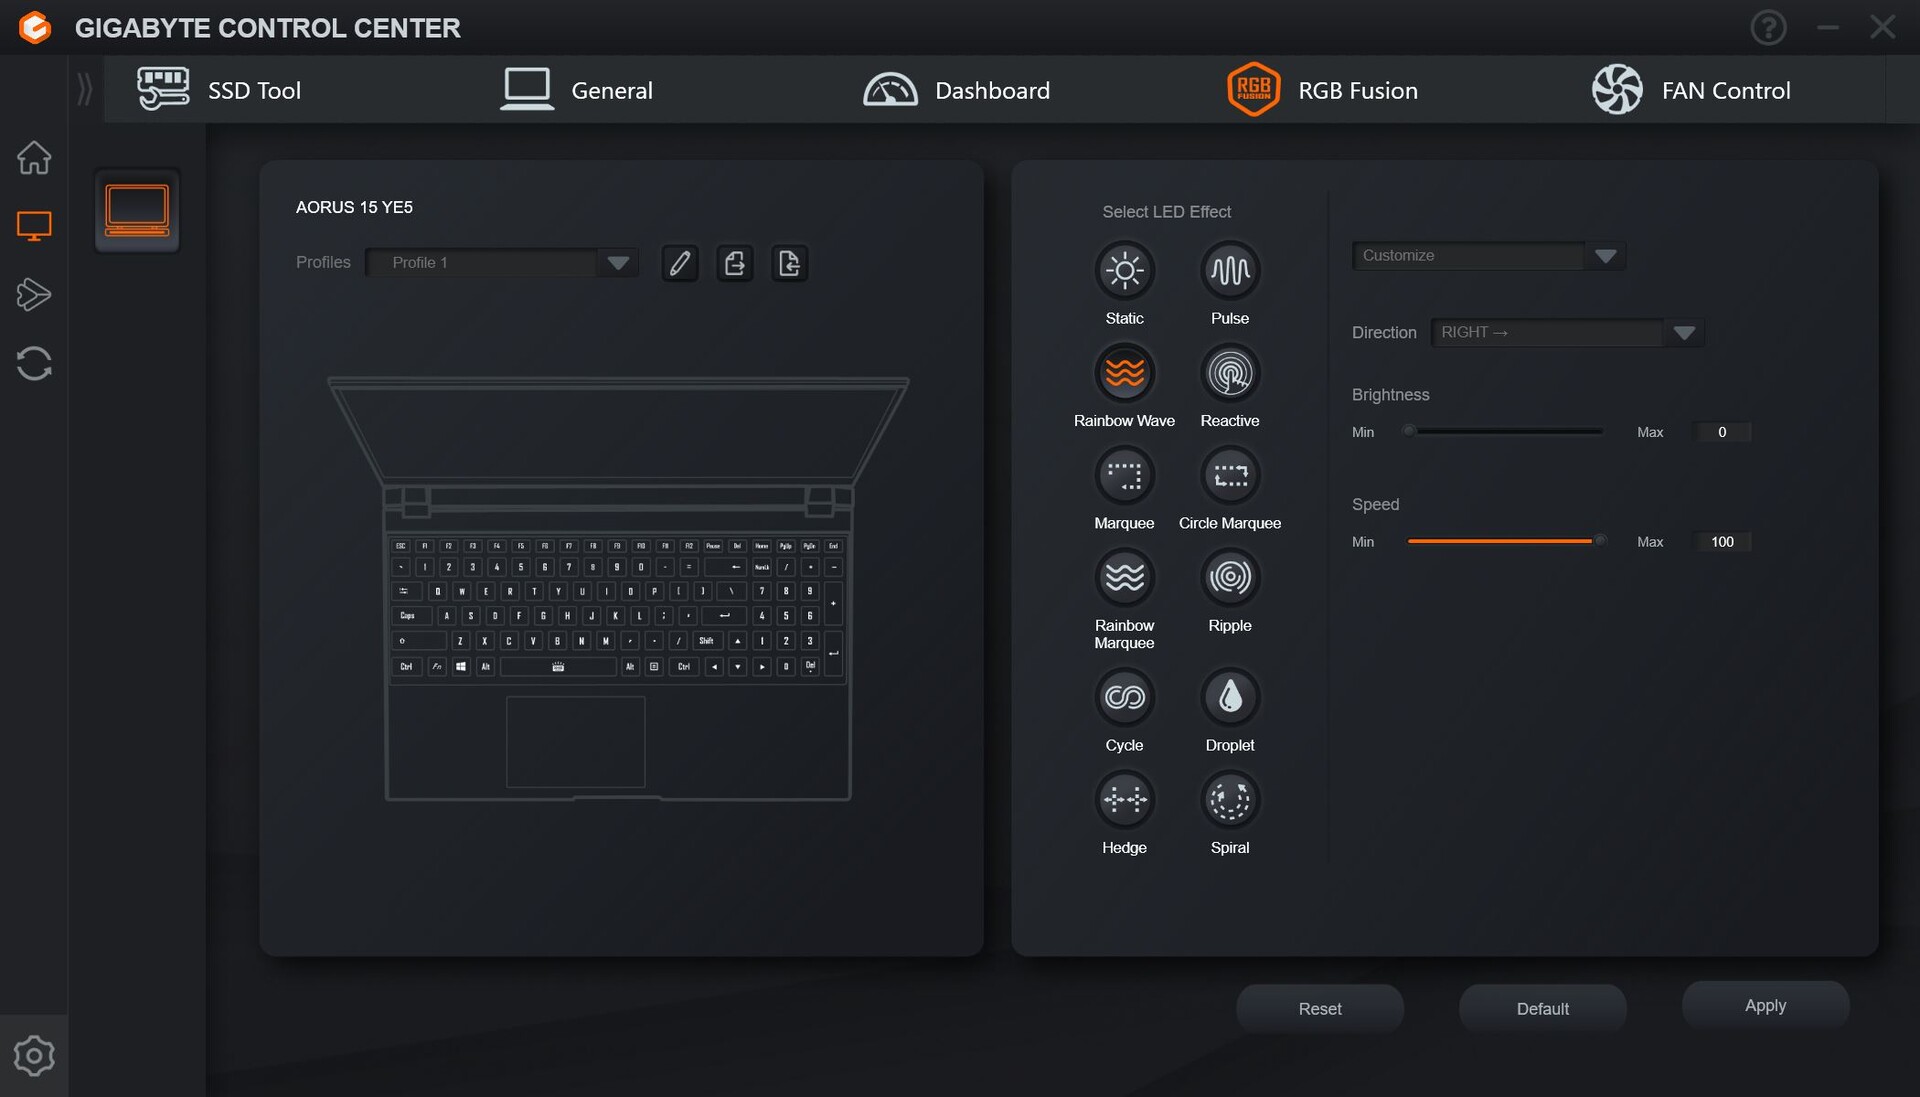
Tuşların arka aydınlatması çeşitli RGB efektlerine sahip, ancak her tuş için ayrı ayrı ayarlanamıyor - ancak bunlar belirli efektler için farklı renklerde yanabiliyor (Yağmur Damlası). Pratik: fn tuşuna basarsanız, özel işlevler oluşturmak için fn ile birleştirilebilen tüm tuşlar aydınlatılır. Ancak, yalnızca normal tuş etiketleri aydınlatılır (örneğin "F7"), ancak özel işlevleri ("sessiz") aydınlatılmaz, bu da bir F tuşunun özel işlevinin karanlık ortamlarda tanınamamasına neden olur.
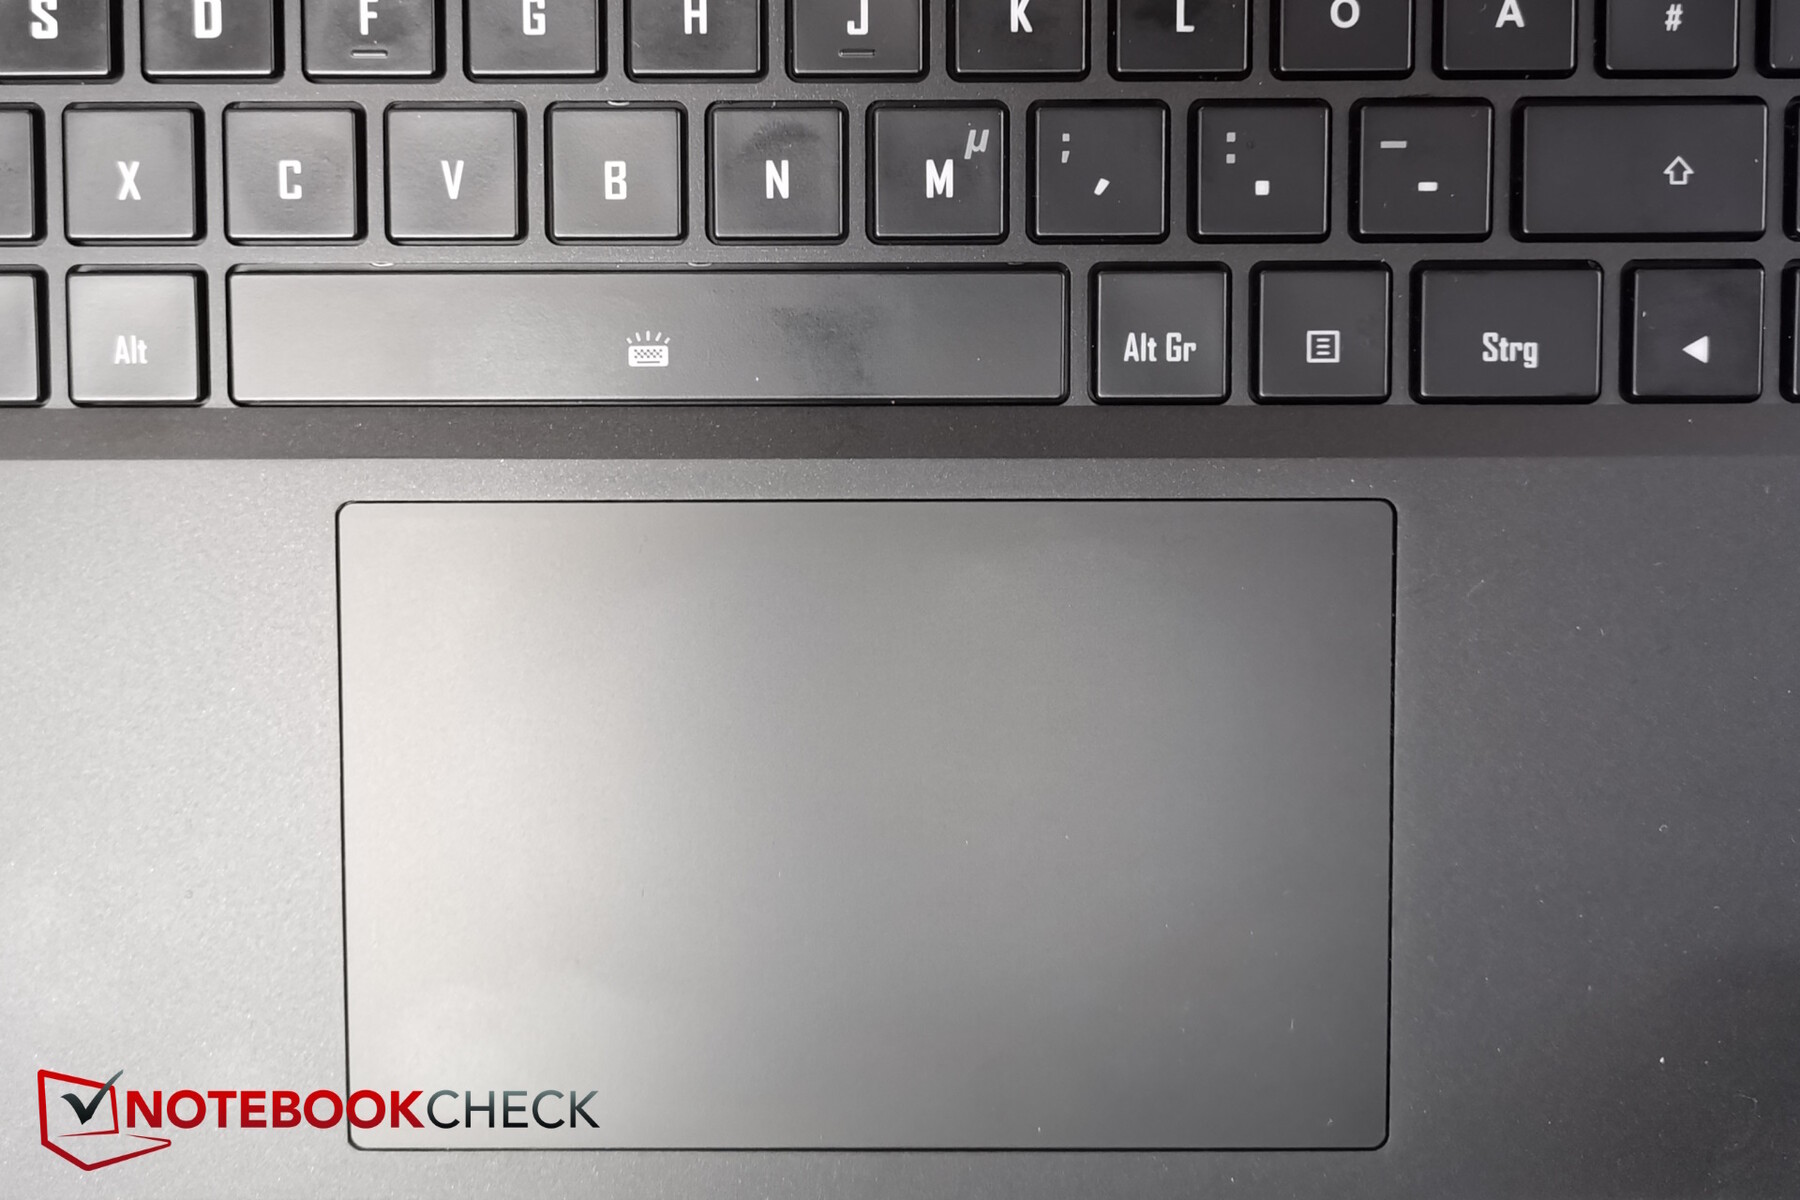
Yeterince büyük dokunmatik yüzey (21,1 x 7,6 cm), elleriniz tamamen kuru olmasa bile güzel ve pürüzsüz. Entegre tıklama düğmeleri oldukça fazla güç gerektiriyor, bu da basınç noktasının net olduğu anlamına geliyor. Tıklama sesleri orta düzeyde.
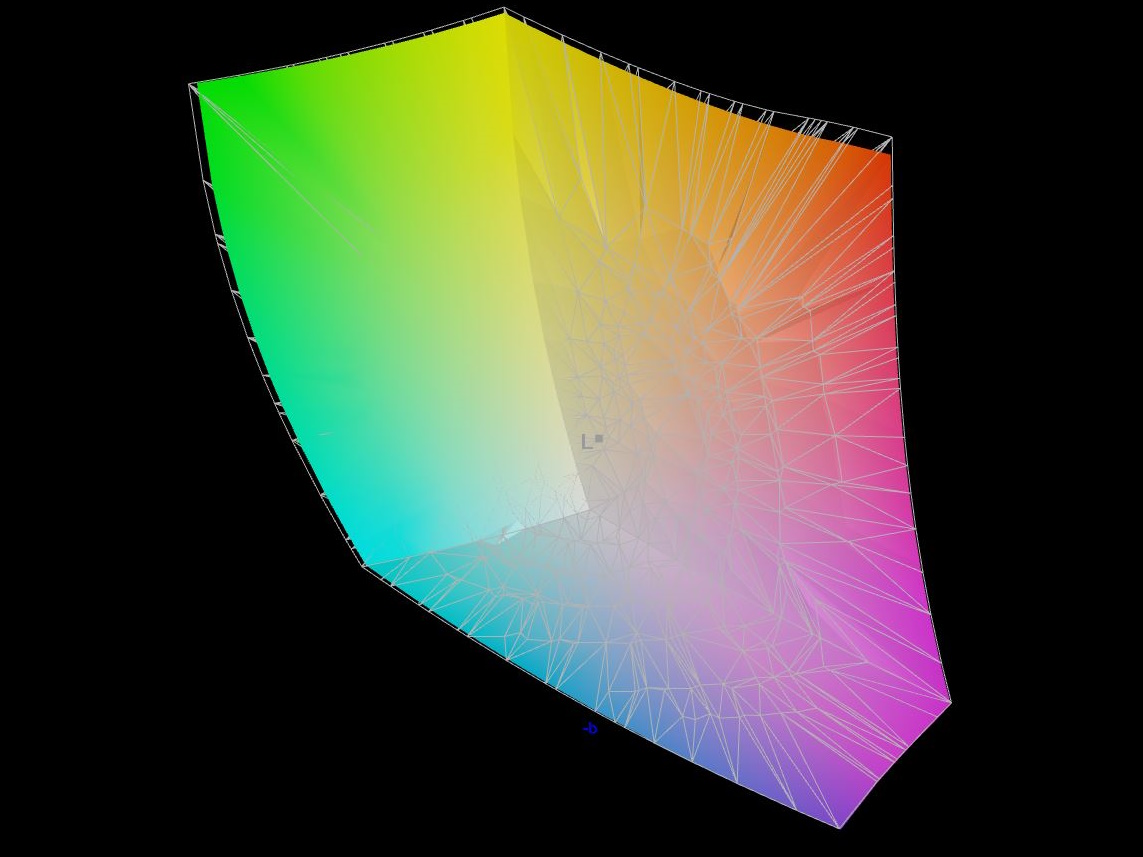
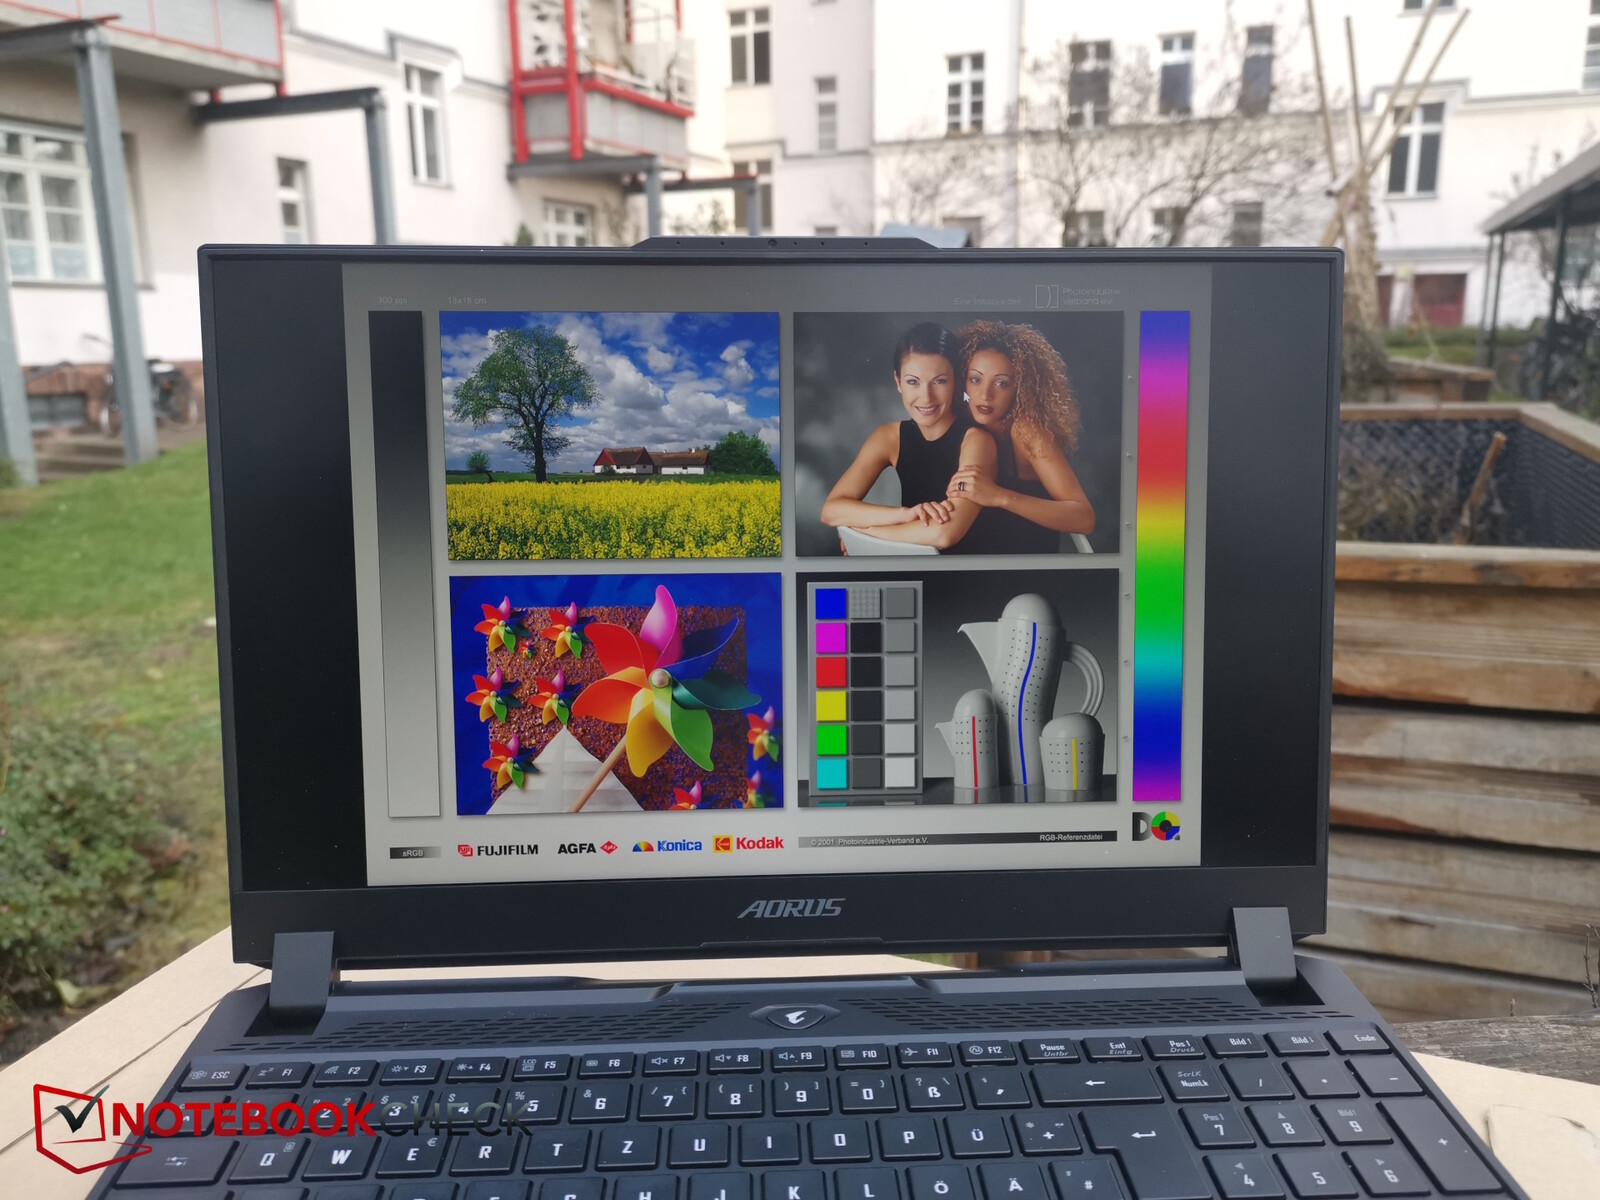
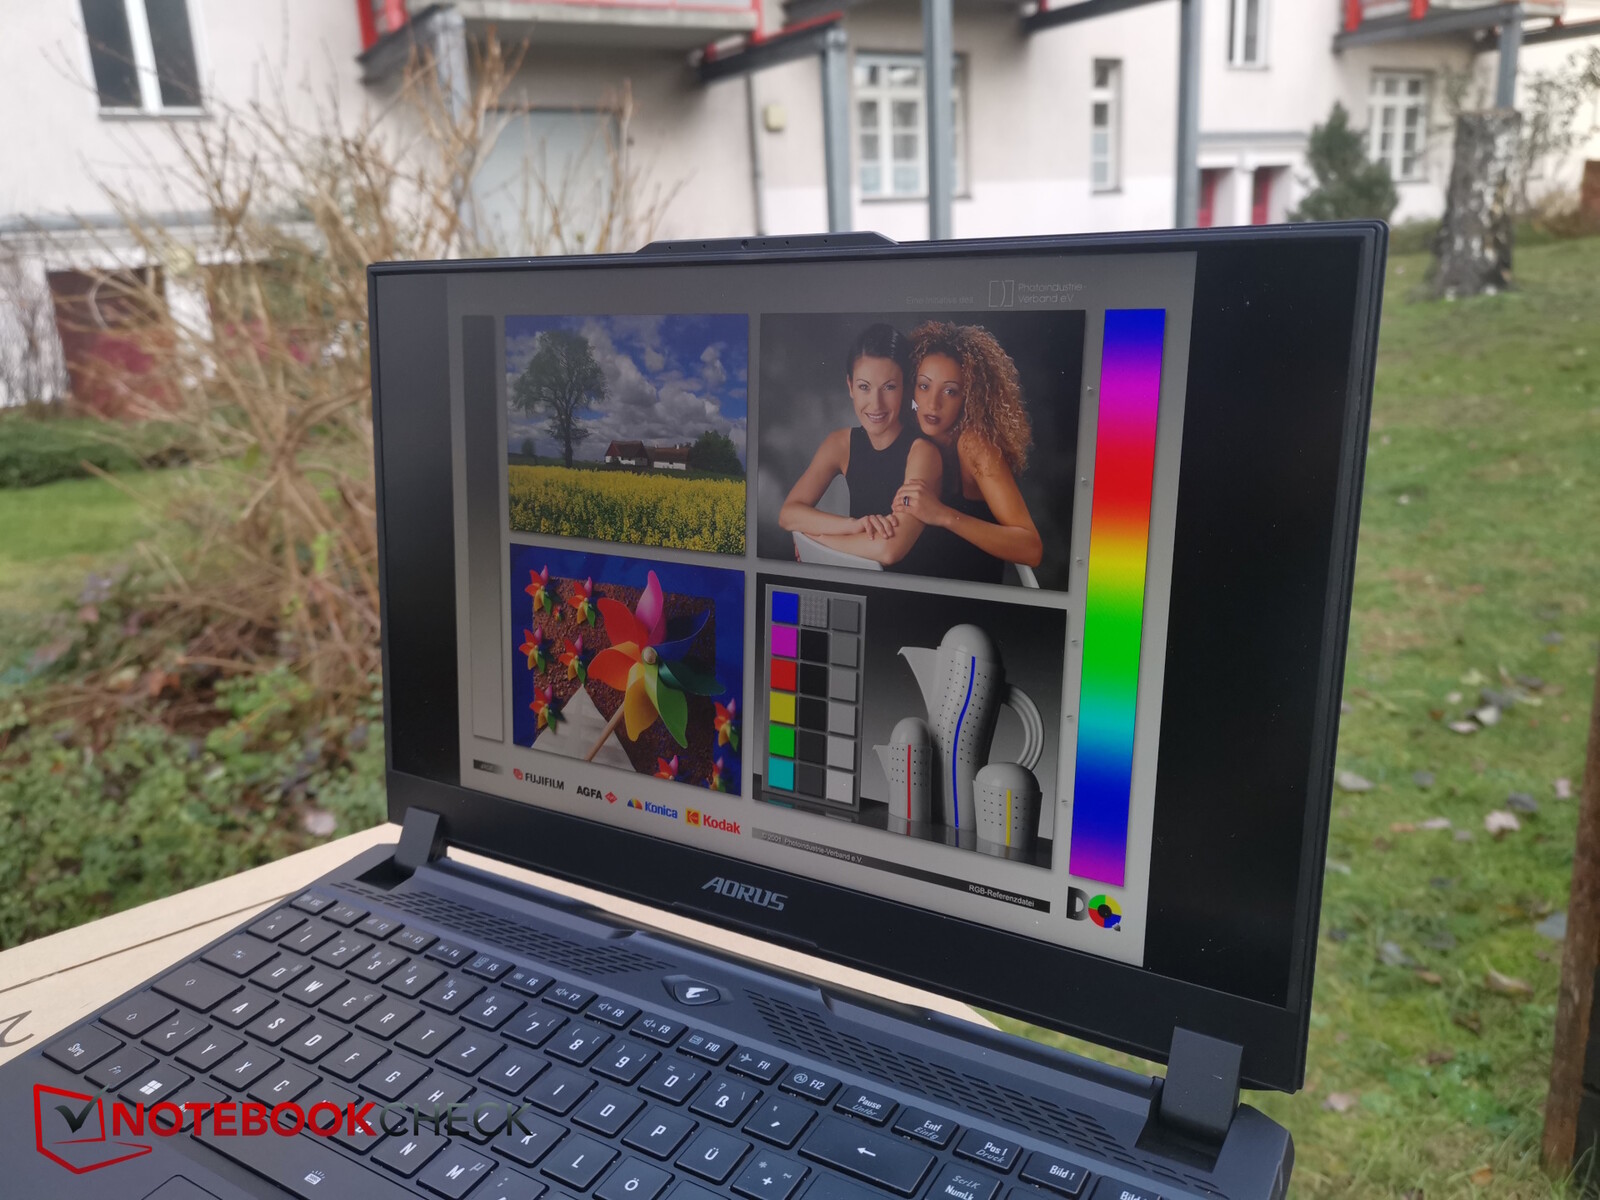
Ekran - iyi renk doğruluğuna sahip 1.440p
Aorus dizüstü bilgisayarın mat WQHD ekranı Chi Mei tarafından üretildi ve daha önce Asus ROG Zephyrus G15 2021'de. Bu bir başarıydı, bu yüzden 2023'te de modası geçmiş görünmüyor. 2.560 x 1.440 piksel çözünürlüğü, 165 Hz yenileme hızı, nispeten hızlı tepki süreleri ve renk alanı kapsamı (%100 sRGB, %97 Display P3) kadar etkileyici. Öte yandan ekranın parlaklığı ve kontrastı ortalama düzeyde. Alternatif olarak, 360 Hz yenileme hızına sahip bir Full HD modeli de var.
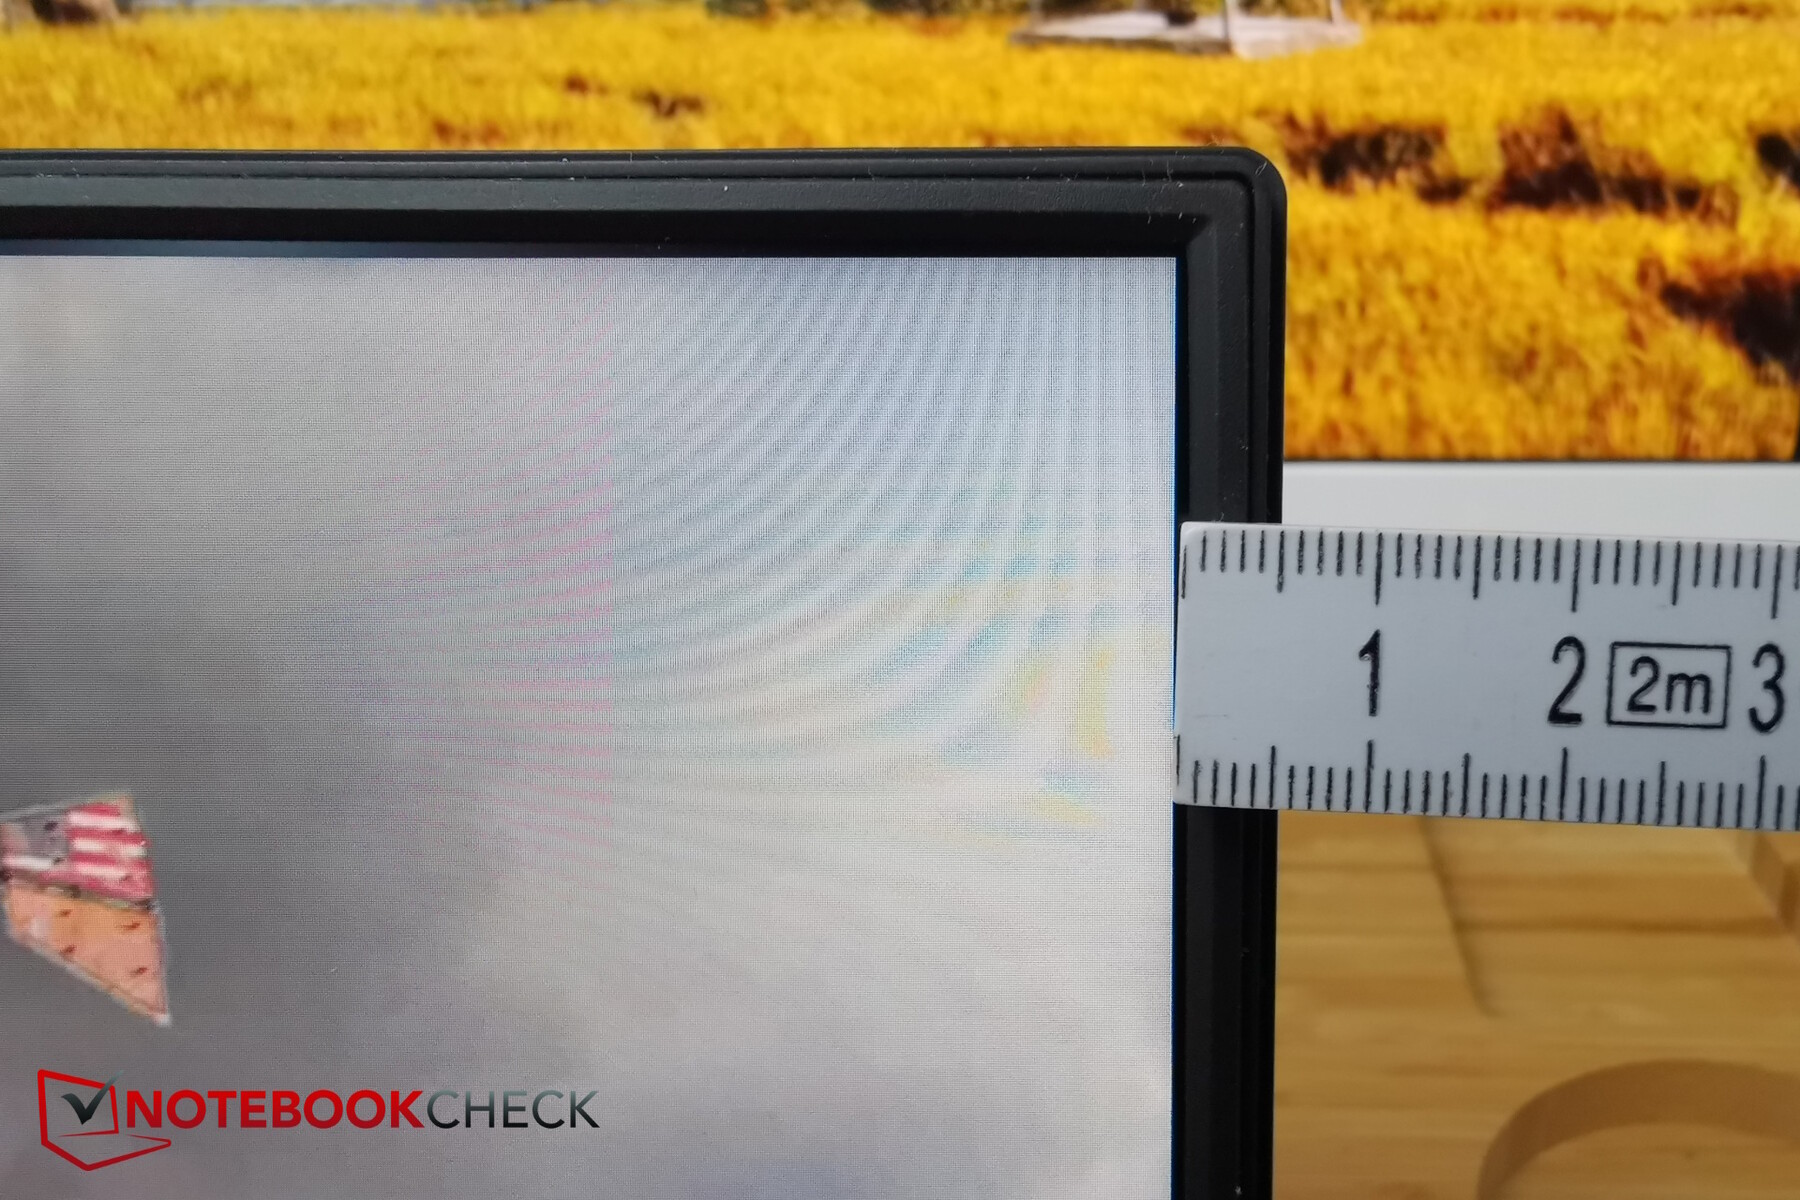
Sol alt köşede ve sağ üst kenar boyunca çok görünür arka ışık kanaması daha az iyi. Ancak parlaklık kontrolü için PWM kullanılmıyor. Tepki süreleri en iyi ihtimalle vasattır.
| |||||||||||||||||||||||||
Aydınlatma: 81 %
Batarya modunda parlaklık: 350 cd/m²
Kontrast: 939:1 (Siyah: 0.38 cd/m²)
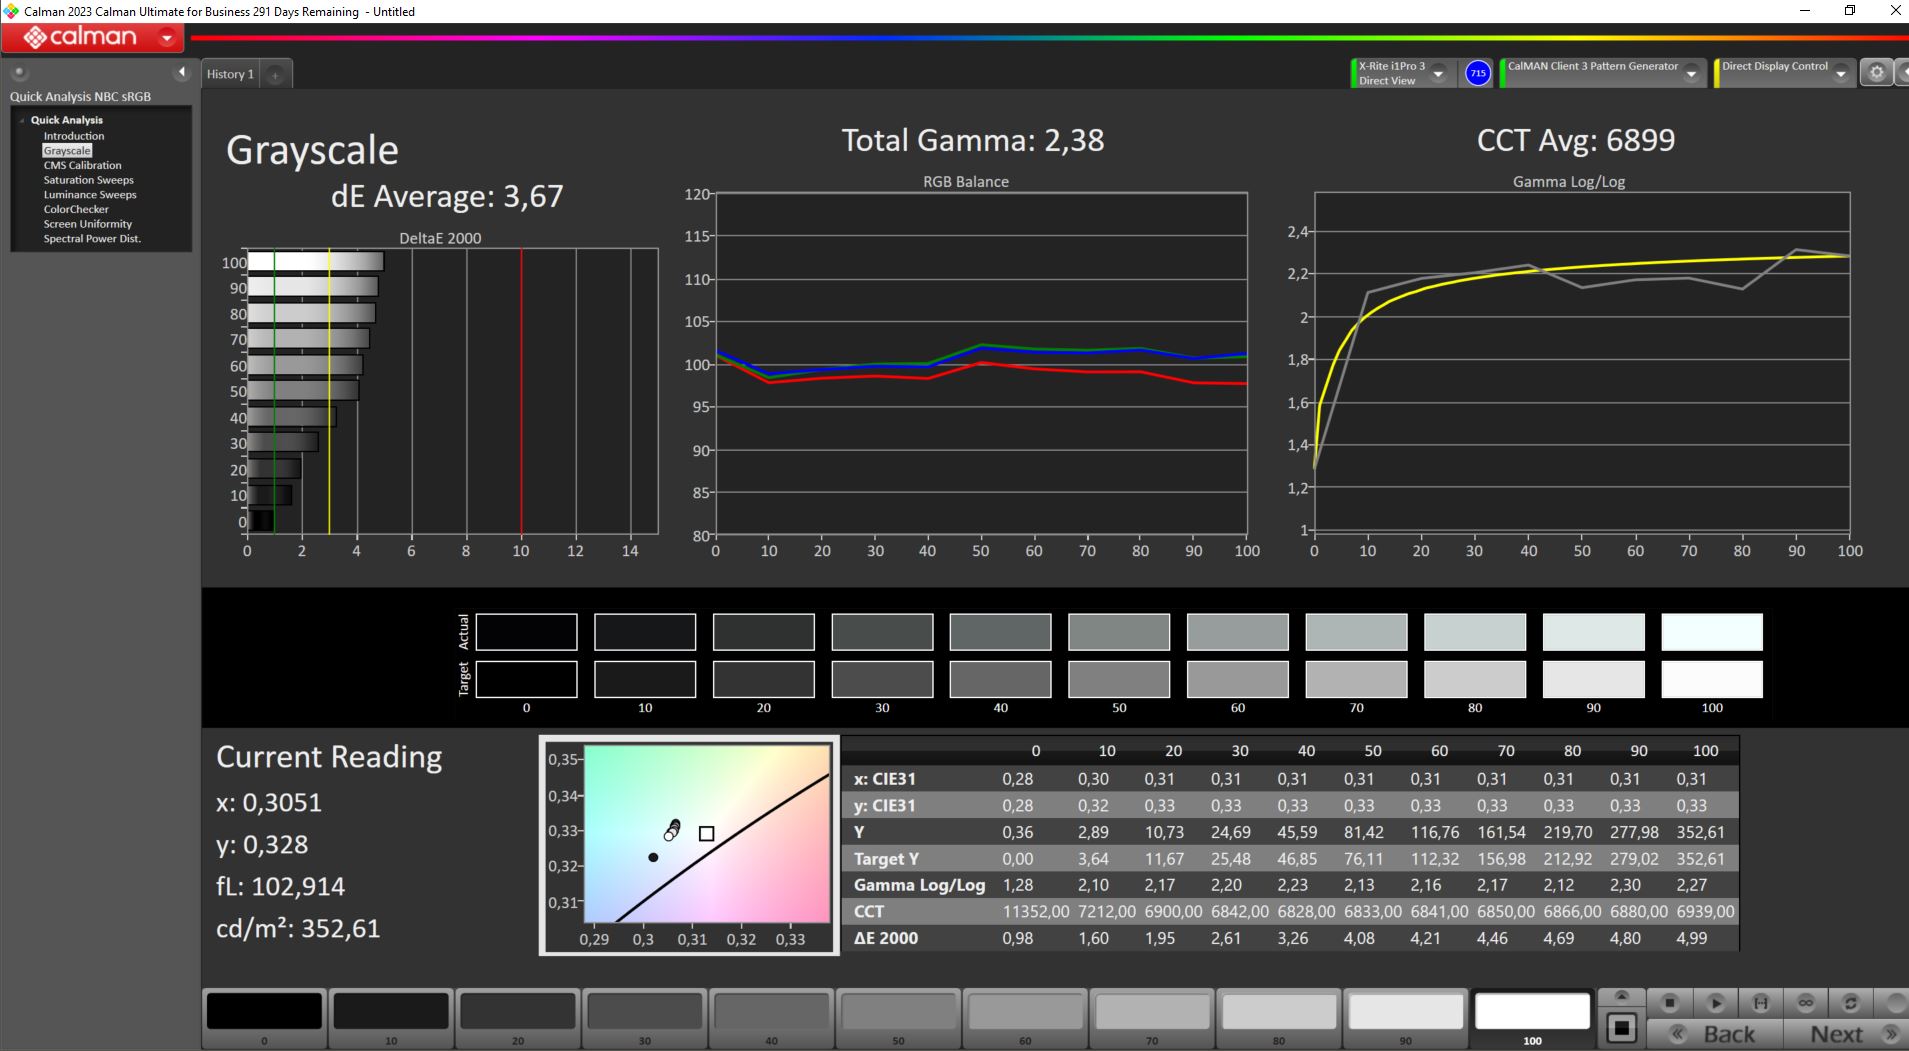
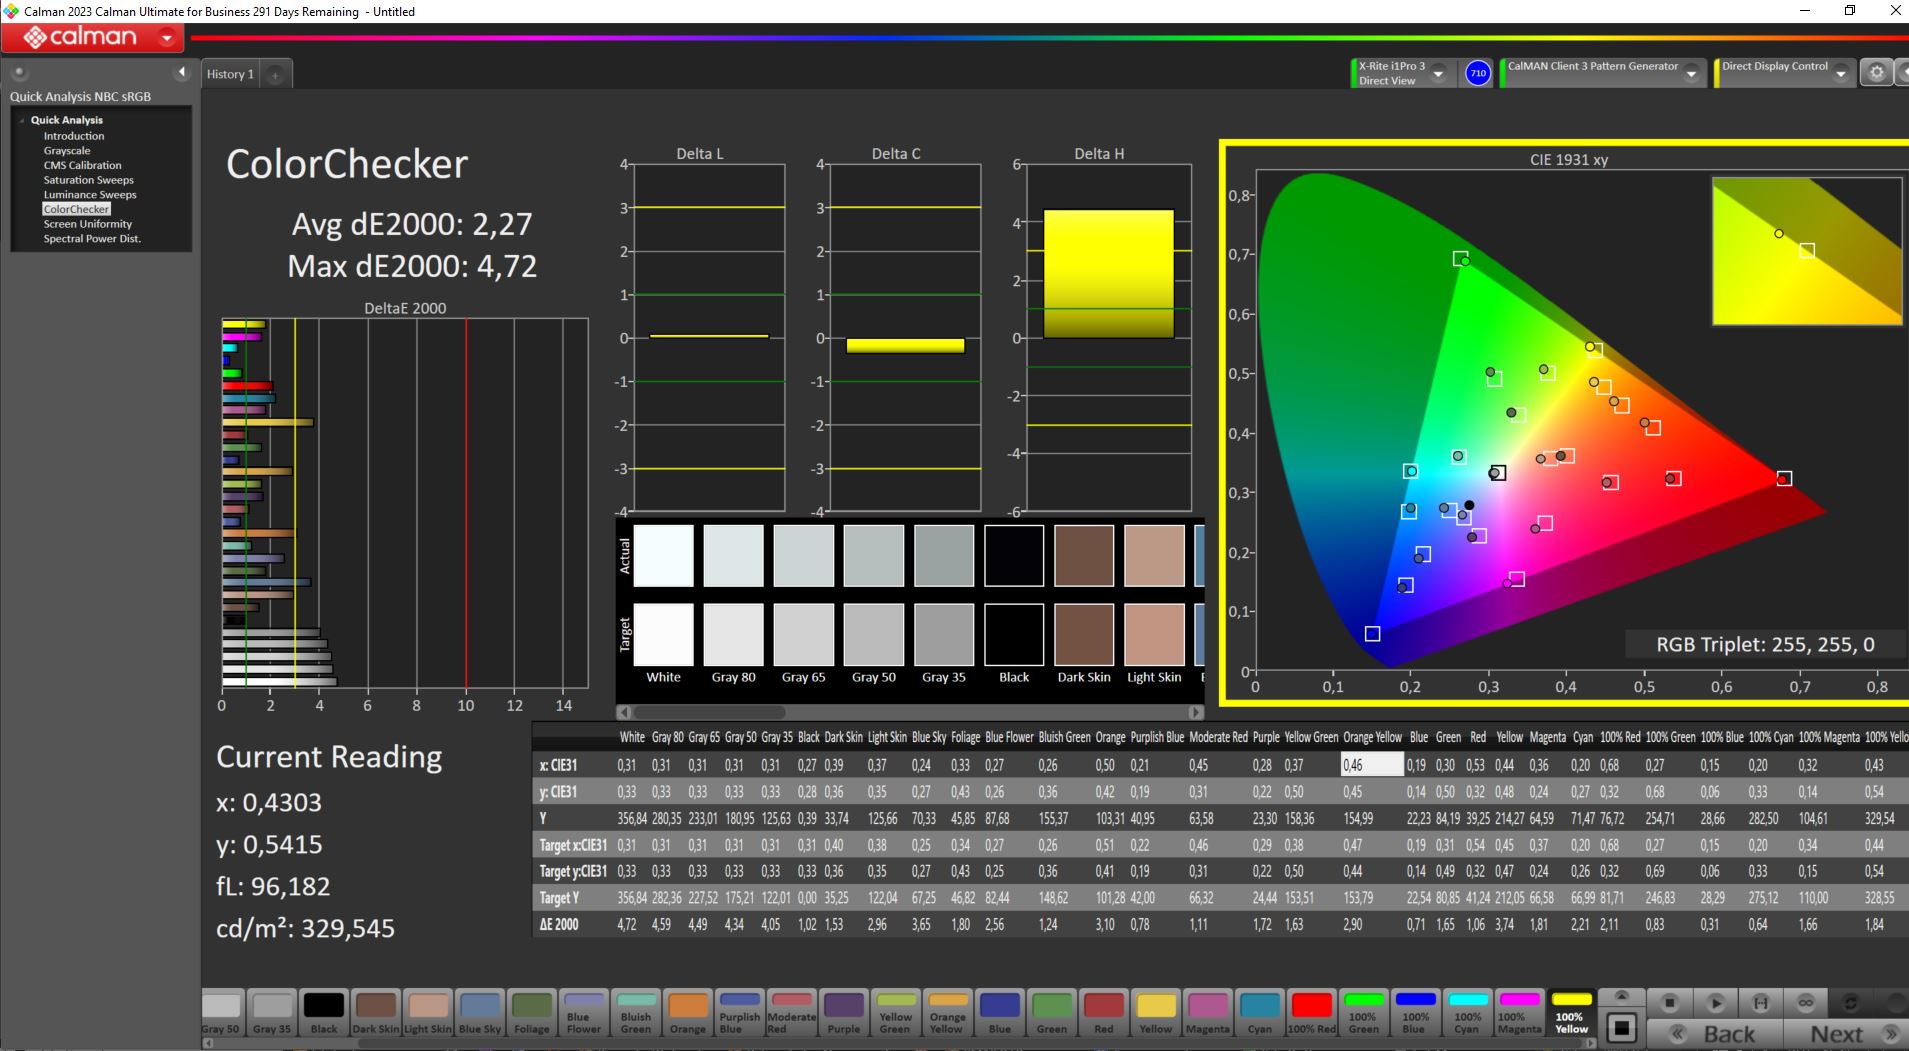
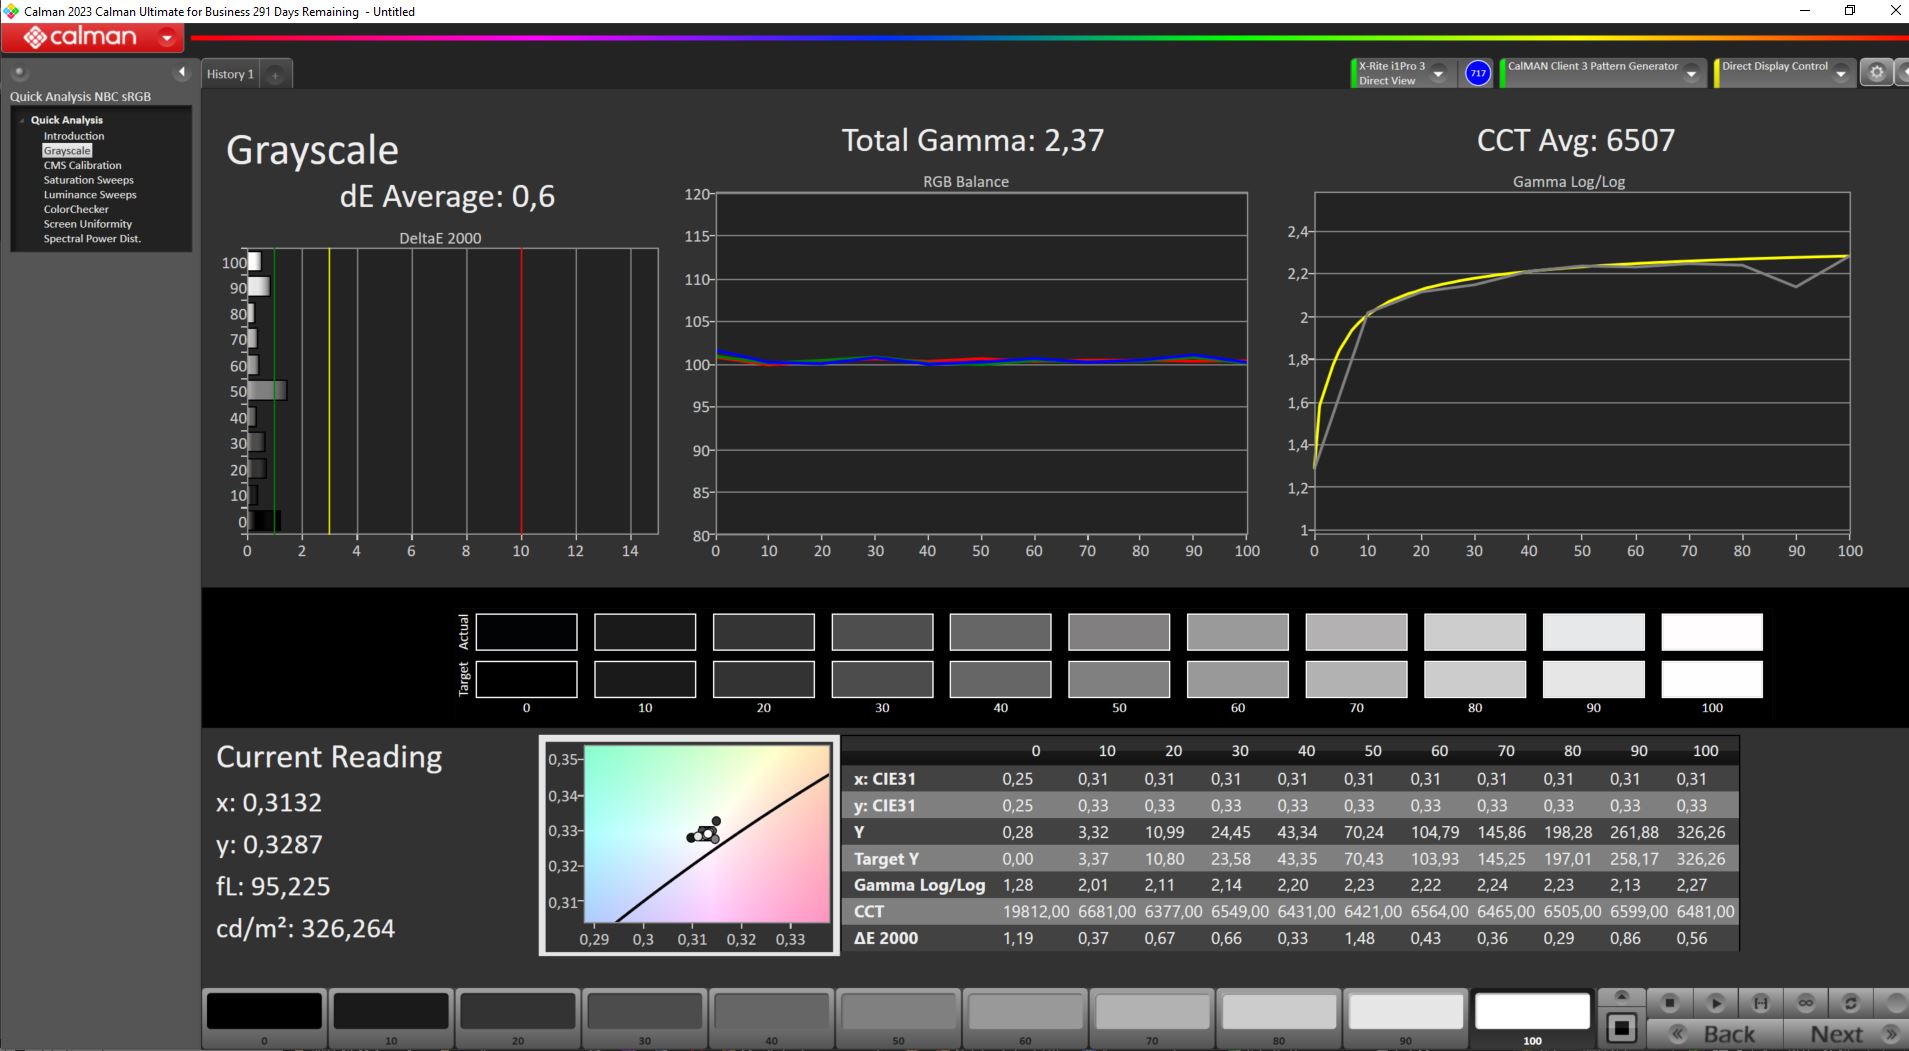
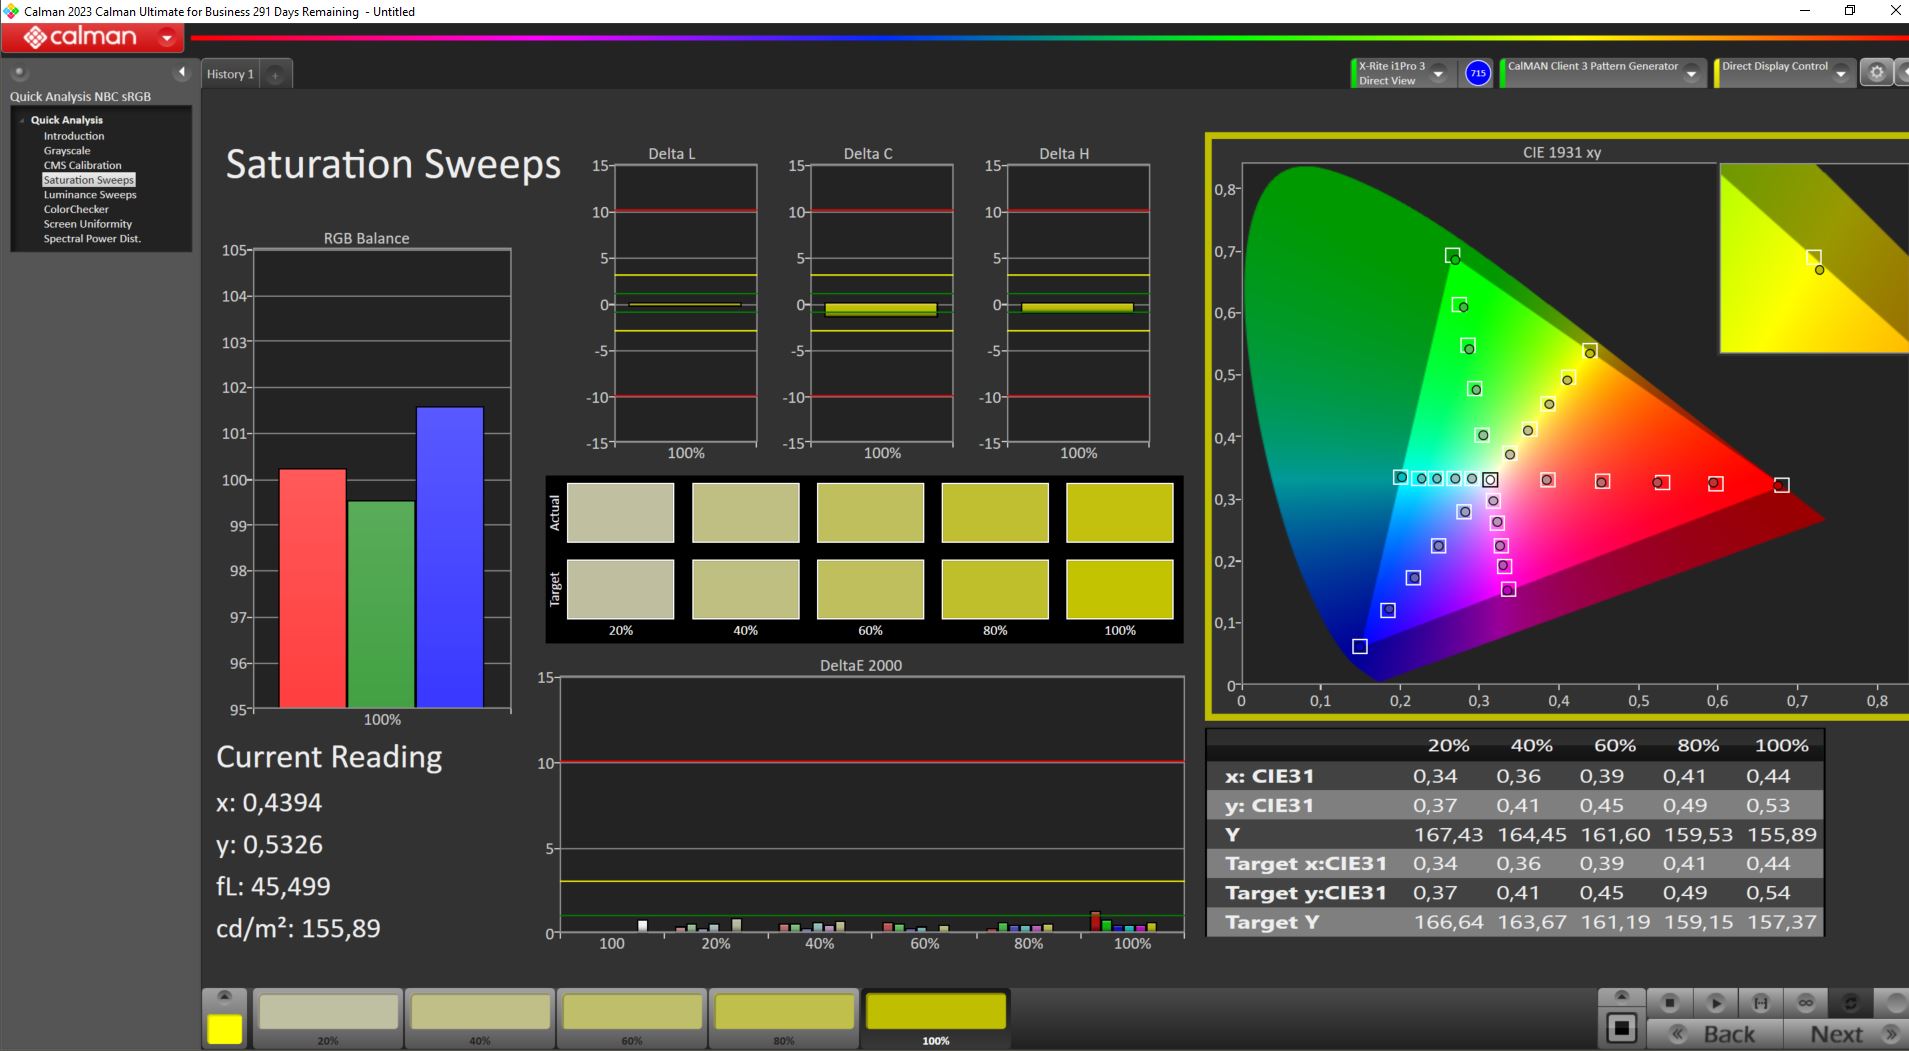
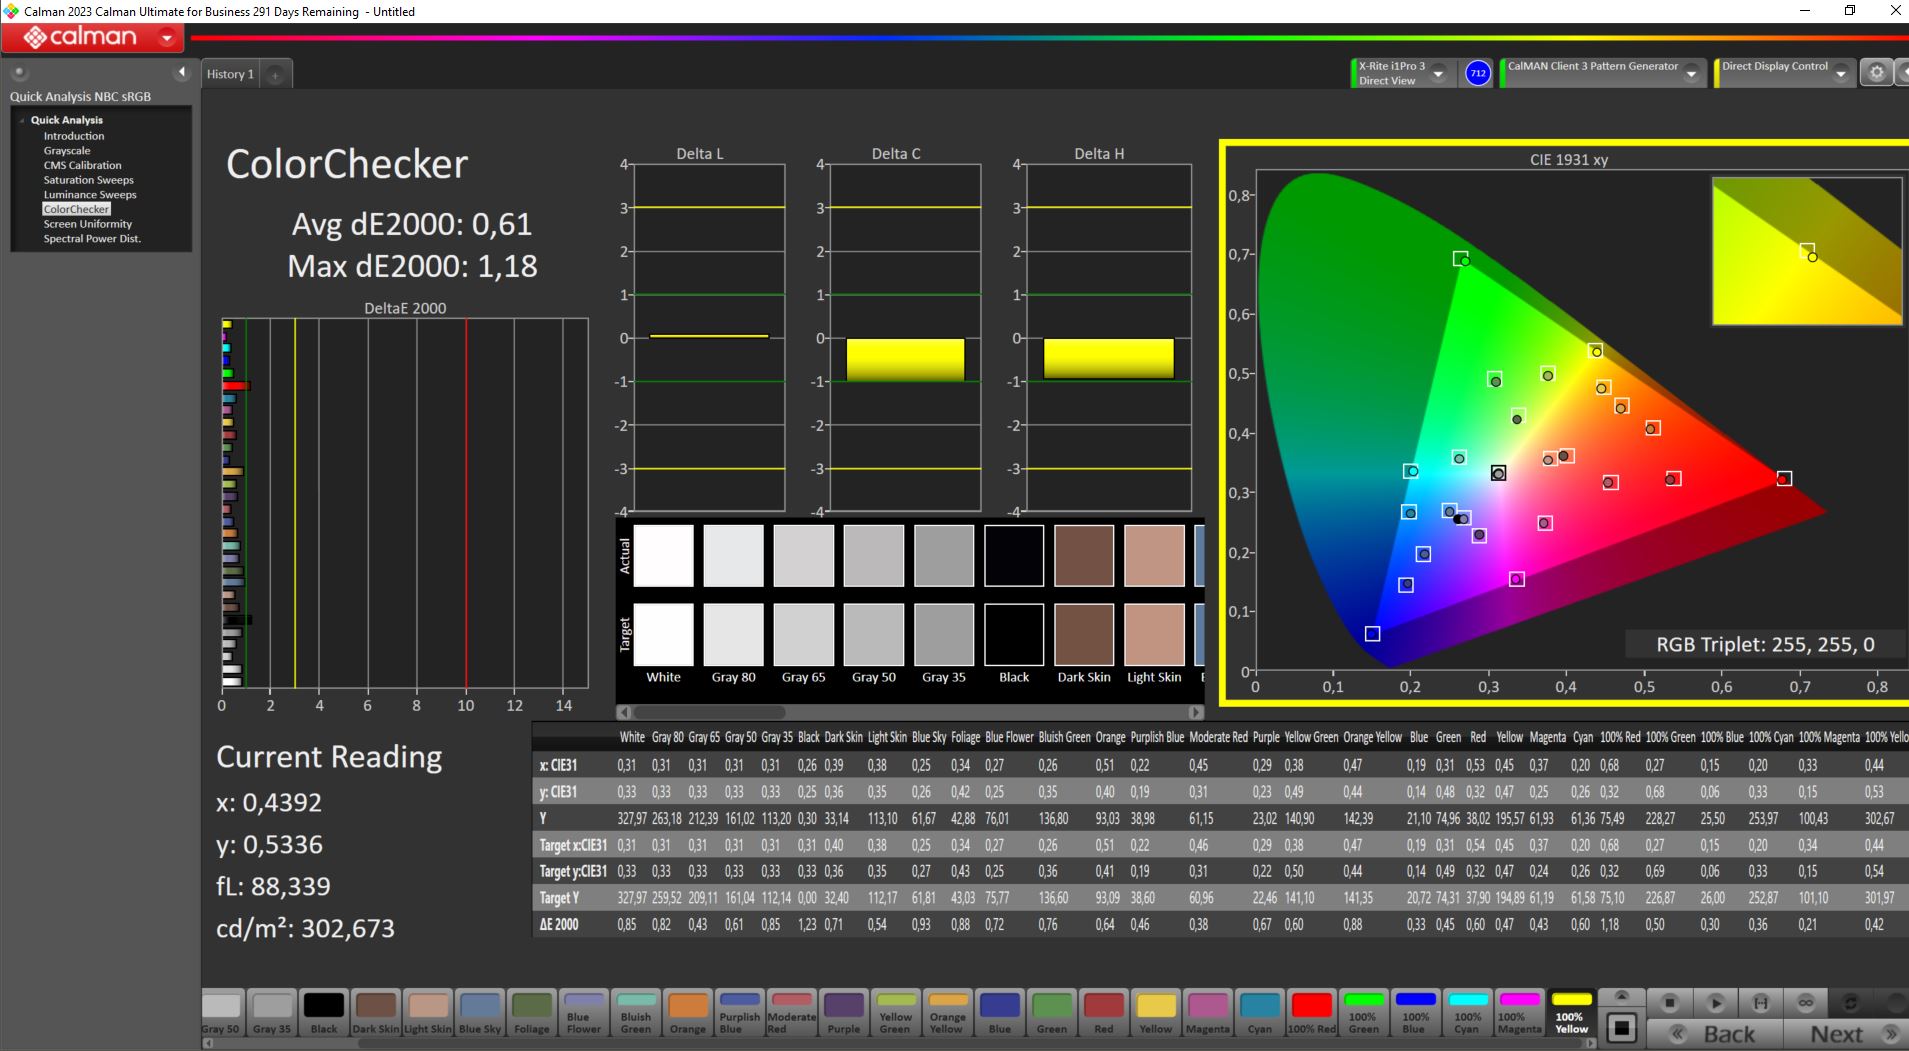
ΔE ColorChecker Calman: 2.27 | ∀{0.5-29.43 Ø4.71}
calibrated: 0.61
ΔE Greyscale Calman: 3.67 | ∀{0.09-98 Ø4.96}
85.9% AdobeRGB 1998 (Argyll 3D)
100% sRGB (Argyll 3D)
97.7% Display P3 (Argyll 3D)
Gamma: 2.38
CCT: 7899 K
| Aorus 15 YE5-54DEB34SH Chi Mei CMN1540 (CMN N156KME-GNA), IPS, 2560x1440, 15.6" | Aorus 15 BSF Sharp LQ156T1JW05, IPS, 2560x1440, 15.6" | Captiva Advanced Gaming I74-121 BOE08B3, IPS, 1920x1080, 15.6" | HP Victus 16-r0077ng CMN162D, IPS, 1920x1080, 16.1" | Dell XPS 15 9530 RTX 4070 Samsung 156XG01, OLED, 3456x2160, 15.6" | HP Omen 16-wf000 BOE0B7D, IPS, 2560x1440, 16.1" | |
|---|---|---|---|---|---|---|
| Display | 0% | -21% | -18% | 6% | -16% | |
| Display P3 Coverage (%) | 97.7 | 98.2 1% | 64 -34% | 66.7 -32% | 99.8 2% | 69 -29% |
| sRGB Coverage (%) | 100 | 99.9 0% | 93.2 -7% | 98 -2% | 100 0% | 99.2 -1% |
| AdobeRGB 1998 Coverage (%) | 85.9 | 85.7 0% | 66 -23% | 69 -20% | 98.4 15% | 71.2 -17% |
| Response Times | 40% | 55% | 30% | 87% | 47% | |
| Response Time Grey 50% / Grey 80% * (ms) | 18.9 ? | 11.3 ? 40% | 5 ? 74% | 13.3 ? 30% | 1.68 ? 91% | 4.6 ? 76% |
| Response Time Black / White * (ms) | 11.7 ? | 7 ? 40% | 7.55 ? 35% | 8.2 ? 30% | 1.94 ? 83% | 9.7 ? 17% |
| PWM Frequency (Hz) | 239 | |||||
| Screen | -34% | -28% | 15% | -36% | 7% | |
| Brightness middle (cd/m²) | 357 | 299 -16% | 346 -3% | 308 -14% | 389.5 9% | 310.9 -13% |
| Brightness (cd/m²) | 322 | 282 -12% | 324 1% | 285 -11% | 392 22% | 296 -8% |
| Brightness Distribution (%) | 81 | 82 1% | 90 11% | 85 5% | 98 21% | 91 12% |
| Black Level * (cd/m²) | 0.38 | 0.31 18% | 0.35 8% | 0.25 34% | 0.35 8% | |
| Contrast (:1) | 939 | 965 3% | 989 5% | 1232 31% | 888 -5% | |
| Colorchecker dE 2000 * | 2.27 | 2.24 1% | 4.12 -81% | 1.3 43% | 4.95 -118% | 2.18 4% |
| Colorchecker dE 2000 max. * | 4.72 | 4.29 9% | 7.78 -65% | 2.76 42% | 8.65 -83% | 3.58 24% |
| Colorchecker dE 2000 calibrated * | 0.61 | 2.62 -330% | 1.22 -100% | 0.92 -51% | 1.53 -151% | 0.52 15% |
| Greyscale dE 2000 * | 3.67 | 3 18% | 4.81 -31% | 1.7 54% | 2 46% | 2.8 24% |
| Gamma | 2.38 92% | 2.086 105% | 2.31 95% | 2.167 102% | 2.27 97% | 2.18 101% |
| CCT | 7899 82% | 6289 103% | 7633 85% | 6767 96% | 6265 104% | 6002 108% |
| Toplam Ortalama (Program / Ayarlar) | 2% /
-16% | 2% /
-15% | 9% /
10% | 19% /
-5% | 13% /
8% |
* ... daha küçük daha iyidir
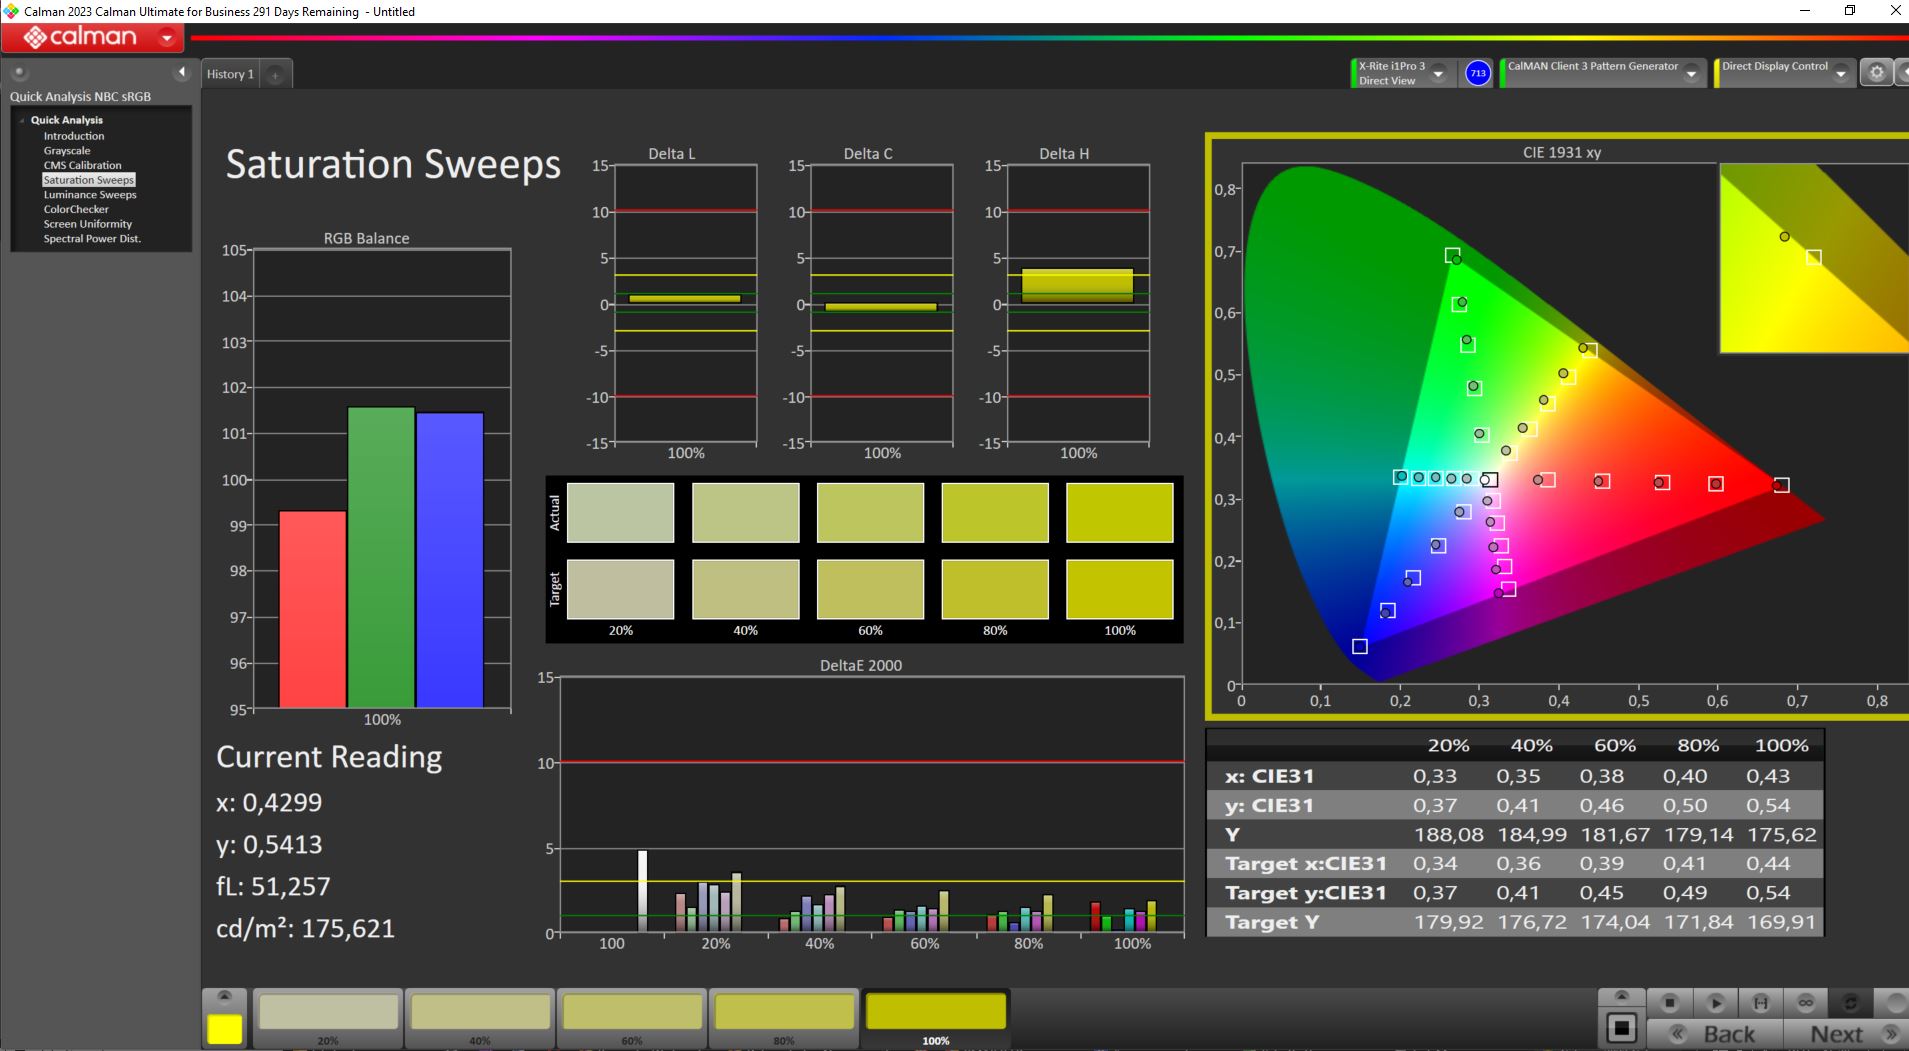
Ex works, ekran en iyi şekilde kalibre edilmiş olarak gelmiyor ancak X-Rite Fab ölçüm cihazı ve Calman yazılımını kullanarak yaptığımız kalibrasyon DeltaE değerini ((renk) sapmaları için önemli) hem gri tonlama hem de renkler için 1'in çok altına düşürüyor. İyi renk alanı kapsamı ile birlikte (aşağıdaki resimlerin son satırına bakın), ekran yarı profesyonel görüntü ve video düzenleme için de uygundur.

Yanıt Sürelerini Görüntüle
| ↔ Tepki Süresi Siyahtan Beyaza | ||
|---|---|---|
| 11.7 ms ... yükseliş ↗ ve sonbahar↘ birleşimi | ↗ 7.2 ms yükseliş | 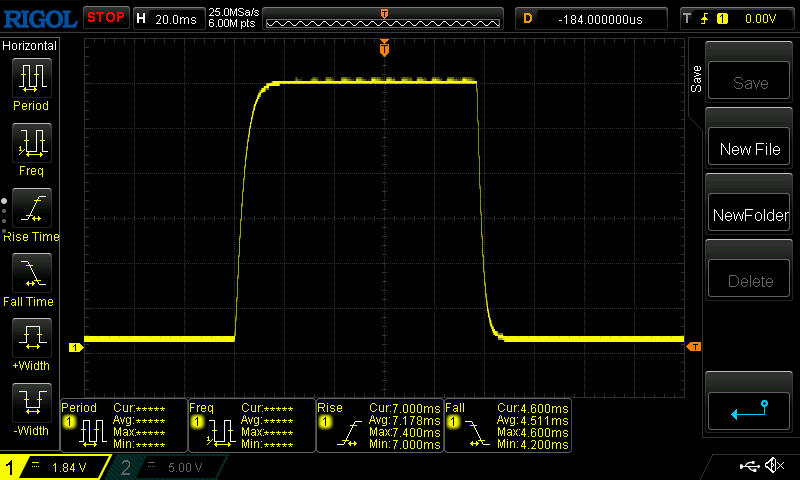 |
| ↘ 4.5 ms sonbahar | ||
| Ekran, testlerimizde iyi yanıt oranları gösteriyor ancak rekabetçi oyuncular için çok yavaş olabilir. Karşılaştırıldığında, test edilen tüm cihazlar 0.1 (minimum) ile 240 (maksimum) ms arasında değişir. » Tüm cihazların 32 %'si daha iyi. Bu, ölçülen yanıt süresinin test edilen tüm cihazların ortalamasından (19.8 ms) daha iyi olduğu anlamına gelir. | ||
| ↔ Tepki Süresi %50 Griden %80 Griye | ||
| 18.9 ms ... yükseliş ↗ ve sonbahar↘ birleşimi | ↗ 9.4 ms yükseliş | 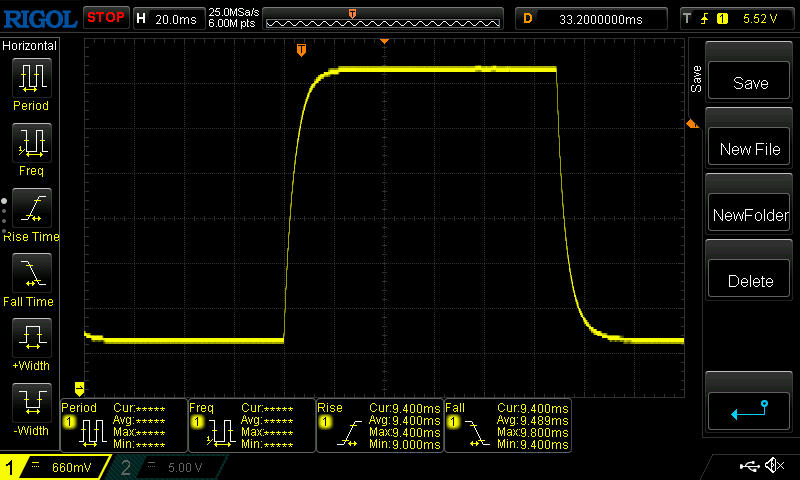 |
| ↘ 9.5 ms sonbahar | ||
| Ekran, testlerimizde iyi yanıt oranları gösteriyor ancak rekabetçi oyuncular için çok yavaş olabilir. Karşılaştırıldığında, test edilen tüm cihazlar 0.165 (minimum) ile 636 (maksimum) ms arasında değişir. » Tüm cihazların 33 %'si daha iyi. Bu, ölçülen yanıt süresinin test edilen tüm cihazların ortalamasından (31 ms) daha iyi olduğu anlamına gelir. | ||
Ekran Titremesi / PWM (Darbe Genişliği Modülasyonu)
| Ekran titriyor / PWM algılanmadı | 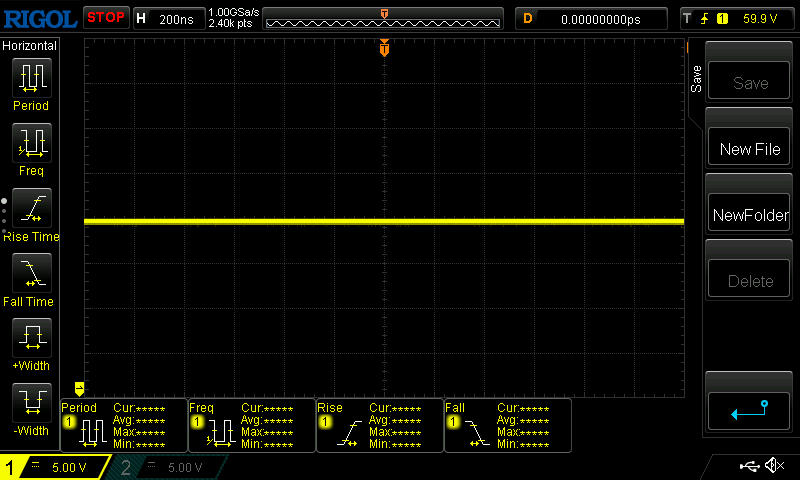 | ||
Karşılaştırıldığında: Test edilen tüm cihazların %52 %'si ekranı karartmak için PWM kullanmıyor. PWM tespit edilirse, ortalama 7754 (minimum: 5 - maksimum: 343500) Hz ölçüldü. | |||
Dizüstü bilgisayarın 300 nit'in üzerindeki kabul edilebilir parlaklığı ve mat yüzeyi sayesinde ekran içeriği gölgeli ortamlarda da rahatlıkla görülebiliyor.

Performans - Son nesil hala sunuyor
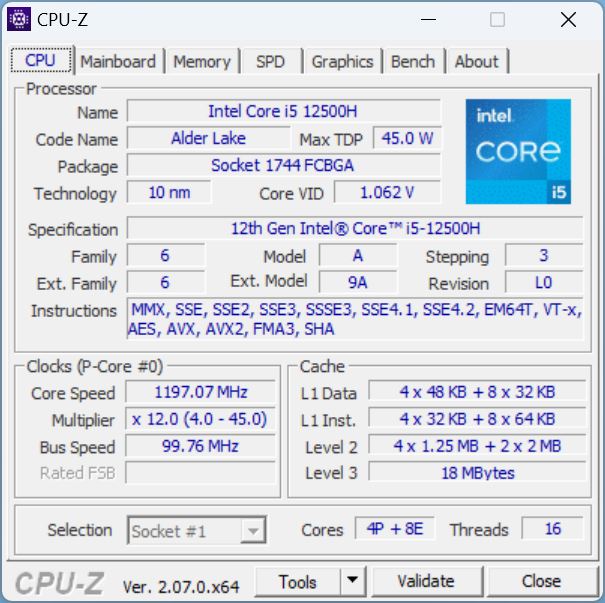
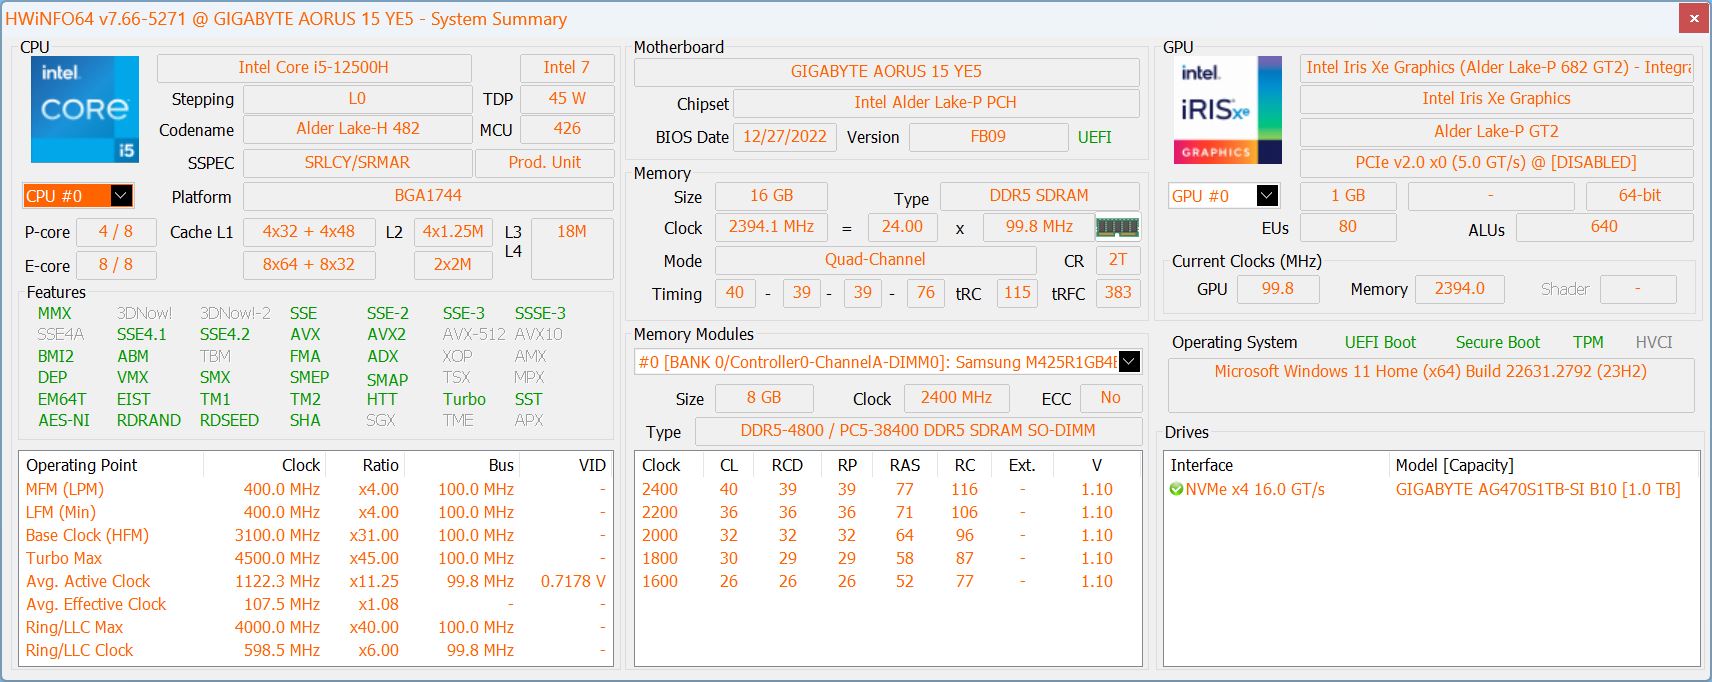
Son nesil CPU ve GPU sisteme güç veriyor. Daha eski Core i5-12500H 16 GB modern DDR5 4800 RAM'e ve Gigabyte'ın 1 TB NVMe SSD'sine erişebiliyor. Onunla birlikte RTX 3080 Tiaorus 15 YE5, son nesil ve orta sınıf CPU'suna rağmen kesinlikle üst düzey bir oyuncu olarak sınıflandırılabilir.
Test koşulları
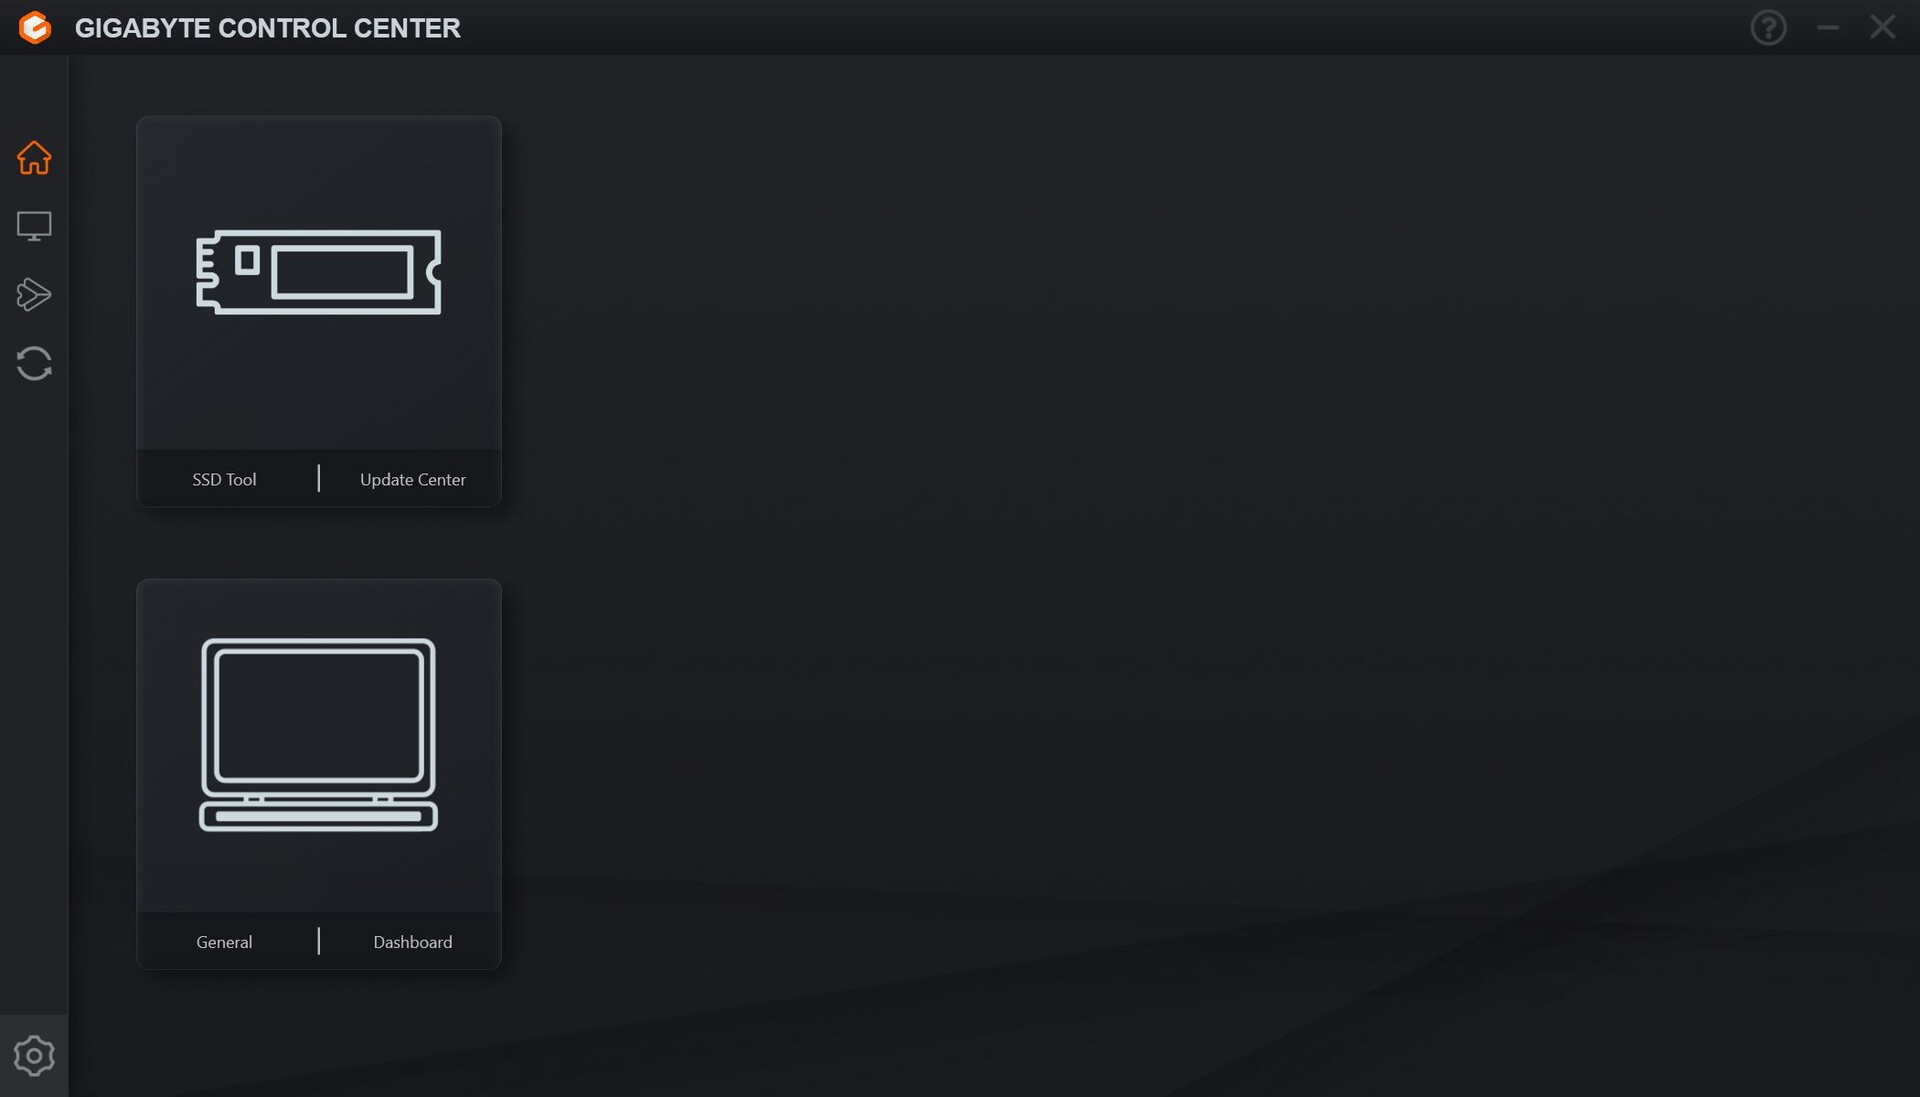
Ex works, dizüstü bilgisayar bir Kontrol Merkezi ile önceden yüklenmiş olarak gelmedi - Gigabyte destek web sitesinden indirilmeli veya indirilebilir gerekirse.
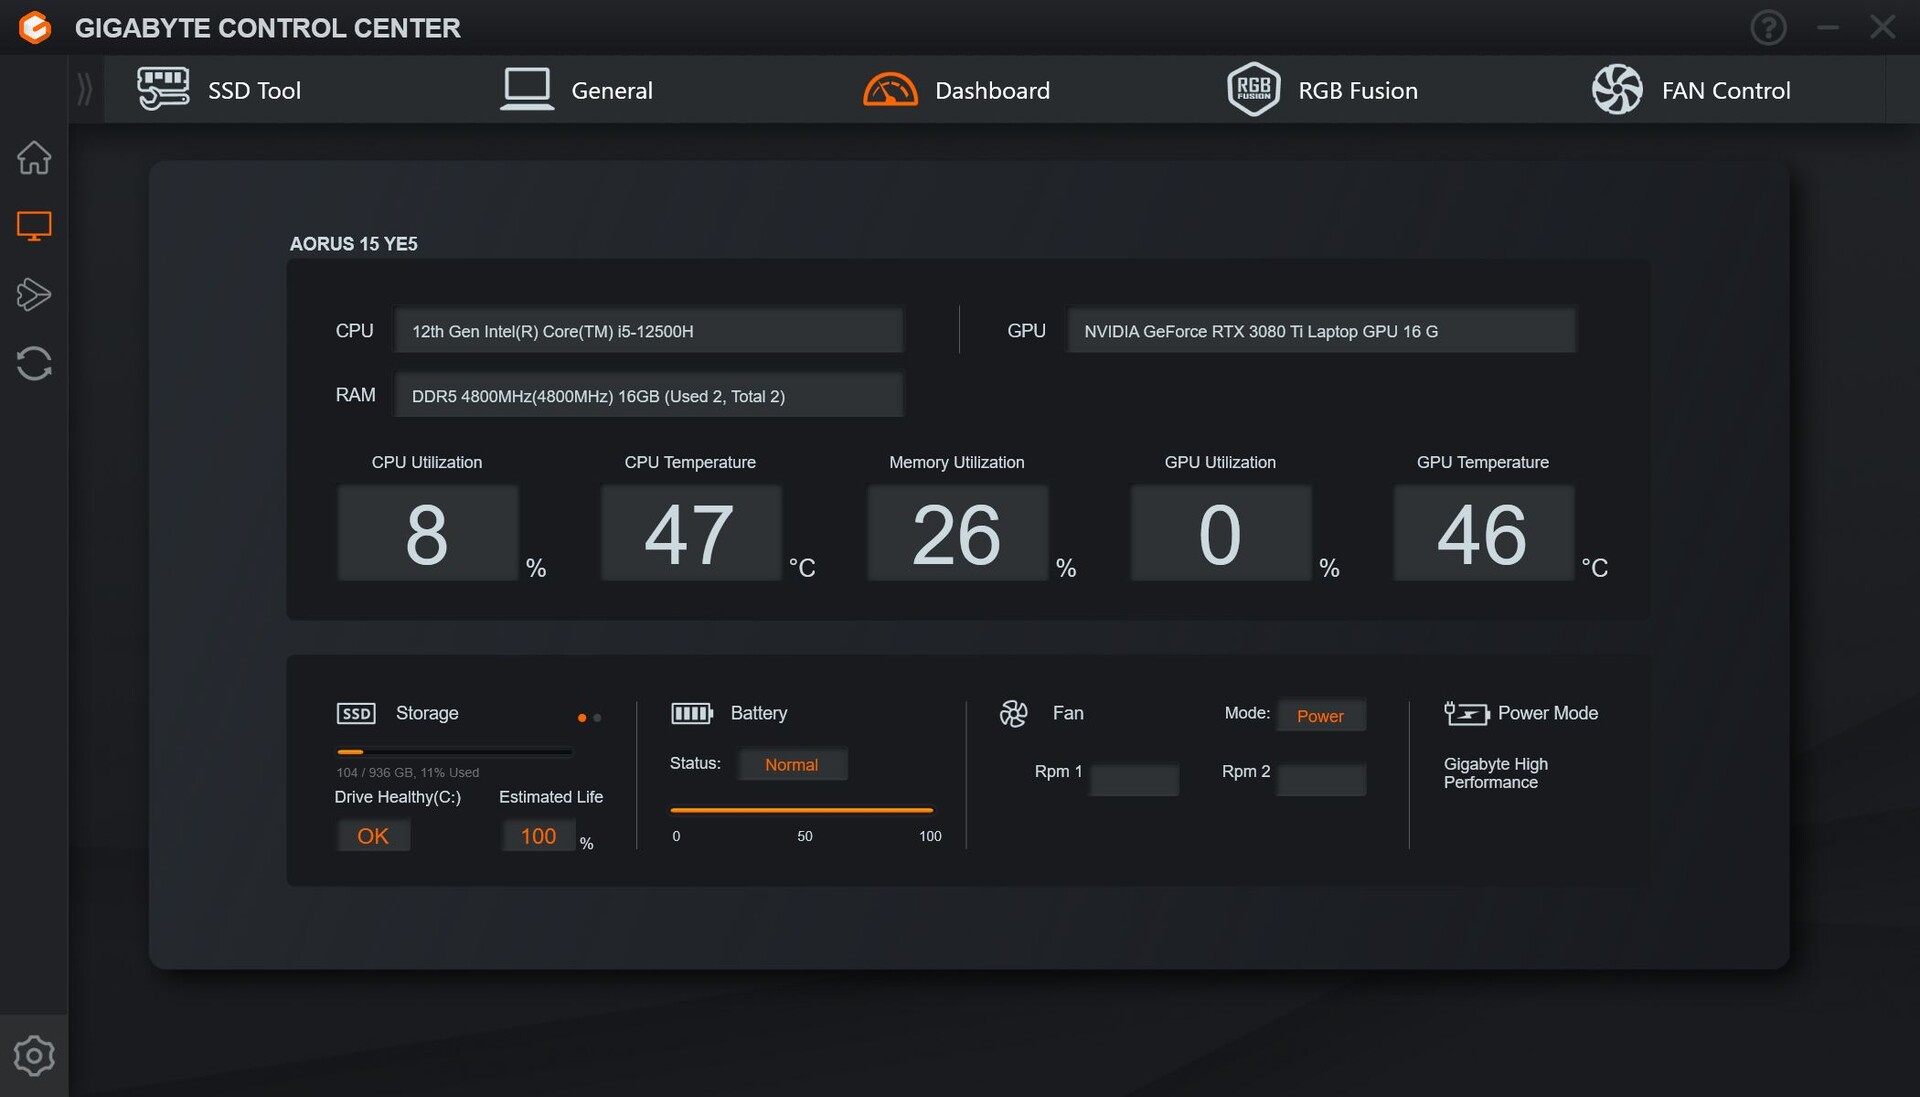
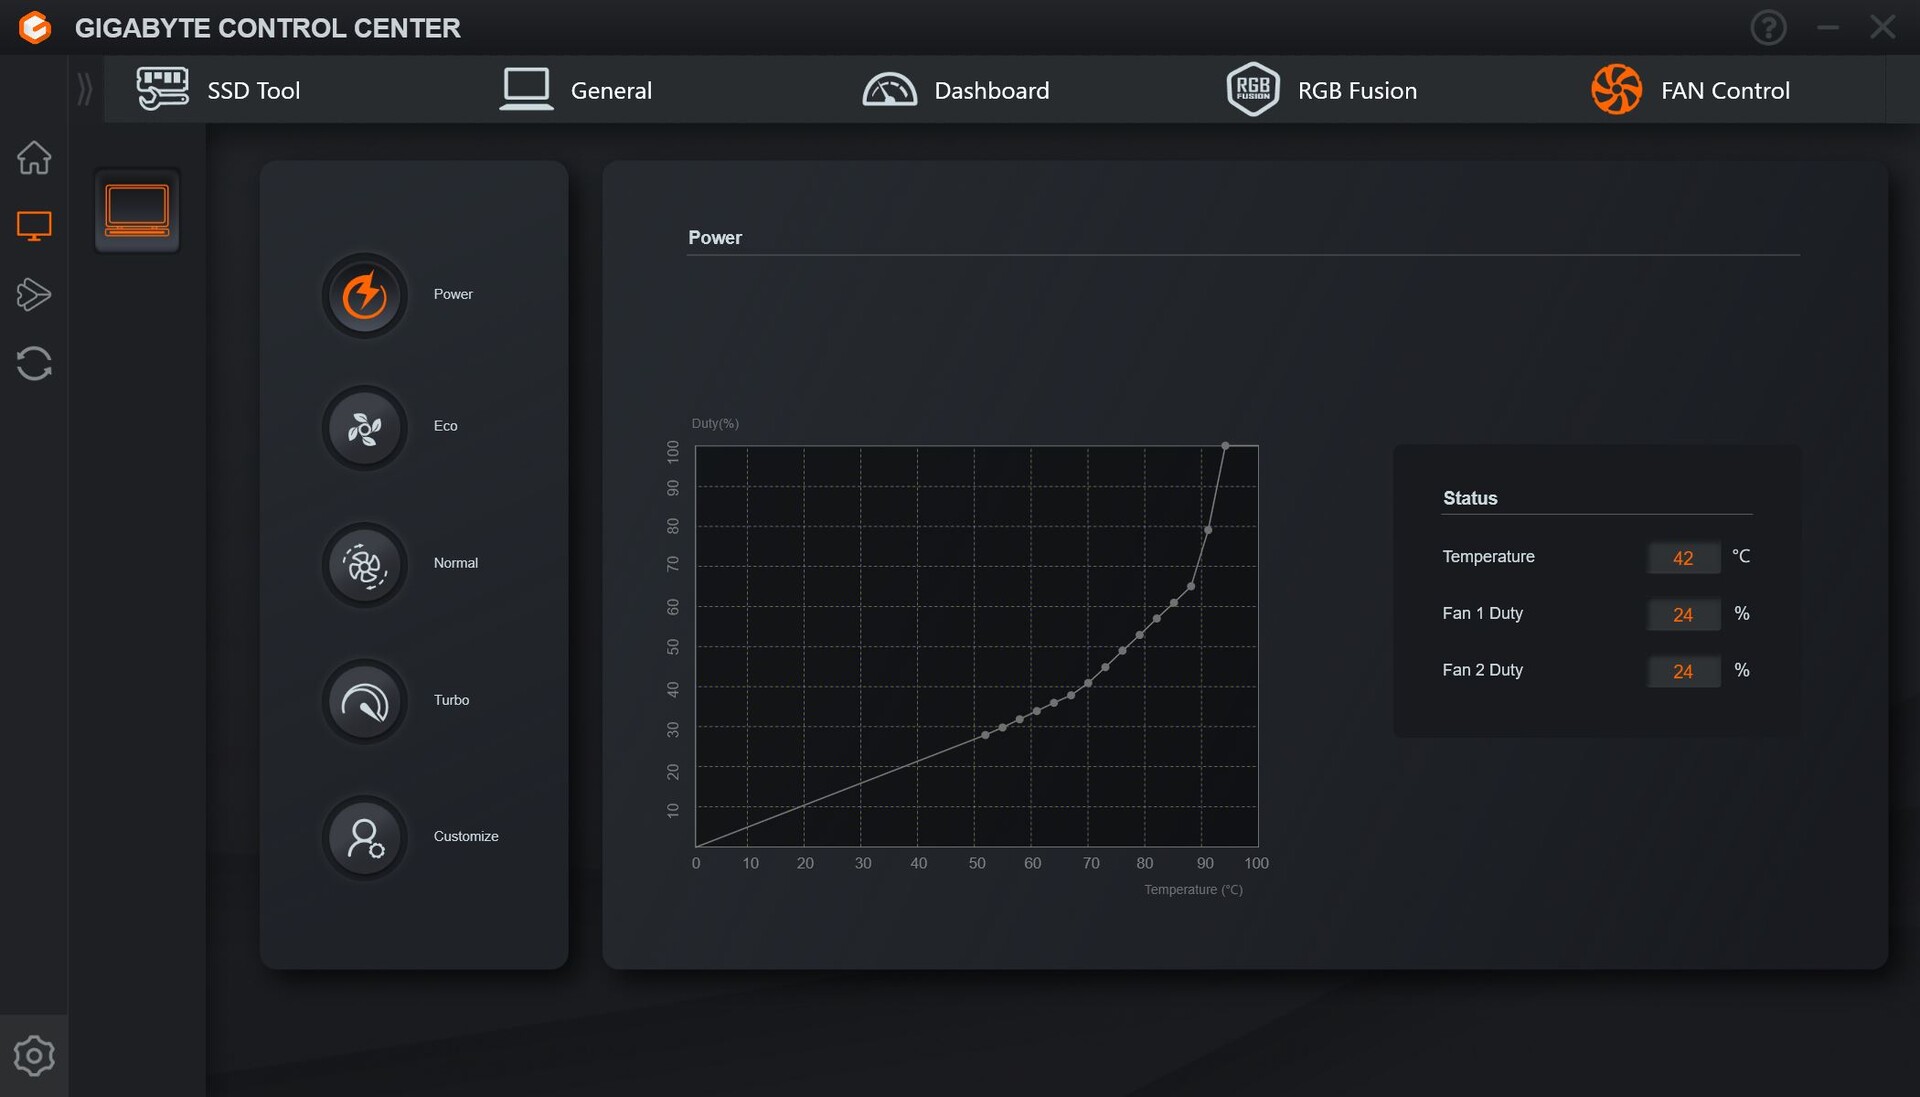
Gigabyte Kontrol Merkezi, performansı, klavye arka aydınlatmasını ve SSD'yi kontrol eden birçok önemli ayar içerir. Menü biraz daha iyi yapılandırılmış olabilir, çünkü ana ekran herhangi bir yararlı bilgi göstermiyor gibi görünüyor - daha fazla bilgi için önce dizüstü bilgisayarın kendisini veya SSD'yi seçmeniz gerekiyor. Bununla birlikte, aynı şeyi ilgili menülerde de yapabilirsiniz, bu yüzden özellikle ana ekran saçma görünüyor. GPU'ları değiştirme seçeneğini de kaçırdık.
Aksi takdirde, performans modlarının yanı sıra fan eğrileri, ayrı olarak ayarlanabilen bir performans modu ve çeşitli diğer seçenekler vardır. Biz kıyaslamalarımız için oyun modunu kullandık. Daha da güçlü turbo modunu kullanırken fanlar her zaman tam hızda çalışıyor.
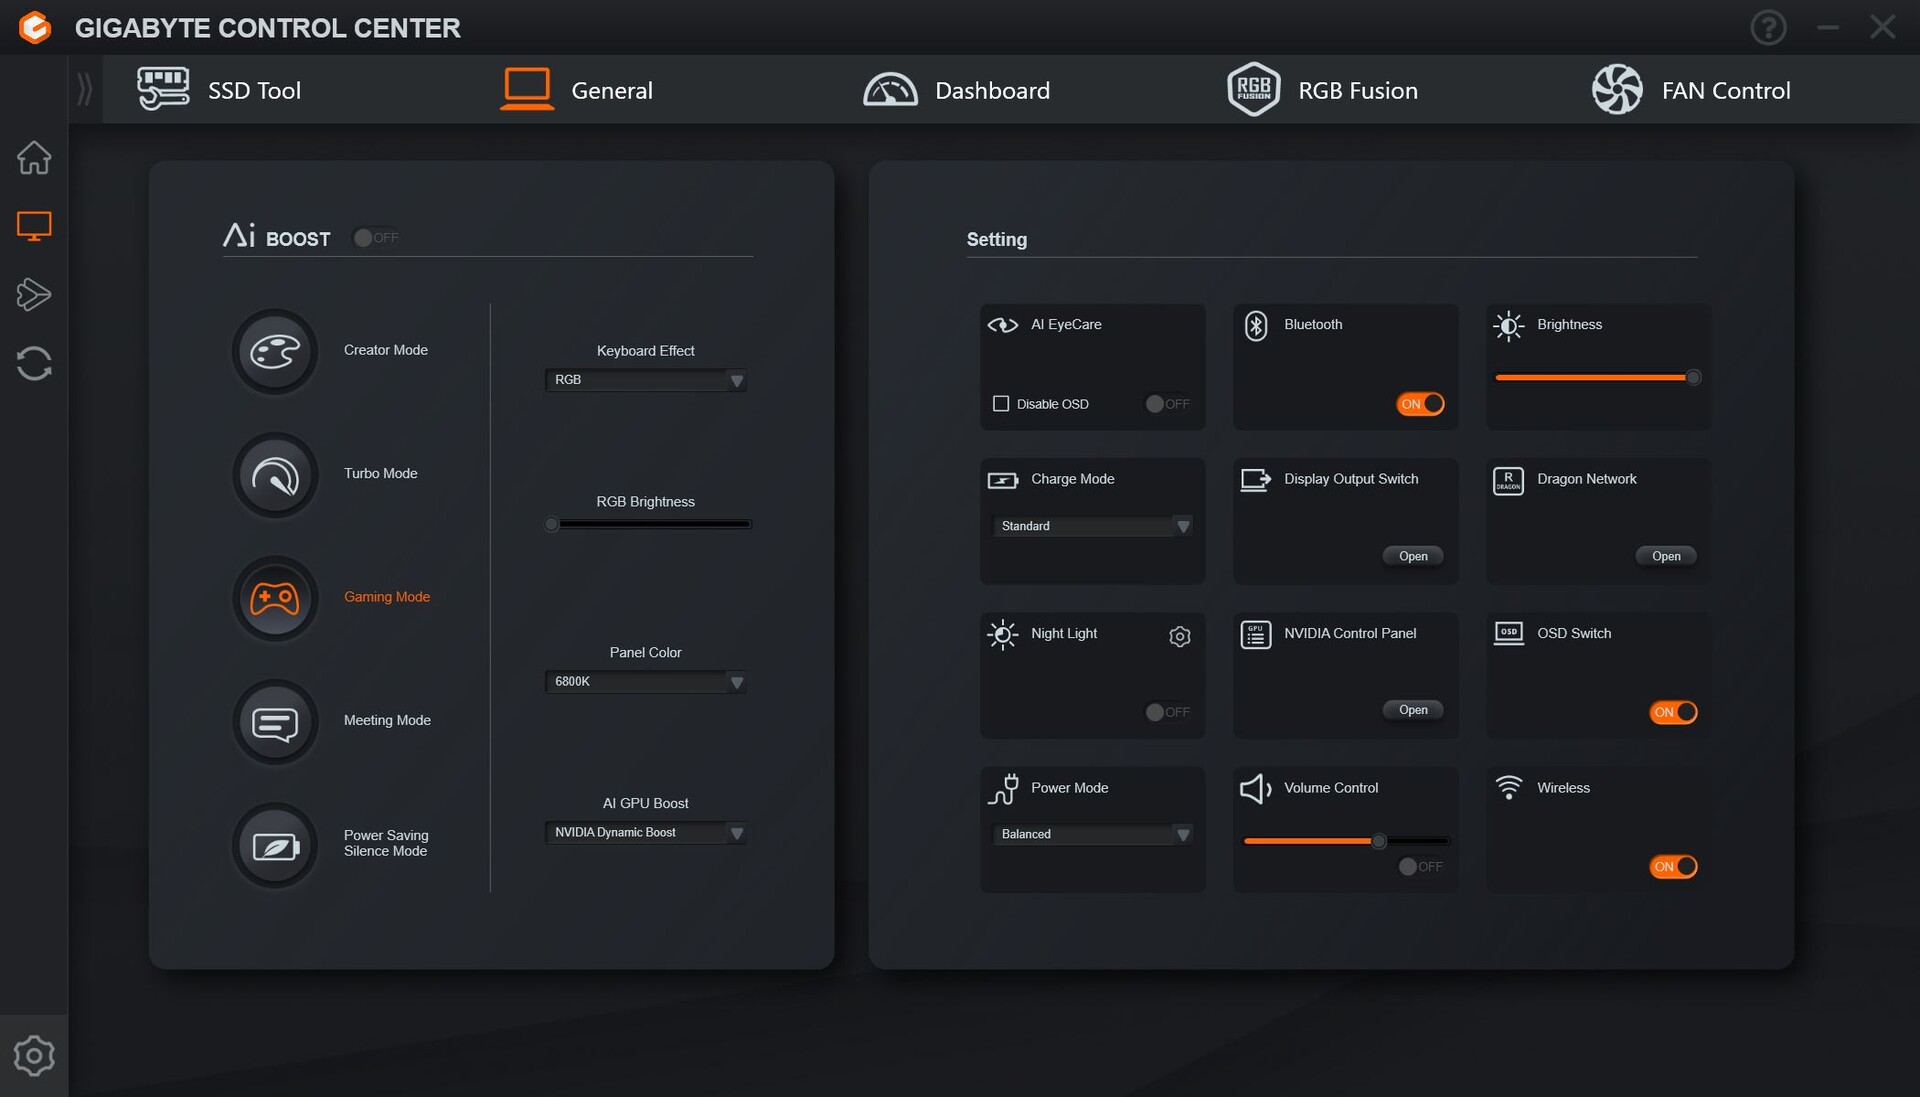
Bekleme modu hakkında bir kelime: Aorus ile (dahil olmak üzere Aorus 15G), dizüstü bilgisayar kapağı hafifçe kapatılır kapatılmaz dizüstü bilgisayarın bekleme moduna geçmesi yaygın gibi görünüyor. Örneğin, harici bir monitör kullanıyorsanız ve dizüstü bilgisayarın kapağını hafifçe öne doğru katlamak istiyorsanız, bu son derece can sıkıcı bir durumdur. Bununla birlikte, sistem yaklaşık 40 ila 45 derecede kapanır, bu gerçekten çok erkendir ve sinirlerinizi bozar. Bir dizüstü bilgisayar sadece gerçekten kapandığında kapanmalıdır, yarı yolda değil.
İşlemci
Dizüstü bilgisayar bir Alder Lake CPU'ya sahiptir - Core i5-12500H - 4 P ve 8 E çekirdeği ile. Bu da toplamda 8 çekirdek ve 16 iş parçacığı anlamına geliyor. Eski üst orta sınıf CPU üreticiye para kazandırmıştır.
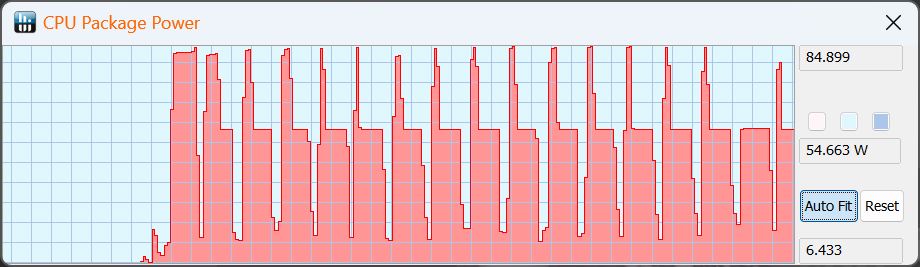
Cinebench R15 Döngüsü sırasında, performansı ilk iki çalıştırmada biraz düştü, ardından sabit kaldı.
Tüm CPU testleri boyunca, Gen 13'ün Gen 12'ye göre önemli (ancak çok büyük olmayan) bir hız avantajı sunduğu anlaşıldı.
Bu Captiva bir i5-13500H yaklaşık yüzde 13 önde geldi. Daha iyi i7-13700H'ye sahip diğer rakipler yüzde 8 gibi düşük bir oranda daha iyi (HP Victus) yüzde 22'lik belirgin bir iyileşmeye (Aorus 15 BSF).
| Cinebench R15 | Çoklu iş parçacığı puanı (1. çalıştırma) | Watt cinsinden CPU güç tüketimi |
|---|---|---|
| AI Boost | 2,277 | 85 |
| Turbo | 2,283 | 85 |
| Oyun | 2,283 | 85, 55'e düştü |
| Yaratıcı | 2,239 | 85 |
| Toplantı | 836 | 30, hızla 15'e düşer |
| Güç Tasarrufu | 724 | 30, 15'e düşer |
| Batarya | 1,670 | 45 |
Cinebench R15 Multi continuous test
Cinebench R23: Multi Core | Single Core
Cinebench R20: CPU (Multi Core) | CPU (Single Core)
Cinebench R15: CPU Multi 64Bit | CPU Single 64Bit
Blender: v2.79 BMW27 CPU
7-Zip 18.03: 7z b 4 | 7z b 4 -mmt1
Geekbench 5.5: Multi-Core | Single-Core
HWBOT x265 Benchmark v2.2: 4k Preset
LibreOffice : 20 Documents To PDF
R Benchmark 2.5: Overall mean
| CPU Performance rating | |
| Sınıf ortalaması Gaming | |
| HP Omen 16-wf000 -1! | |
| Aorus 15 BSF | |
| Dell XPS 15 9530 RTX 4070 | |
| Captiva Advanced Gaming I74-121 | |
| HP Victus 16-r0077ng | |
| Aorus 15 YE5-54DEB34SH | |
| Ortalama Intel Core i5-12500H | |
| Cinebench R23 / Multi Core | |
| Sınıf ortalaması Gaming (10488 - 42661, n=107, son 2 yıl) | |
| HP Omen 16-wf000 | |
| Aorus 15 BSF | |
| Captiva Advanced Gaming I74-121 | |
| Dell XPS 15 9530 RTX 4070 | |
| HP Victus 16-r0077ng | |
| Aorus 15 YE5-54DEB34SH | |
| Ortalama Intel Core i5-12500H (11330 - 14686, n=9) | |
| Cinebench R23 / Single Core | |
| Sınıf ortalaması Gaming (1166 - 2415, n=107, son 2 yıl) | |
| Aorus 15 BSF | |
| HP Omen 16-wf000 | |
| Dell XPS 15 9530 RTX 4070 | |
| Captiva Advanced Gaming I74-121 | |
| Aorus 15 YE5-54DEB34SH | |
| HP Victus 16-r0077ng | |
| Ortalama Intel Core i5-12500H (1558 - 1701, n=9) | |
| Cinebench R20 / CPU (Multi Core) | |
| Sınıf ortalaması Gaming (4029 - 16433, n=106, son 2 yıl) | |
| HP Omen 16-wf000 | |
| Aorus 15 BSF | |
| Captiva Advanced Gaming I74-121 | |
| Dell XPS 15 9530 RTX 4070 | |
| HP Victus 16-r0077ng | |
| Ortalama Intel Core i5-12500H (4687 - 5640, n=9) | |
| Aorus 15 YE5-54DEB34SH | |
| Cinebench R20 / CPU (Single Core) | |
| Sınıf ortalaması Gaming (442 - 913, n=106, son 2 yıl) | |
| Aorus 15 BSF | |
| HP Omen 16-wf000 | |
| Dell XPS 15 9530 RTX 4070 | |
| Captiva Advanced Gaming I74-121 | |
| Aorus 15 YE5-54DEB34SH | |
| HP Victus 16-r0077ng | |
| Ortalama Intel Core i5-12500H (602 - 656, n=9) | |
| Cinebench R15 / CPU Multi 64Bit | |
| Sınıf ortalaması Gaming (1578 - 6330, n=105, son 2 yıl) | |
| HP Omen 16-wf000 | |
| Aorus 15 BSF | |
| Dell XPS 15 9530 RTX 4070 | |
| Captiva Advanced Gaming I74-121 | |
| HP Victus 16-r0077ng | |
| Aorus 15 YE5-54DEB34SH | |
| Ortalama Intel Core i5-12500H (1970 - 2283, n=10) | |
| Cinebench R15 / CPU Single 64Bit | |
| Sınıf ortalaması Gaming (188.8 - 350, n=106, son 2 yıl) | |
| Aorus 15 BSF | |
| Dell XPS 15 9530 RTX 4070 | |
| HP Omen 16-wf000 | |
| Captiva Advanced Gaming I74-121 | |
| Aorus 15 YE5-54DEB34SH | |
| HP Victus 16-r0077ng | |
| Ortalama Intel Core i5-12500H (220 - 250, n=9) | |
| Blender / v2.79 BMW27 CPU | |
| Aorus 15 YE5-54DEB34SH | |
| Ortalama Intel Core i5-12500H (223 - 288, n=9) | |
| Aorus 15 BSF | |
| Dell XPS 15 9530 RTX 4070 | |
| HP Victus 16-r0077ng | |
| Captiva Advanced Gaming I74-121 | |
| Sınıf ortalaması Gaming (79 - 330, n=104, son 2 yıl) | |
| 7-Zip 18.03 / 7z b 4 | |
| Sınıf ortalaması Gaming (33491 - 148086, n=105, son 2 yıl) | |
| HP Omen 16-wf000 | |
| HP Victus 16-r0077ng | |
| Aorus 15 BSF | |
| Dell XPS 15 9530 RTX 4070 | |
| Captiva Advanced Gaming I74-121 | |
| Aorus 15 YE5-54DEB34SH | |
| Ortalama Intel Core i5-12500H (44105 - 54380, n=9) | |
| 7-Zip 18.03 / 7z b 4 -mmt1 | |
| Sınıf ortalaması Gaming (4199 - 7436, n=105, son 2 yıl) | |
| Aorus 15 BSF | |
| Dell XPS 15 9530 RTX 4070 | |
| HP Omen 16-wf000 | |
| Captiva Advanced Gaming I74-121 | |
| HP Victus 16-r0077ng | |
| Aorus 15 YE5-54DEB34SH | |
| Ortalama Intel Core i5-12500H (5151 - 5563, n=9) | |
| Geekbench 5.5 / Multi-Core | |
| Sınıf ortalaması Gaming (6460 - 28263, n=105, son 2 yıl) | |
| HP Omen 16-wf000 | |
| Aorus 15 BSF | |
| Dell XPS 15 9530 RTX 4070 | |
| HP Victus 16-r0077ng | |
| Aorus 15 YE5-54DEB34SH | |
| Captiva Advanced Gaming I74-121 | |
| Ortalama Intel Core i5-12500H (7962 - 10828, n=9) | |
| Geekbench 5.5 / Single-Core | |
| Sınıf ortalaması Gaming (986 - 2474, n=105, son 2 yıl) | |
| Dell XPS 15 9530 RTX 4070 | |
| HP Omen 16-wf000 | |
| Aorus 15 BSF | |
| Captiva Advanced Gaming I74-121 | |
| HP Victus 16-r0077ng | |
| Aorus 15 YE5-54DEB34SH | |
| Ortalama Intel Core i5-12500H (1471 - 1693, n=9) | |
| HWBOT x265 Benchmark v2.2 / 4k Preset | |
| Sınıf ortalaması Gaming (11.5 - 44.4, n=105, son 2 yıl) | |
| HP Omen 16-wf000 | |
| Captiva Advanced Gaming I74-121 | |
| Dell XPS 15 9530 RTX 4070 | |
| HP Victus 16-r0077ng | |
| Aorus 15 BSF | |
| Aorus 15 YE5-54DEB34SH | |
| Ortalama Intel Core i5-12500H (12 - 16.6, n=9) | |
| LibreOffice / 20 Documents To PDF | |
| HP Victus 16-r0077ng | |
| Aorus 15 YE5-54DEB34SH | |
| Captiva Advanced Gaming I74-121 | |
| Sınıf ortalaması Gaming (33.2 - 88.8, n=105, son 2 yıl) | |
| Ortalama Intel Core i5-12500H (40.1 - 58.5, n=9) | |
| Aorus 15 BSF | |
| HP Omen 16-wf000 | |
| Dell XPS 15 9530 RTX 4070 | |
| R Benchmark 2.5 / Overall mean | |
| Aorus 15 YE5-54DEB34SH | |
| Ortalama Intel Core i5-12500H (0.4748 - 0.535, n=9) | |
| HP Victus 16-r0077ng | |
| Captiva Advanced Gaming I74-121 | |
| HP Omen 16-wf000 | |
| Aorus 15 BSF | |
| Dell XPS 15 9530 RTX 4070 | |
| Sınıf ortalaması Gaming (0.3439 - 0.759, n=106, son 2 yıl) | |
* ... daha küçük daha iyidir
AIDA64: FP32 Ray-Trace | FPU Julia | CPU SHA3 | CPU Queen | FPU SinJulia | FPU Mandel | CPU AES | CPU ZLib | FP64 Ray-Trace | CPU PhotoWorxx
| Performance rating | |
| Sınıf ortalaması Gaming | |
| Aorus 15 BSF | |
| Captiva Advanced Gaming I74-121 | |
| Dell XPS 15 9530 RTX 4070 | |
| HP Victus 16-r0077ng | |
| Aorus 15 YE5-54DEB34SH | |
| Ortalama Intel Core i5-12500H | |
| AIDA64 / FP32 Ray-Trace | |
| Sınıf ortalaması Gaming (10227 - 85542, n=105, son 2 yıl) | |
| Captiva Advanced Gaming I74-121 | |
| HP Victus 16-r0077ng | |
| Dell XPS 15 9530 RTX 4070 | |
| Aorus 15 BSF | |
| Aorus 15 YE5-54DEB34SH | |
| Ortalama Intel Core i5-12500H (6851 - 13947, n=9) | |
| AIDA64 / FPU Julia | |
| Sınıf ortalaması Gaming (51376 - 238426, n=105, son 2 yıl) | |
| Captiva Advanced Gaming I74-121 | |
| HP Victus 16-r0077ng | |
| Aorus 15 BSF | |
| Dell XPS 15 9530 RTX 4070 | |
| Aorus 15 YE5-54DEB34SH | |
| Ortalama Intel Core i5-12500H (29874 - 68178, n=9) | |
| AIDA64 / CPU SHA3 | |
| Sınıf ortalaması Gaming (2180 - 10115, n=105, son 2 yıl) | |
| Captiva Advanced Gaming I74-121 | |
| HP Victus 16-r0077ng | |
| Aorus 15 BSF | |
| Dell XPS 15 9530 RTX 4070 | |
| Aorus 15 YE5-54DEB34SH | |
| Ortalama Intel Core i5-12500H (2287 - 3337, n=9) | |
| AIDA64 / CPU Queen | |
| Sınıf ortalaması Gaming (49785 - 173351, n=90, son 2 yıl) | |
| Aorus 15 BSF | |
| Dell XPS 15 9530 RTX 4070 | |
| HP Victus 16-r0077ng | |
| Captiva Advanced Gaming I74-121 | |
| Aorus 15 YE5-54DEB34SH | |
| Ortalama Intel Core i5-12500H (77935 - 80703, n=9) | |
| AIDA64 / FPU SinJulia | |
| Sınıf ortalaması Gaming (4424 - 33636, n=105, son 2 yıl) | |
| Aorus 15 BSF | |
| Dell XPS 15 9530 RTX 4070 | |
| HP Victus 16-r0077ng | |
| Captiva Advanced Gaming I74-121 | |
| Aorus 15 YE5-54DEB34SH | |
| Ortalama Intel Core i5-12500H (6590 - 7431, n=9) | |
| AIDA64 / FPU Mandel | |
| Sınıf ortalaması Gaming (25115 - 128721, n=105, son 2 yıl) | |
| Captiva Advanced Gaming I74-121 | |
| HP Victus 16-r0077ng | |
| Dell XPS 15 9530 RTX 4070 | |
| Aorus 15 BSF | |
| Aorus 15 YE5-54DEB34SH | |
| Ortalama Intel Core i5-12500H (18252 - 34041, n=9) | |
| AIDA64 / CPU AES | |
| Captiva Advanced Gaming I74-121 | |
| Aorus 15 BSF | |
| Aorus 15 YE5-54DEB34SH | |
| Sınıf ortalaması Gaming (39258 - 247074, n=105, son 2 yıl) | |
| Ortalama Intel Core i5-12500H (50298 - 111567, n=9) | |
| HP Victus 16-r0077ng | |
| Dell XPS 15 9530 RTX 4070 | |
| AIDA64 / CPU ZLib | |
| Sınıf ortalaması Gaming (574 - 2531, n=105, son 2 yıl) | |
| Captiva Advanced Gaming I74-121 | |
| HP Victus 16-r0077ng | |
| Aorus 15 YE5-54DEB34SH | |
| Dell XPS 15 9530 RTX 4070 | |
| Aorus 15 BSF | |
| Ortalama Intel Core i5-12500H (746 - 924, n=9) | |
| AIDA64 / FP64 Ray-Trace | |
| Sınıf ortalaması Gaming (5509 - 45446, n=105, son 2 yıl) | |
| Captiva Advanced Gaming I74-121 | |
| HP Victus 16-r0077ng | |
| Dell XPS 15 9530 RTX 4070 | |
| Aorus 15 BSF | |
| Aorus 15 YE5-54DEB34SH | |
| Ortalama Intel Core i5-12500H (3848 - 7405, n=9) | |
| AIDA64 / CPU PhotoWorxx | |
| Sınıf ortalaması Gaming (12271 - 89891, n=105, son 2 yıl) | |
| Dell XPS 15 9530 RTX 4070 | |
| HP Victus 16-r0077ng | |
| Aorus 15 BSF | |
| Aorus 15 YE5-54DEB34SH | |
| Ortalama Intel Core i5-12500H (13686 - 43813, n=9) | |
| Captiva Advanced Gaming I74-121 | |
Sistem performansı
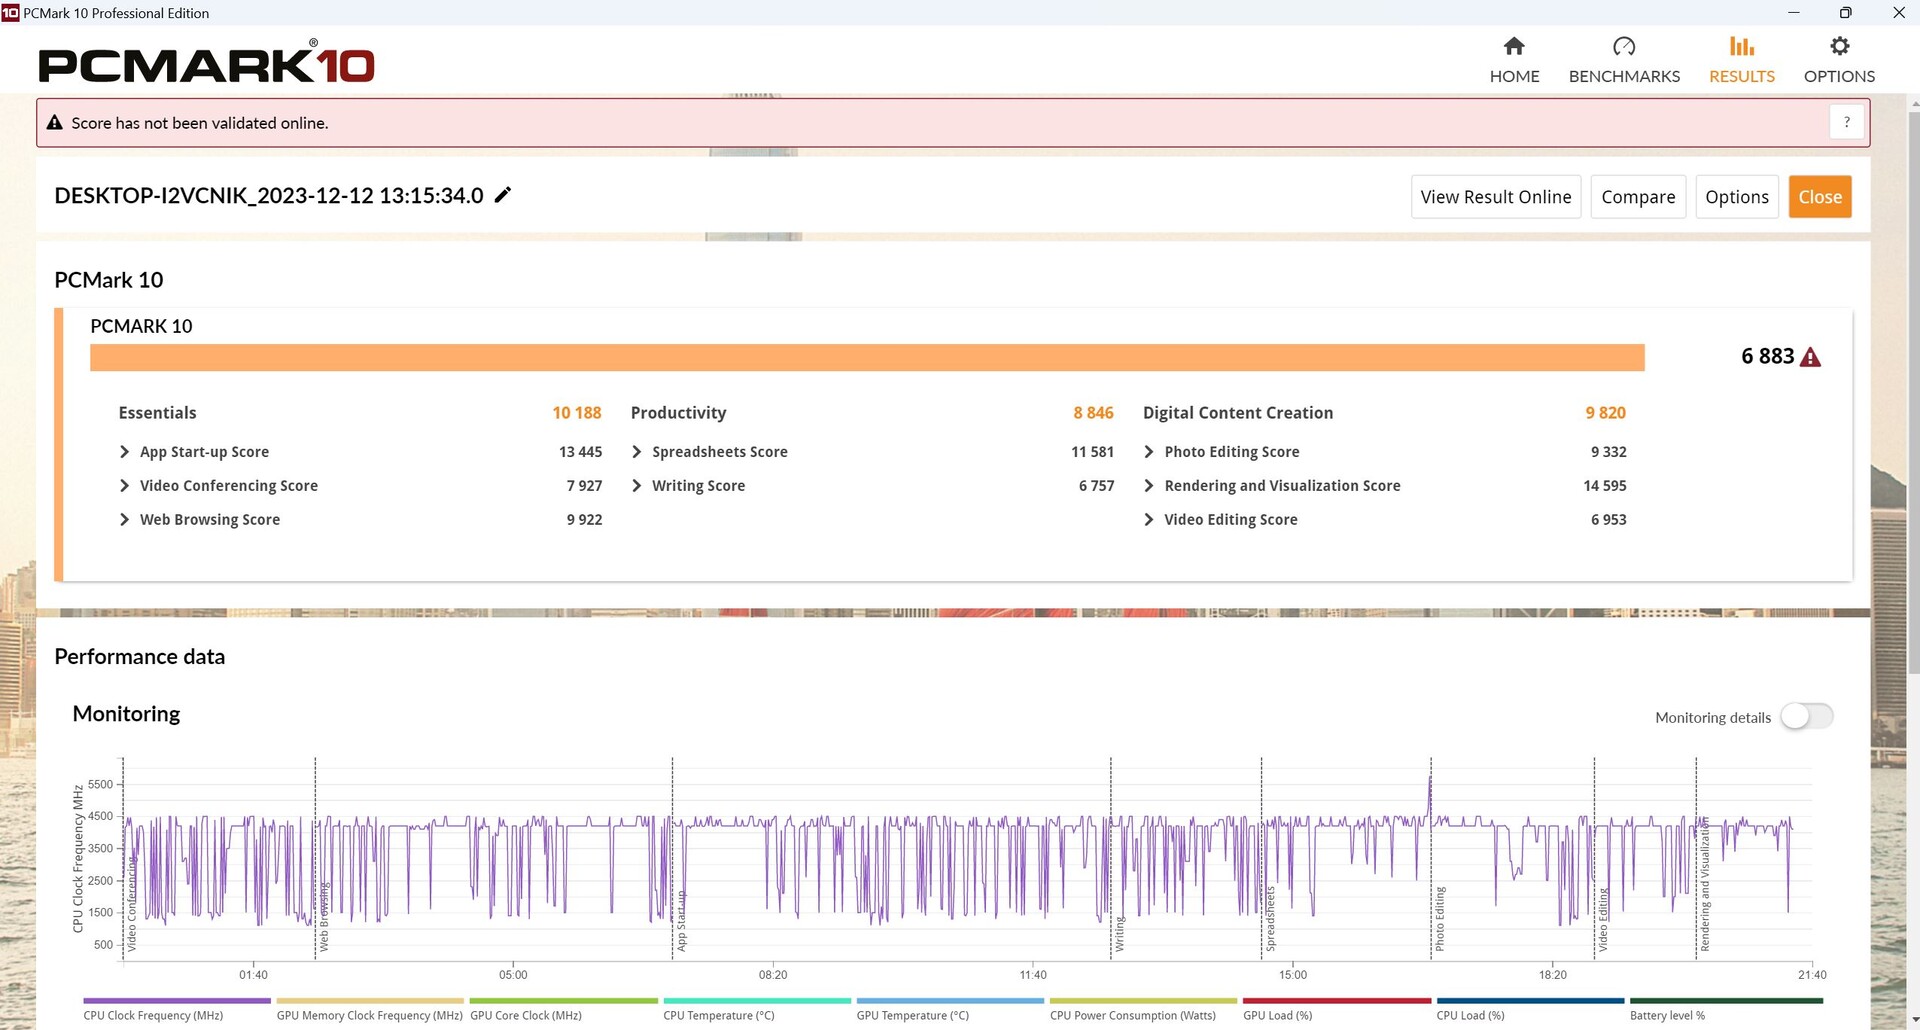
PCMark 10 sırasında, halef CPU'ya sahip Captiva yaklaşık yüzde 7 önde gelirken, CrossMark sırasında her iki cihaz da aynı başarıyı gösterdi.
CrossMark: Overall | Productivity | Creativity | Responsiveness
WebXPRT 3: Overall
WebXPRT 4: Overall
Mozilla Kraken 1.1: Total
| PCMark 10 / Score | |
| Sınıf ortalaması Gaming (5828 - 12414, n=93, son 2 yıl) | |
| HP Omen 16-wf000 | |
| Captiva Advanced Gaming I74-121 | |
| Aorus 15 BSF | |
| Dell XPS 15 9530 RTX 4070 | |
| HP Victus 16-r0077ng | |
| Aorus 15 YE5-54DEB34SH | |
| Ortalama Intel Core i5-12500H, NVIDIA GeForce RTX 3080 Ti Laptop GPU (n=1) | |
| PCMark 10 / Essentials | |
| Captiva Advanced Gaming I74-121 | |
| Dell XPS 15 9530 RTX 4070 | |
| Aorus 15 BSF | |
| HP Victus 16-r0077ng | |
| Sınıf ortalaması Gaming (8810 - 11935, n=97, son 2 yıl) | |
| HP Omen 16-wf000 | |
| Aorus 15 YE5-54DEB34SH | |
| Ortalama Intel Core i5-12500H, NVIDIA GeForce RTX 3080 Ti Laptop GPU (n=1) | |
| PCMark 10 / Productivity | |
| Sınıf ortalaması Gaming (6845 - 25323, n=95, son 2 yıl) | |
| HP Omen 16-wf000 | |
| Captiva Advanced Gaming I74-121 | |
| Aorus 15 BSF | |
| HP Victus 16-r0077ng | |
| Aorus 15 YE5-54DEB34SH | |
| Ortalama Intel Core i5-12500H, NVIDIA GeForce RTX 3080 Ti Laptop GPU (n=1) | |
| Dell XPS 15 9530 RTX 4070 | |
| PCMark 10 / Digital Content Creation | |
| Sınıf ortalaması Gaming (7602 - 19954, n=95, son 2 yıl) | |
| HP Omen 16-wf000 | |
| Aorus 15 BSF | |
| Dell XPS 15 9530 RTX 4070 | |
| Captiva Advanced Gaming I74-121 | |
| HP Victus 16-r0077ng | |
| Aorus 15 YE5-54DEB34SH | |
| Ortalama Intel Core i5-12500H, NVIDIA GeForce RTX 3080 Ti Laptop GPU (n=1) | |
| CrossMark / Overall | |
| Aorus 15 BSF | |
| Sınıf ortalaması Gaming (1366 - 2409, n=94, son 2 yıl) | |
| Dell XPS 15 9530 RTX 4070 | |
| HP Omen 16-wf000 | |
| Captiva Advanced Gaming I74-121 | |
| Aorus 15 YE5-54DEB34SH | |
| Ortalama Intel Core i5-12500H, NVIDIA GeForce RTX 3080 Ti Laptop GPU (n=1) | |
| CrossMark / Productivity | |
| Aorus 15 BSF | |
| Sınıf ortalaması Gaming (1386 - 2254, n=94, son 2 yıl) | |
| Dell XPS 15 9530 RTX 4070 | |
| Captiva Advanced Gaming I74-121 | |
| Aorus 15 YE5-54DEB34SH | |
| Ortalama Intel Core i5-12500H, NVIDIA GeForce RTX 3080 Ti Laptop GPU (n=1) | |
| HP Omen 16-wf000 | |
| CrossMark / Creativity | |
| Sınıf ortalaması Gaming (1343 - 2786, n=94, son 2 yıl) | |
| Dell XPS 15 9530 RTX 4070 | |
| Aorus 15 BSF | |
| HP Omen 16-wf000 | |
| Aorus 15 YE5-54DEB34SH | |
| Ortalama Intel Core i5-12500H, NVIDIA GeForce RTX 3080 Ti Laptop GPU (n=1) | |
| Captiva Advanced Gaming I74-121 | |
| CrossMark / Responsiveness | |
| Aorus 15 BSF | |
| Sınıf ortalaması Gaming (1226 - 2334, n=94, son 2 yıl) | |
| Dell XPS 15 9530 RTX 4070 | |
| Captiva Advanced Gaming I74-121 | |
| Aorus 15 YE5-54DEB34SH | |
| Ortalama Intel Core i5-12500H, NVIDIA GeForce RTX 3080 Ti Laptop GPU (n=1) | |
| HP Omen 16-wf000 | |
| WebXPRT 3 / Overall | |
| Dell XPS 15 9530 RTX 4070 | |
| Sınıf ortalaması Gaming (220 - 532, n=98, son 2 yıl) | |
| Aorus 15 BSF | |
| HP Omen 16-wf000 | |
| HP Victus 16-r0077ng | |
| HP Victus 16-r0077ng | |
| Captiva Advanced Gaming I74-121 | |
| Captiva Advanced Gaming I74-121 | |
| Aorus 15 YE5-54DEB34SH | |
| Ortalama Intel Core i5-12500H, NVIDIA GeForce RTX 3080 Ti Laptop GPU (n=1) | |
| WebXPRT 4 / Overall | |
| Sınıf ortalaması Gaming (165 - 354, n=98, son 2 yıl) | |
| Dell XPS 15 9530 RTX 4070 | |
| Aorus 15 BSF | |
| HP Omen 16-wf000 | |
| HP Victus 16-r0077ng | |
| HP Victus 16-r0077ng | |
| Aorus 15 YE5-54DEB34SH | |
| Ortalama Intel Core i5-12500H, NVIDIA GeForce RTX 3080 Ti Laptop GPU (n=1) | |
| Captiva Advanced Gaming I74-121 | |
| Captiva Advanced Gaming I74-121 | |
| Mozilla Kraken 1.1 / Total | |
| Aorus 15 YE5-54DEB34SH | |
| Ortalama Intel Core i5-12500H, NVIDIA GeForce RTX 3080 Ti Laptop GPU (n=1) | |
| HP Victus 16-r0077ng | |
| HP Victus 16-r0077ng | |
| Captiva Advanced Gaming I74-121 | |
| Captiva Advanced Gaming I74-121 | |
| HP Omen 16-wf000 | |
| Dell XPS 15 9530 RTX 4070 | |
| Aorus 15 BSF | |
| Sınıf ortalaması Gaming (391 - 590, n=100, son 2 yıl) | |
* ... daha küçük daha iyidir
| PCMark 10 Score | 6883 puan | |
Yardım | ||
| AIDA64 / Memory Copy | |
| Sınıf ortalaması Gaming (21750 - 129946, n=105, son 2 yıl) | |
| Dell XPS 15 9530 RTX 4070 | |
| HP Victus 16-r0077ng | |
| Aorus 15 BSF | |
| Aorus 15 YE5-54DEB34SH | |
| Ortalama Intel Core i5-12500H (23850 - 66598, n=9) | |
| Captiva Advanced Gaming I74-121 | |
| AIDA64 / Memory Read | |
| Sınıf ortalaması Gaming (22956 - 118858, n=105, son 2 yıl) | |
| Dell XPS 15 9530 RTX 4070 | |
| HP Victus 16-r0077ng | |
| Aorus 15 BSF | |
| Aorus 15 YE5-54DEB34SH | |
| Ortalama Intel Core i5-12500H (24879 - 68013, n=9) | |
| Captiva Advanced Gaming I74-121 | |
| AIDA64 / Memory Write | |
| Aorus 15 BSF | |
| Sınıf ortalaması Gaming (22297 - 135096, n=105, son 2 yıl) | |
| Dell XPS 15 9530 RTX 4070 | |
| HP Victus 16-r0077ng | |
| Aorus 15 YE5-54DEB34SH | |
| Ortalama Intel Core i5-12500H (23543 - 58797, n=9) | |
| Captiva Advanced Gaming I74-121 | |
| AIDA64 / Memory Latency | |
| Sınıf ortalaması Gaming (75.3 - 259, n=105, son 2 yıl) | |
| Aorus 15 YE5-54DEB34SH | |
| Ortalama Intel Core i5-12500H (83.8 - 114.7, n=9) | |
| HP Victus 16-r0077ng | |
| Aorus 15 BSF | |
| Dell XPS 15 9530 RTX 4070 | |
| Captiva Advanced Gaming I74-121 | |
* ... daha küçük daha iyidir
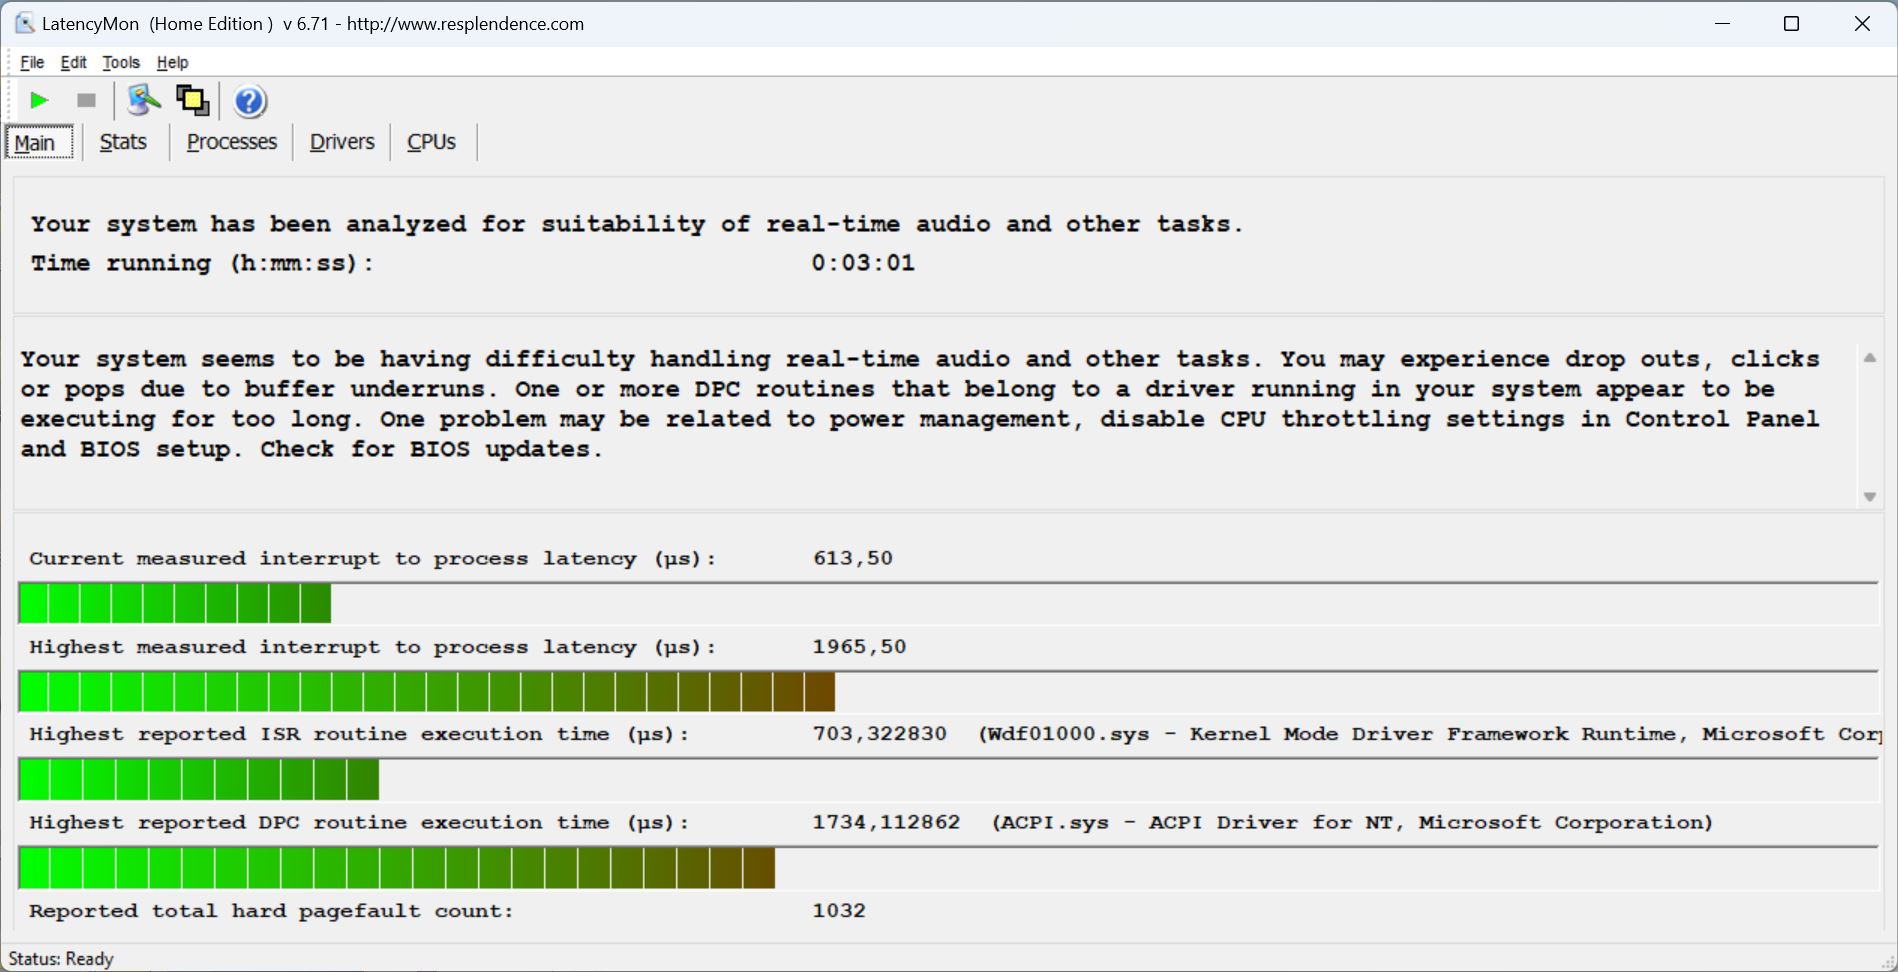
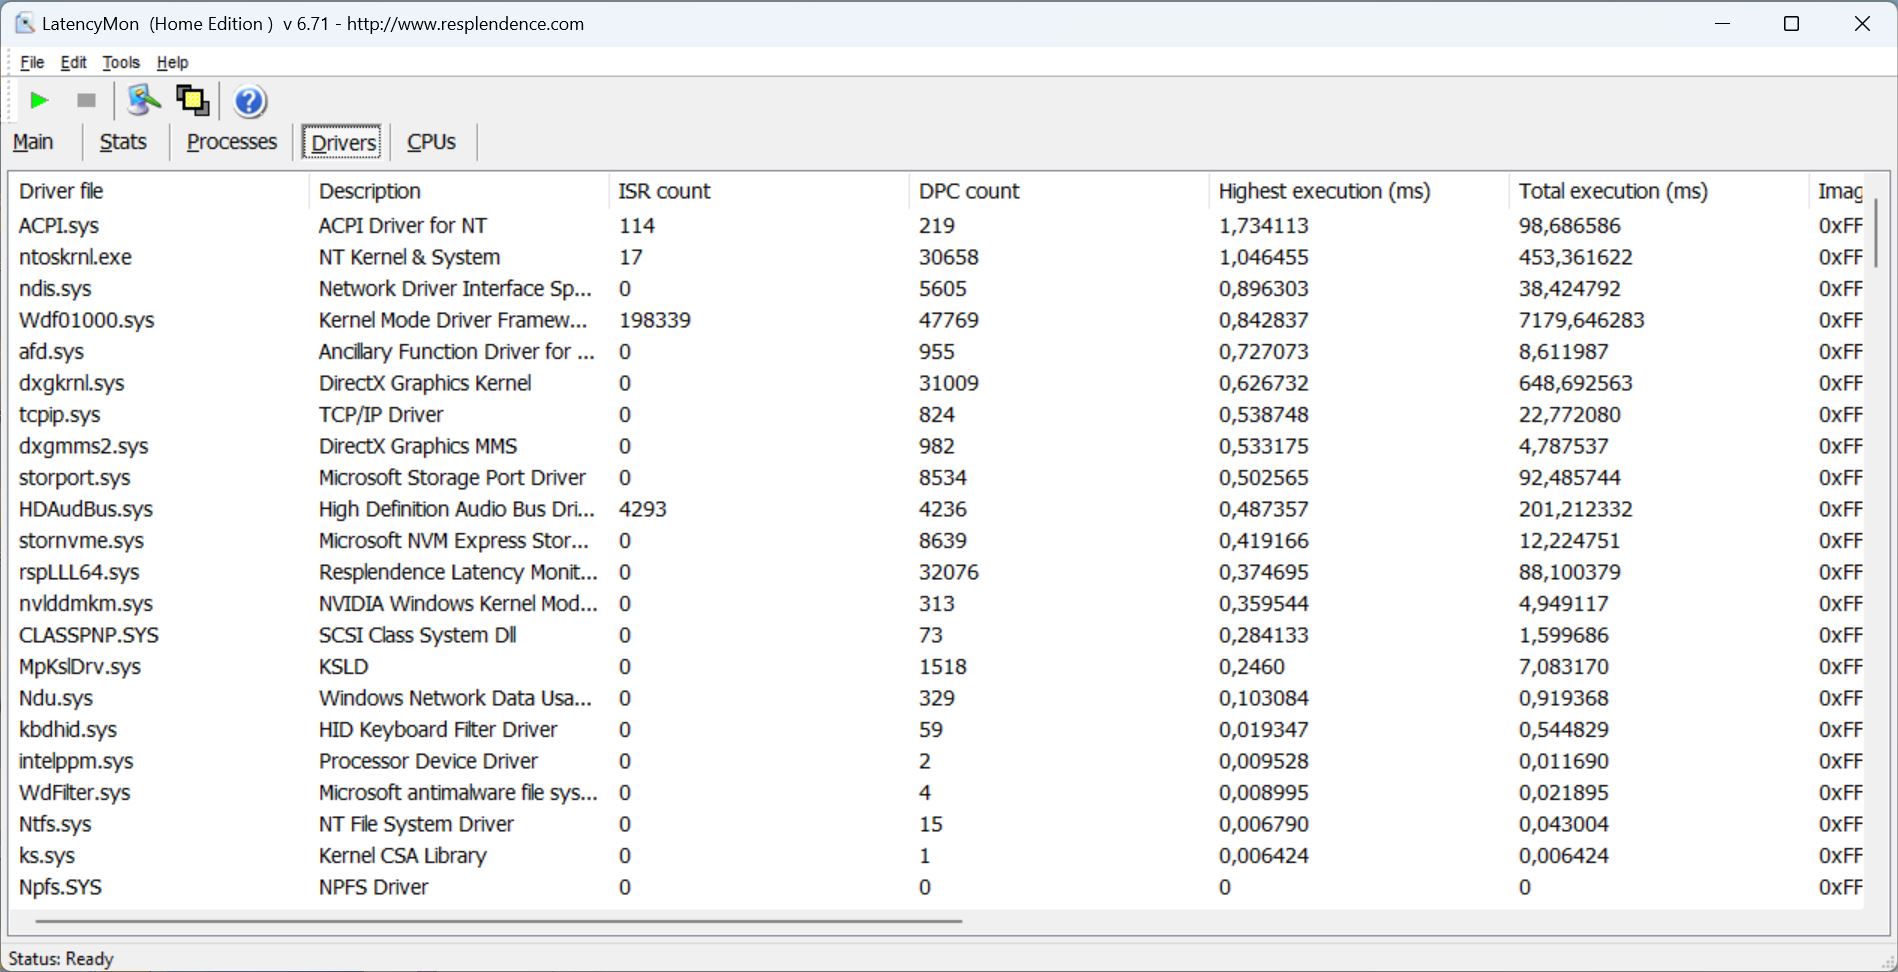
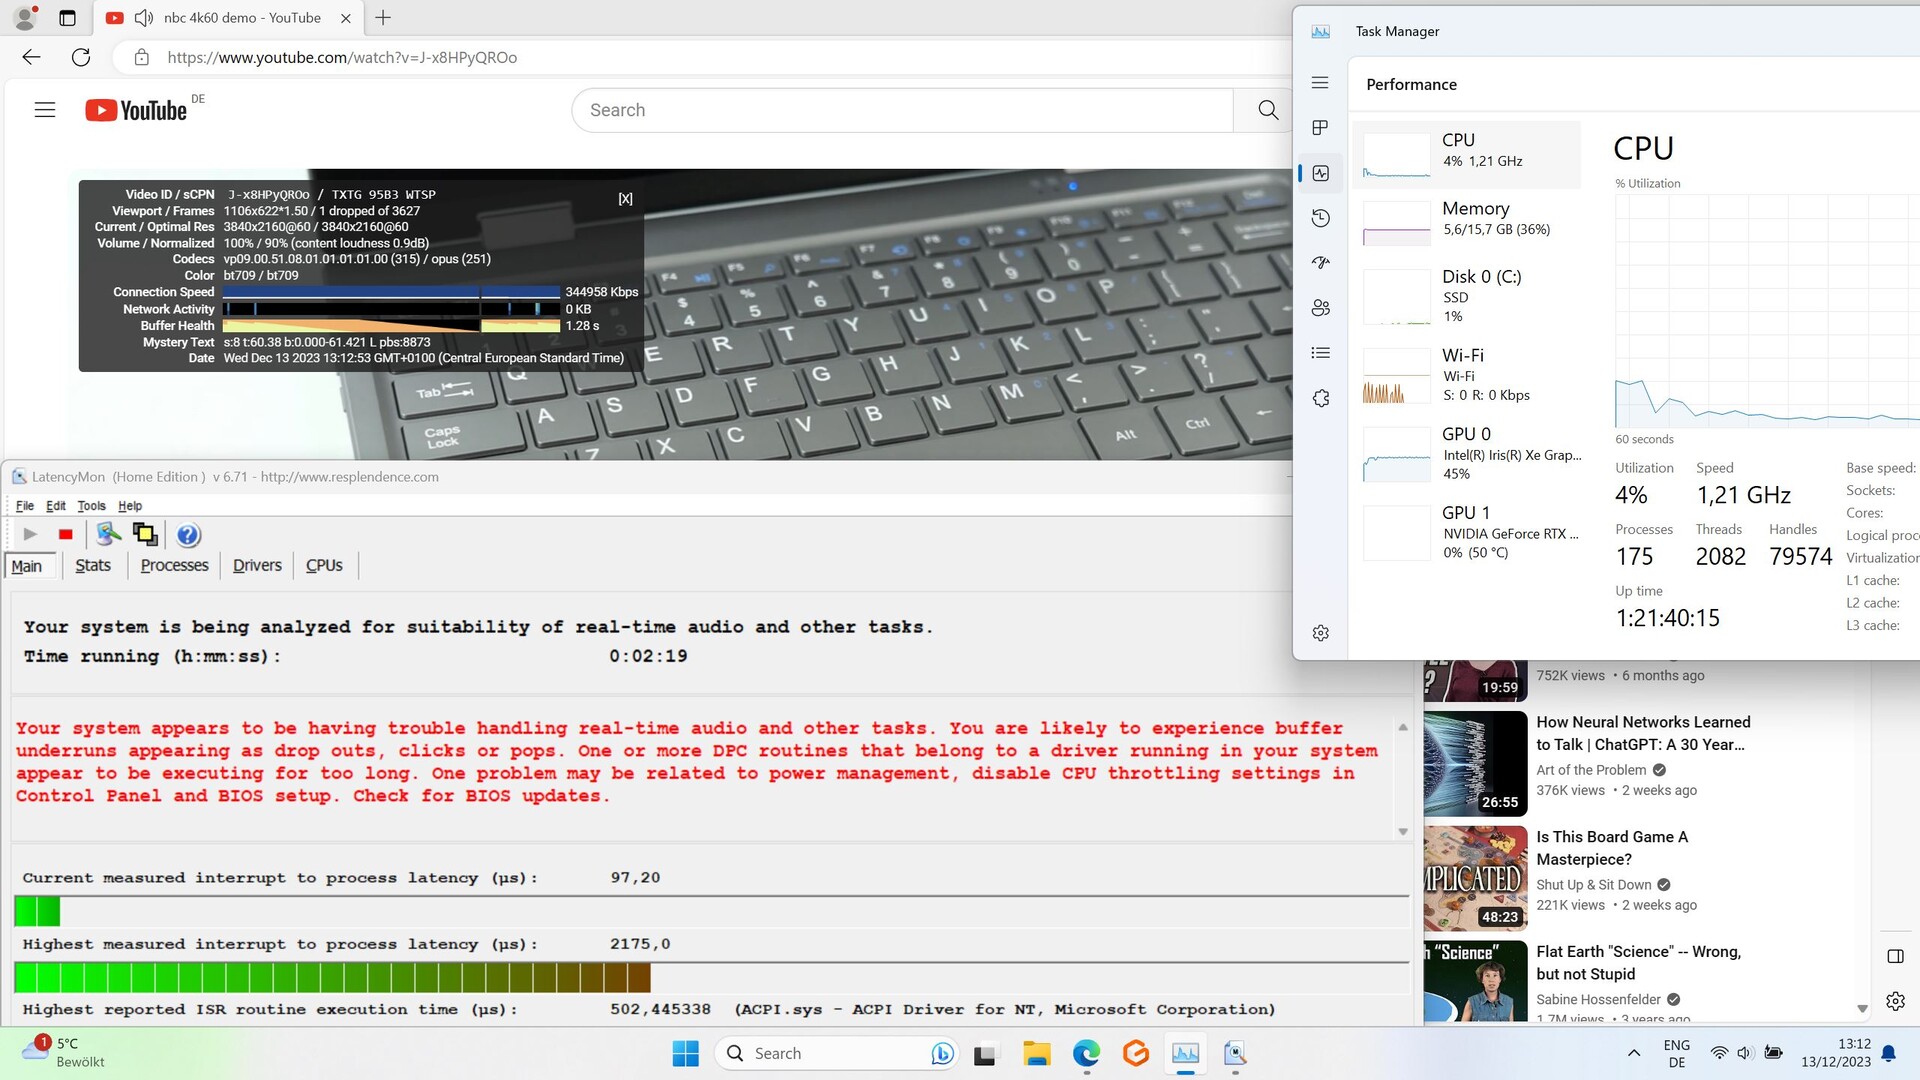
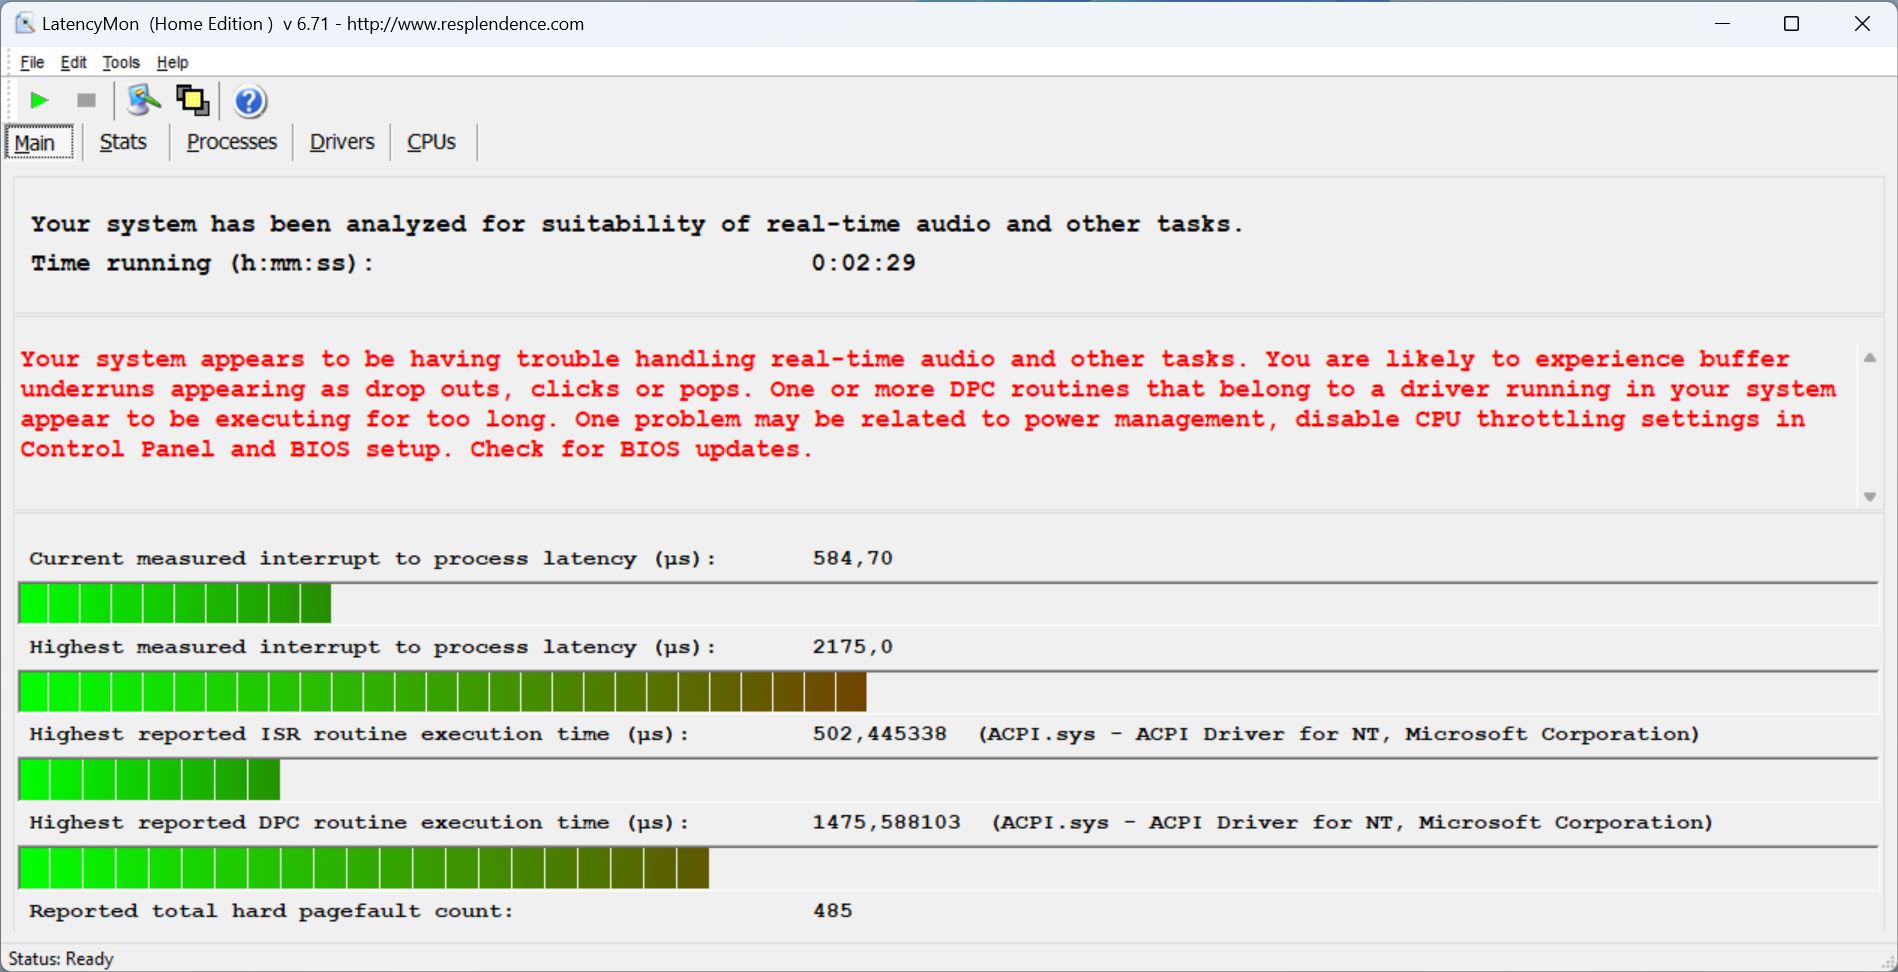
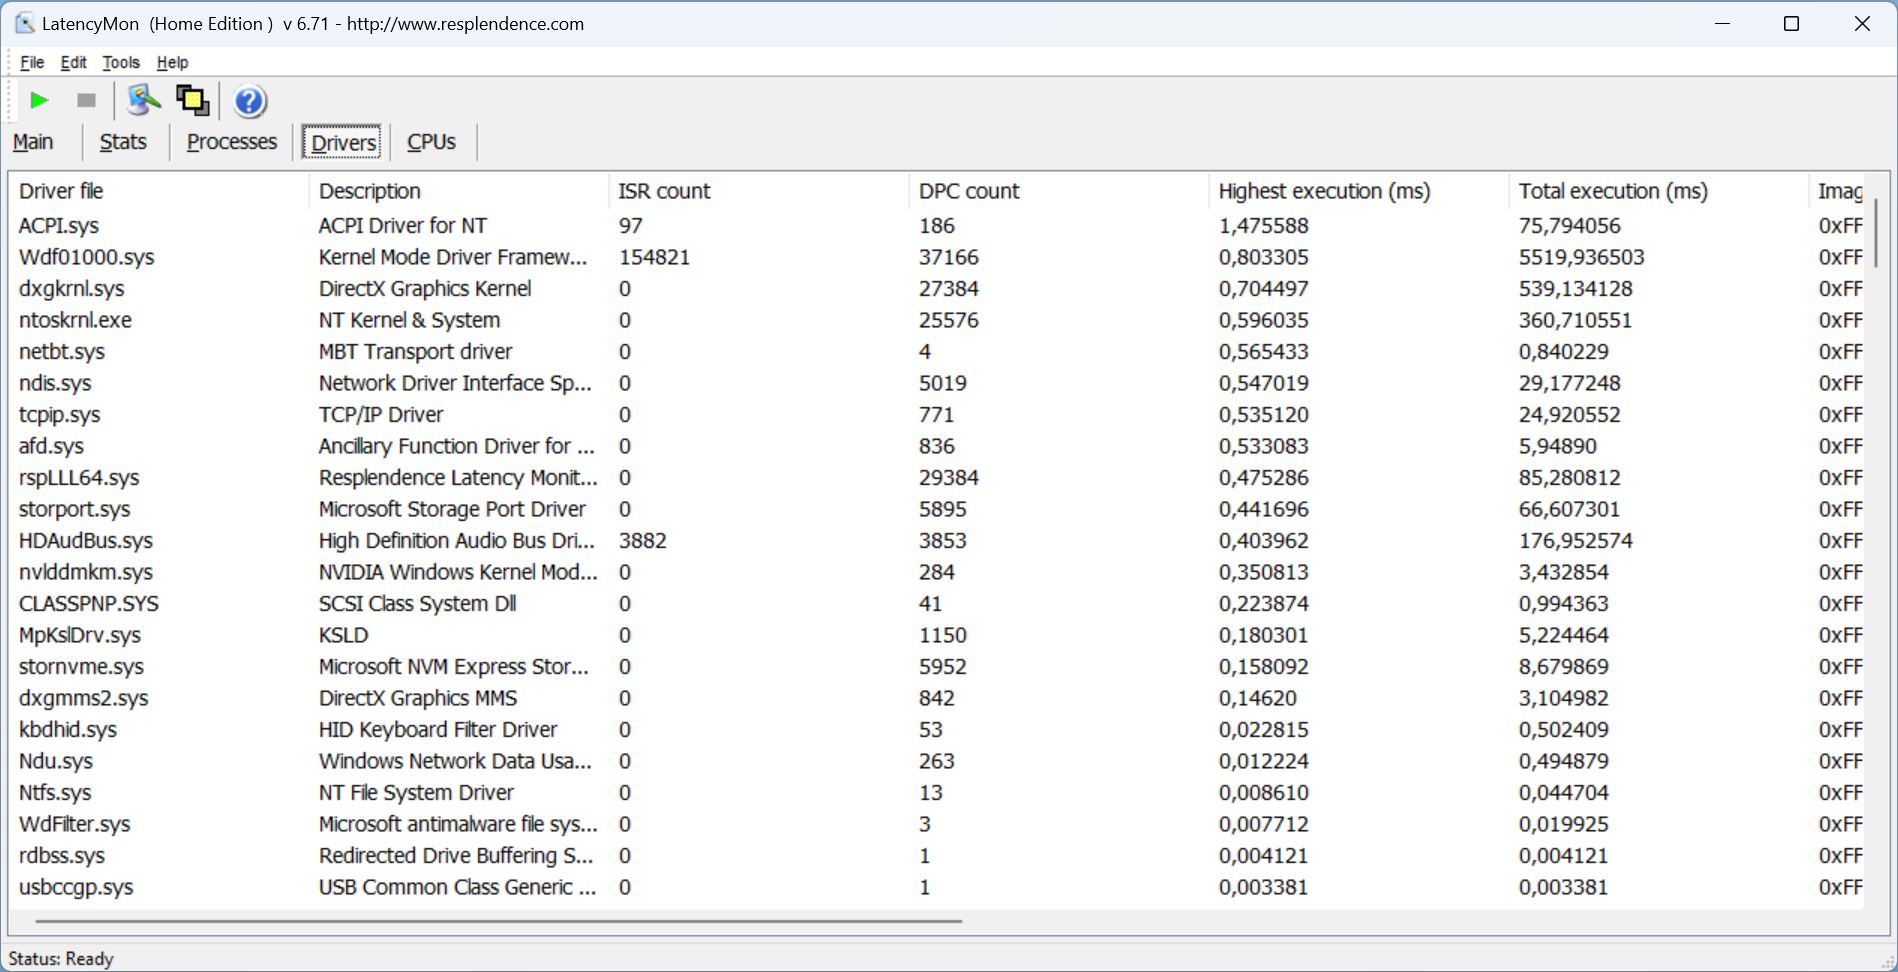
DPC gecikme süresi
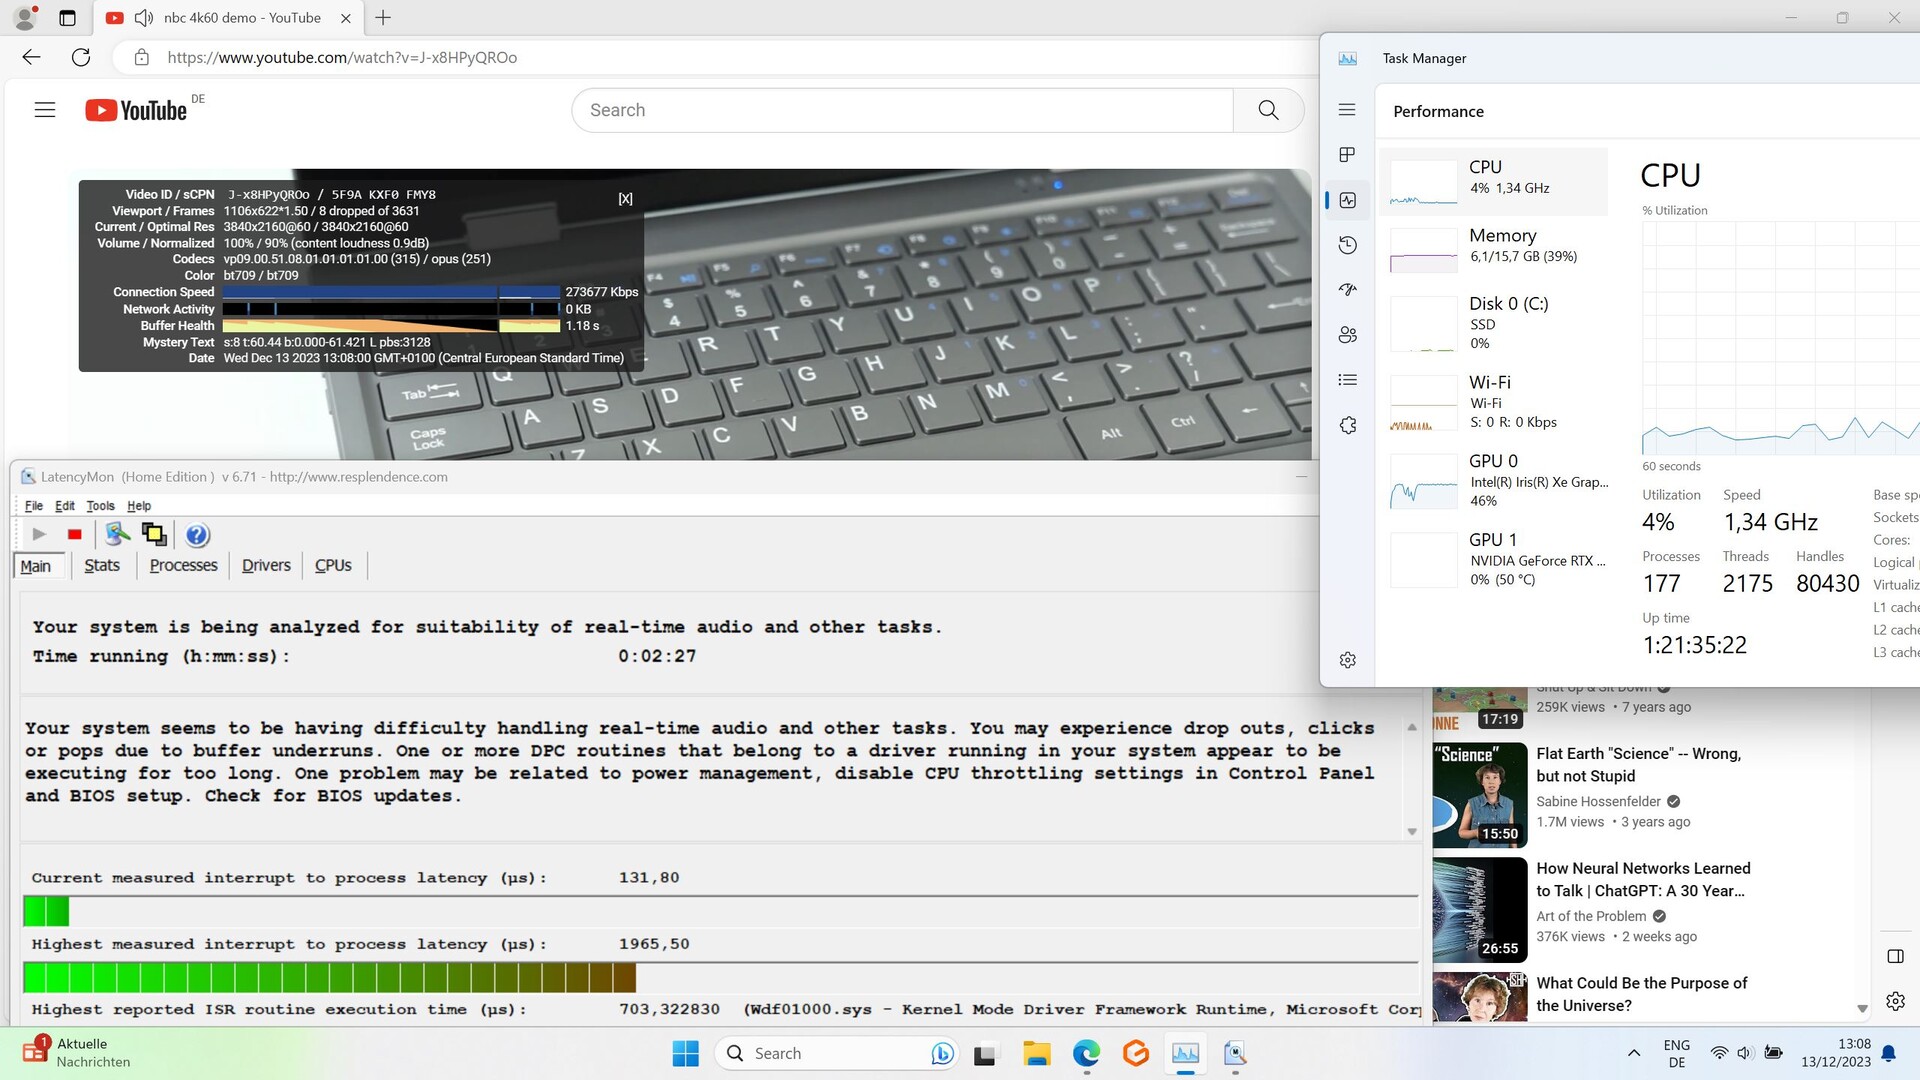
Kontrol Merkezi dengeli bir mod sunmadığından, dizüstü bilgisayarı toplantı ve içerik oluşturucu modlarını kullanarak test ettik. İlkinde birden fazla tarayıcı sekmesi açarken bazı gecikme sorunları ortaya çıktı. 4K/60 fps YouTube videosu sırasında bu sorunlar daha da arttı ve sekiz karenin düşmesine neden oldu.
Daha güçlü içerik oluşturucu modu kullanıldığında bu durumun değişebileceğini düşünüyorsanız maalesef yanılıyorsunuz. Tarayıcıyı açarken gecikmelerin arttığını zaten belirtmiştik. Öte yandan, video yalnızca bir kare düşerek çalıştı.
| DPC Latencies / LatencyMon - interrupt to process latency (max), Web, Youtube, Prime95 | |
| HP Omen 16-wf000 | |
| Aorus 15 YE5-54DEB34SH | |
| HP Victus 16-r0077ng | |
| Aorus 15 BSF | |
| Dell XPS 15 9530 RTX 4070 | |
| Captiva Advanced Gaming I74-121 | |
* ... daha küçük daha iyidir
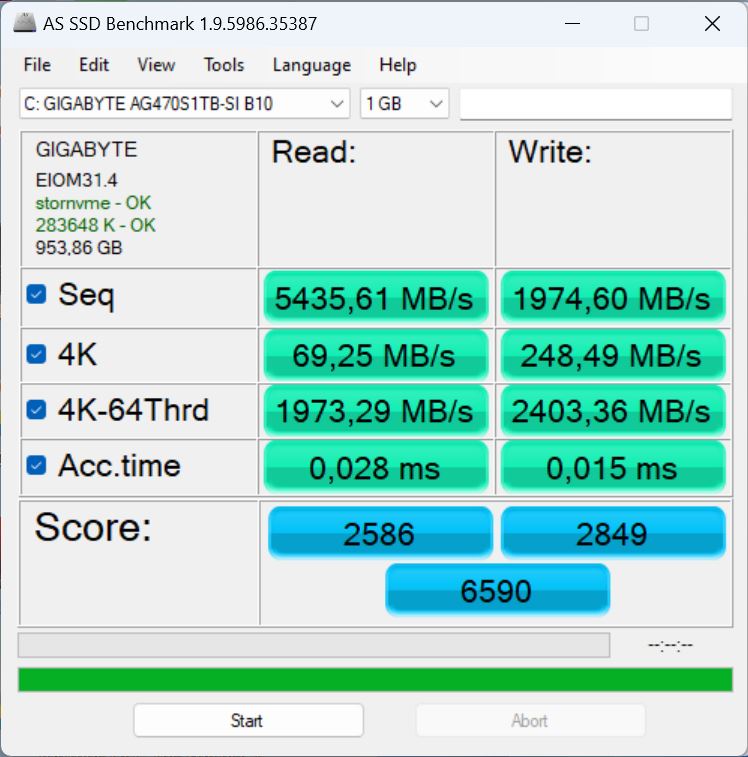
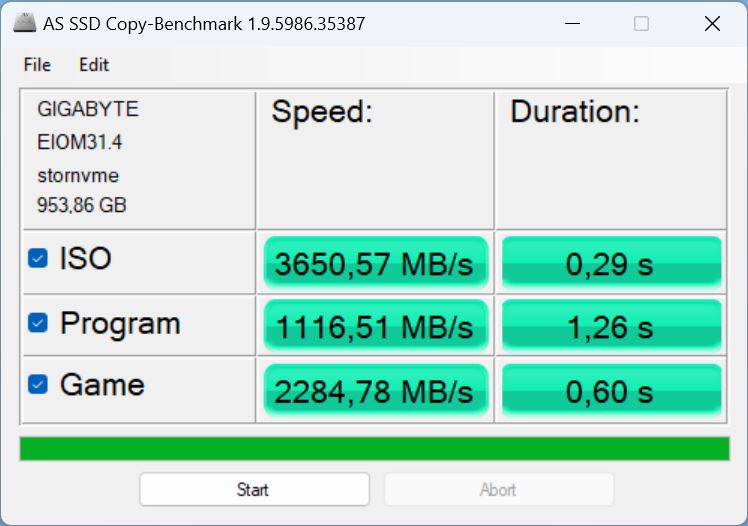
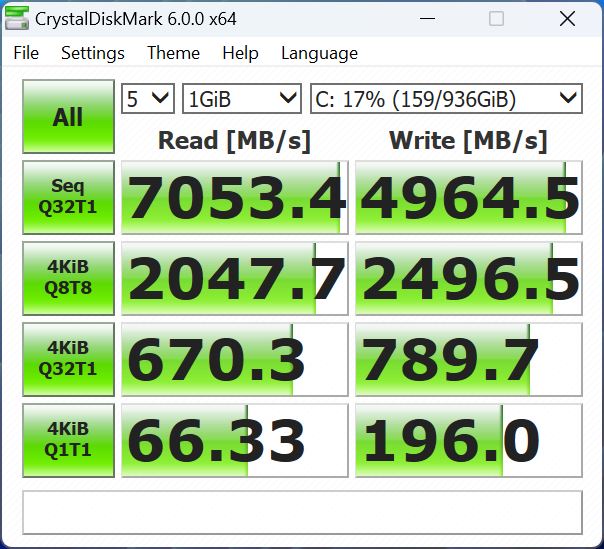
Depolama cihazları
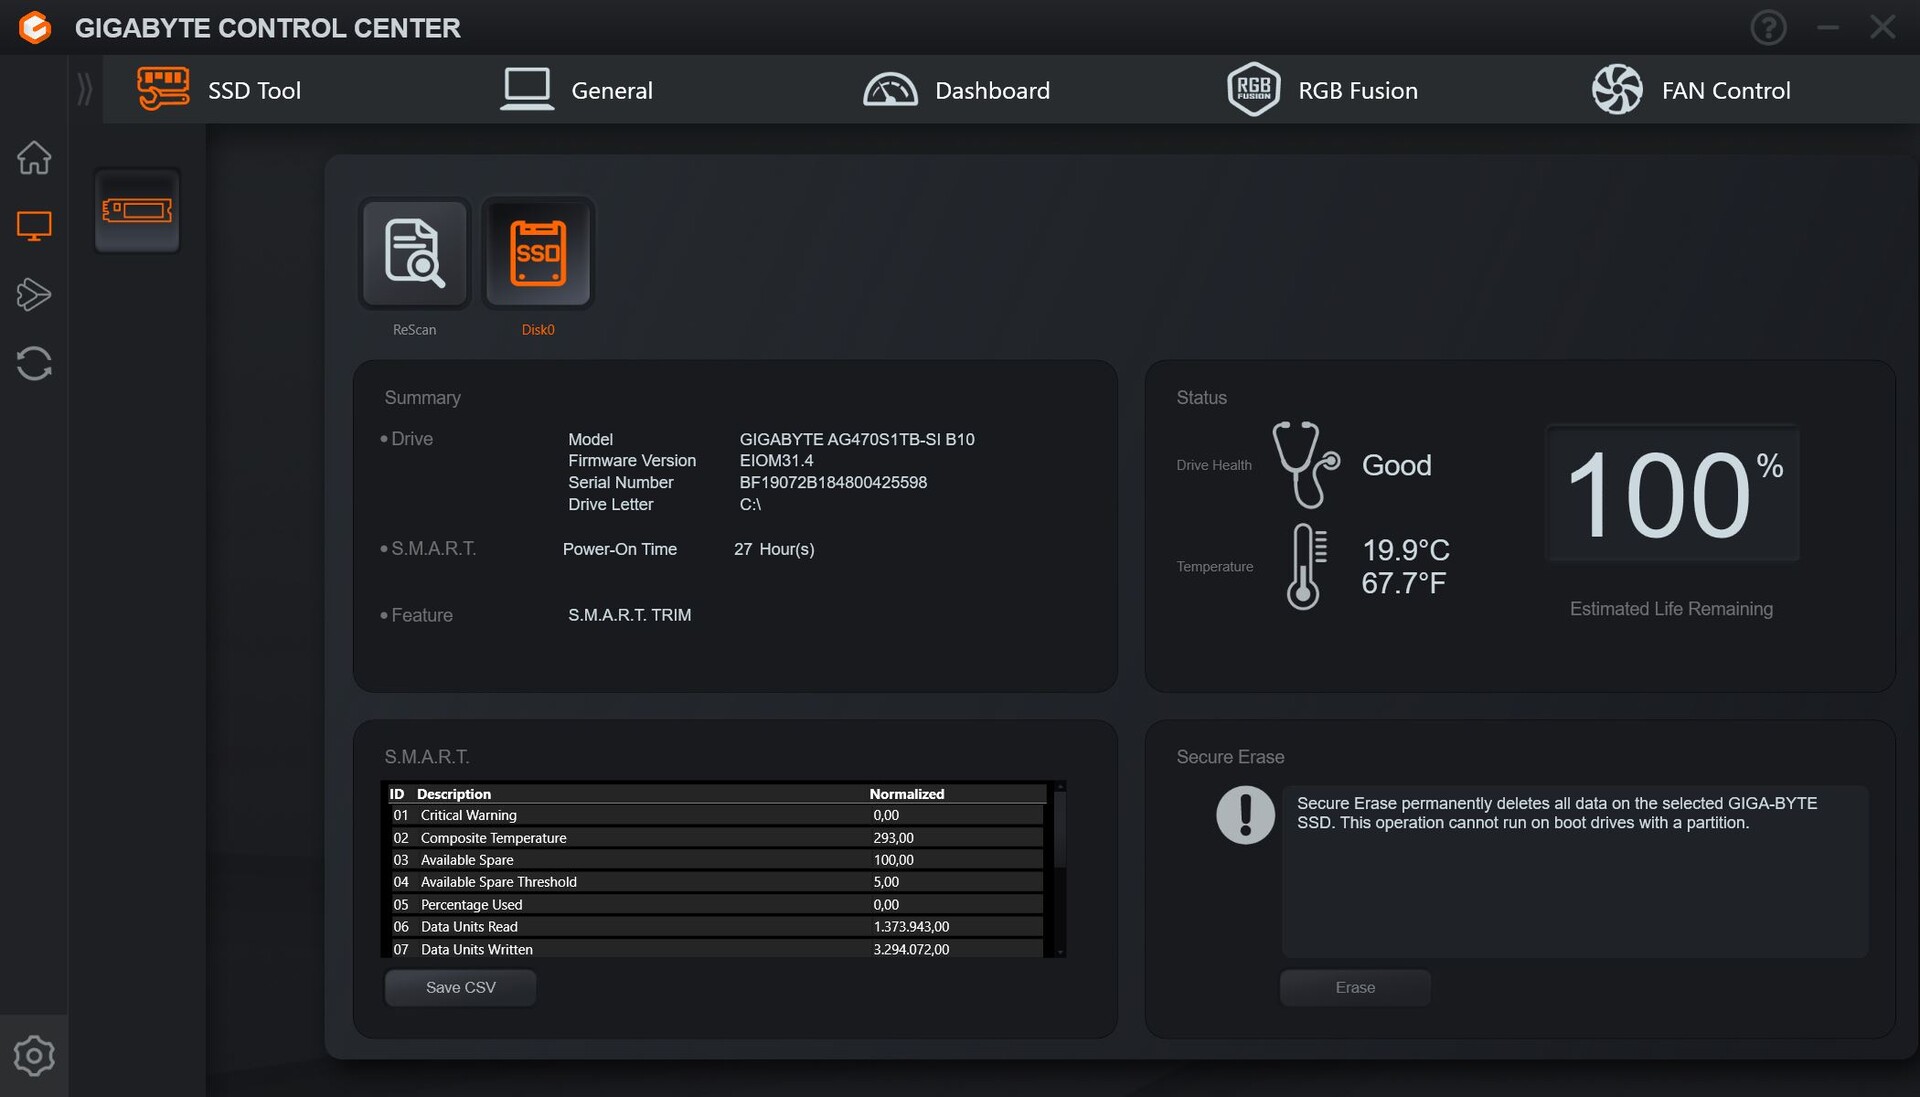
Kurulu Gigabyte AG470S1TB-SI B10, 1 TB depolama alanı ile hızlı bir üst düzey PCIe Gen 4 NVMe SSD'dir. Bizim SSD en iyi listesişu anda mükemmel olan 3. pozisyonda yer almaktadır.
Aorus 15 YE5 içinde, tam potansiyelini kullanamayabilir (referans modelin yüzde 12 gerisinde kalıyor), ancak yine de rakiplerinin SSD'lerinden daha hızlıdır. Bunun tek istisnası mevcut nesil Aorus 15'tir. Aynı SSD'yi kullanıyor ancak yüzde 28 daha hızlı. Buna rağmen, test örneğimizin performansı hala mükemmeldir ve her şeyden önemlisi, sürekli kullanım sırasında sabit kalmış ve herhangi bir yavaşlama sorunu göstermemiştir.

| Drive Performance rating - Percent | |
| Aorus 15 BSF | |
| Ortalama Gigabyte AG470S1TB-SI B10 | |
| Aorus 15 YE5-54DEB34SH | |
| Sınıf ortalaması Gaming | |
| HP Omen 16-wf000 | |
| Dell XPS 15 9530 RTX 4070 | |
| HP Victus 16-r0077ng | |
| Captiva Advanced Gaming I74-121 | |
* ... daha küçük daha iyidir
Reading continuous performance: DiskSpd Read Loop, Queue Depth 8
Grafik kartı
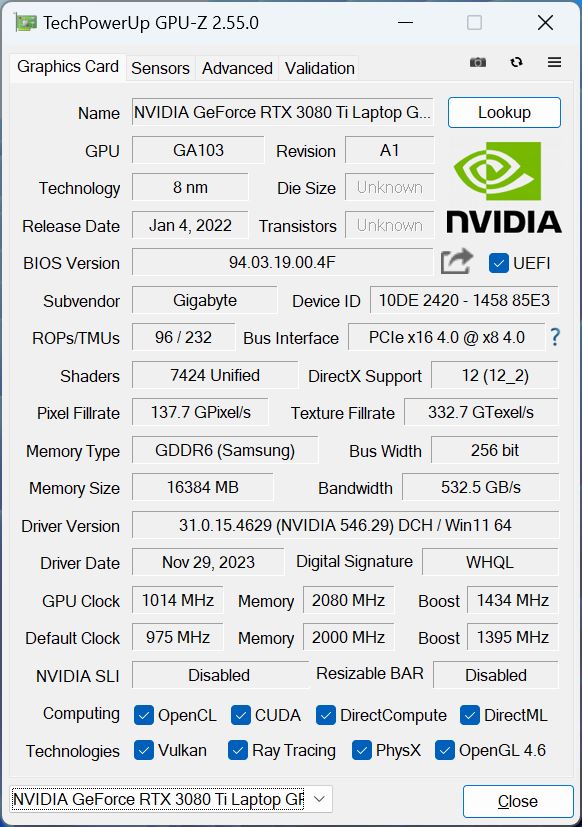
Eski amiral gemisi modeli Geforce RTX 3080 Ti 16 GB RAM ile dizüstü bilgisayarın grafik kartı olarak 3D hesaplamalardan sorumludur. Bununla birlikte, mümkün olan maksimum 165 watt'ın yalnızca 130 watt'ı verilmiştir. Güçlü Ampere çipi, mevcut Ada Lovelace mimarisi kadar verimli değil ve muhtemelen daha fazla ısı üretiyor.
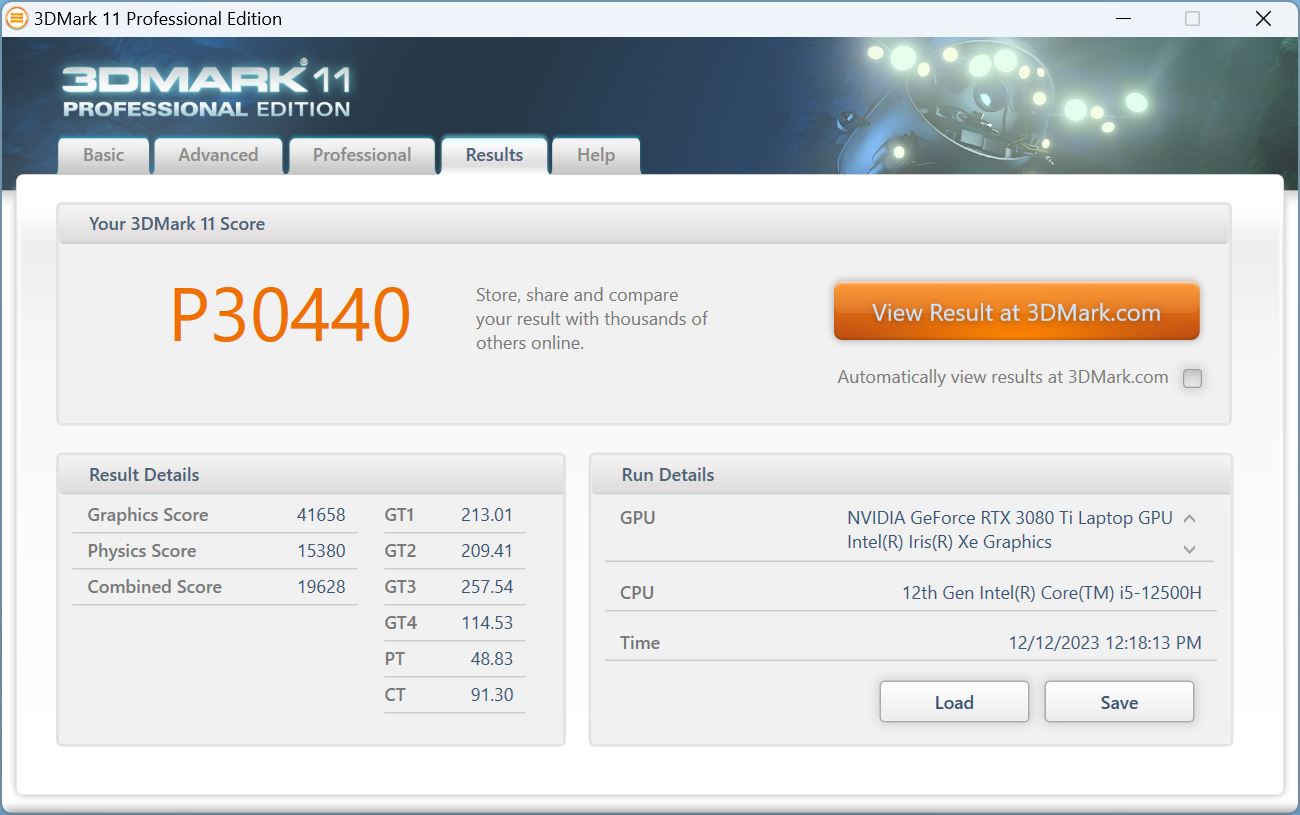
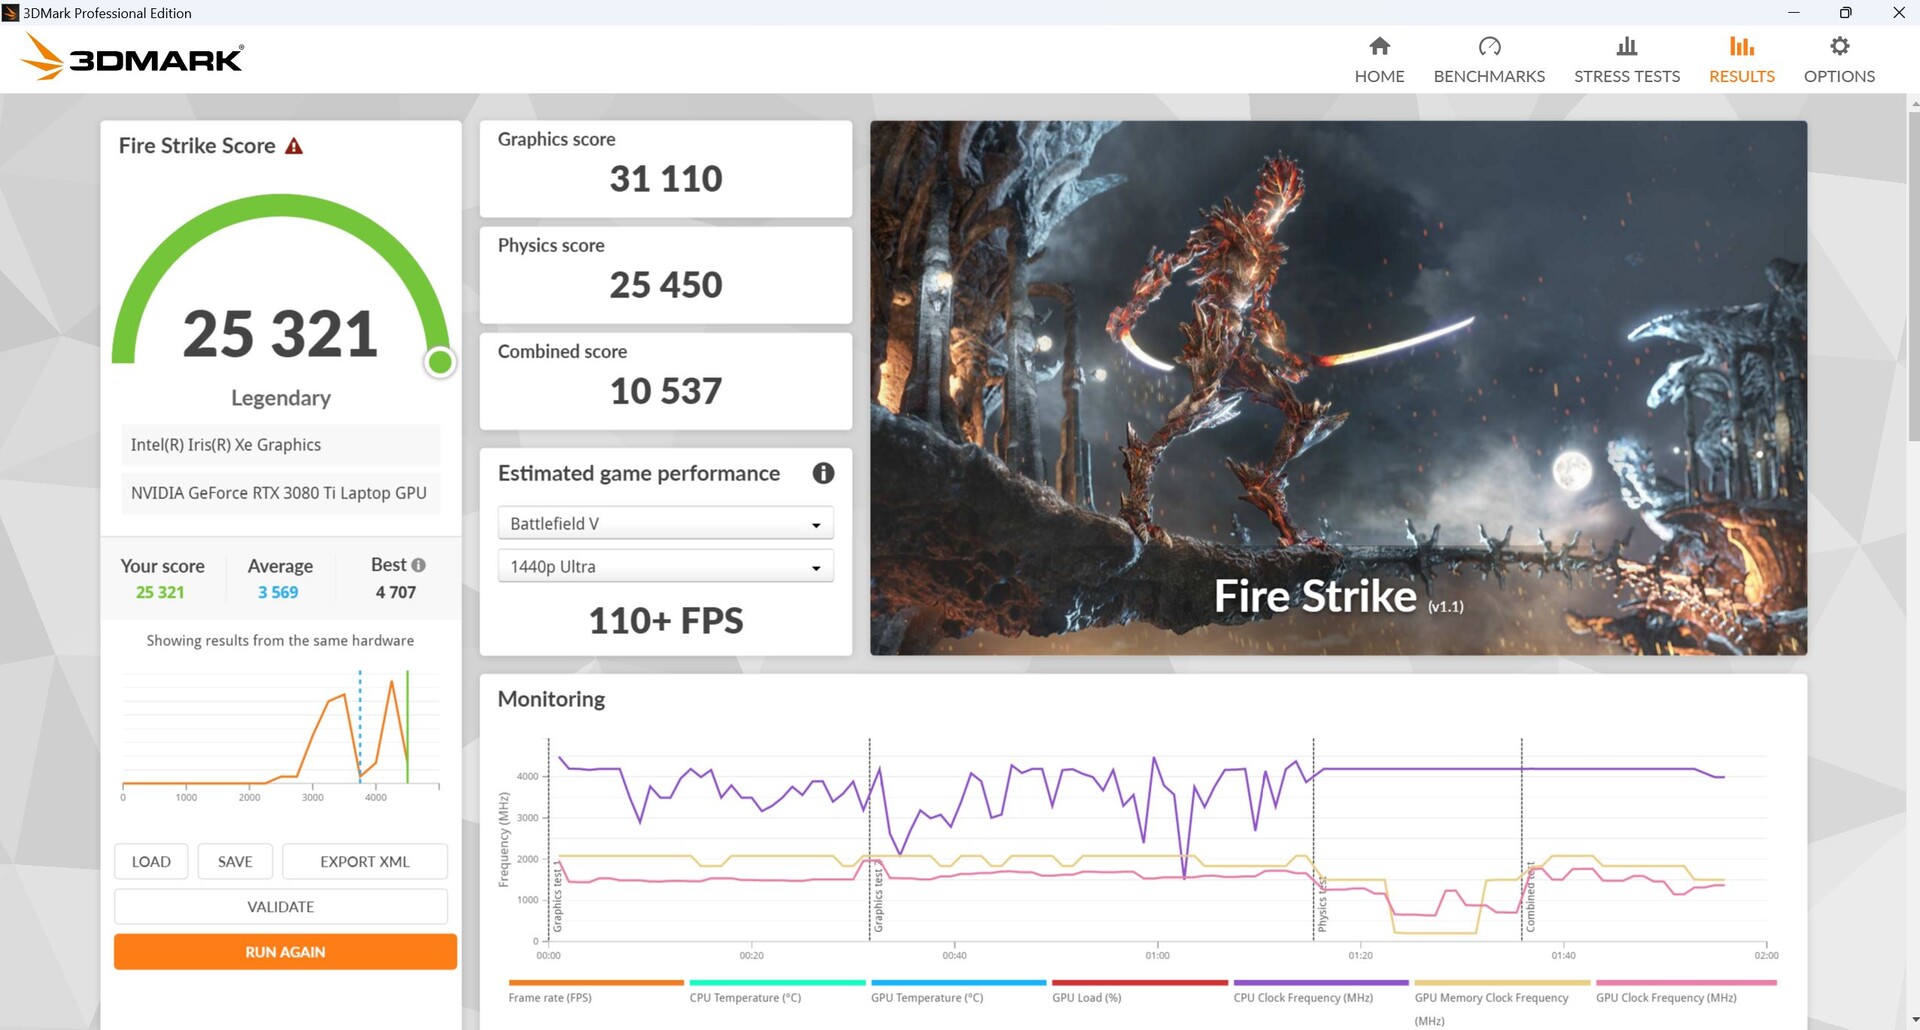
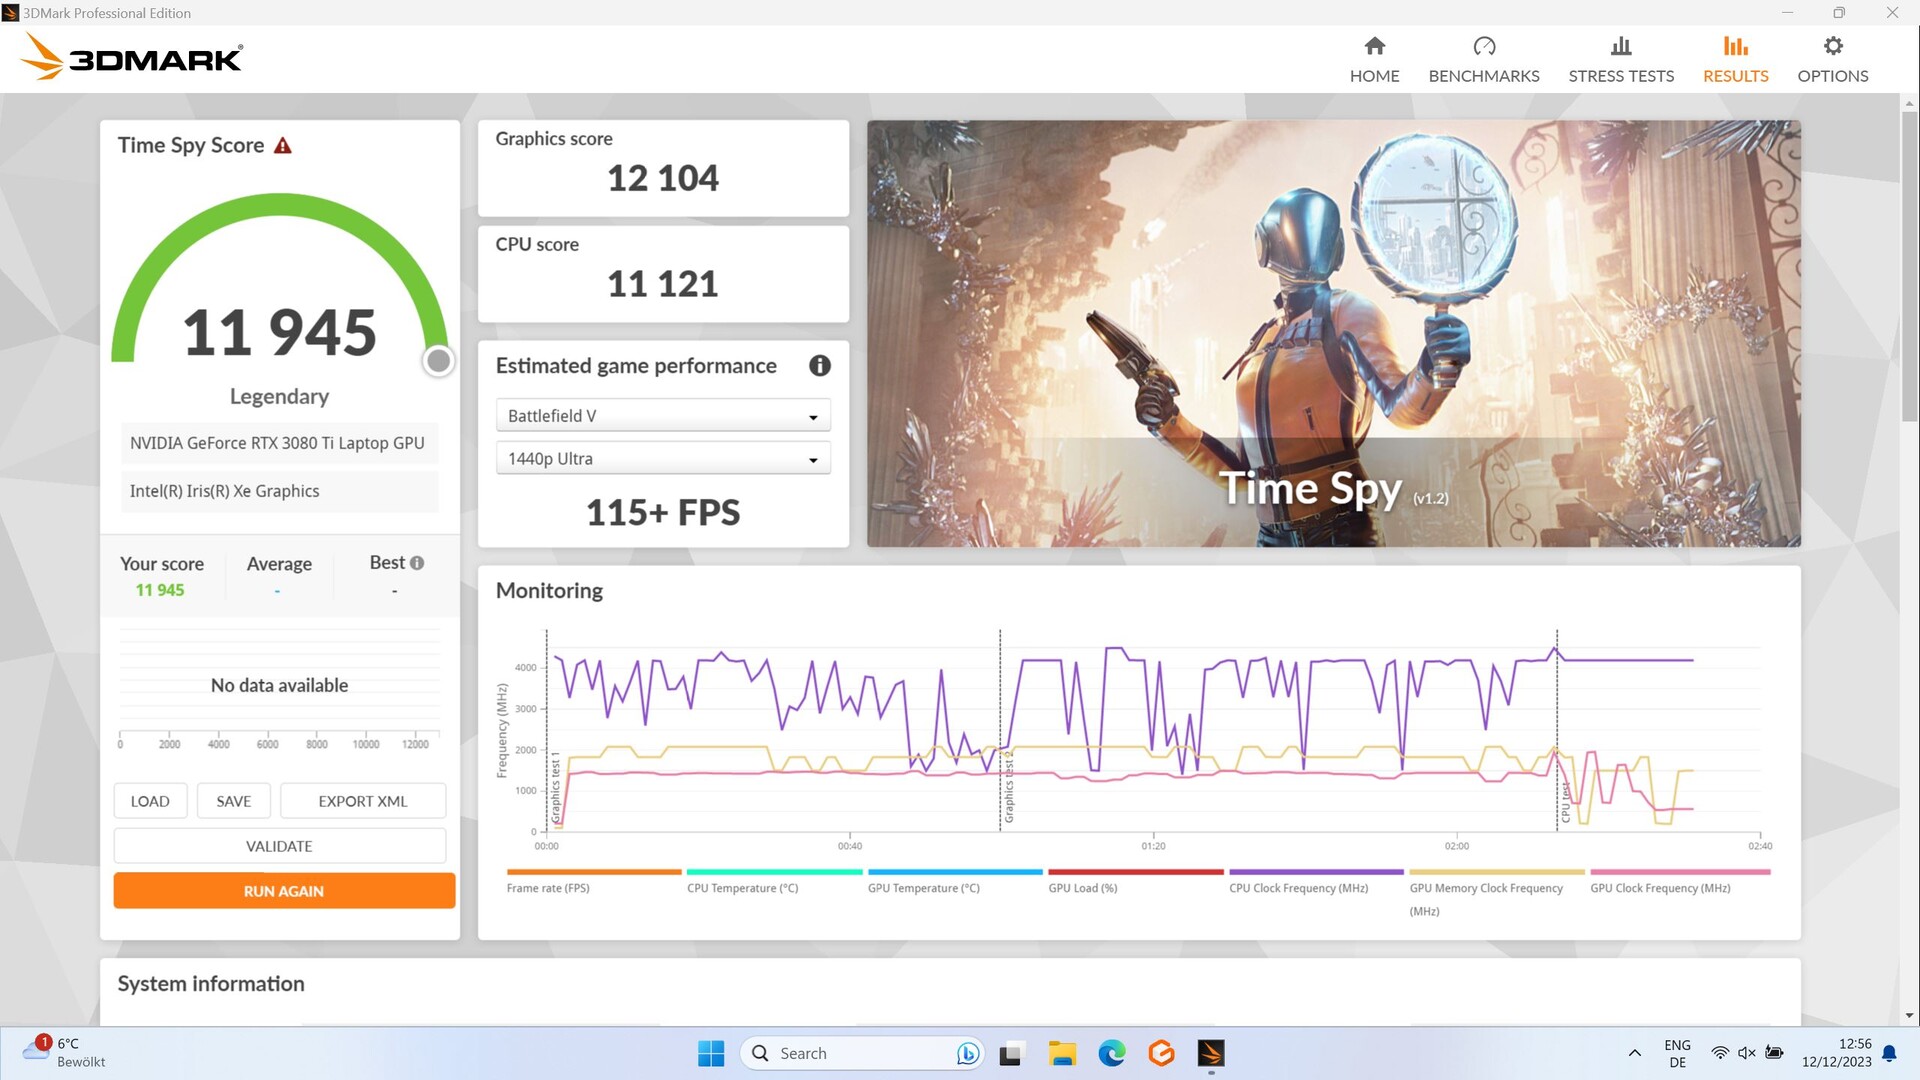
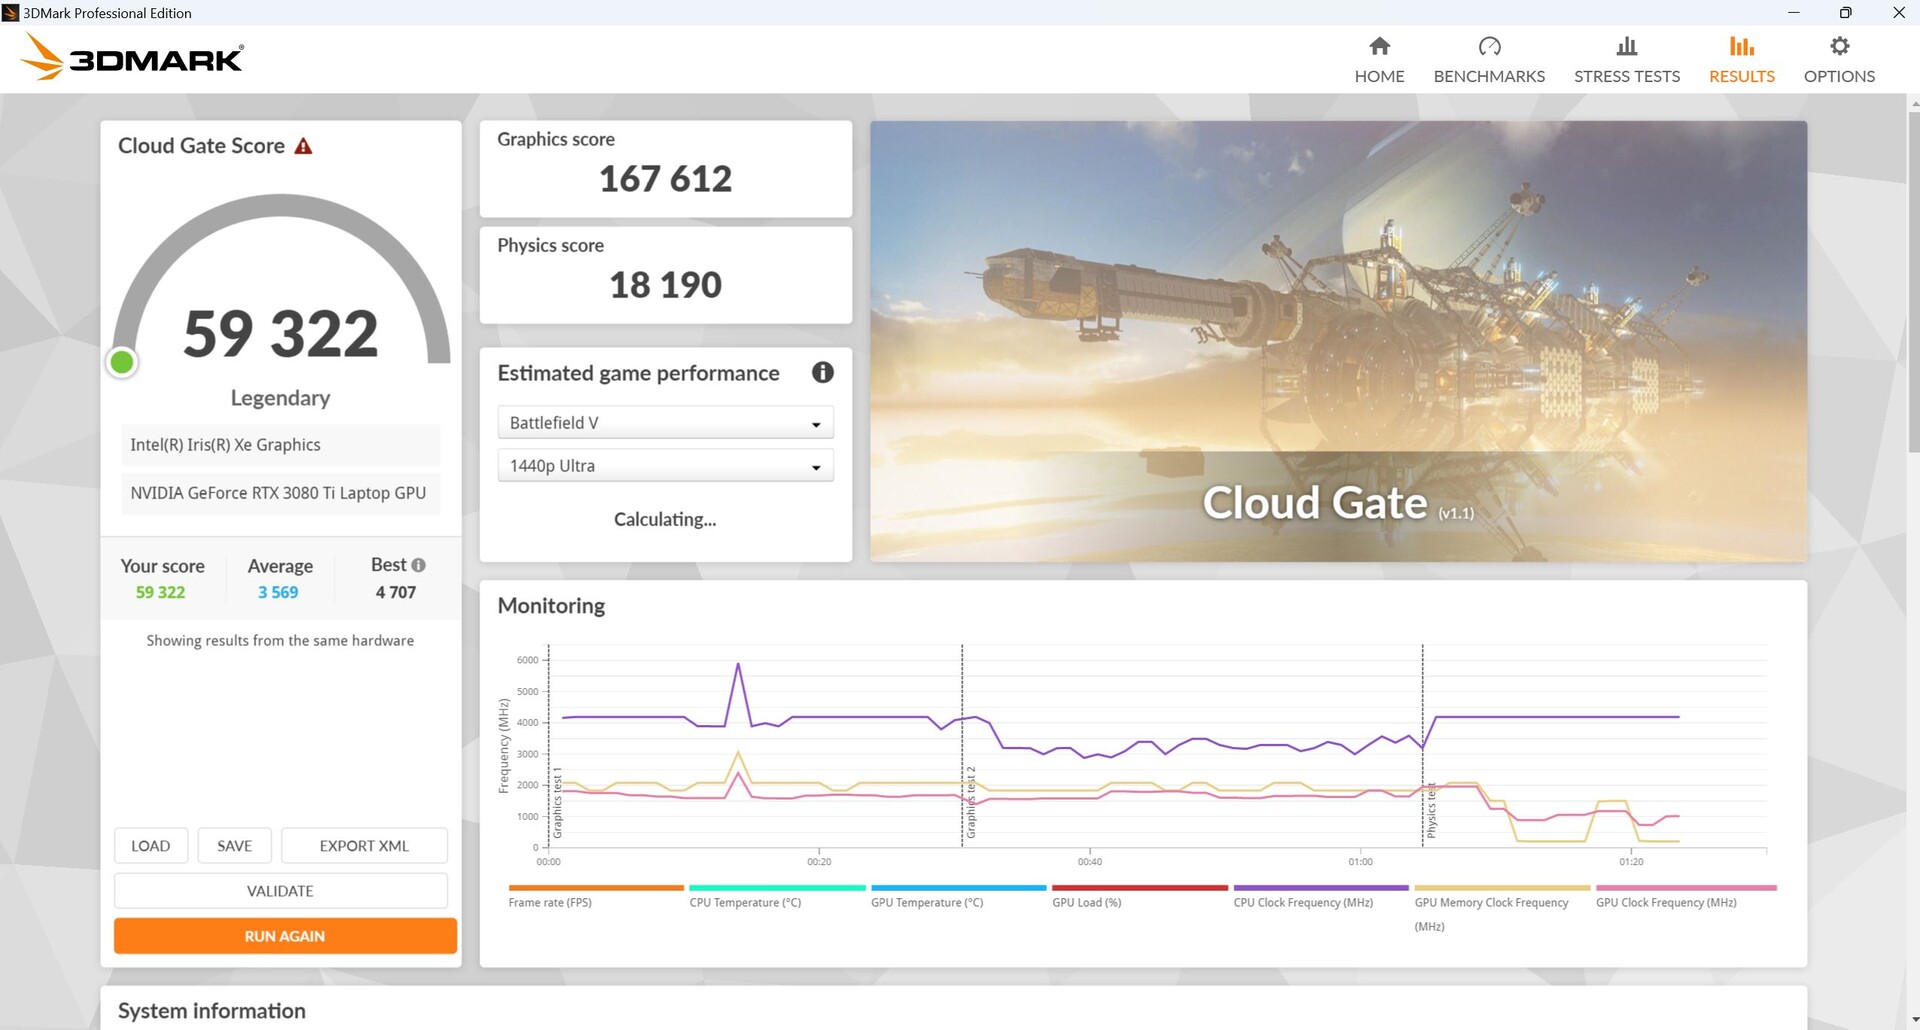
Sentetik 3DMark kıyaslamaları sırasında, Aorus'umuz mevcut nesil rakiplerinden daha iyi bir performans gösterdi RTX 4060 ve bir RTX 4070. RTX 3080 Ti neredeyse tüm testlerde - sadece birkaç puan farkla da olsa - önde geldi. Bununla birlikte, aralarındaki farklar oldukça küçüktür, ancak testler boyunca sabittir.
Pil modunda, Fire Strike adresindeki performansı 31.110'dan sadece 6.921 puana düşerek yüzde 78'lik büyük bir düşüş gösterdi!
| 3DMark Performance rating - Percent | |
| HP Omen 16-wf000 -1! | |
| Sınıf ortalaması Gaming | |
| Aorus 15 YE5-54DEB34SH | |
| Aorus 15 BSF | |
| HP Victus 16-r0077ng | |
| Captiva Advanced Gaming I74-121 | |
| Ortalama NVIDIA GeForce RTX 3080 Ti Laptop GPU | |
| Dell XPS 15 9530 RTX 4070 -1! | |
| 3DMark 11 Performance | 30440 puan | |
| 3DMark Cloud Gate Standard Score | 59322 puan | |
| 3DMark Fire Strike Score | 25321 puan | |
| 3DMark Time Spy Score | 11945 puan | |
Yardım | ||
* ... daha küçük daha iyidir
Oyun
Oyun oynarken Aorus'umuz rTX 4070 içeren yeni nesil Aorus ve hatta onu çok az bir farkla geçmeyi başardı. RTX 4070'e sahip diğer tüm rakipleri de kıl payı geride bıraktı. Bu RTX 4080 ile Omen 16 zirvede ulaşılamaz kaldı ve tüm oyun testlerinde ikinci sıradaki Aorus'tan yaklaşık yüzde 18 daha hızlıydı. CPU odaklı oyunlarda ise vasat performansı nedeniyle rakiplerinin gerisinde kaldı i5-12500H.
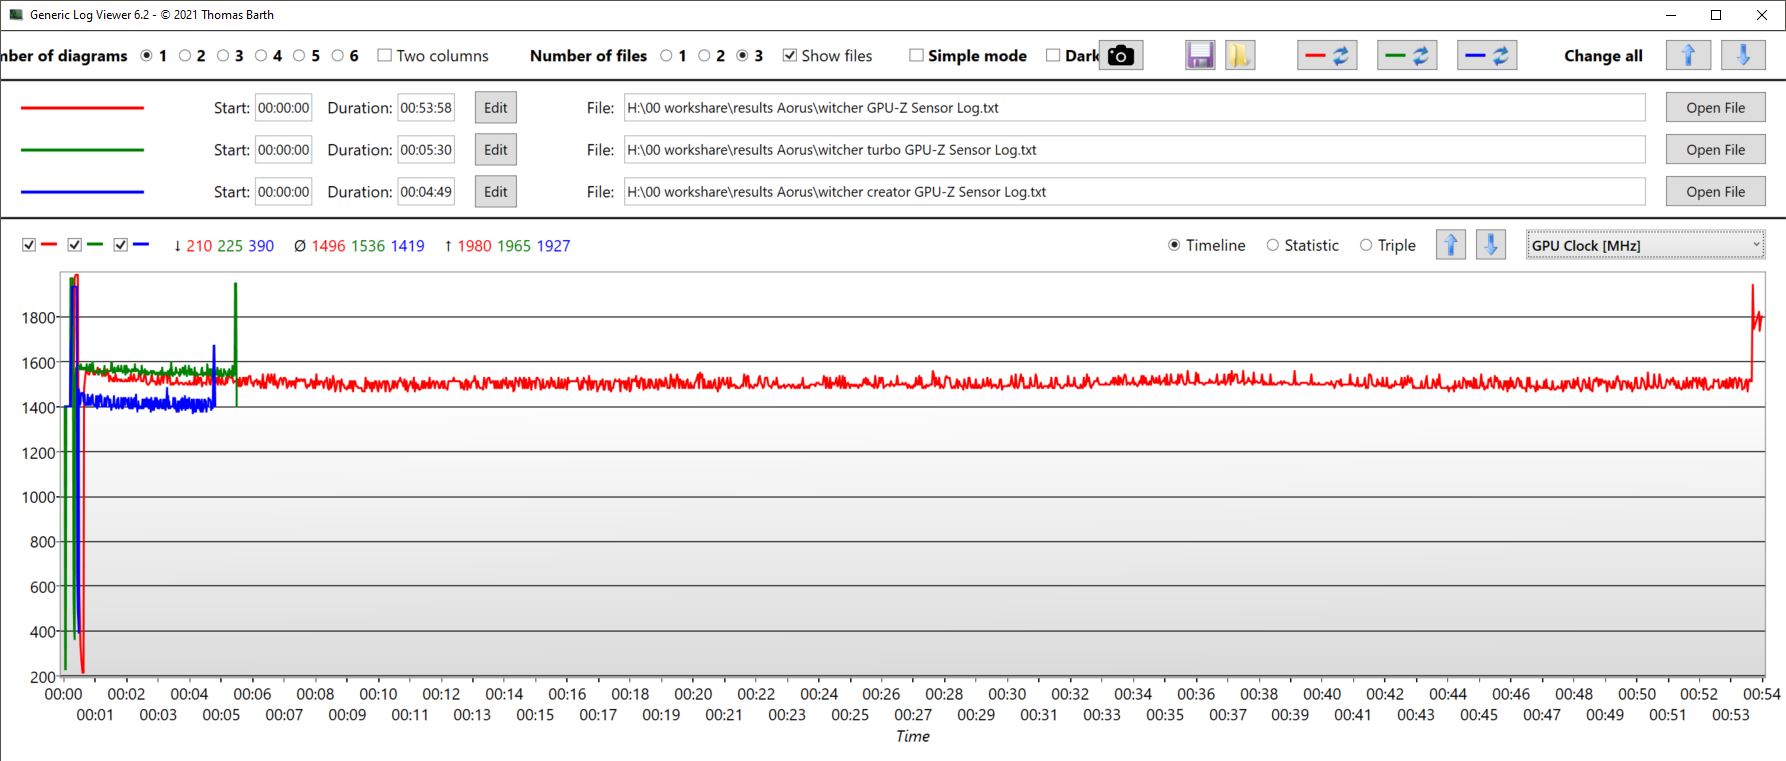
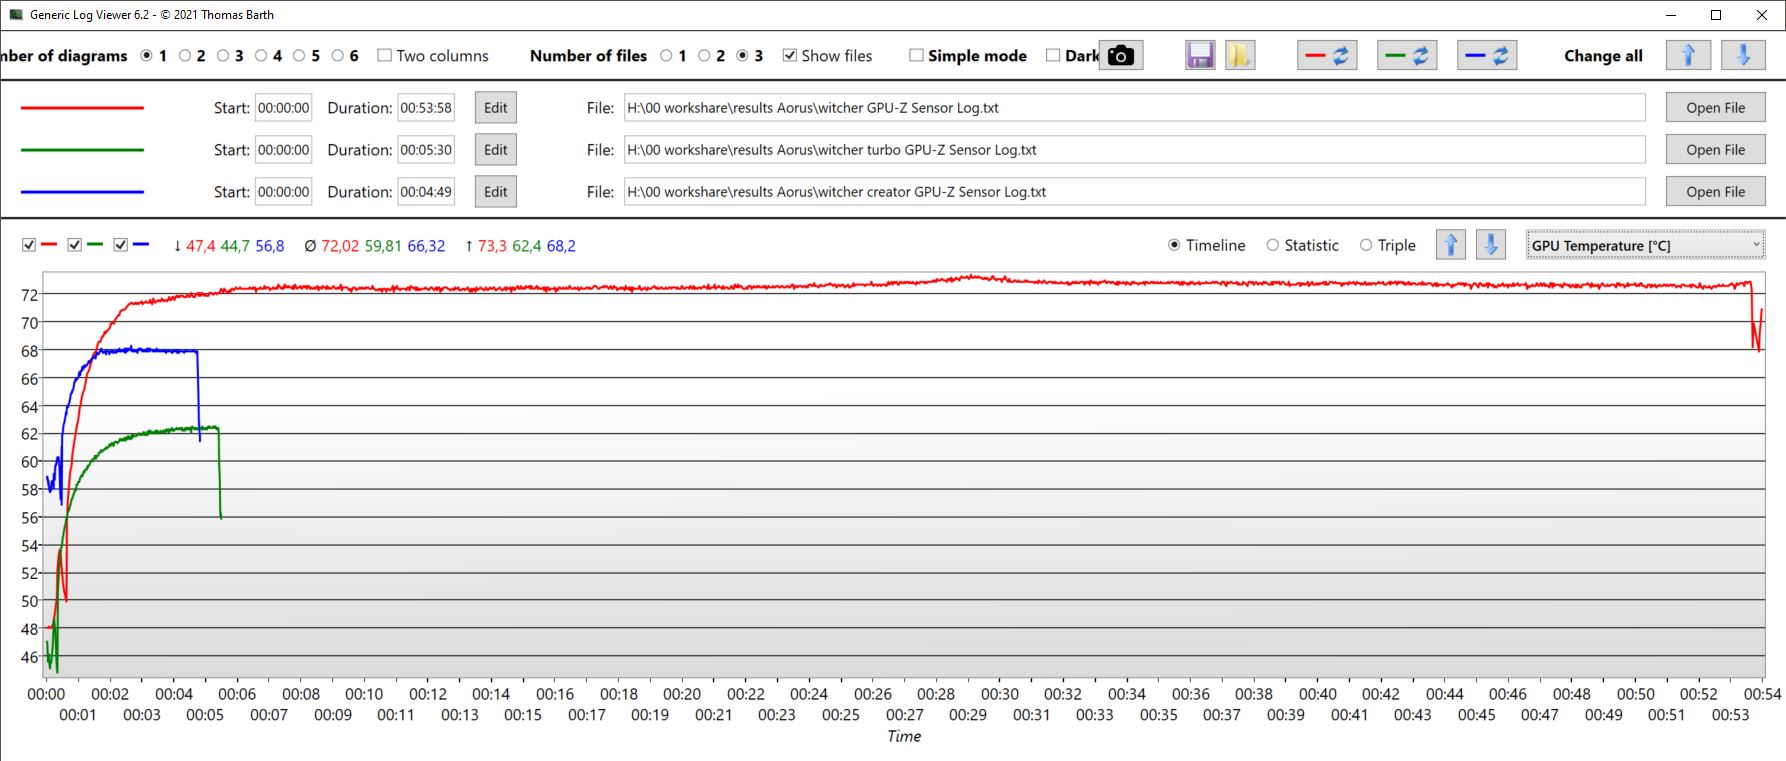
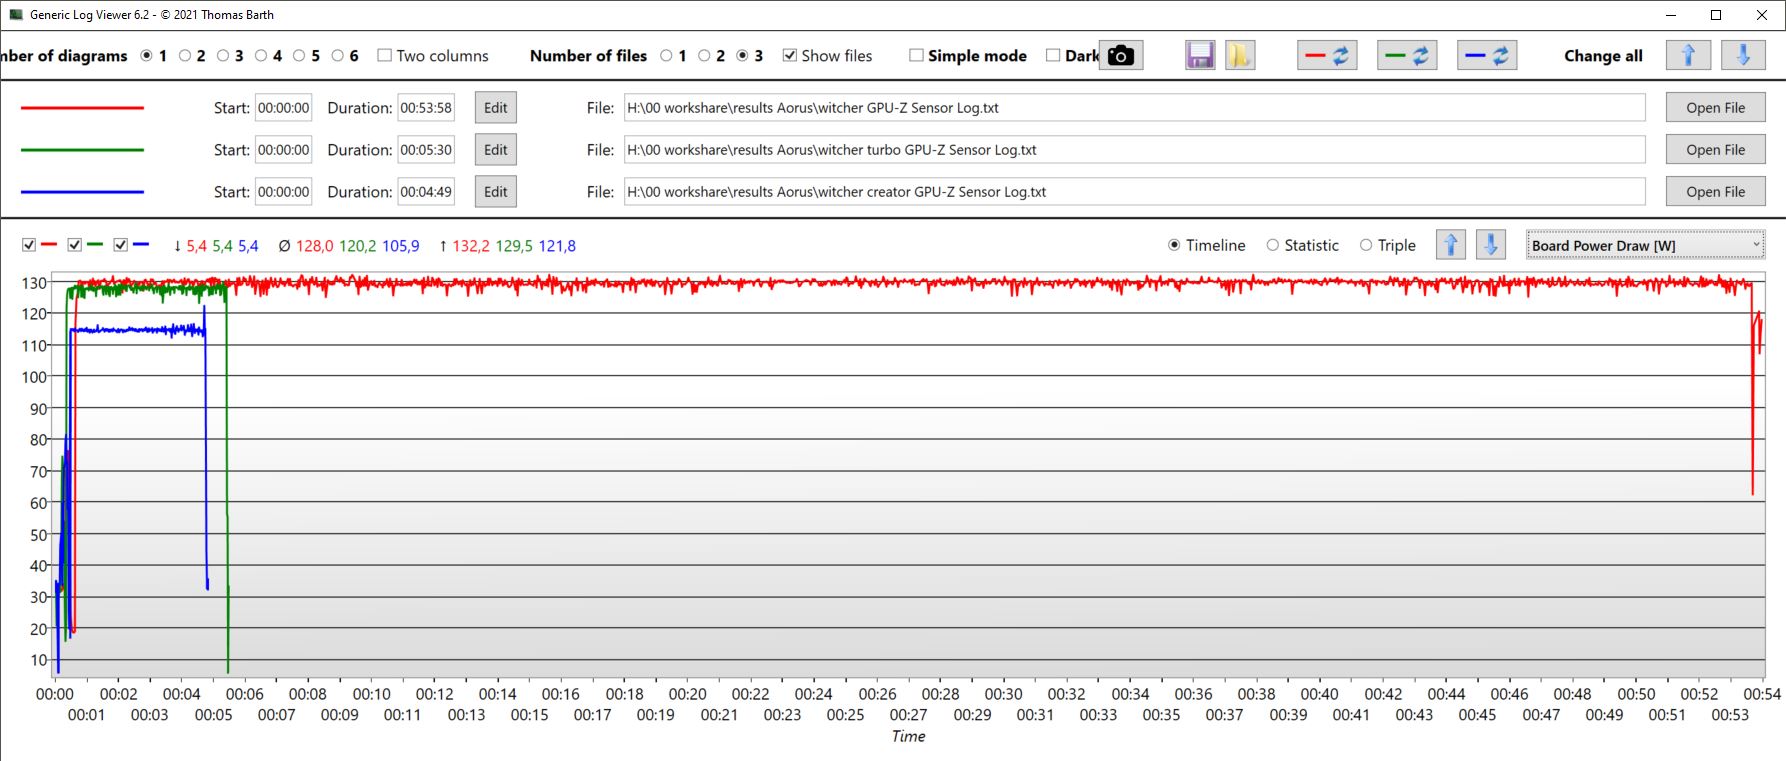
Modları karşılaştırırken, turbo, AI ve oyun modlarının hepsinin The Witcher 3'da neredeyse aynı GPU performansını sağladığı dikkat çekmektedir. Tek fark, GPU'nun turbo modunda önemli ölçüde daha soğuk kalması, ancak bu modun da önemli ölçüde daha yüksek olmasıdır.
Yaratıcı modu (bu sefer mavi eğri) biraz daha kötü performans gösterdi, çok fazla güç çekmedi ve biraz daha soğuk kaldı. Gürültü emisyonları bölümünde, modları ve bunların The Witcher 3 çalıştırılırken FPS ve gürültü emisyonları üzerindeki etkilerini listeledik.
| Performance rating - Percent | |
| Sınıf ortalaması Gaming | |
| HP Omen 16-wf000 | |
| Aorus 15 YE5-54DEB34SH -1! | |
| Aorus 15 BSF -1! | |
| Captiva Advanced Gaming I74-121 | |
| HP Victus 16-r0077ng | |
| Dell XPS 15 9530 RTX 4070 | |
| The Witcher 3 - 1920x1080 Ultra Graphics & Postprocessing (HBAO+) | |
| Sınıf ortalaması Gaming (104.7 - 240, n=7, son 2 yıl) | |
| HP Omen 16-wf000 | |
| Aorus 15 YE5-54DEB34SH | |
| Aorus 15 BSF | |
| HP Victus 16-r0077ng | |
| Captiva Advanced Gaming I74-121 | |
| Dell XPS 15 9530 RTX 4070 | |
| GTA V - 1920x1080 Highest AA:4xMSAA + FX AF:16x | |
| Sınıf ortalaması Gaming (48.3 - 186.9, n=94, son 2 yıl) | |
| Aorus 15 YE5-54DEB34SH | |
| Captiva Advanced Gaming I74-121 | |
| HP Omen 16-wf000 | |
| HP Victus 16-r0077ng | |
| Dell XPS 15 9530 RTX 4070 | |
| Final Fantasy XV Benchmark - 1920x1080 High Quality | |
| HP Omen 16-wf000 | |
| Sınıf ortalaması Gaming (41 - 215, n=95, son 2 yıl) | |
| Aorus 15 YE5-54DEB34SH | |
| Aorus 15 BSF | |
| HP Victus 16-r0077ng | |
| Captiva Advanced Gaming I74-121 | |
| Dell XPS 15 9530 RTX 4070 | |
| Strange Brigade - 1920x1080 ultra AA:ultra AF:16 | |
| HP Omen 16-wf000 | |
| Sınıf ortalaması Gaming (76.3 - 458, n=87, son 2 yıl) | |
| Aorus 15 BSF | |
| HP Victus 16-r0077ng | |
| Captiva Advanced Gaming I74-121 | |
| Dell XPS 15 9530 RTX 4070 | |
| Dota 2 Reborn - 1920x1080 ultra (3/3) best looking | |
| HP Omen 16-wf000 | |
| Sınıf ortalaması Gaming (84.8 - 248, n=107, son 2 yıl) | |
| Aorus 15 BSF | |
| Captiva Advanced Gaming I74-121 | |
| Aorus 15 YE5-54DEB34SH | |
| Dell XPS 15 9530 RTX 4070 | |
| HP Victus 16-r0077ng | |
| X-Plane 11.11 - 1920x1080 high (fps_test=3) | |
| HP Omen 16-wf000 | |
| Aorus 15 BSF | |
| Captiva Advanced Gaming I74-121 | |
| Sınıf ortalaması Gaming (55.5 - 143.5, n=109, son 2 yıl) | |
| HP Victus 16-r0077ng | |
| Aorus 15 YE5-54DEB34SH | |
| Dell XPS 15 9530 RTX 4070 | |
Witcher 3 FPS diagram
| düşük | orta | yüksek | ultra | QHD | 4K | |
|---|---|---|---|---|---|---|
| GTA V (2015) | 184.4 | 180.8 | 176 | 118 | ||
| The Witcher 3 (2015) | 385 | 306 | 222 | 120 | 86 | |
| Dota 2 Reborn (2015) | 167.6 | 154.1 | 146.4 | 138.9 | 140.1 | |
| Final Fantasy XV Benchmark (2018) | 206 | 151.7 | 119.2 | 92.2 | ||
| X-Plane 11.11 (2018) | 134.1 | 121.3 | 94.9 | 85.4 | ||
| Far Cry 5 (2018) | 165 | 137 | 131 | 124 | 116 |
Emisyonlar ve güç - RTX 3080 Ti'nin önerebileceğinden daha iyi
Gürültü emisyonları
Turbo modunda, fanlar her zaman sınırlarına yakındır, yani 52 ila 55 dB. Diğer modlarda, fanlar daha durumsal olarak çalışır. Aşağıdaki tablo, yaklaşık 10 dakika The Witcher 3 oynatıldıktan sonra farklı modların gürültü emisyon seviyelerini listelemektedir. Genel olarak, emisyonları performansına göre ılımlı olarak tanımlanabilir ve birçok mod sayesinde çok değişken bir şekilde ayarlanabilir. Her iki Captiva ve HP Victus 3D uygulamalarda daha kötü performans gösterir ancak benzer şekilde gürültülüdür - Captiva daha da gürültülüdür.
Oyun modunda, fanlar sessiz de olsa dizüstü bilgisayar rölantideyken de aktiftir. Toplantı modunda veya Güç Tasarrufunda genellikle sessizdirler. Oyun modu seçiliyken simüle edilen ortalama yük senaryosu (3DMark06) sırasında, gürültü emisyonları kademeli olarak 43 dB'ye kadar yükseldi. Güç Tasarrufu'nda ise aynı test sadece 27 dB'de gerçekleştirilmiştir.
| Performans modu/Witcher 3 | Maksimum kare hızı | Ortalama kare hızı | dB cinsinden gürültü emisyonları | Watt cinsinden tüketim |
|---|---|---|---|---|
| Turbo | 124 | 118 | 52,68 | 199 |
| AI | 122 | 116 | 44,78 | 197 |
| Oyun | 125 | 116 | 46,77 | 196 |
| Yaratıcı | 115 | 110 | 44,78 | 185 |
| Toplantı | 111 | 105 | 36,53 | 163 |
| Güç Tasarrufu | 115 | 106 | 36,53 | 162 |
Ses yüksekliği
| Boşta |
| 23 / 23 / 26.42 dB |
| Çalışırken |
| 43.5 / 50.21 dB |
 | ||
30 dB sessiz 40 dB(A) duyulabilirlik 50 dB(A) gürültülü |
||
min: | ||
| Aorus 15 YE5-54DEB34SH GeForce RTX 3080 Ti Laptop GPU, i5-12500H, Gigabyte AG470S1TB-SI B10 | Aorus 15 BSF GeForce RTX 4070 Laptop GPU, i7-13700H, Gigabyte AG470S1TB-SI B10 | Captiva Advanced Gaming I74-121 GeForce RTX 4060 Laptop GPU, i5-13500H, Samsung SSD 980 1TB MZ-V8V1T0BW | HP Victus 16-r0077ng GeForce RTX 4070 Laptop GPU, i7-13700H, Kioxia XG8 KXG80ZNV1T02 | Dell XPS 15 9530 RTX 4070 GeForce RTX 4070 Laptop GPU, i7-13700H, SK hynix PC801 HFS001TEJ9X101N | HP Omen 16-wf000 GeForce RTX 4080 Laptop GPU, i7-13700HX, SK hynix PC801 HFS002TEJ9X101N | |
|---|---|---|---|---|---|---|
| Noise | -20% | -3% | -9% | 10% | -13% | |
| kapalı / ortam * (dB) | 23 | 24 -4% | 23 -0% | 25 -9% | 23.1 -0% | 23 -0% |
| Idle Minimum * (dB) | 23 | 25 -9% | 23 -0% | 28 -22% | 23.1 -0% | 29.6 -29% |
| Idle Average * (dB) | 23 | 31 -35% | 25.67 -12% | 29 -26% | 23.1 -0% | 29.8 -30% |
| Idle Maximum * (dB) | 26.42 | 37 -40% | 25.67 3% | 30 -14% | 24.2 8% | 30.4 -15% |
| Load Average * (dB) | 43.5 | 51 -17% | 38.52 11% | 43 1% | 27.1 38% | 33.8 22% |
| Witcher 3 ultra * (dB) | 46.77 | 54.17 -16% | 46 2% | 40.1 14% | 57 -22% | |
| Load Maximum * (dB) | 50.21 | 57 -14% | 54.17 -8% | 48 4% | 44.6 11% | 58.3 -16% |
* ... daha küçük daha iyidir
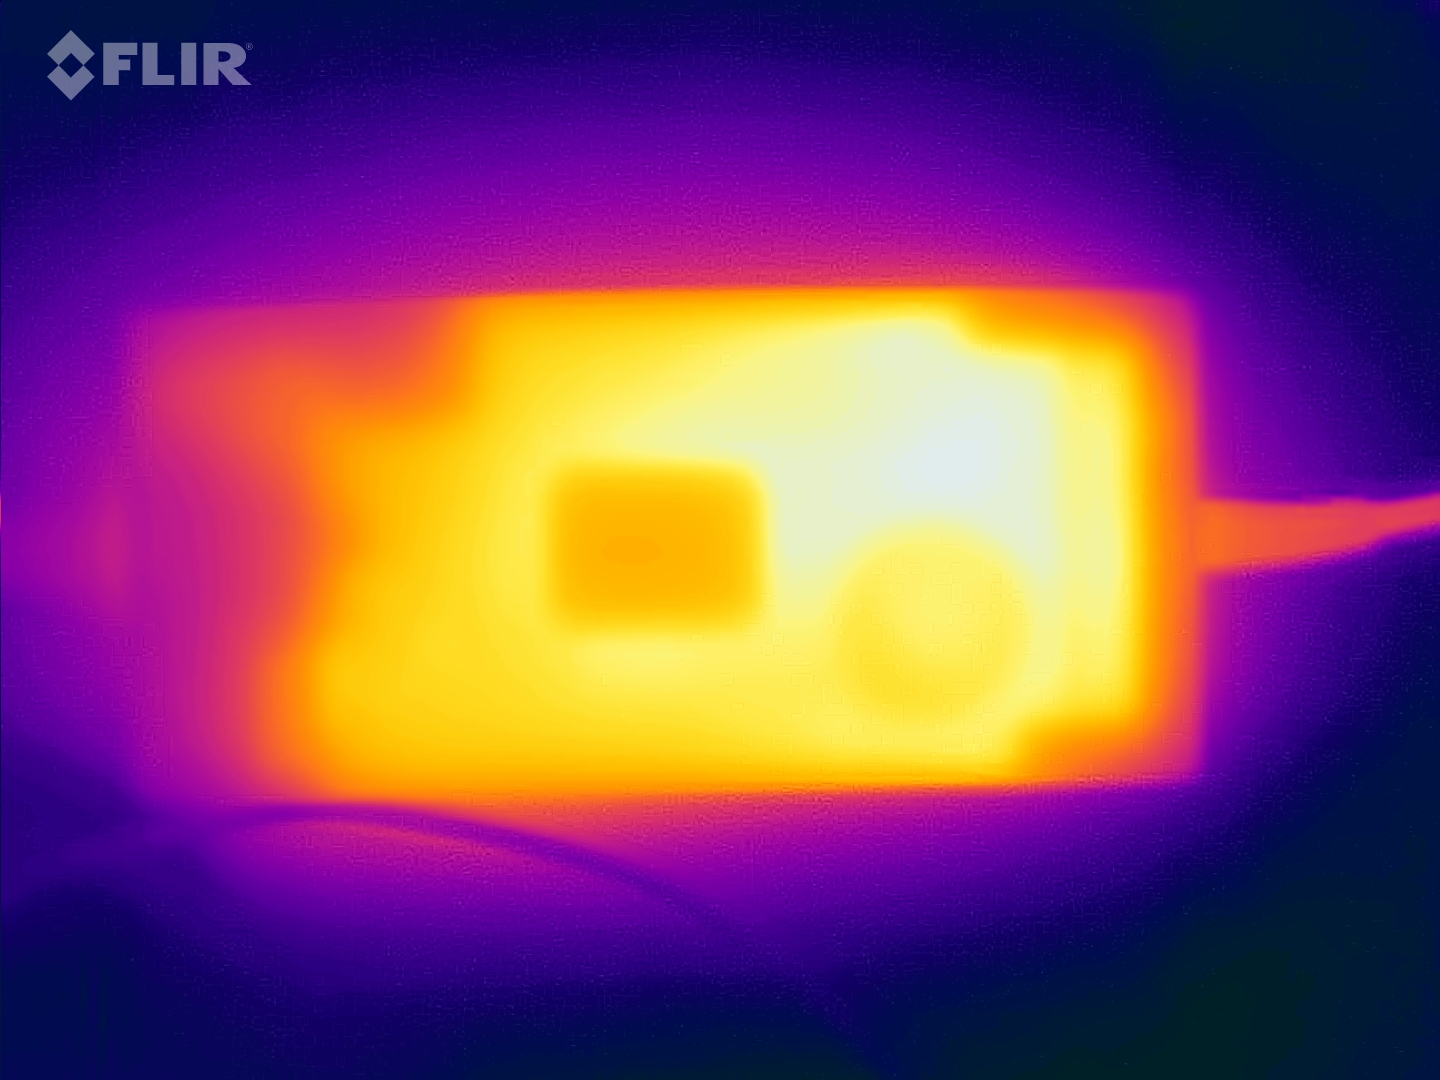
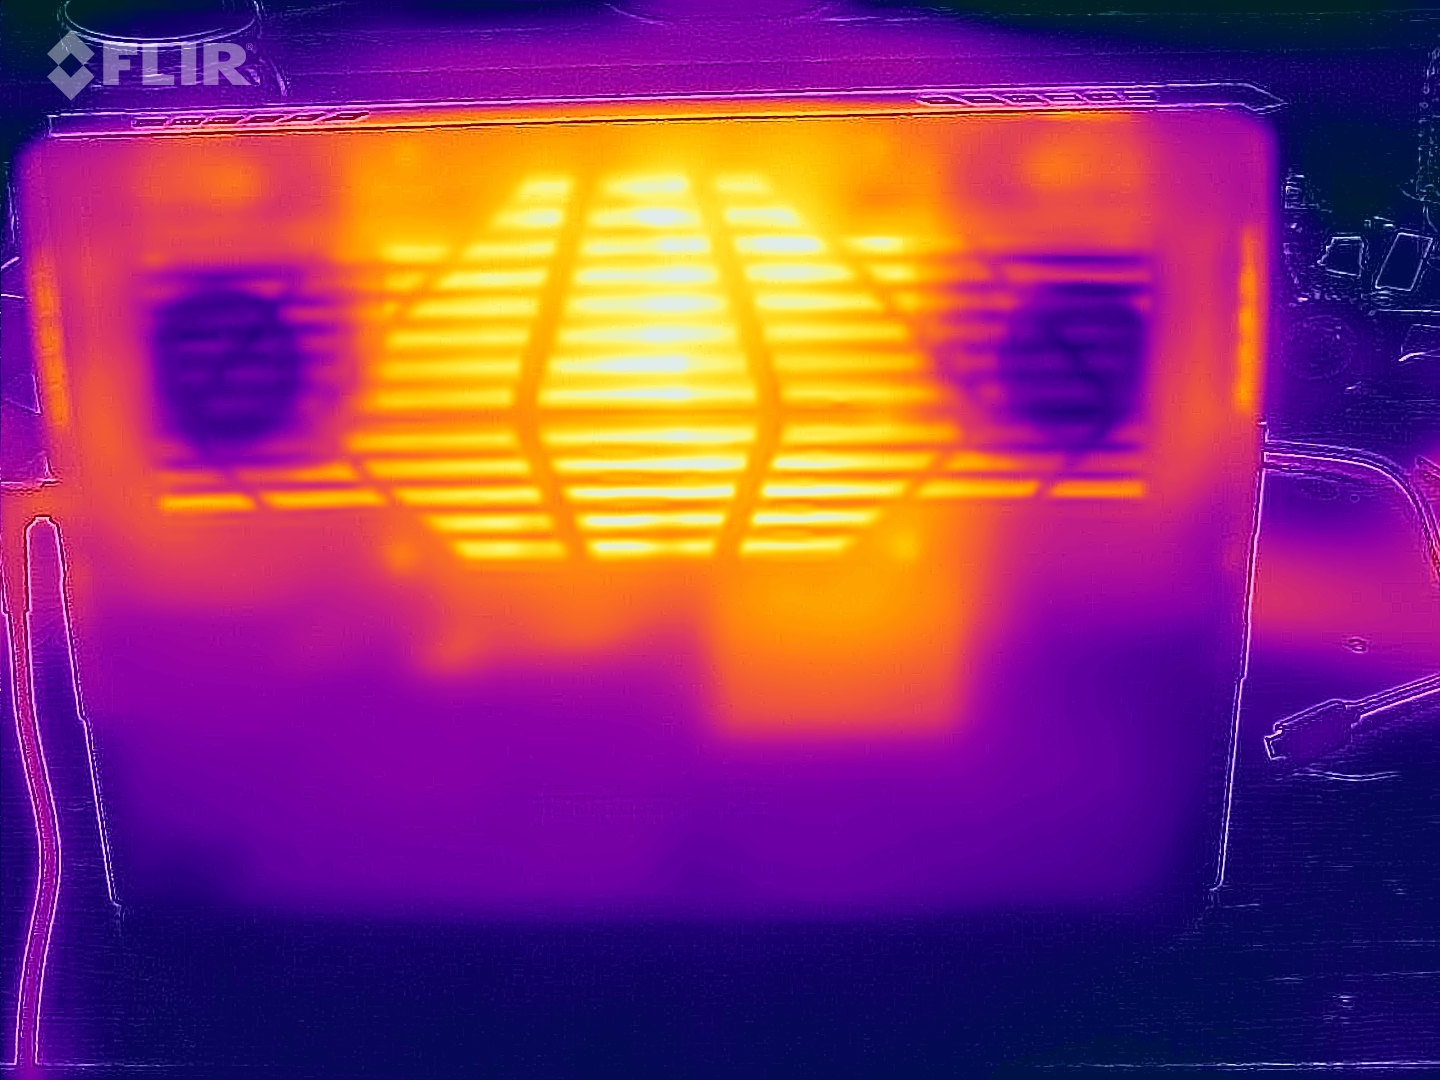
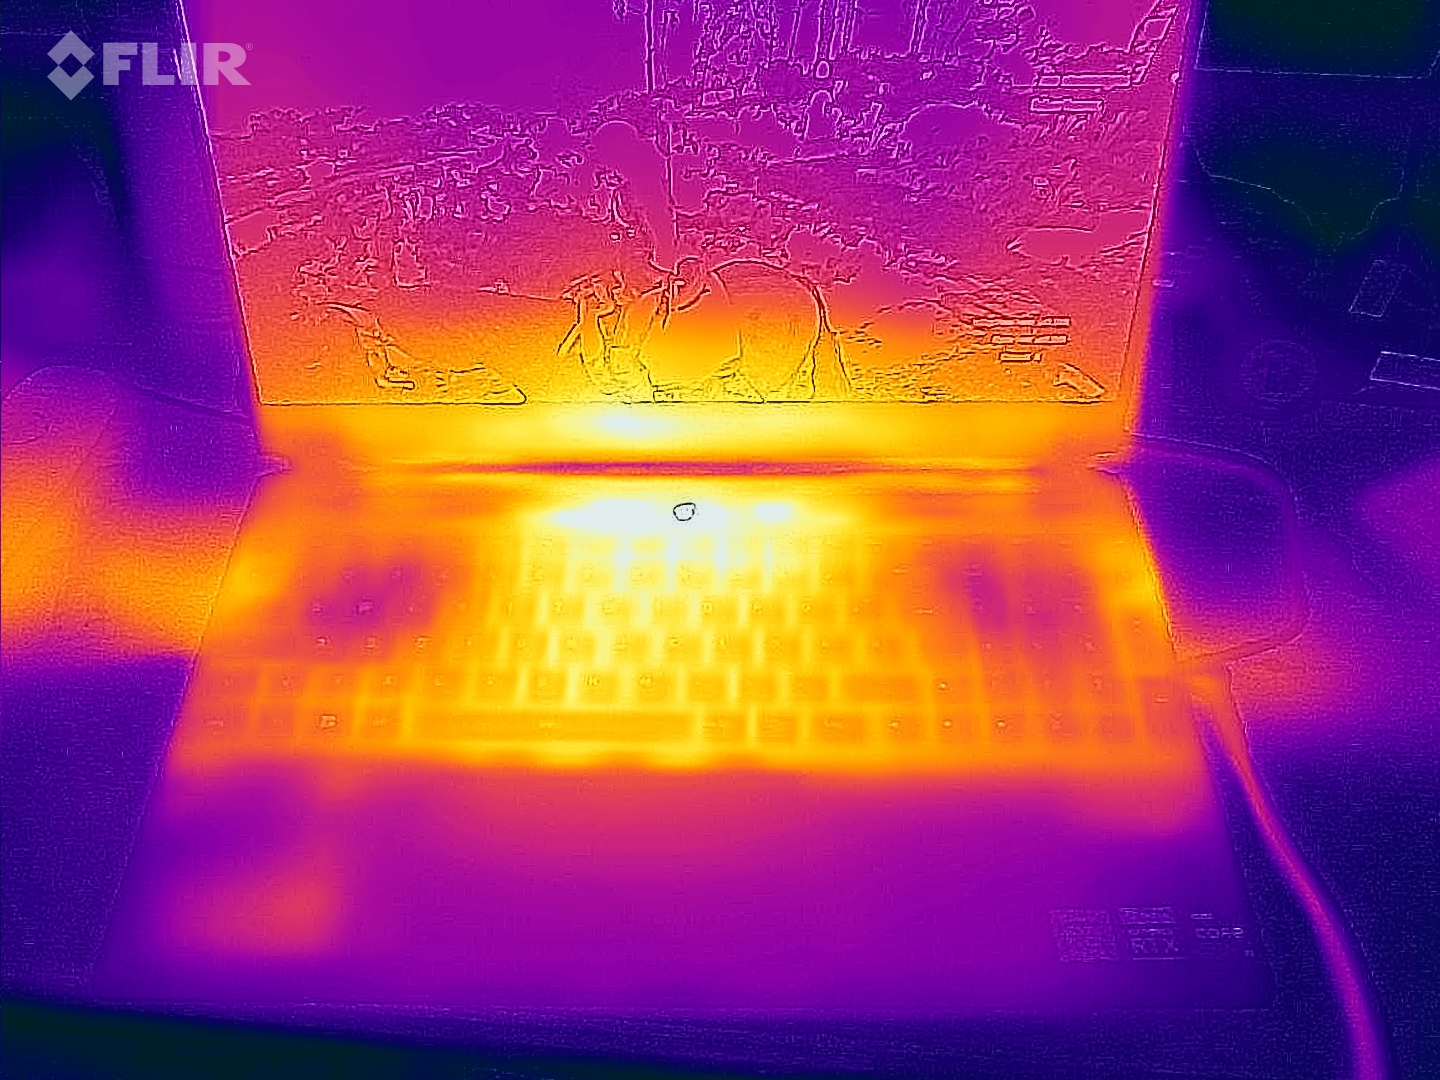
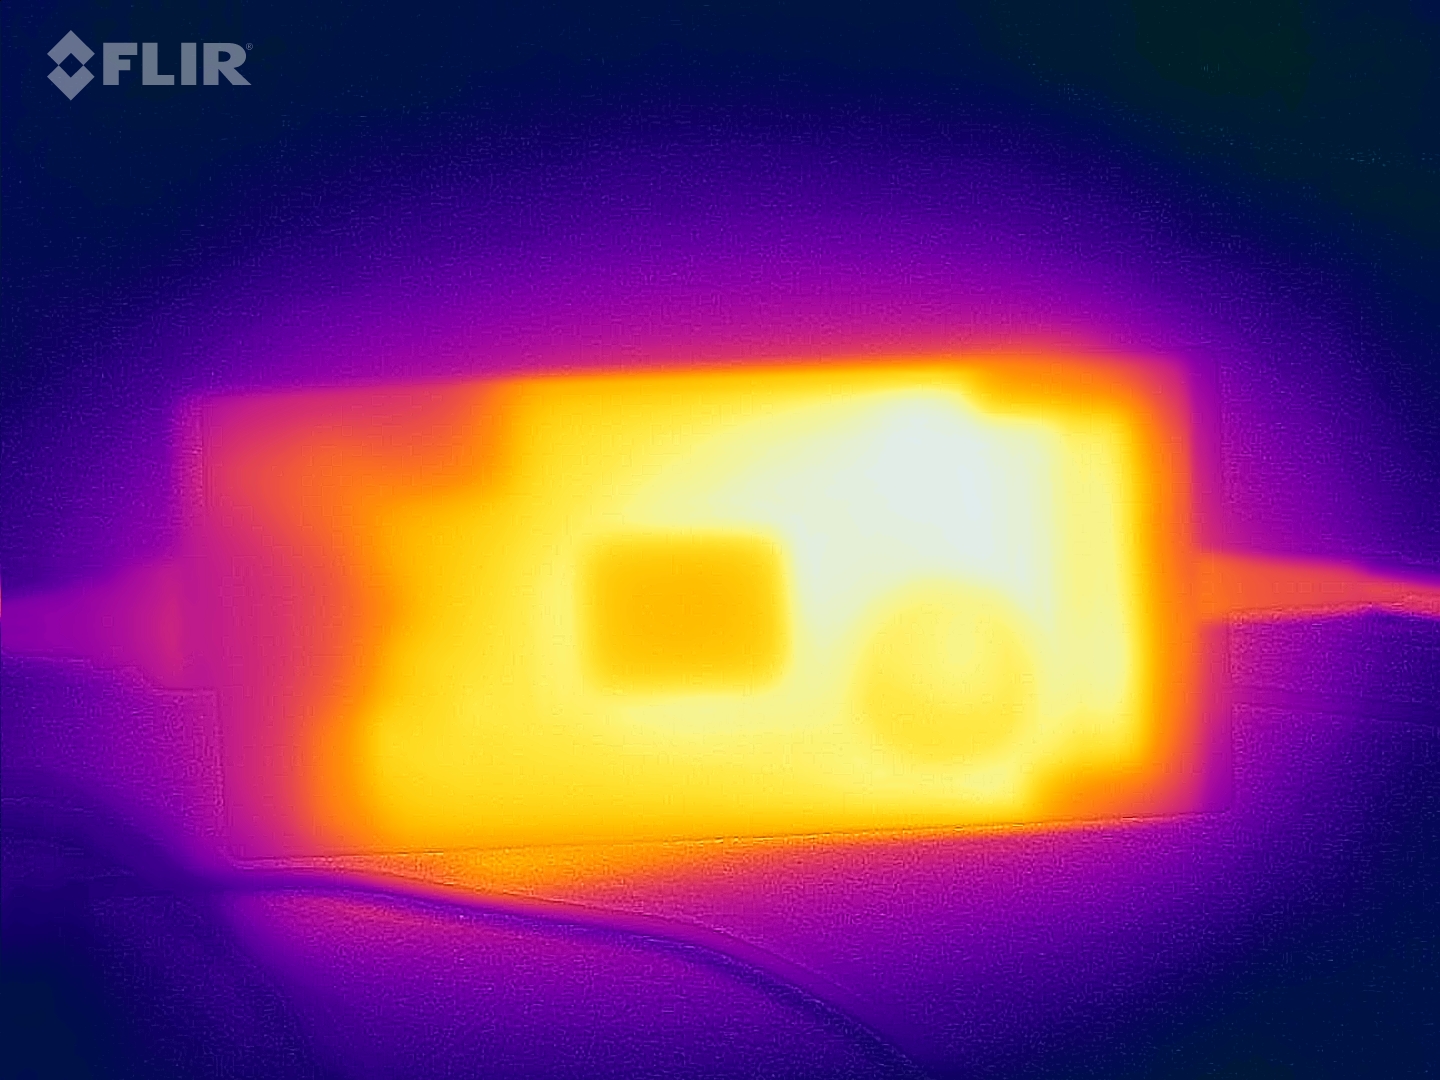
Sıcaklık
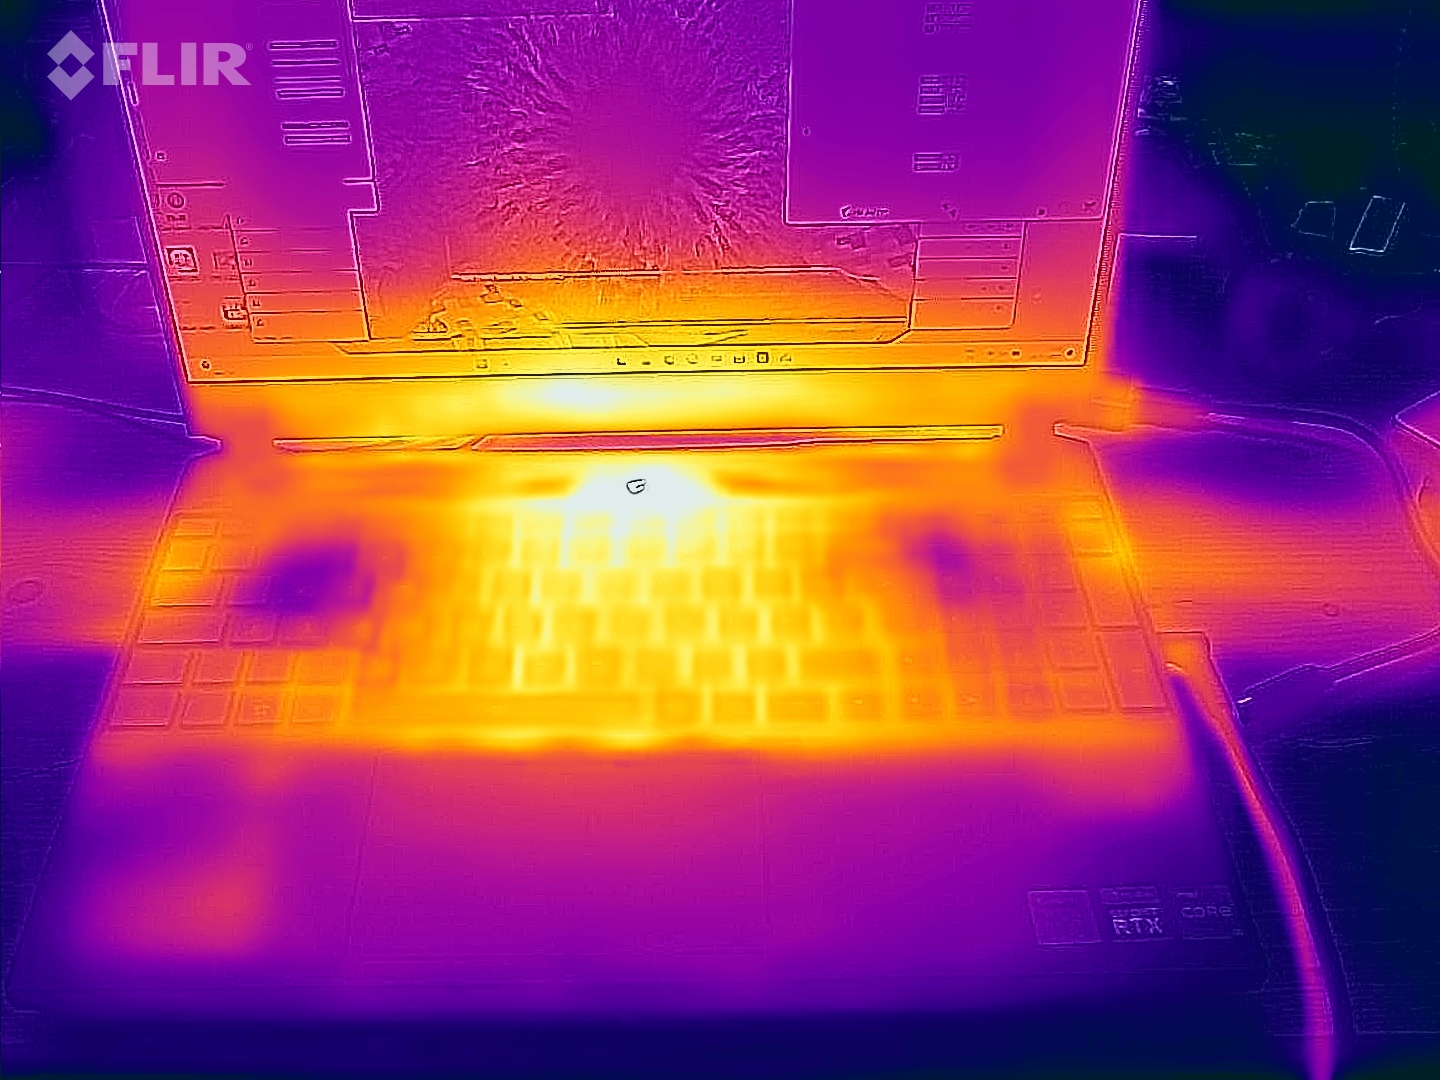
Yüksek yük altında, özellikle cihazın ortasındaki alt kısımda ekrana doğru ısınır. Bununla birlikte, 50 °C'ye kadar olan sıcaklık, tipik oyun dizüstü bilgisayarları aralığındadır. Hatta üst kısım maksimum 43 °C ile şaşırtıcı derecede serin kalıyor. Turbo modunda sıcaklıklar daha da düşüktür.
(±) Üst taraftaki maksimum sıcaklık, 40.4 °C / 105 F ortalamasına kıyasla 43 °C / 109 F'dir. , Gaming sınıfı için 21.2 ile 68.8 °C arasında değişir.
(-) Alt kısım, 43.2 °C / 110 F ortalamasına kıyasla maksimum 50 °C / 122 F'ye kadar ısınır
(+) Boşta kullanımda, üst tarafın ortalama sıcaklığı 27.3 °C / 81 F olup, cihazın 33.9 °C / 93 F.
(+) The Witcher 3 oynarken, üst tarafın ortalama sıcaklığı 29.7 °C / 85 F olup, cihazın 33.9 °C / 93 F.
(+) Avuç içi dayanakları ve dokunmatik yüzey, maksimum 26 °C / 78.8 F ile cilt sıcaklığından daha soğuktur ve bu nedenle dokunulduğunda soğuktur.
(+) Benzer cihazların avuç içi dayanağı alanının ortalama sıcaklığı 28.8 °C / 83.8 F (+2.8 °C / 5 F) idi.
| Aorus 15 YE5-54DEB34SH Intel Core i5-12500H, NVIDIA GeForce RTX 3080 Ti Laptop GPU | Aorus 15 BSF Intel Core i7-13700H, NVIDIA GeForce RTX 4070 Laptop GPU | Captiva Advanced Gaming I74-121 Intel Core i5-13500H, NVIDIA GeForce RTX 4060 Laptop GPU | HP Victus 16-r0077ng Intel Core i7-13700H, NVIDIA GeForce RTX 4070 Laptop GPU | Dell XPS 15 9530 RTX 4070 Intel Core i7-13700H, NVIDIA GeForce RTX 4070 Laptop GPU | HP Omen 16-wf000 Intel Core i7-13700HX, NVIDIA GeForce RTX 4080 Laptop GPU | |
|---|---|---|---|---|---|---|
| Heat | -8% | 4% | -8% | 1% | 5% | |
| Maximum Upper Side * (°C) | 43 | 48 -12% | 41 5% | 51 -19% | 45.6 -6% | 45 -5% |
| Maximum Bottom * (°C) | 50 | 47 6% | 42 16% | 54 -8% | 42 16% | 48.8 2% |
| Idle Upper Side * (°C) | 33 | 39 -18% | 32 3% | 37 -12% | 34.4 -4% | 29.2 12% |
| Idle Bottom * (°C) | 32 | 35 -9% | 35 -9% | 29 9% | 33.2 -4% | 28.8 10% |
* ... daha küçük daha iyidir
Konuşmacılar
Hoparlörlerin iyi bir ses seviyesine sahip olması olumlu bir yön. Bununla birlikte, neredeyse hiç bas yoktur ve hatta orta ve yüksek sesler özellikle dengeli değildir.
Harici ses cihazlarını bağlamak için mikrofonlar ve kulaklıklar için birleşik 3,5 mm jak mevcuttur.
Aorus 15 YE5-54DEB34SH ses analizi
(+) | hoparlörler nispeten yüksek sesle çalabilir (84.15 dB)
Bas 100 - 315Hz
(-) | neredeyse hiç bas yok - ortalama olarak medyandan 27.1% daha düşük
(±) | Bas doğrusallığı ortalamadır (12.4% delta - önceki frekans)
Ortalar 400 - 2000 Hz
(±) | daha yüksek ortalar - ortalama olarak medyandan 6.2% daha yüksek
(±) | Ortaların doğrusallığı ortalamadır (7.7% delta - önceki frekans)
Yüksekler 2 - 16 kHz
(±) | daha yüksek en yüksekler - ortalama olarak medyandan 7.4% daha yüksek
(±) | Yükseklerin doğrusallığı ortalamadır (7.5% delta - önceki frekans)
Toplam 100 - 16.000 Hz
(±) | Genel sesin doğrusallığı ortalamadır (22.5% ortancaya göre fark)
Aynı sınıfla karşılaştırıldığında
» Bu sınıftaki tüm test edilen cihazların %81%'si daha iyi, 5% benzer, 14% daha kötüydü
» En iyisinin deltası 6% idi, ortalama 18% idi, en kötüsü 132% idi
Test edilen tüm cihazlarla karşılaştırıldığında
» Test edilen tüm cihazların %66'si daha iyi, 6 benzer, % 28 daha kötüydü
» En iyisinin deltası 4% idi, ortalama 23% idi, en kötüsü 134% idi
Apple MacBook Pro 16 2021 M1 Pro ses analizi
(+) | hoparlörler nispeten yüksek sesle çalabilir (84.7 dB)
Bas 100 - 315Hz
(+) | iyi bas - medyandan yalnızca 3.8% uzakta
(+) | bas doğrusaldır (5.2% delta ile önceki frekans)
Ortalar 400 - 2000 Hz
(+) | dengeli ortalar - medyandan yalnızca 1.3% uzakta
(+) | orta frekanslar doğrusaldır (2.1% deltadan önceki frekansa)
Yüksekler 2 - 16 kHz
(+) | dengeli yüksekler - medyandan yalnızca 1.9% uzakta
(+) | yüksekler doğrusaldır (2.7% deltadan önceki frekansa)
Toplam 100 - 16.000 Hz
(+) | genel ses doğrusaldır (4.6% ortancaya göre fark)
Aynı sınıfla karşılaştırıldığında
» Bu sınıftaki tüm test edilen cihazların %0%'si daha iyi, 0% benzer, 100% daha kötüydü
» En iyisinin deltası 5% idi, ortalama 17% idi, en kötüsü 45% idi
Test edilen tüm cihazlarla karşılaştırıldığında
» Test edilen tüm cihazların %0'si daha iyi, 0 benzer, % 100 daha kötüydü
» En iyisinin deltası 4% idi, ortalama 23% idi, en kötüsü 134% idi
Güç tüketimi
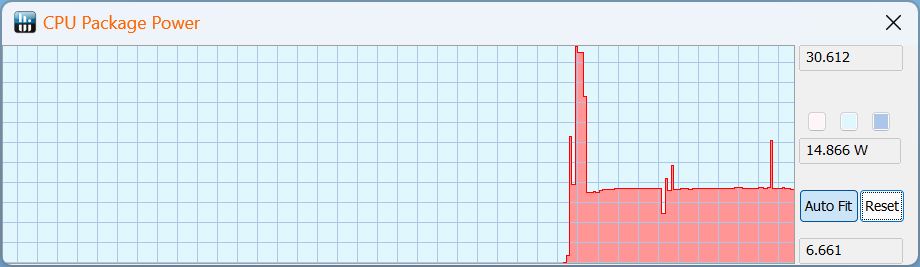
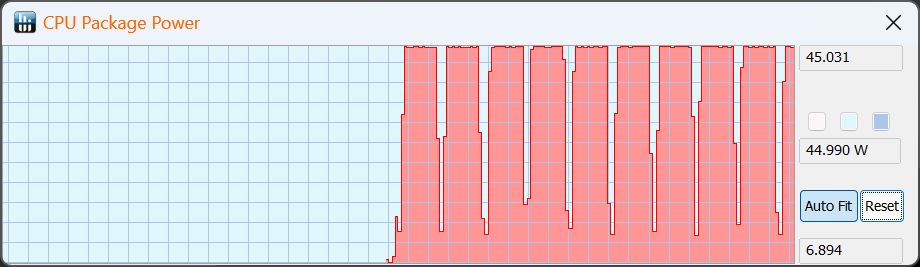
Tamam, RTX 3080 Ti tam olarak tutumlu değil - teknik olarak, mevcut CPU/GPU nesli şimdiye kadar daha verimli olmalıydı.
Örneğin The Witcher 3 oynarken Captiva kadar "az" tüketmek için Aorus'umuzu toplantı moduna veya Güç Tasarrufuna ayarlamanız gerekir. Bununla birlikte, oyundaki yenileme hızları da biraz şaşırtıcı bir seviyededir (gürültü emisyonları bölümündeki tabloya bakın).
Her şeyden önce, 3DMark06 testimizde (ortalama yük) ölçtüğümüz 150 watt olumsuz olarak göze çarpıyor; aksine, Captiva sadece 85 watt tüketiyor. Genel olarak, boşta bile biraz daha yüksek bir tüketim beklenmelidir, ancak oyun oynarken bu perspektife yerleştirilir.
Delta'nın 240 watt'lık güç kaynağının kolayca başa çıkabileceği maksimum ve geçici 204 watt'lık bir değer ölçtük.
| Kapalı / Bekleme modu | |
| Boşta | |
| Çalışırken |
|
Key:
min: | |
| Aorus 15 YE5-54DEB34SH GeForce RTX 3080 Ti Laptop GPU, i5-12500H, Gigabyte AG470S1TB-SI B10 | Aorus 15 BSF GeForce RTX 4070 Laptop GPU, i7-13700H, Gigabyte AG470S1TB-SI B10 | Captiva Advanced Gaming I74-121 GeForce RTX 4060 Laptop GPU, i5-13500H, Samsung SSD 980 1TB MZ-V8V1T0BW | HP Victus 16-r0077ng GeForce RTX 4070 Laptop GPU, i7-13700H, Kioxia XG8 KXG80ZNV1T02 | Dell XPS 15 9530 RTX 4070 GeForce RTX 4070 Laptop GPU, i7-13700H, SK hynix PC801 HFS001TEJ9X101N | HP Omen 16-wf000 GeForce RTX 4080 Laptop GPU, i7-13700HX, SK hynix PC801 HFS002TEJ9X101N | |
|---|---|---|---|---|---|---|
| Power Consumption | 10% | 15% | 23% | 23% | -24% | |
| Idle 150cd/m2 * (Watt) | 16 | 12.4 22% | 18 -13% | 12.8 20% | 20.1 -26% | 23.2 -45% |
| 3DMark06 Return To Proxycon * (Watt) | 150 | 85 43% | ||||
| Witcher 3 ultra * (Watt) | 196 | 175.8 10% | 164 16% | 141.8 28% | 95.4 51% | 214 -9% |
| 1280x720 Prime95 28.10 and Furmark 1.25 * (Watt) | 204 | 210 -3% | 179 12% | 164.1 20% | 117.2 43% | 240 -18% |
* ... daha küçük daha iyidir
Power consumption Witcher 3 / stress test
Power consumption with external monitor
Çalışma Zamanları
Aorus, muhtemelen artan rölanti tüketimi nedeniyle çalışma süreleri açısından hayal kırıklığına uğratıyor. Gigabyte 99 Wh'lık cömert bir batarya yerleştirmiş ancak çalışma süreleri yine de sadece Captiva 53 Wh batarya ile! I7-13700H ve RTX 4070'e sahip mevcut nesil Aorus BSF, 99 Wh piliyle yüzde 65 daha uzun süre dayandı ve WLAN testinde neredeyse iki kat daha uzun süre dayandı! Aorus'umuz 5,5 saatten az dayanırken, BSF 10 saatten fazla dayandı.
| Aorus 15 YE5-54DEB34SH i5-12500H, GeForce RTX 3080 Ti Laptop GPU, 99 Wh | Aorus 15 BSF i7-13700H, GeForce RTX 4070 Laptop GPU, 99 Wh | Captiva Advanced Gaming I74-121 i5-13500H, GeForce RTX 4060 Laptop GPU, 53 Wh | HP Victus 16-r0077ng i7-13700H, GeForce RTX 4070 Laptop GPU, 83 Wh | Dell XPS 15 9530 RTX 4070 i7-13700H, GeForce RTX 4070 Laptop GPU, 86 Wh | HP Omen 16-wf000 i7-13700HX, GeForce RTX 4080 Laptop GPU, 83 Wh | Sınıf ortalaması Gaming | |
|---|---|---|---|---|---|---|---|
| Pil Çalışma Süresi | 64% | -5% | 34% | 20% | -20% | 26% | |
| H.264 (h) | 5.3 | 9 70% | 4.9 -8% | 8.32 ? 57% | |||
| WiFi v1.3 (h) | 5.3 | 10.3 94% | 5.3 0% | 7.1 34% | 8 51% | 5.1 -4% | 7.11 ? 34% |
| Load (h) | 1.7 | 2.2 29% | 1.6 -6% | 1.5 -12% | 1.1 -35% | 1.502 ? -12% | |
| Reader / Idle (h) | 10.9 | 11.5 | 5.5 | 8.27 ? |
Artılar
Eksiler
Karar - Kesinlikle rekabetçi!

Gen-12 CPU ve RTX 3080 Ti kombinasyonu, özellikle (3D) performans söz konusu olduğunda, hiçbir şekilde geçmişte kalmış bir şey değildir. Aorus 15 YE5, RTX 4070 ile diğer oyun dizüstü bilgisayarlarının çoğunu geride bırakabilir, bu da onu özellikle düşük fiyatı açısından dikkate değer kılar. Buna rağmen Aorus, rakiplerinin çoğunda olduğu gibi Thunderbolt 4, hızlı bir SSD veya çok yönlü bir tasarım gibi modern özelliklerden vazgeçmedi.
Düşük verimliliği artık tamamen güncel değil, bu da çoğunlukla dizüstü bilgisayarın büyük piline rağmen hayal kırıklığı yaratan çalışma sürelerine yansıyor. Eski 720p web kamerası mutlak bir dezavantaj olmayabilir, ancak oyuncular için bu açık bir dezavantajdır. Aorus için tipik olan can sıkıcı bir özellik de ekranı 45 derece kapattığınız anda cihazın çok hızlı bir şekilde bekleme moduna geçmesi.
Aorus 15 YE5, diğer bazı daha pahalı rakipleri gibi ucuz görünmeden düşük bir fiyata çok güçlü bir oyun performansı sunuyor. Son nesil GPU'su özellikle 3D performansı söz konusu olduğunda etkileyicidir, ancak verimliliği ve çalışma süreleri eksiktir.
RTX 4070'li MSI Katana gibi benzer fiyatlı bazı alternatifler mevcut. Bununla birlikte, Aorus birçok oyunda küçük bir miktar daha hızlı olmalıdır. Dahası, Katana Thunderbolt 4'e sahip değil ya da yüksek kalite hissi vermiyor. Buna karşılık, MSI daha uzun çalışma sürelerinden yararlanıyor. Sonuç HP Victus 16 benzer şekilde davranır - hatta biraz daha pahalıdır ancak Aorus kadar hızlı değildir veya Aorus kadar kaliteli hissettirmez. Şu anda mevcut nesil Aorus'u satın almak için yaklaşık 300 ABD Doları daha fazla harcamanız gerekecek.
Fiyat ve bulunabilirlik
Aorus 15 YE5 şu anda yaklaşık 1.500 ABD dolarına satılmaktadır. Bu yazının yazıldığı sırada, ABD'deki herhangi bir çevrimiçi perakendecide satılık bulamadık.
Aorus 15 YE5-54DEB34SH
- 12/15/2023 v7 (old)
Christian Hintze
Şeffaflık
İncelenecek cihazların seçimi editör ekibimiz tarafından yapılır. Test örneği, bu incelemenin amacı doğrultusunda üretici veya perakendeci tarafından yazara ödünç olarak sağlanmıştır. Borç verenin bu inceleme üzerinde herhangi bir etkisi olmadığı gibi, üretici de yayınlanmadan önce bu incelemenin bir kopyasını almamıştır. Bu incelemeyi yayınlama zorunluluğu yoktu. Bağımsız bir medya şirketi olarak Notebookcheck, üreticilerin, perakendecilerin veya yayıncıların otoritesine tabi değildir.
Notebookcheck bu şekilde test yapıyor
Notebookcheck, tüm sonuçların karşılaştırılabilir olmasını sağlamak için her yıl yüzlerce dizüstü bilgisayarı ve akıllı telefonu standart prosedürler kullanarak bağımsız olarak inceliyor. Yaklaşık 20 yıldır test yöntemlerimizi sürekli olarak geliştirdik ve bu süreçte endüstri standartlarını belirledik. Test laboratuvarlarımızda deneyimli teknisyenler ve editörler tarafından yüksek kaliteli ölçüm ekipmanları kullanılmaktadır. Bu testler çok aşamalı bir doğrulama sürecini içerir. Karmaşık derecelendirme sistemimiz, nesnelliği koruyan yüzlerce sağlam temellere dayanan ölçüm ve kıyaslamaya dayanmaktadır.Price comparison

