Asus Vivobook 15 F512DA Laptop incelemsi
Asus VivoBook serisi, üst seviye ve daha pahalı ZenBook serilerini tamamlamak için bütçeden orta sınıf dizüstü bilgisayarlardan oluşur. Burada sahip olduğumuz ünite, AMD'nin giriş seviyesi 2. nesil Zen Ryzen 3 3200U işlemci ile donatılmış 15.6 inç VivoBook 15. 4 GB RAM, 128 GB SSD ve 1080p ekranlı bu SKU, yaklaşık 400 USD karşılığında çevrimiçi olarak bulunabilir. Intel Core i3-8145U, Core i5-8265U, Core i7-8565U veya GeForce MX110 grafikli SKU'lar da mevcuttur. Bu görsel olarak özdeş Intel varyantları, AMD destekli VivoBook F512 serimizin aksine VivoBook X512 serisi olarak pazarlanıyor.Doğru rakipler arasında Lenovo Ideapad S340-15, Acer Aspire 5 A515, Dell Inspiron 15 3585 gibi diğer bütçeli 15,6 inç multimedya dizüstü bilgisayarlar var ve Huawei MateBook D.Daha fazla Asus yorumu: Asus VivoBook S15 S532Asus VivoBook S15 S530Asus ZenBook 15 UX534Asus Zephyrus G14Asus Chromebook Flip C434
Derecelendirme | Tarih | Modeli | Ağırlık | Yükseklik | Boyut | Çözünürlük | Fiyat |
|---|---|---|---|---|---|---|---|
| 73.1 % v7 (old) | 05/2020 | Asus Vivobook 15 F512DA-SH31 R3 3200U, Vega 3 | 1.8 kg | 19.9 mm | 15.60" | 1920x1080 | |
| 79.4 % v7 (old) | 03/2020 | Lenovo Ideapad S340-15IIL i7-1065G7, Iris Plus Graphics G7 (Ice Lake 64 EU) | 1.8 kg | 17.9 mm | 15.60" | 1920x1080 | |
| 78.4 % v7 (old) | Acer Aspire 5 A515-43-R6WW R5 3500U, Vega 8 | 1.8 kg | 18 mm | 15.60" | 1920x1080 | ||
| 77.6 % v6 (old) | 05/2022 | Dell Inspiron 15 3585 (2300U, Vega 6) R3 2300U, Vega 6 | 1.9 kg | 20 mm | 15.60" | 1920x1080 | |
| 85.2 % v7 (old) | 03/2020 | Huawei MateBook D 15-53010TUY R5 3500U, Vega 8 | 1.5 kg | 16.9 mm | 15.60" | 1920x1080 |
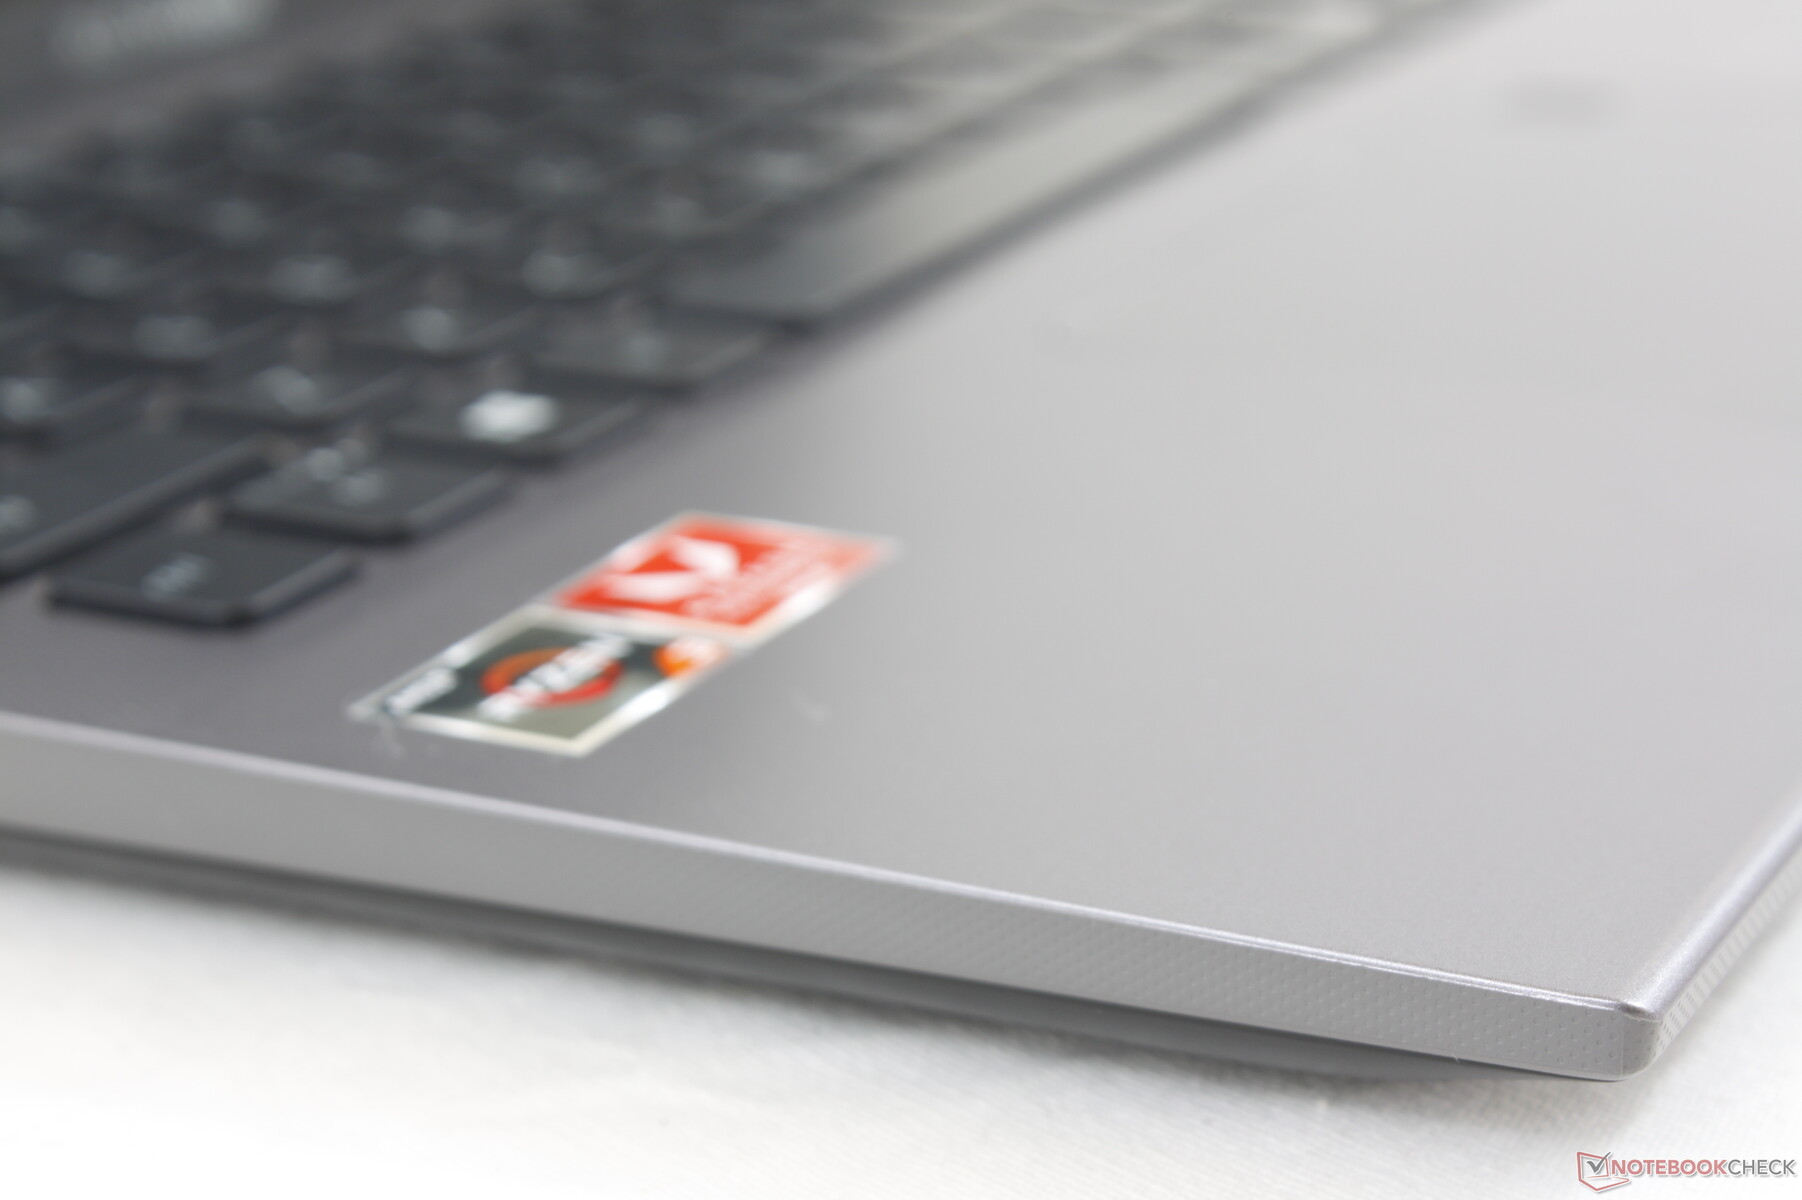
Durum
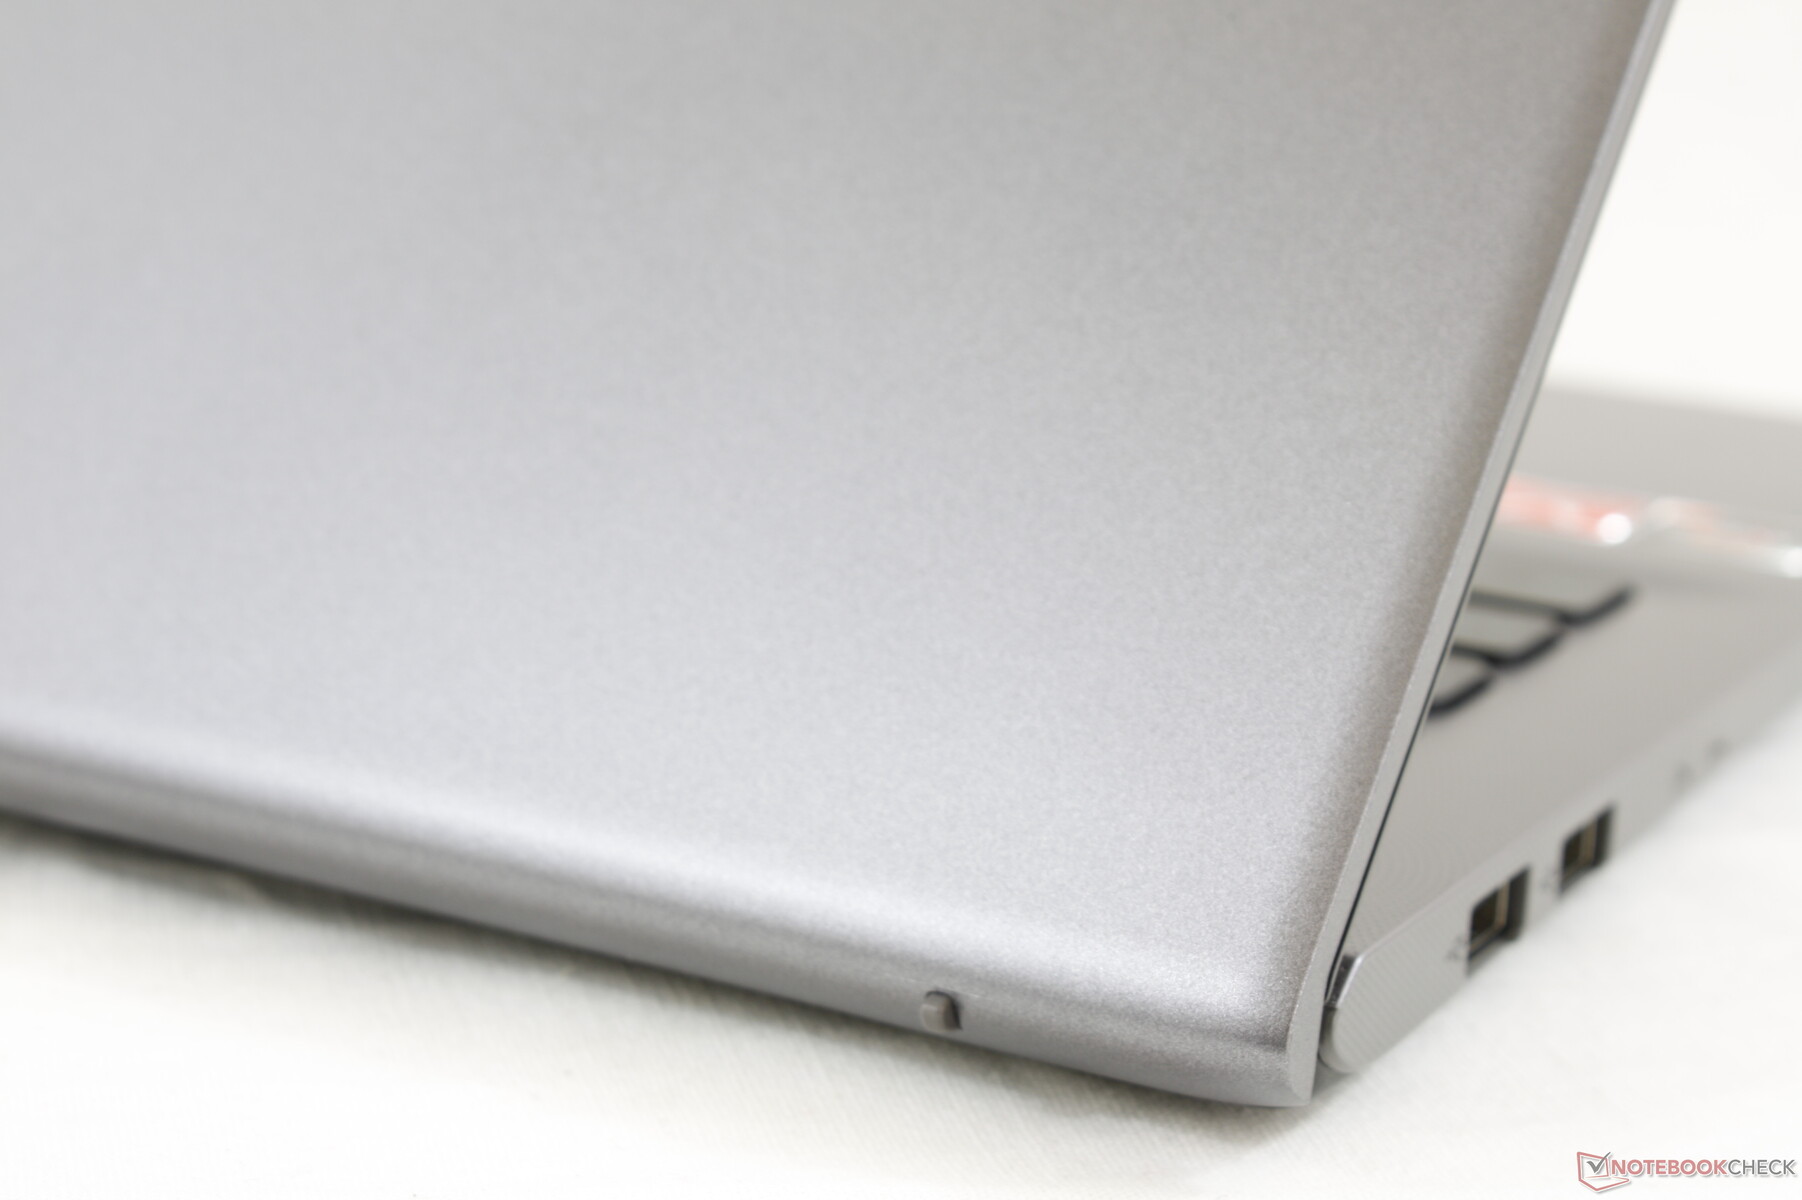
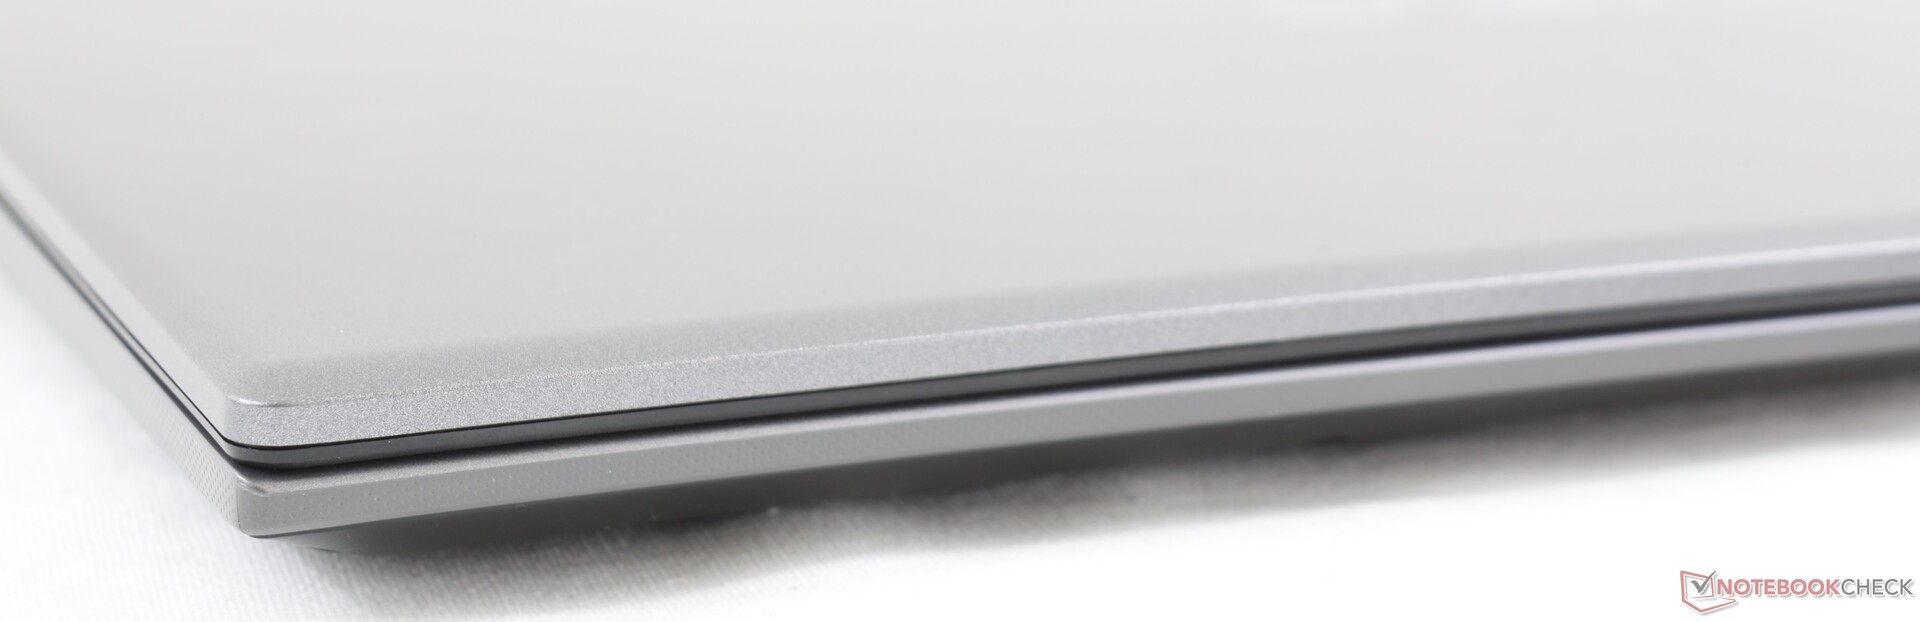
Şasi iskeleti, ScreenPad olmadan da olsa VivoBook S15 S532 ile özdeştir. Bu nedenle, S532 şasisi hakkındaki mevcut yorumlarımızın çoğu burada F512 için geçerlidir. Bununla birlikte, kapak köşelerden bükülürken daha kolay esnediğinden beklenenden daha dayanıksızdır. Taban, plastik malzemelere rağmen sadece hafif esneme ve gıcırdama ile nispeten daha serttir.

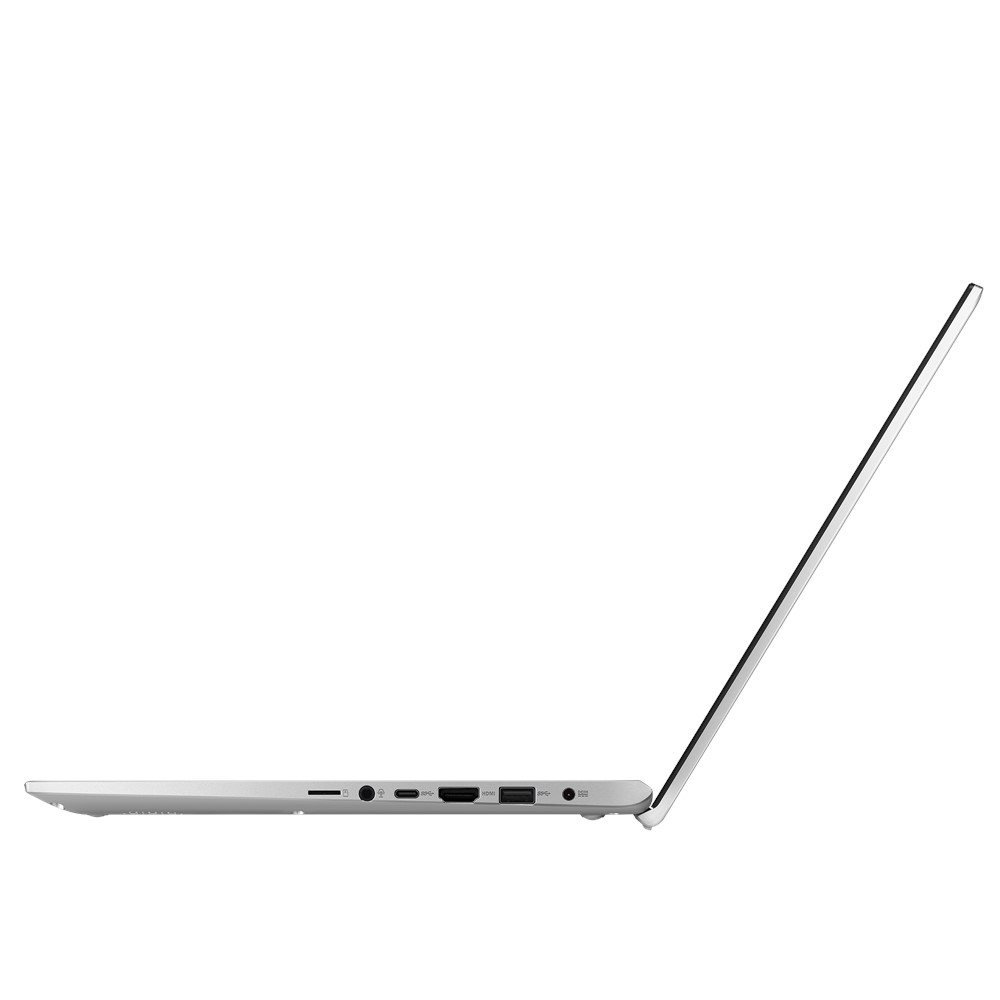
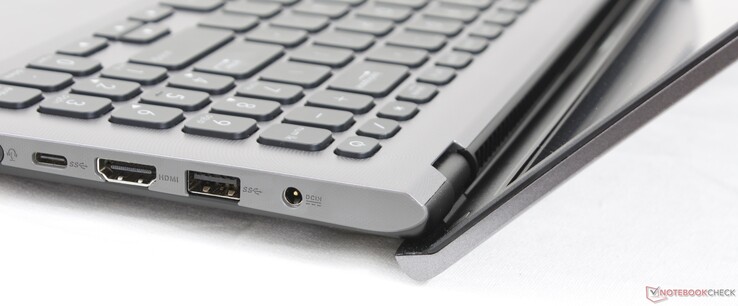
Bağlantı
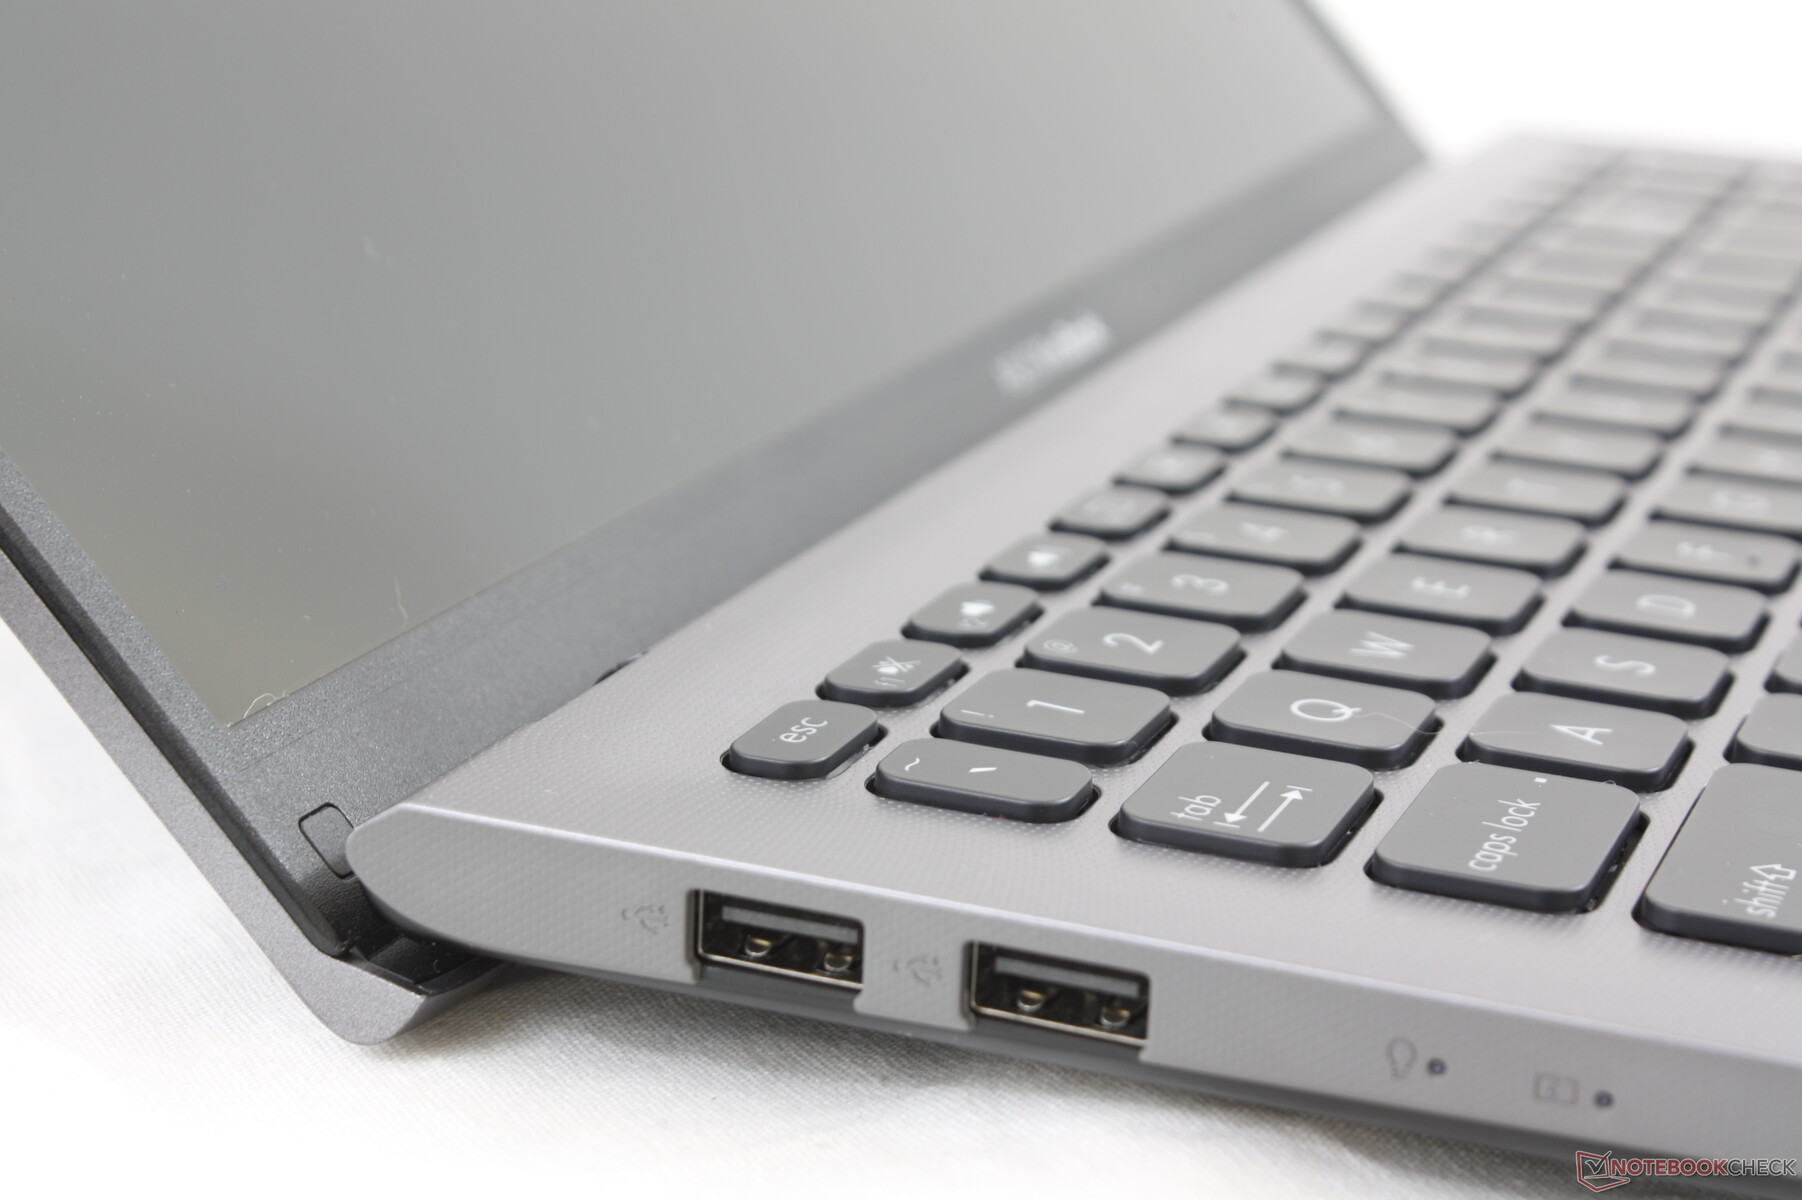
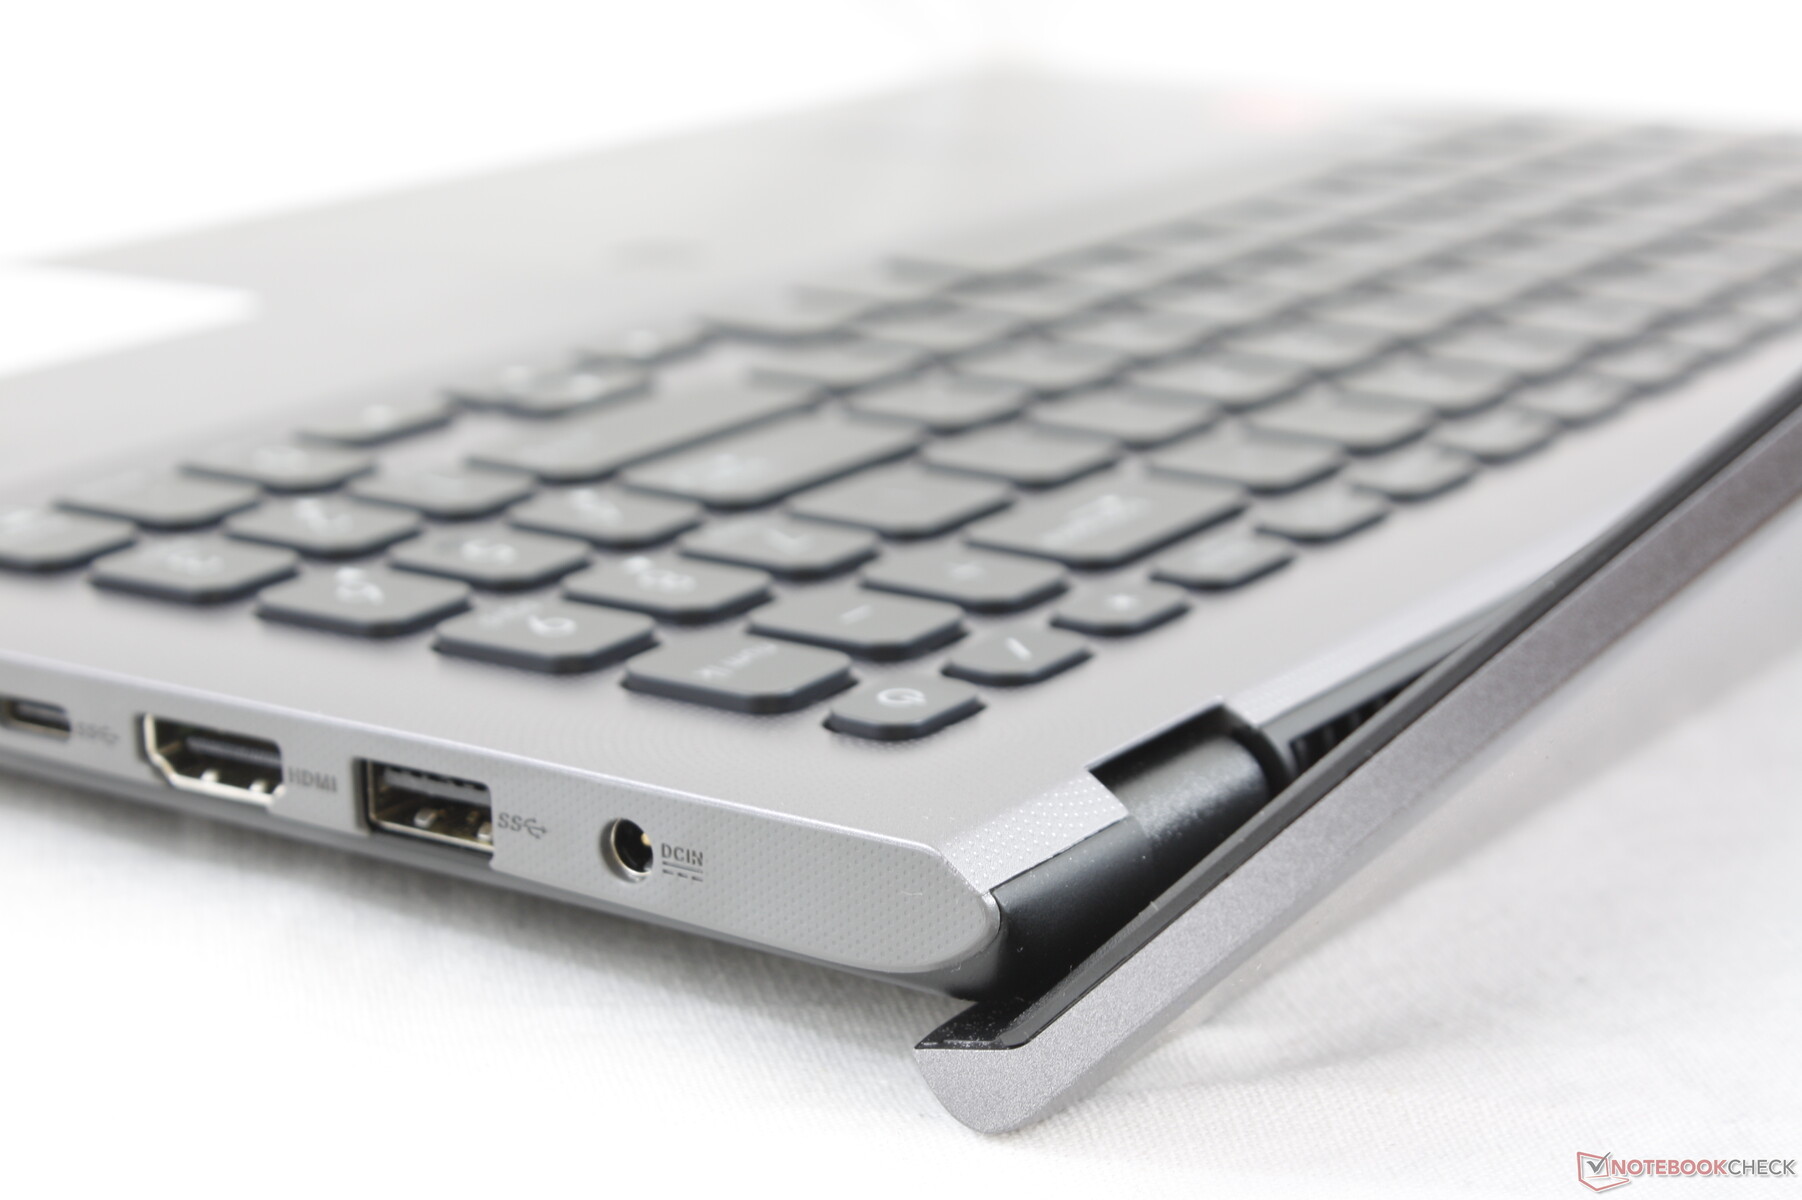
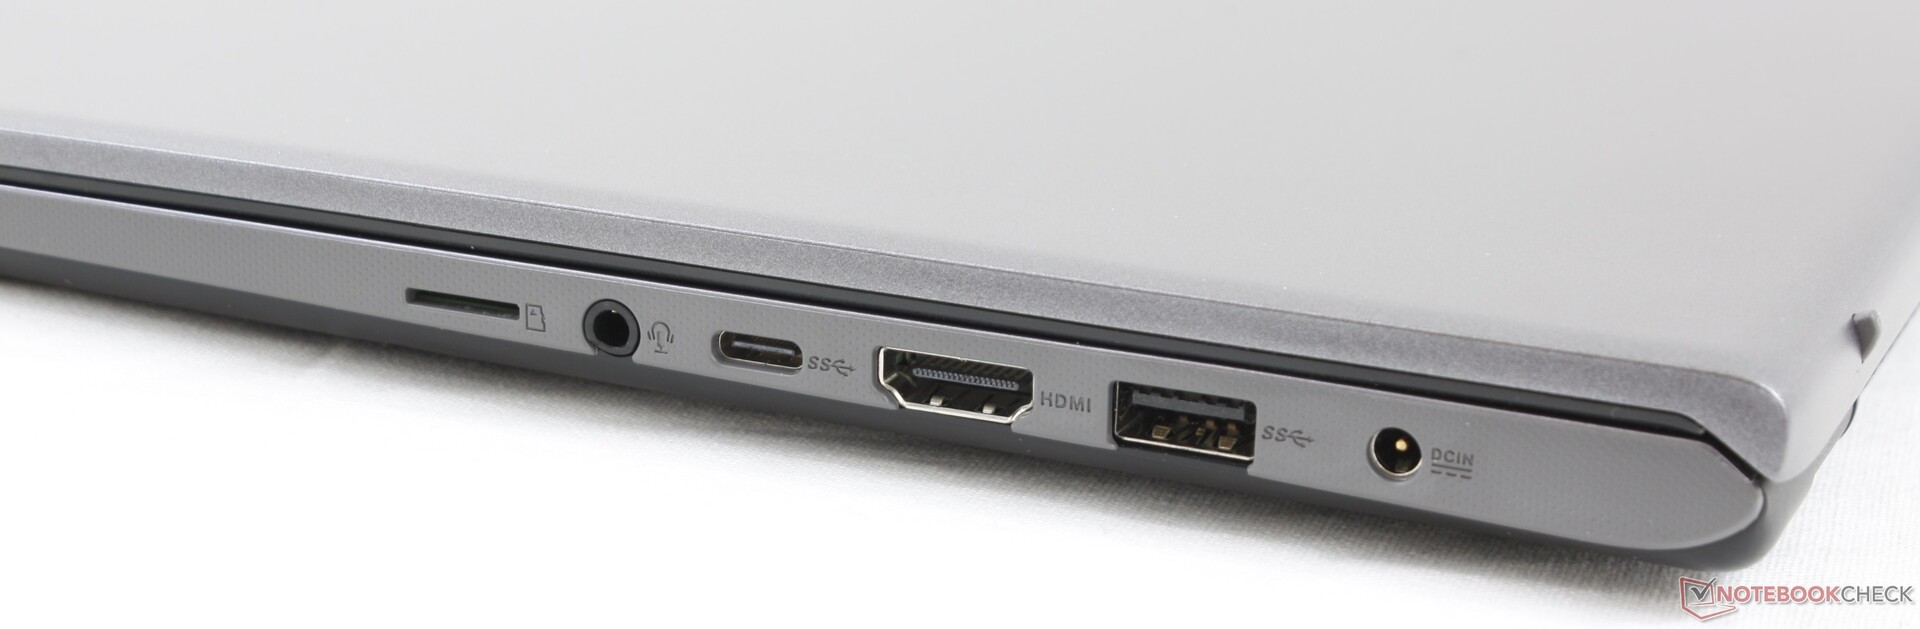
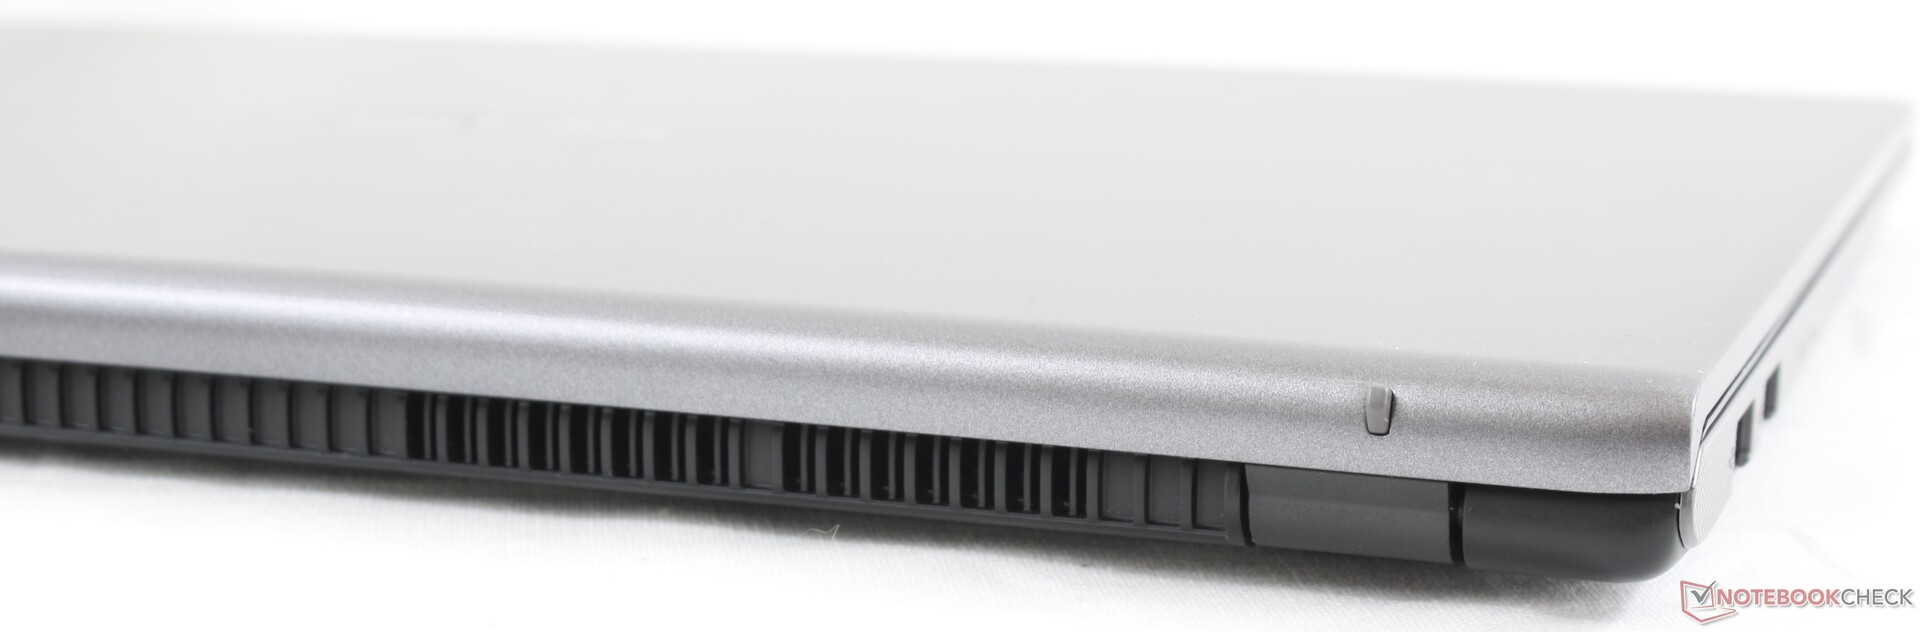
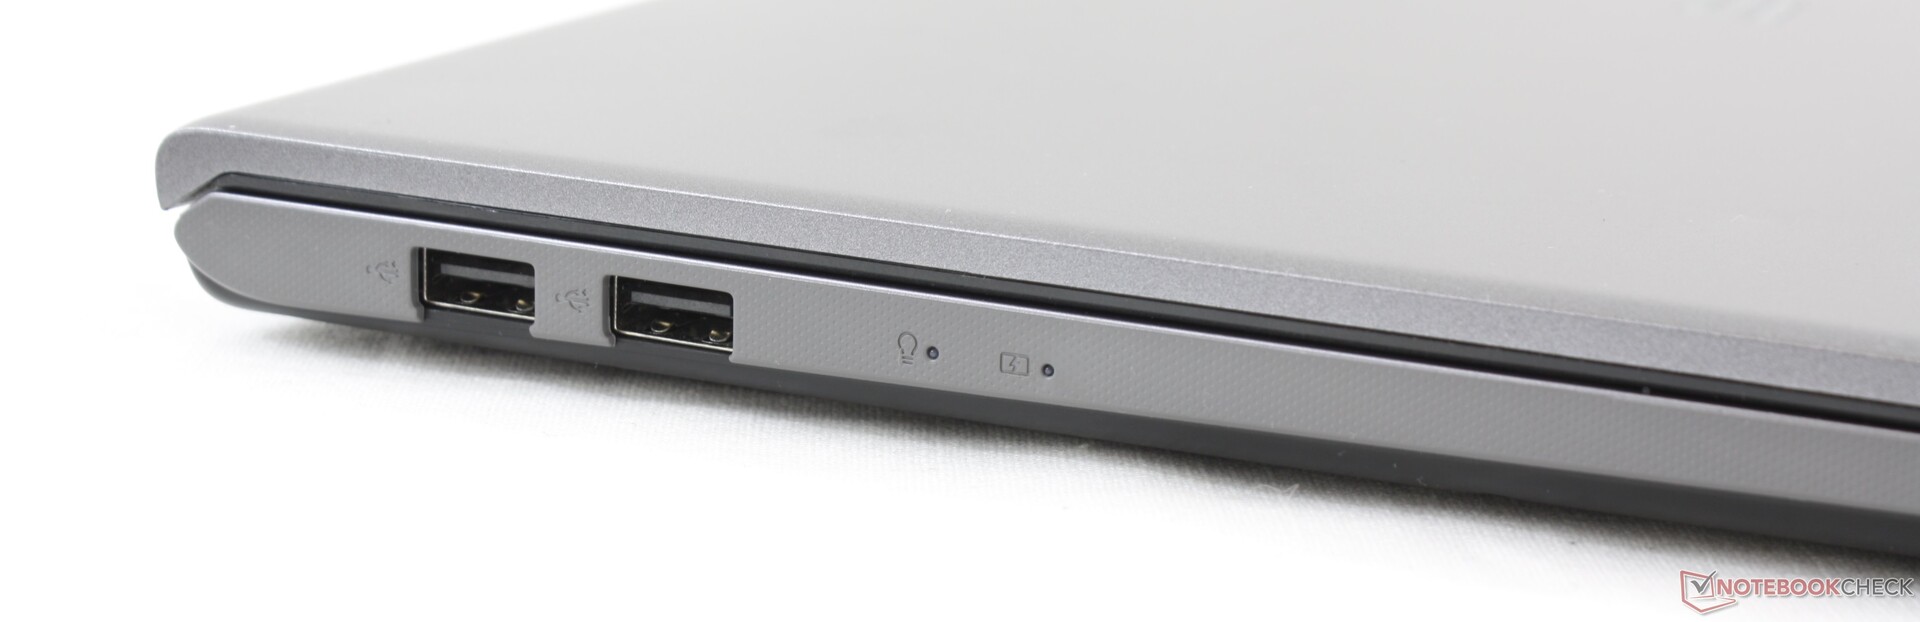
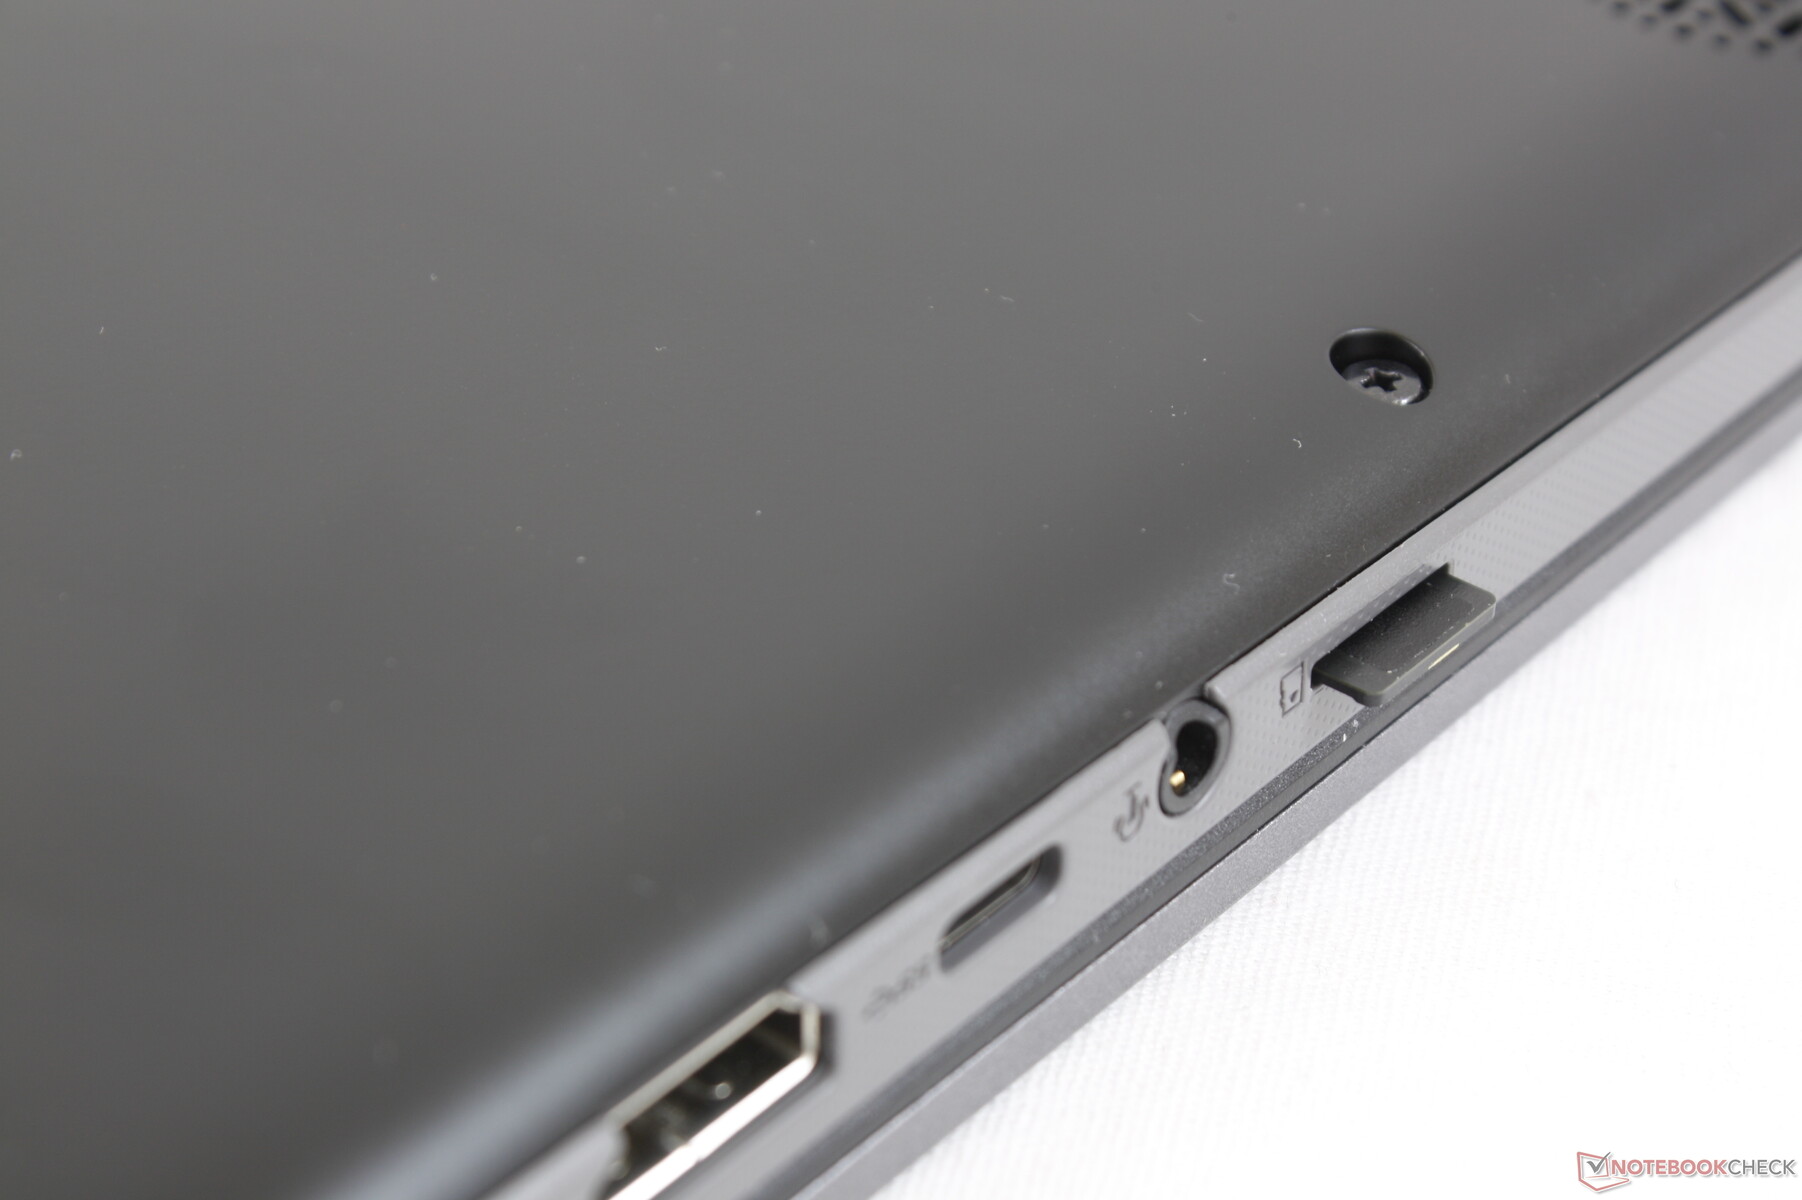
Bağlantı noktası seçenekleri VivoBook S15 S532 ile aynıdır. Sağ kenardaki HDMI ve USB bağlantı noktaları bilinmeyen nedenlerle değiştirilmiştir, ancak bağlantı noktası konumlandırması iki Asus dizüstü bilgisayarı arasında aynıdır. Sıkışık hissedebildikleri için portlar arasında daha geniş boşluklar tercih ederdik.
SD Kart Okuyucu
| SD Card Reader | |
| average JPG Copy Test (av. of 3 runs) | |
| Dell XPS 15 9570 Core i9 UHD (Toshiba Exceria Pro SDXC 64 GB UHS-II) | |
| Lenovo Ideapad S340-15IIL (Toshiba Exceria Pro SDXC 64 GB UHS-II) | |
| Dell Inspiron 15 3585 (2300U, Vega 6) (Toshiba Exceria Pro SDXC 64 GB UHS-II) | |
| Asus Vivobook 15 F512DA-SH31 (Toshiba Exceria Pro M501 64 GB UHS-II) | |
| maximum AS SSD Seq Read Test (1GB) | |
| Dell XPS 15 9570 Core i9 UHD (Toshiba Exceria Pro SDXC 64 GB UHS-II) | |
| Lenovo Ideapad S340-15IIL (Toshiba Exceria Pro SDXC 64 GB UHS-II) | |
| Asus Vivobook 15 F512DA-SH31 (Toshiba Exceria Pro M501 64 GB UHS-II) | |
| Dell Inspiron 15 3585 (2300U, Vega 6) (Toshiba Exceria Pro SDXC 64 GB UHS-II) | |
İletişim
Bluetooth 4.2 ile Intel 8265 standart olarak geliyor. Sistem, Netgear RAX200 yönlendiricimizle yapılan çoklu tekrar testlere rağmen özellikle aktarım hızlarıyla yüksek aktarım hızlarını koruma konusunda sorun yaşıyor gibi görünüyor. Aksi takdirde, web'e göz atarken veya video akışı yaparken bağlantı sorunları yaşamadık.
| Networking | |
| iperf3 transmit AX12 | |
| Microsoft Surface Laptop 3 13 Core i5-1035G7 | |
| Lenovo ThinkPad X1 Yoga 20SA000GUS | |
| Acer Aspire 5 A515-54G | |
| Asus Vivobook 15 F512DA-SH31 | |
| iperf3 receive AX12 | |
| Microsoft Surface Laptop 3 13 Core i5-1035G7 | |
| Lenovo ThinkPad X1 Yoga 20SA000GUS | |
| Acer Aspire 5 A515-54G | |
| Asus Vivobook 15 F512DA-SH31 | |
Web kamerası


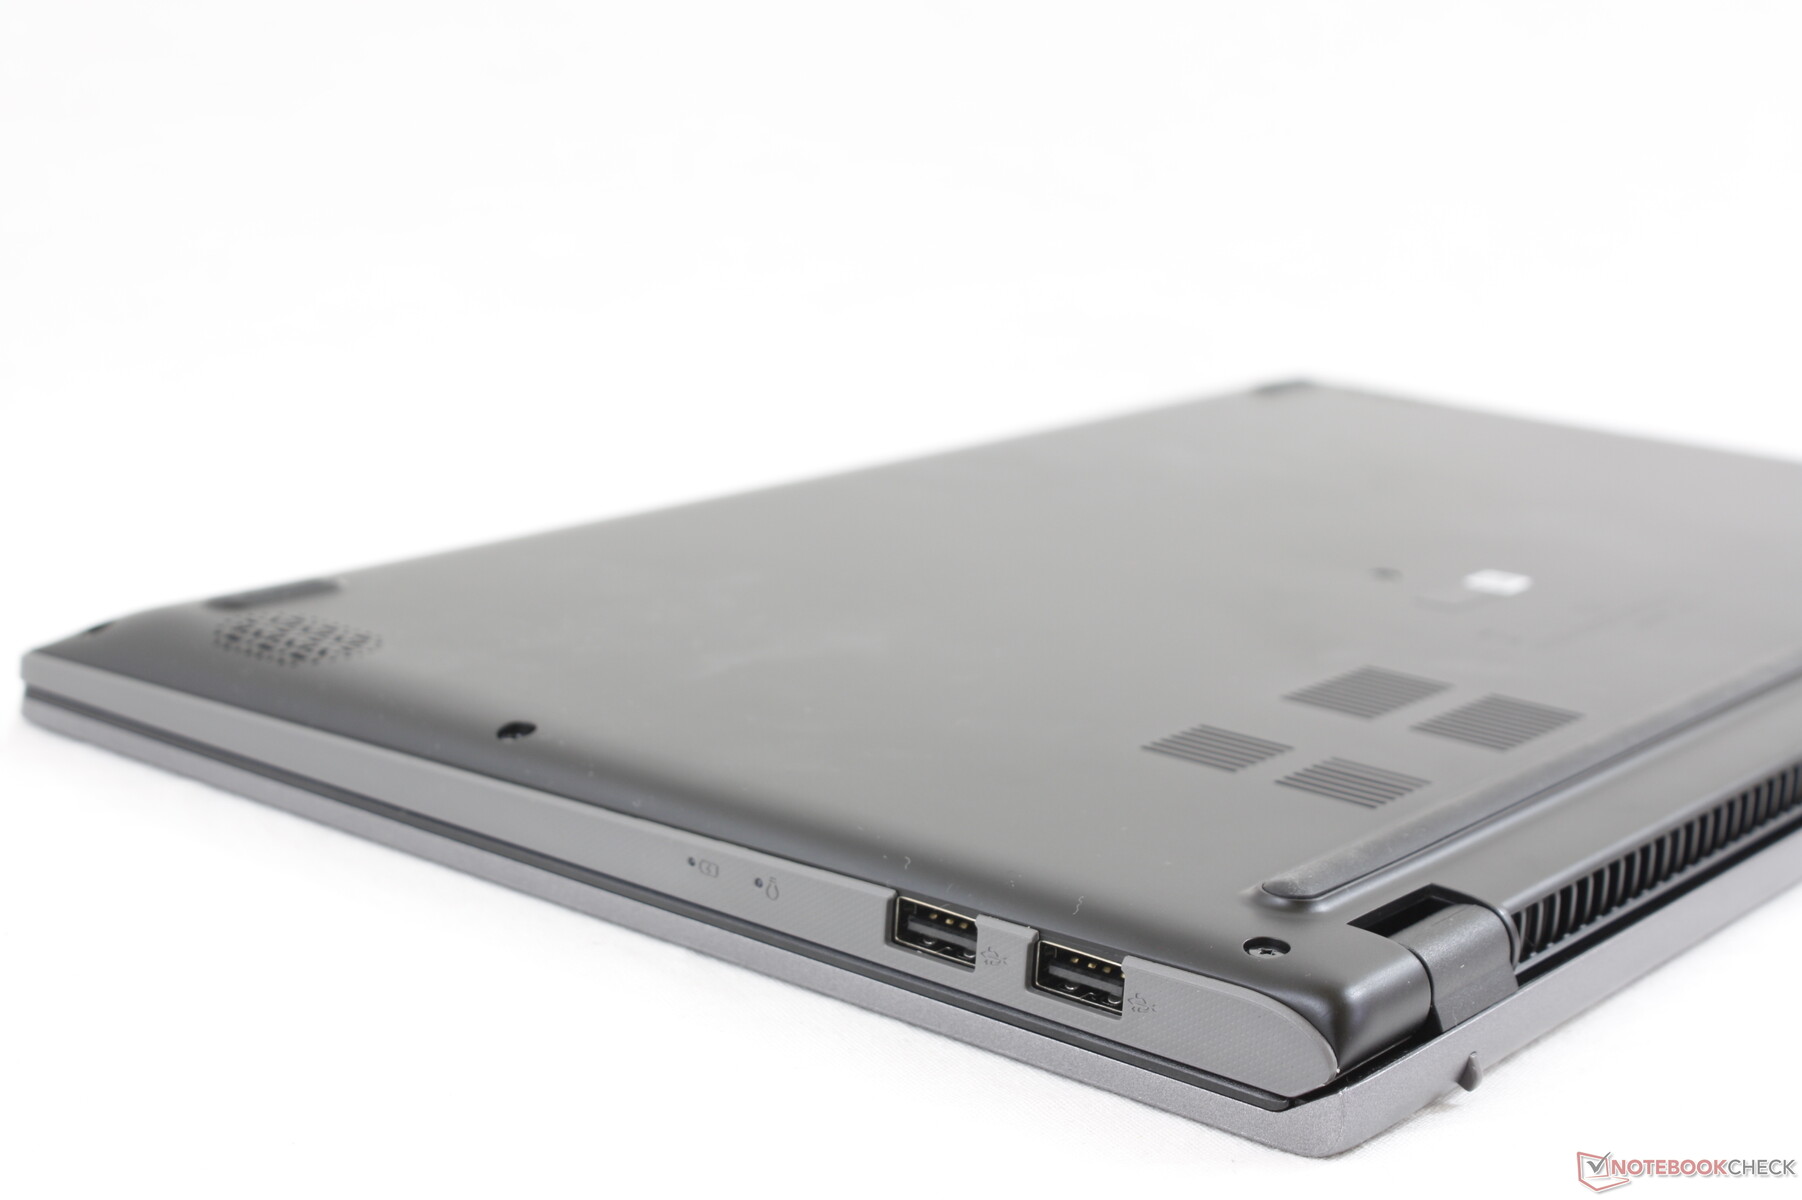
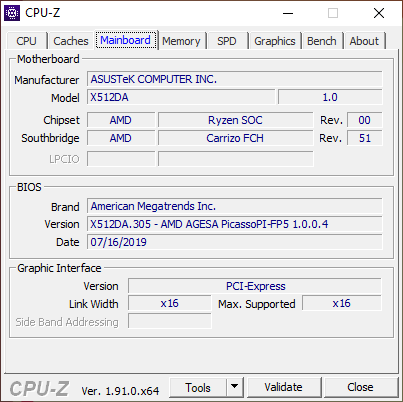
Bakım
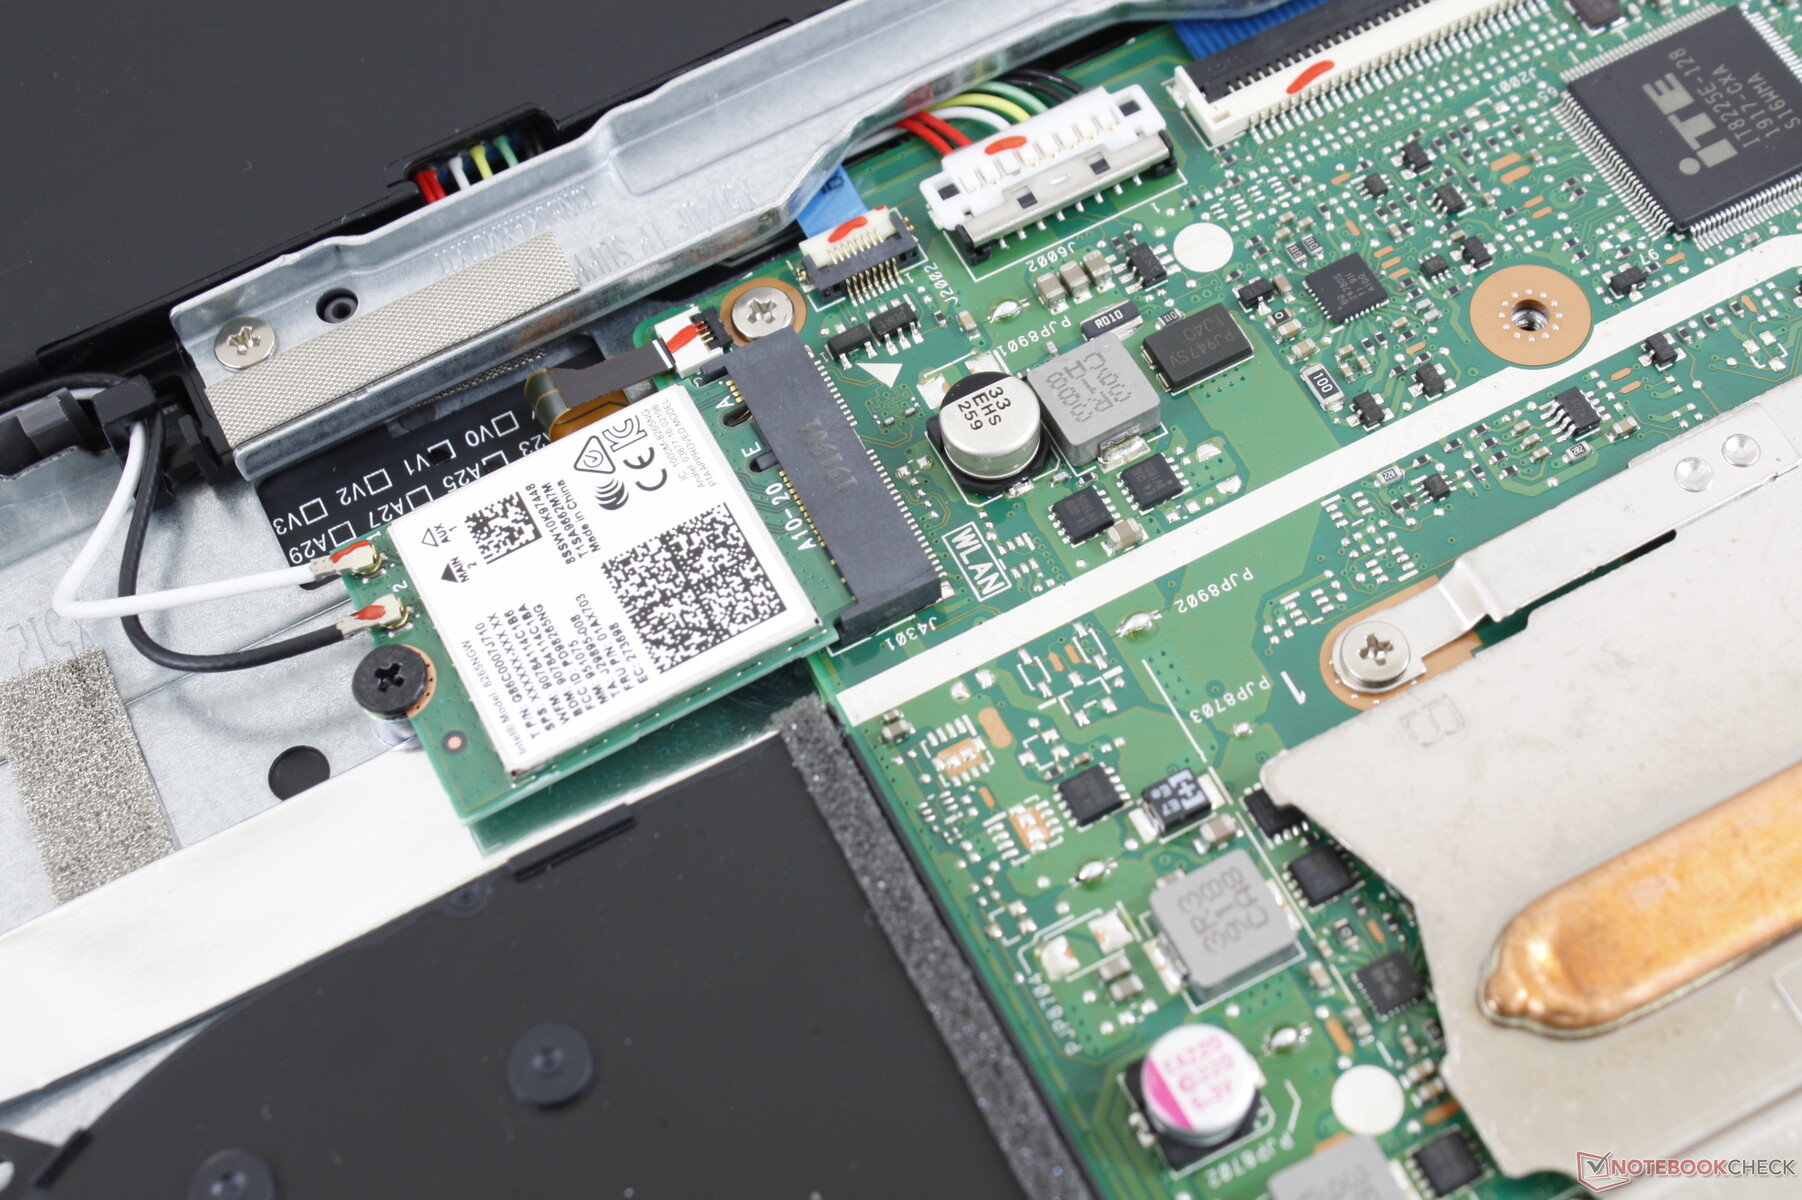
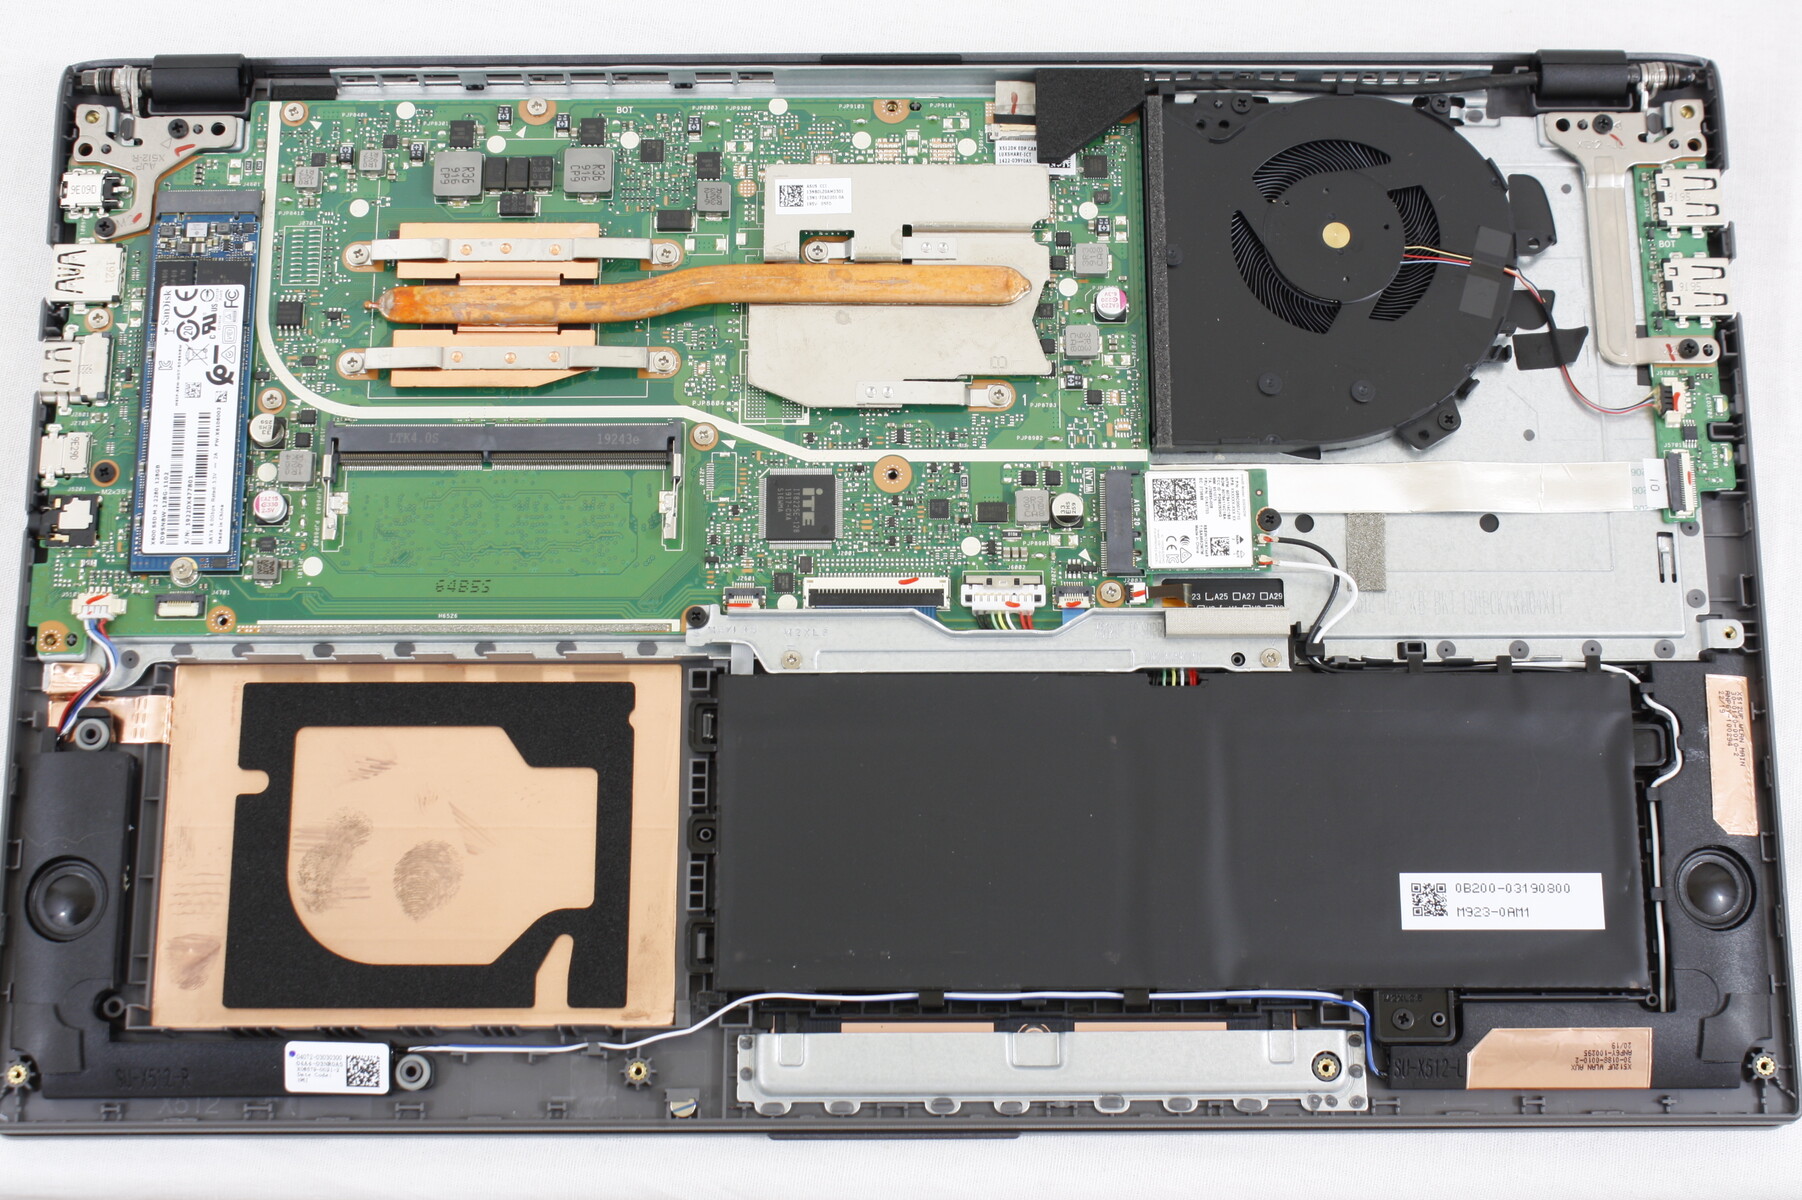
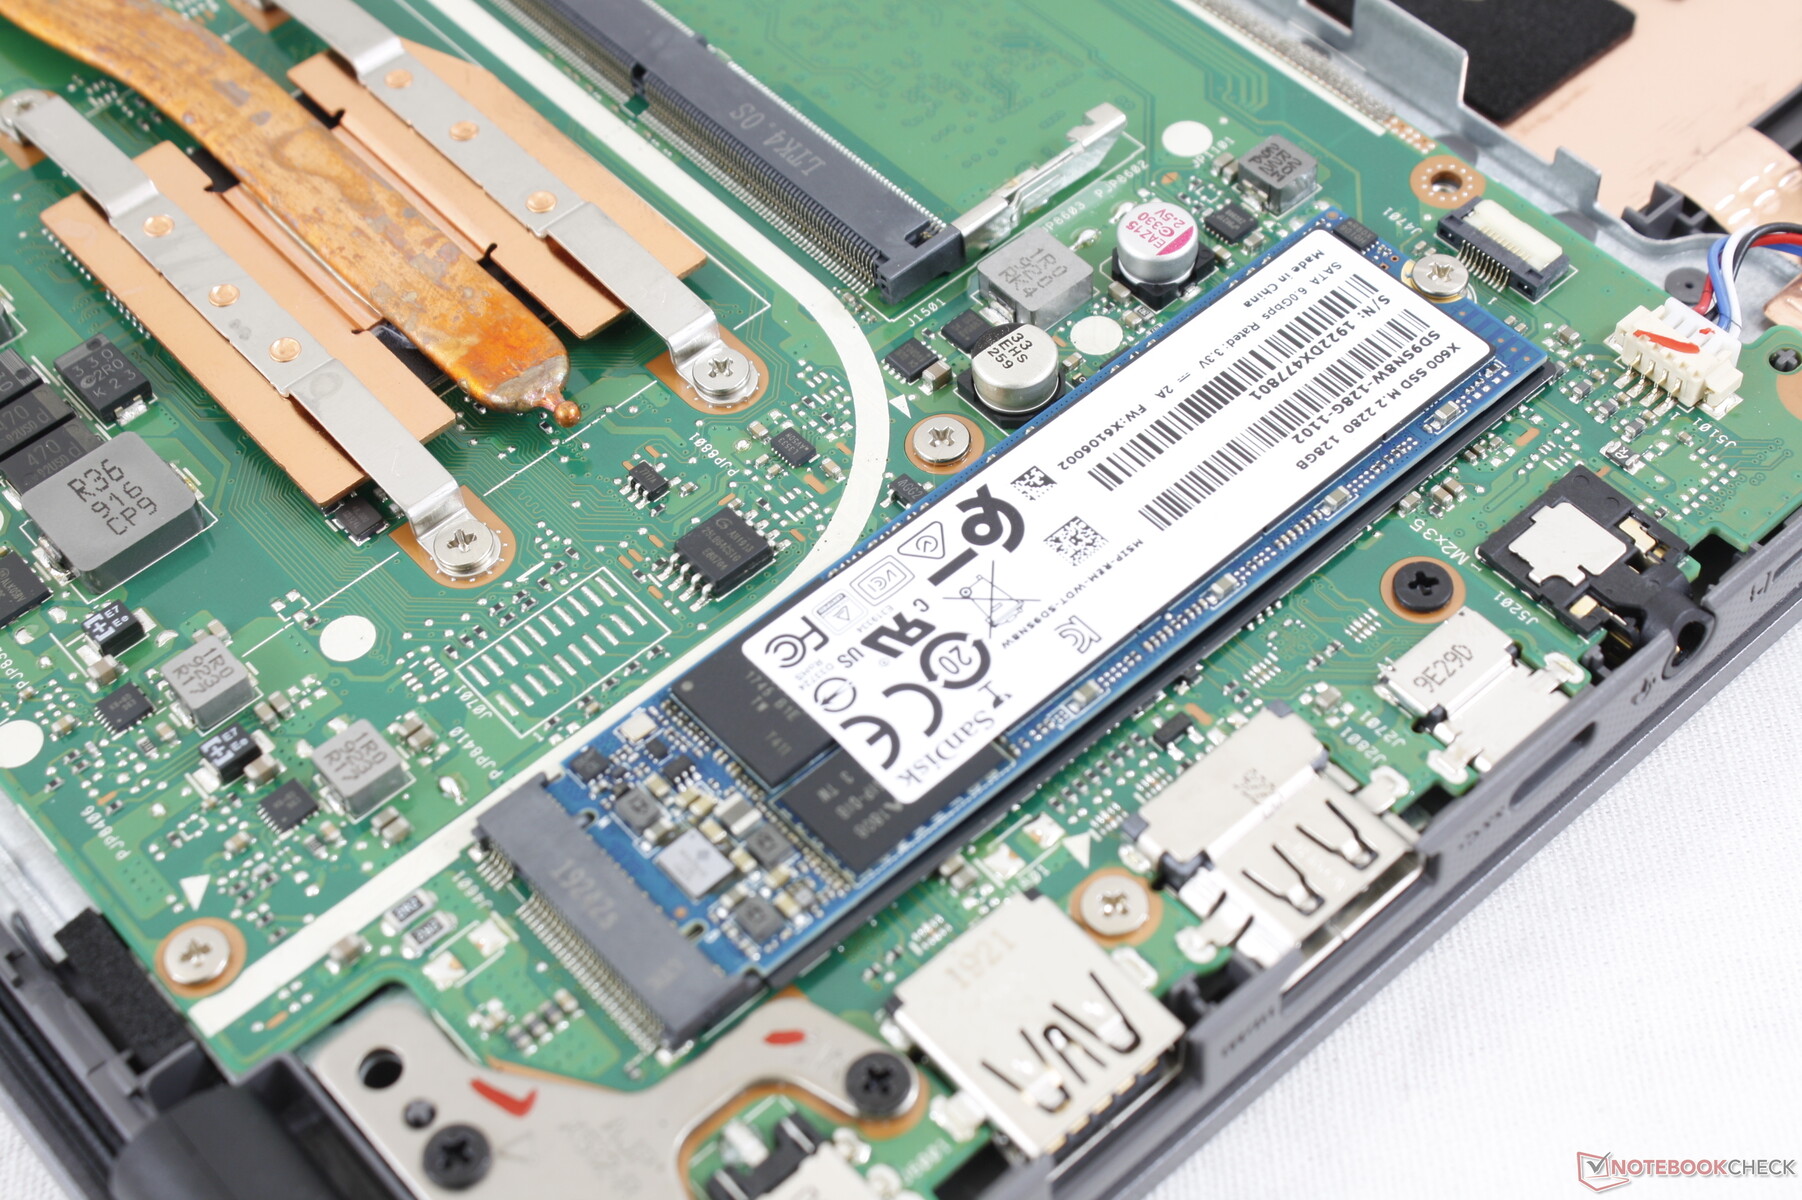
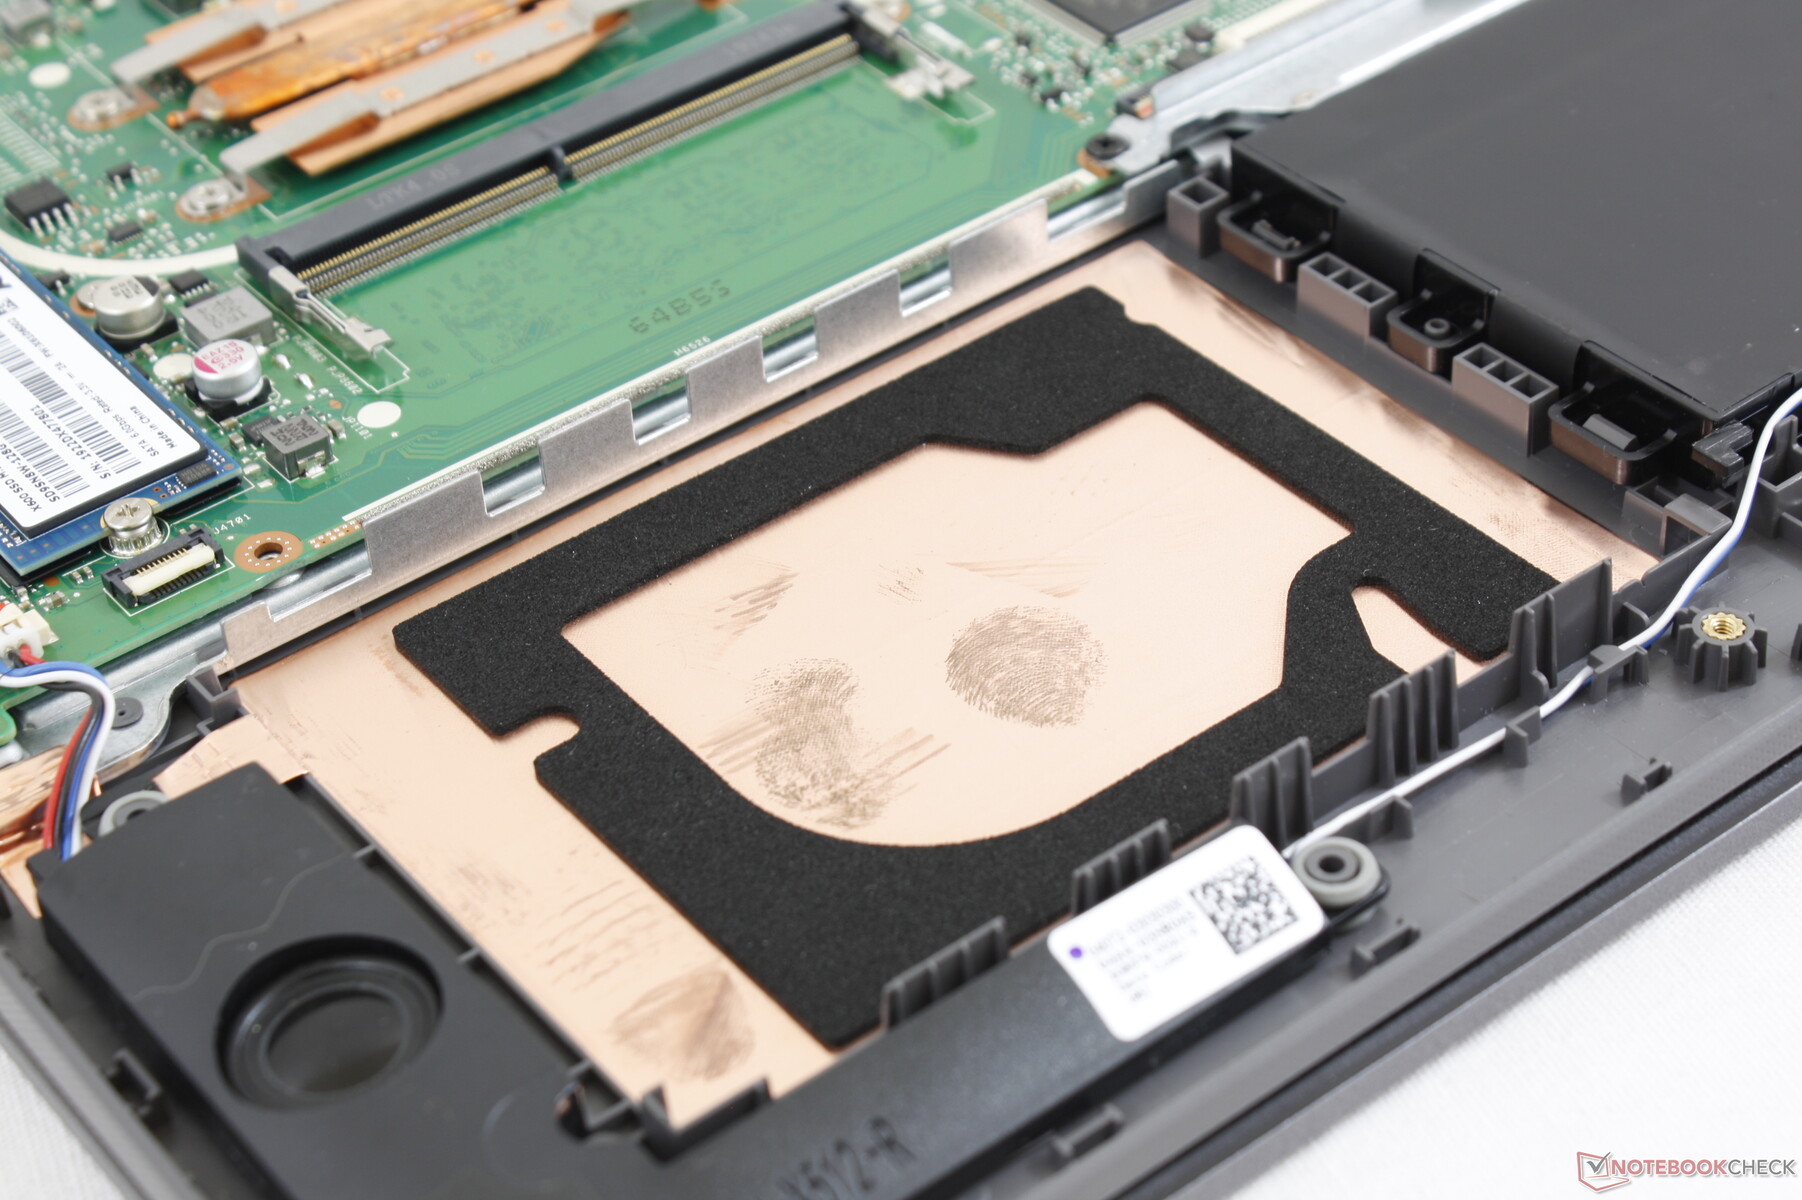
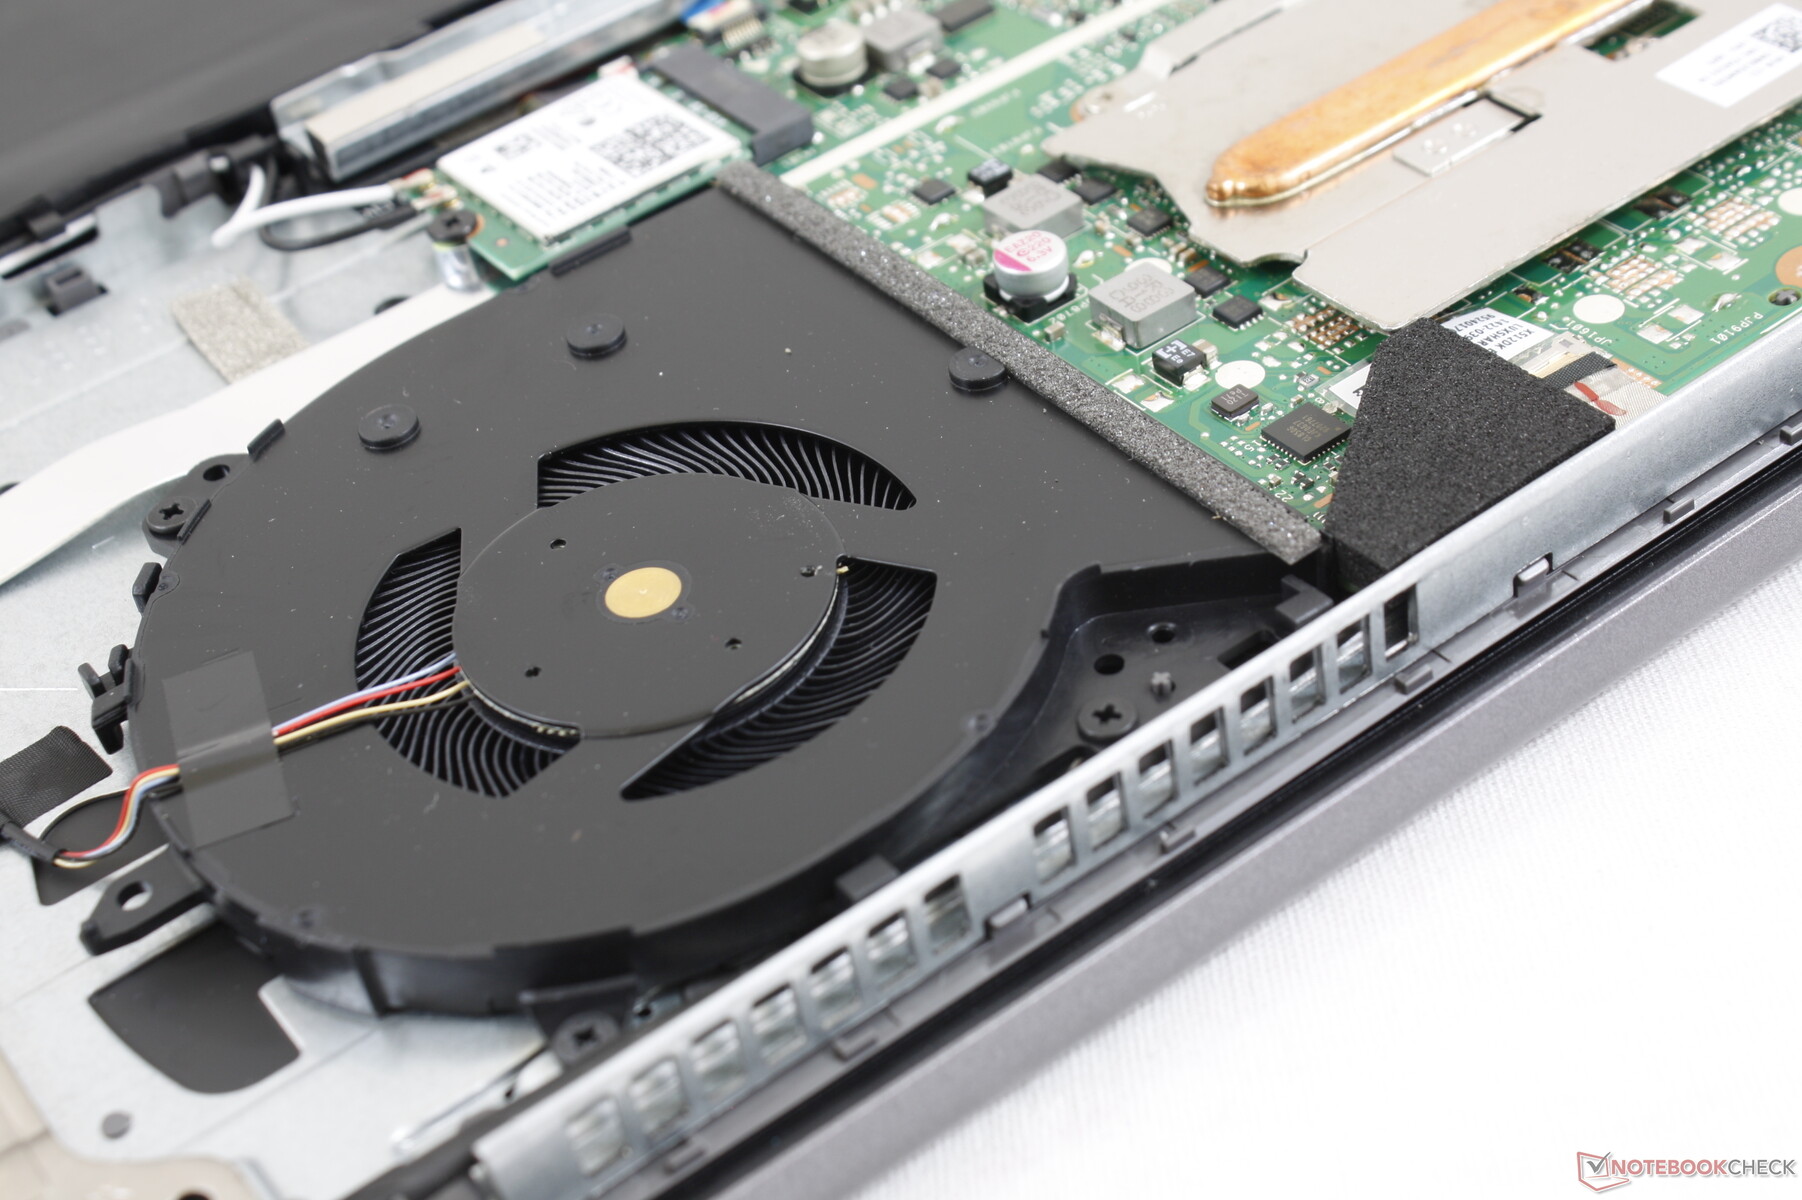
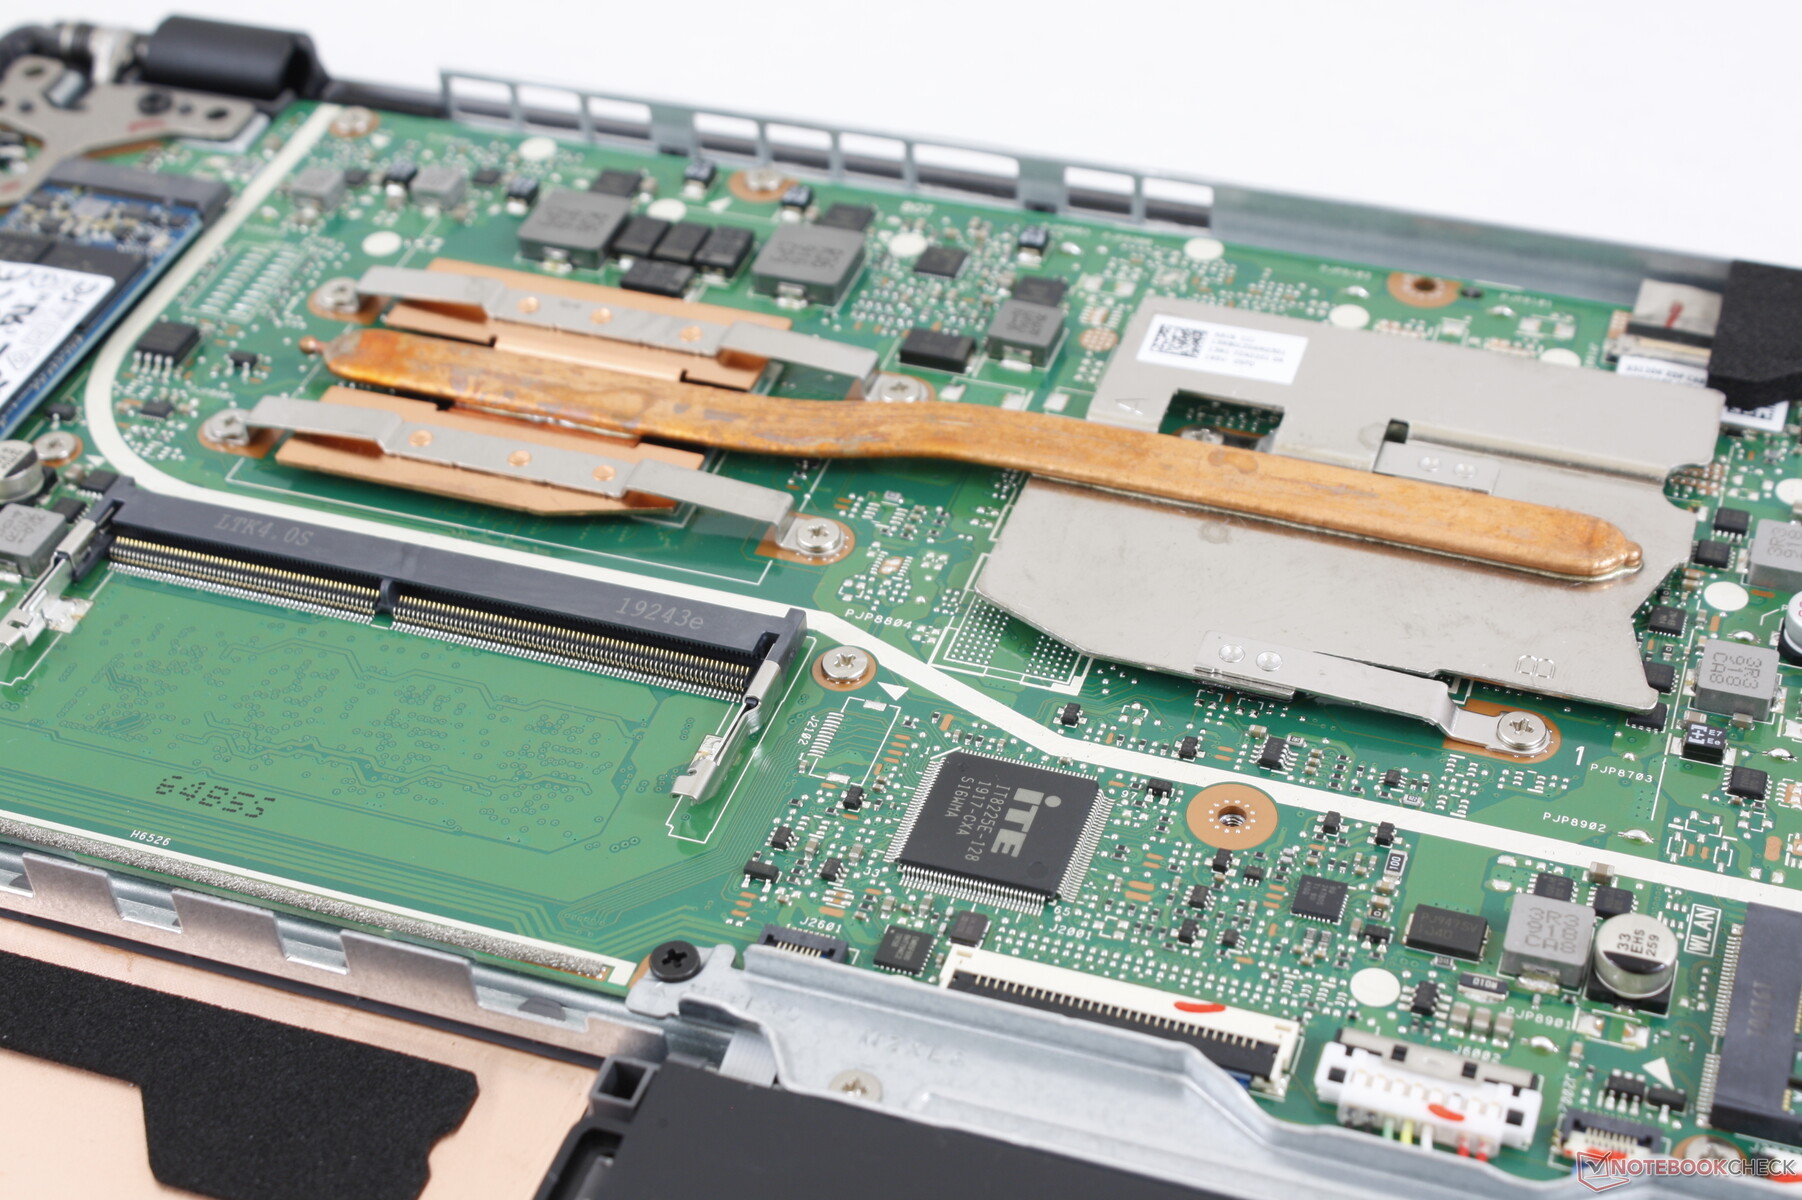
Yalnızca Philips tornavida gerektirdiğinden alt panelin çıkarılması kolaydır. İçeri girdikten sonra bir SODIMM yuvası ve bir M.2 2280 yuvası var. Pil ve sistem fanının yanındaki kullanılmayan büyük boşluklara dikkat edin.
Aksesuarlar ve Garanti
Kutuda AC adaptörü ve evrak işleri dışında hiçbir ekstra yoktur. Standart bir yıllık sınırlı garanti geçerlidir.
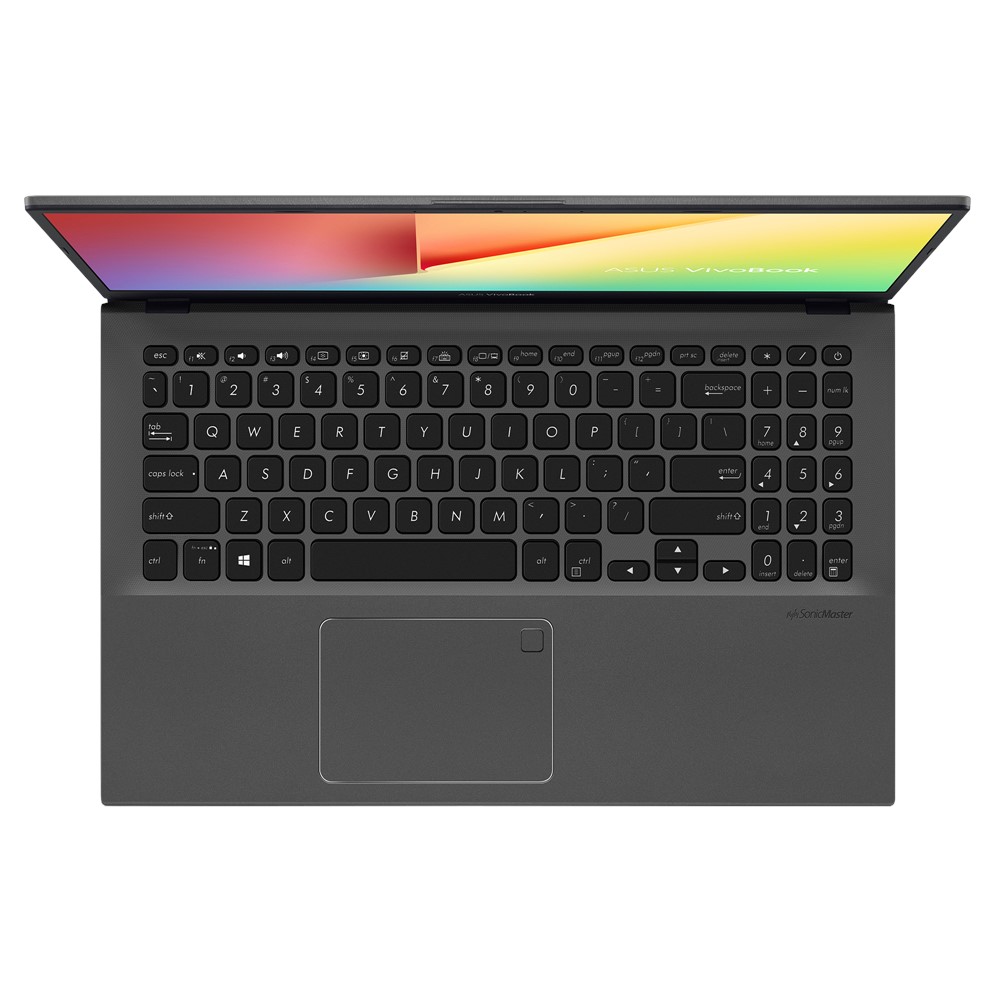
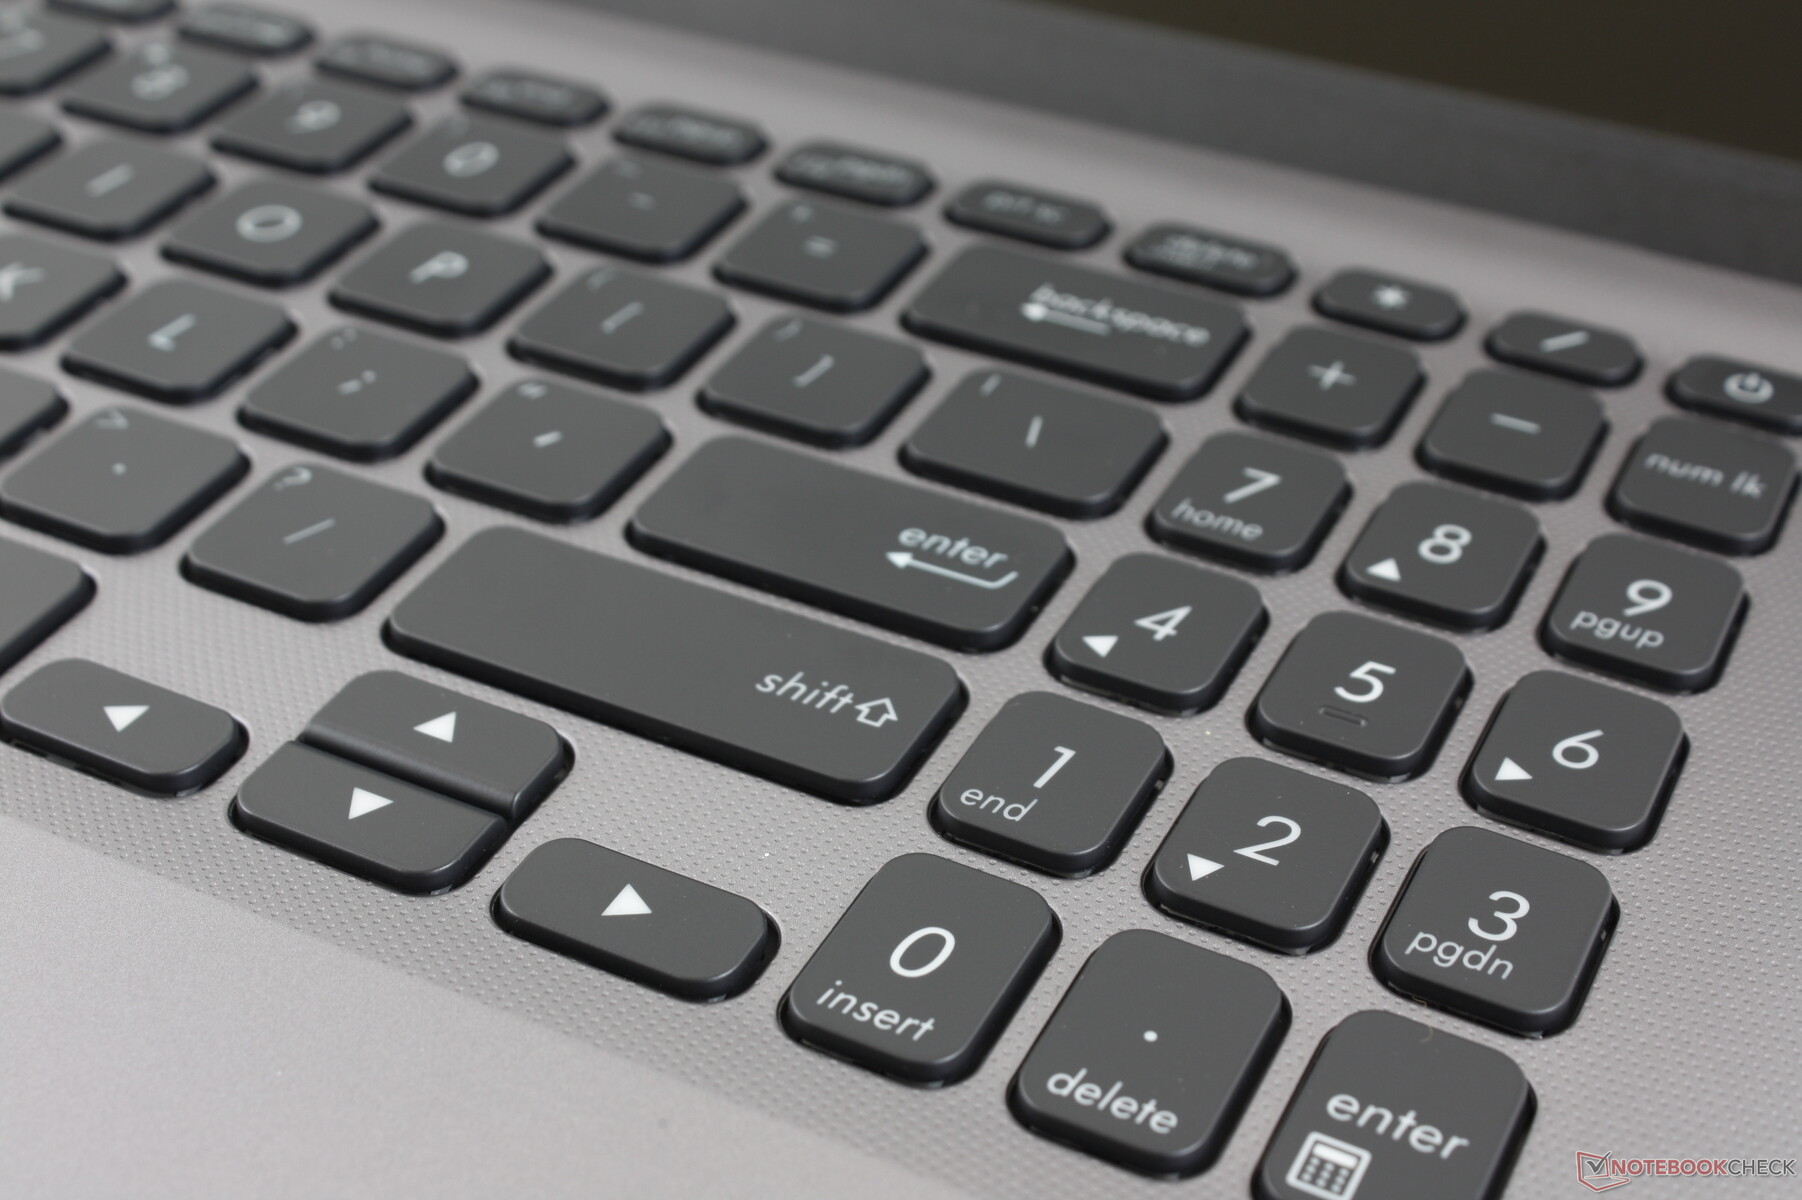
Giriş cihazları
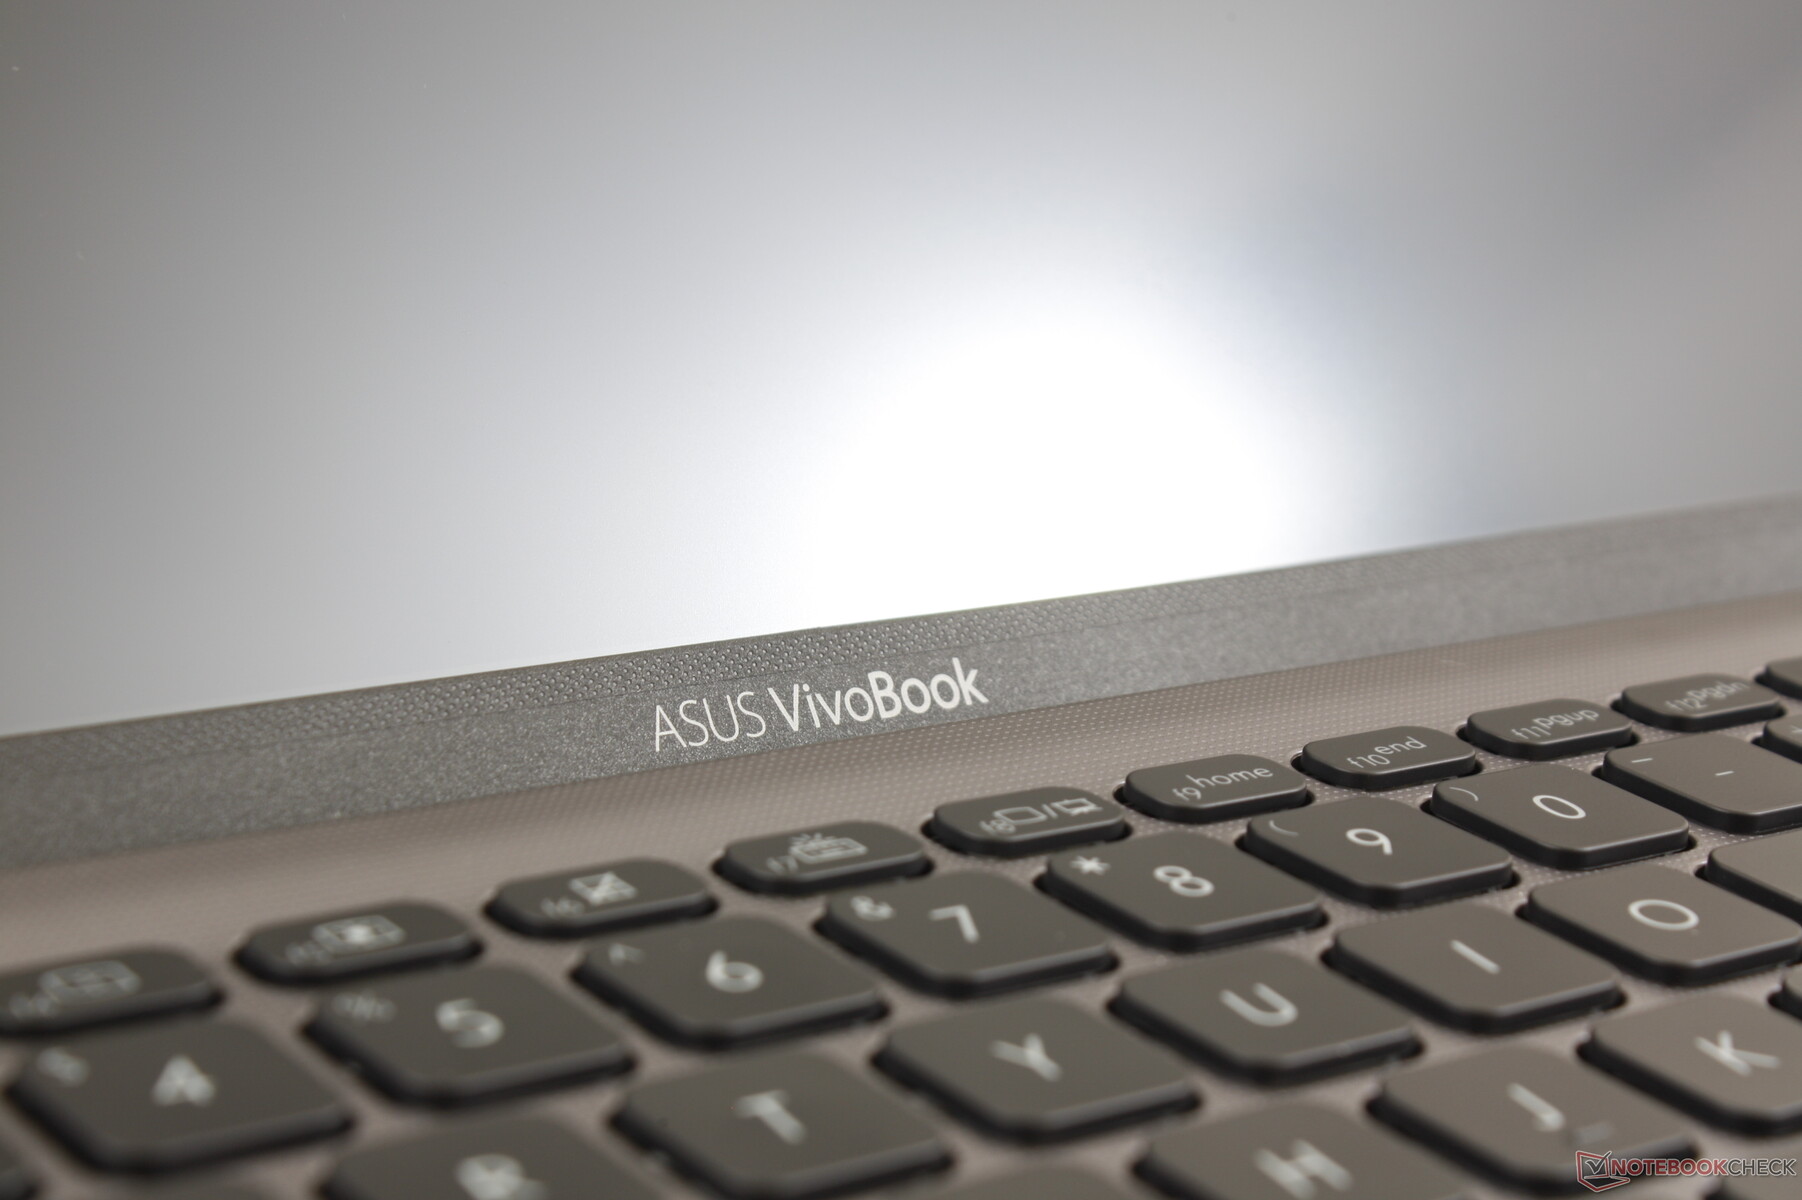
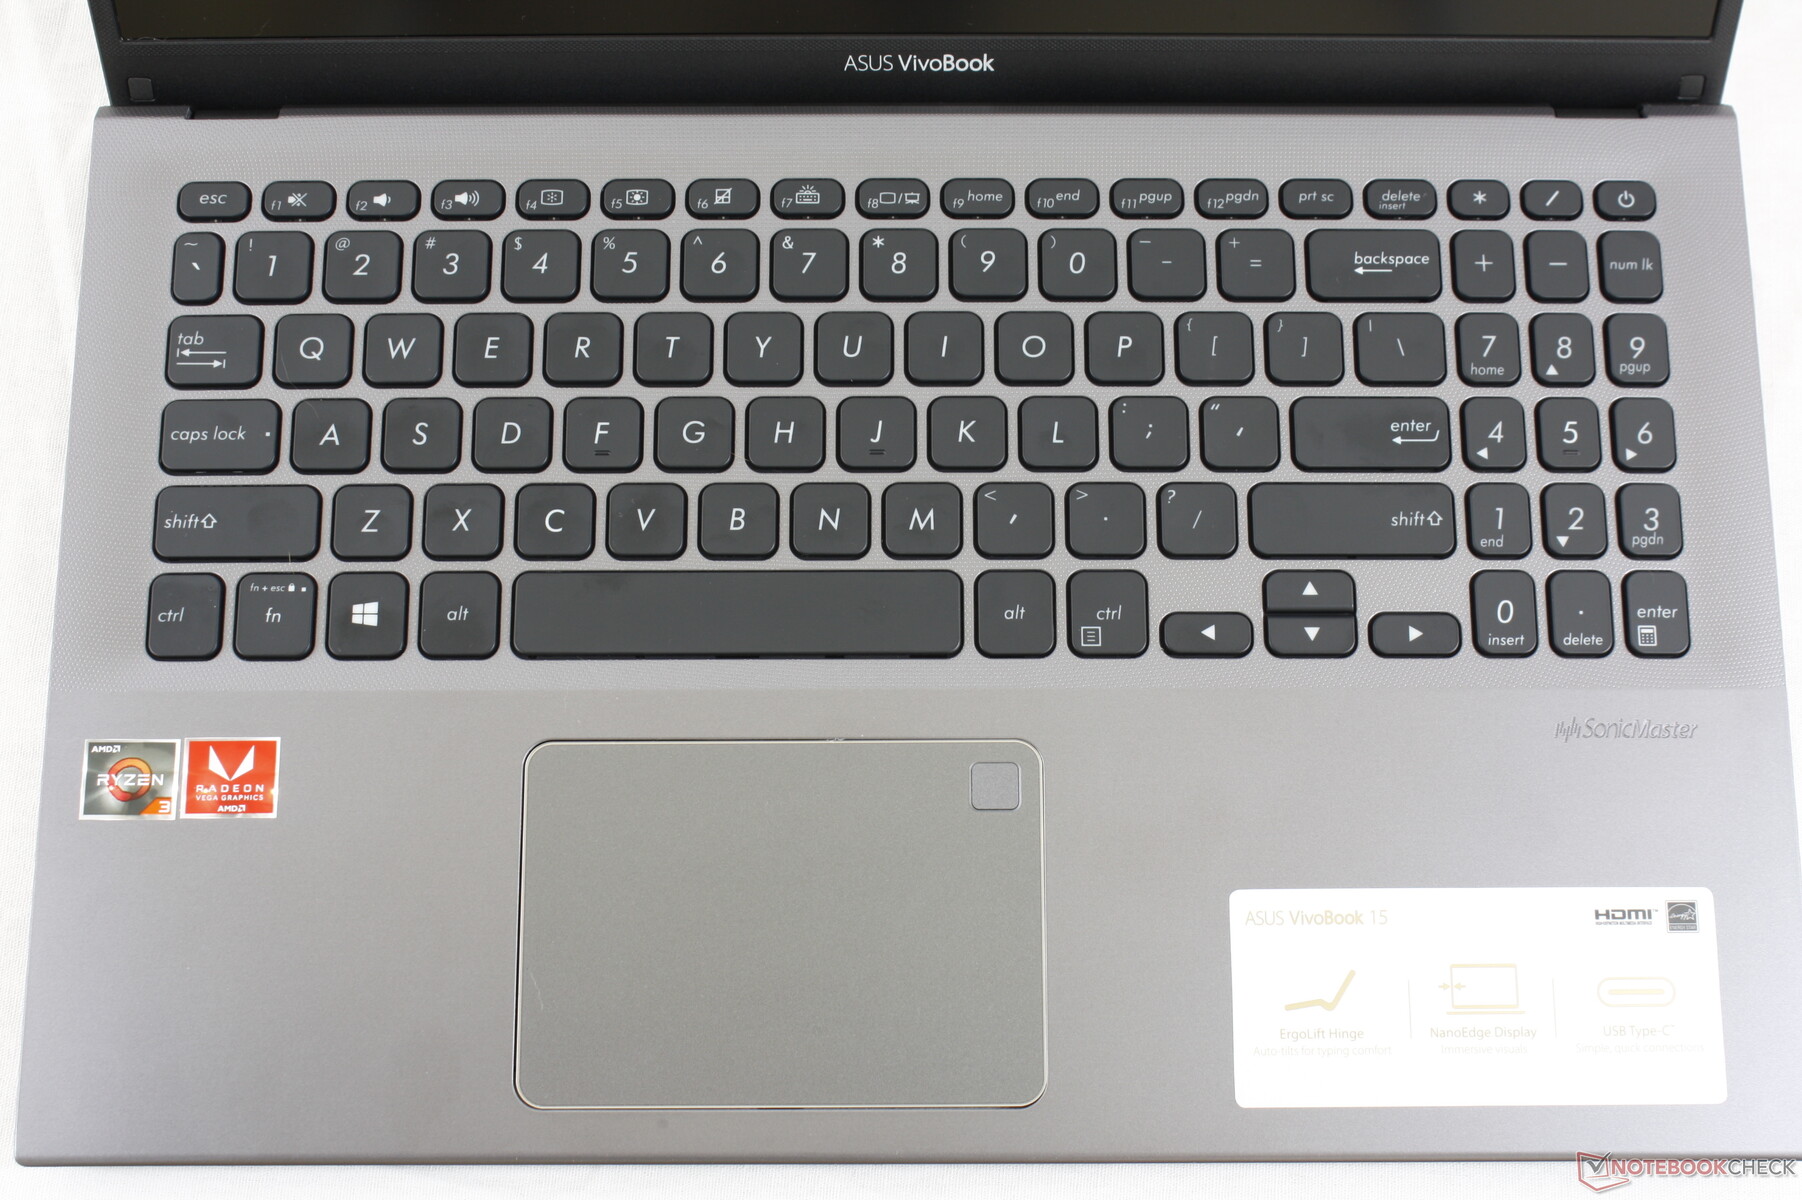
Arkadan aydınlatmalı klavye, VivoBook S15 S532'deki klavyeyle aynı boyut, düzen ve his ile aynıdır. Ana QWERTY anahtarları 500 $ alt fiyat noktasını göz önünde bulundurarak harika geri bildirimlere sahiptir, ancak sıkışık NumPad anahtarları ve küçük Ok tuşları çok süngerimsi ve rahatsızdır.
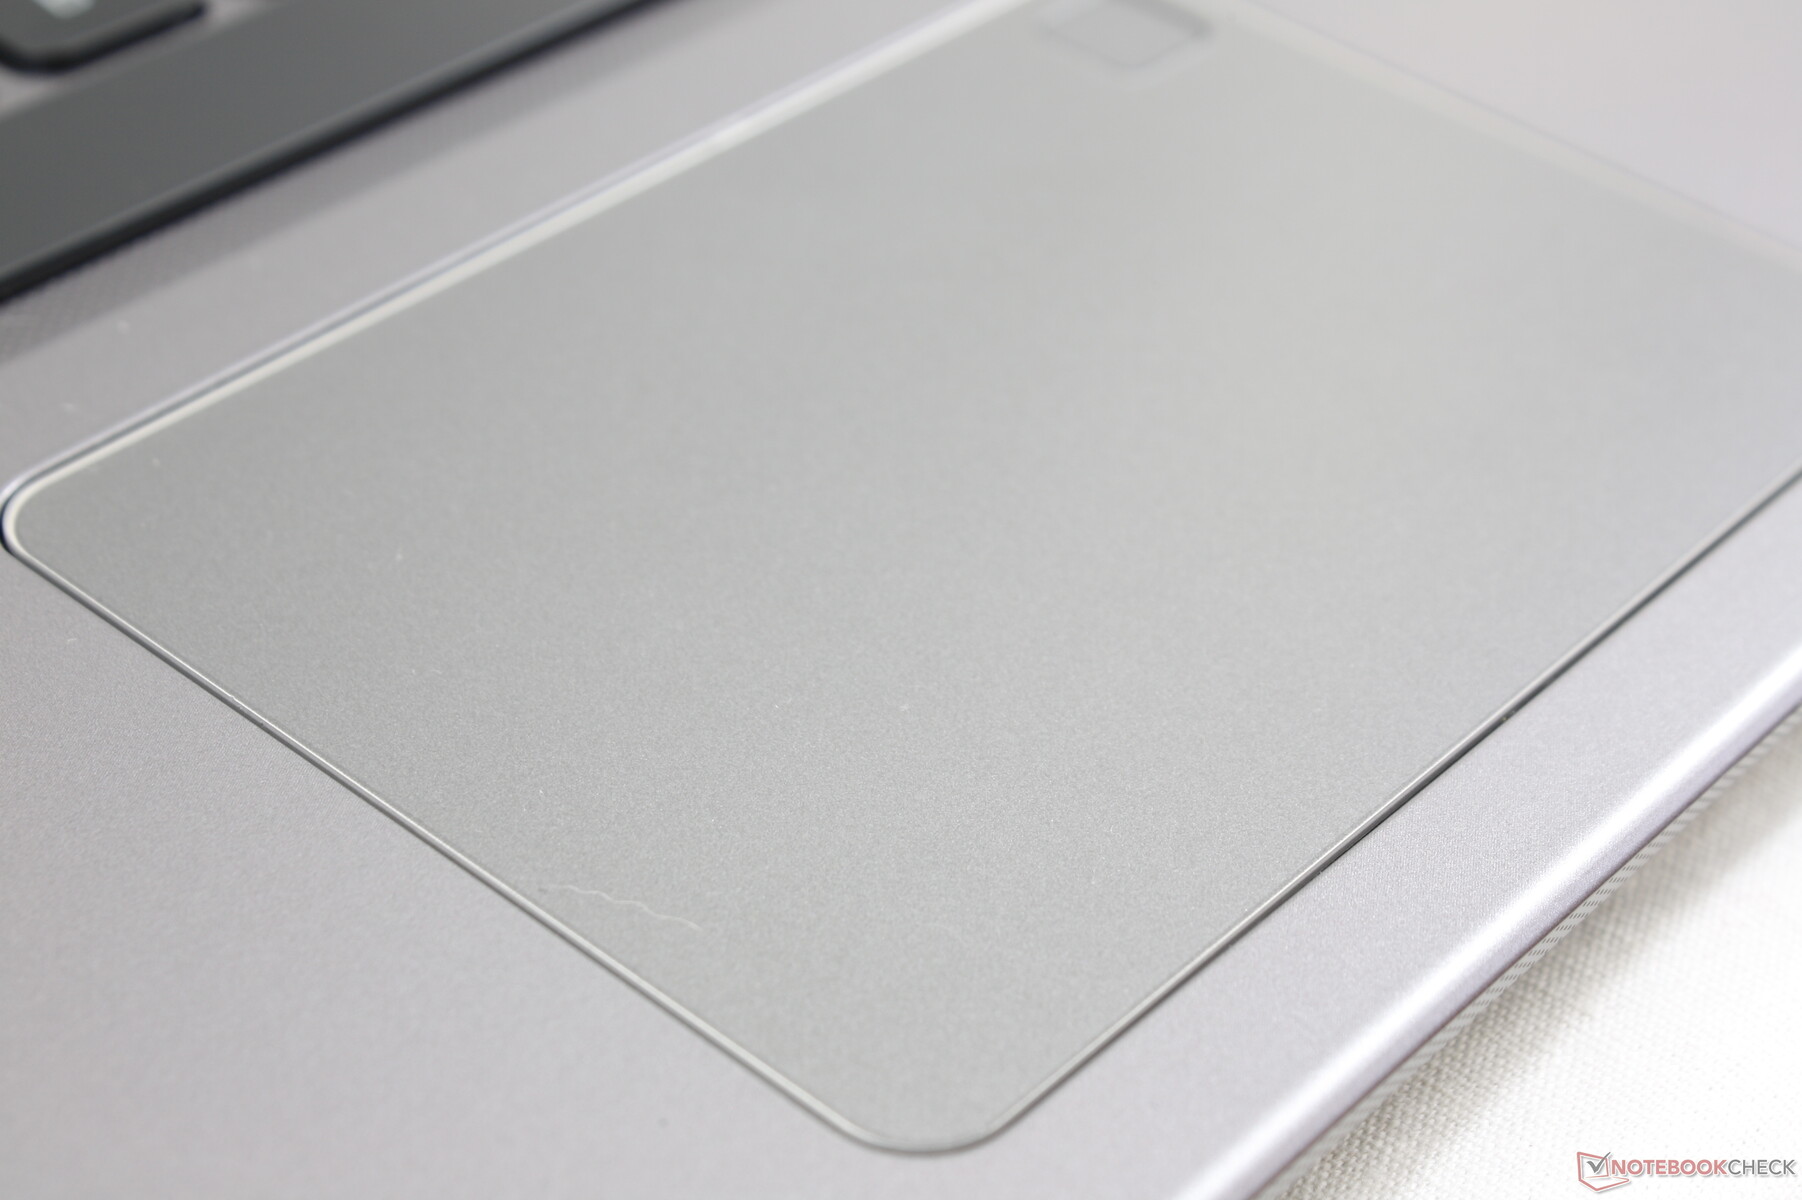
Dokunmatik
Hassas özellikli tıklama yüzeyi (10,5 x 7,4 cm) ZenBook 15'tekinden (13 x 6,7 cm) daha küçüktür. İmleç hareketi, fark edilir hatalar veya imleç atlama olmadan pürüzsüzdür. Bununla birlikte, tıklamak süngerimsi hissediyor ve daha sıkı olabilirdi.

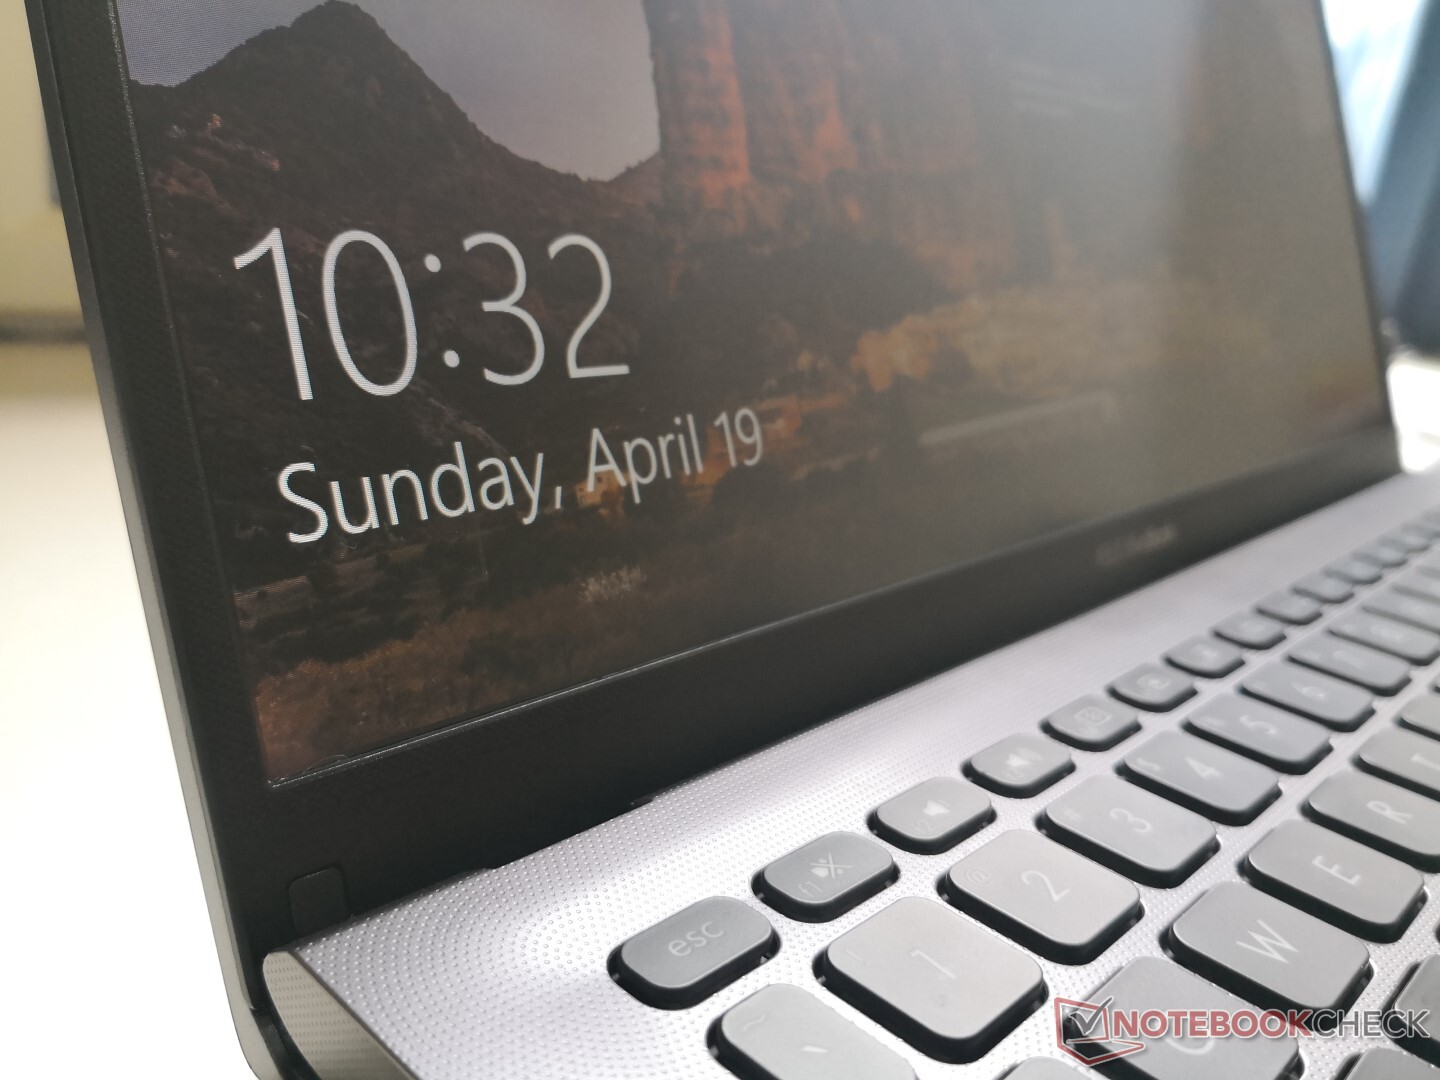
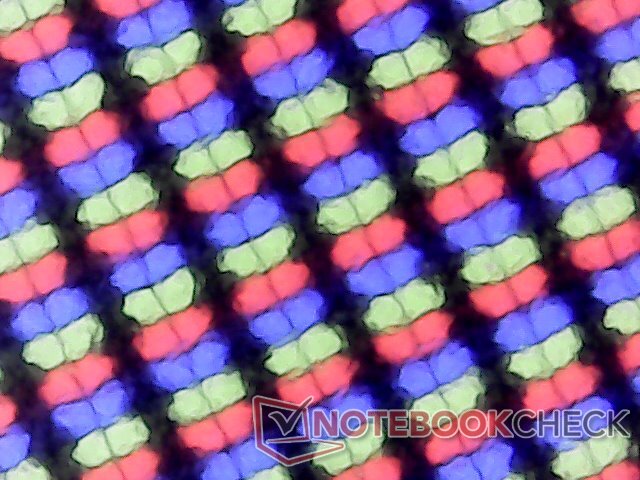
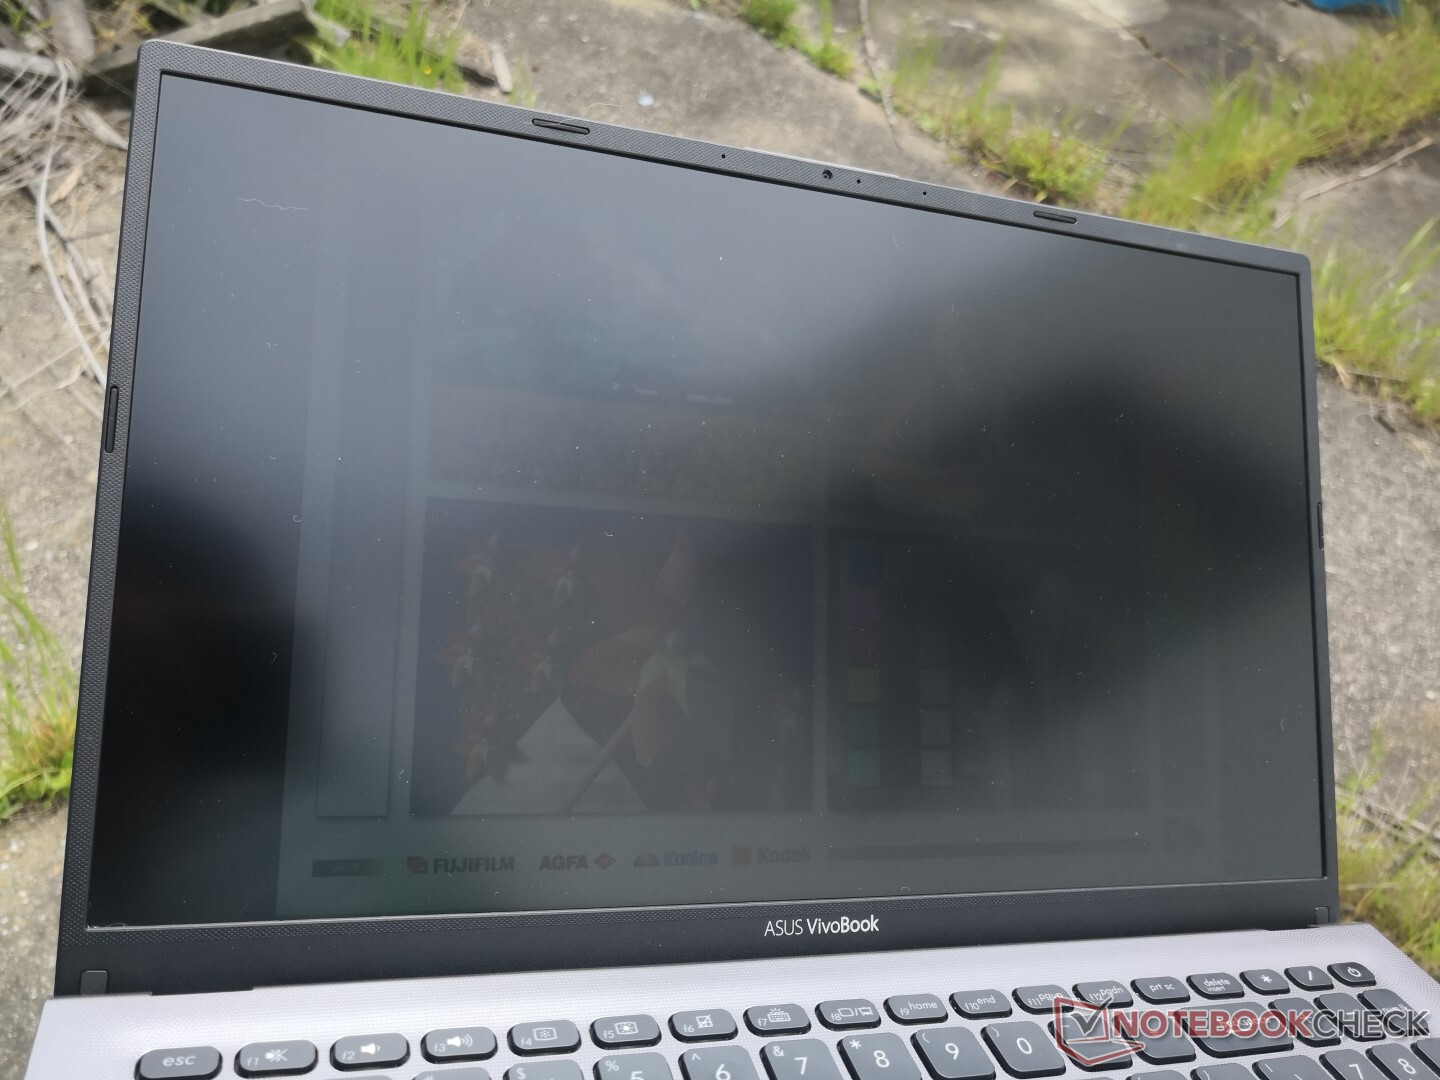
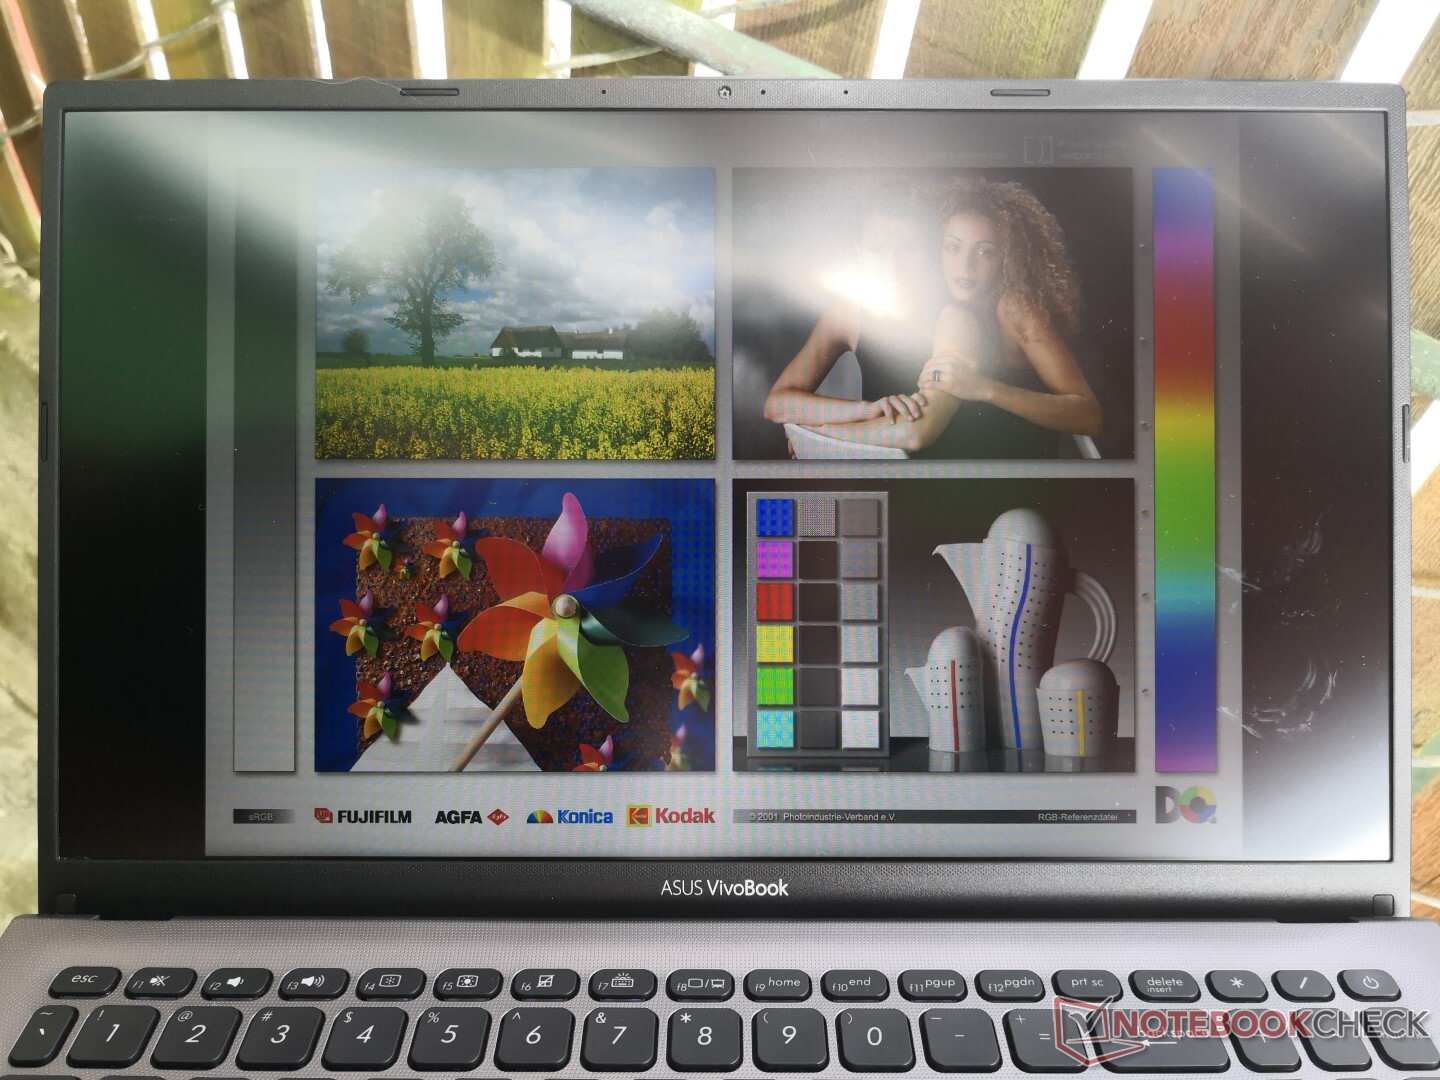
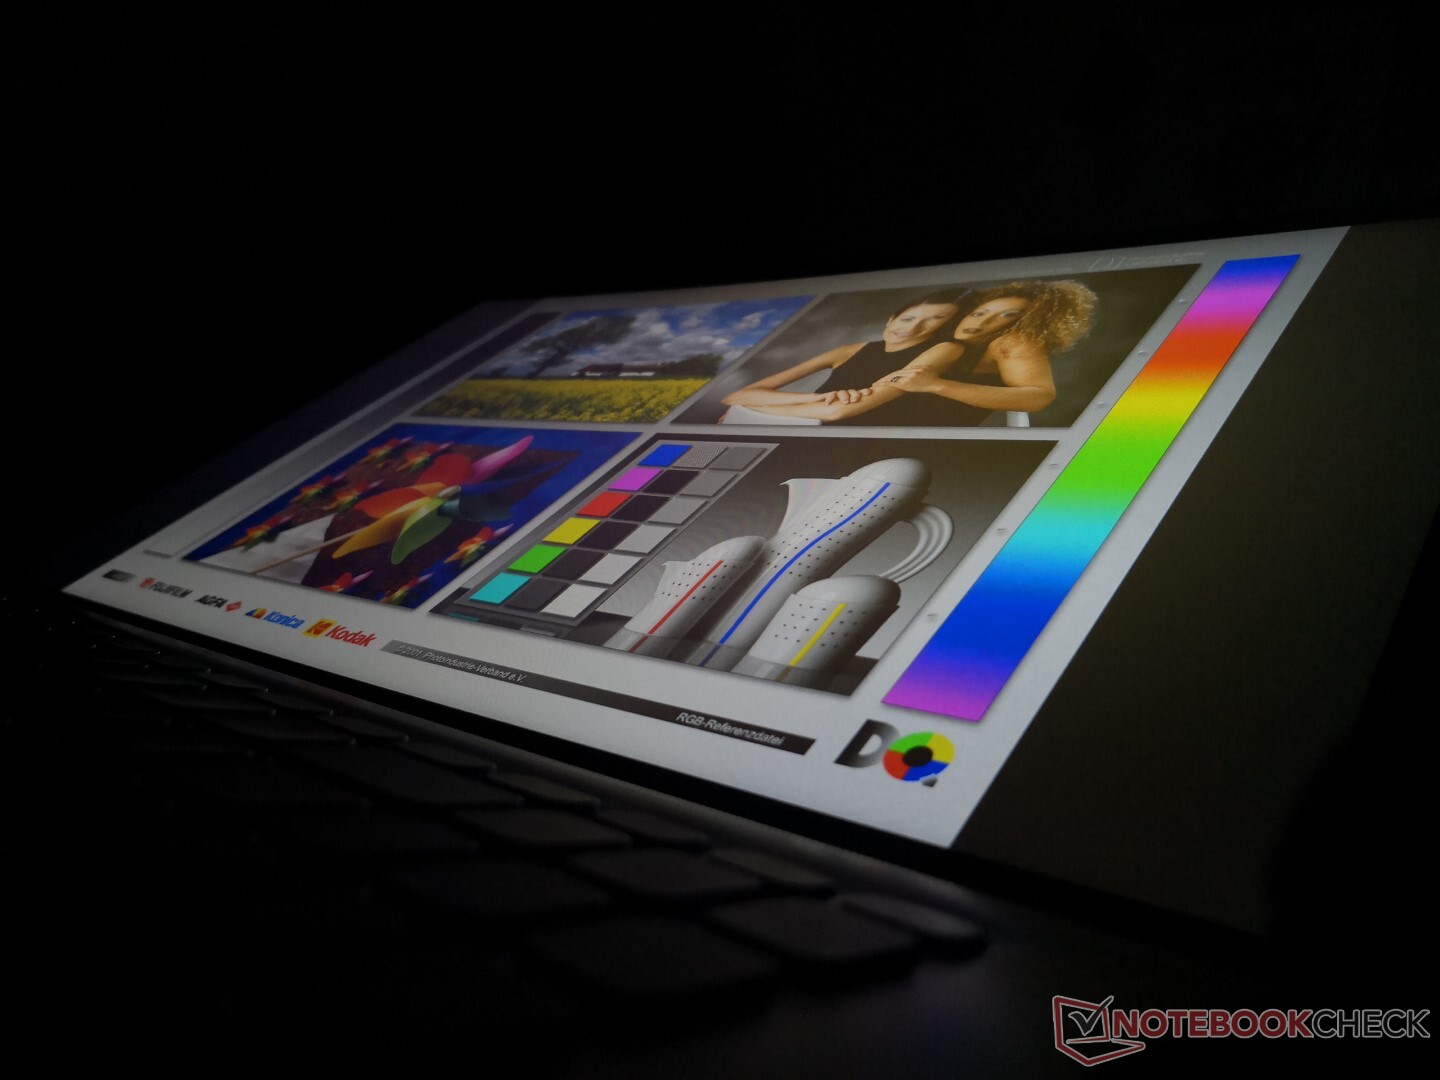
Görüntüle
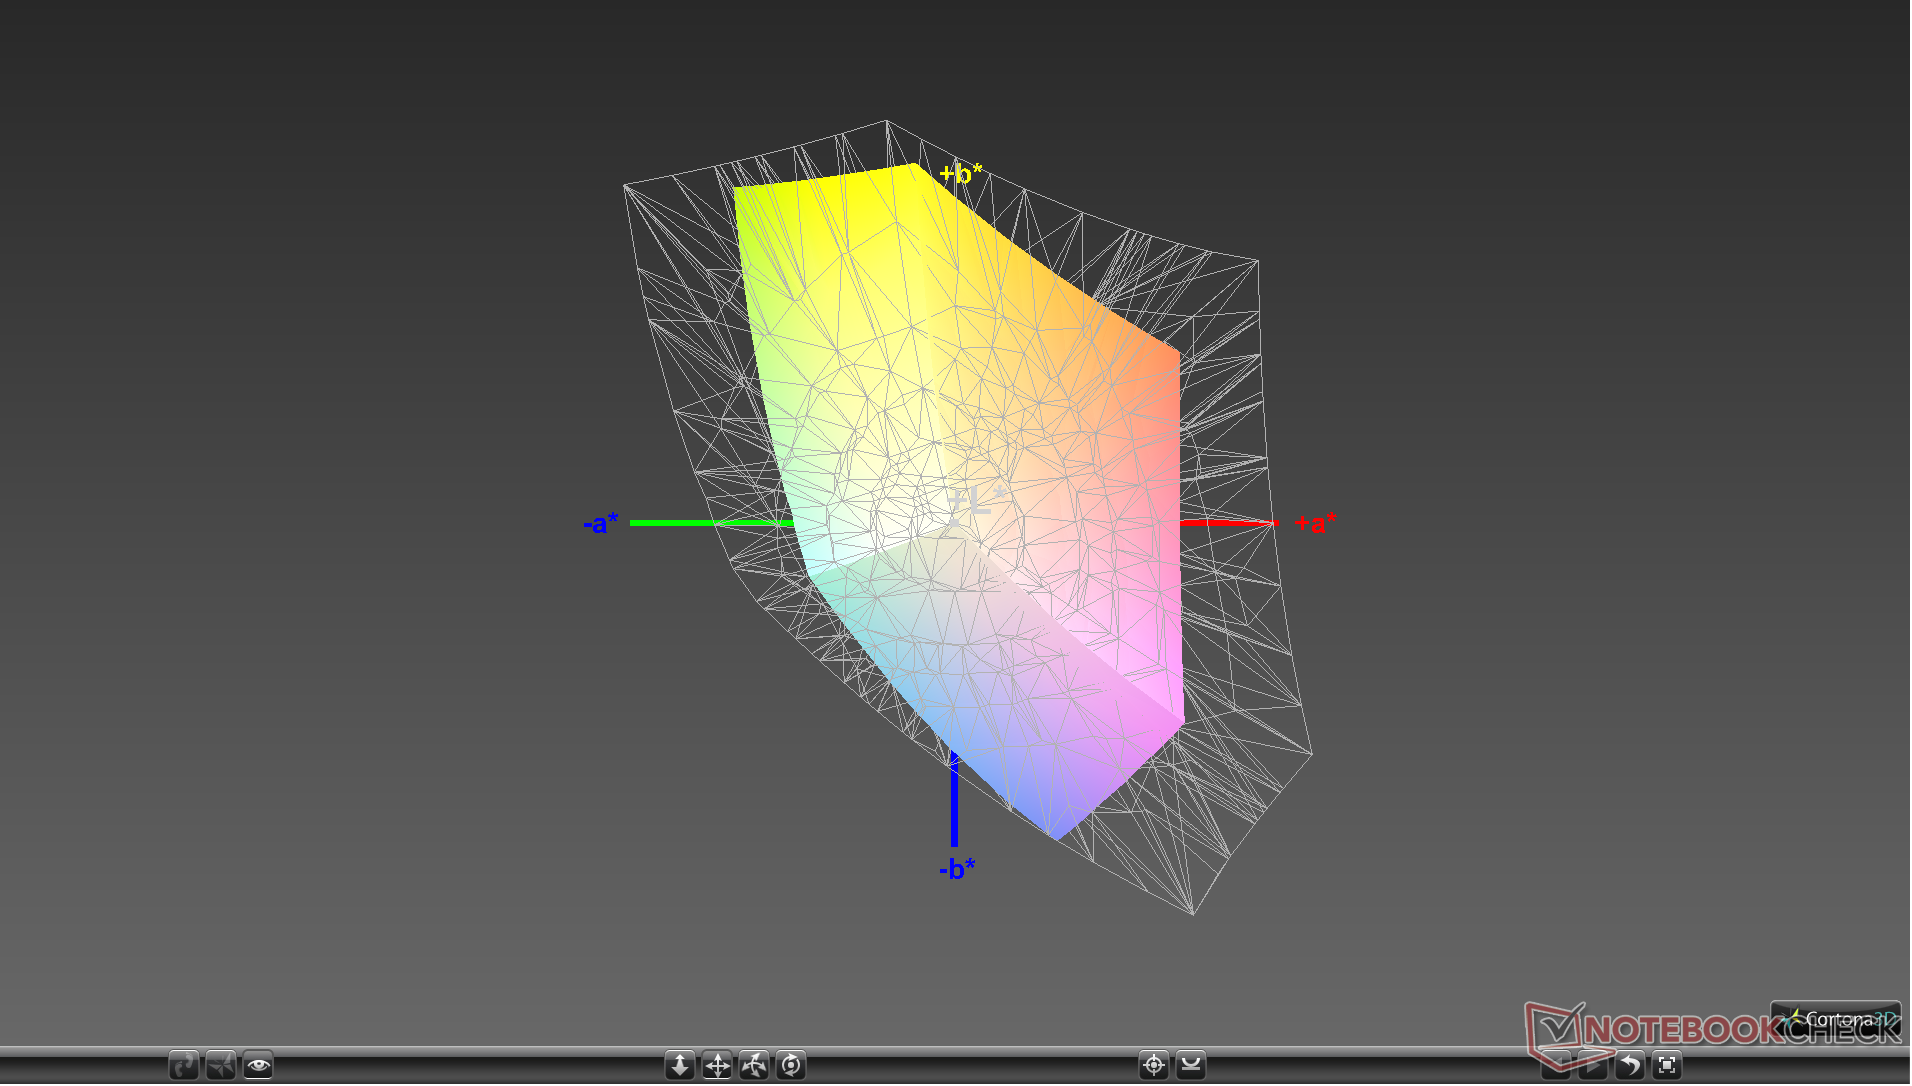
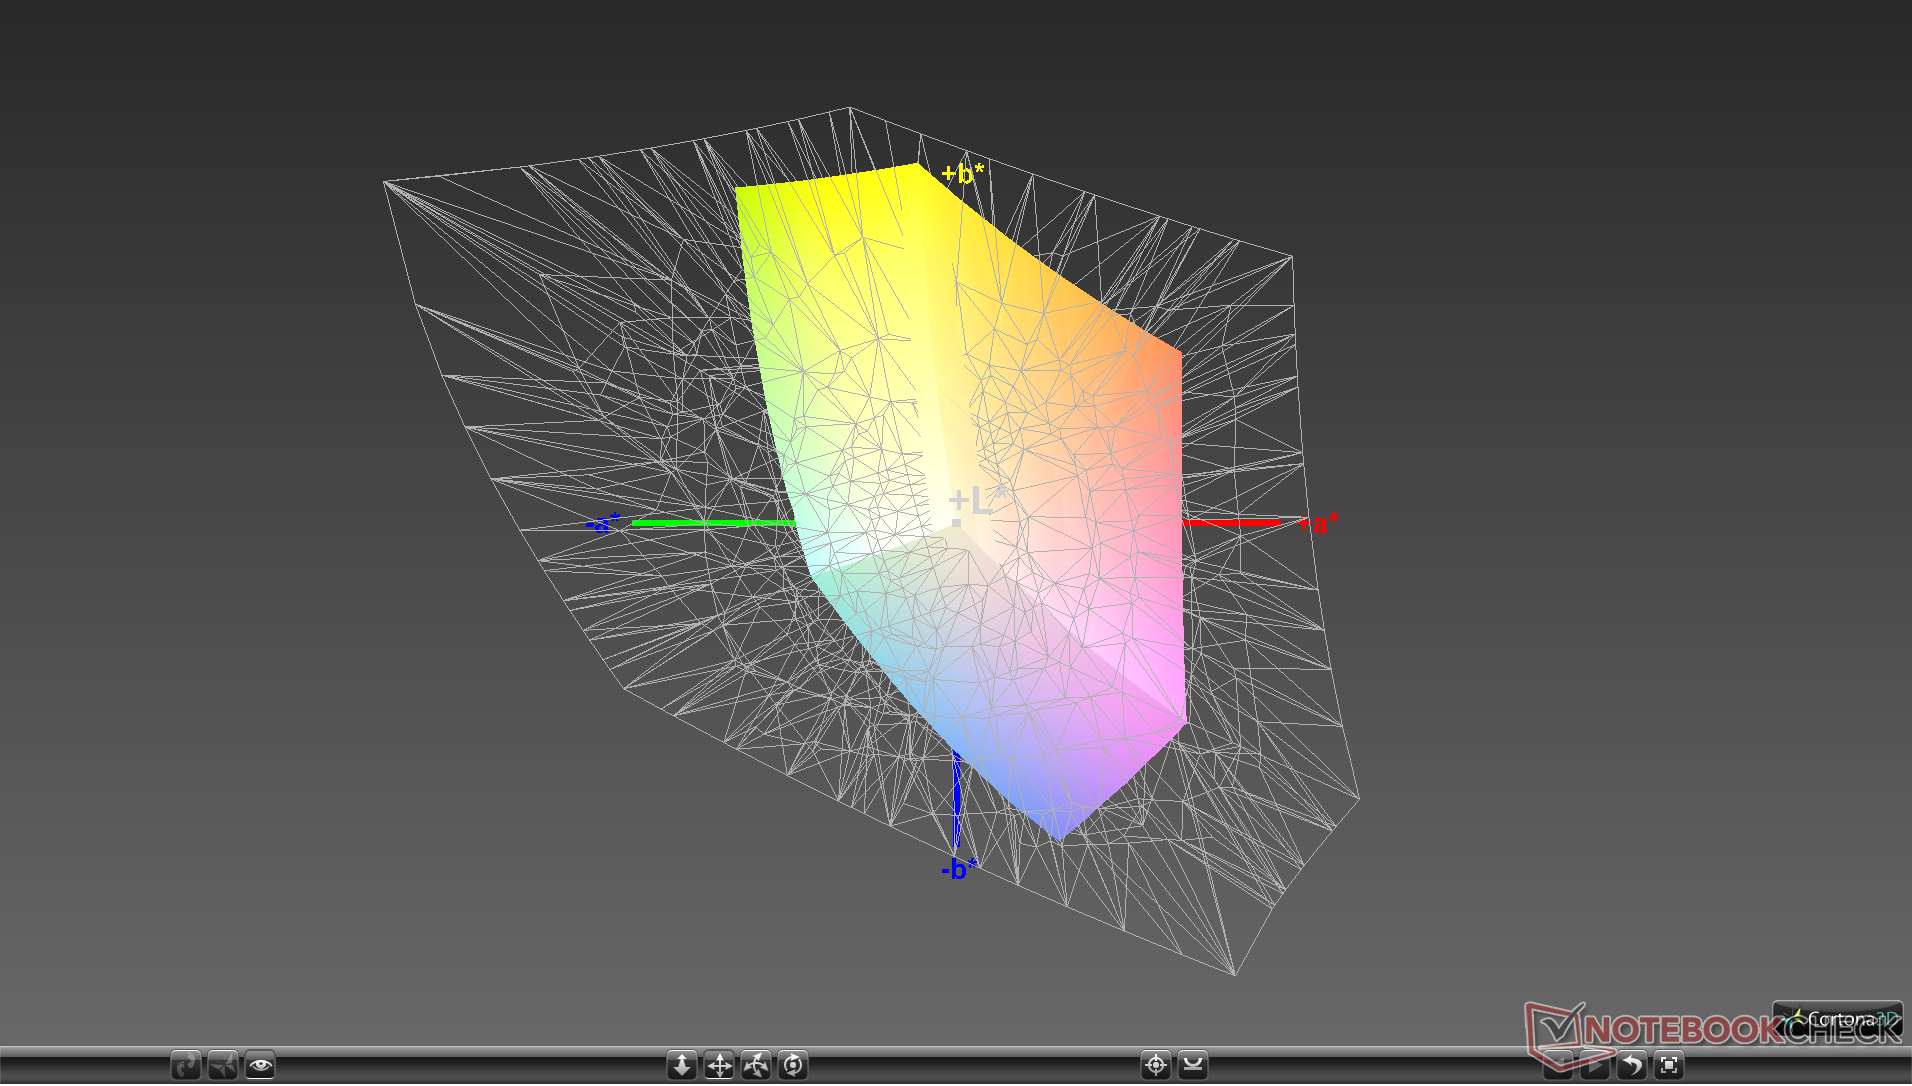
AU Optronics B156HAN02.1 IPS paneli, ThinkPad E590 ve Asus'un kendi 2017 VivoBook S15 S510UQ'su da dahil olmak üzere bir dizi diğer 15,6 inçlik dizüstü bilgisayarlarda bulunabilir. Sadece 300: 1'lik düşük kontrast oranı ve sadece yüzde 58'lik dar sRGB renk alanı kapsamı, ucuz bir panelin göstergesidir. En üst düzey Ultrabook kalitesini beklemesek de, IdeaPad S340 gibi rakip bazı düşük kaliteli dizüstü bilgisayarların Asus'umuzdan daha iyi bir görüntüleme deneyimi için daha parlak ekranları ve çok daha yüksek kontrast oranları var. mat ekranlarda yaygındır. Ekran, pop veya süper net metinler ve görüntüler bekleyen renkler beklemediğiniz sürece işi yapar.


| |||||||||||||||||||||||||
Aydınlatma: 89 %
Batarya modunda parlaklık: 216.3 cd/m²
Kontrast: 294:1 (Siyah: 0.86 cd/m²)
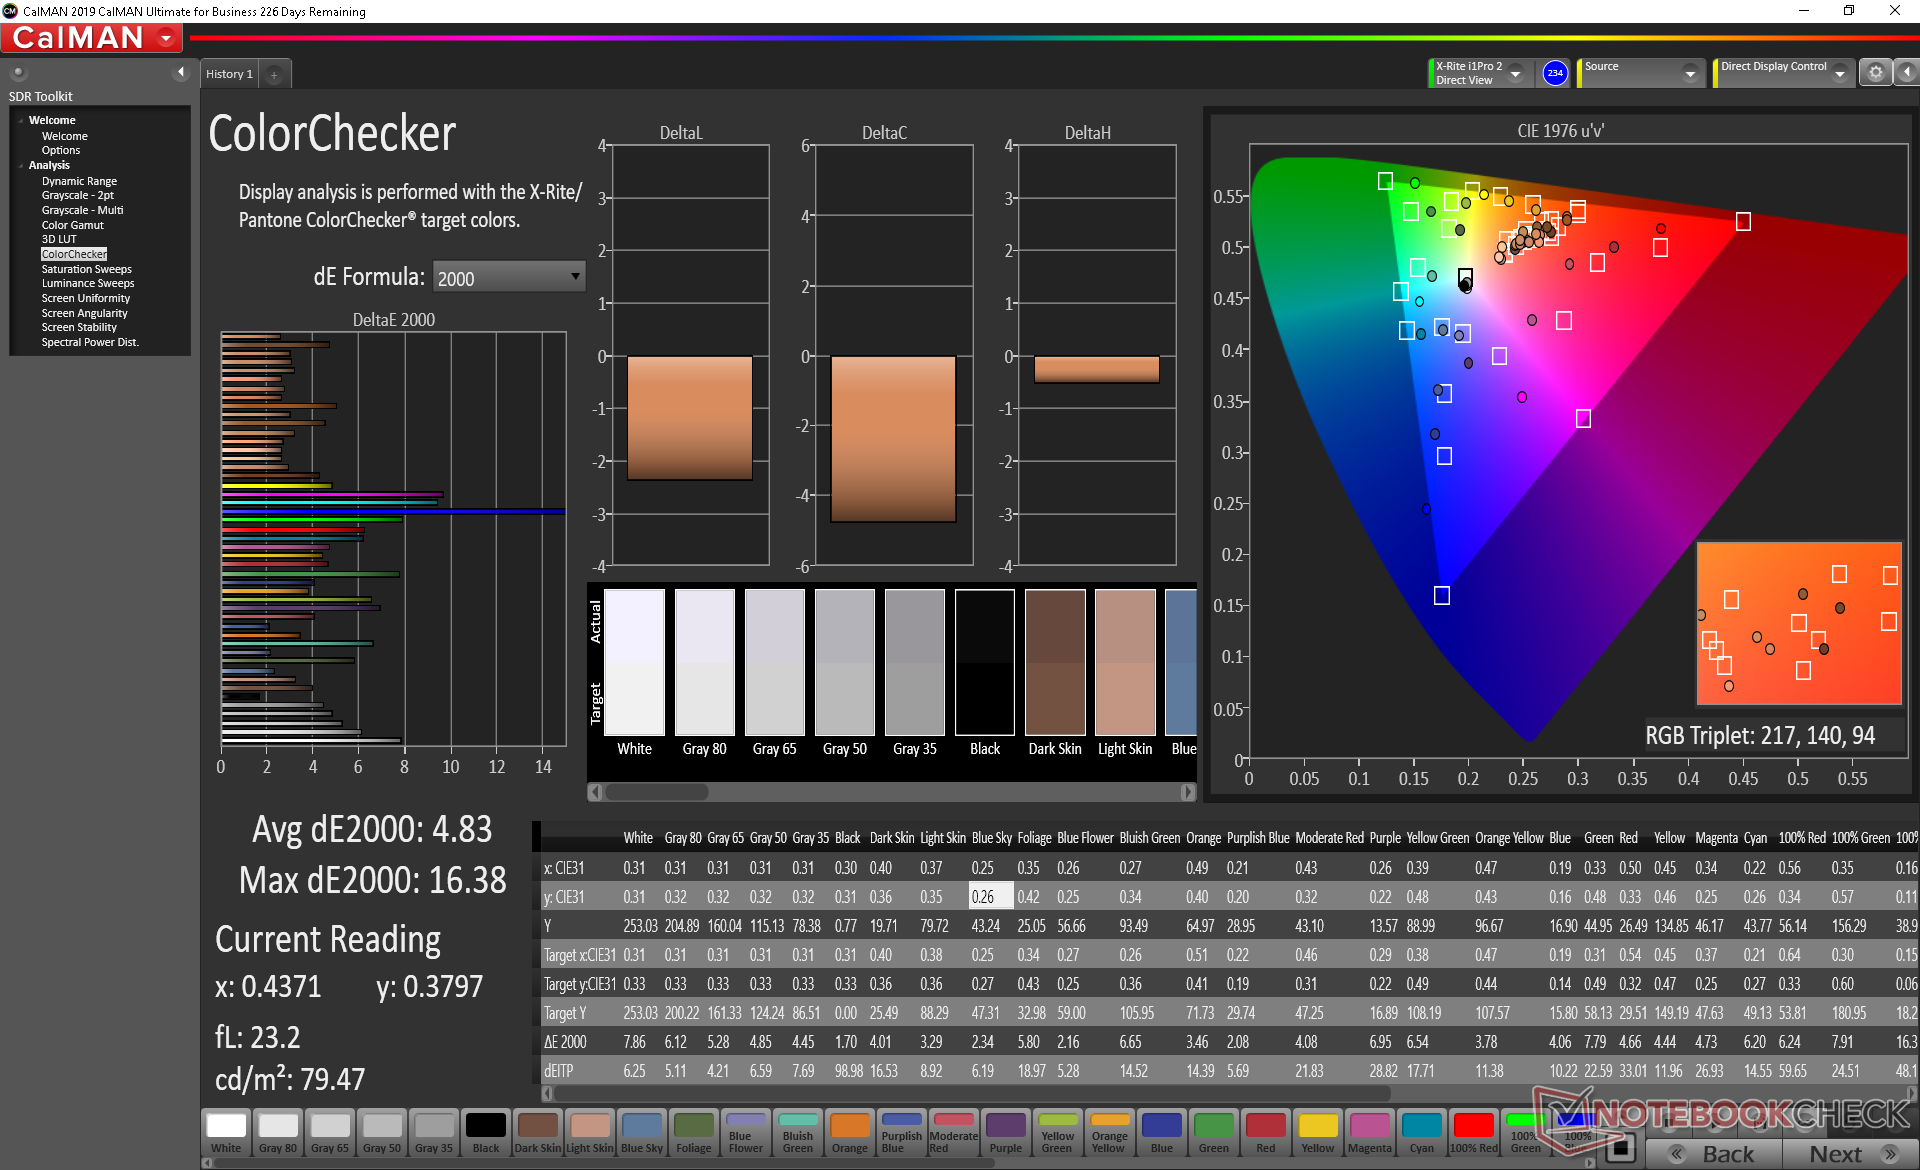
ΔE ColorChecker Calman: 4.83 | ∀{0.5-29.43 Ø4.73}
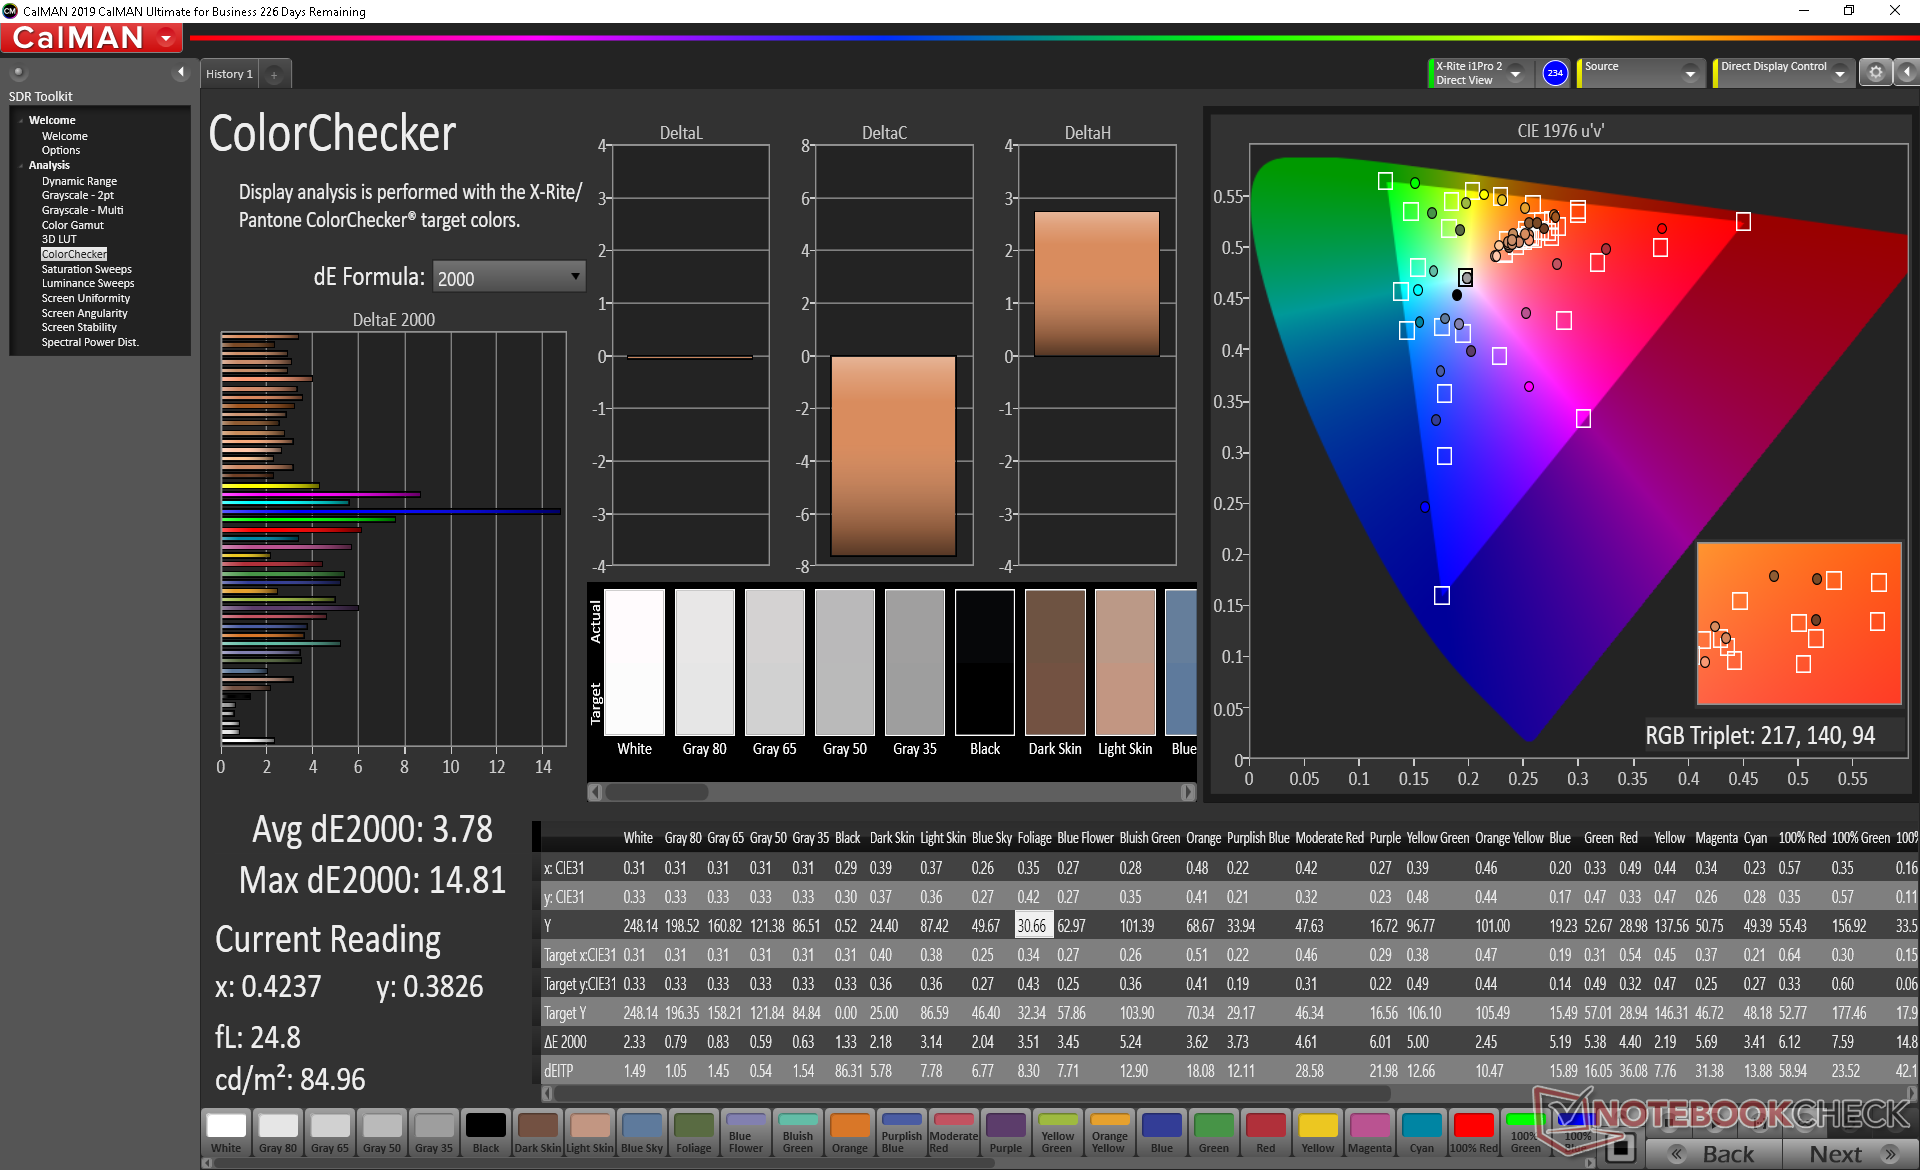
calibrated: 3.78
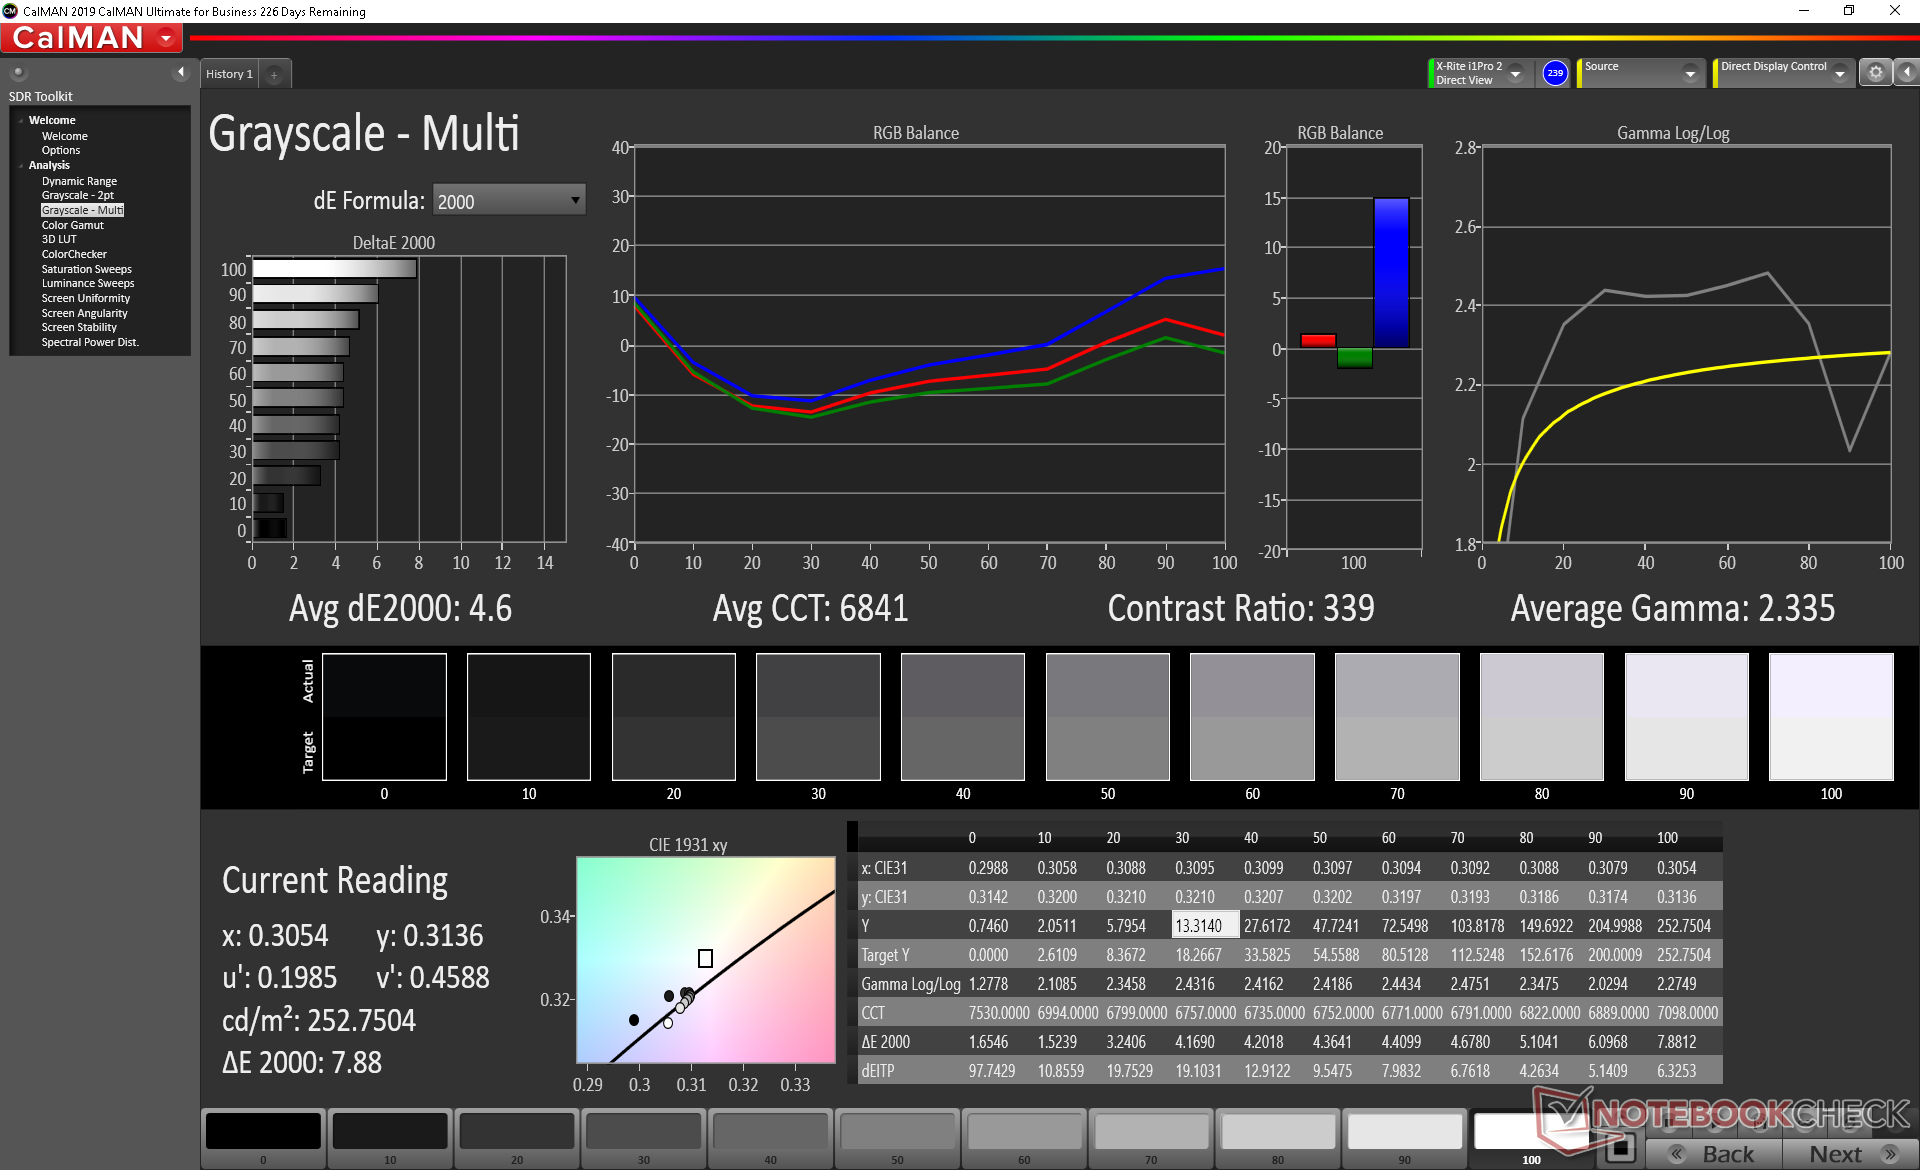
ΔE Greyscale Calman: 4.6 | ∀{0.09-98 Ø4.97}
58.1% sRGB (Argyll 1.6.3 3D)
36.9% AdobeRGB 1998 (Argyll 1.6.3 3D)
40% AdobeRGB 1998 (Argyll 3D)
58.2% sRGB (Argyll 3D)
38.71% Display P3 (Argyll 3D)
Gamma: 2.34
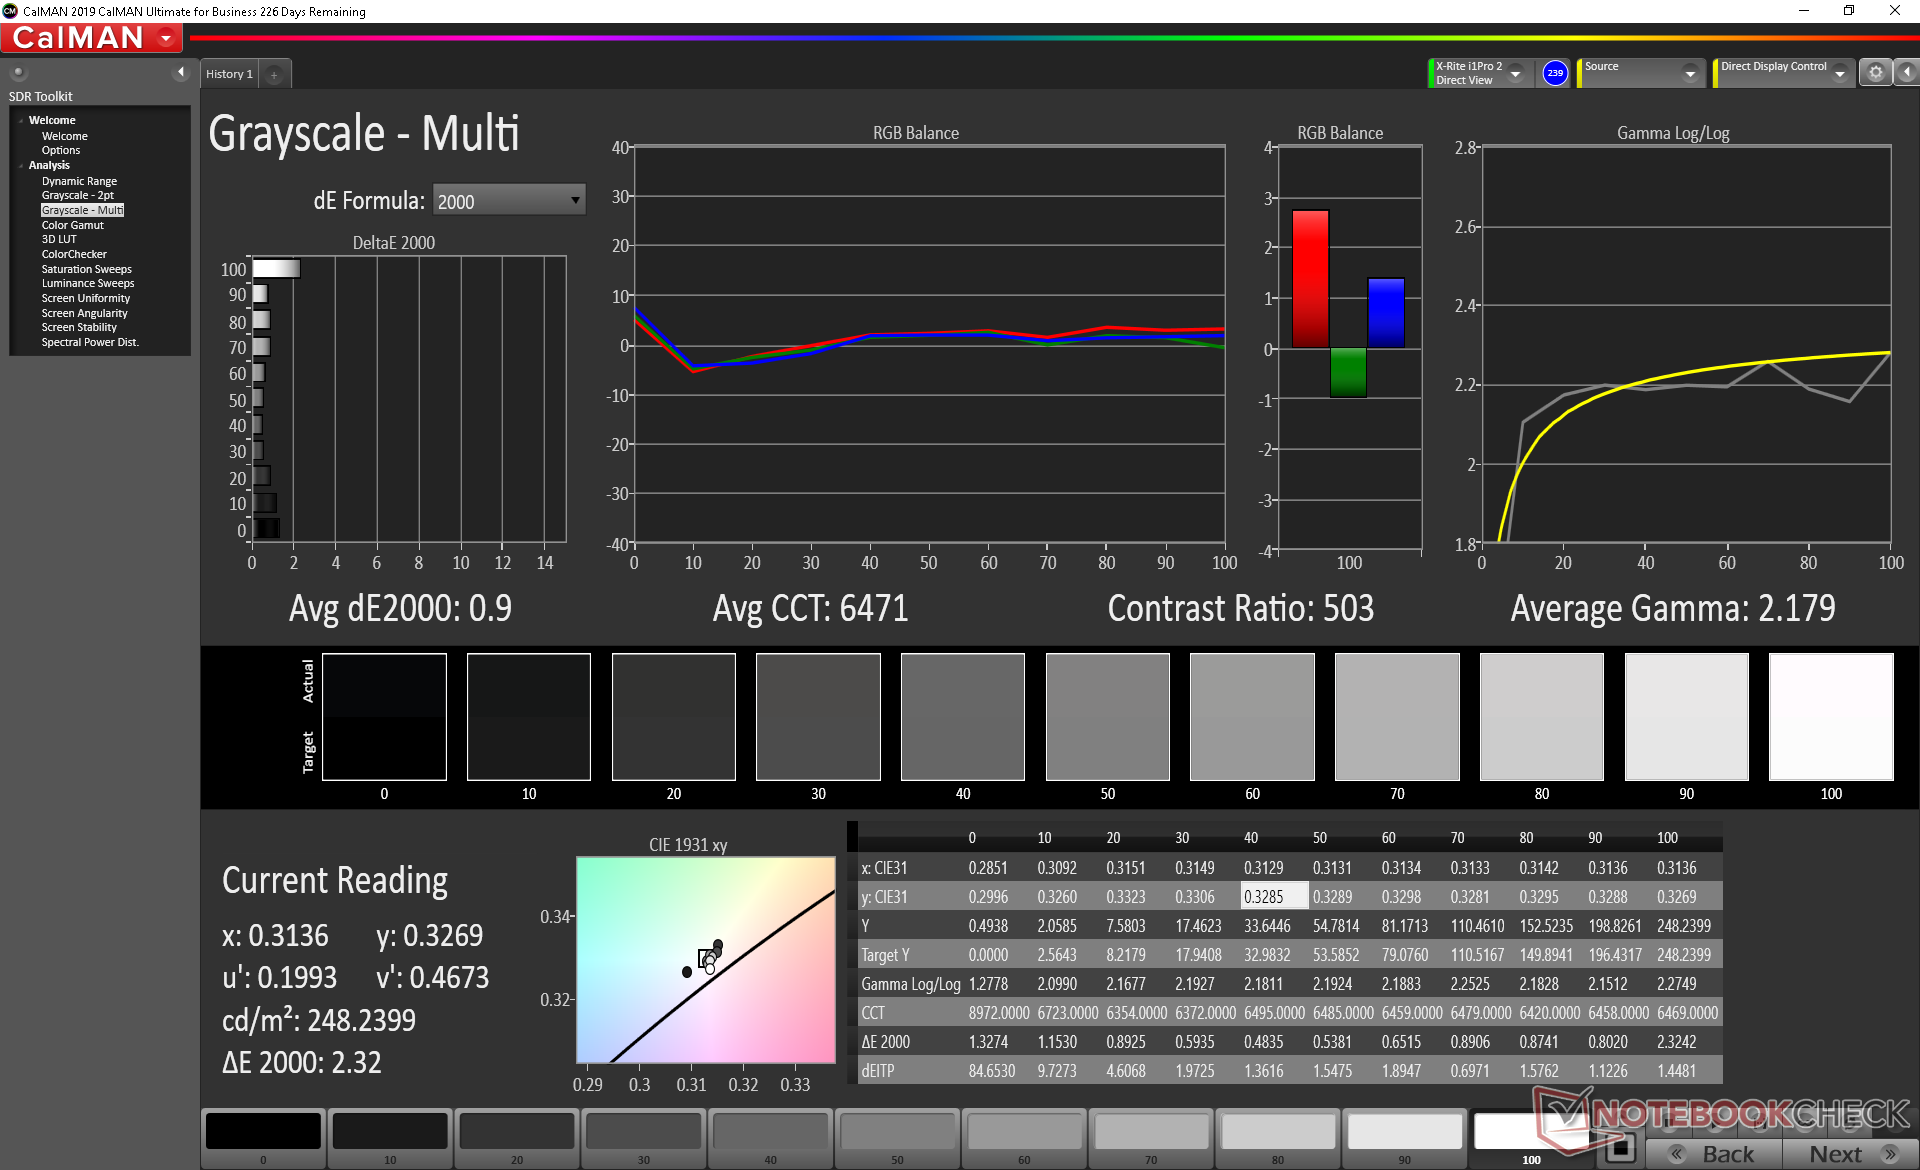
CCT: 6841 K
| Asus Vivobook 15 F512DA-SH31 AU Optronics B156HAN02.1, IPS, 15.6", 1920x1080 | Lenovo Ideapad S340-15IIL BOE CQ NV156FHM-T03, IPS, 15.6", 1920x1080 | Acer Aspire 5 A515-43-R6WW CEC PANDA LM156LF-CL07, IPS, 15.6", 1920x1080 | Dell Inspiron 15 3585 (2300U, Vega 6) BOE0802, TN, 15.6", 1920x1080 | Asus ZenBook 15 UX534FTC-A8190T BOE CQ NV156FHM-N63, IPS, 15.6", 1920x1080 | Huawei MateBook D 15-53010TUY AU Optronics AUO28ED, IPS, 15.6", 1920x1080 | |
|---|---|---|---|---|---|---|
| Display | 3% | 2% | 1% | 58% | 5% | |
| Display P3 Coverage (%) | 38.71 | 40.43 4% | 39.53 2% | 39.22 1% | 65 68% | 40.49 5% |
| sRGB Coverage (%) | 58.2 | 58.8 1% | 59.5 2% | 58.9 1% | 86.2 48% | 60.9 5% |
| AdobeRGB 1998 Coverage (%) | 40 | 41.77 4% | 40.84 2% | 40.52 1% | 62.9 57% | 41.84 5% |
| Response Times | -24% | 8% | 26% | -17% | -13% | |
| Response Time Grey 50% / Grey 80% * (ms) | 36 ? | 46.4 ? -29% | 36 ? -0% | 39 ? -8% | 45 ? -25% | 43.6 ? -21% |
| Response Time Black / White * (ms) | 29.6 ? | 35.2 ? -19% | 25 ? 16% | 12 ? 59% | 32 ? -8% | 31.2 ? -5% |
| PWM Frequency (Hz) | 178 ? | 250 ? | ||||
| Screen | 23% | 35% | -22% | 67% | 58% | |
| Brightness middle (cd/m²) | 252.8 | 320.8 27% | 250 -1% | 225 -11% | 299 18% | 271 7% |
| Brightness (cd/m²) | 237 | 309 30% | 228 -4% | 213 -10% | 280 18% | 256 8% |
| Brightness Distribution (%) | 89 | 87 -2% | 83 -7% | 88 -1% | 89 0% | 90 1% |
| Black Level * (cd/m²) | 0.86 | 0.27 69% | 0.205 76% | 0.535 38% | 0.21 76% | 0.15 83% |
| Contrast (:1) | 294 | 1188 304% | 1220 315% | 421 43% | 1424 384% | 1807 515% |
| Colorchecker dE 2000 * | 4.83 | 7.68 -59% | 5.65 -17% | 10.37 -115% | 4.76 1% | 4.7 3% |
| Colorchecker dE 2000 max. * | 16.38 | 21.97 -34% | 13.7 16% | 19.75 -21% | 9 45% | 20.4 -25% |
| Colorchecker dE 2000 calibrated * | 3.78 | 4.65 -23% | 3.89 -3% | 4.6 -22% | ||
| Greyscale dE 2000 * | 4.6 | 7.3 -59% | 6.32 -37% | 12.09 -163% | 3.53 23% | 1.6 65% |
| Gamma | 2.34 94% | 2.12 104% | 2.45 90% | 2.72 81% | 2.3 96% | 2.17 101% |
| CCT | 6841 95% | 6213 105% | 7287 89% | 13335 49% | 7228 90% | 6649 98% |
| Color Space (Percent of AdobeRGB 1998) (%) | 36.9 | 37.8 2% | 38 3% | 37 0% | 56 52% | 38.5 4% |
| Color Space (Percent of sRGB) (%) | 58.1 | 58.3 0% | 59 2% | 59 2% | 86 48% | 60.6 4% |
| Toplam Ortalama (Program / Ayarlar) | 1% /
14% | 15% /
25% | 2% /
-12% | 36% /
54% | 17% /
40% |
* ... daha küçük daha iyidir
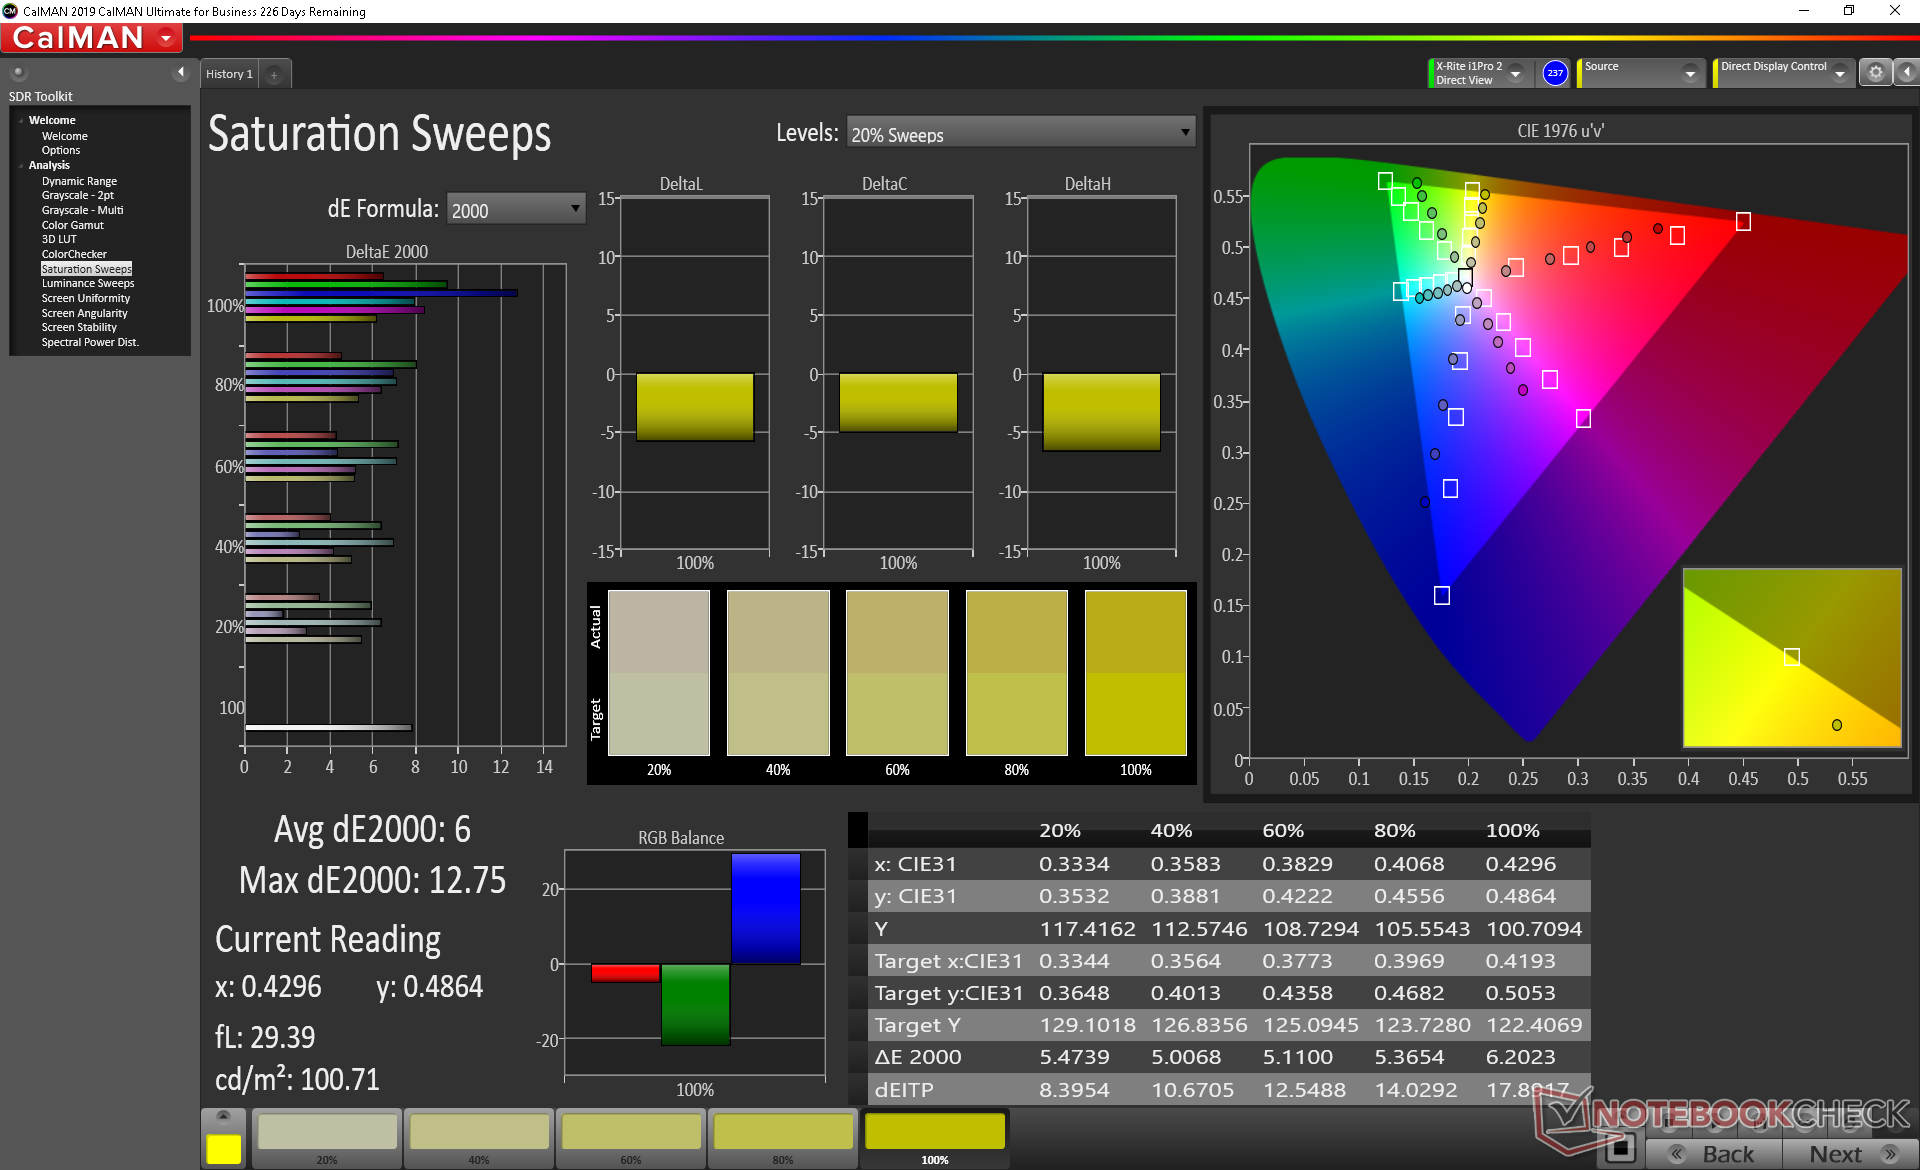
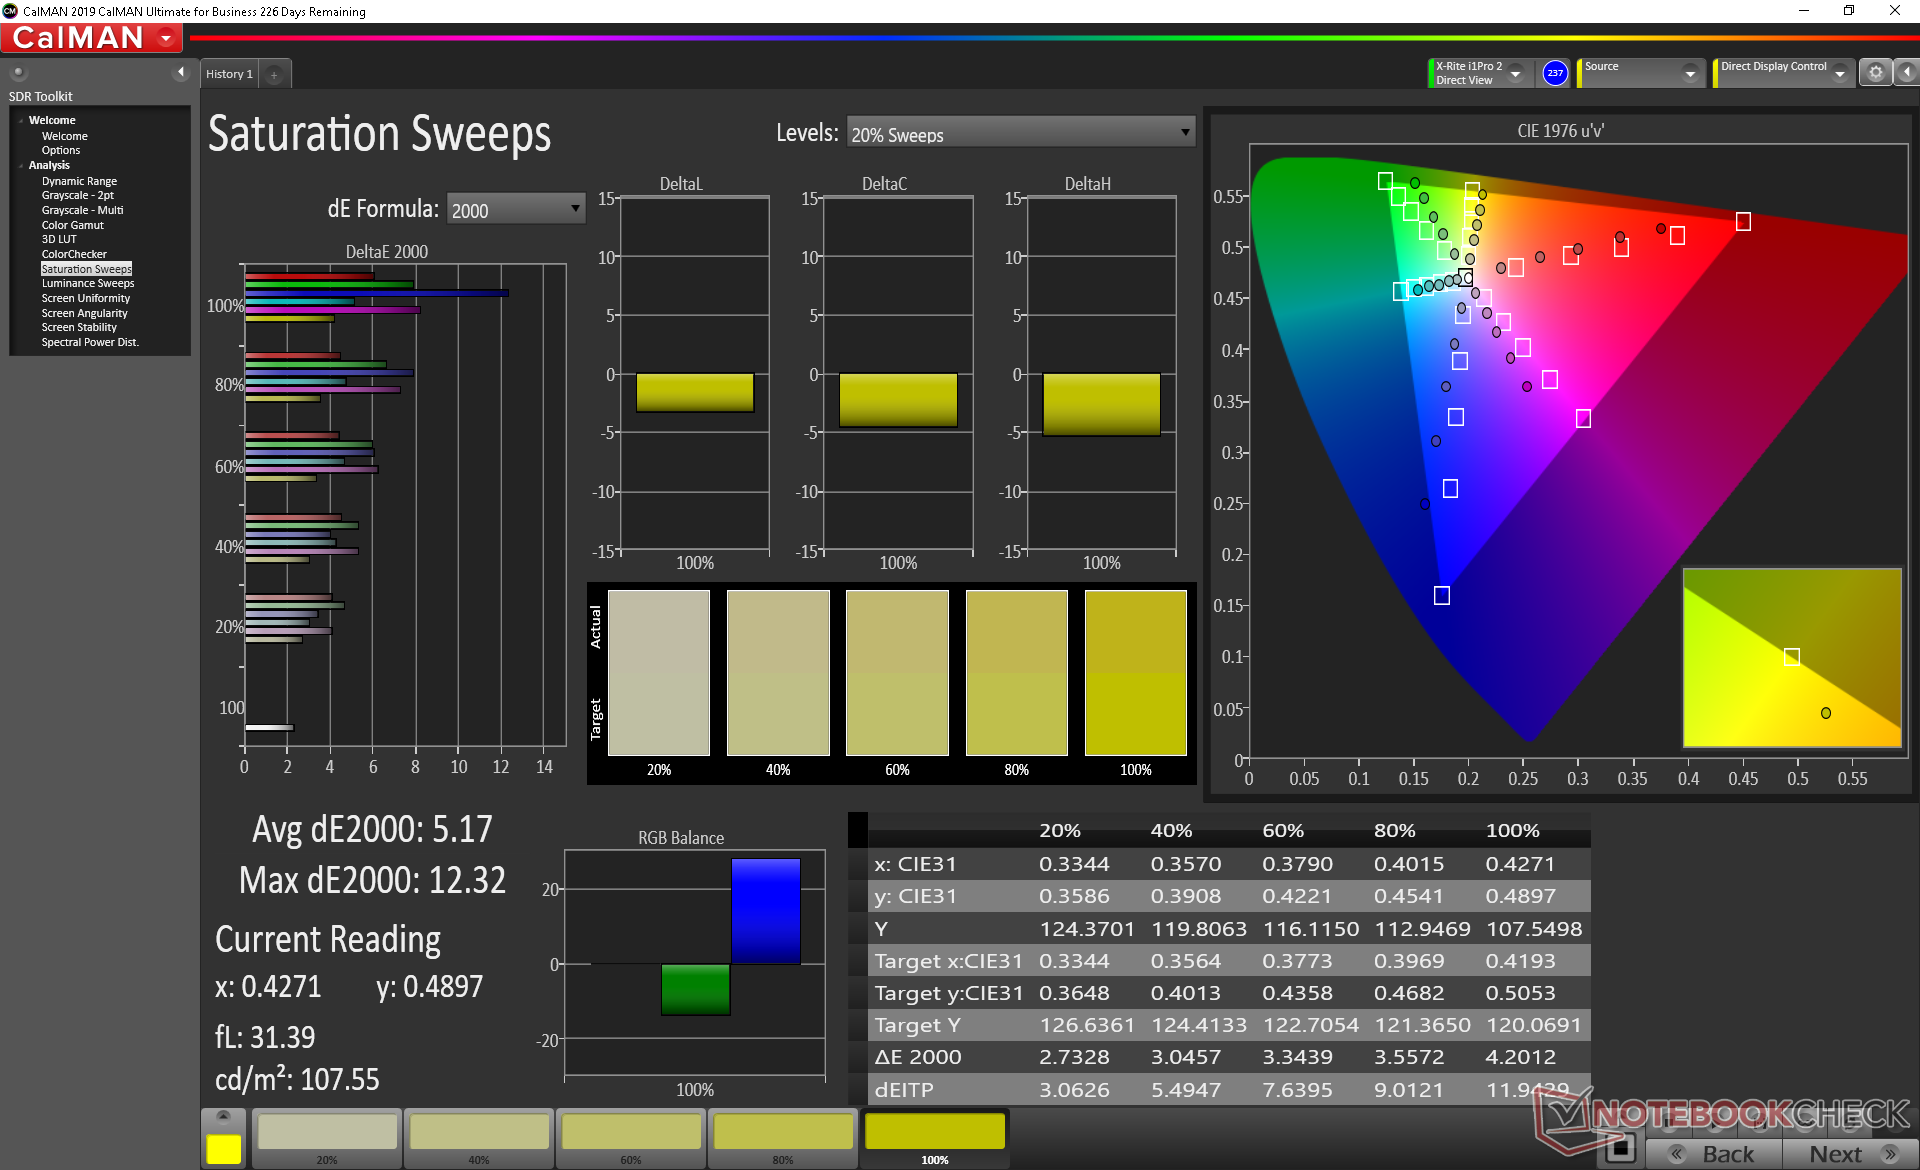
Ekranı kendimiz kalibre etmek gri tonlamayı ortalama 4,6 DeltaE'den sadece 0,9'a önemli ölçüde geliştirir. Bununla birlikte, renk doğruluğu, panelin renk alanı çok dar olduğu için çok az değişir. Mavi, diğer birincil ve ikincil renklerden çok daha yanlış temsil edilir.
Yanıt Sürelerini Görüntüle
| ↔ Tepki Süresi Siyahtan Beyaza | ||
|---|---|---|
| 29.6 ms ... yükseliş ↗ ve sonbahar↘ birleşimi | ↗ 18 ms yükseliş | 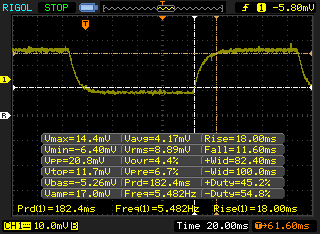 |
| ↘ 11.6 ms sonbahar | ||
| Ekran, testlerimizde nispeten yavaş yanıt oranları gösteriyor ve oyuncular için çok yavaş olabilir. Karşılaştırıldığında, test edilen tüm cihazlar 0.1 (minimum) ile 240 (maksimum) ms arasında değişir. » Tüm cihazların 79 %'si daha iyi. Bu, ölçülen yanıt süresinin test edilen tüm cihazların ortalamasından (19.9 ms) daha kötü olduğu anlamına gelir. | ||
| ↔ Tepki Süresi %50 Griden %80 Griye | ||
| 36 ms ... yükseliş ↗ ve sonbahar↘ birleşimi | ↗ 20 ms yükseliş | 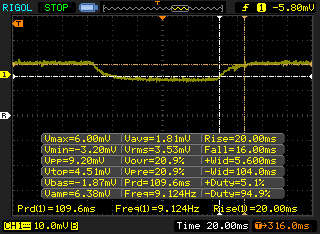 |
| ↘ 16 ms sonbahar | ||
| Ekran, testlerimizde yavaş yanıt oranları gösteriyor ve oyuncular için yetersiz olacaktır. Karşılaştırıldığında, test edilen tüm cihazlar 0.165 (minimum) ile 636 (maksimum) ms arasında değişir. » Tüm cihazların 50 %'si daha iyi. Bu, ölçülen yanıt süresinin test edilen tüm cihazların ortalamasından (31.1 ms) daha kötü olduğu anlamına gelir. | ||
Ekran Titremesi / PWM (Darbe Genişliği Modülasyonu)
| Ekran titriyor / PWM algılanmadı | 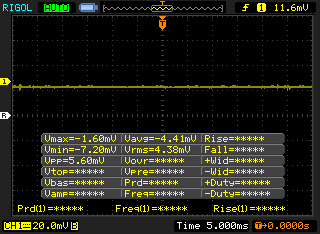 | ||
Karşılaştırıldığında: Test edilen tüm cihazların %52 %'si ekranı karartmak için PWM kullanmıyor. PWM tespit edilirse, ortalama 7798 (minimum: 5 - maksimum: 343500) Hz ölçüldü. | |||
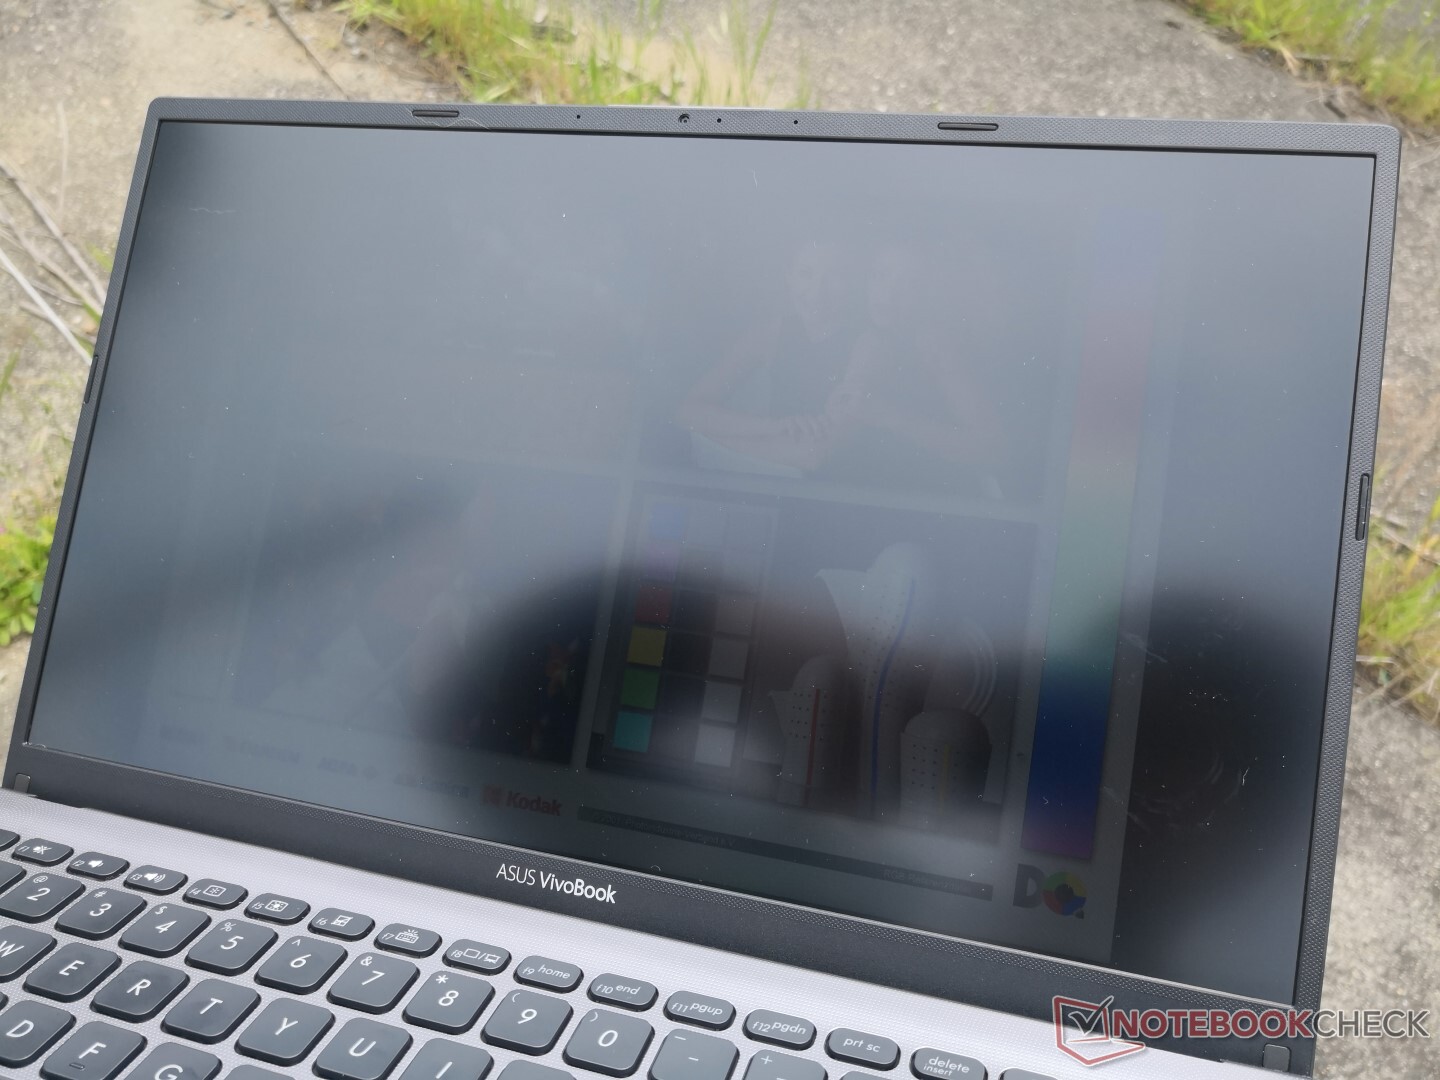
Dış mekan görünürlüğü zayıf ancak bütçe kategorisi için bekleniyor. Bu, bir elektrik prizinden çıkarıldığında hem sığ kontrast oranı hem de ekranın maksimum parlaklık seviyesi 252 nit'den sadece 216 nite düşürüldü. Otomatik parlaklık azaltmayı devre dışı bırakmak üzere Radeon ayarlarını etkinleştirmek için AMD Adrenalin'i manuel olarak yüklemeniz gerekebilir.
Verim
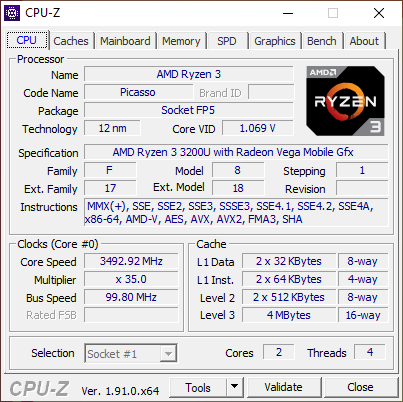
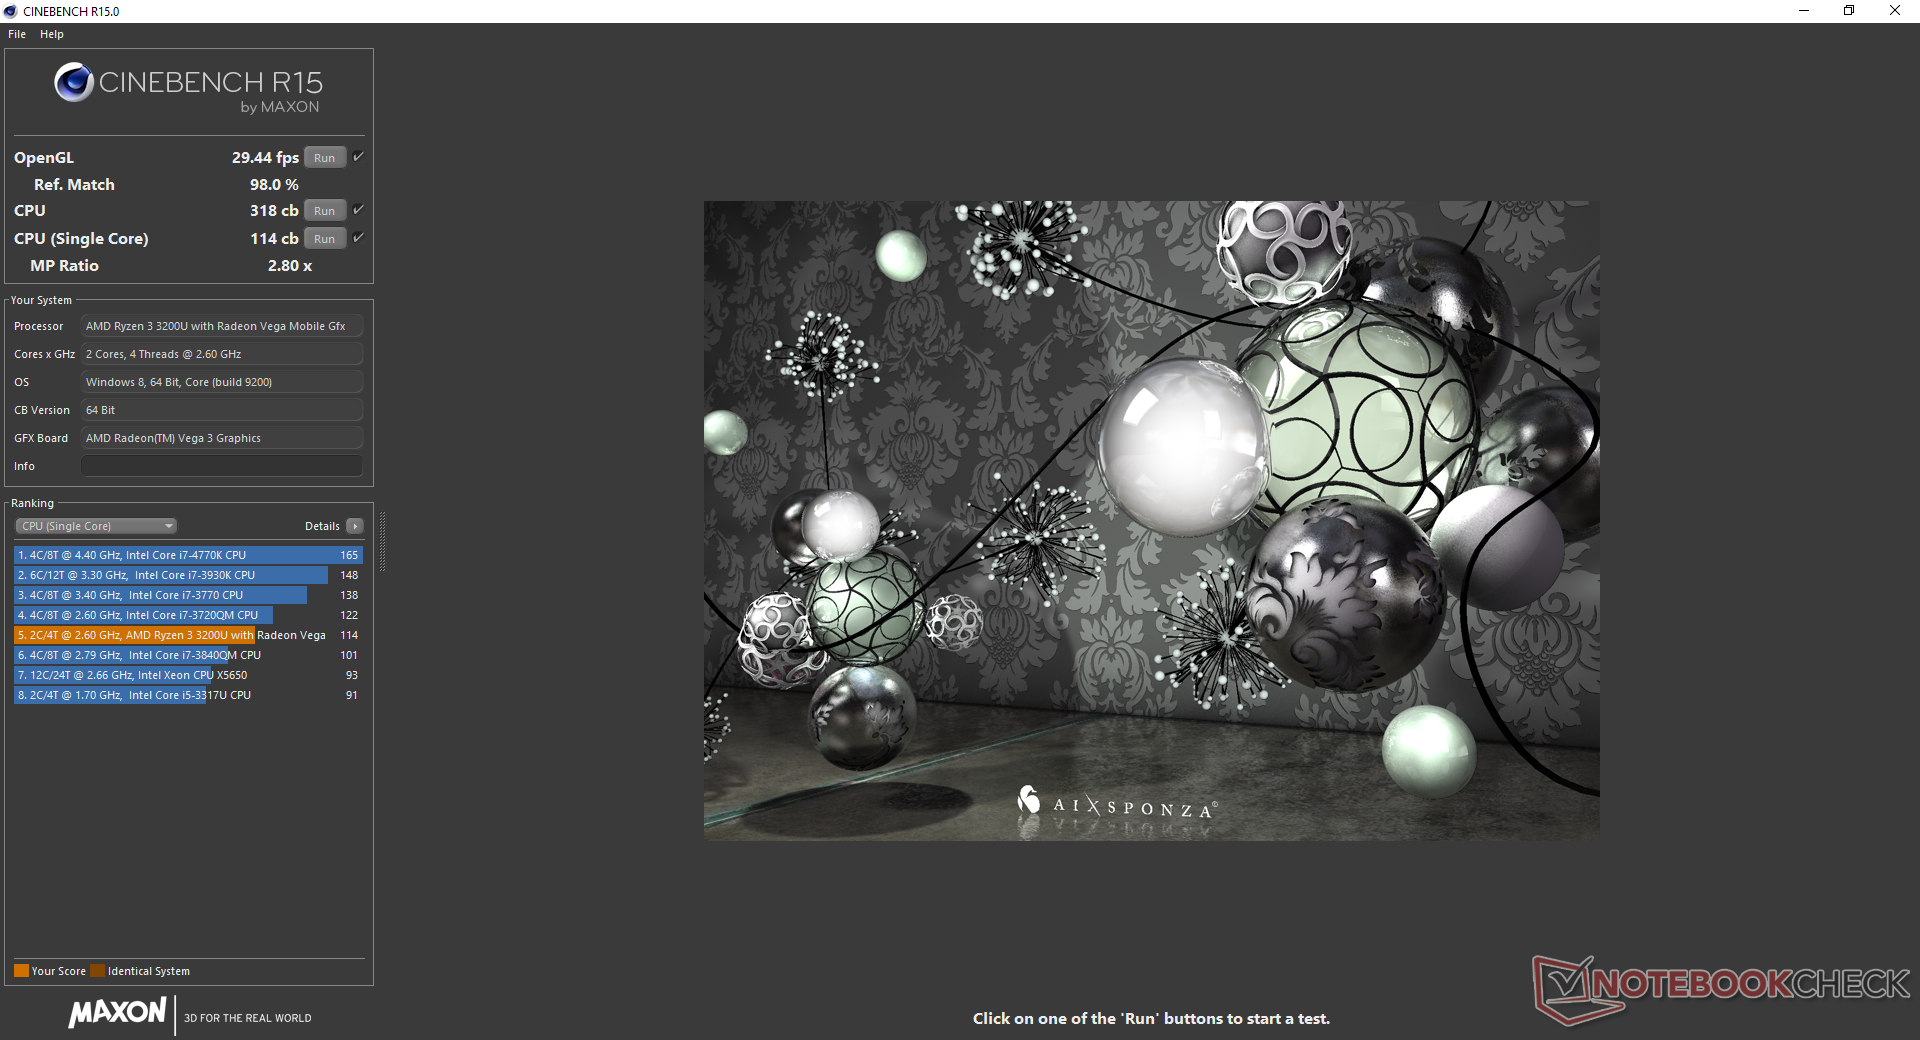
İşlemci
CPU performansı en çok Intel'in son nesil Kaby Lake Core i3-8130U veya Whisky Lake-U Core i3-8145U'ya benzer. Intel'in Dell XPS 13'te bulunan en yeni 10. nesil Core i3-1005G1, yaklaşık yüzde 20 ila 30 daha hızlı işlemci performansı sunar. Asus, bu VivoBook modeli için bütçemiz Ryzen 3 yapılandırmamızdan yaklaşık yüzde 50 daha hızlı çok iş parçacığı performansı için Core i7-8565U seçenekleri sunuyor. Daha fazla teknik bilgi ve kıyaslama karşılaştırması için Ryzen 3 3200U'daki özel sayfamıza bakın. Ryzen 3 3200U'nun yerini önümüzdeki aylarda Ryzen 3 4300U alacak.
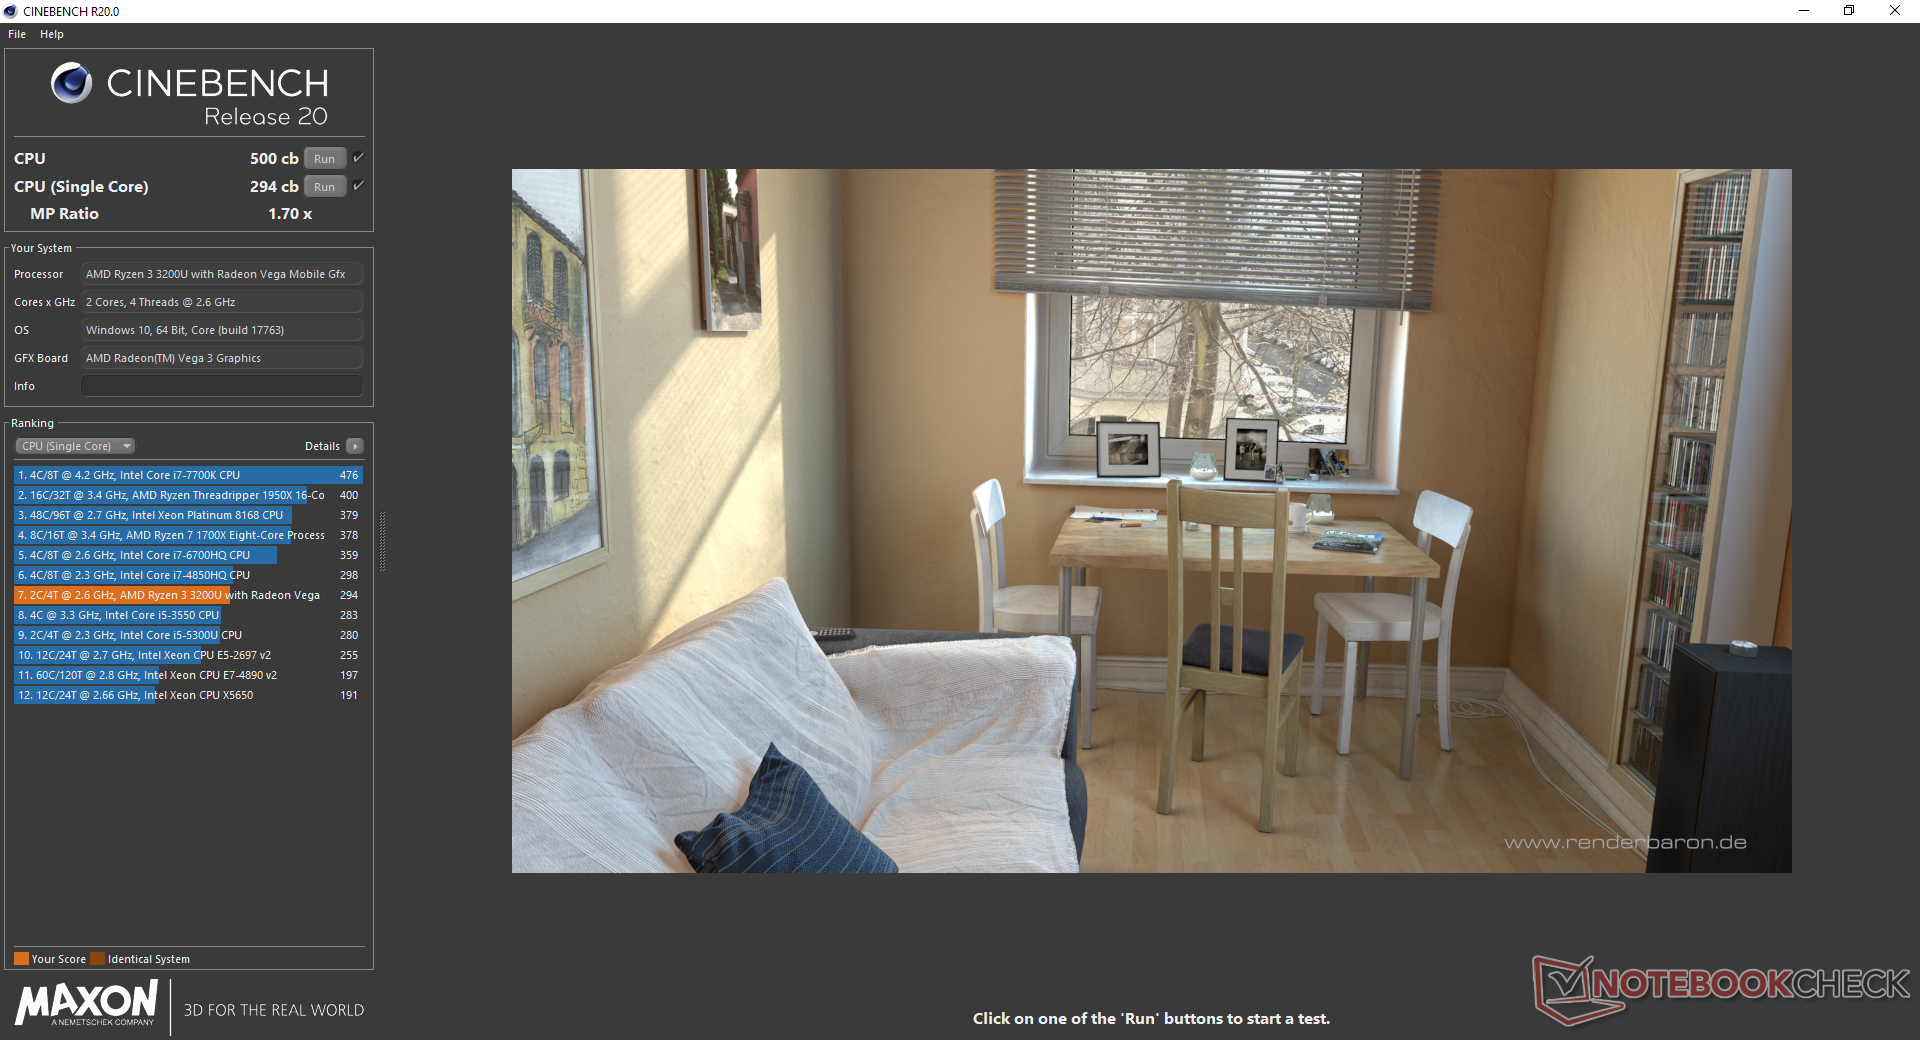
| Cinebench R20 | |
| CPU (Single Core) | |
| MSI Prestige 15 A10SC | |
| Acer Aspire 5 A515-54G | |
| HP Pavilion x360 15-dq0065cl | |
| Dell XPS 13 7390 2-in-1 Core i3 | |
| Huawei MateBook D 15-53010TUY | |
| Asus VivoBook Flip 14 TP412UA-EC969T | |
| Dell Inspiron 15 5000 5585 | |
| Asus Vivobook 15 F512DA-SH31 | |
| Ortalama AMD Ryzen 3 3200U (274 - 318, n=5) | |
| Dell Latitude 3400 | |
| HP ProBook x360 11 G4 | |
| Intel NUC5i3RYK | |
| Chuwi UBook CWI509 | |
| Chuwi LapBook Plus | |
| CPU (Multi Core) | |
| MSI Prestige 15 A10SC | |
| Huawei MateBook D 15-53010TUY | |
| Dell Inspiron 15 5000 5585 | |
| Acer Aspire 5 A515-54G | |
| HP Pavilion x360 15-dq0065cl | |
| Dell XPS 13 7390 2-in-1 Core i3 | |
| Asus VivoBook Flip 14 TP412UA-EC969T | |
| Asus Vivobook 15 F512DA-SH31 | |
| Dell Latitude 3400 | |
| Ortalama AMD Ryzen 3 3200U (453 - 727, n=5) | |
| Intel NUC5i3RYK | |
| HP ProBook x360 11 G4 | |
| Chuwi UBook CWI509 | |
| Chuwi LapBook Plus | |
| Cinebench R15 | |
| CPU Single 64Bit | |
| MSI Prestige 15 A10SC | |
| HP Pavilion x360 15-dq0065cl | |
| Acer Aspire 5 A515-54G | |
| Dell XPS 13 7390 2-in-1 Core i3 | |
| Dell Latitude 3400 | |
| Huawei MateBook D 15-53010TUY | |
| Asus VivoBook Flip 14 TP412UA-EC969T | |
| Dell Inspiron 15 5000 5585 | |
| Ortalama AMD Ryzen 3 3200U (126 - 130, n=3) | |
| Asus Vivobook 15 F512DA-SH31 | |
| HP ProBook x360 11 G4 | |
| Intel NUC5i3RYK | |
| Chuwi UBook CWI509 | |
| Chuwi LapBook Plus | |
| CPU Multi 64Bit | |
| MSI Prestige 15 A10SC | |
| Huawei MateBook D 15-53010TUY | |
| Dell Inspiron 15 5000 5585 | |
| Acer Aspire 5 A515-54G | |
| HP Pavilion x360 15-dq0065cl | |
| Dell XPS 13 7390 2-in-1 Core i3 | |
| Dell Latitude 3400 | |
| Asus VivoBook Flip 14 TP412UA-EC969T | |
| Ortalama AMD Ryzen 3 3200U (318 - 353, n=3) | |
| Asus Vivobook 15 F512DA-SH31 | |
| Intel NUC5i3RYK | |
| Intel NUC5i3RYK | |
| HP ProBook x360 11 G4 | |
| Chuwi UBook CWI509 | |
| Chuwi LapBook Plus | |
| Cinebench R11.5 | |
| CPU Single 64Bit | |
| Dell XPS 13 7390 2-in-1 Core i3 | |
| Dell Inspiron 15 5000 5585 | |
| Chuwi LapBook Plus | |
| CPU Multi 64Bit | |
| Dell Inspiron 15 5000 5585 | |
| Dell XPS 13 7390 2-in-1 Core i3 | |
| Chuwi LapBook Plus | |
| Cinebench R10 | |
| Rendering Multiple CPUs 32Bit | |
| Dell XPS 13 7390 2-in-1 Core i3 | |
| Asus VivoBook Flip 14 TP412UA-EC969T | |
| Dell Latitude 3400 | |
| Ortalama AMD Ryzen 3 3200U (n=1) | |
| HP ProBook x360 11 G4 | |
| Chuwi LapBook Plus | |
| Rendering Single 32Bit | |
| Dell XPS 13 7390 2-in-1 Core i3 | |
| Dell Latitude 3400 | |
| Asus VivoBook Flip 14 TP412UA-EC969T | |
| Ortalama AMD Ryzen 3 3200U (n=1) | |
| HP ProBook x360 11 G4 | |
| Chuwi LapBook Plus | |
| wPrime 2.10 - 1024m | |
| Chuwi LapBook Plus | |
| HP ProBook x360 11 G4 | |
| Intel NUC5i3RYK | |
| Ortalama AMD Ryzen 3 3200U (n=1) | |
| Dell XPS 13 7390 2-in-1 Core i3 | |
* ... daha küçük daha iyidir
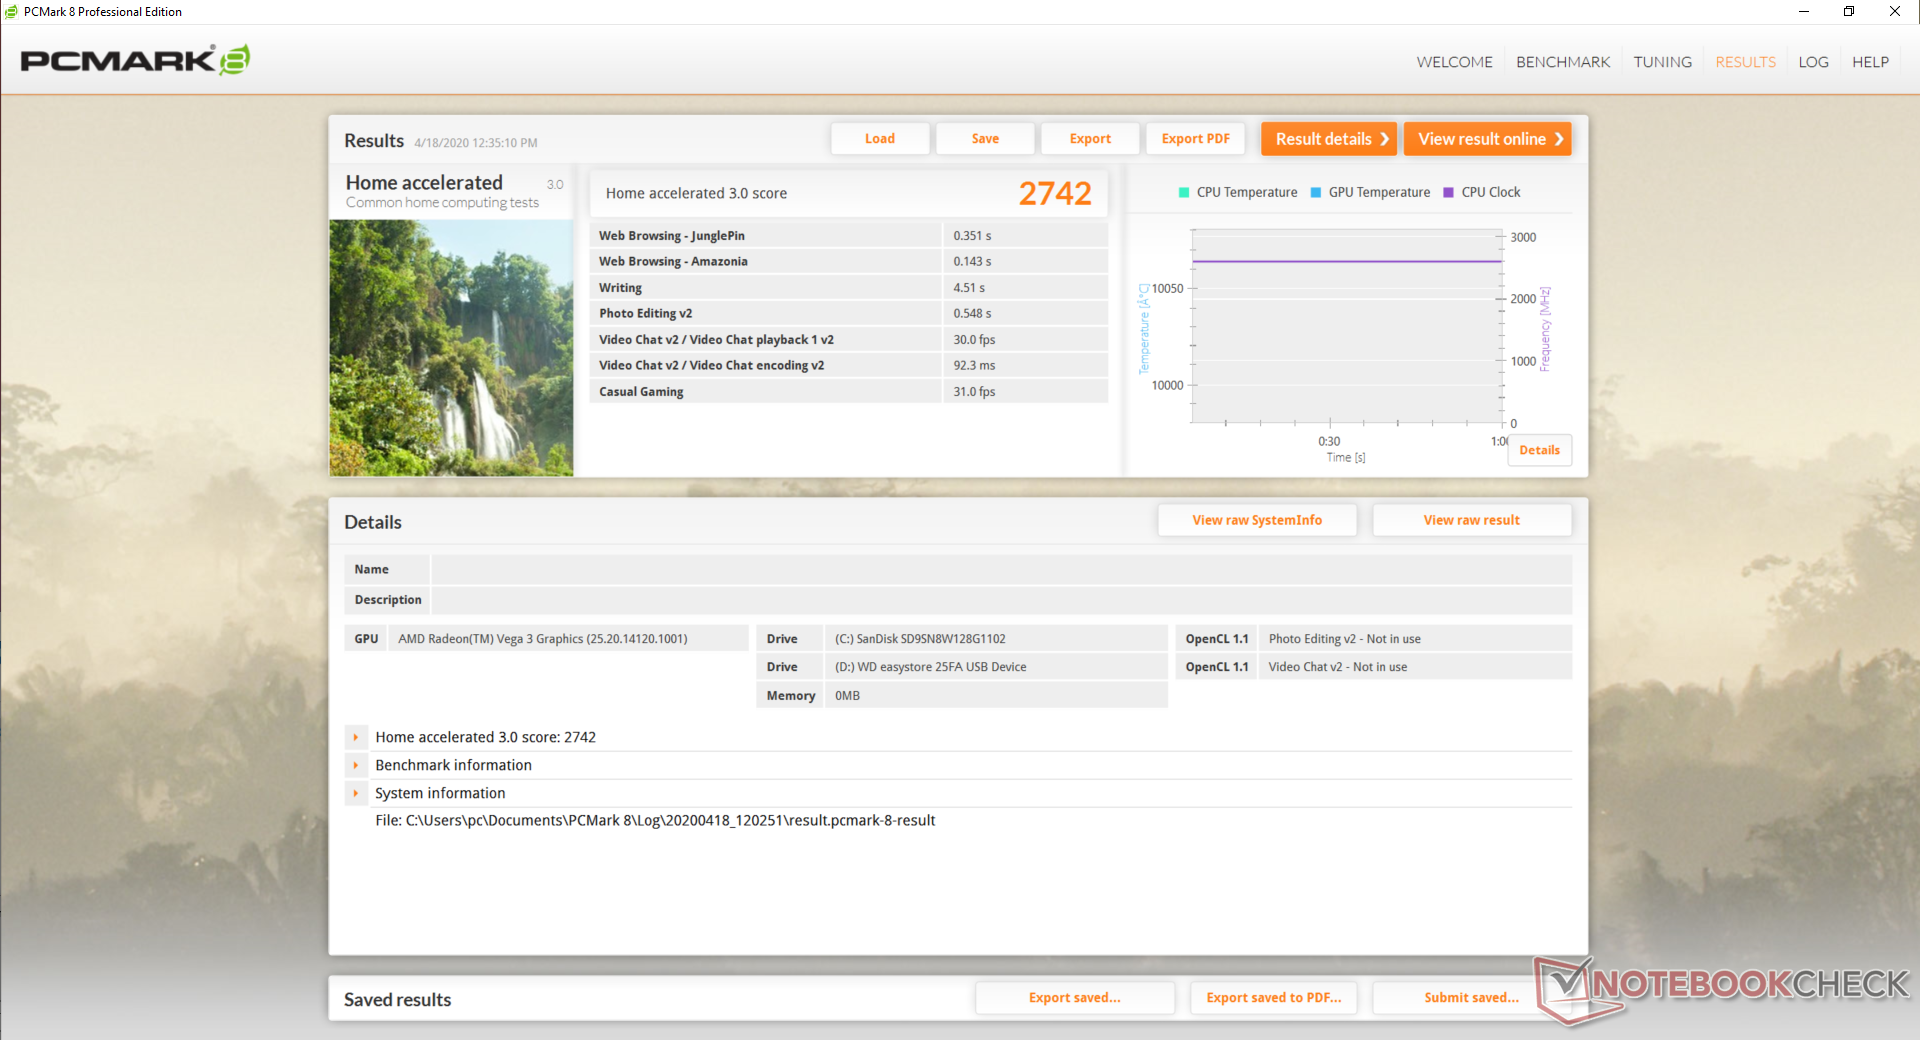
Sistem performansı
PCMark kriterleri, Chuwi LapBook gibi Intel Atom tabanlı dizüstü bilgisayarların çok ilerisindeyken rakip Core i3 alternatifleriyle göreceli olmasını bekledikleri yerdir.
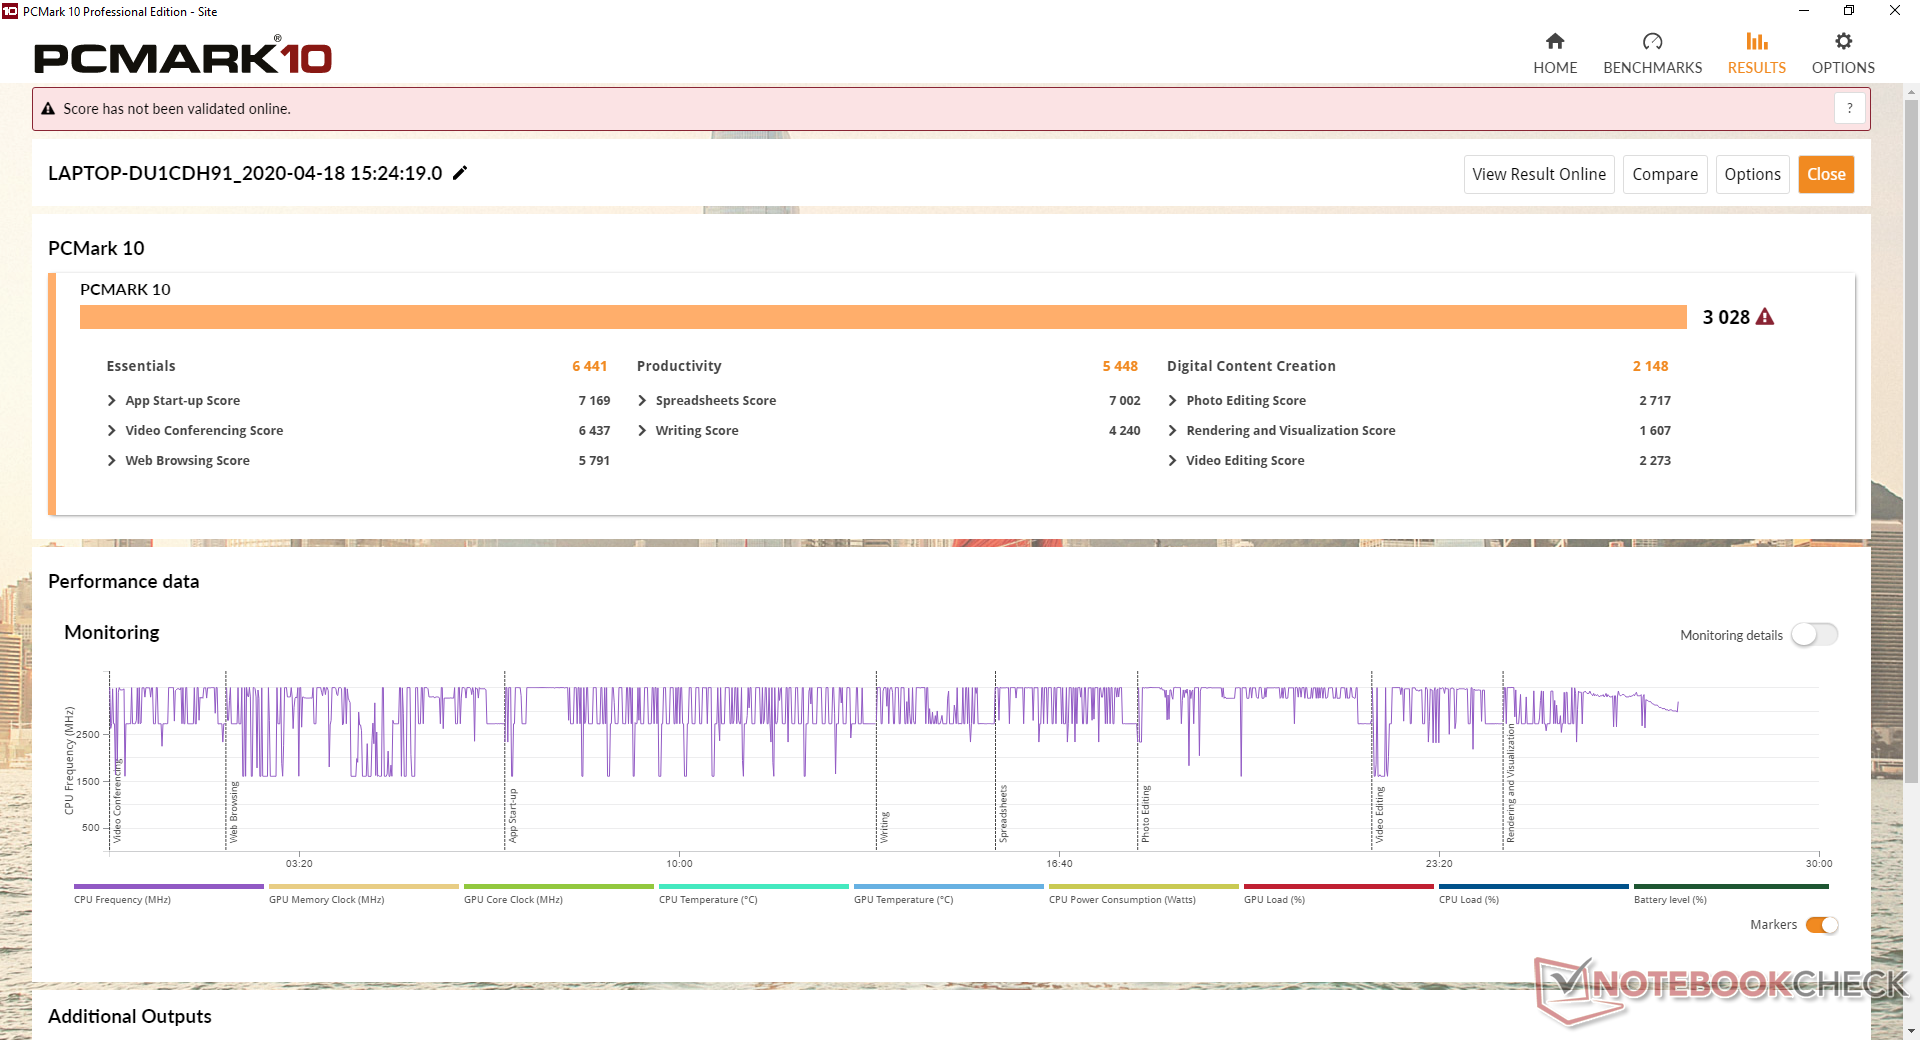
| PCMark 10 | |
| Score | |
| Dell Inspiron 15 5000 5585 | |
| Huawei MateBook D 15-53010TUY | |
| Asus VivoBook Flip 14 TP412UA-EC969T | |
| Ortalama AMD Ryzen 3 3200U, AMD Radeon RX Vega 3 (3028 - 3326, n=3) | |
| Asus Vivobook 15 F512DA-SH31 | |
| Chuwi LapBook Plus | |
| Essentials | |
| Dell Inspiron 15 5000 5585 | |
| Huawei MateBook D 15-53010TUY | |
| Asus VivoBook Flip 14 TP412UA-EC969T | |
| Ortalama AMD Ryzen 3 3200U, AMD Radeon RX Vega 3 (6441 - 7487, n=3) | |
| Asus Vivobook 15 F512DA-SH31 | |
| Chuwi LapBook Plus | |
| Productivity | |
| Dell Inspiron 15 5000 5585 | |
| Asus VivoBook Flip 14 TP412UA-EC969T | |
| Huawei MateBook D 15-53010TUY | |
| Ortalama AMD Ryzen 3 3200U, AMD Radeon RX Vega 3 (5448 - 5698, n=3) | |
| Asus Vivobook 15 F512DA-SH31 | |
| Chuwi LapBook Plus | |
| Digital Content Creation | |
| Dell Inspiron 15 5000 5585 | |
| Huawei MateBook D 15-53010TUY | |
| Asus VivoBook Flip 14 TP412UA-EC969T | |
| Ortalama AMD Ryzen 3 3200U, AMD Radeon RX Vega 3 (2148 - 2343, n=3) | |
| Asus Vivobook 15 F512DA-SH31 | |
| Chuwi LapBook Plus | |
| PCMark 8 | |
| Home Score Accelerated v2 | |
| Huawei MateBook D 15-53010TUY | |
| Dell Inspiron 15 5000 5585 | |
| Asus VivoBook Flip 14 TP412UA-EC969T | |
| Ortalama AMD Ryzen 3 3200U, AMD Radeon RX Vega 3 (2742 - 3065, n=3) | |
| Asus Vivobook 15 F512DA-SH31 | |
| Chuwi LapBook Plus | |
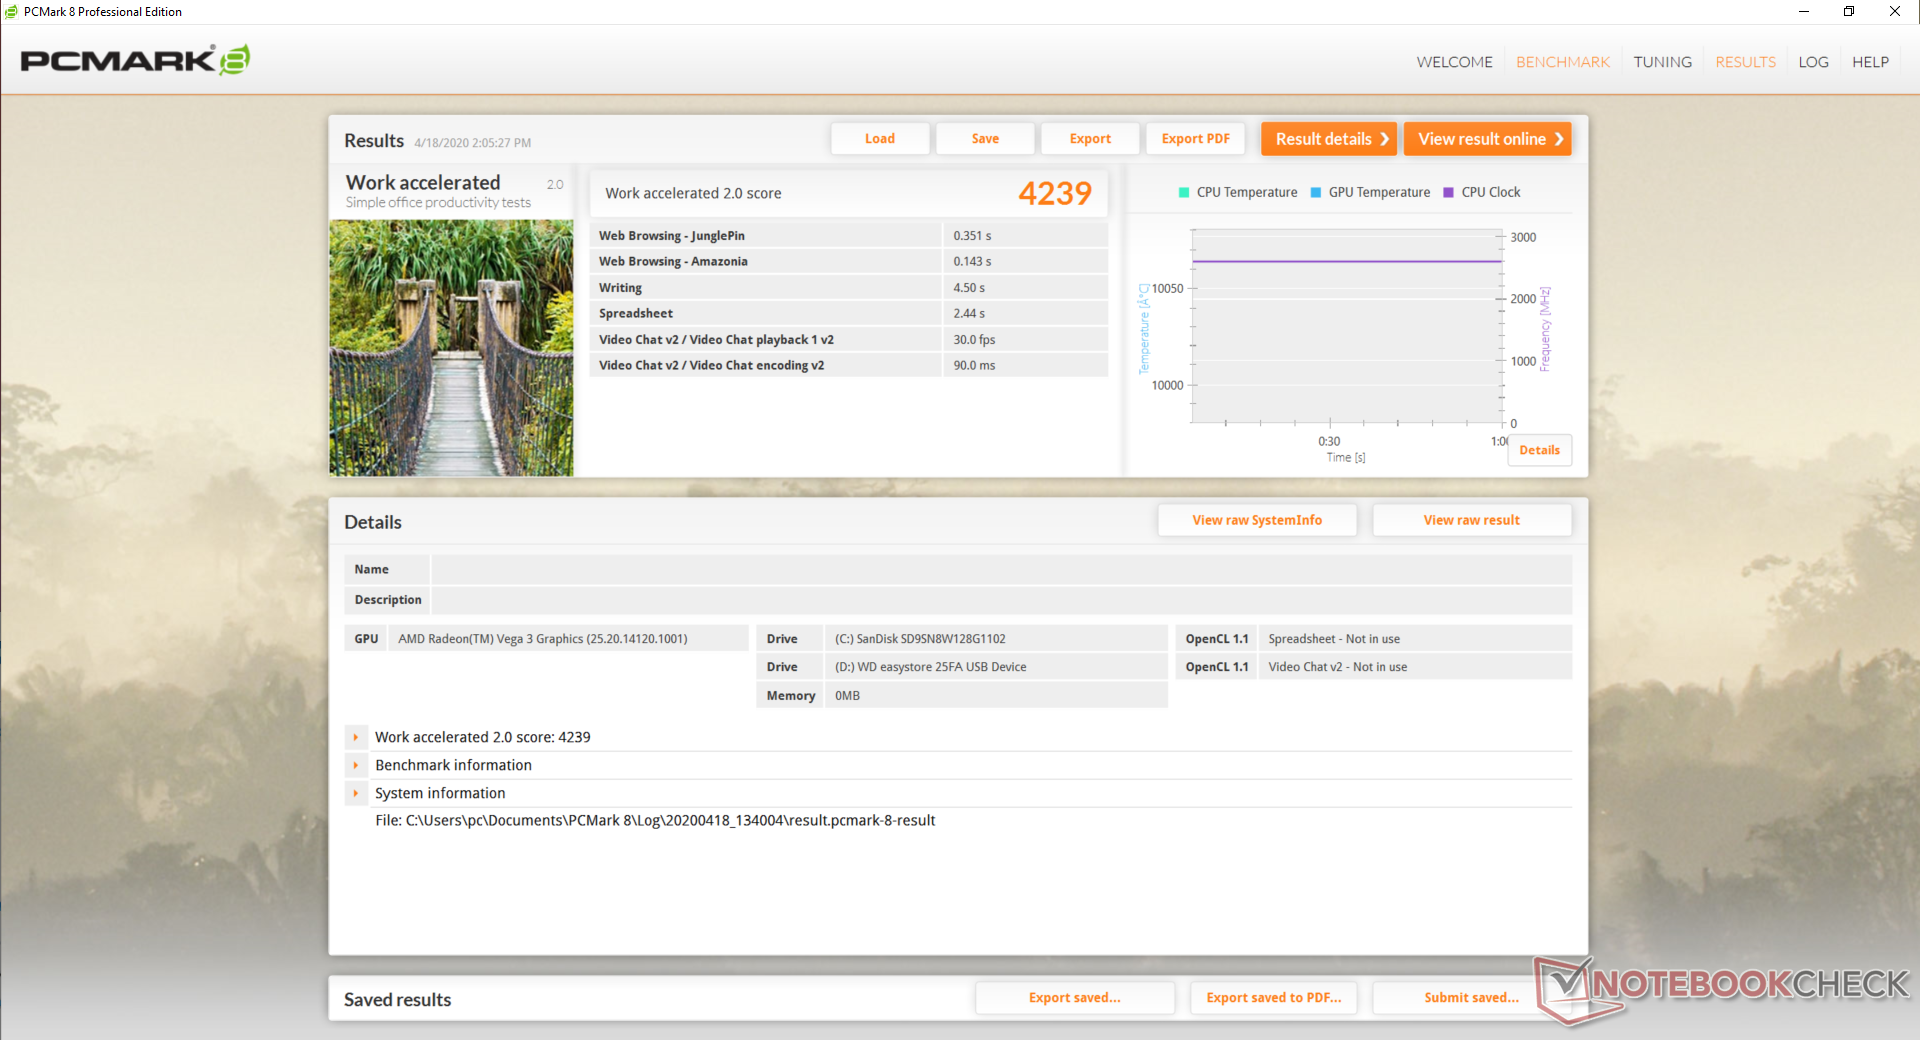
| Work Score Accelerated v2 | |
| Huawei MateBook D 15-53010TUY | |
| Asus VivoBook Flip 14 TP412UA-EC969T | |
| Dell Inspiron 15 5000 5585 | |
| Ortalama AMD Ryzen 3 3200U, AMD Radeon RX Vega 3 (4239 - 4400, n=3) | |
| Asus Vivobook 15 F512DA-SH31 | |
| PCMark 8 Home Score Accelerated v2 | 2742 puan | |
| PCMark 8 Work Score Accelerated v2 | 4239 puan | |
| PCMark 10 Score | 3028 puan | |
Yardım | ||
DPC Gecikmesi
Sistem, birden fazla Edge sekmesi açarken, 4K UHD video oynatırken ve Prime95'i sırayla çalıştırırken DPC gecikme sorunları gösterir. Neyse ki, 4K UHD video testimiz sırasında atlanan kareleri gözlemleyemiyoruz.
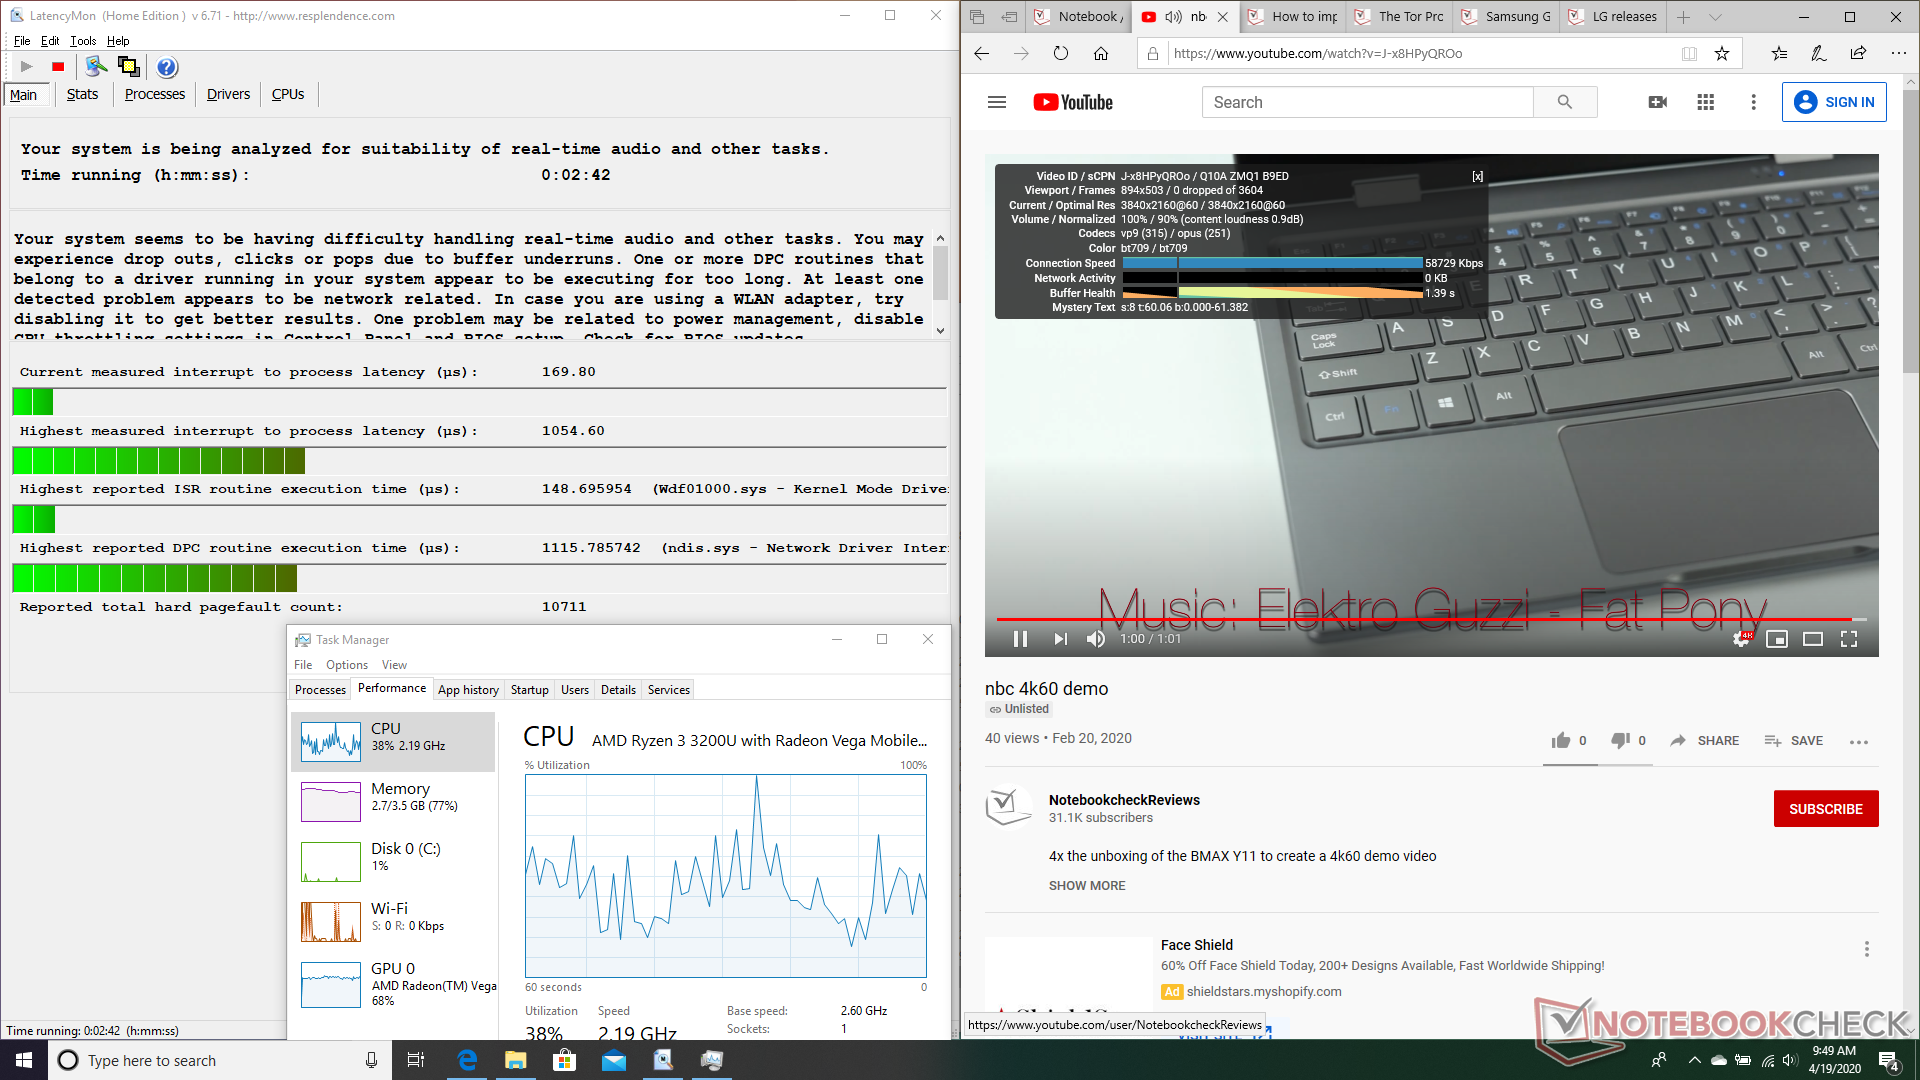
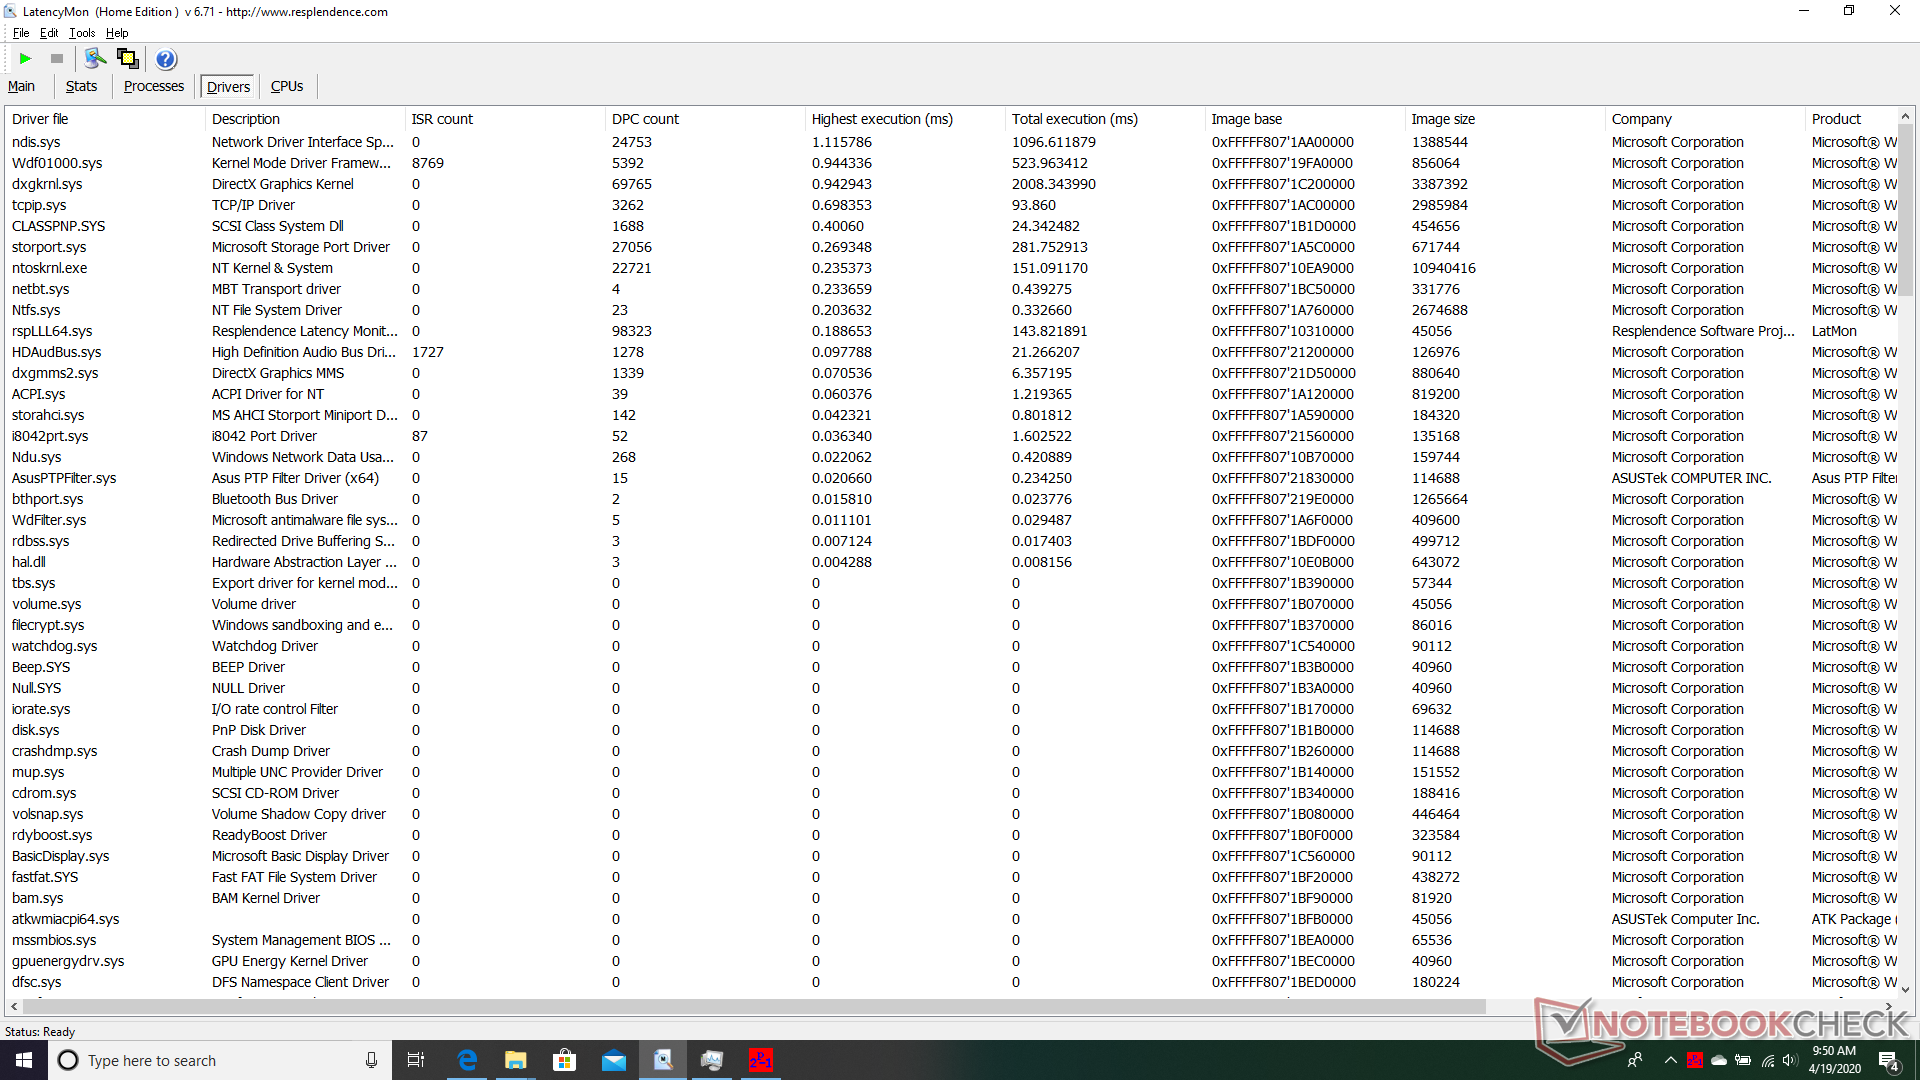
| DPC Latencies / LatencyMon - interrupt to process latency (max), Web, Youtube, Prime95 | |
| Asus Vivobook 15 F512DA-SH31 | |
* ... daha küçük daha iyidir
Depolama aygıtları
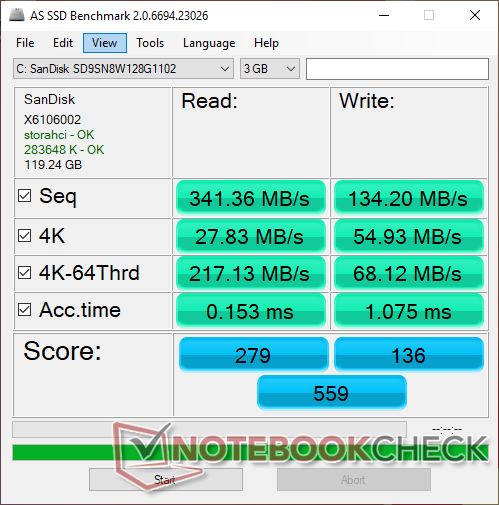
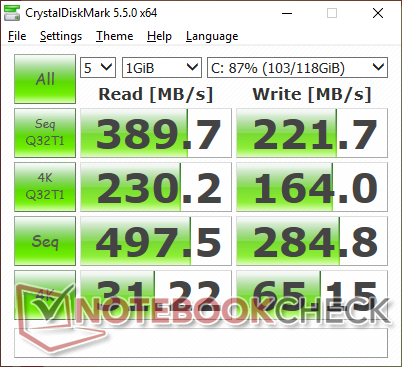
Test birimimiz fiyatları düşük tutmak için ucuz 128 GB SanDisk SD9SN8W128G M.2 SSD ile birlikte gelir. AS SSD'ye göre sıralı okuma ve yazma hızları, yalnızca 341 MB / s ve 134 MB / s'de çoğu SATA III SSD'den daha yavaştır. CrystalDiskMark sonuçları daha hızlı, ancak yine de kategori için hayal kırıklığı yaratıyor.
| Asus Vivobook 15 F512DA-SH31 SanDisk X600 SD9SN8W-128G | Lenovo Ideapad S340-15IIL Intel SSD 660p SSDPEKNW512G8 | Acer Aspire 5 A515-43-R6WW Intel SSD 660p 1TB SSDPEKNW010T8 | Dell Inspiron 15 3585 (2300U, Vega 6) Toshiba BG3 KBG30ZMS256G | Asus ZenBook 15 UX534FTC-A8190T Samsung SSD PM981 MZVLB1T0HALR | Huawei MateBook D 15-53010TUY Samsung SSD PM981 MZVLB256HAHQ | |
|---|---|---|---|---|---|---|
| AS SSD | 444% | 357% | 153% | 773% | 530% | |
| Seq Read (MB/s) | 341.4 | 1447 324% | 1358 298% | 1291 278% | 2643 674% | 2613 665% |
| Seq Write (MB/s) | 134.2 | 926 590% | 1300 869% | 688 413% | 1533 1042% | 1549 1054% |
| 4K Read (MB/s) | 27.83 | 40.06 44% | 44.88 61% | 21.87 -21% | 49.12 77% | 47.15 69% |
| 4K Write (MB/s) | 54.9 | 97.9 78% | 77.5 41% | 35.62 -35% | 134.7 145% | 111.6 103% |
| 4K-64 Read (MB/s) | 217.1 | 323.7 49% | 586 170% | 632 191% | 1028 374% | 748 245% |
| 4K-64 Write (MB/s) | 68.1 | 791 1062% | 738 984% | 221.2 225% | 1353 1887% | 1275 1772% |
| Access Time Read * (ms) | 0.153 | 0.06 61% | 0.33 -116% | 0.033 78% | 0.062 59% | |
| Access Time Write * (ms) | 1.075 | 0.144 87% | 0.057 95% | 0.234 78% | 0.028 97% | 0.042 96% |
| Score Read (Points) | 279 | 508 82% | 767 175% | 783 181% | 1342 381% | 1057 279% |
| Score Write (Points) | 136 | 982 622% | 945 595% | 326 140% | 1641 1107% | 1542 1034% |
| Score Total (Points) | 559 | 1738 211% | 2115 278% | 1489 166% | 3622 548% | 3097 454% |
| Copy ISO MB/s (MB/s) | 115.9 | 943 714% | 432.6 273% | 2226 1821% | ||
| Copy Program MB/s (MB/s) | 44.51 | 612 1275% | 95.6 115% | 506 1037% | ||
| Copy Game MB/s (MB/s) | 74.3 | 826 1012% | 263.4 255% | 1230 1555% | ||
| CrystalDiskMark 5.2 / 6 | 198% | 204% | 96% | 395% | 314% | |
| Write 4K (MB/s) | 65.2 | 130.8 101% | 114.9 76% | 87.3 34% | 138.1 112% | 134.8 107% |
| Read 4K (MB/s) | 31.22 | 54.8 76% | 52.7 69% | 23.54 -25% | 45.89 47% | 41.68 34% |
| Write Seq (MB/s) | 284.8 | 978 243% | 1361 378% | 824 189% | 2147 654% | 1651 480% |
| Read Seq (MB/s) | 497.5 | 1627 227% | 1385 178% | 715 44% | 2188 340% | 2300 362% |
| Write 4K Q32T1 (MB/s) | 164 | 450.1 174% | 181.1 10% | 147.8 -10% | 427.8 161% | 260 59% |
| Read 4K Q32T1 (MB/s) | 230.2 | 345.9 50% | 340.5 48% | 256.1 11% | 404 75% | 335.1 46% |
| Write Seq Q32T1 (MB/s) | 221.7 | 982 343% | 1519 585% | 733 231% | 2396 981% | 1641 640% |
| Read Seq Q32T1 (MB/s) | 389.7 | 1842 373% | 1515 289% | 1525 291% | 3454 786% | 3452 786% |
| Toplam Ortalama (Program / Ayarlar) | 321% /
354% | 281% /
289% | 125% /
132% | 584% /
635% | 422% /
439% |
* ... daha küçük daha iyidir

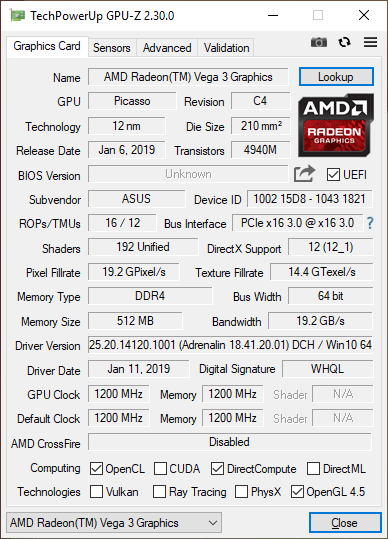
GPU Performansı
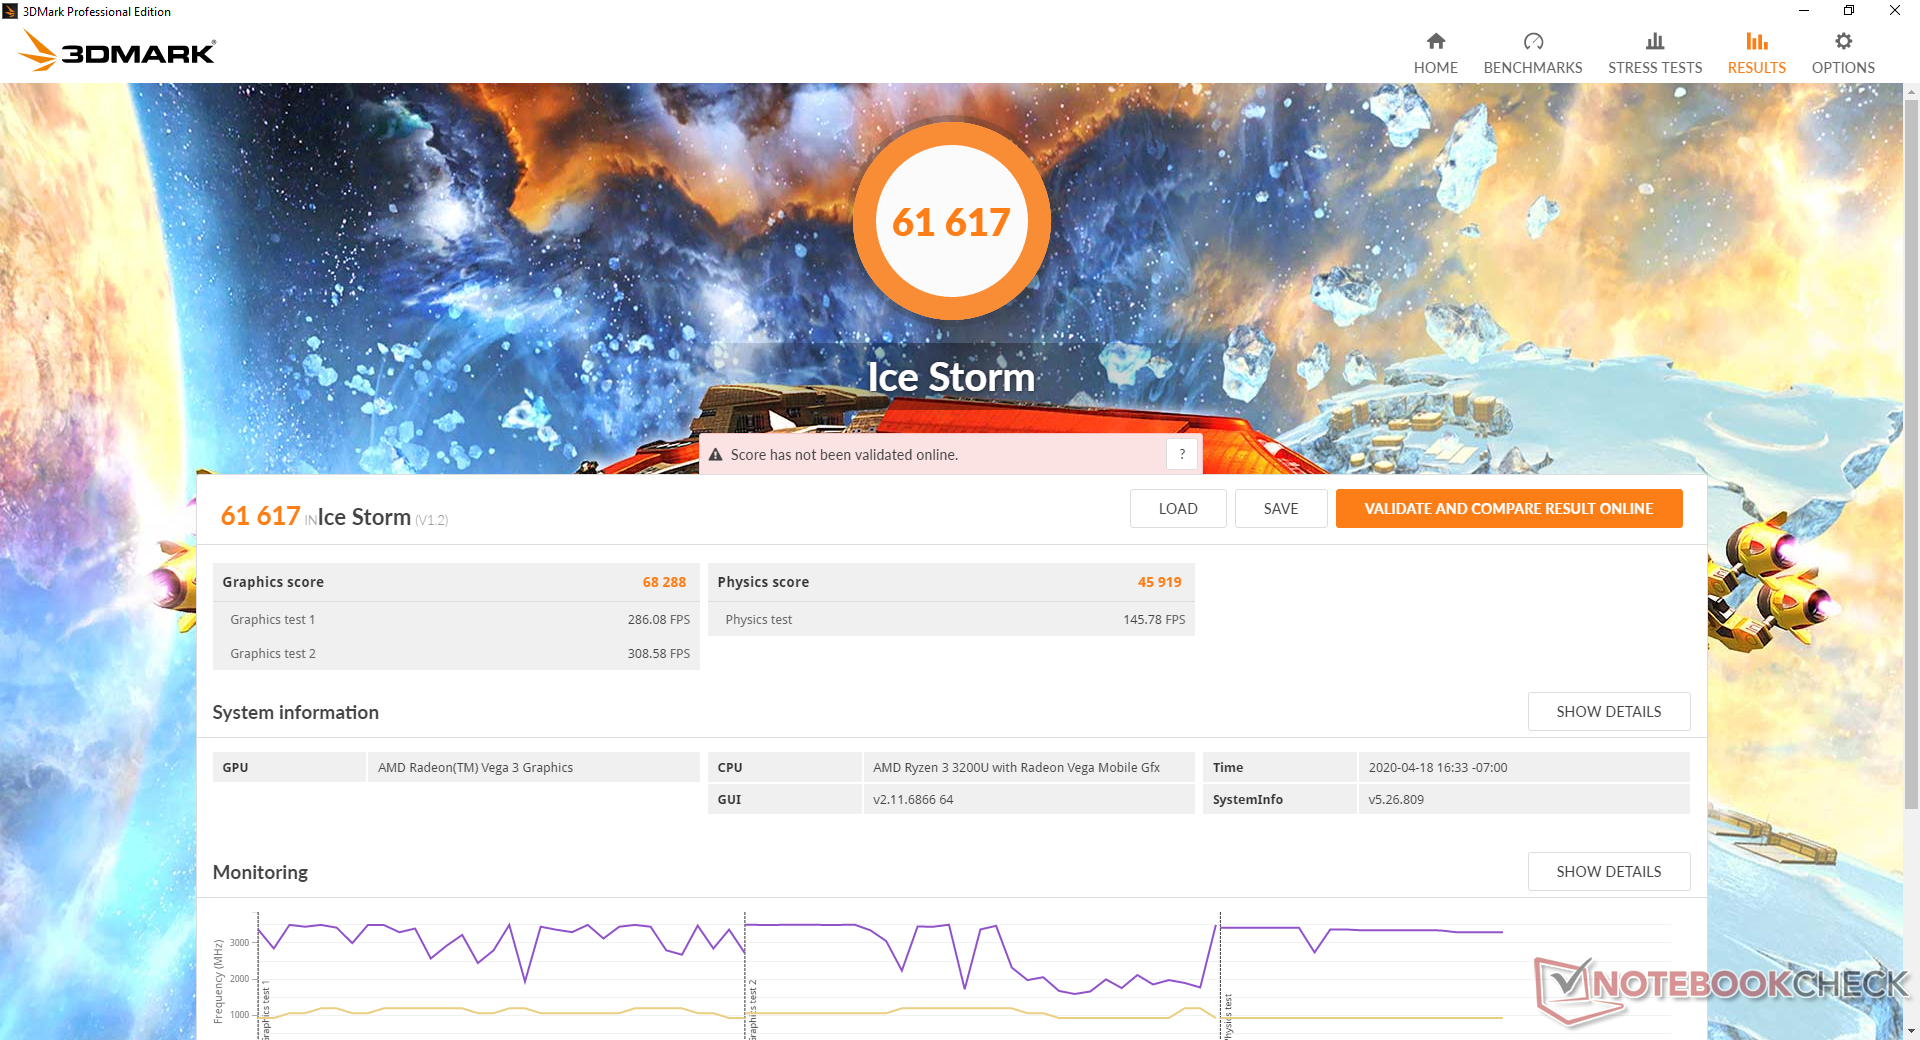
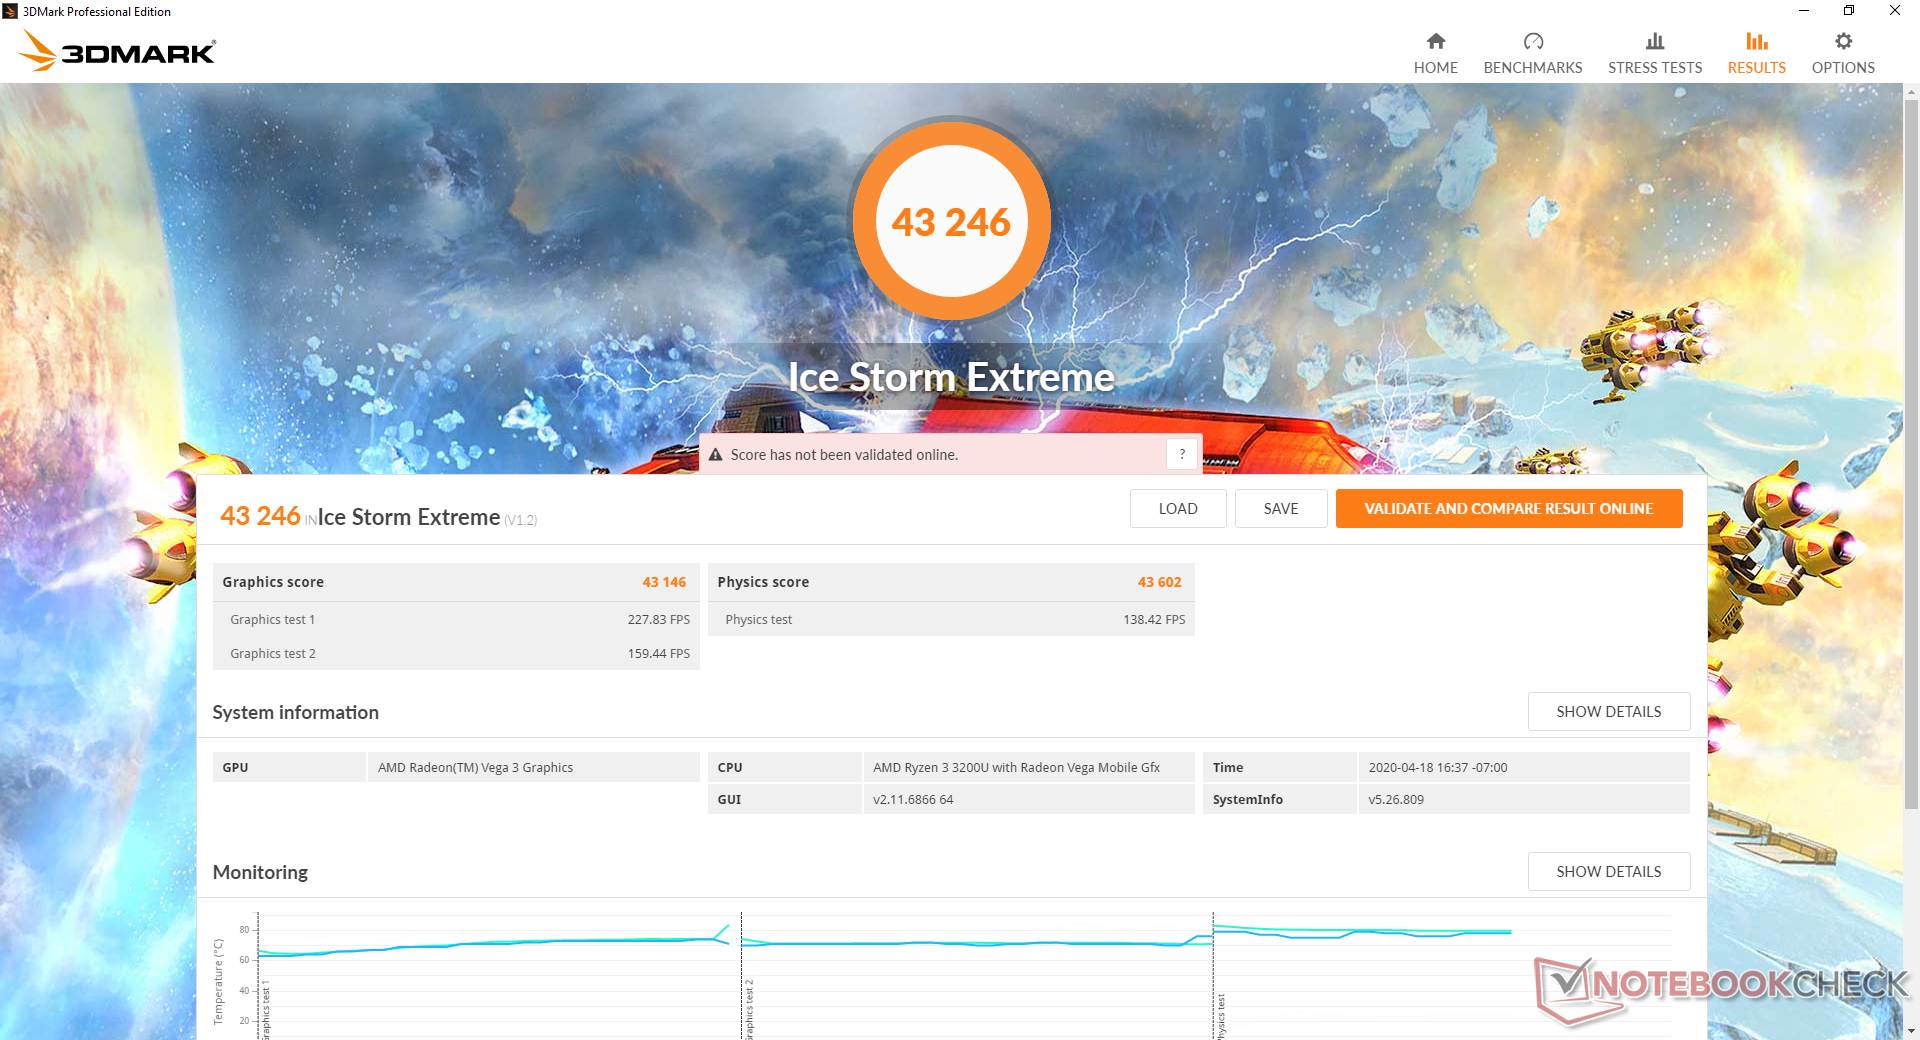
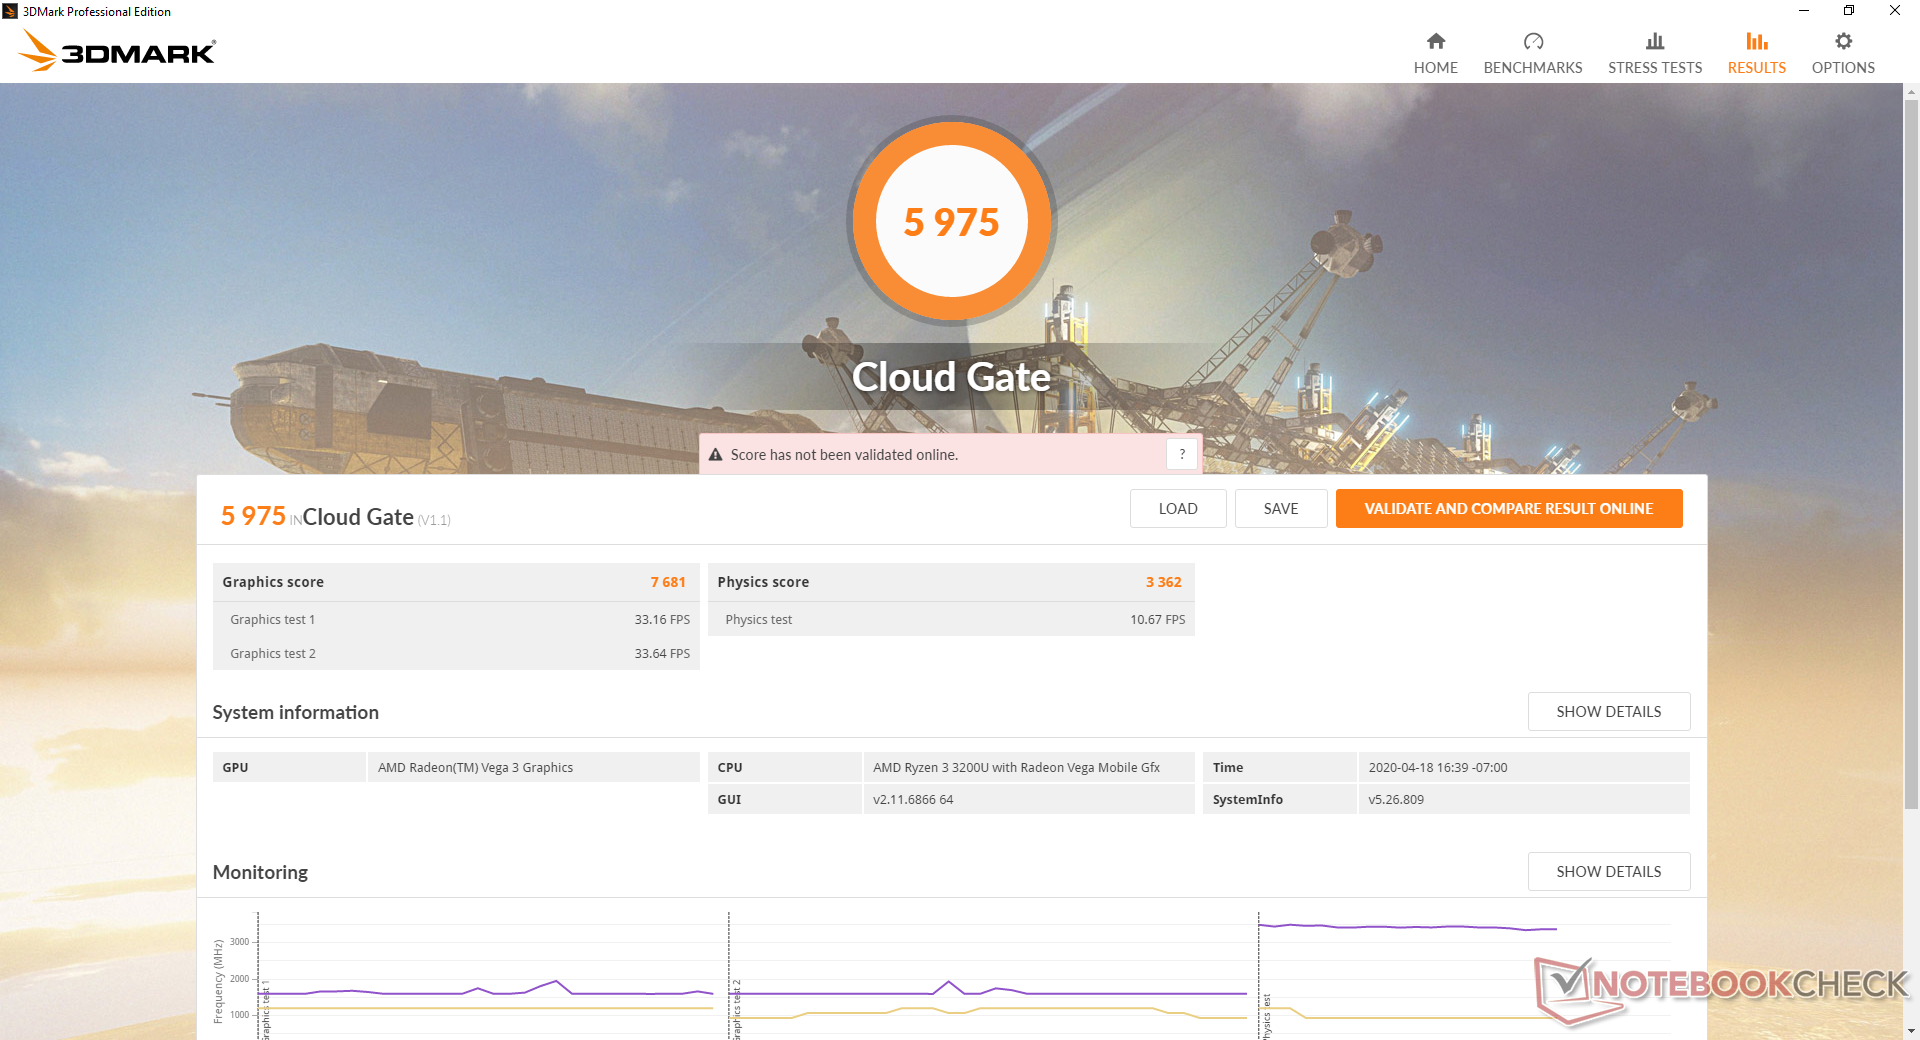
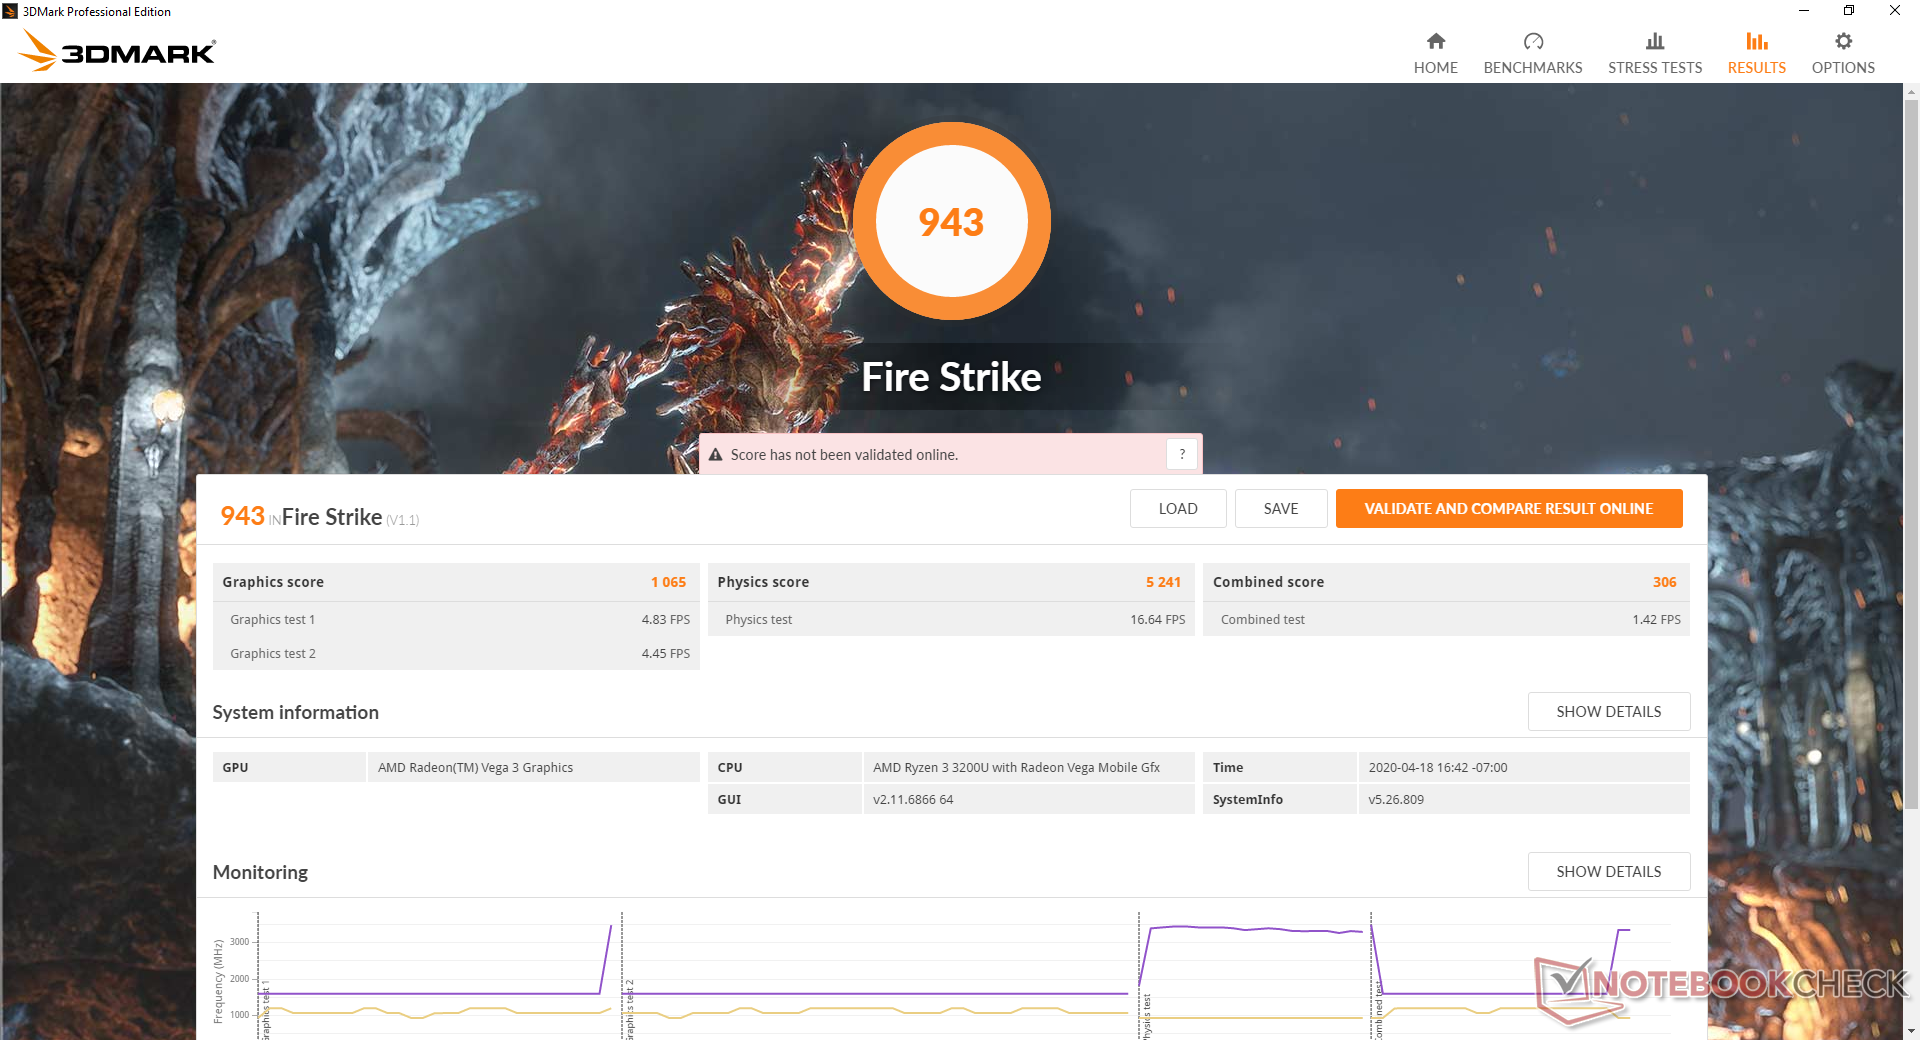
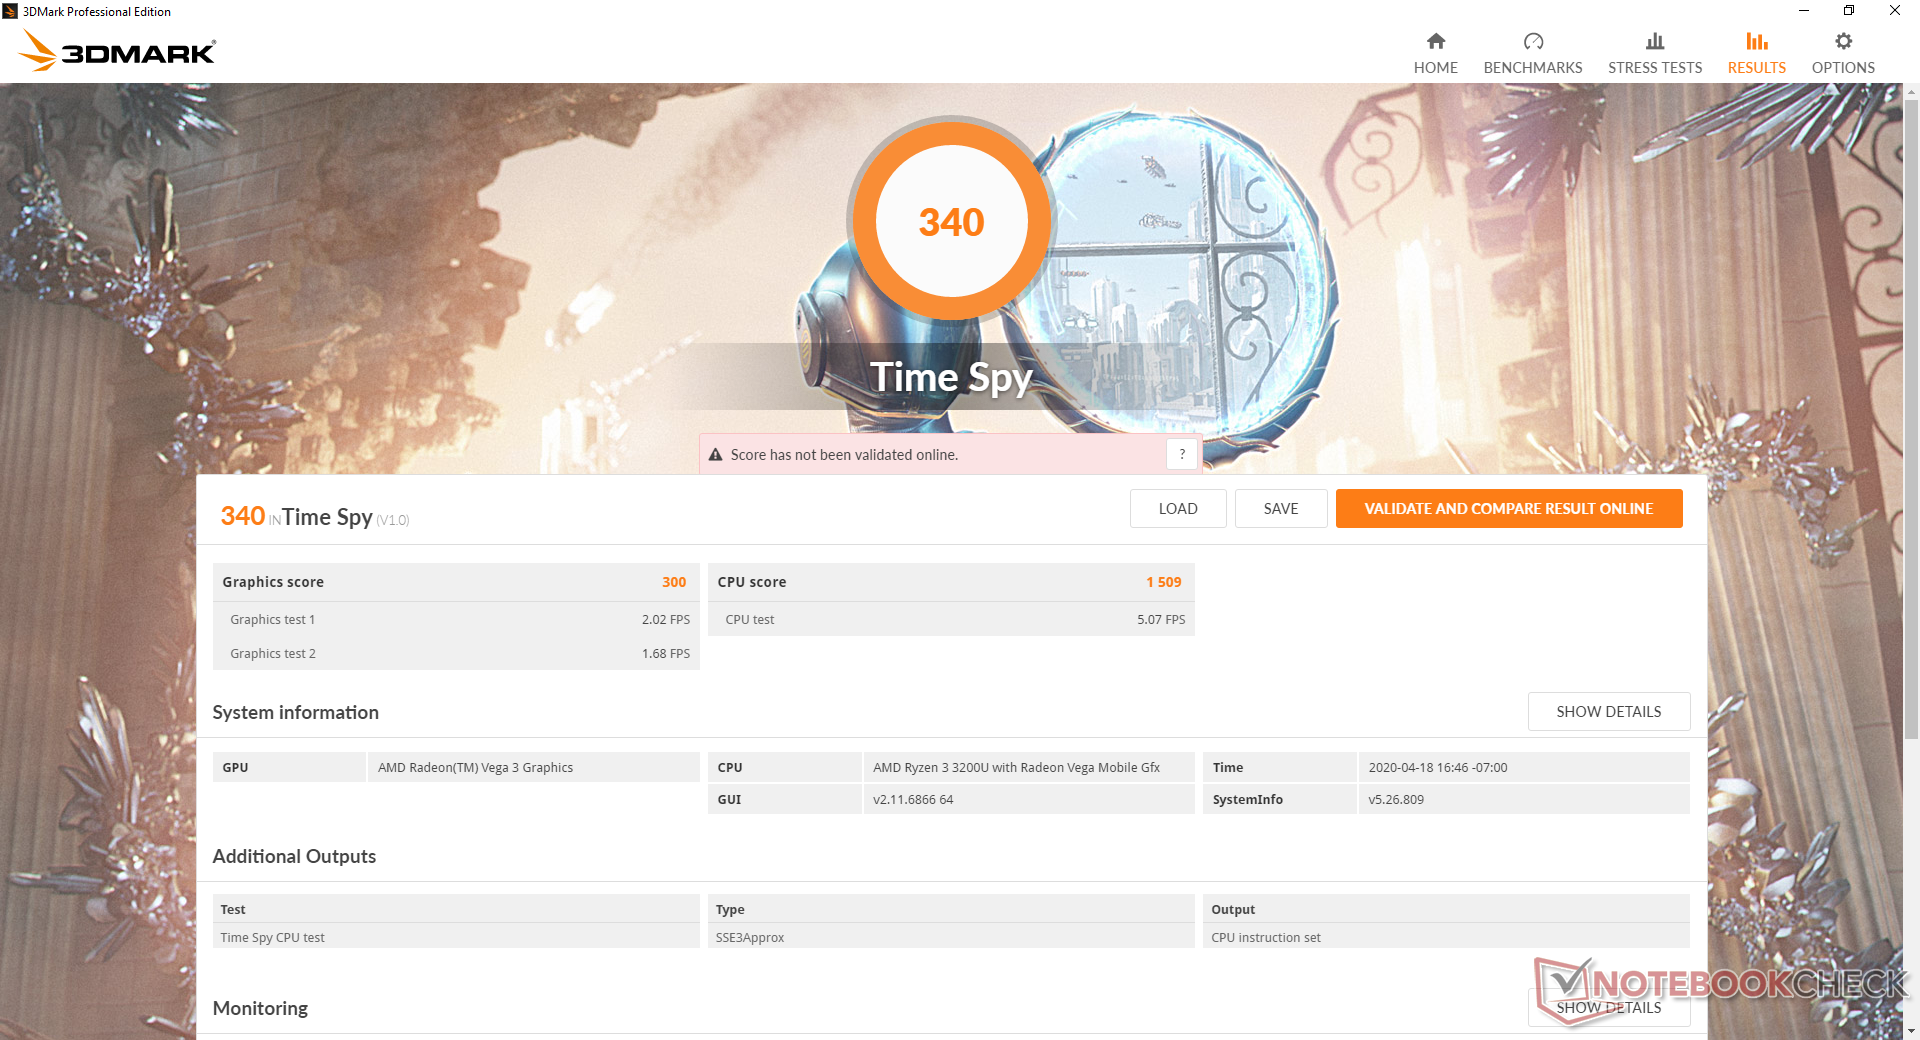
Entegre Radeon RX Vega 3, çoğu 3D oyun için uygun olmayan rakip Intel UHD Graphics 620 ile boyunduruk halindedir. DOTA 2 veya Rocket League gibi hafif oyunlar için, RX Vega 10, Buz gölü Core i7 veya GeForce MX150 / MX250 içeren dizüstü bilgisayarları düşünün. Daha fazla karşılaştırma karşılaştırması için RX Vega 3'teki özel sayfamıza bakın.
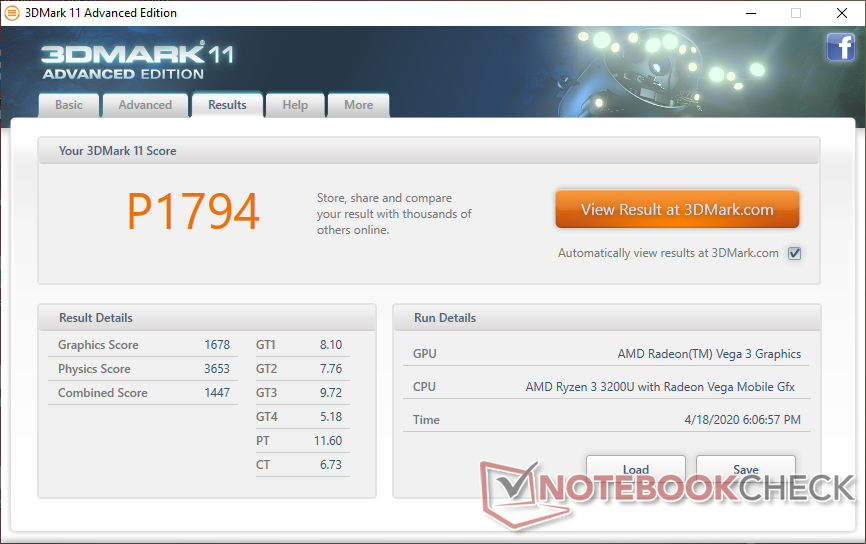
| 3DMark 11 Performance | 1794 puan | |
| 3DMark Ice Storm Standard Score | 61617 puan | |
| 3DMark Cloud Gate Standard Score | 5975 puan | |
| 3DMark Fire Strike Score | 943 puan | |
| 3DMark Time Spy Score | 340 puan | |
Yardım | ||
| Dota 2 Reborn | |
| 1280x720 min (0/3) fastest | |
| Acer Aspire 5 A515-54G | |
| Lenovo ThinkBook 15 | |
| Dell XPS 13 9300 i5 FHD | |
| Asus VivoBook S15 S510UA | |
| Lenovo ThinkPad X1 Yoga 20SA000GUS | |
| Intel NUC5i3RYK | |
| Huawei MateBook D 15-53010TUY | |
| HP Pavilion 15-cw1212ng | |
| Asus Vivobook 15 F512DA-SH31 | |
| 1366x768 med (1/3) | |
| Acer Aspire 5 A515-54G | |
| Huawei MateBook D 15-53010TUY | |
| Asus VivoBook S15 S510UA | |
| Lenovo ThinkBook 15 | |
| Lenovo ThinkPad X1 Yoga 20SA000GUS | |
| Dell XPS 13 9300 i5 FHD | |
| HP Pavilion 15-cw1212ng | |
| Asus Vivobook 15 F512DA-SH31 | |
| Intel NUC5i3RYK | |
| düşük | orta | yüksek | ultra | |
|---|---|---|---|---|
| Dota 2 Reborn (2015) | 60.8 | 38.8 | 18.2 | 16.9 |
| X-Plane 11.11 (2018) | 18.3 | 12.3 | 11.1 |
Emisyonları
Sistem Gürültüsü
Fan gürültüsü sistemde bir sorun oluşturmaz. Bu iş yükleri sırasında 31 dB (A) değerine kadar fan gürültüsüyle yazarken, göz atarken veya sözcük işleme yaparken sessiz bir deneyim bekleyin. Maksimum 34 dB (A) kaydedebiliriz, bu sadece aşırı yükleri çalıştırırken geçicidir.
| Asus Vivobook 15 F512DA-SH31 Vega 3, R3 3200U, SanDisk X600 SD9SN8W-128G | Lenovo Ideapad S340-15IIL Iris Plus Graphics G7 (Ice Lake 64 EU), i7-1065G7, Intel SSD 660p SSDPEKNW512G8 | Acer Aspire 5 A515-43-R6WW Vega 8, R5 3500U, Intel SSD 660p 1TB SSDPEKNW010T8 | Dell Inspiron 15 3585 (2300U, Vega 6) Vega 6, R3 2300U, Toshiba BG3 KBG30ZMS256G | Asus ZenBook 15 UX534FTC-A8190T GeForce GTX 1650 Max-Q, i7-10510U, Samsung SSD PM981 MZVLB1T0HALR | Huawei MateBook D 15-53010TUY Vega 8, R5 3500U, Samsung SSD PM981 MZVLB256HAHQ | |
|---|---|---|---|---|---|---|
| Noise | 1% | -7% | -10% | -6% | -1% | |
| kapalı / ortam * (dB) | 29.2 | 28.5 2% | 30.2 -3% | 30.6 -5% | 30.3 -4% | 29.6 -1% |
| Idle Minimum * (dB) | 29.2 | 28.5 2% | 30.2 -3% | 30.6 -5% | 30.3 -4% | 29.6 -1% |
| Idle Average * (dB) | 29.2 | 28.5 2% | 30.2 -3% | 30.6 -5% | 30.3 -4% | 29.6 -1% |
| Idle Maximum * (dB) | 29.2 | 28.5 2% | 30.2 -3% | 30.6 -5% | 30.9 -6% | 29.6 -1% |
| Load Average * (dB) | 30.5 | 30.3 1% | 34.8 -14% | 36.7 -20% | 31.3 -3% | 30.6 -0% |
| Load Maximum * (dB) | 34 | 35.5 -4% | 39.5 -16% | 41.1 -21% | 38.2 -12% | 33.8 1% |
| Witcher 3 ultra * (dB) | 38.1 |
* ... daha küçük daha iyidir
Ses yüksekliği
| Boşta |
| 29.2 / 29.2 / 29.2 dB |
| Çalışırken |
| 30.5 / 34 dB |
 | ||
30 dB sessiz 40 dB(A) duyulabilirlik 50 dB(A) gürültülü |
||
min: | ||
Sıcaklık
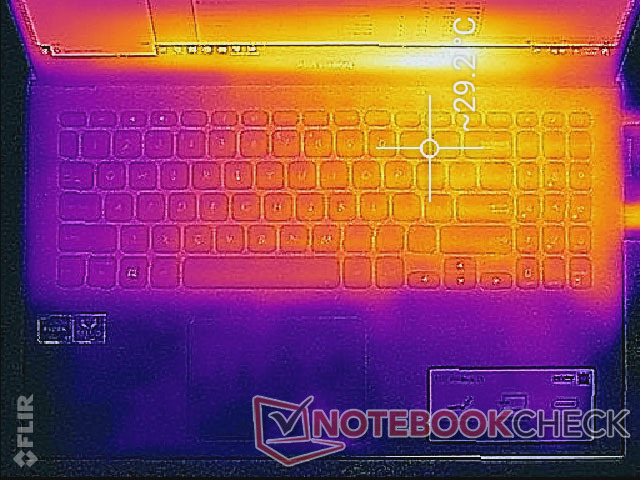
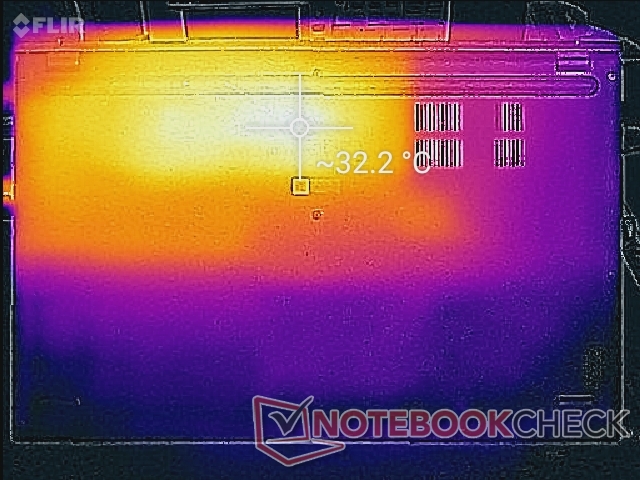
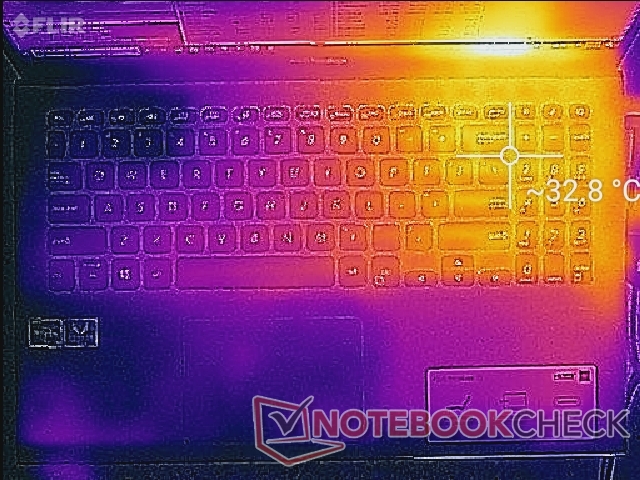
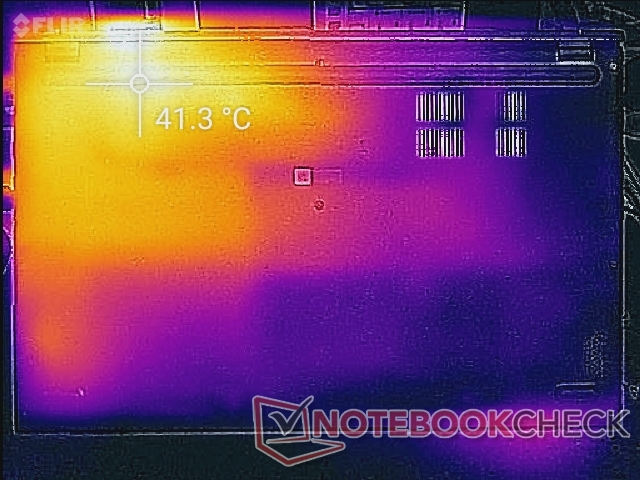
VivoBook F512 / X512 üzerindeki yüzey sıcaklıkları, işlemci ve soğutma çözümünün içine nasıl yerleştirildiği nedeniyle kasanın sağ yarısında her zaman sol yarısından daha sıcak olacaktır. Aşırı yükler altındayken, klavye sıcak nokta platoları yaklaşık 33 C'ye kadar, alt sıcak nokta 42 C kadar yüksek olabilir.
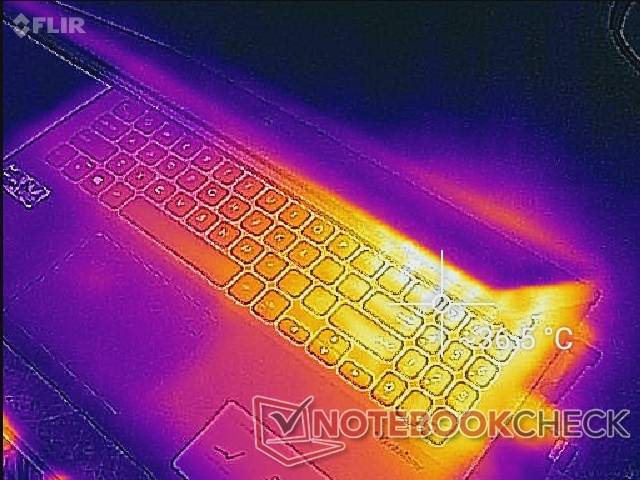
(+) Üst taraftaki maksimum sıcaklık, 36.8 °C / 98 F ortalamasına kıyasla 33 °C / 91 F'dir. , Multimedia sınıfı için 21 ile 71 °C arasında değişir.
(±) Alt kısım, 39.1 °C / 102 F ortalamasına kıyasla maksimum 41.4 °C / 107 F'ye kadar ısınır
(+) Boşta kullanımda, üst tarafın ortalama sıcaklığı 25.8 °C / 78 F olup, cihazın 31.3 °C / 88 F.
(+) Avuç içi dayanakları ve dokunmatik yüzey, maksimum 24.2 °C / 75.6 F ile cilt sıcaklığından daha soğuktur ve bu nedenle dokunulduğunda soğuktur.
(+) Benzer cihazların avuç içi dayanağı alanının ortalama sıcaklığı 28.7 °C / 83.7 F (+4.5 °C / 8.1 F) idi.
Stres testi
Herhangi bir olası azaltma veya kararlılık sorununu belirlemek için sistemi sentetik yüklerle vurgularız. Prime95'in çalıştırılması CPU'nun sadece ilk birkaç saniye için 3,5 GHz ve 3,3 GHz'e yükselmesine neden olur. Daha sonra saat hızları 2,5 GHz ve 86 C'de sabitlenir ve yinelenen artışlar 3,1 GHz'e yükselir. Hem CPU hem de GPU vurgulanmışsa, saat hızları 2 GHz'e düşer. Şebekede çalışan bir 3DMark 11, pillerdeki 1866 ve 1596 puanlara kıyasla sırasıyla 3653 ve 1678 puanlık Fizik ve Grafik puanlarını döndürür.
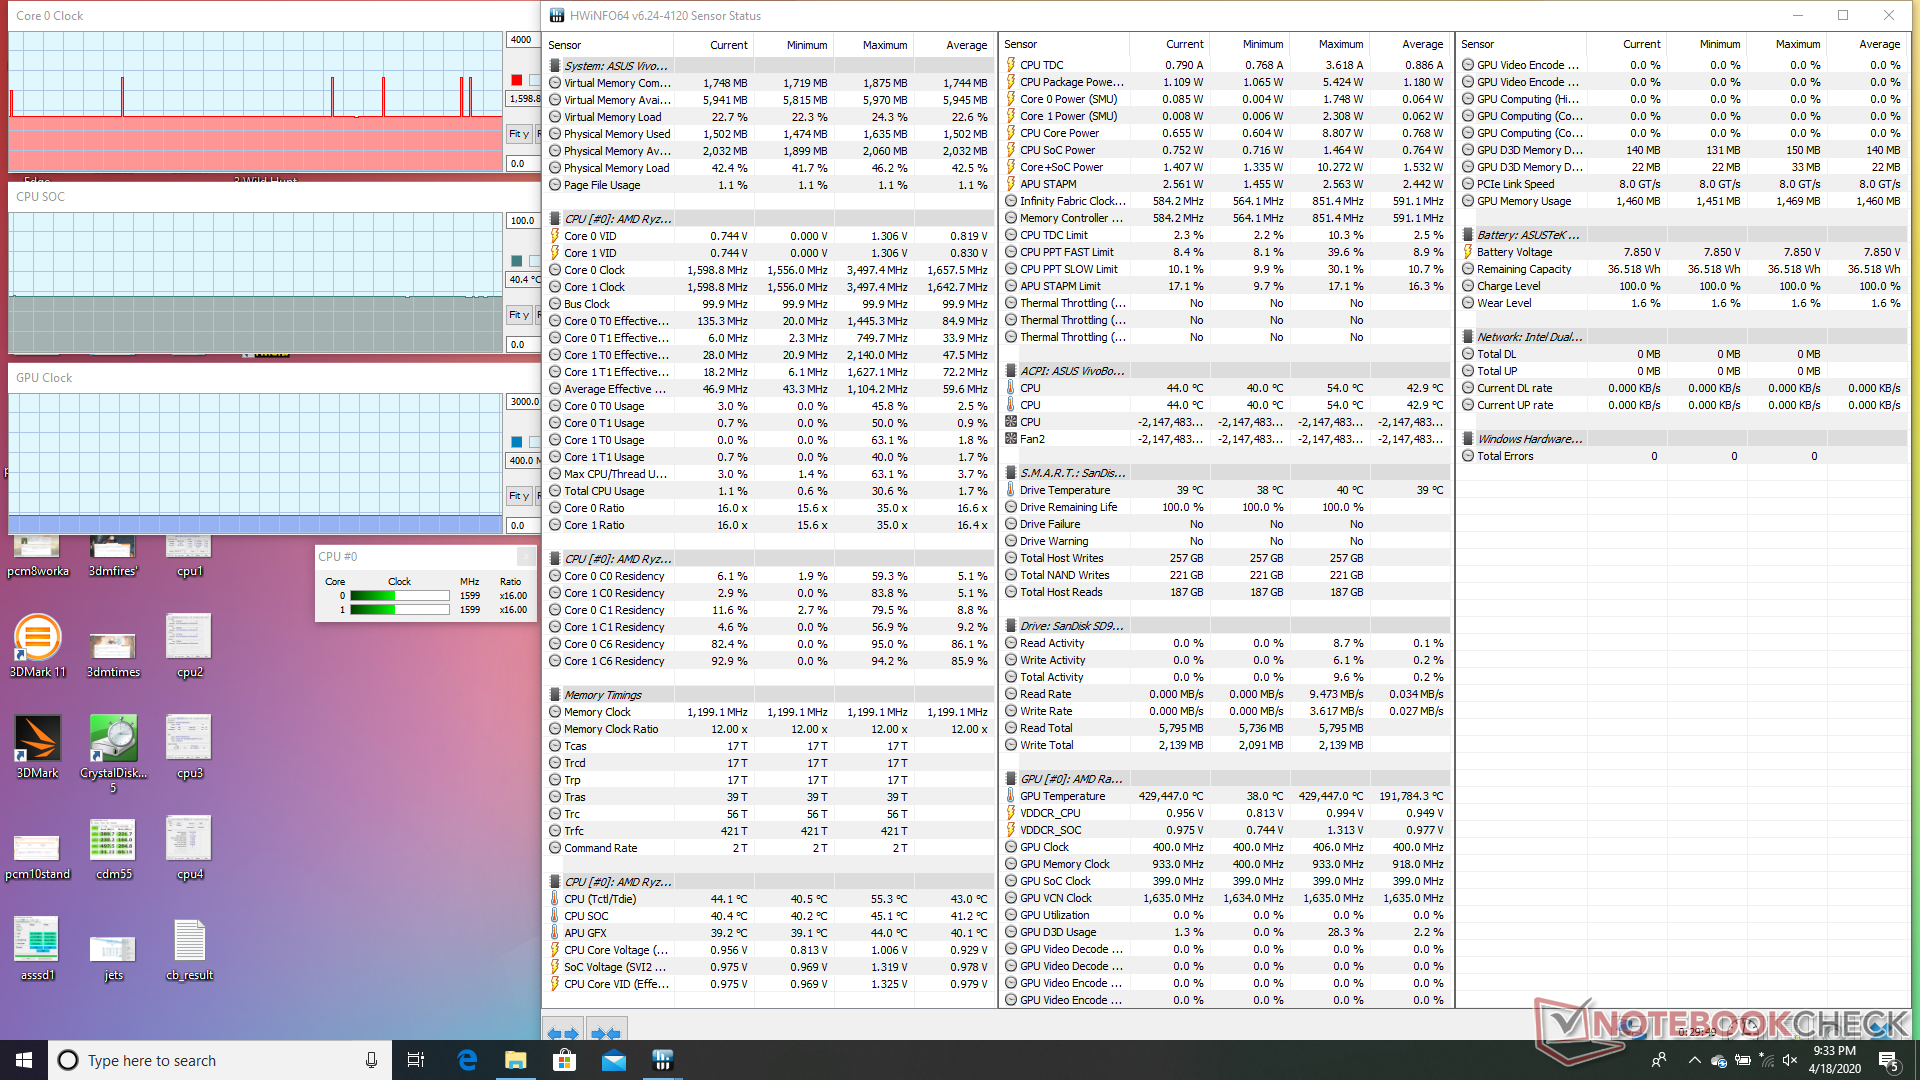
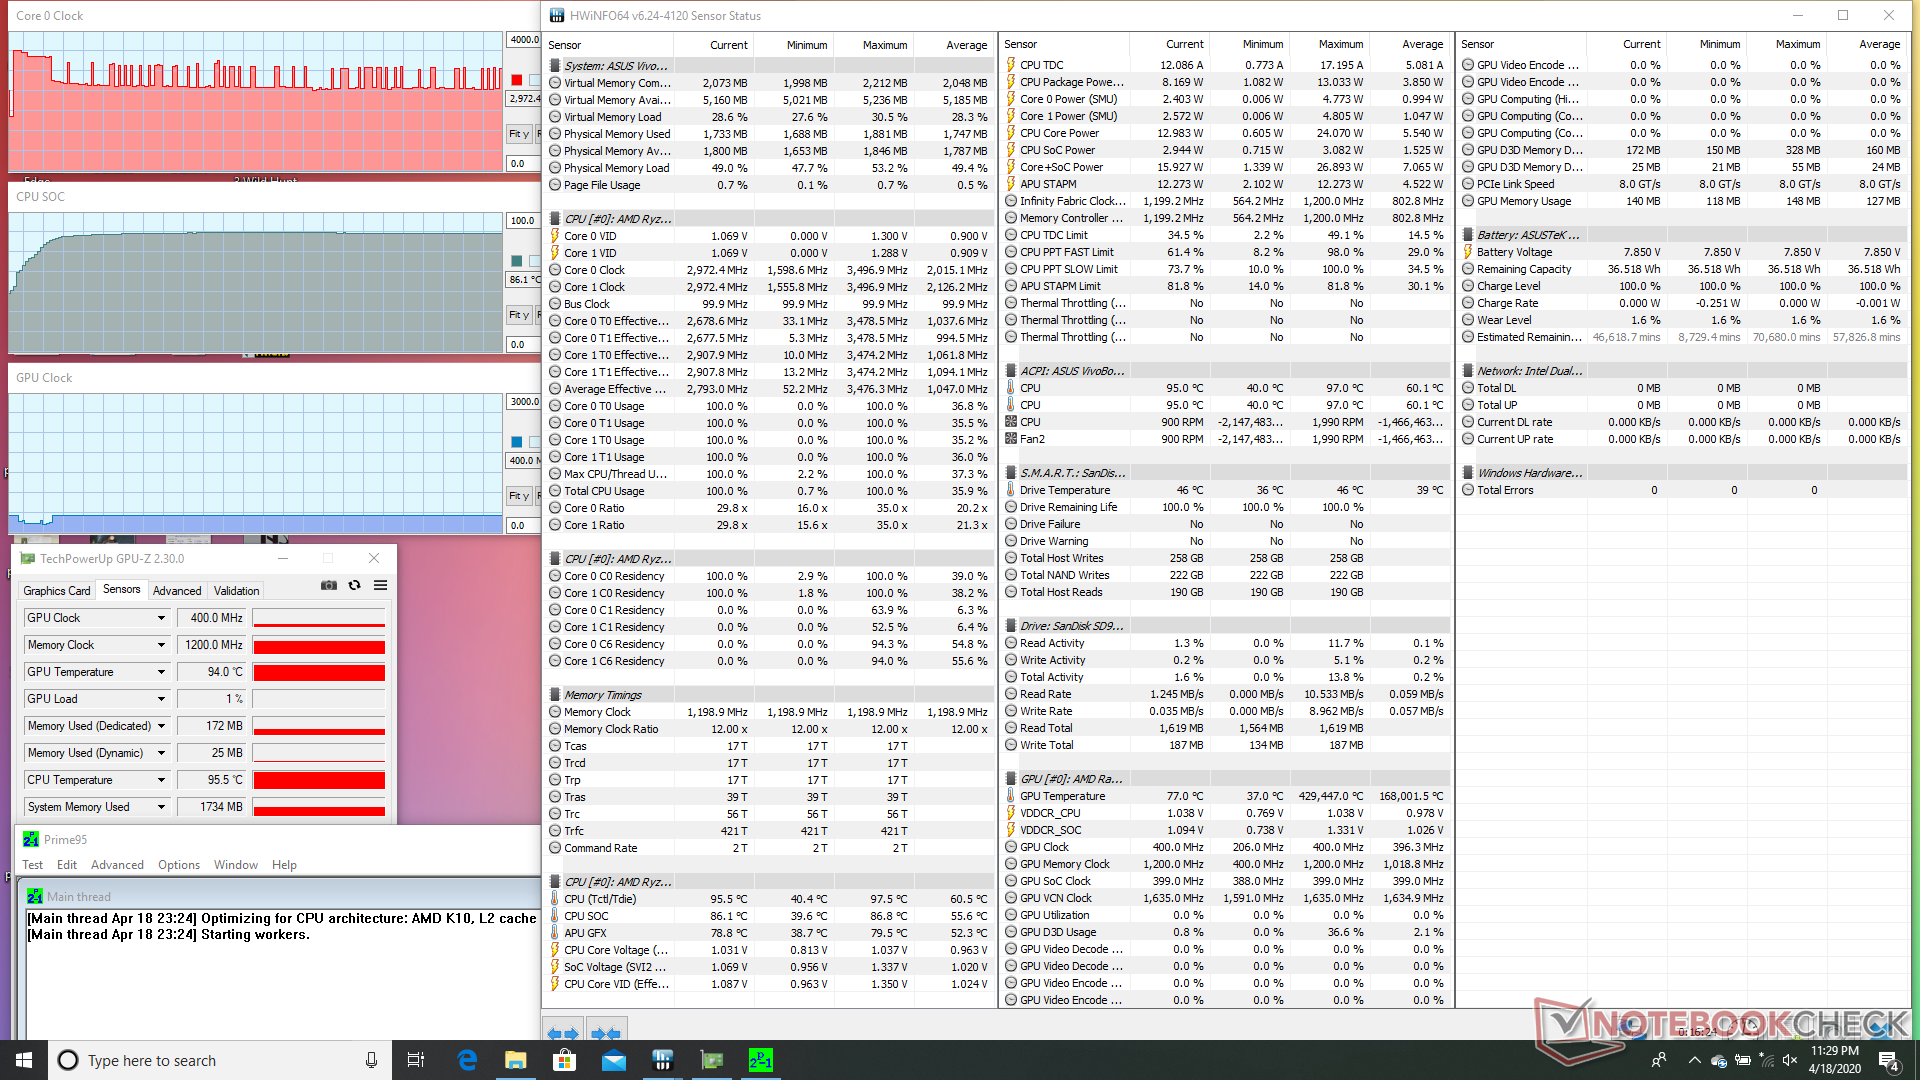
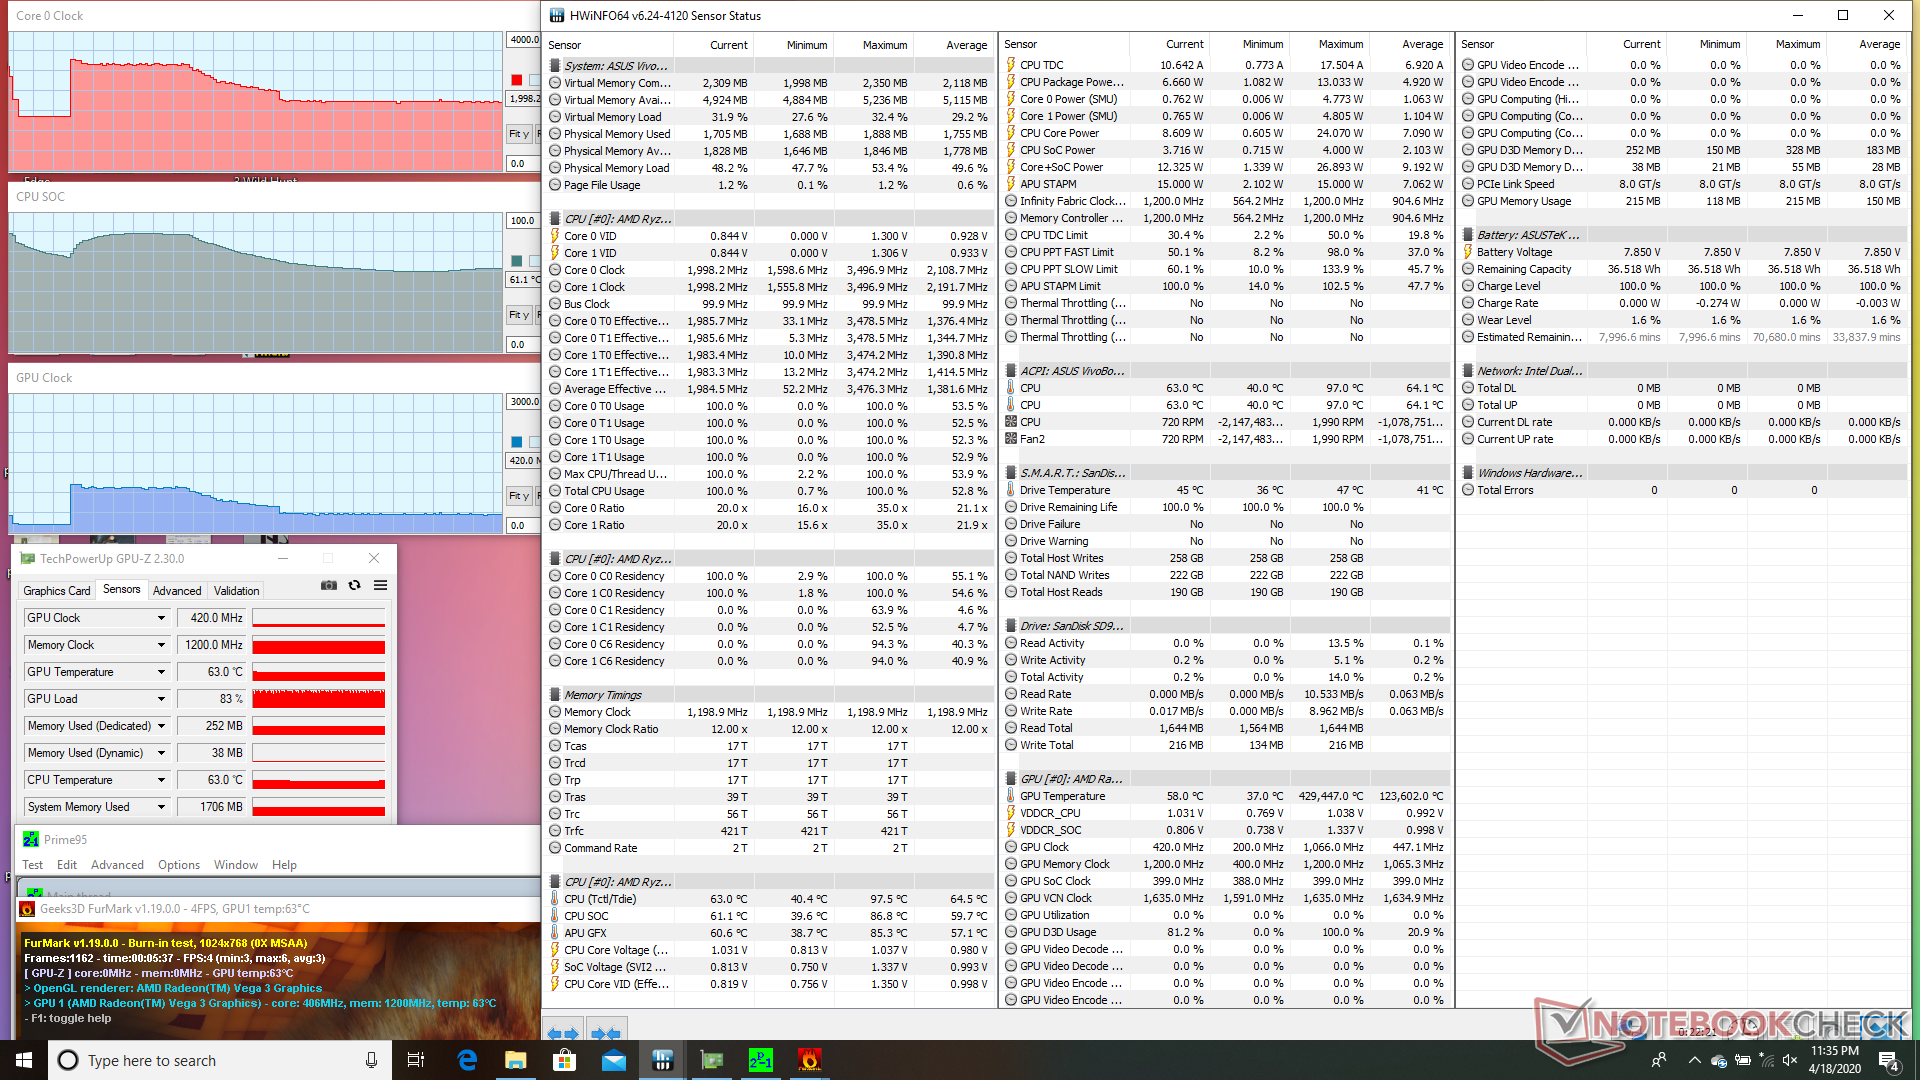
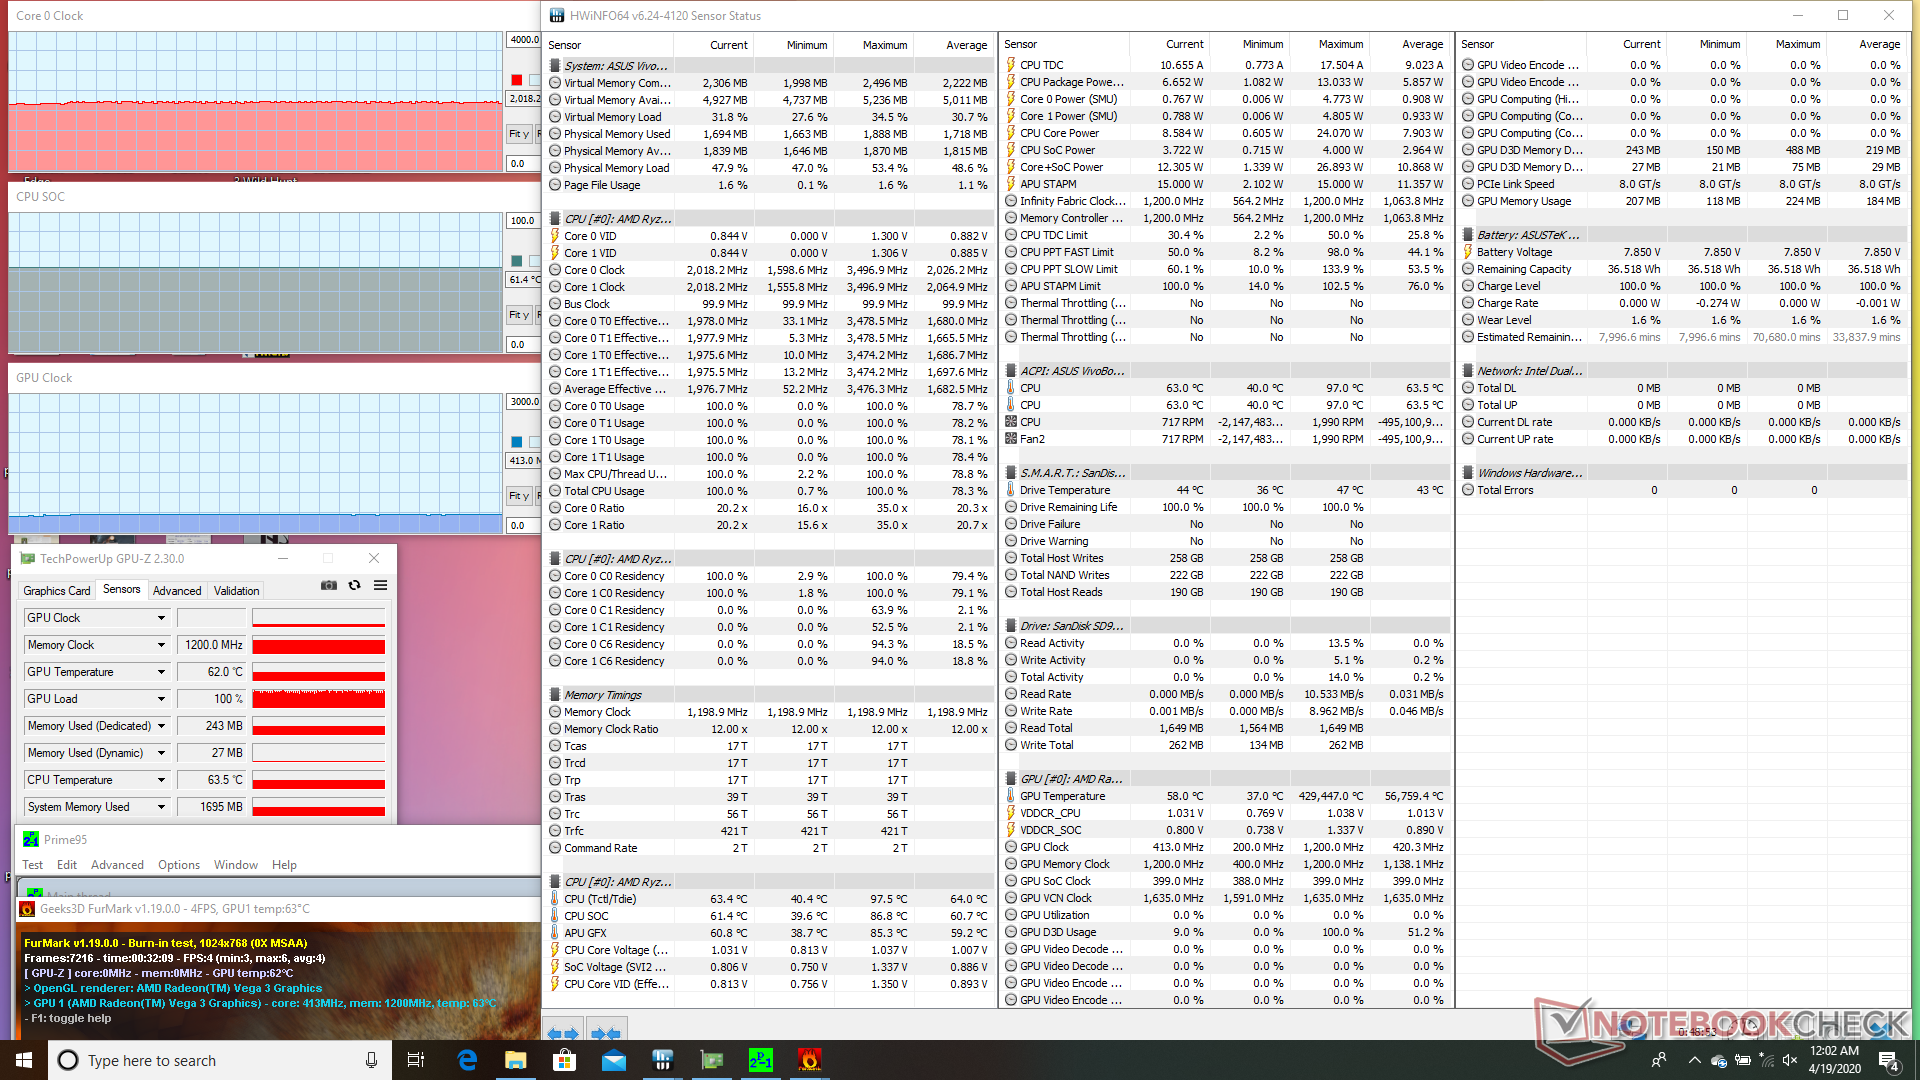
| CPU Clock (GHz) | GPU Clock (MHz) | Average CPU Temperature (°C) | |
| System Idle | -- | -- | 40 |
| Prime95 Stress | 2.5 - 3.1 | -- | 86 |
| Prime95 + FurMark Stress | 2.0 | 413 | 61 |
Hoparlörler
Burada fiyat dikkate iyi para hoparlörleri hakkında olağanüstü bir şey yok. Yüksek ses seviyesi ayarları statik olmayacaktır, ancak ön avuç içi dayanakları dokunmaya orta derecede titreşecektir. Maksimum ses düzeyi büyük bir konferans salonu için yeterince yüksek değildir.


Asus Vivobook 15 F512DA-SH31 ses analizi
(±) | hoparlör ses yüksekliği ortalama ama iyi (78.6 dB)
Bas 100 - 315Hz
(±) | azaltılmış bas - ortalama olarak medyandan 13.6% daha düşük
(±) | Bas doğrusallığı ortalamadır (13.9% delta - önceki frekans)
Ortalar 400 - 2000 Hz
(+) | dengeli ortalar - medyandan yalnızca 3.7% uzakta
(+) | orta frekanslar doğrusaldır (5% deltadan önceki frekansa)
Yüksekler 2 - 16 kHz
(+) | dengeli yüksekler - medyandan yalnızca 3% uzakta
(+) | yüksekler doğrusaldır (6.2% deltadan önceki frekansa)
Toplam 100 - 16.000 Hz
(±) | Genel sesin doğrusallığı ortalamadır (18.9% ortancaya göre fark)
Aynı sınıfla karşılaştırıldığında
» Bu sınıftaki tüm test edilen cihazların %59%'si daha iyi, 7% benzer, 33% daha kötüydü
» En iyisinin deltası 5% idi, ortalama 17% idi, en kötüsü 45% idi
Test edilen tüm cihazlarla karşılaştırıldığında
» Test edilen tüm cihazların %44'si daha iyi, 8 benzer, % 48 daha kötüydü
» En iyisinin deltası 4% idi, ortalama 24% idi, en kötüsü 134% idi
Apple MacBook 12 (Early 2016) 1.1 GHz ses analizi
(+) | hoparlörler nispeten yüksek sesle çalabilir (83.6 dB)
Bas 100 - 315Hz
(±) | azaltılmış bas - ortalama olarak medyandan 11.3% daha düşük
(±) | Bas doğrusallığı ortalamadır (14.2% delta - önceki frekans)
Ortalar 400 - 2000 Hz
(+) | dengeli ortalar - medyandan yalnızca 2.4% uzakta
(+) | orta frekanslar doğrusaldır (5.5% deltadan önceki frekansa)
Yüksekler 2 - 16 kHz
(+) | dengeli yüksekler - medyandan yalnızca 2% uzakta
(+) | yüksekler doğrusaldır (4.5% deltadan önceki frekansa)
Toplam 100 - 16.000 Hz
(+) | genel ses doğrusaldır (10.2% ortancaya göre fark)
Aynı sınıfla karşılaştırıldığında
» Bu sınıftaki tüm test edilen cihazların %7%'si daha iyi, 2% benzer, 91% daha kötüydü
» En iyisinin deltası 5% idi, ortalama 18% idi, en kötüsü 53% idi
Test edilen tüm cihazlarla karşılaştırıldığında
» Test edilen tüm cihazların %5'si daha iyi, 1 benzer, % 94 daha kötüydü
» En iyisinin deltası 4% idi, ortalama 24% idi, en kötüsü 134% idi
Enerji yönetimi
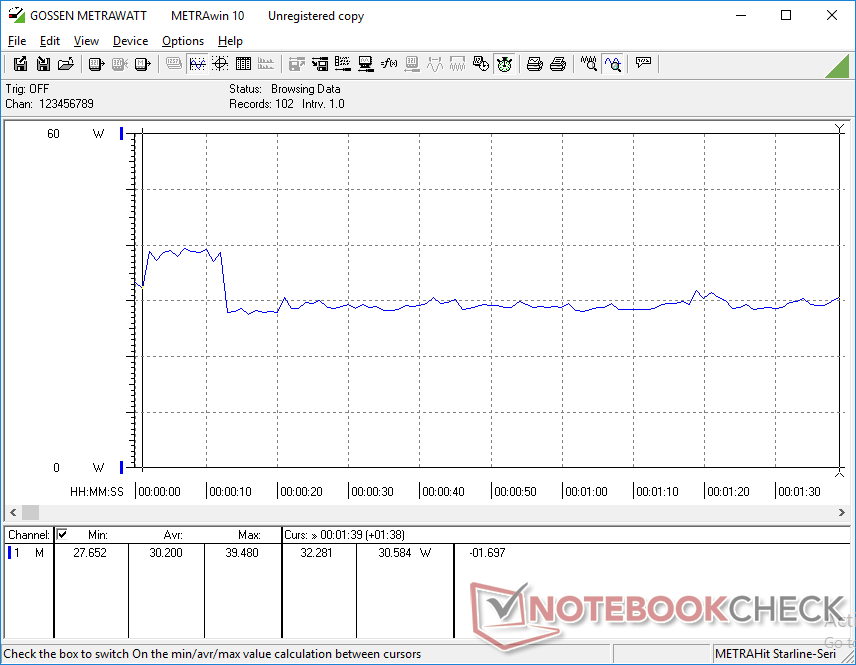
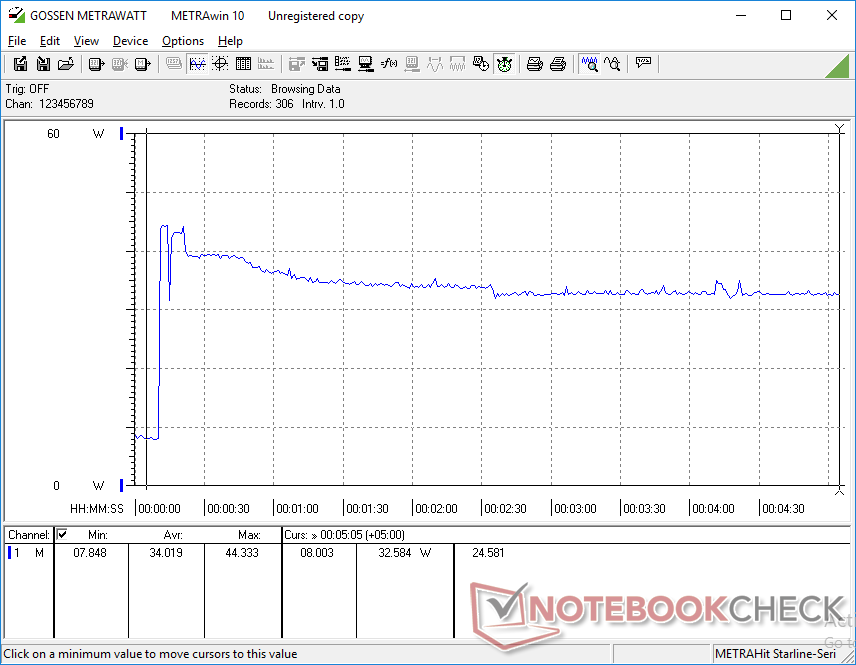
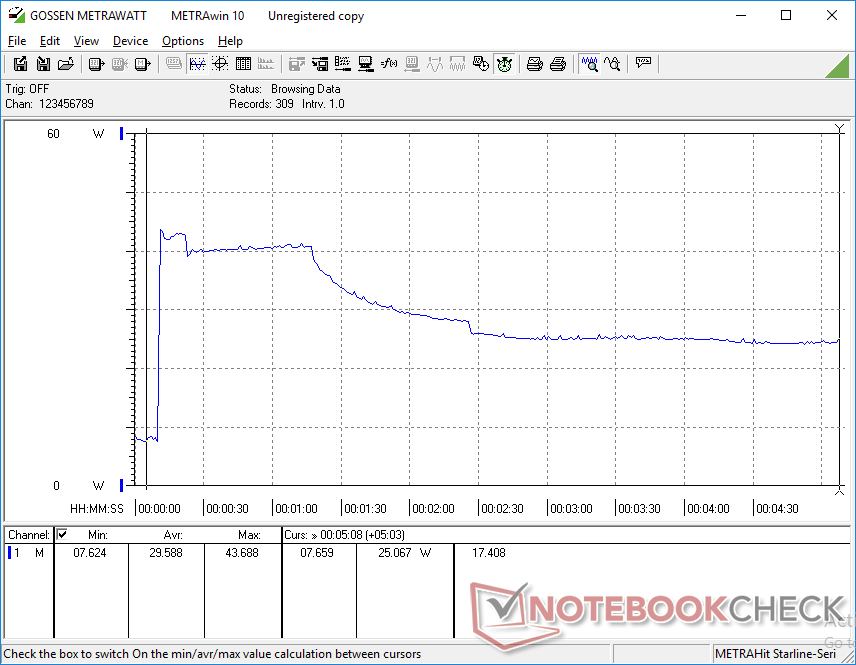
Güç tüketimi
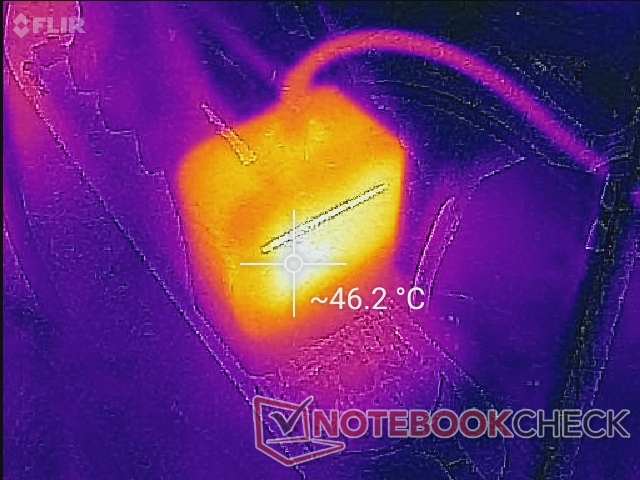
Masaüstünde rölanti, güç ayarına ve parlaklık seviyesine bağlı olarak 3 W ile 8 W arasında çeker. 3DMark 06 kullanırken, üst seviye Ryzen 5 3500U ile Acer Aspire A515'e kaydettiğimiz değerle kıyaslanabilir olmak için ortalama tüketim sadece 30 W'dir. Küçükten maksimum 44.4 W tüketim kaydedebiliriz (~ 5.3 x 5,3 x 2,8 cm) 45 W AC adaptör. Bu yüksek tüketim, aşağıdaki grafiklerde gösterildiği gibi performans azaltma nedeniyle zamanla düşer.
| Kapalı / Bekleme modu | |
| Boşta | |
| Çalışırken |
|
Key:
min: | |
| Asus Vivobook 15 F512DA-SH31 R3 3200U, Vega 3, SanDisk X600 SD9SN8W-128G, IPS, 1920x1080, 15.6" | Lenovo Ideapad S340-15IIL i7-1065G7, Iris Plus Graphics G7 (Ice Lake 64 EU), Intel SSD 660p SSDPEKNW512G8, IPS, 1920x1080, 15.6" | Acer Aspire 5 A515-43-R6WW R5 3500U, Vega 8, Intel SSD 660p 1TB SSDPEKNW010T8, IPS, 1920x1080, 15.6" | Dell Inspiron 15 3585 (2300U, Vega 6) R3 2300U, Vega 6, Toshiba BG3 KBG30ZMS256G, TN, 1920x1080, 15.6" | Asus ZenBook 15 UX534FTC-A8190T i7-10510U, GeForce GTX 1650 Max-Q, Samsung SSD PM981 MZVLB1T0HALR, IPS, 1920x1080, 15.6" | Huawei MateBook D 15-53010TUY R5 3500U, Vega 8, Samsung SSD PM981 MZVLB256HAHQ, IPS, 1920x1080, 15.6" | |
|---|---|---|---|---|---|---|
| Power Consumption | -19% | -3% | -37% | -65% | -33% | |
| Idle Minimum * (Watt) | 3.2 | 3.8 -19% | 3.7 -16% | 6.3 -97% | 2.8 13% | 5.2 -63% |
| Idle Average * (Watt) | 6.8 | 6.9 -1% | 6.2 9% | 9.2 -35% | 7.7 -13% | 8.8 -29% |
| Idle Maximum * (Watt) | 7.7 | 7.7 -0% | 8.4 -9% | 9.6 -25% | 9.4 -22% | 10.2 -32% |
| Load Average * (Watt) | 30.3 | 43.3 -43% | 31.1 -3% | 38 -25% | 57 -88% | 37.5 -24% |
| Witcher 3 ultra * (Watt) | 28.2 | 40.4 -43% | 62 -120% | |||
| Load Maximum * (Watt) | 44.4 | 47.5 -7% | 43.1 3% | 46 -4% | 116 -161% | 50.9 -15% |
* ... daha küçük daha iyidir
Pil ömrü
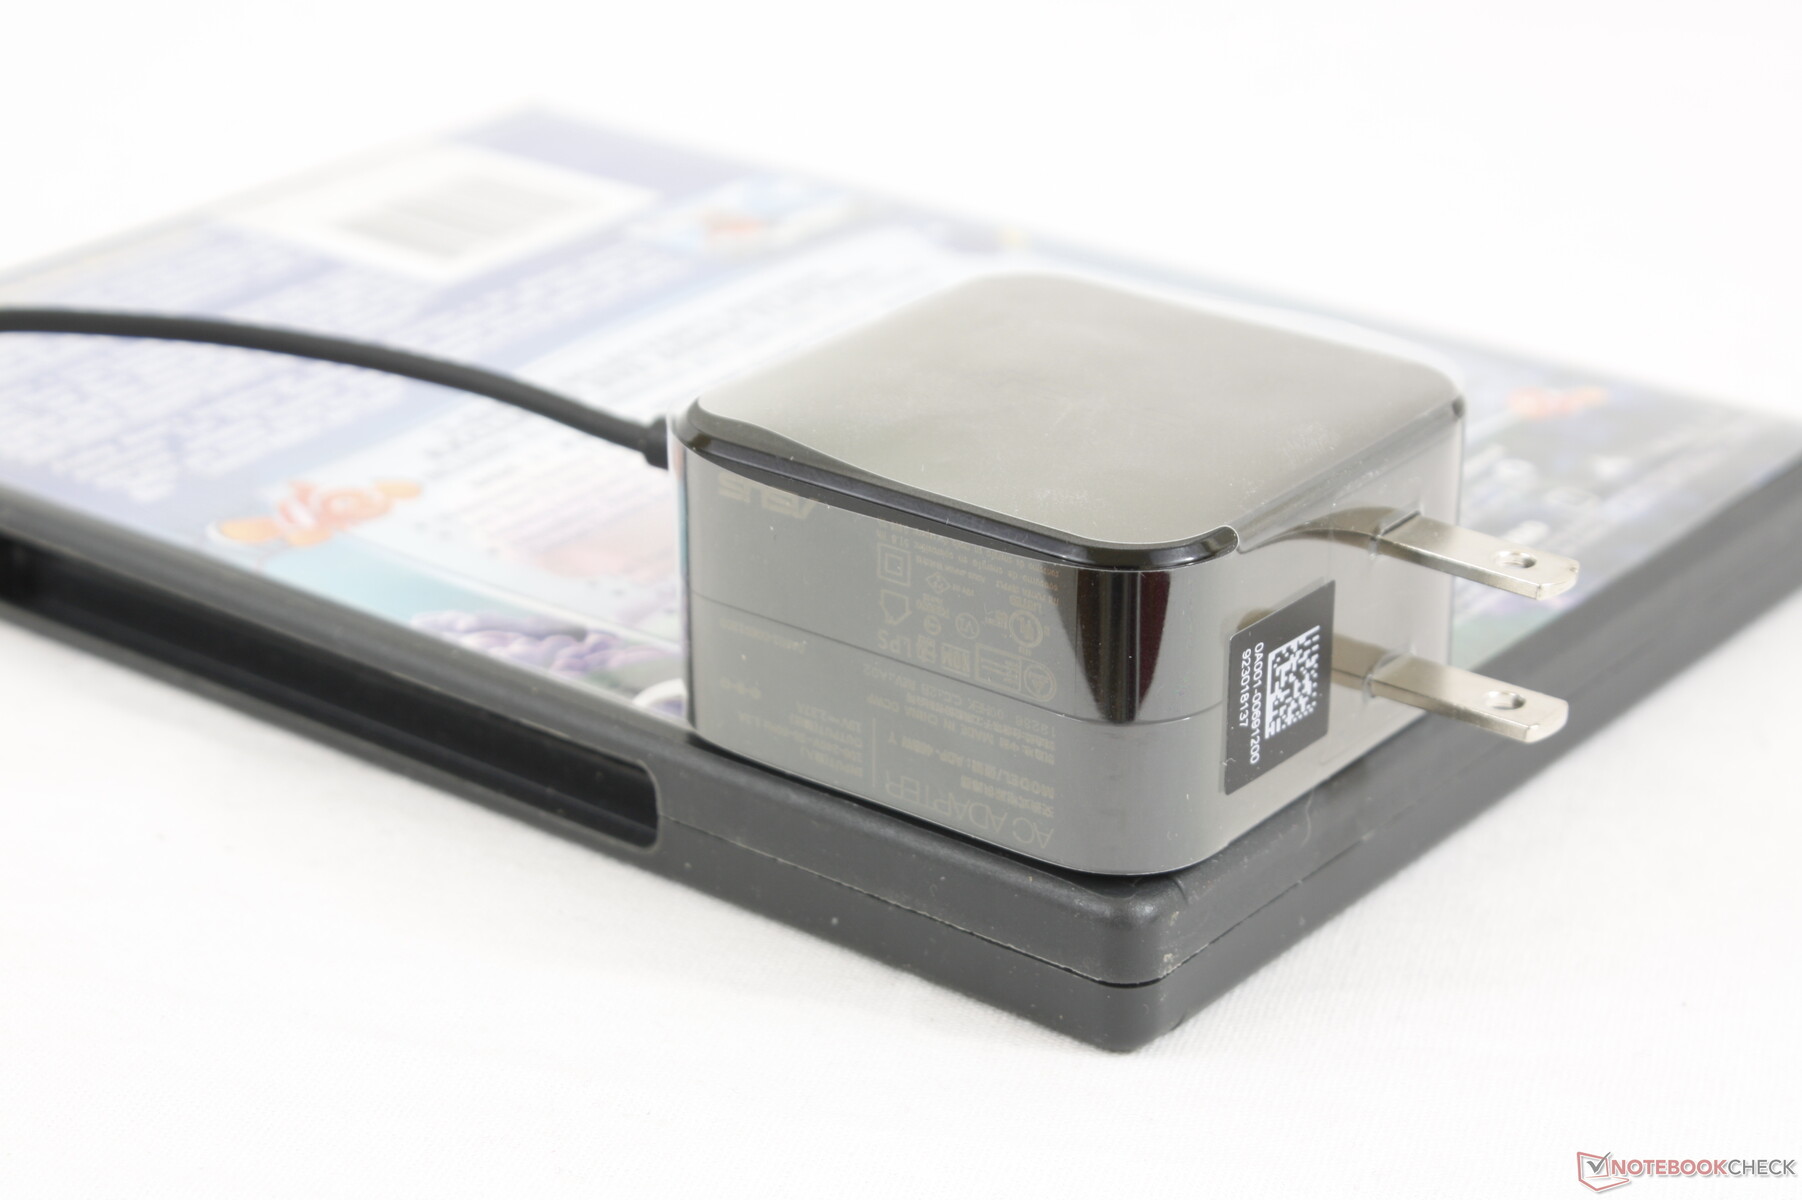
Küçük dahili pil bütçe kategorisi için ortaktır, ancak XPS 15 gibi üst düzey dizüstü bilgisayarlar 90 Wh'ın üzerindeki pilleri taşıyabilir. Bununla birlikte, pil ömrü Asus'umuzda 6 saatin altında gerçek dünya WLAN kullanımı ile iyi. Boştan tam kapasiteye şarj etmek yaklaşık 1.5 saat sürüyor. Sistem USB Type-C ile şarj edilemez.
| Asus Vivobook 15 F512DA-SH31 R3 3200U, Vega 3, 37 Wh | Lenovo Ideapad S340-15IIL i7-1065G7, Iris Plus Graphics G7 (Ice Lake 64 EU), 36 Wh | Acer Aspire 5 A515-43-R6WW R5 3500U, Vega 8, 48 Wh | Dell Inspiron 15 3585 (2300U, Vega 6) R3 2300U, Vega 6, 42 Wh | Asus ZenBook 15 UX534FTC-A8190T i7-10510U, GeForce GTX 1650 Max-Q, 71 Wh | Huawei MateBook D 15-53010TUY R5 3500U, Vega 8, 42 Wh | |
|---|---|---|---|---|---|---|
| Pil Çalışma Süresi | -28% | 30% | -12% | 107% | 30% | |
| WiFi v1.3 (h) | 6 | 4.3 -28% | 7.8 30% | 5.3 -12% | 12.4 107% | 7.8 30% |
| Reader / Idle (h) | 10 | 17.7 | 7.3 | 27.2 | ||
| Load (h) | 1.1 | 2.2 | 1.8 | 2.4 | 1.3 |
Artılar
Eksiler
Karar
Ryzen 3 yapılandırmamız, Intel Core i3 yapılandırmasından daha az bir fiyata satılırken, süreçte esasen aynı performansı sunar. Bu, AMD'nin bütçe alanında bile Intel'e karşı dolar başına üstün performansının iyi bir örneğidir. Dezavantajları sınırlı 4 GB RAM ve düşük depolama alanı içerir, ancak bu VivoBook'un sisteme hem daha uzun bacaklara hem de düşük bir giriş engeline sahip olması şaşırtıcı derecede kolay servis ve yükseltme işlemidir. Yaklaşık 200 $ daha fazla harcama yapmak istiyorsanız, öneririz özellikle dizüstü bilgisayarla çok seyahat etmeyi planlıyorsanız AMD destekli Huawei MateBook D 15'i kontrol edin. VivoBook'un loş ekranı, çoğu dış mekan koşulunda kullanılmasını zorlaştırır. Ofis işleriniz ve video akışlarınız çoğunlukla iç mekandaysa, temel VivoBook işi yapabilir. Test birimimizde sorunlar yaşadığımız için kablosuz cihazınızın sorunsuz çalıştığından emin olun.
Asus Vivobook 15 F512DA-SH31
- 04/20/2020 v7 (old)
Allen Ngo
Price comparison

