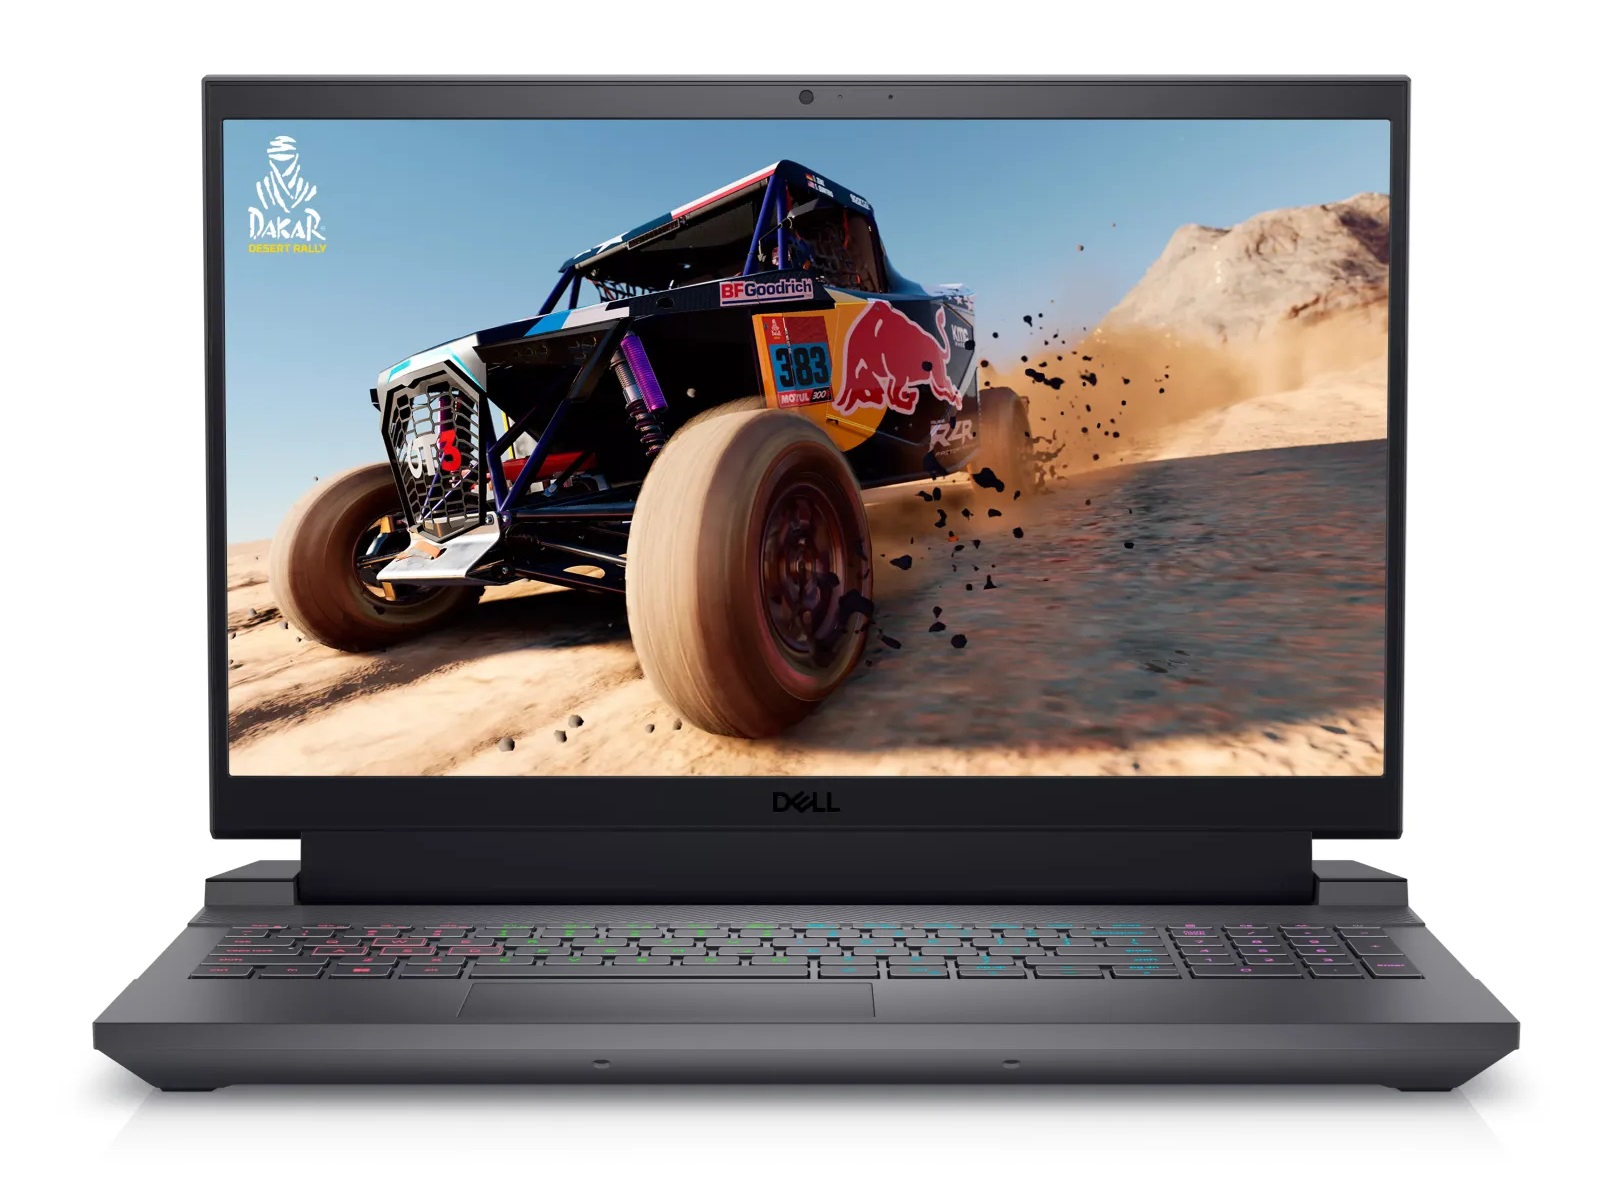
Dell G15 5530 incelemesi: Koyu Gölge Grisi RTX 4050 dizüstü oyun bilgisayarı

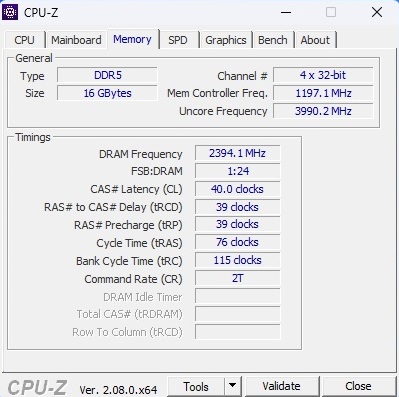
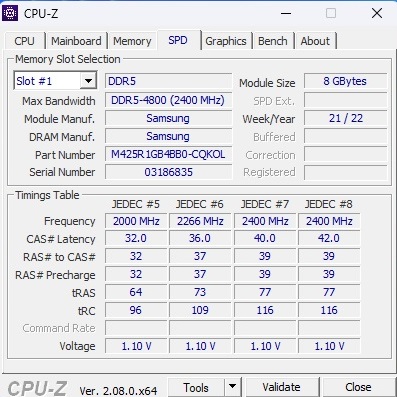
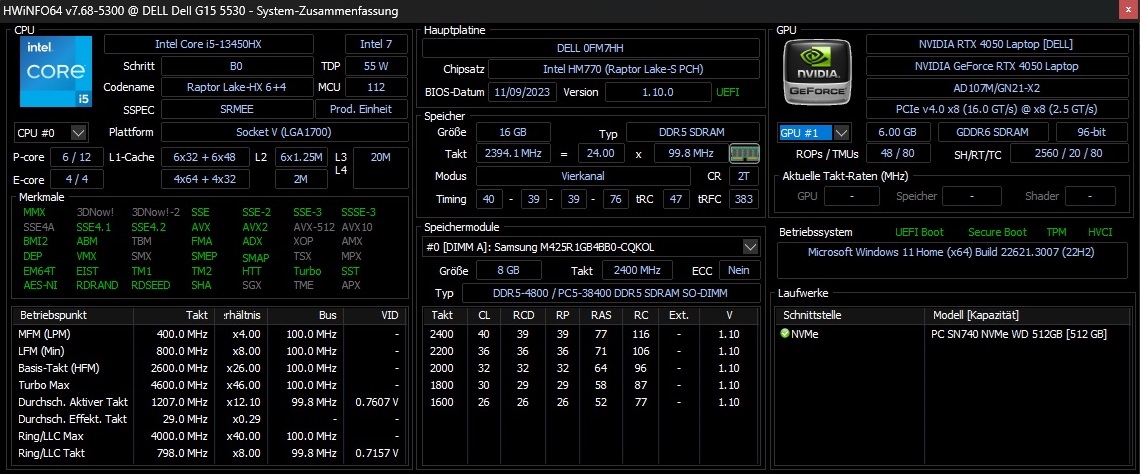
G15'i bir Core i7-13650HX ve GeForce RTX 4060 birkaç ay önce (bkz makale), şimdi daha düşük maliyetli versiyonu (birkaç yüz avro ile) bir Core i5-13450HX und GeForce RTX 4050. Bu varyant benzer şekilde 16 GB DDR-4800 RAM, 512 GB sürücü ve 165Hz IPS ekran ile donatılmıştır, ancak bu bileşenler için zaman zaman farklı modeller kullanılmaktadır. Paketi tamamlayan ise Windows 11 Home 64 Bit işletim sistemi.
G15, RTX 4050 tabanlı 15 inçlik diğer oyun dizüstü bilgisayarlarına karşı Medion Erazer Crawler E40, the Lenovo LOQ 15IRH8 ve Asus TUF A15 FA507bunların hepsi karşılaştırma amacıyla aşağıdaki tablolarda gösterilmiştir.
Şasi aşağıdakilerle aynı olduğu için G15 daha önce renk düzeni (beyaz yerine gri) ve klavye dili dışında inceledik, bu makalede sadece kasayı, özellikleri ve giriş cihazlarını kısaca ele alacağız.
Karşılaştırmalı olarak olası rakipler
Derecelendirme | Tarih | Modeli | Ağırlık | Yükseklik | Boyut | Çözünürlük | Fiyat |
|---|---|---|---|---|---|---|---|
| 84.7 % v7 (old) | 01/2024 | Dell G15 5530, i5-13450HX RTX 4050 i5-13450HX, GeForce RTX 4050 Laptop GPU | 2.7 kg | 27 mm | 15.60" | 1920x1080 | |
| 85.4 % v7 (old) | 12/2023 | Medion Erazer Crawler E40 - MD 62518 i5-13500H, GeForce RTX 4050 Laptop GPU | 2.3 kg | 28 mm | 15.60" | 1920x1080 | |
| 85.9 % v7 (old) | 10/2023 | Lenovo LOQ 15IRH8 Core i7 i7-13620H, GeForce RTX 4050 Laptop GPU | 2.4 kg | 25.2 mm | 15.60" | 2560x1440 | |
| 86.3 % v7 (old) | Asus TUF A15 FA507 R7 7735HS, GeForce RTX 4050 Laptop GPU | 2.2 kg | 24.9 mm | 15.60" | 1920x1080 | ||
| 84.2 % v7 (old) | 07/2023 | Dell G15 5530 i7-13650HX, GeForce RTX 4060 Laptop GPU | 3 kg | 26.95 mm | 15.60" | 1920x1080 |
Dava
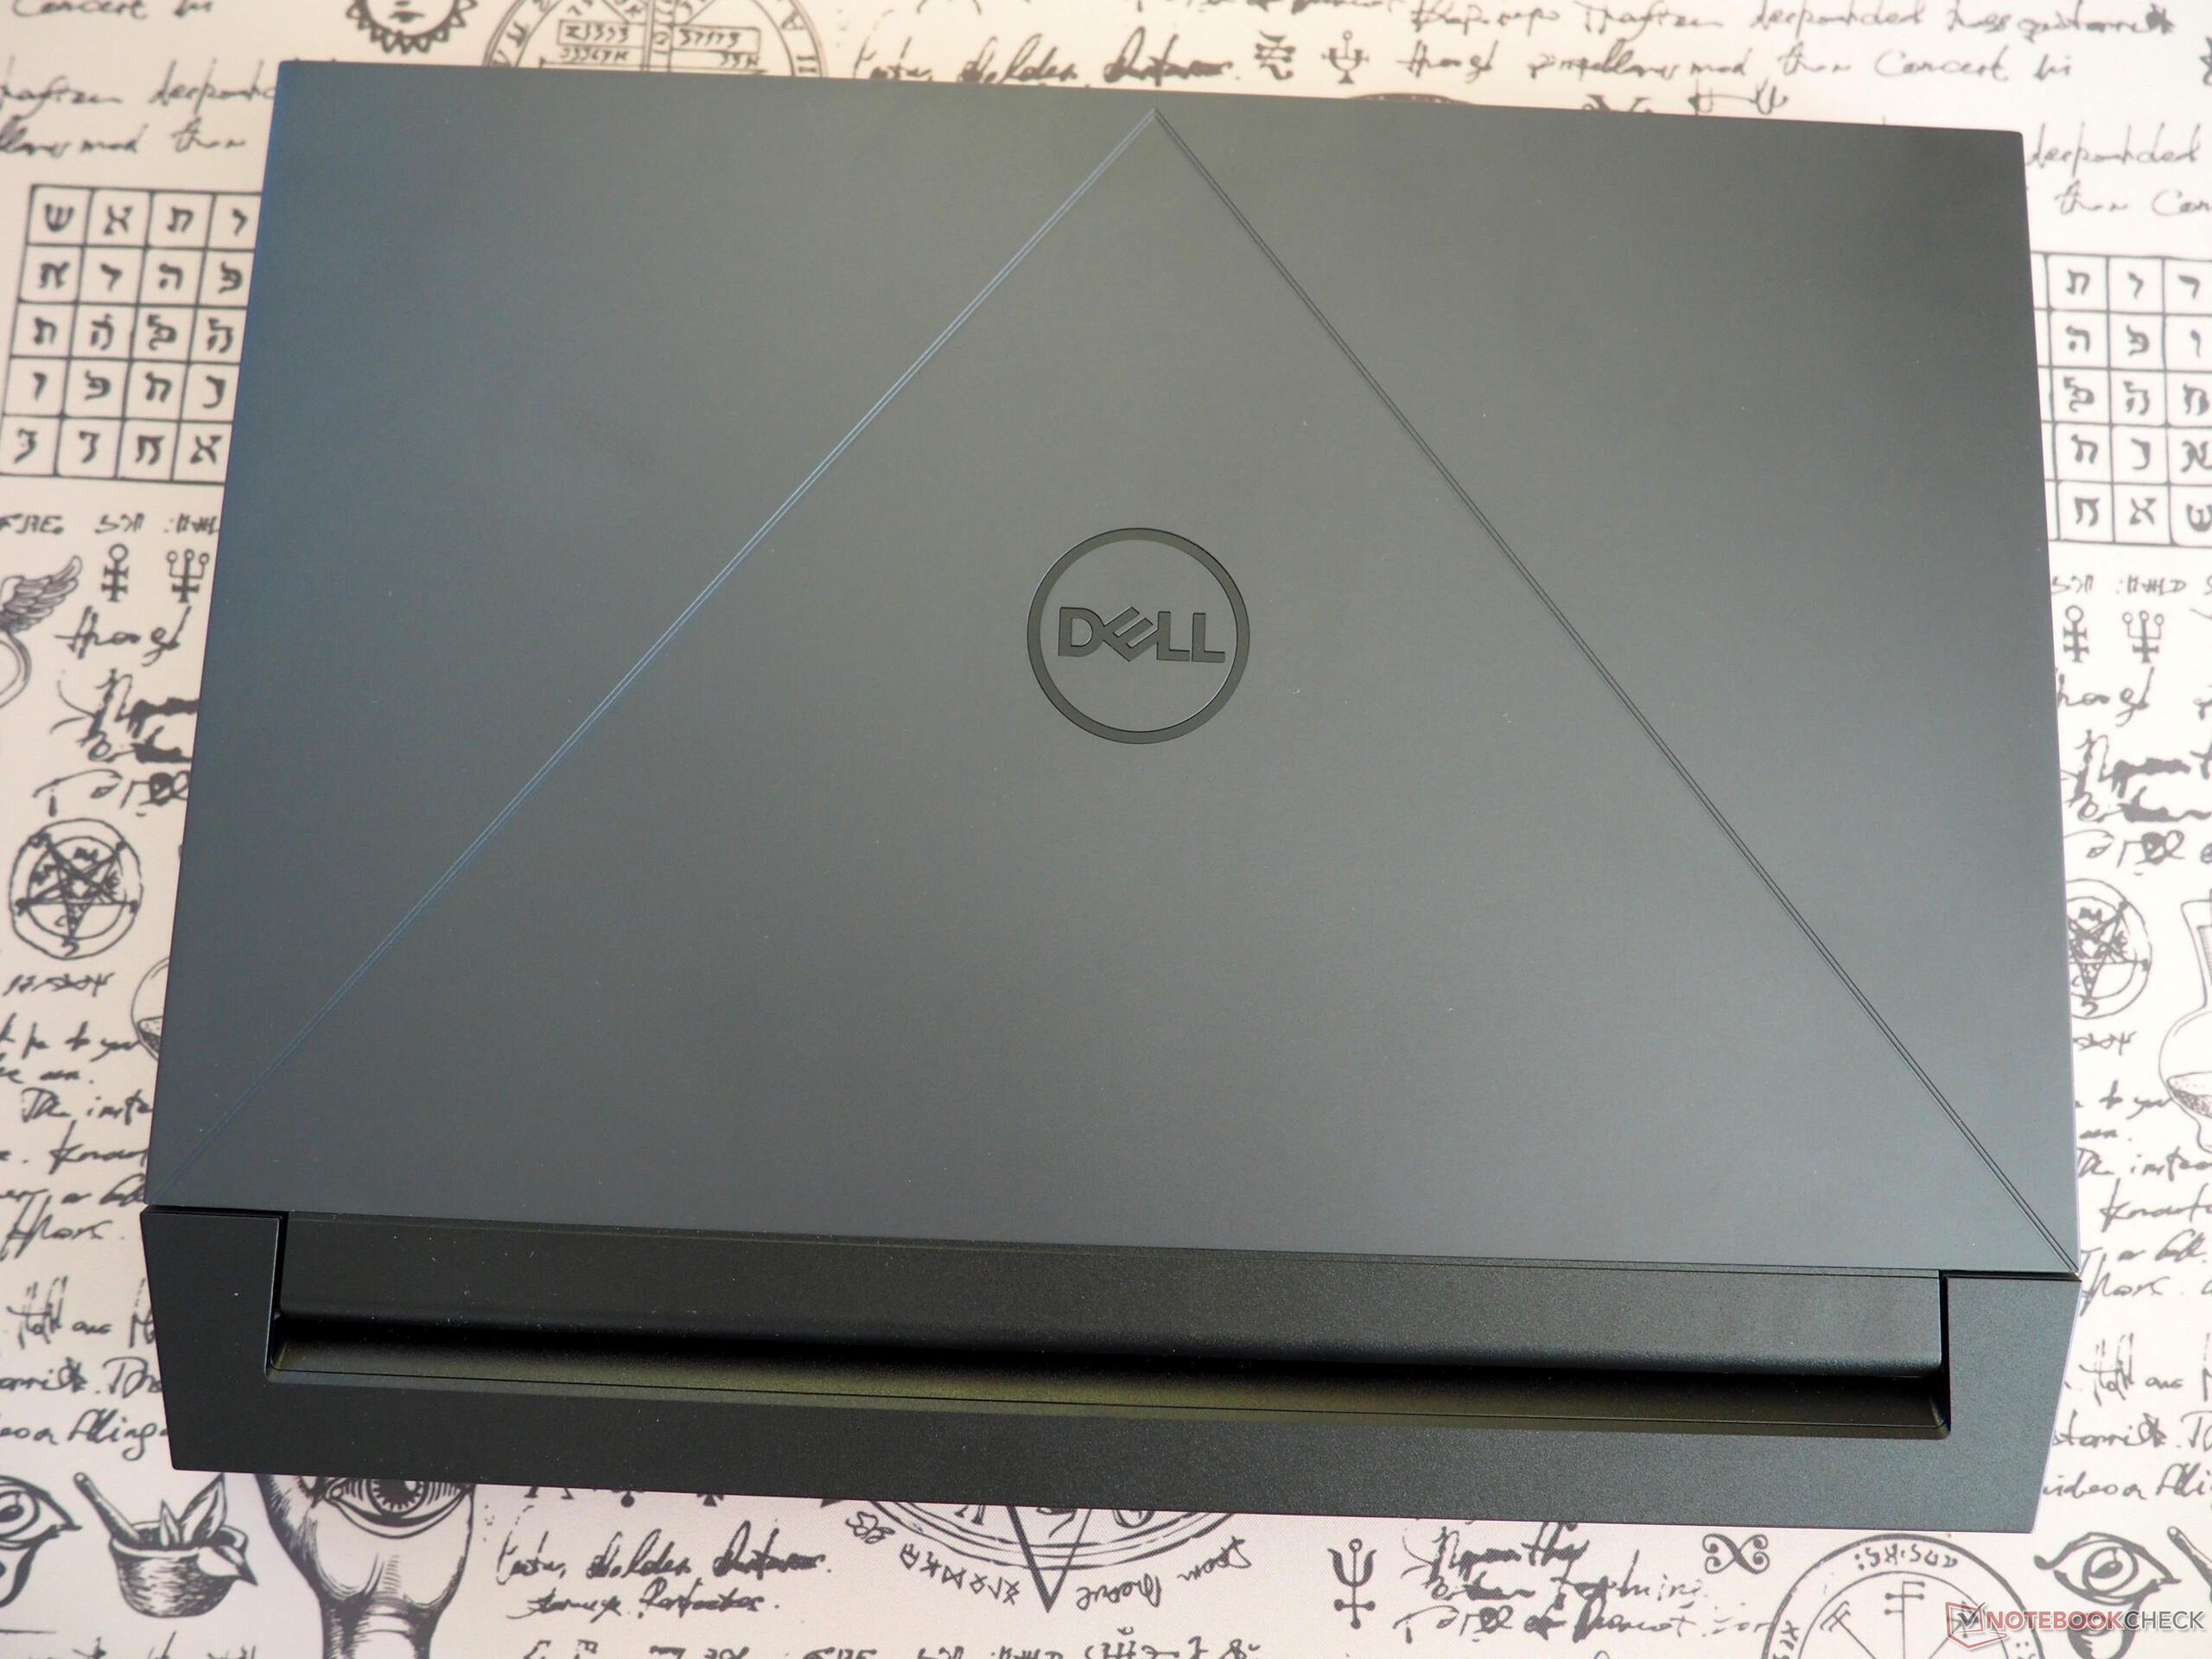
G15 klasik yapıya sahip bir dizüstü bilgisayar, yani ne çok ince (2,7 cm veya 1,06 inç) ne de özellikle hafif (2,7 kg veya 5,95 lb). Rakipleri daha modern tasarımlar sunuyor, ancak bu her zaman iyi bir şey olmak zorunda değil (anahtar kelime: emisyonlar). Estetik açıdan dizüstü bilgisayarın tasarımı özellikle dikkat çekicidir, ancak bu fiyat aralığındaki diğer birçok üreticinin yaptığı gibi Dell, bazı noktalarda takırdama eğilimi olan tamamen plastik bir dış yüzey tercih etmiştir. Buna karşın uyum ve bitiş kalitesi iyi. Menteşe mekanizması iyi bir iş çıkarıyor; dizüstü bilgisayar tek elle kolayca açılabiliyor.

Teknik Özellikler
Arayüzler
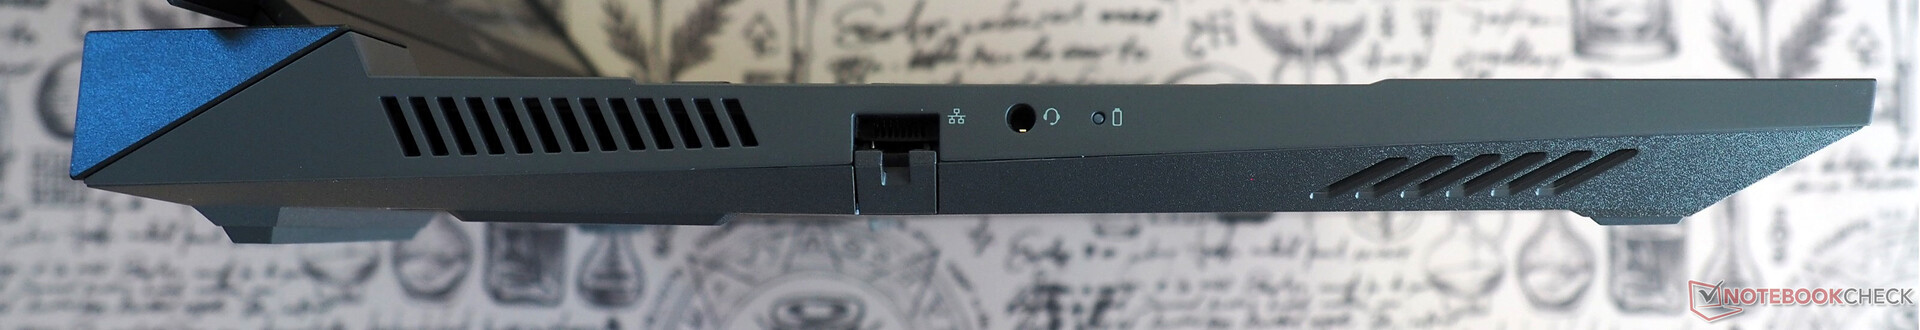
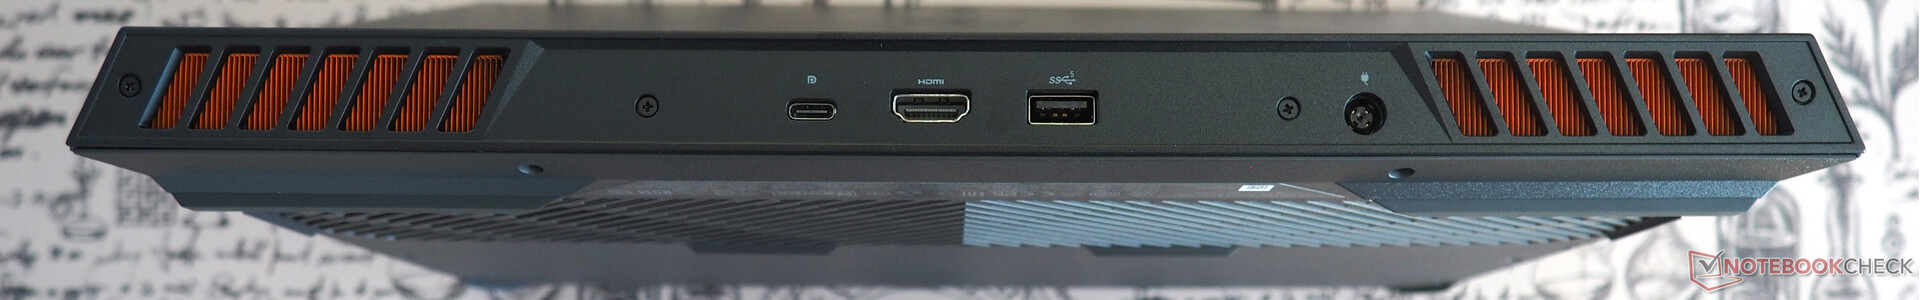
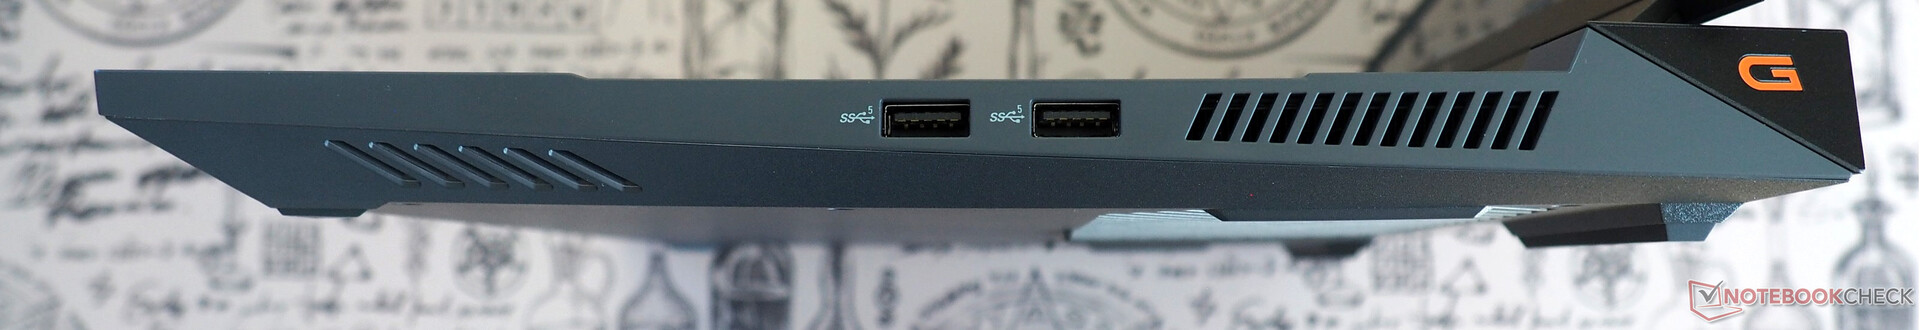
Port seçimi oldukça eski ve seyrek. Örneğin, cihaz üzerinde tek bir USB4 portu bulamazsınız. Bunun yerine, yalnızca bir USB. 3.2 Gen 2 (Tip C) ve üç USB 3.2 Gen 1 (Tip A) bağlantı noktasıyla geliyor. Kullanıcılar ayrıca bir kart okuyucu ve bir Kensington yuvası olmadan da idare etmek zorunda kalacaklar. Ancak en azından cihazda bir HDMI 2.1 çıkışı, bir Ethernet portu ve bir ses jakı var.
Bağlanabilirlik
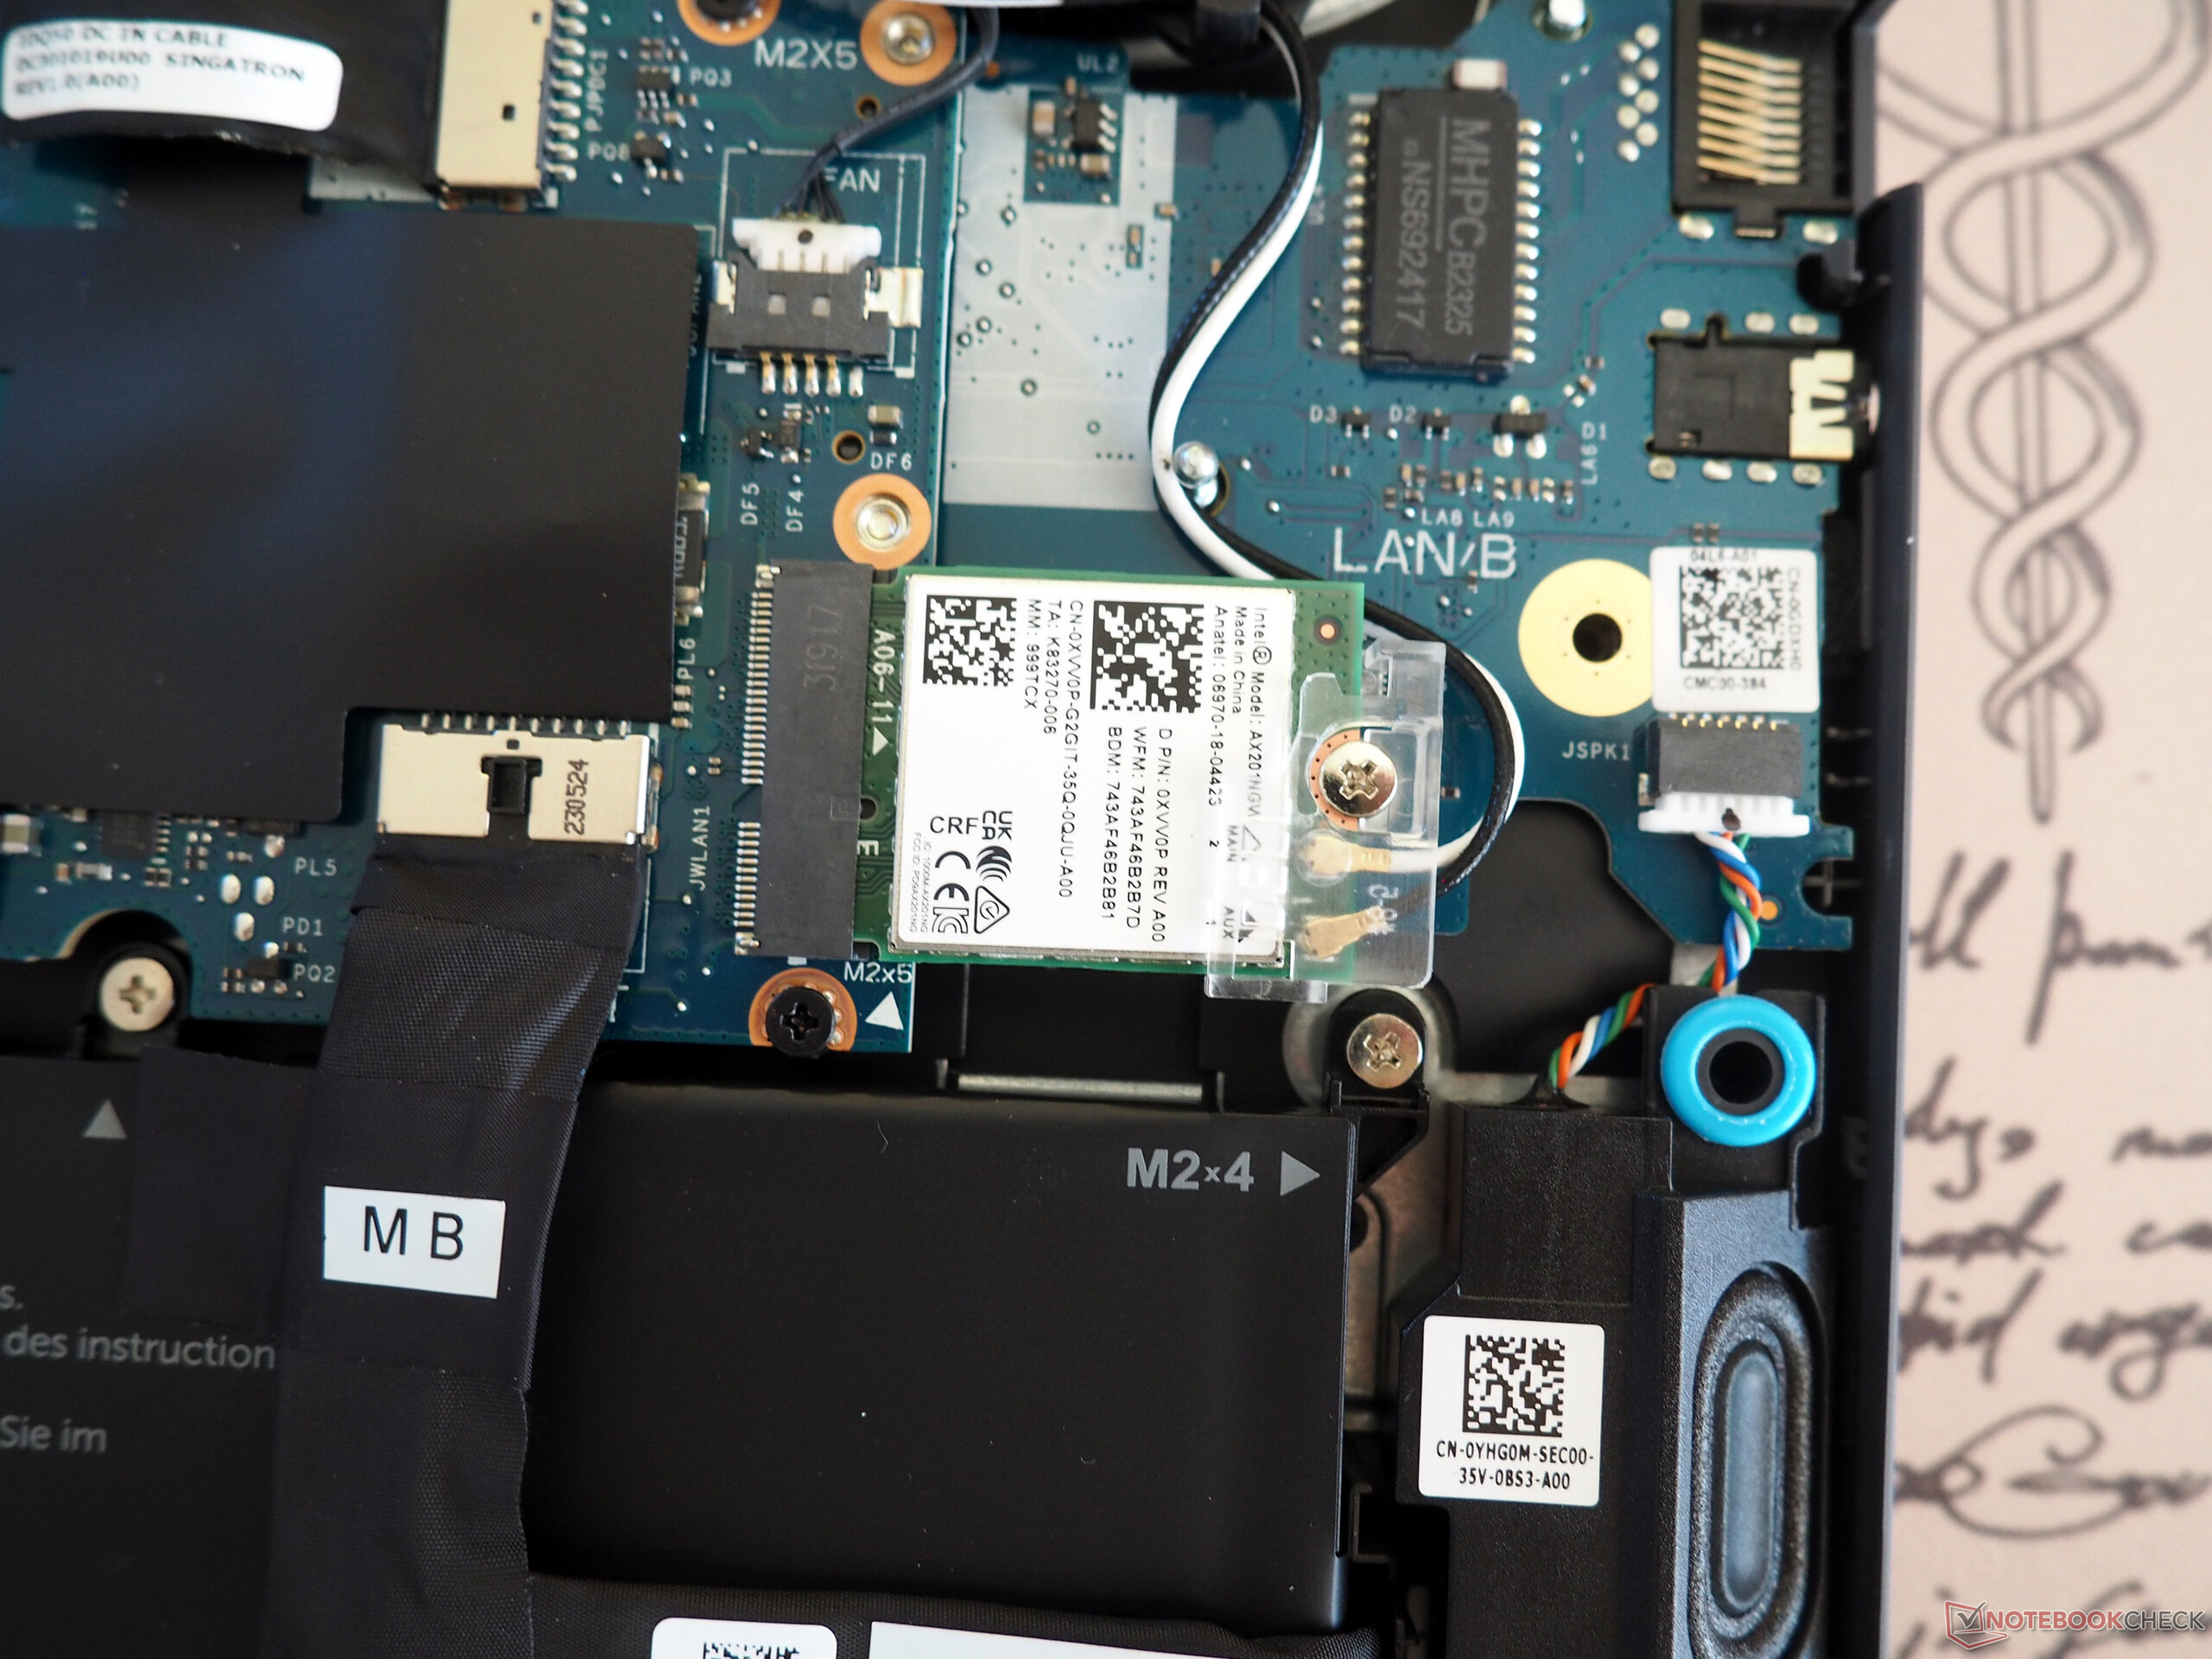
G15'in kablosuz performansı, bu sınıftaki dizüstü bilgisayarlarda şimdiye kadar gördüğümüz ortalama ile aynı seviyede (gönderme) veya daha yüksek (alma). Dahili kablosuz kart Intel tarafından üretilmiştir (Wi-Fi 6 AX201).
| Networking | |
| iperf3 transmit AXE11000 | |
| Dell G15 5530 | |
| Medion Erazer Crawler E40 - MD 62518 | |
| Ortalama Intel Wi-Fi 6 AX201 (438 - 1715, n=74) | |
| Sınıf ortalaması Gaming (560 - 1862, n=87, son 2 yıl) | |
| Dell G15 5530, i5-13450HX RTX 4050 | |
| Asus TUF A15 FA507 | |
| Lenovo LOQ 15IRH8 Core i7 | |
| iperf3 receive AXE11000 | |
| Dell G15 5530, i5-13450HX RTX 4050 | |
| Medion Erazer Crawler E40 - MD 62518 | |
| Dell G15 5530 | |
| Sınıf ortalaması Gaming (680 - 1745, n=87, son 2 yıl) | |
| Ortalama Intel Wi-Fi 6 AX201 (390 - 1734, n=79) | |
| Lenovo LOQ 15IRH8 Core i7 | |
| Asus TUF A15 FA507 | |
Web kamerası
Web kamerası kalite açısından oldukça vasat. Renk doğruluğu ve görüntü netliği söz konusu olduğunda hala iyileştirmeye ihtiyaç var.


Aksesuarlar
Sunulan performans seviyesi göz önüne alındığında, G15 saçma derecede büyük ve ağır bir güç adaptörüyle birlikte gönderilir (kablo dahil 1,5 kg veya 3,3 lb).
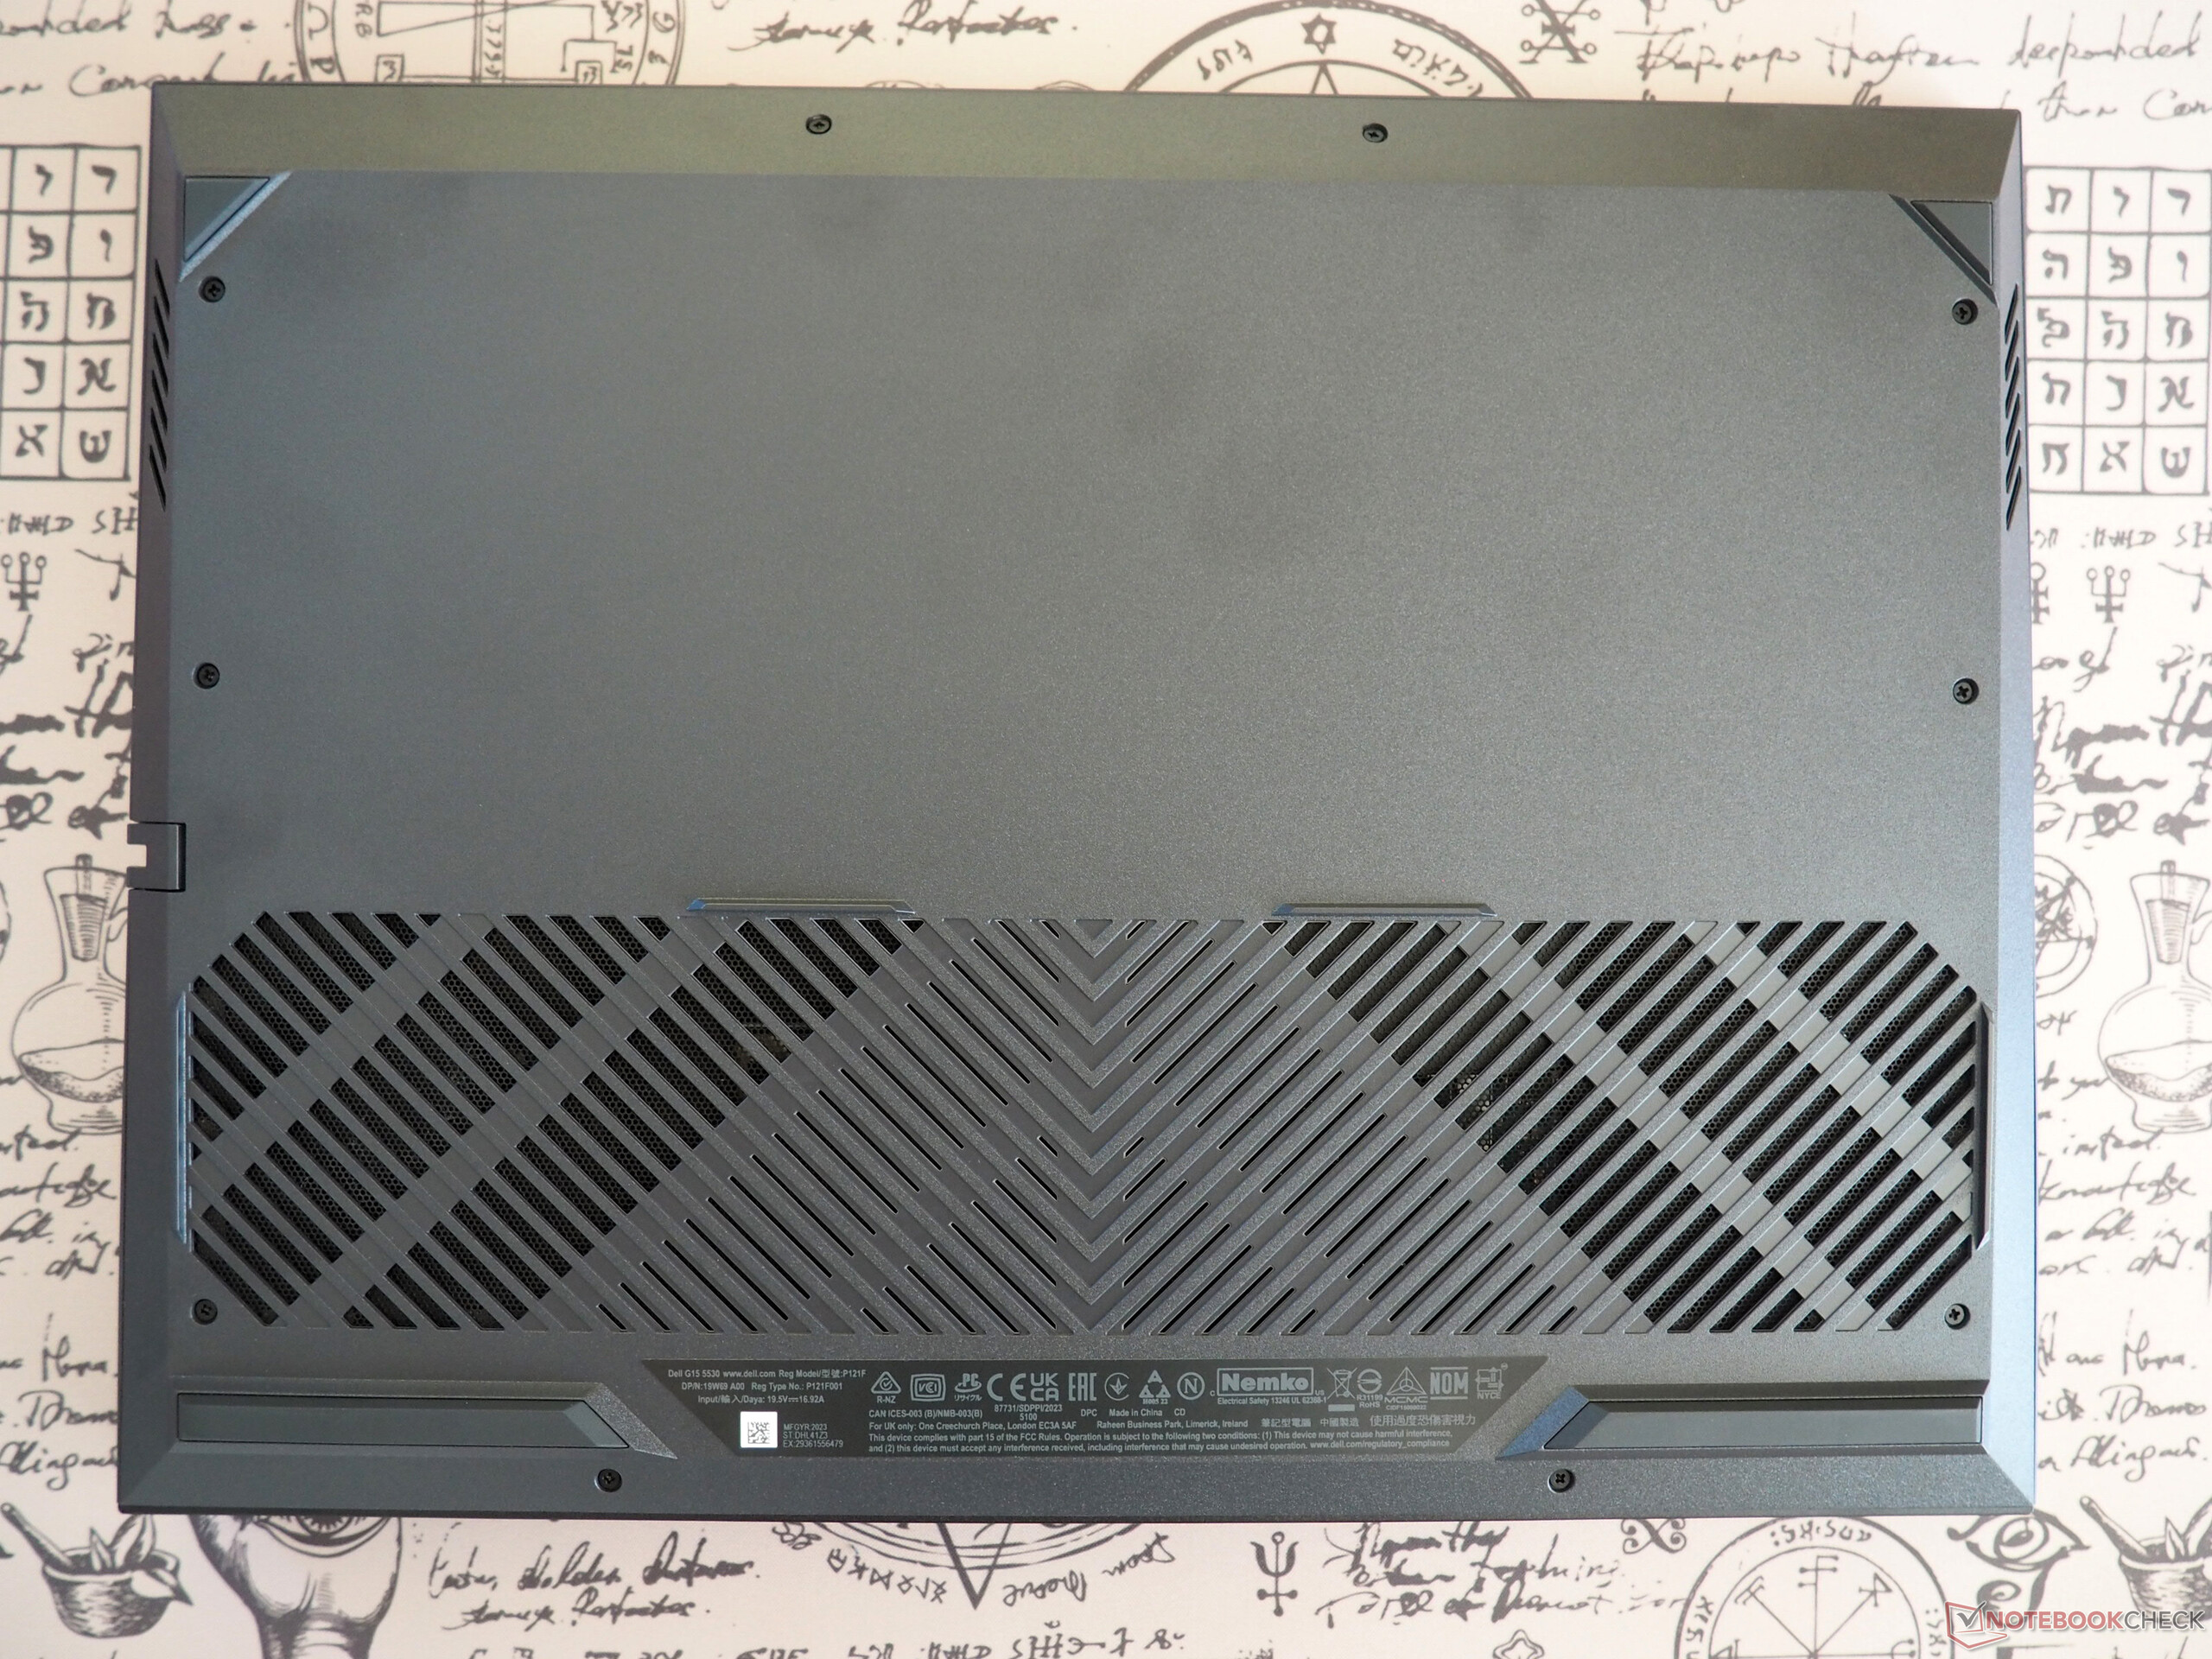
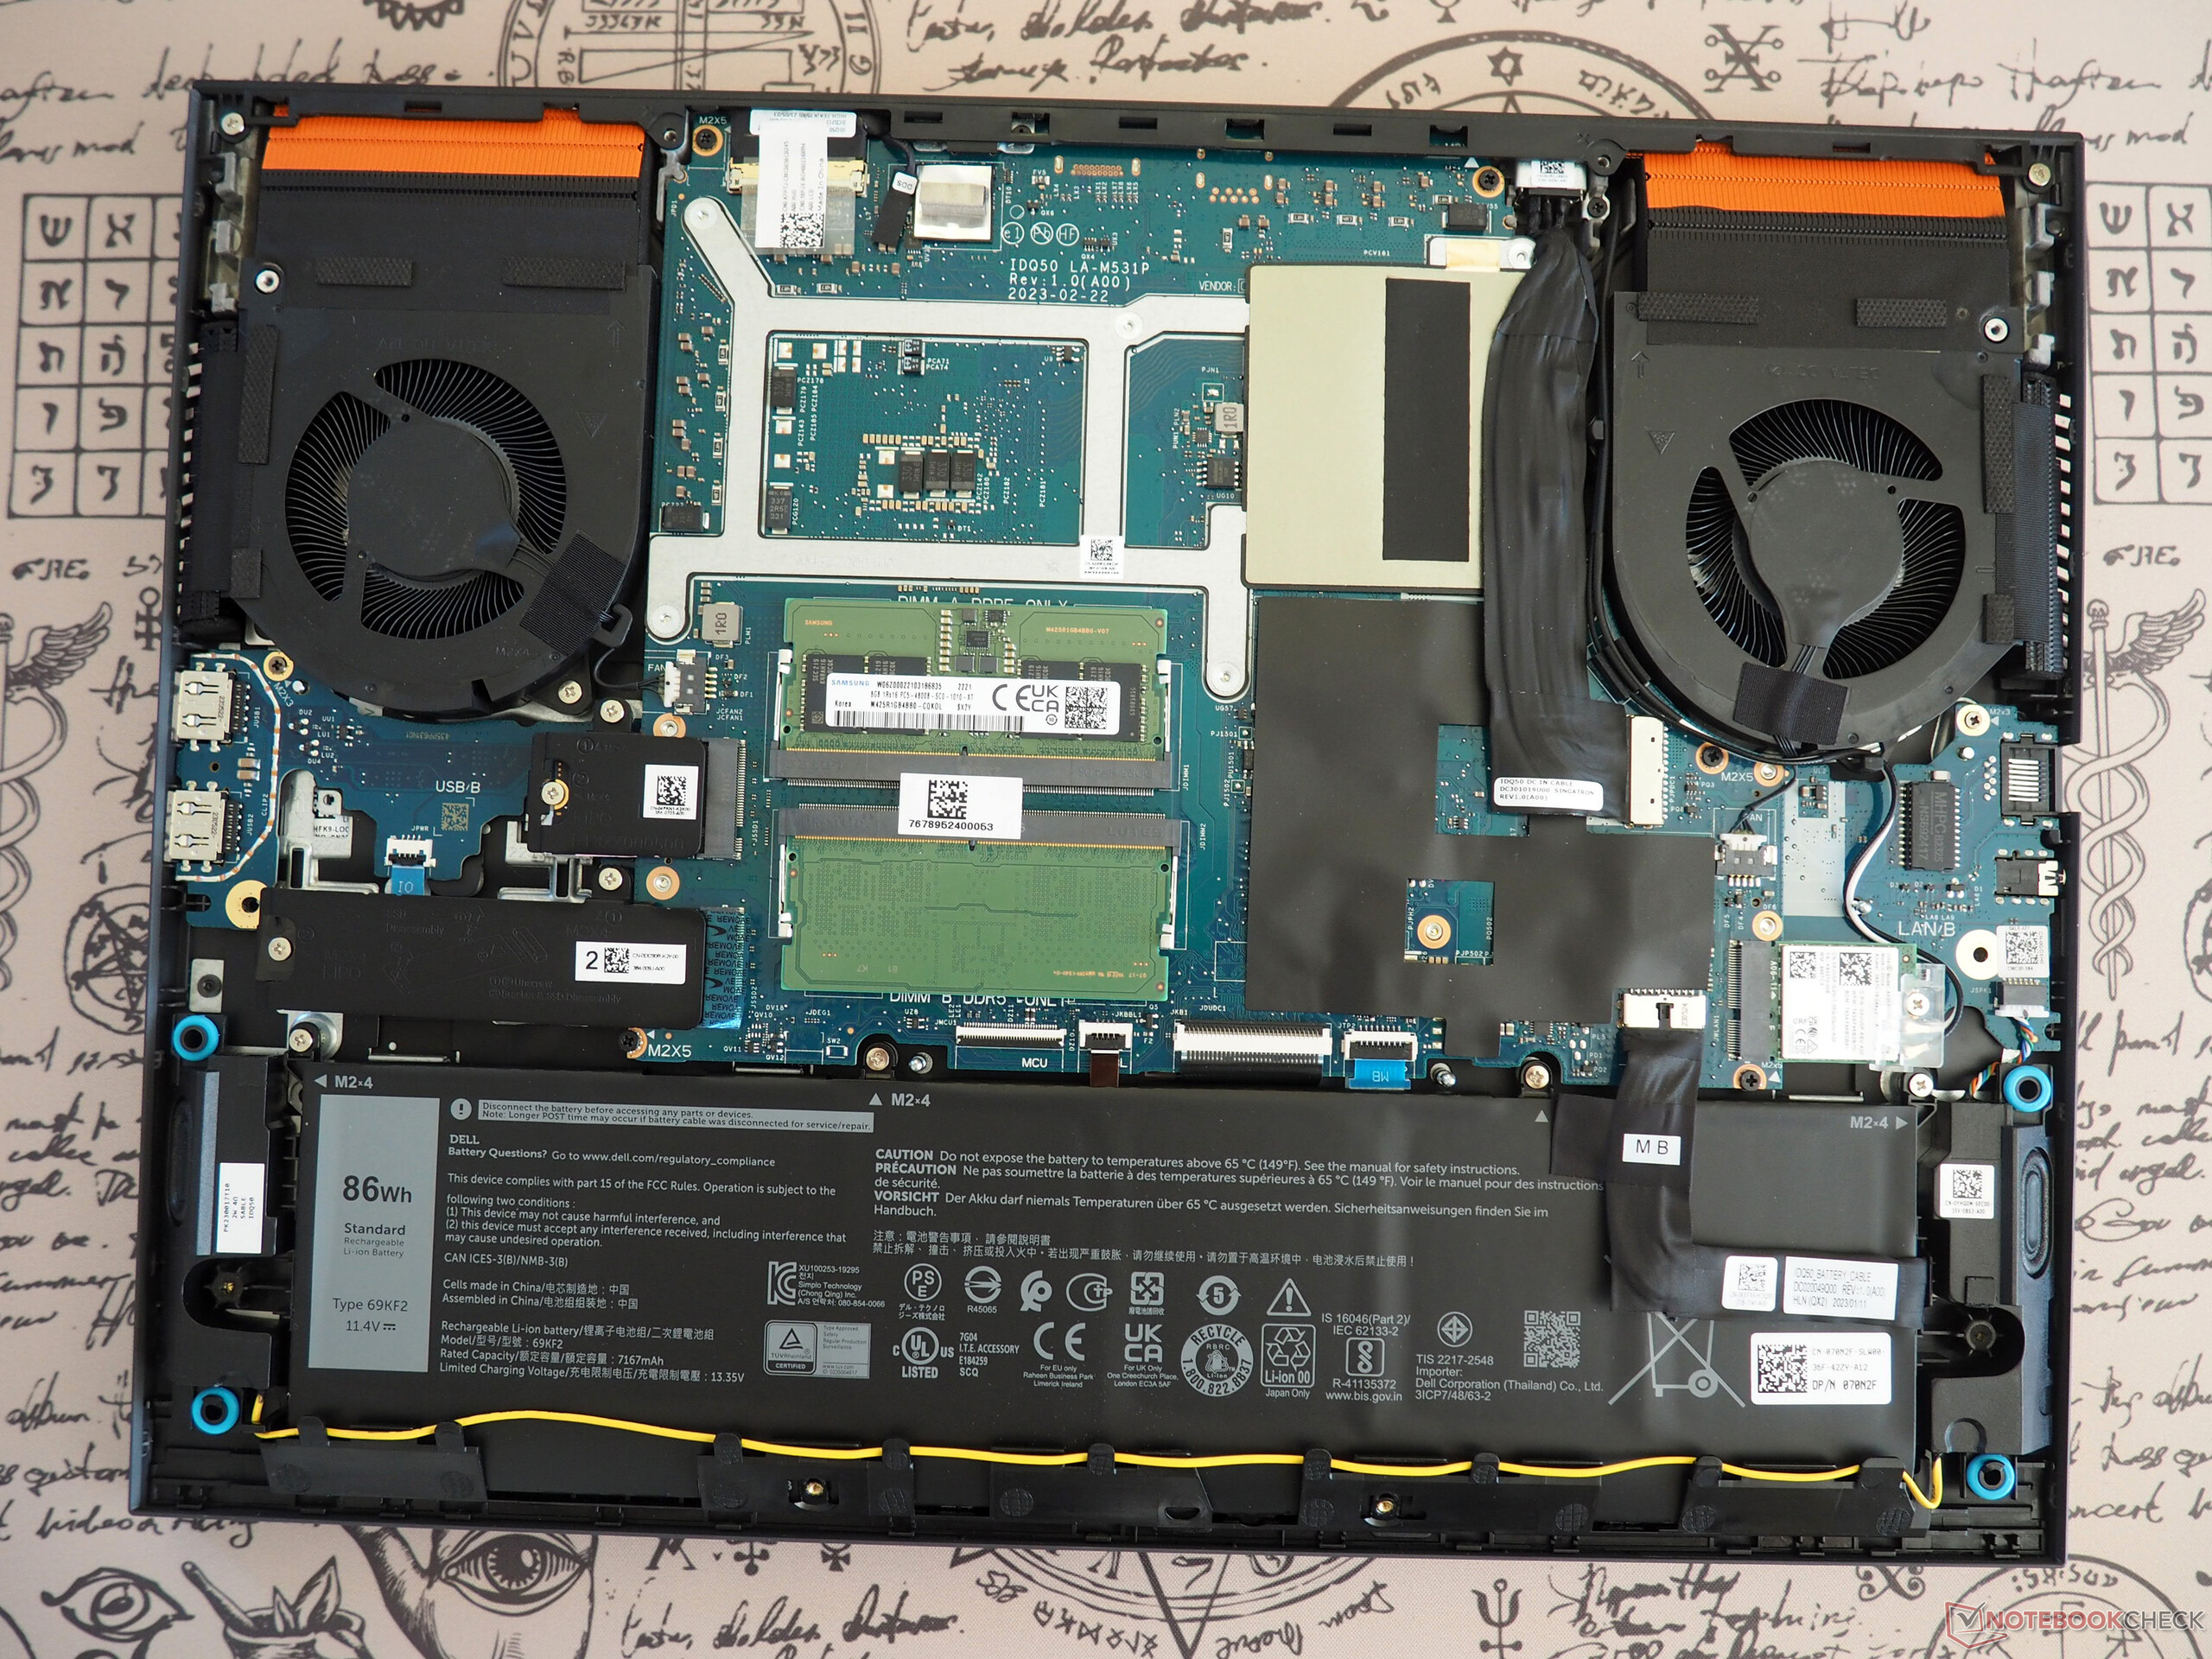
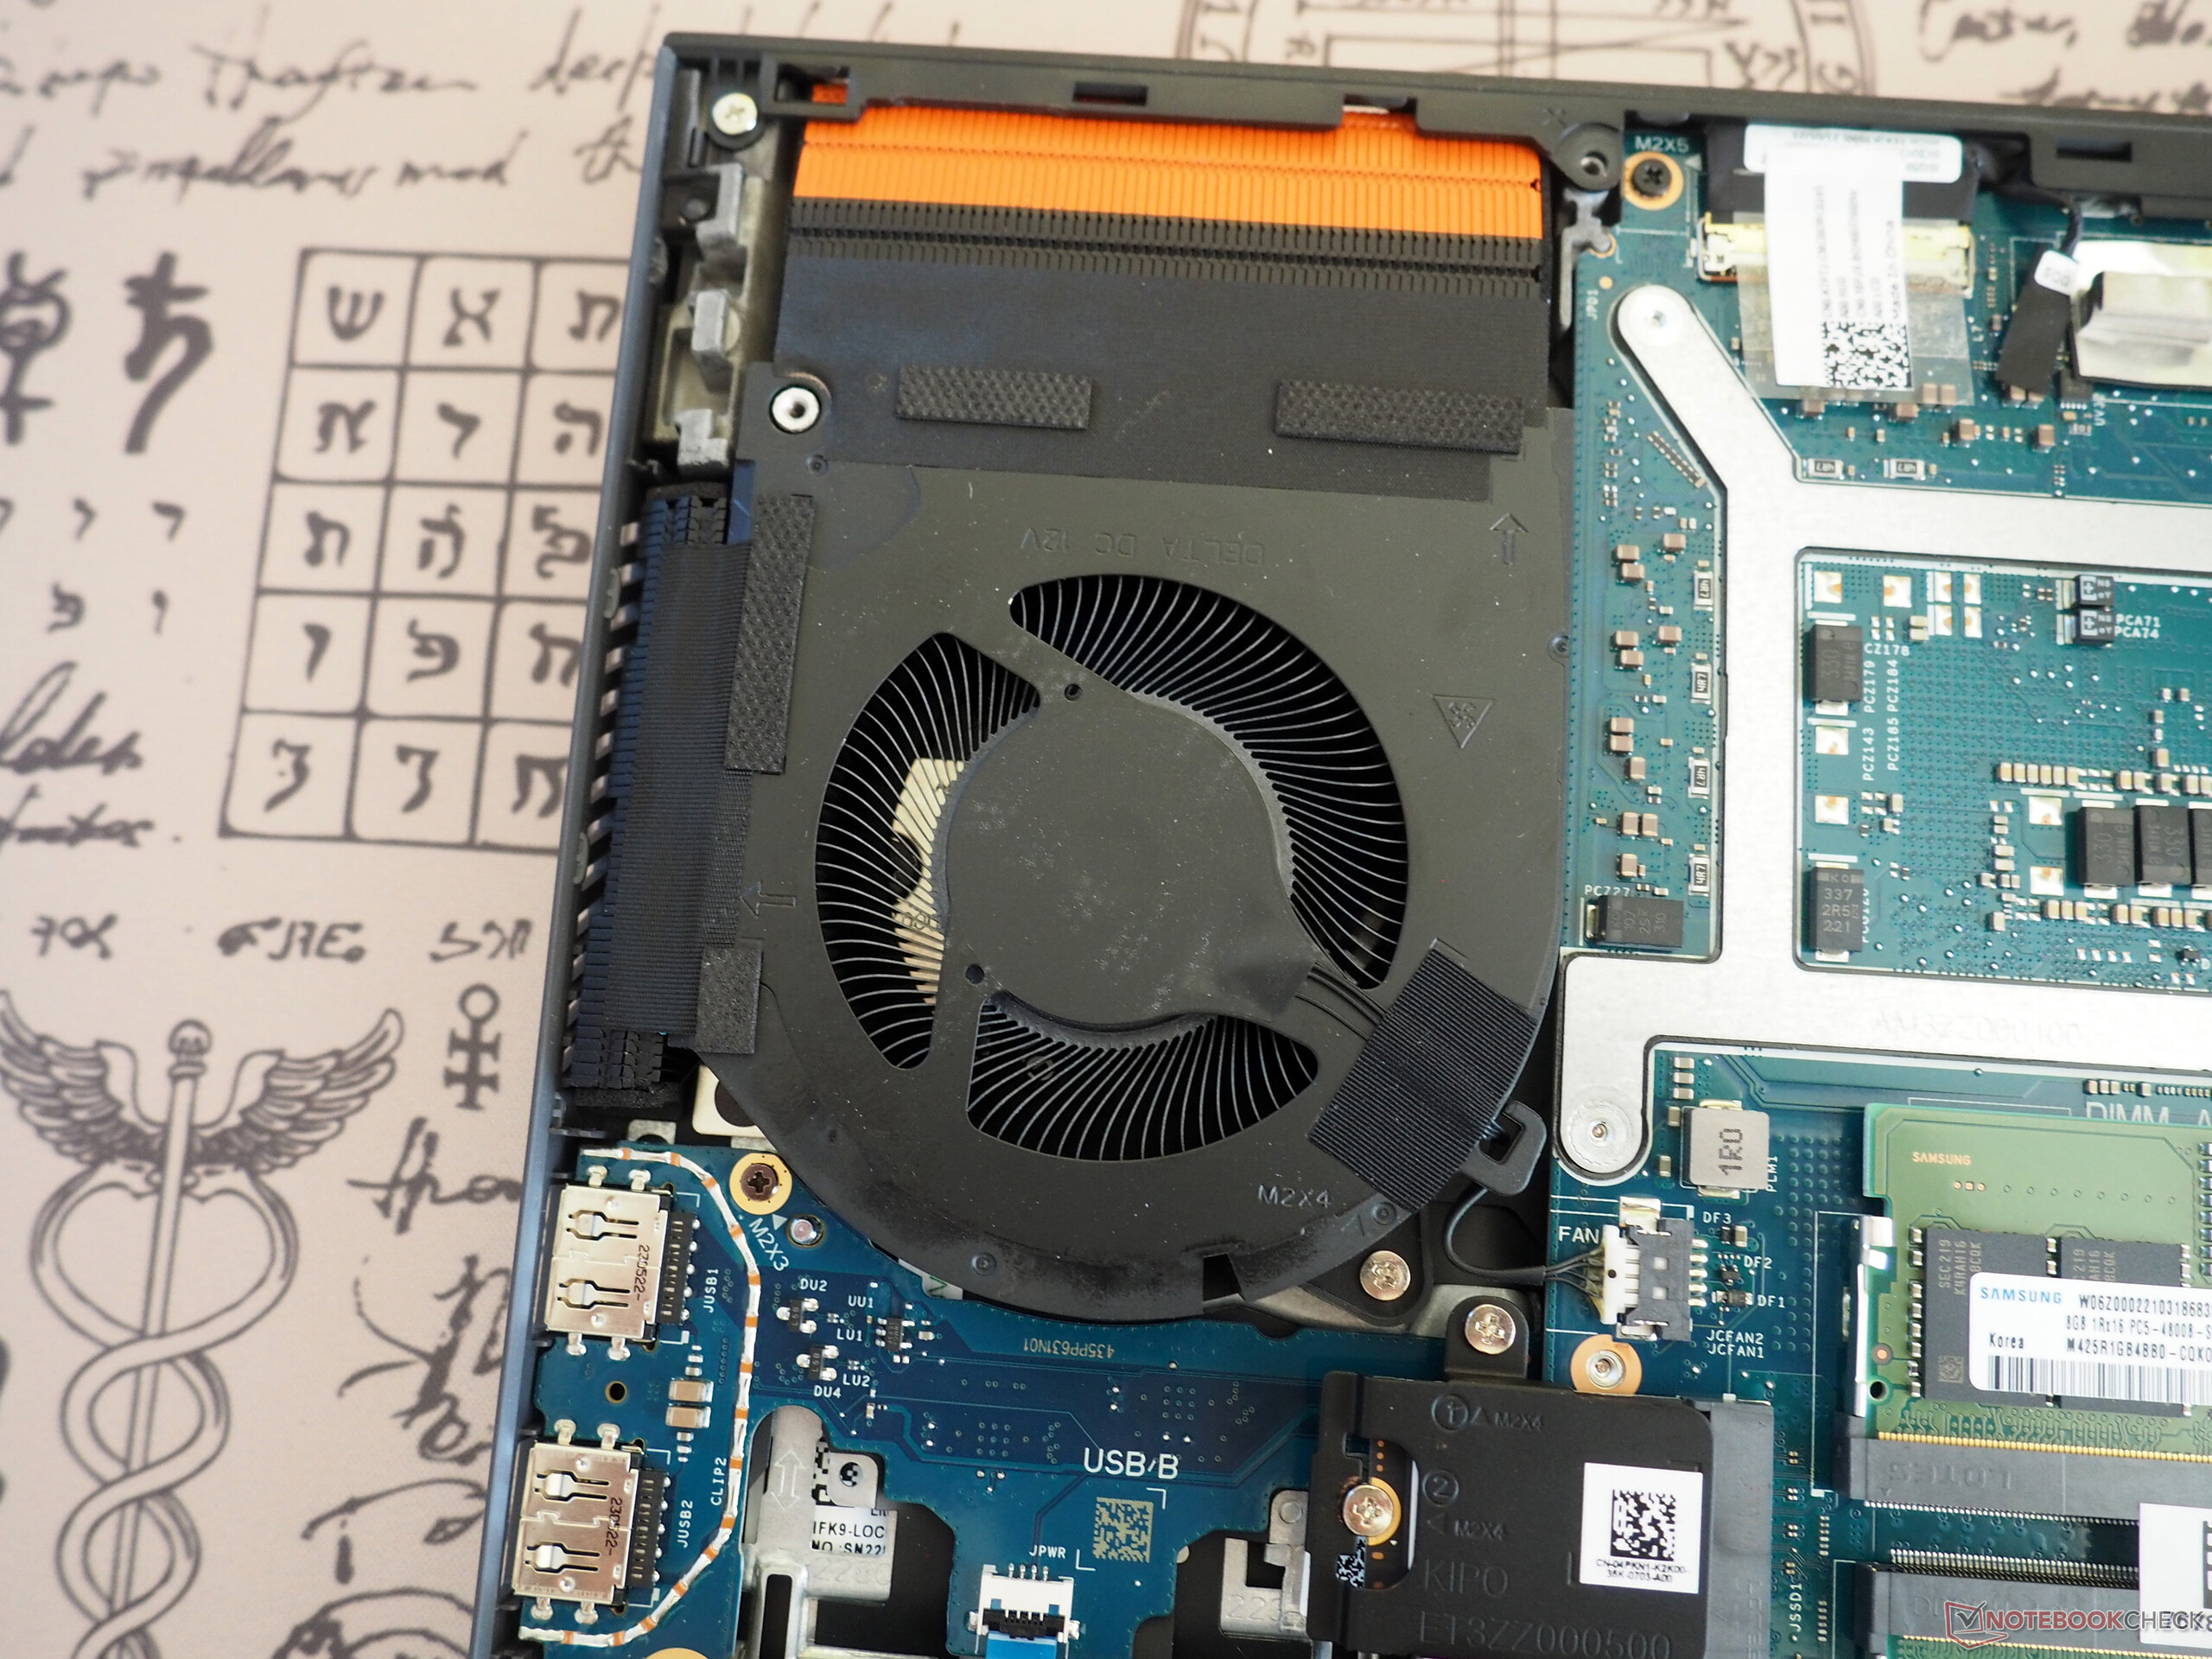
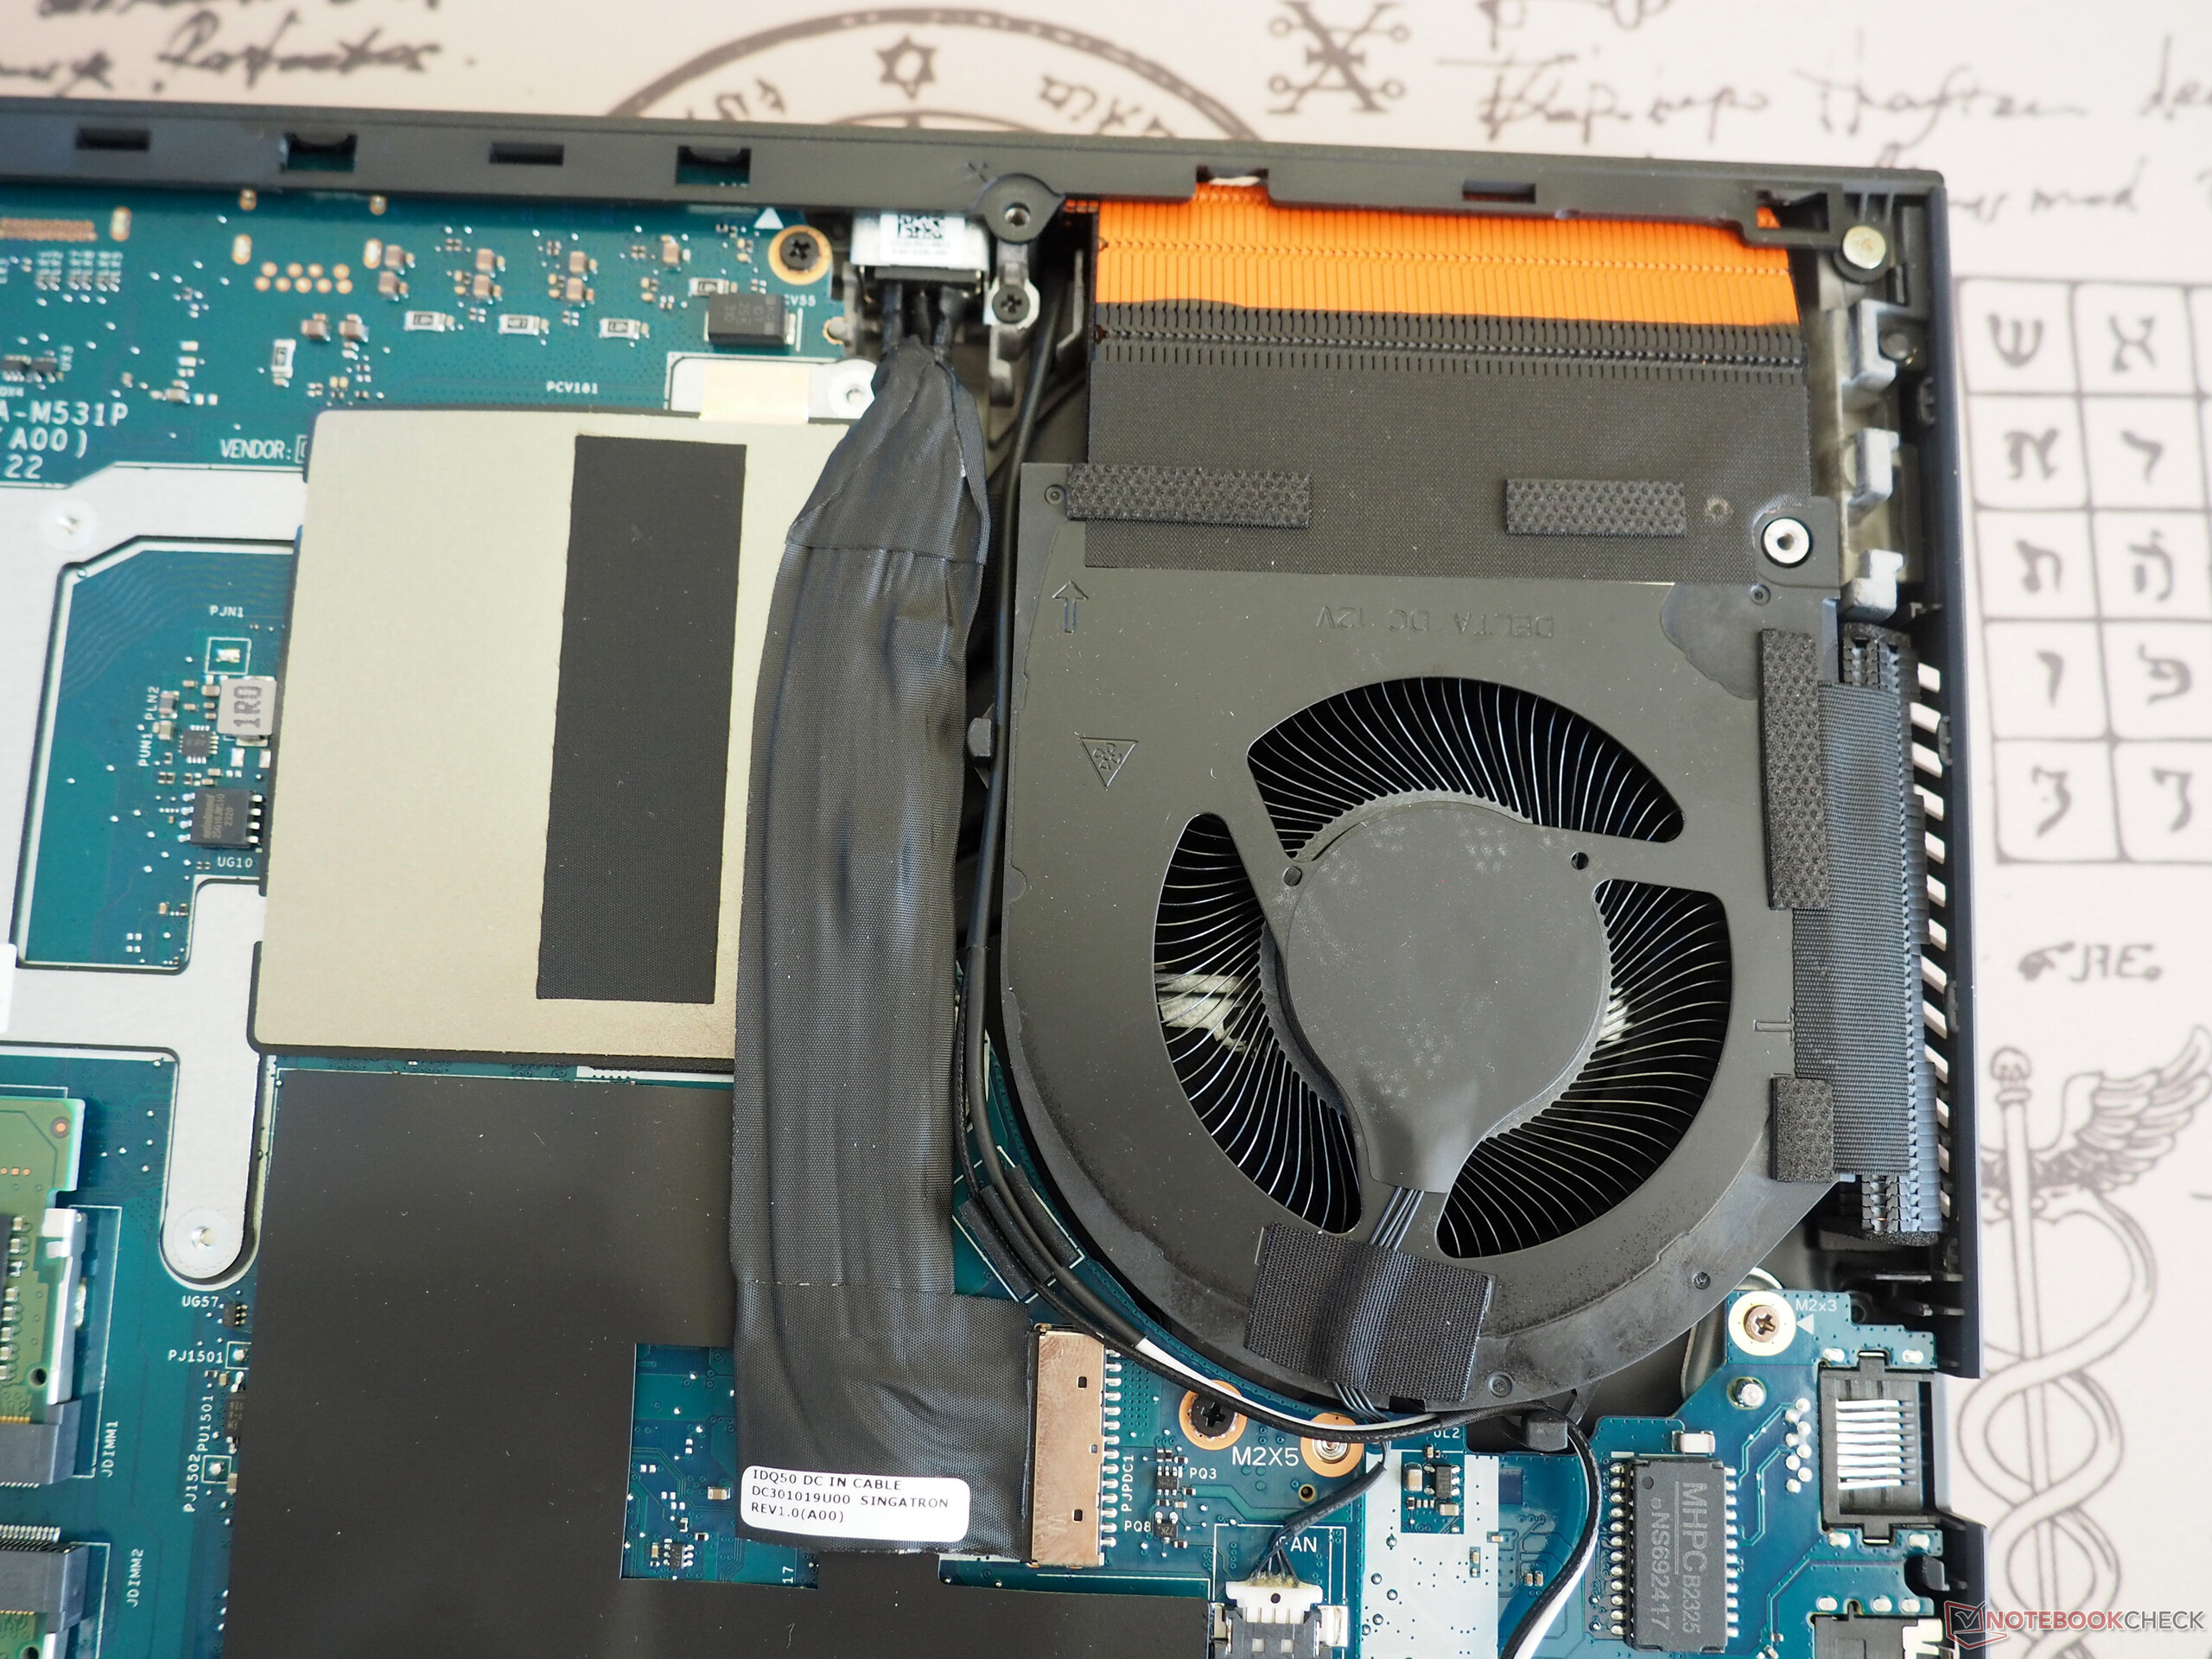
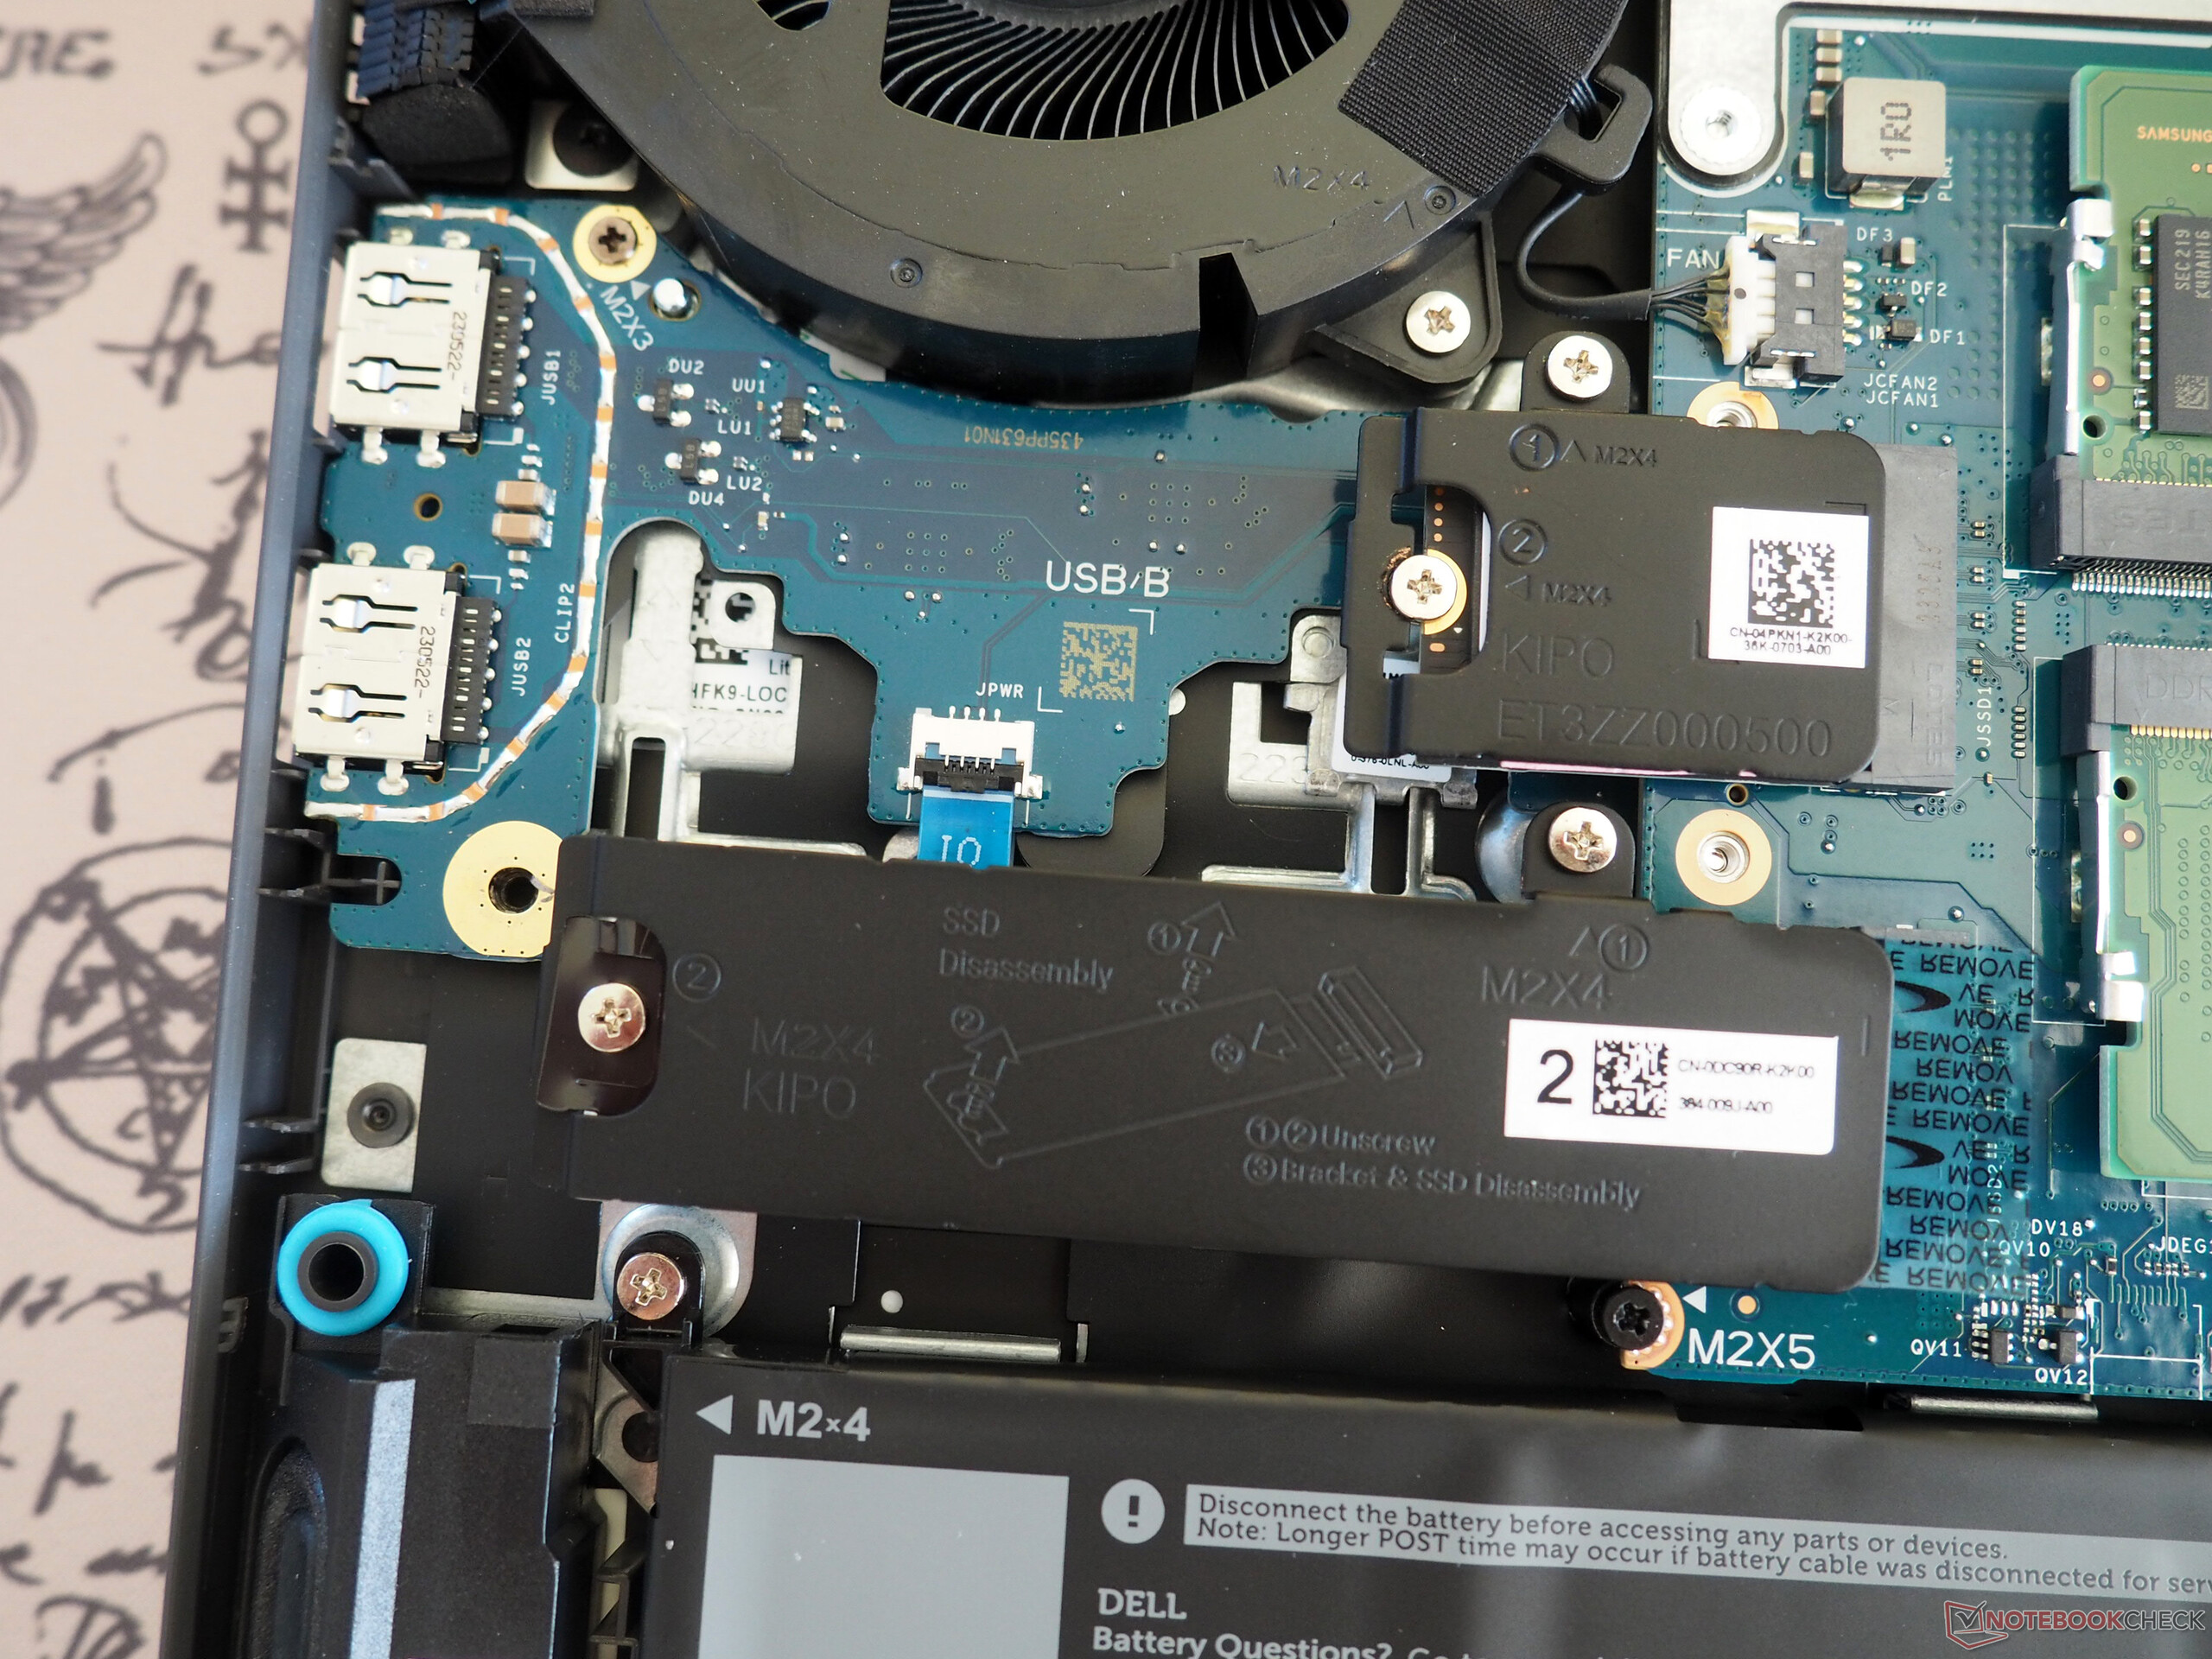
Bakım
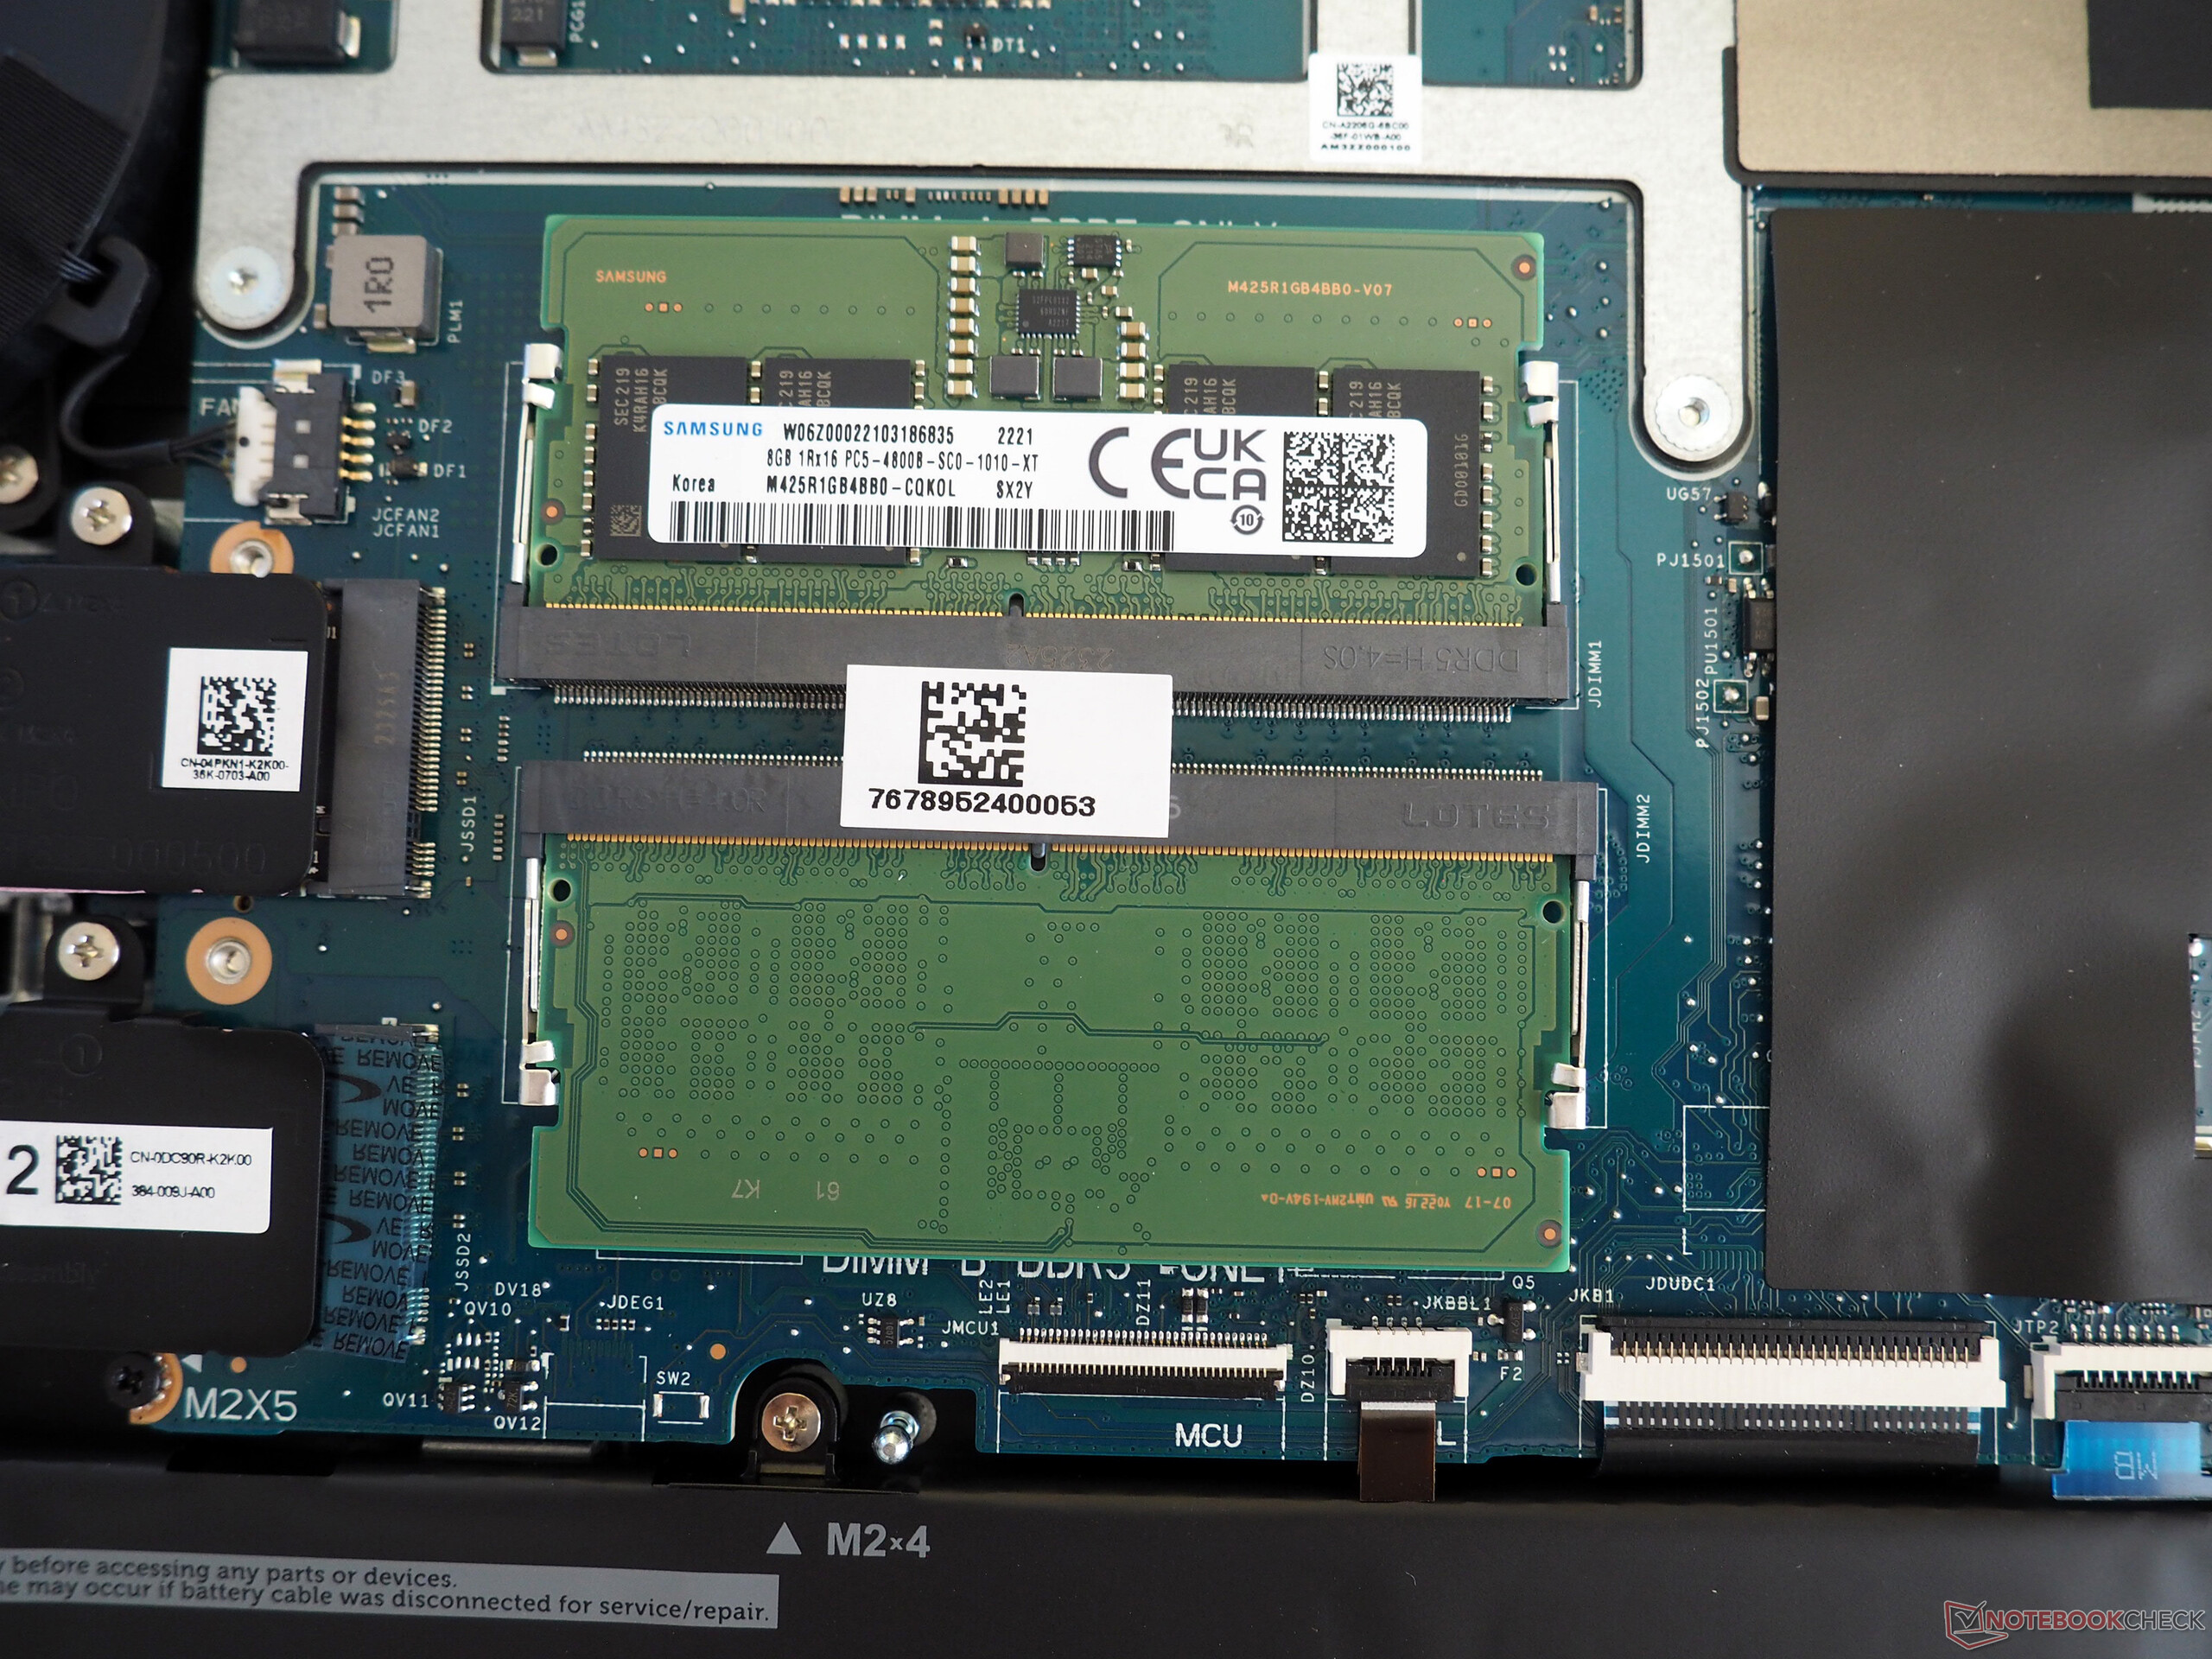
Kasayı açmak ortalama bir kullanıcı tarafından bile kesinlikle yapılabilir. On adet çapraz başlı vidayı söktükten sonra alt paneli tutucudan kaldırabilirsiniz. Kaputun altında soğutma ünitesi, pil, Wi-Fi modülü, dolu iki bellek yuvası, kullanımda olan bir M.2 2230 yuvası ve depolama yükseltmesi için boş bir M.2 2280 yuvası bulunmaktadır.
Garanti
Dell, Almanya'da varsayılan olarak yalnızca 12 aylık bir garanti sağlar. Ancak garanti süresi bölgeye göre değişebilir.
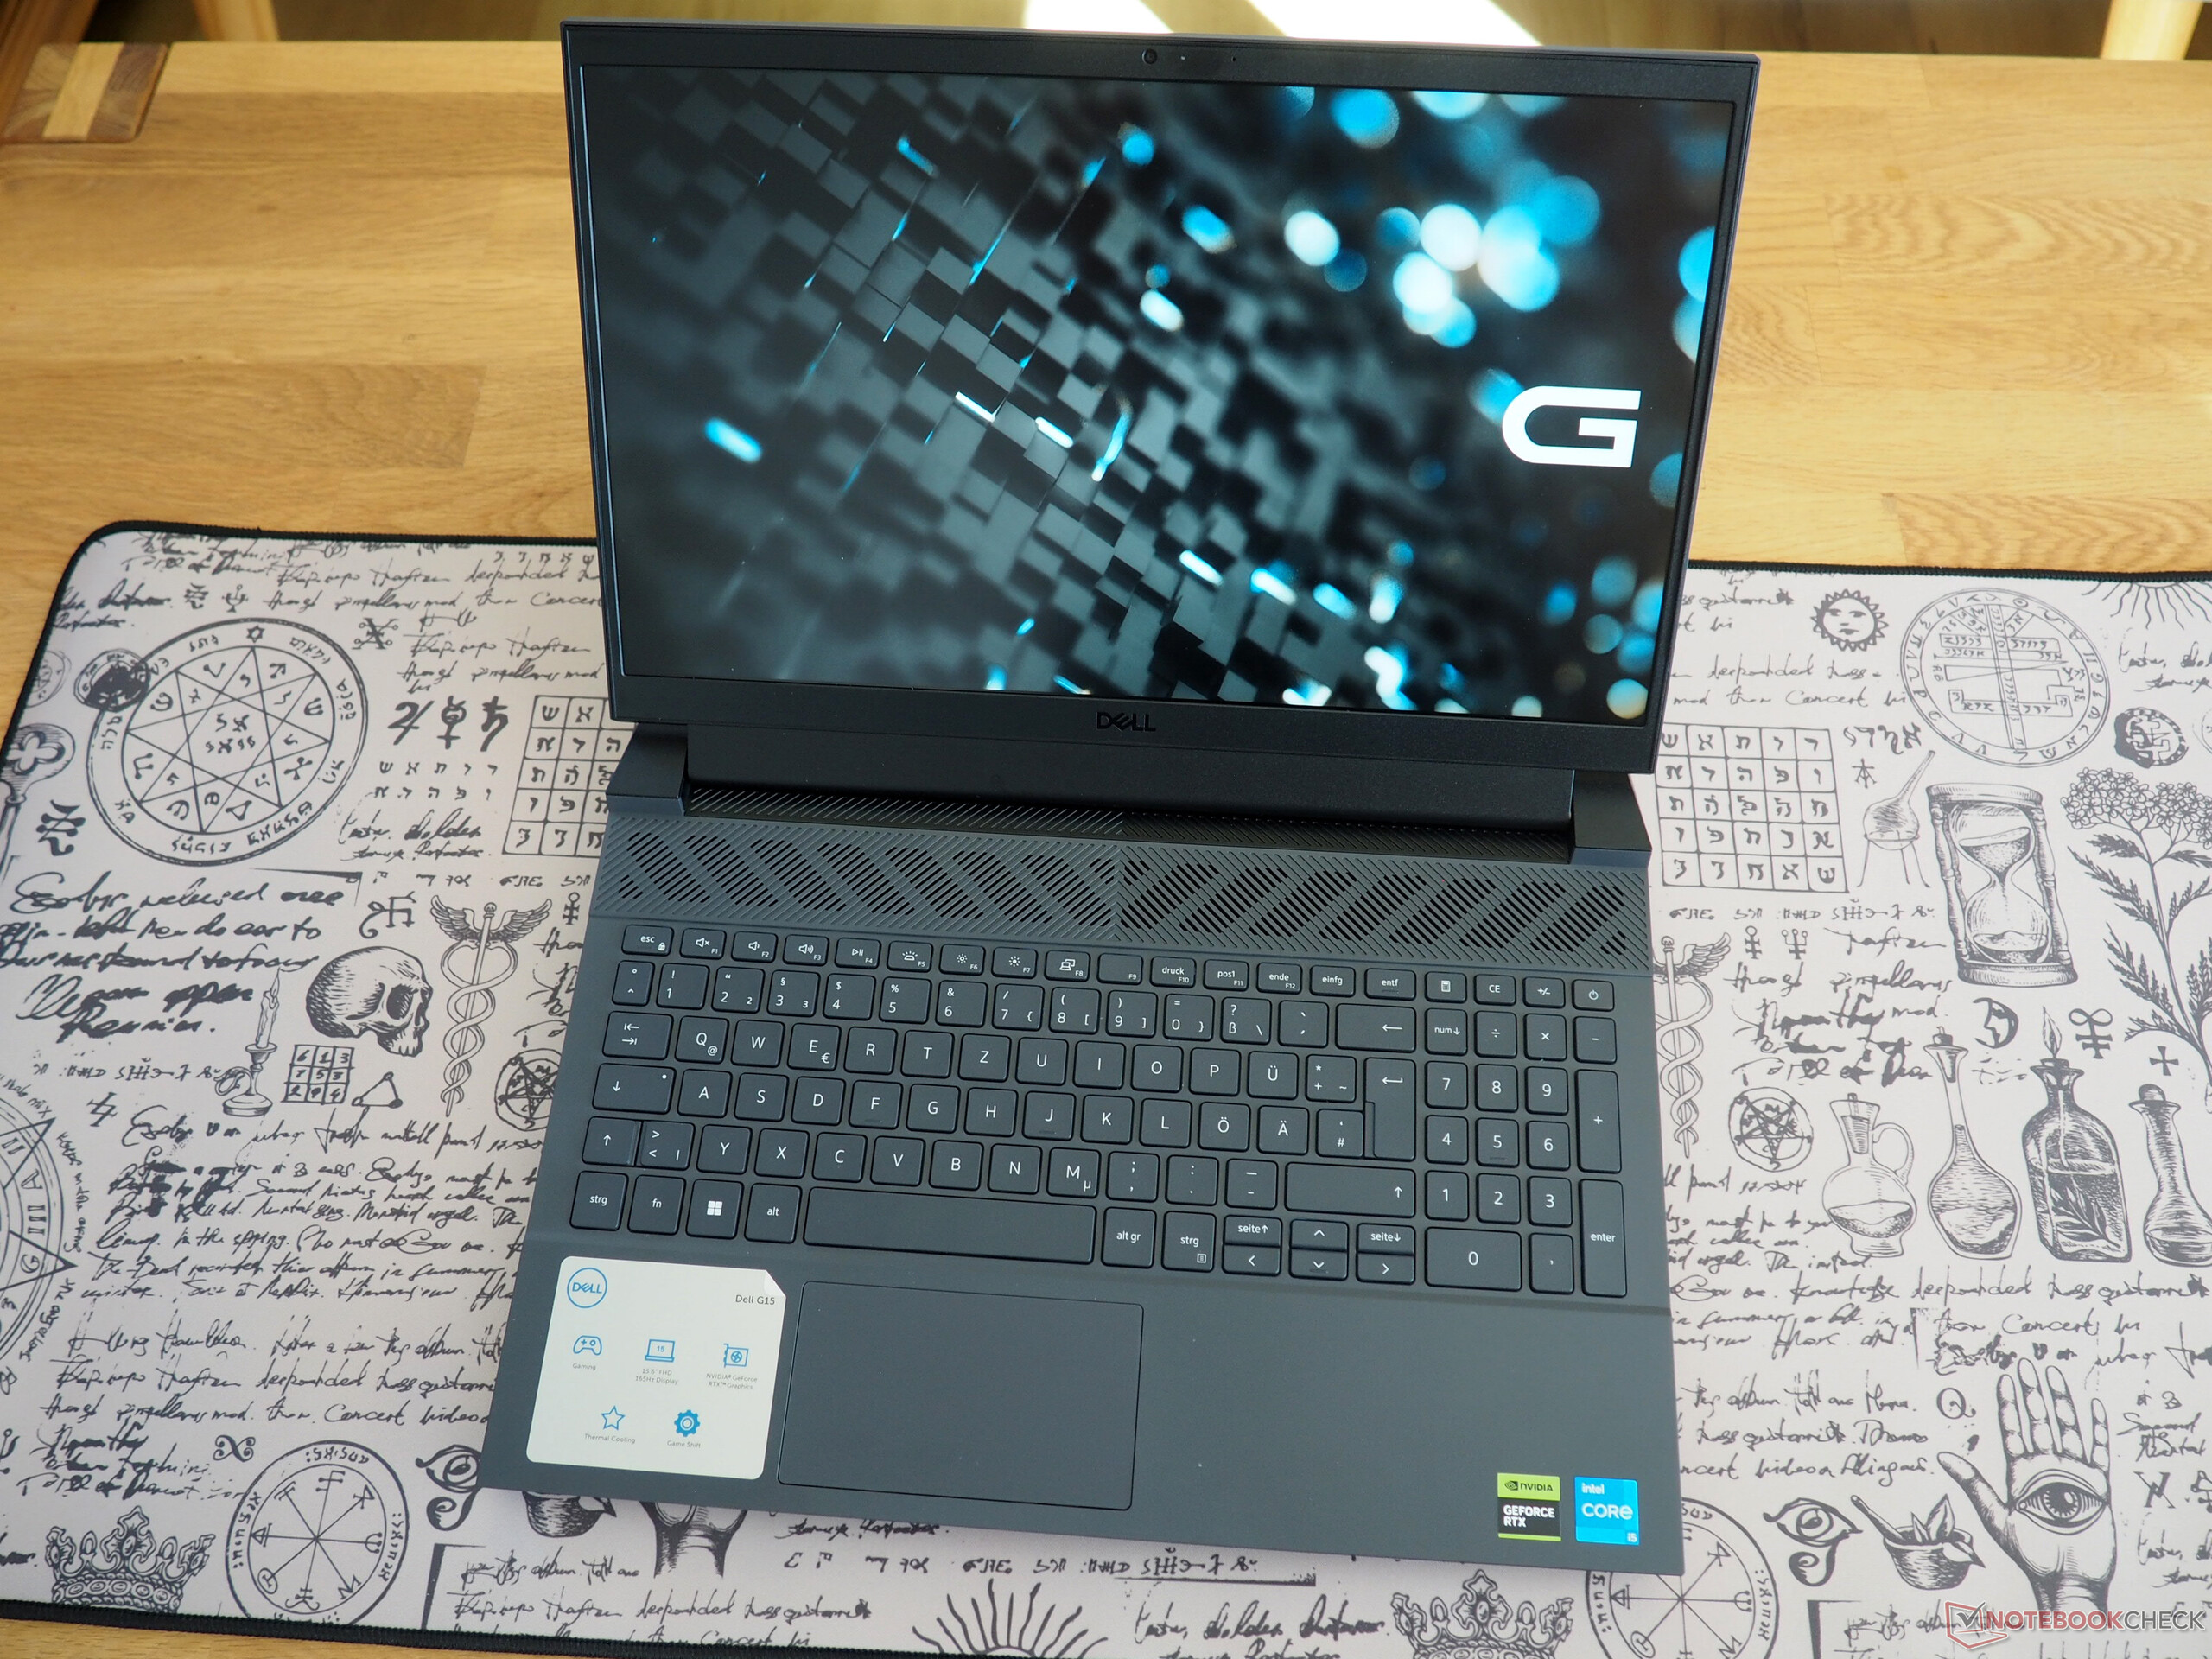
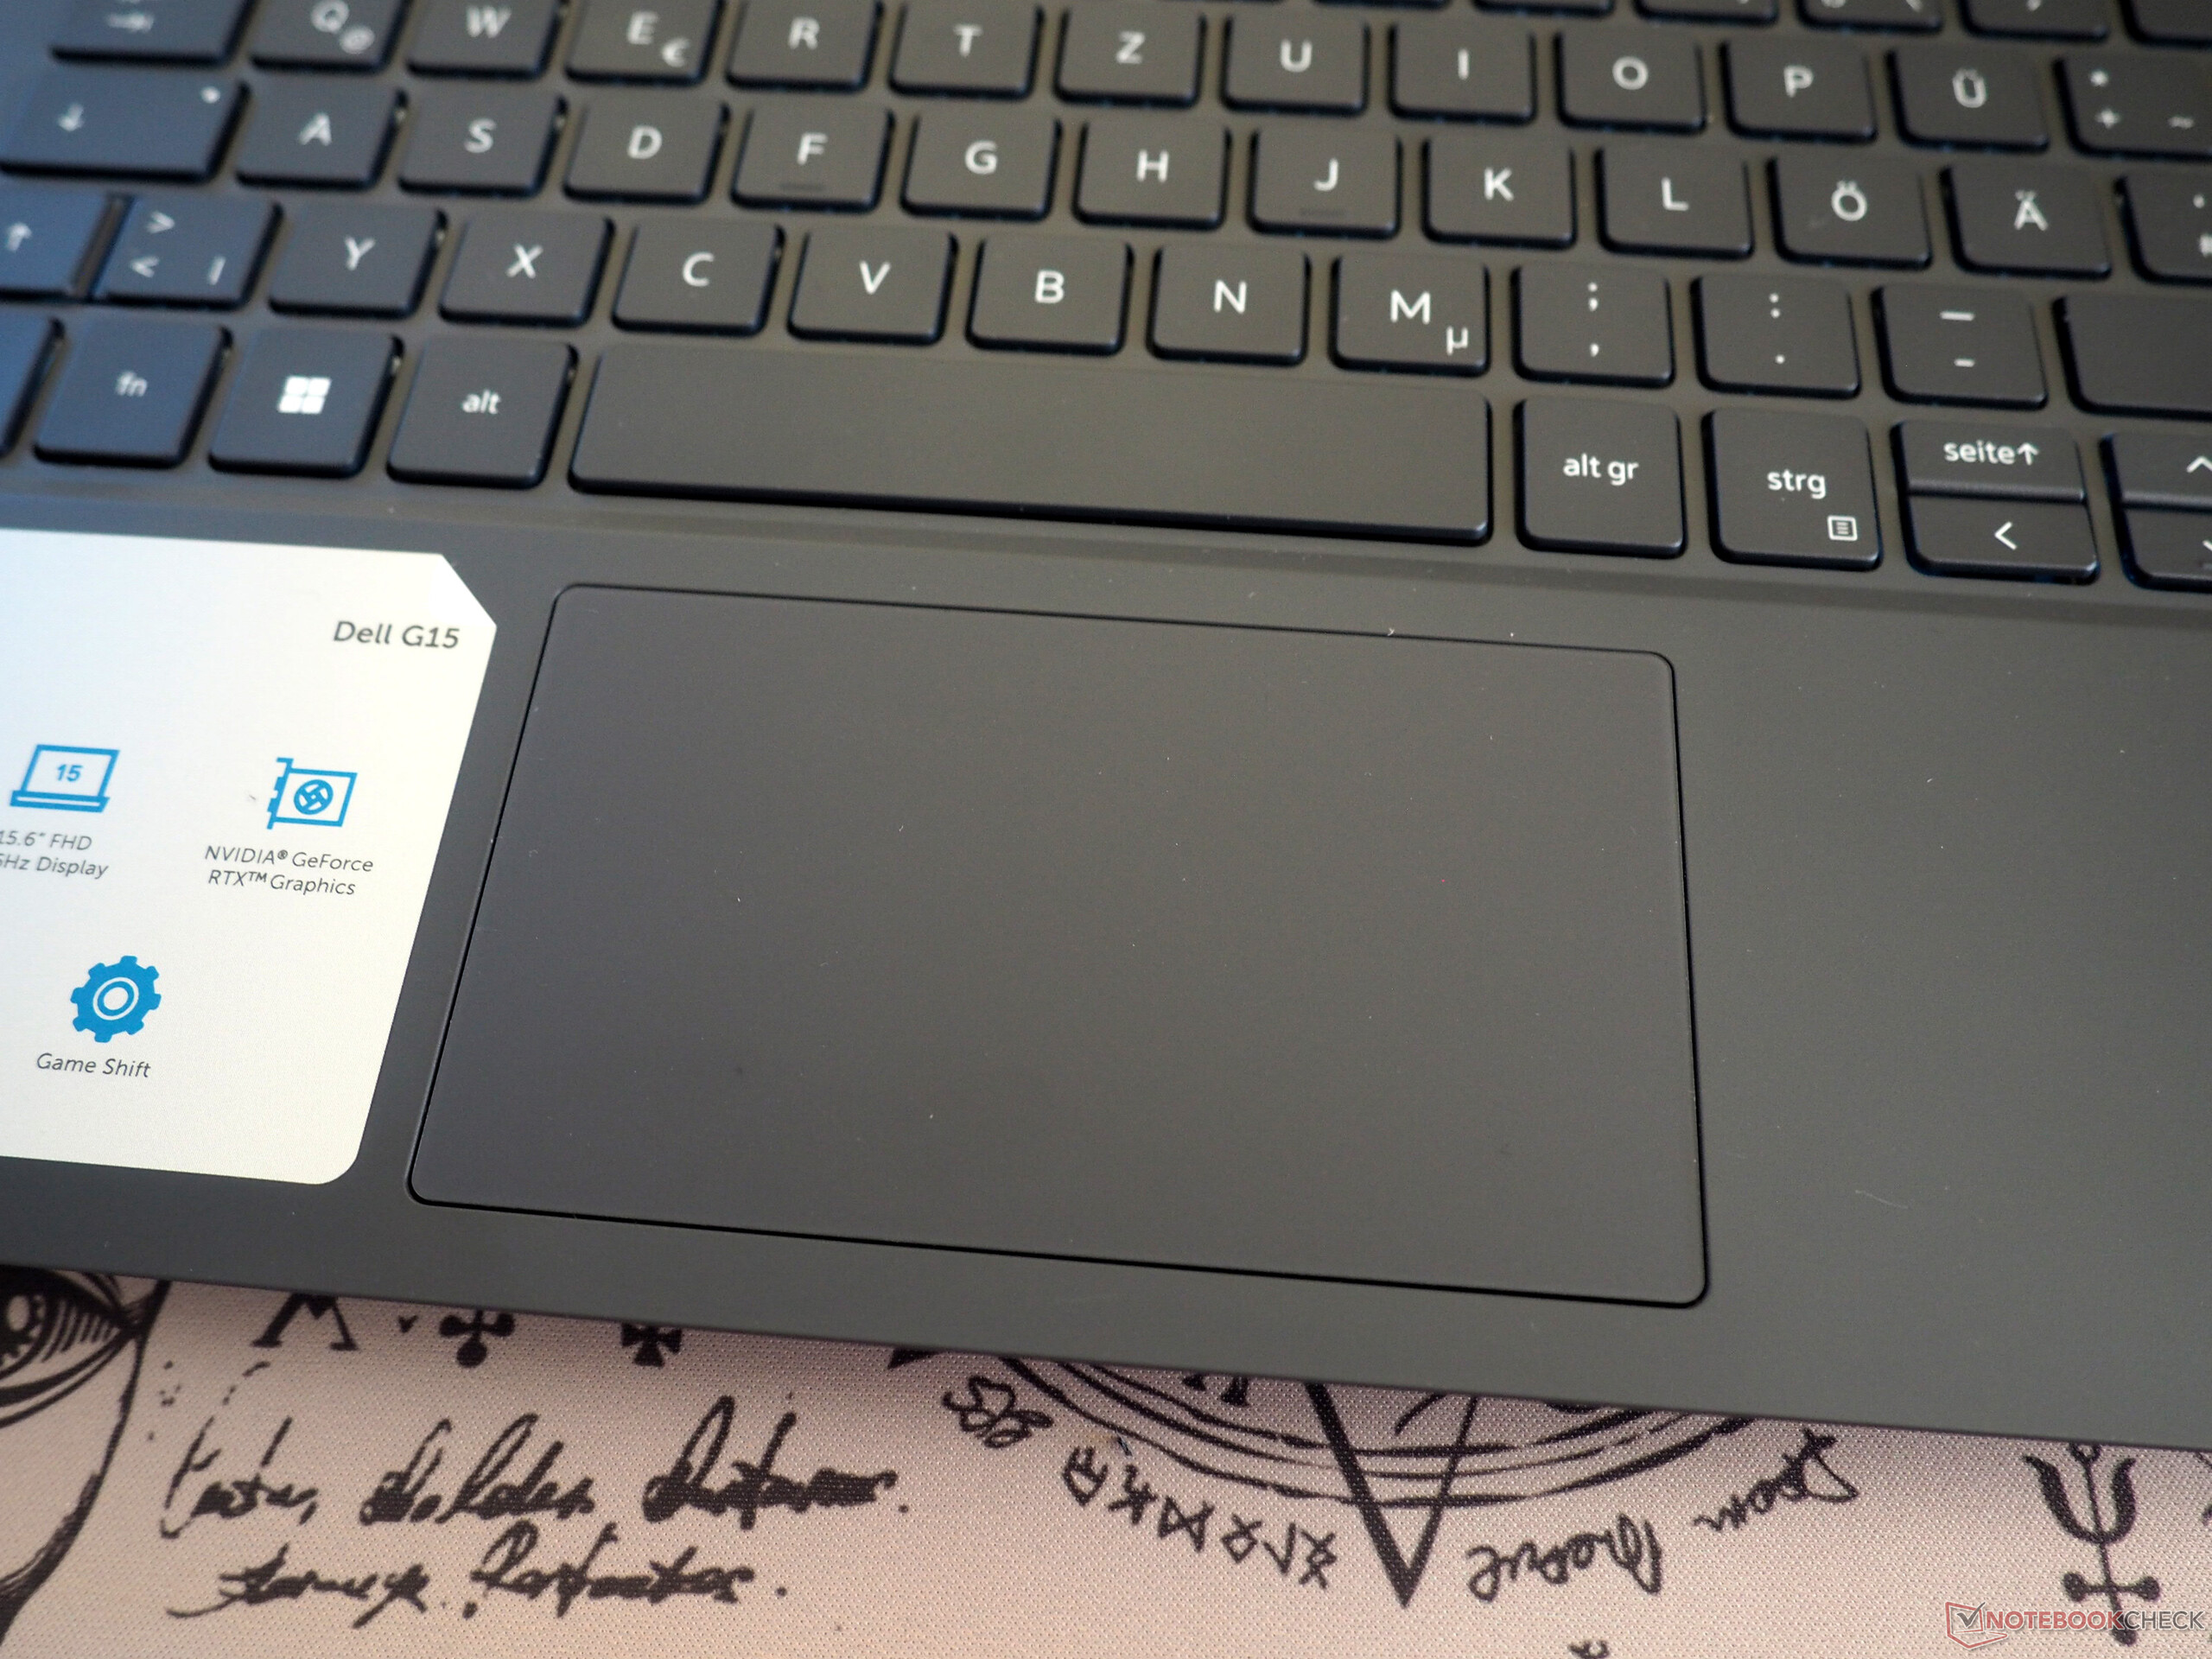
Giriş cihazları
Klavye
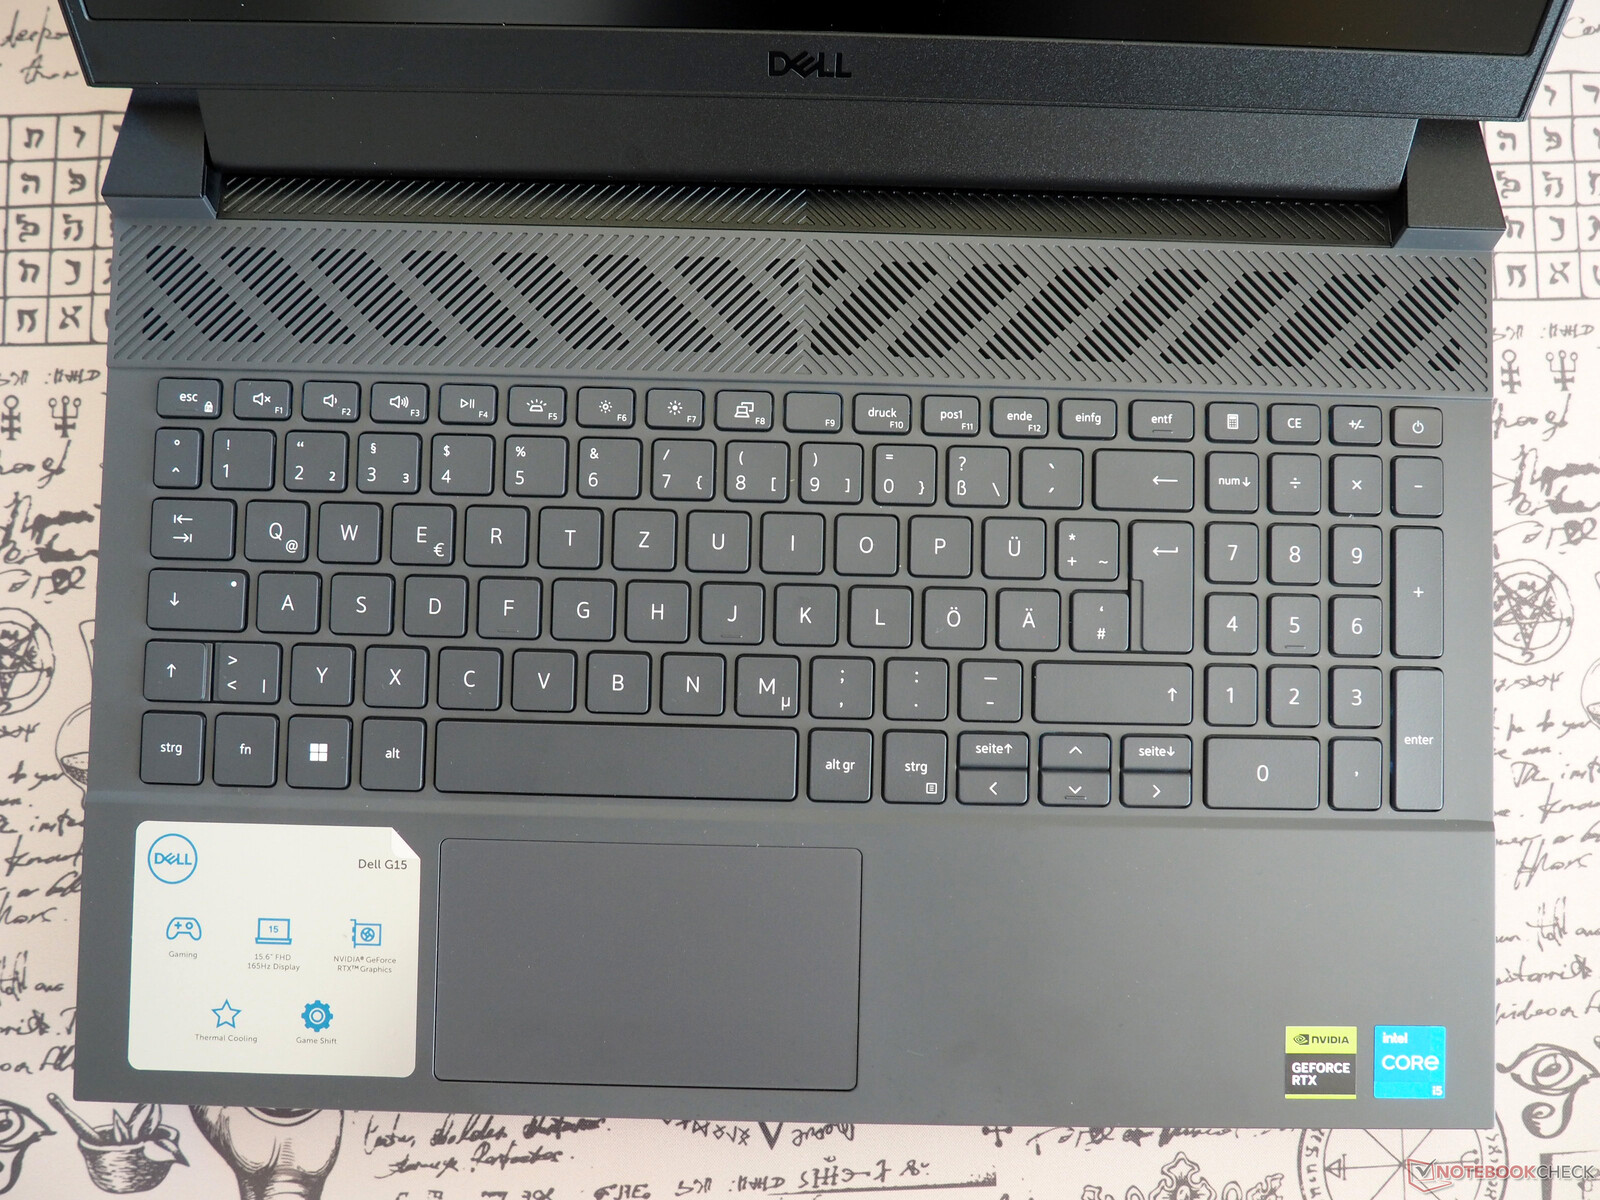
Giriş aygıtları gerçekten şaşırtıcı olmamakla birlikte sağlam. Küçük ok tuşlarına rağmen, özellikle standart düzene büyük ölçüde sadık kalan ve tam boyutlu bir numpad sunan Almanca klavyenin düzenini seviyoruz. Yazma hissi oldukça vasat ve bize göre daha da sıkı olabilirdi. İki parlaklık seviyesine sahip beyaz arka ışık, karanlık bir ortamda yazmayı kolaylaştırıyor.
Dokunmatik yüzey
Dokunmatik yüzey üzerinde de Dell'in biraz çalışması gerekebilir. Örneğin, biraz mütevazı boyutun yanı sıra (yaklaşık 10,5 x 6 cm, 4,1 x 2,4 inç), çok gevşek yüzey hakkında da şikayetlerimiz var. Bununla birlikte, dokunmatik yüzey kabul edilebilir düzeyde pürüzsüzlük ve hassasiyet sağlıyor.
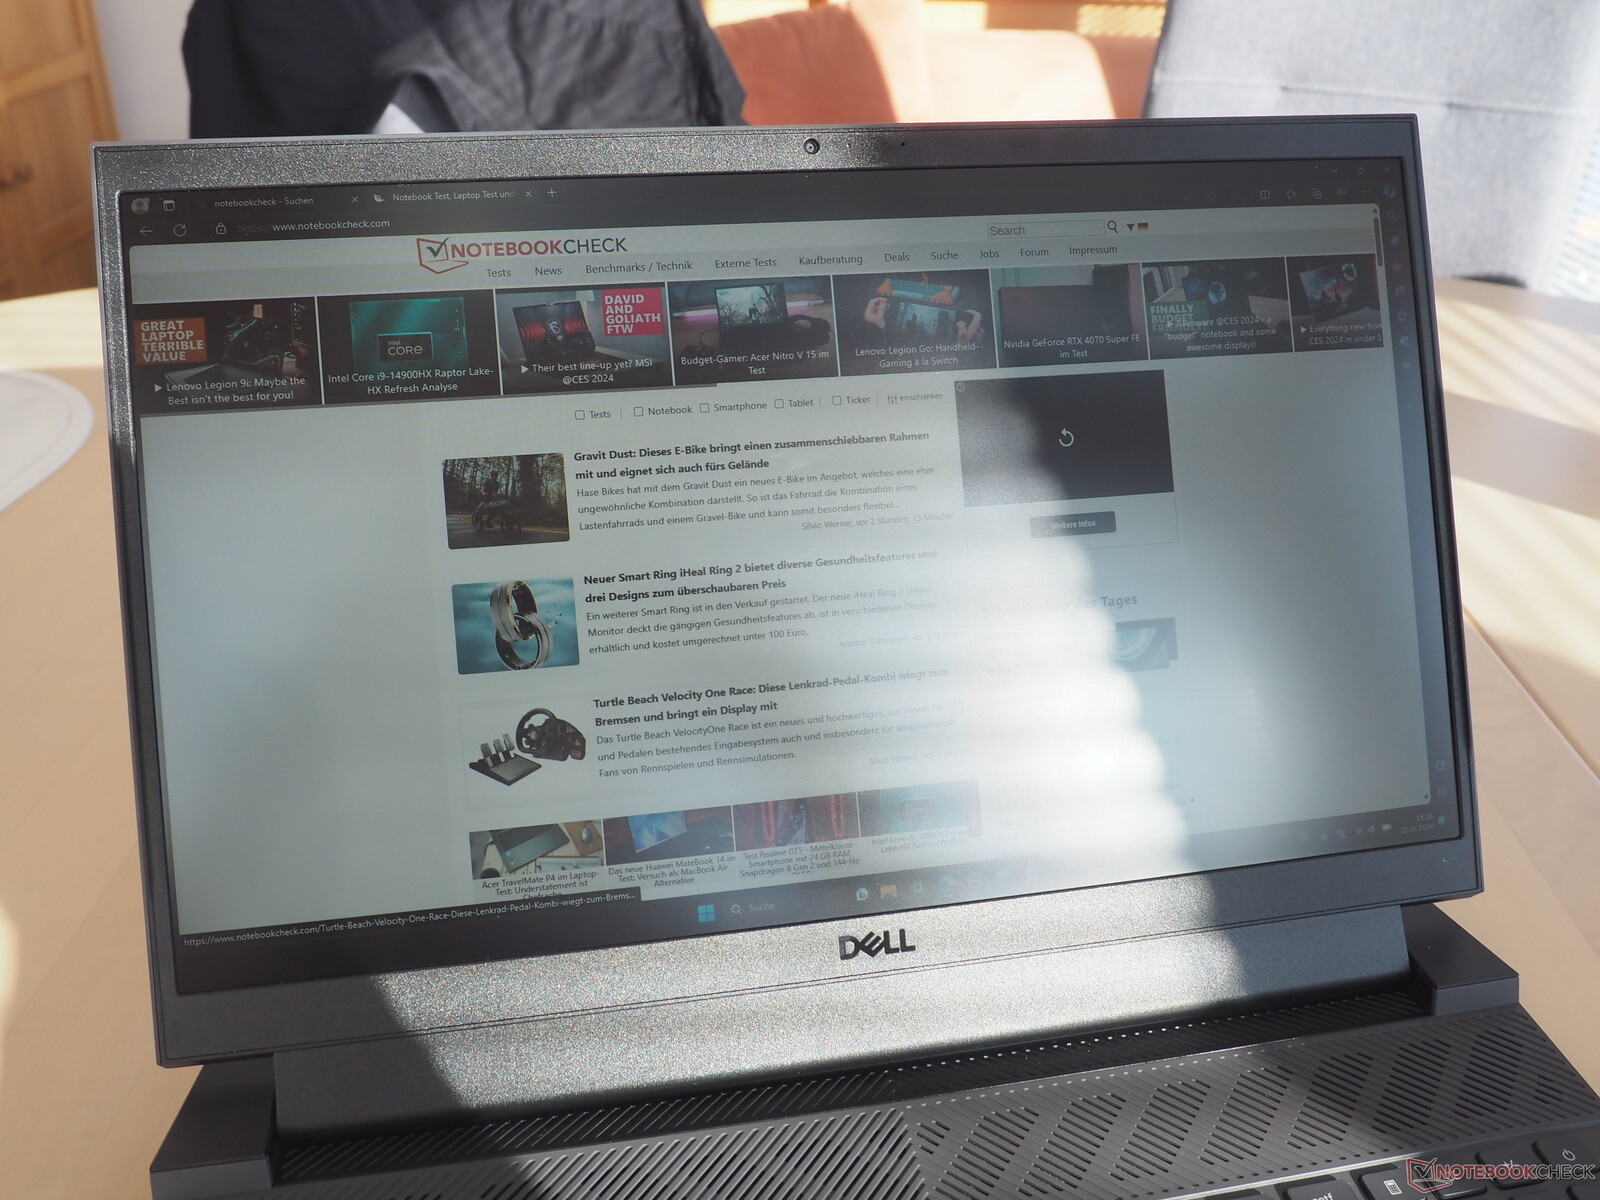
Ekran
Dizüstü bilgisayar 165Hz ekranla da geliyor. Ancak, panel dizüstü bilgisayarda kullanılandan farklıdır G15 daha önce inceledik (tabloya bakınız). Bu aynı zamanda iki ekran için elde edilen bazı sonuçların neden birbirinden farklı olduğunu da açıklamaktadır.
| |||||||||||||||||||||||||
Aydınlatma: 89 %
Batarya modunda parlaklık: 389 cd/m²
Kontrast: 1111:1 (Siyah: 0.35 cd/m²)
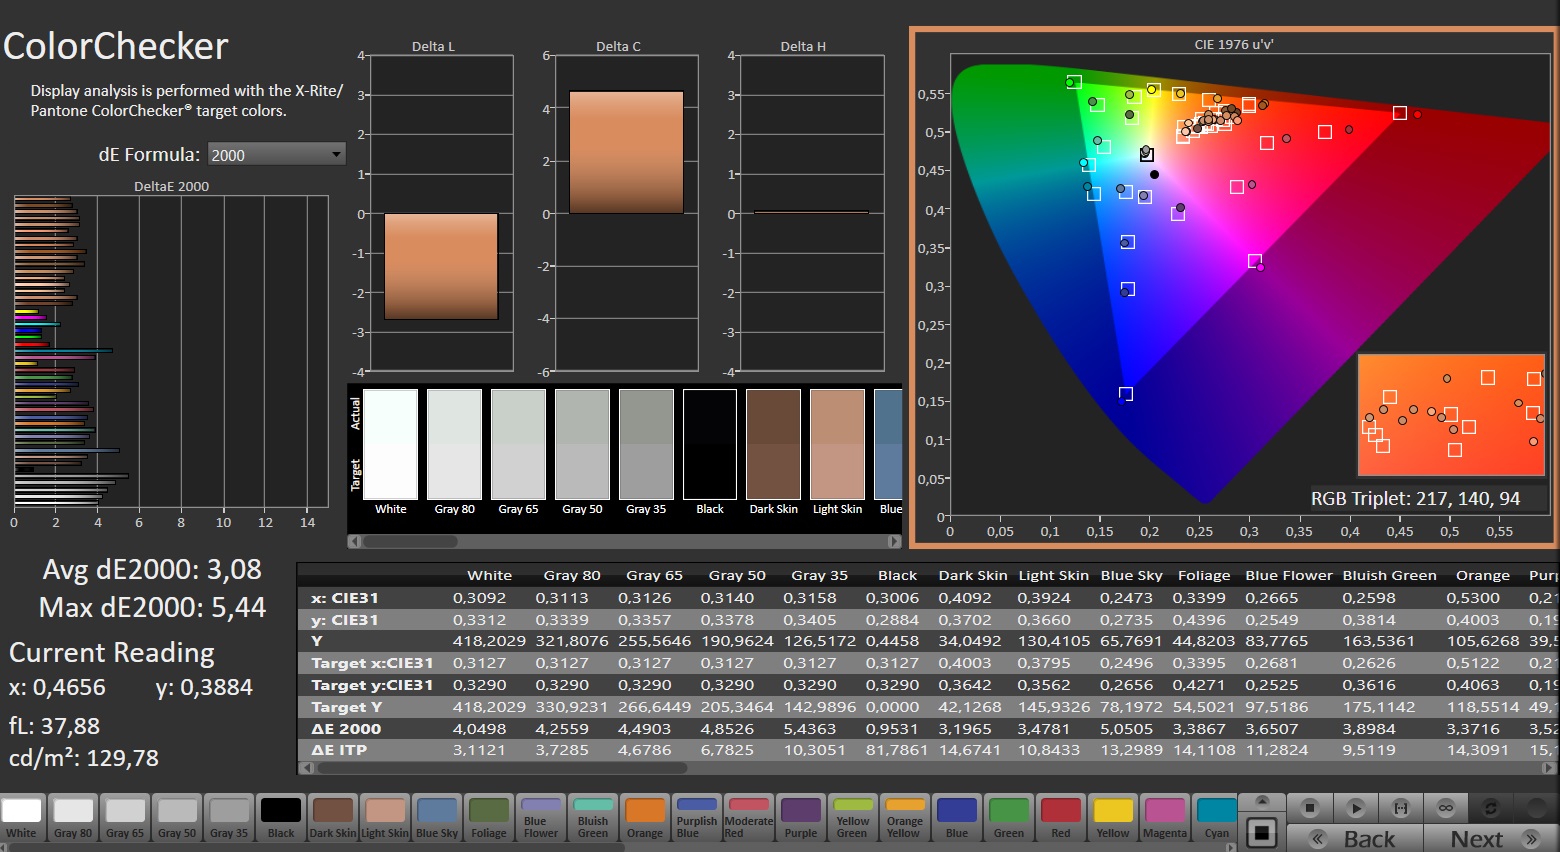
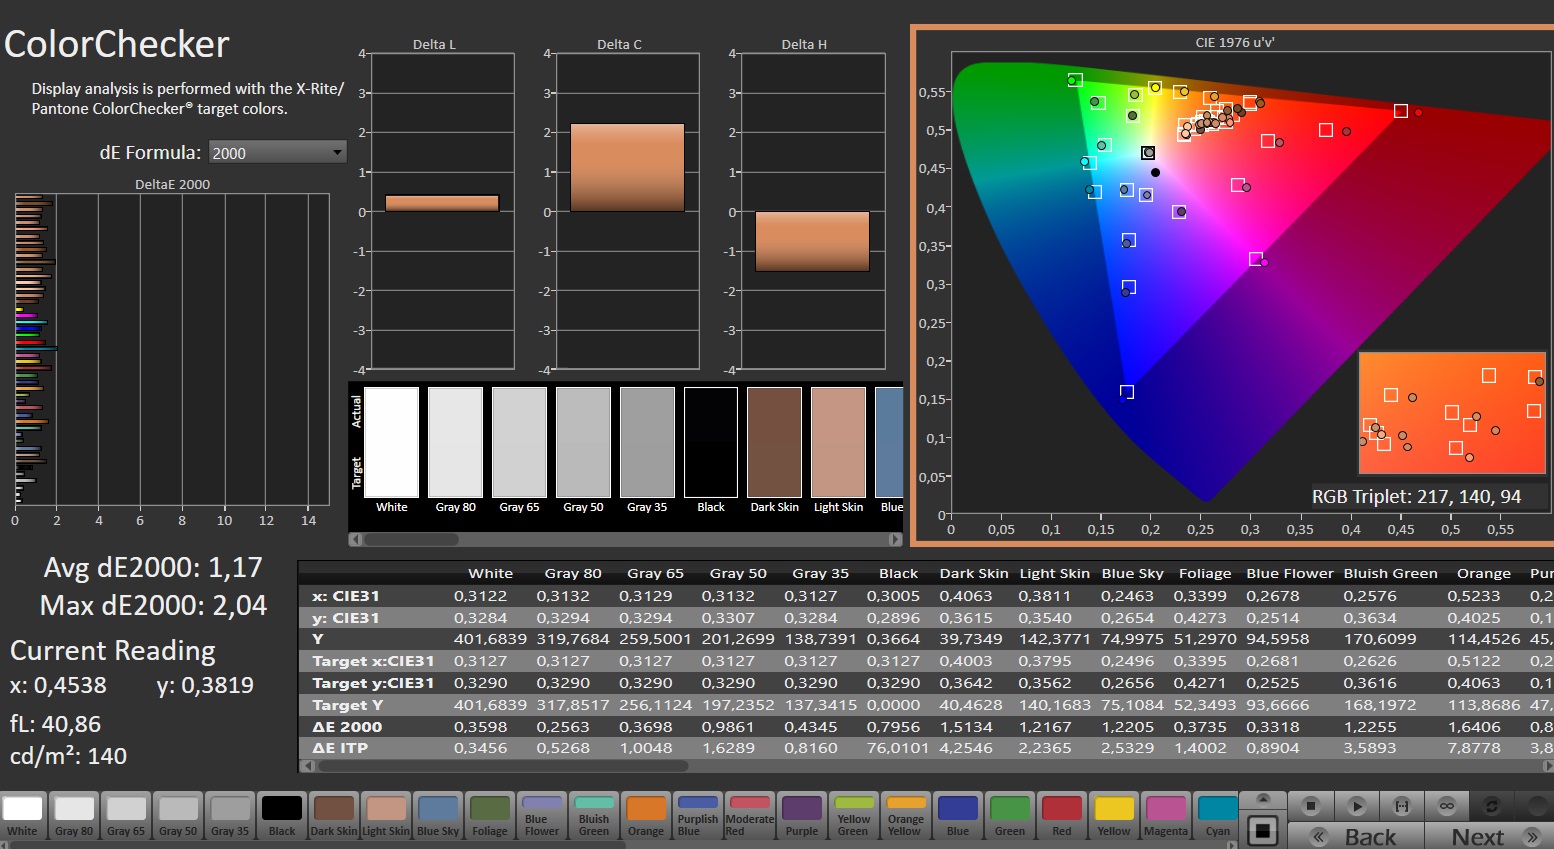
ΔE ColorChecker Calman: 3.08 | ∀{0.5-29.43 Ø4.71}
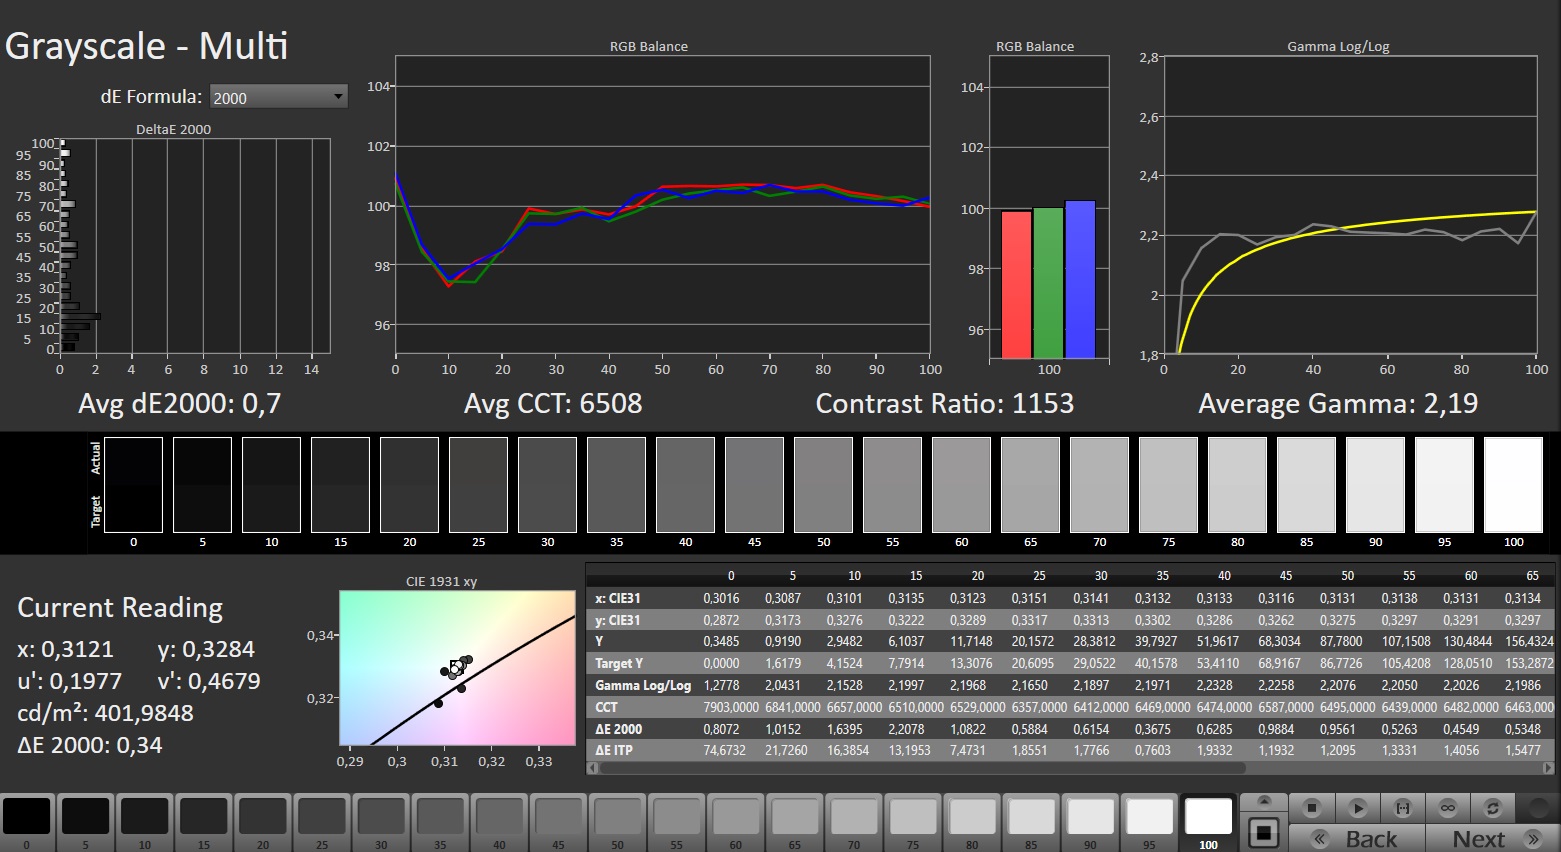
calibrated: 1.17
ΔE Greyscale Calman: 4.4 | ∀{0.09-98 Ø4.96}
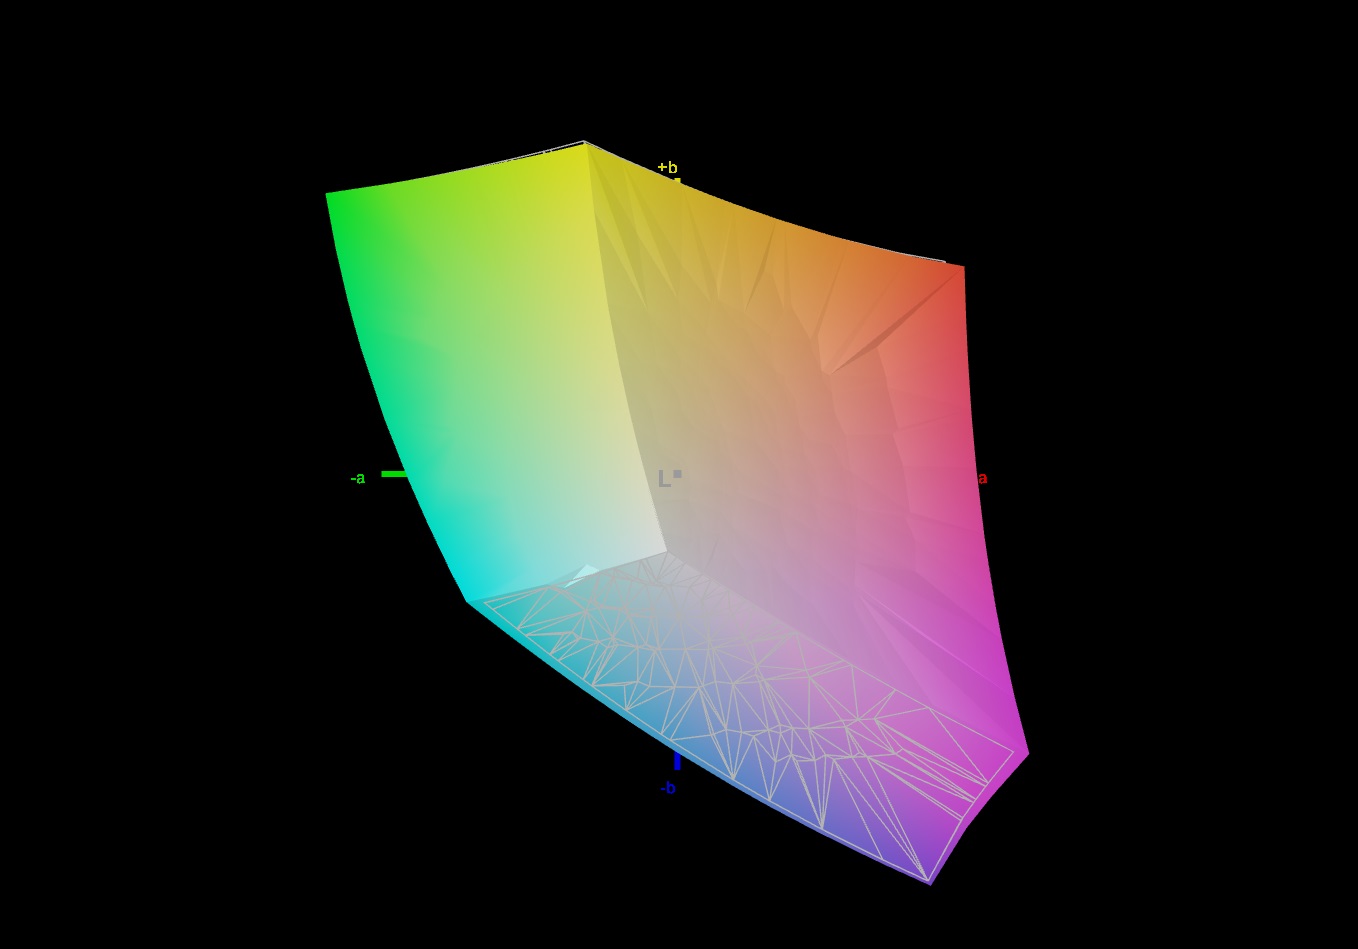
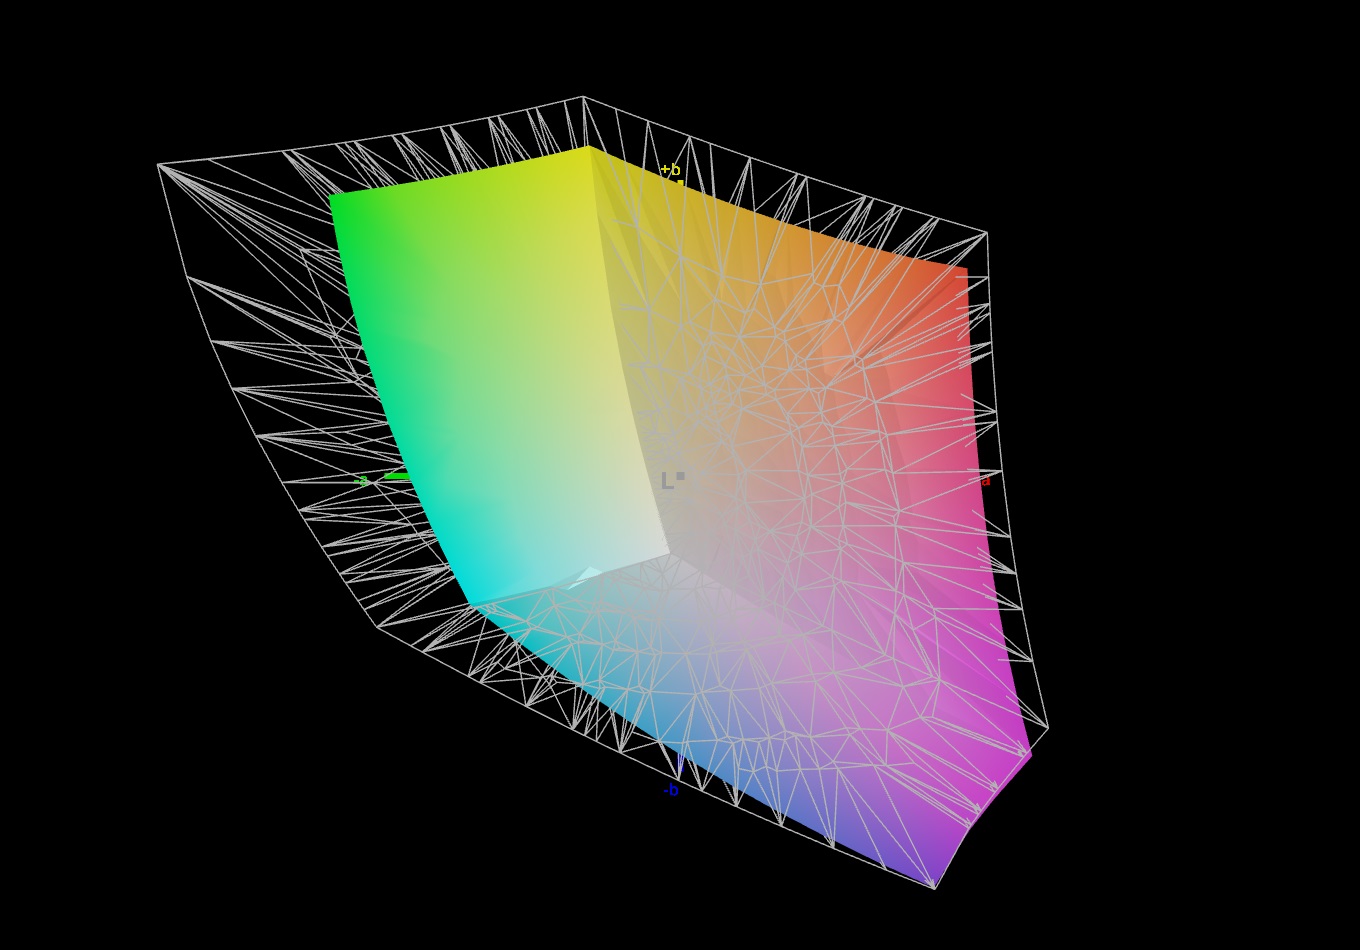
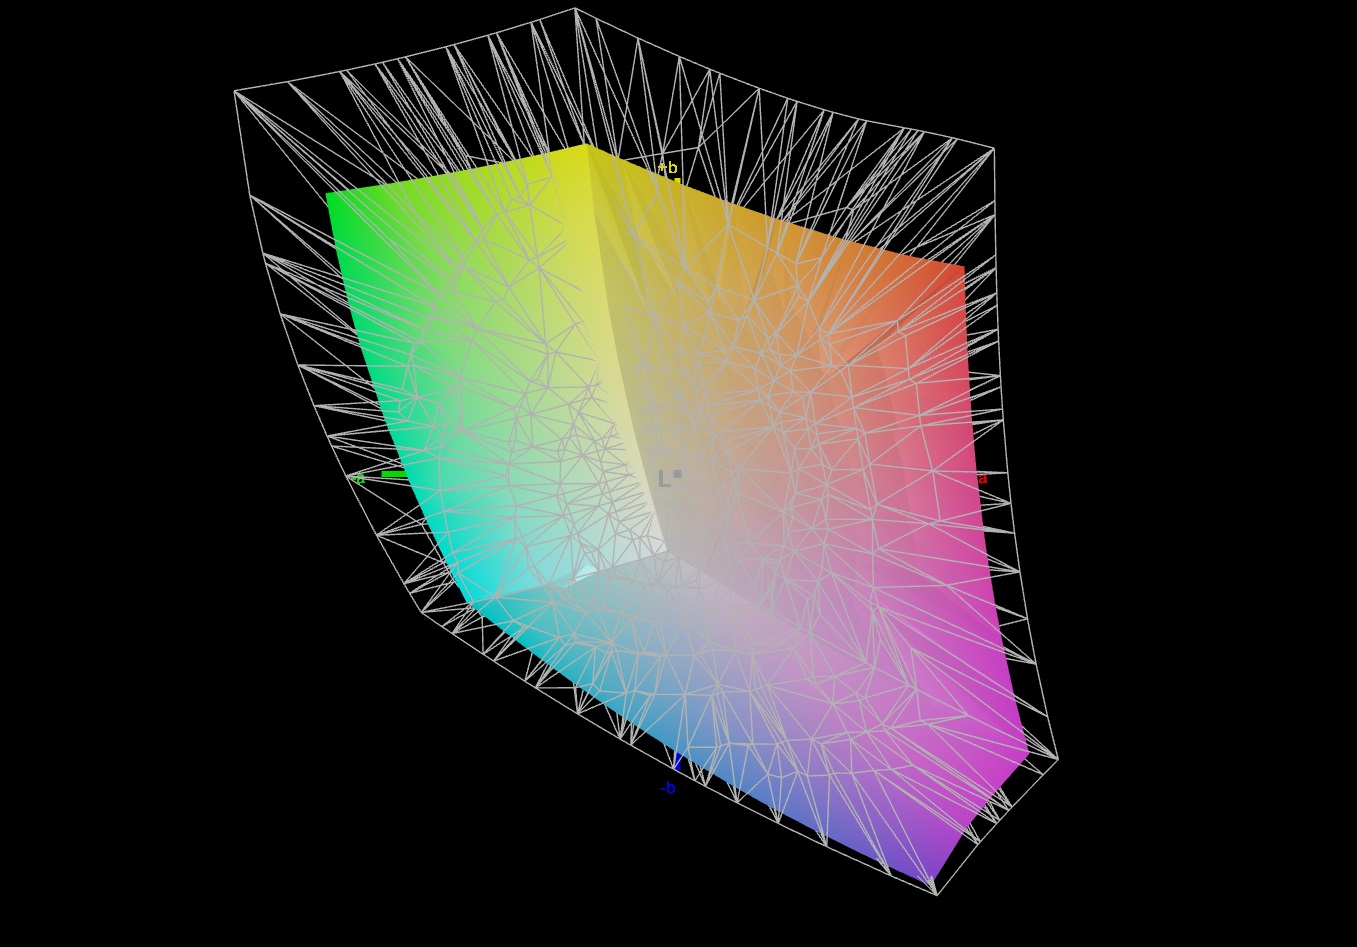
71.4% AdobeRGB 1998 (Argyll 3D)
99.3% sRGB (Argyll 3D)
71.1% Display P3 (Argyll 3D)
Gamma: 2.409
CCT: 6350 K
| Dell G15 5530, i5-13450HX RTX 4050 BOEhydis NV15NY9 (Dell 18PJX), IPS, 1920x1080, 15.6" | Medion Erazer Crawler E40 - MD 62518 BOE HF NV156FHM-N4G, IPS, 1920x1080, 15.6" | Lenovo LOQ 15IRH8 Core i7 BOE CQ NE156QHM-NY4, IPS, 2560x1440, 15.6" | Asus TUF A15 FA507 N156HMA-GA1, IPS, 1920x1080, 15.6" | Dell G15 5530 AUO B156HAN, IPS, 1920x1080, 15.6" | |
|---|---|---|---|---|---|
| Display | -12% | -5% | -6% | 2% | |
| Display P3 Coverage (%) | 71.1 | 61.4 -14% | 66.3 -7% | 64.9 -9% | 73.1 3% |
| sRGB Coverage (%) | 99.3 | 89.7 -10% | 96.6 -3% | 96.5 -3% | 98.4 -1% |
| AdobeRGB 1998 Coverage (%) | 71.4 | 63.2 -11% | 67.7 -5% | 66.6 -7% | 74.4 4% |
| Response Times | -19% | 8% | -234% | 40% | |
| Response Time Grey 50% / Grey 80% * (ms) | 8.5 ? | 8 ? 6% | 5 ? 41% | 30.4 ? -258% | 3.39 ? 60% |
| Response Time Black / White * (ms) | 6.7 ? | 9.6 ? -43% | 8.41 ? -26% | 20.8 ? -210% | 5.35 ? 20% |
| PWM Frequency (Hz) | 21620 ? | ||||
| Screen | -13% | -10% | 21% | -17% | |
| Brightness middle (cd/m²) | 389 | 364 -6% | 373 -4% | 288 -26% | 320 -18% |
| Brightness (cd/m²) | 374 | 351 -6% | 365 -2% | 271 -28% | 316 -16% |
| Brightness Distribution (%) | 89 | 91 2% | 90 1% | 91 2% | 94 6% |
| Black Level * (cd/m²) | 0.35 | 0.43 -23% | 0.33 6% | 0.17 51% | 0.21 40% |
| Contrast (:1) | 1111 | 847 -24% | 1130 2% | 1694 52% | 1524 37% |
| Colorchecker dE 2000 * | 3.08 | 3.98 -29% | 4.19 -36% | 1.9 38% | 4.55 -48% |
| Colorchecker dE 2000 max. * | 5.44 | 6.38 -17% | 8.47 -56% | 3.3 39% | 9.83 -81% |
| Colorchecker dE 2000 calibrated * | 1.17 | 1.36 -16% | 1.07 9% | 0.9 23% | 1.51 -29% |
| Greyscale dE 2000 * | 4.4 | 4.39 -0% | 5 -14% | 2.7 39% | 6.2 -41% |
| Gamma | 2.409 91% | 2.58 85% | 1.93 114% | 2.32 95% | 2.07 106% |
| CCT | 6350 102% | 7316 89% | 7520 86% | 6535 99% | 6479 100% |
| Toplam Ortalama (Program / Ayarlar) | -15% /
-14% | -2% /
-7% | -73% /
-21% | 8% /
-5% |
* ... daha küçük daha iyidir
Mevcut panel biraz daha kötü bir siyah seviyesine sahipken (0,21 cd/m²'ye karşılık 0,35), ortalama maksimum parlaklığı biraz daha yüksektir (316 cd/m²'ye karşılık 374). Diğer G15 modeli, inceleme ünitesinden daha iyi kontrast ve tepki süresine sahip. Bununla birlikte, 1.111:1 kontrast ve 8,5 ms griden griye tepki süresi bir IPS panel için saygıdeğerdir.
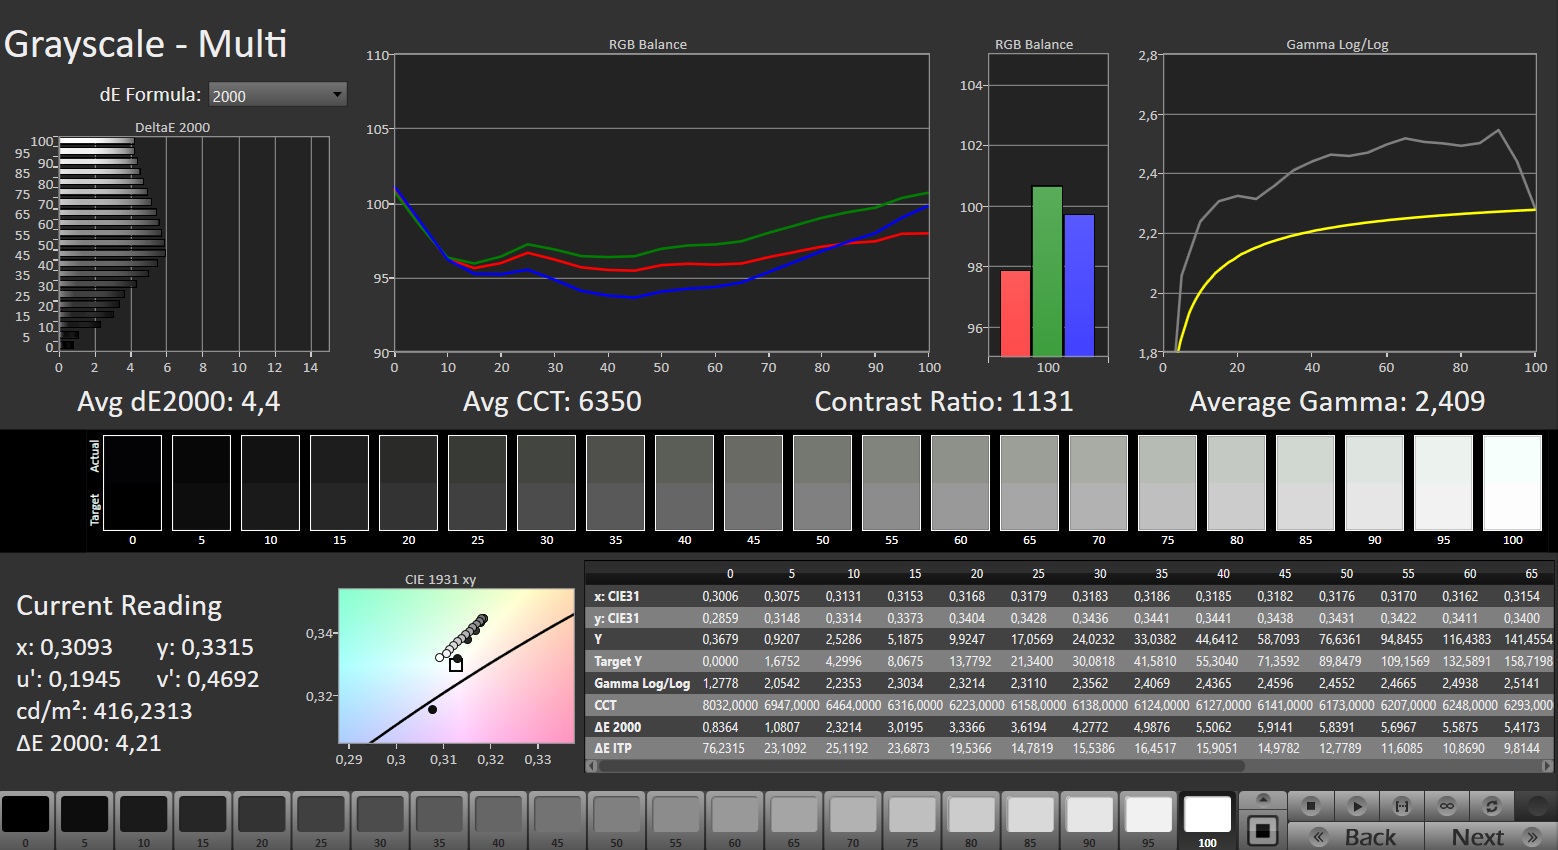
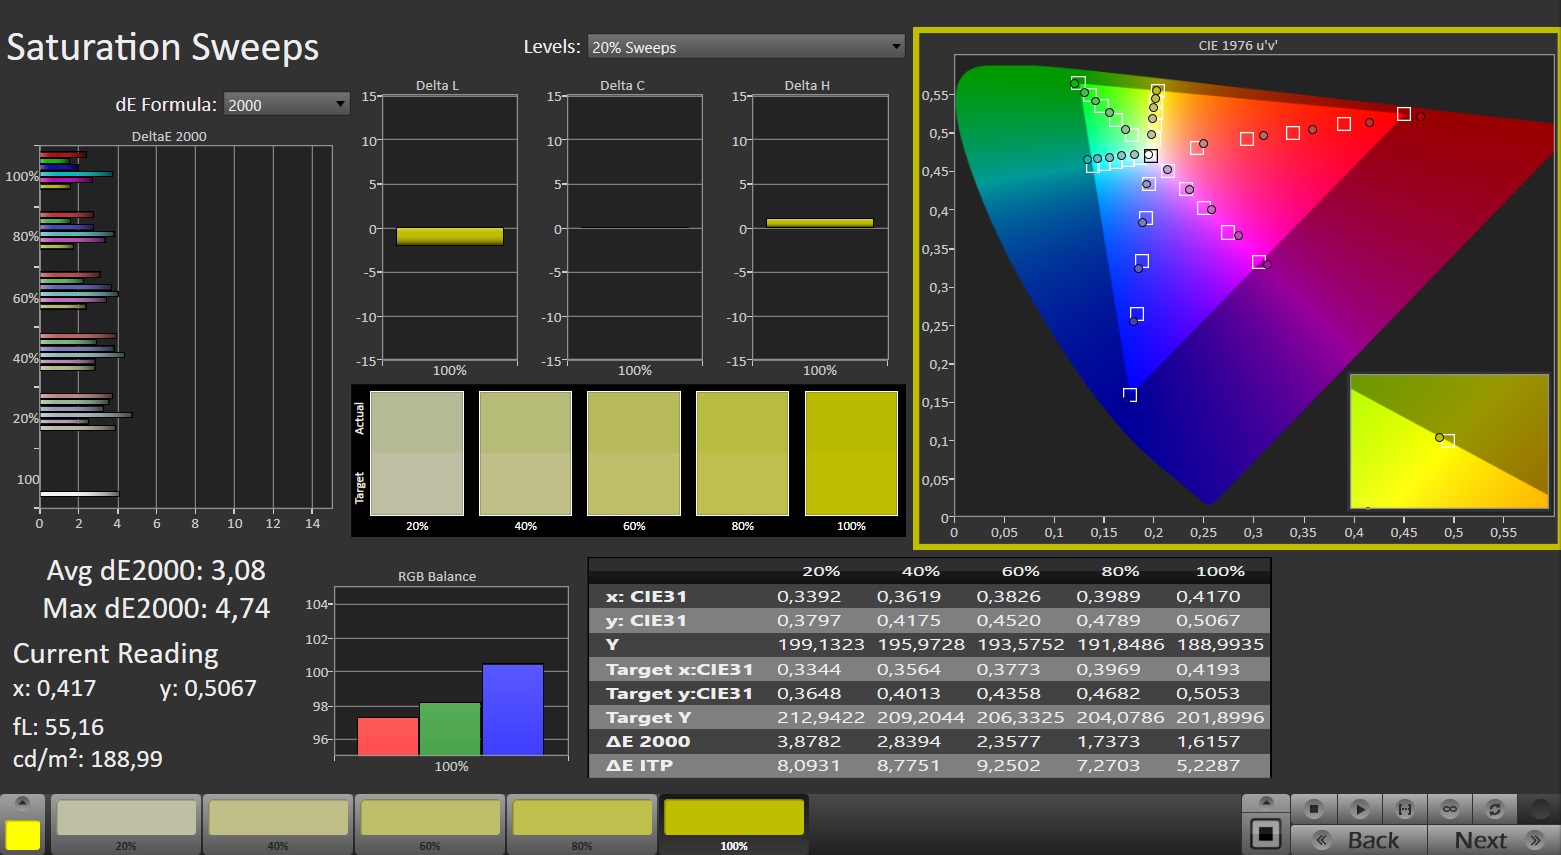
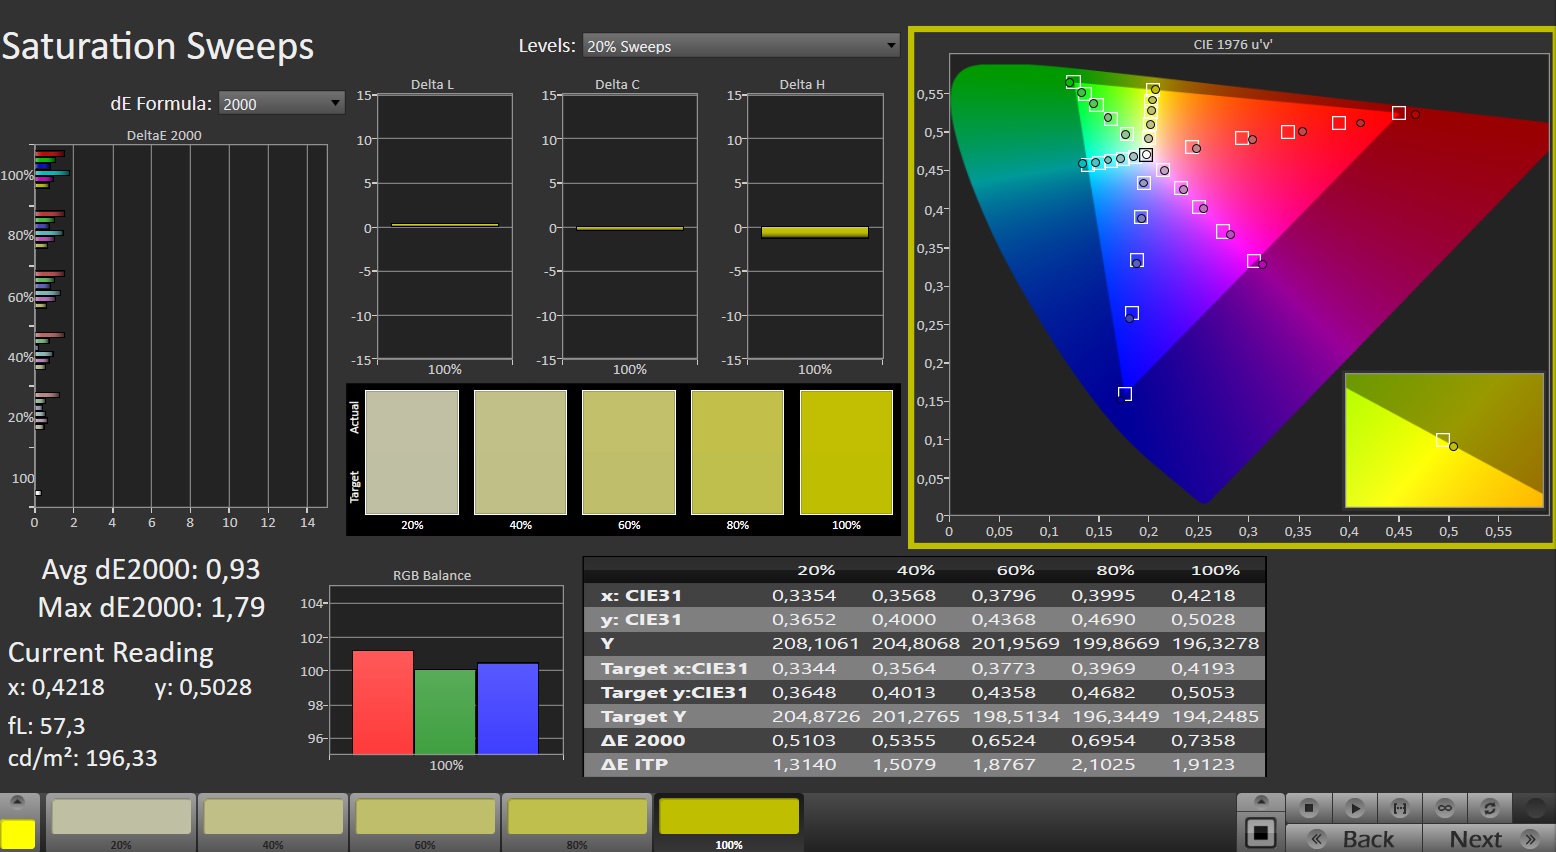
"Saygın" aynı zamanda renk kapsamı için de uygun bir tanımdır: 15 inç dizüstü bilgisayar DCI-P3 ve AdobeRGB renk alanlarını tam olarak üretemese de, neredeyse %100 sRGB kapsamına sahip olmak, 1.000 € (1.090 ABD Doları) fiyat aralığında verilen bir şey değildir Acer Nitro V 15 örneğin, yakın zamanda inceledik.
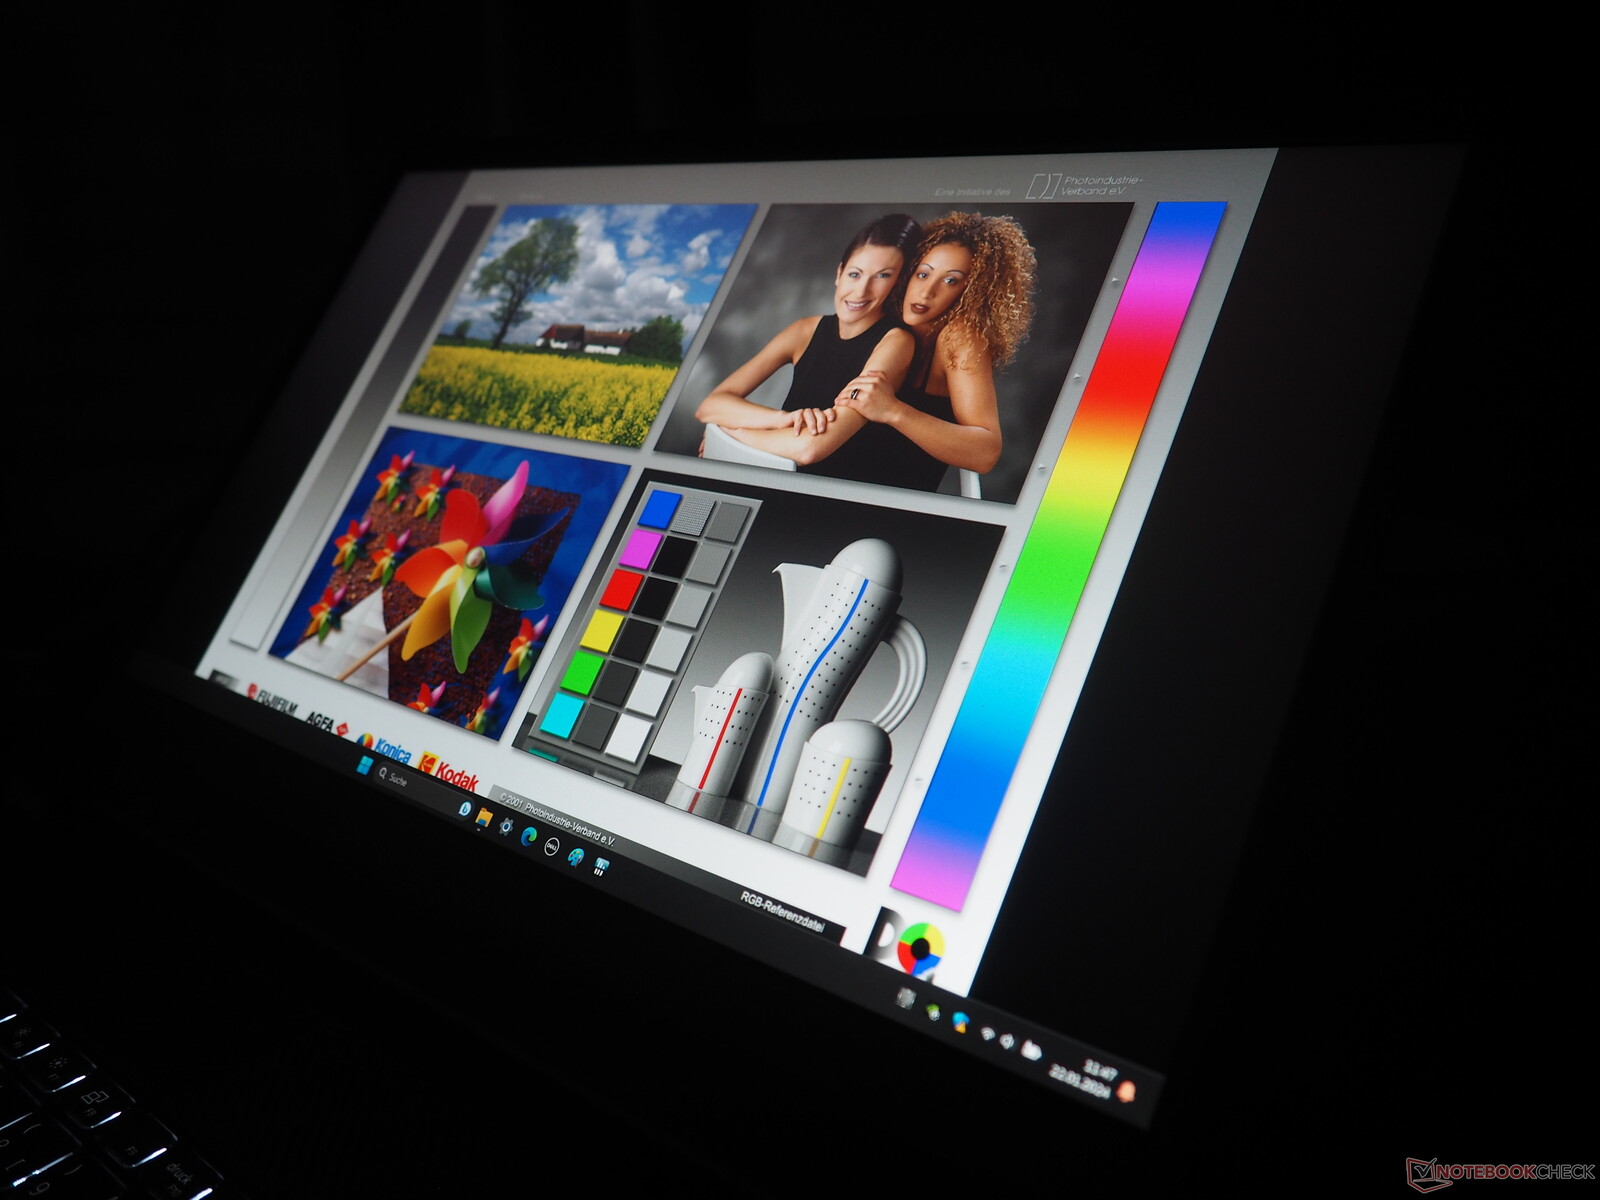
Görüş açısı bir IPS ekran için oldukça tipik, yani oldukça iyi. Çoğu alıcı renk doğruluğundan da memnun kalacaktır.
Yanıt Sürelerini Görüntüle
| ↔ Tepki Süresi Siyahtan Beyaza | ||
|---|---|---|
| 6.7 ms ... yükseliş ↗ ve sonbahar↘ birleşimi | ↗ 3.1 ms yükseliş | 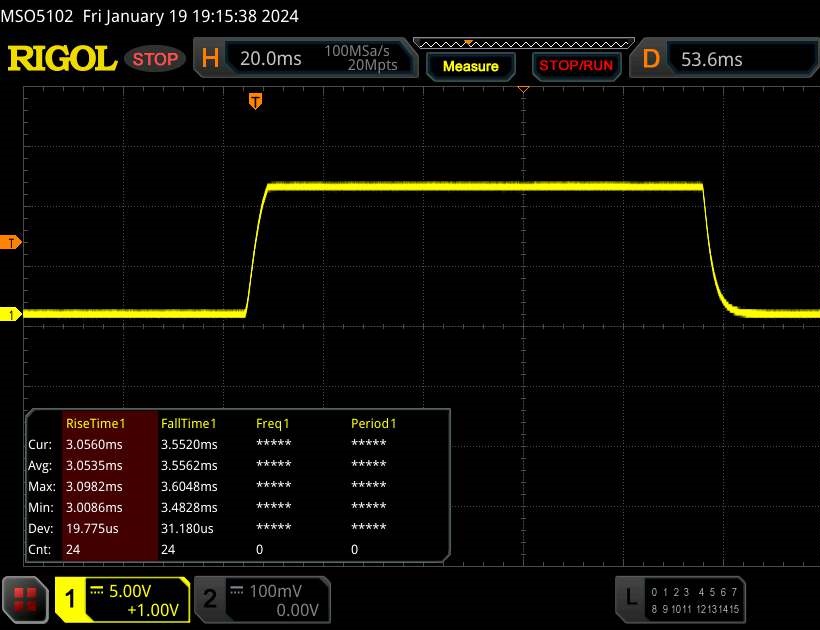 |
| ↘ 3.6 ms sonbahar | ||
| Ekran, testlerimizde çok hızlı yanıt oranları gösteriyor ve hızlı oyun oynamaya çok uygun olmalı. Karşılaştırıldığında, test edilen tüm cihazlar 0.1 (minimum) ile 240 (maksimum) ms arasında değişir. » Tüm cihazların 21 %'si daha iyi. Bu, ölçülen yanıt süresinin test edilen tüm cihazların ortalamasından (19.8 ms) daha iyi olduğu anlamına gelir. | ||
| ↔ Tepki Süresi %50 Griden %80 Griye | ||
| 8.5 ms ... yükseliş ↗ ve sonbahar↘ birleşimi | ↗ 4.2 ms yükseliş | 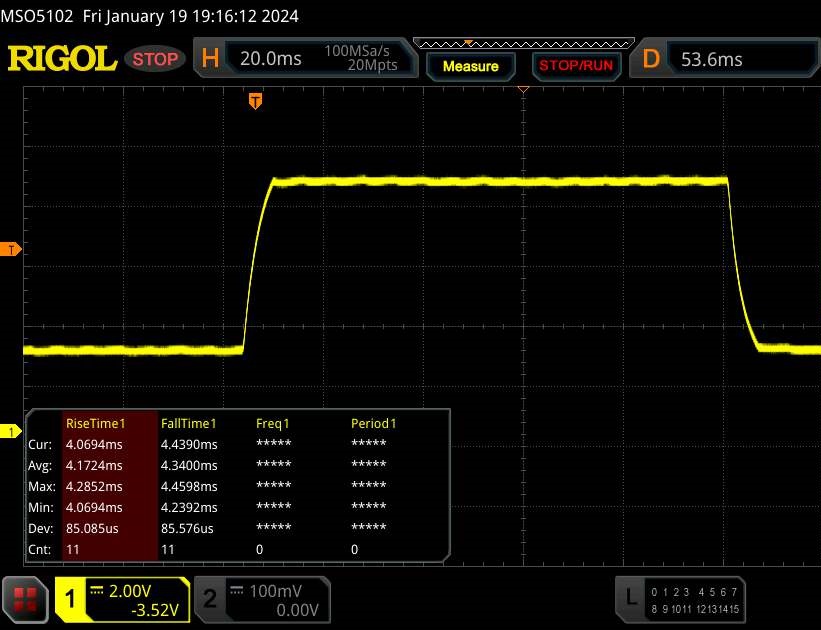 |
| ↘ 4.3 ms sonbahar | ||
| Ekran, testlerimizde hızlı yanıt oranları gösteriyor ve oyun oynamaya uygun olmalı. Karşılaştırıldığında, test edilen tüm cihazlar 0.165 (minimum) ile 636 (maksimum) ms arasında değişir. » Tüm cihazların 22 %'si daha iyi. Bu, ölçülen yanıt süresinin test edilen tüm cihazların ortalamasından (30.9 ms) daha iyi olduğu anlamına gelir. | ||
Ekran Titremesi / PWM (Darbe Genişliği Modülasyonu)
| Ekran titriyor / PWM algılanmadı | 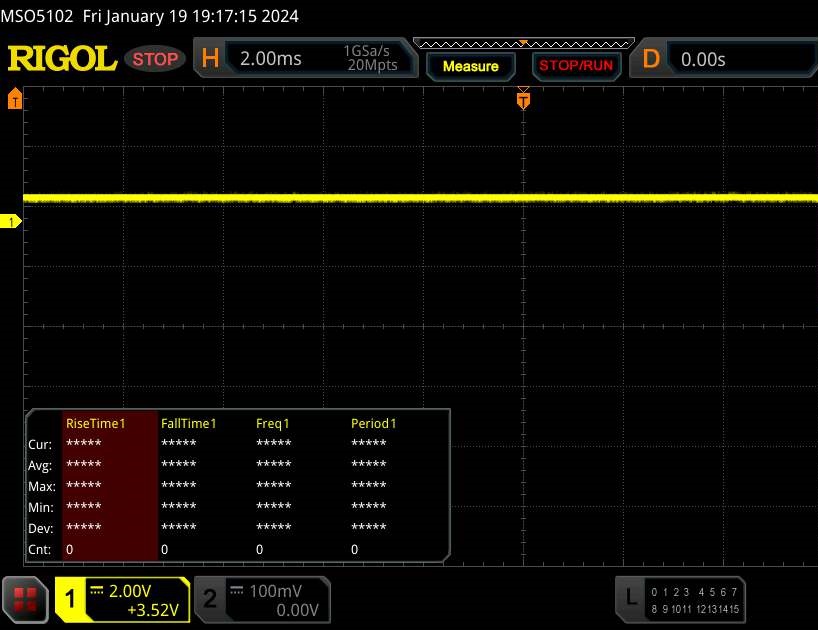 | ||
Karşılaştırıldığında: Test edilen tüm cihazların %52 %'si ekranı karartmak için PWM kullanmıyor. PWM tespit edilirse, ortalama 7741 (minimum: 5 - maksimum: 343500) Hz ölçüldü. | |||
Performans
İçinde ister RTX 4050 ister RTX 4060 olsun, Dell G15 5530 hala orta sınıf bir oyun dizüstü bilgisayarıdır. 16 GB DDR5 bellek şu anda oyun oynamak için kesinlikle yeterli; yukarıda belirtildiği gibi, biraz yetersiz olan 512 GB SSD depolama alanı daha büyük bir M.2 sürücü eklenerek genişletilebilir.
Test koşulu
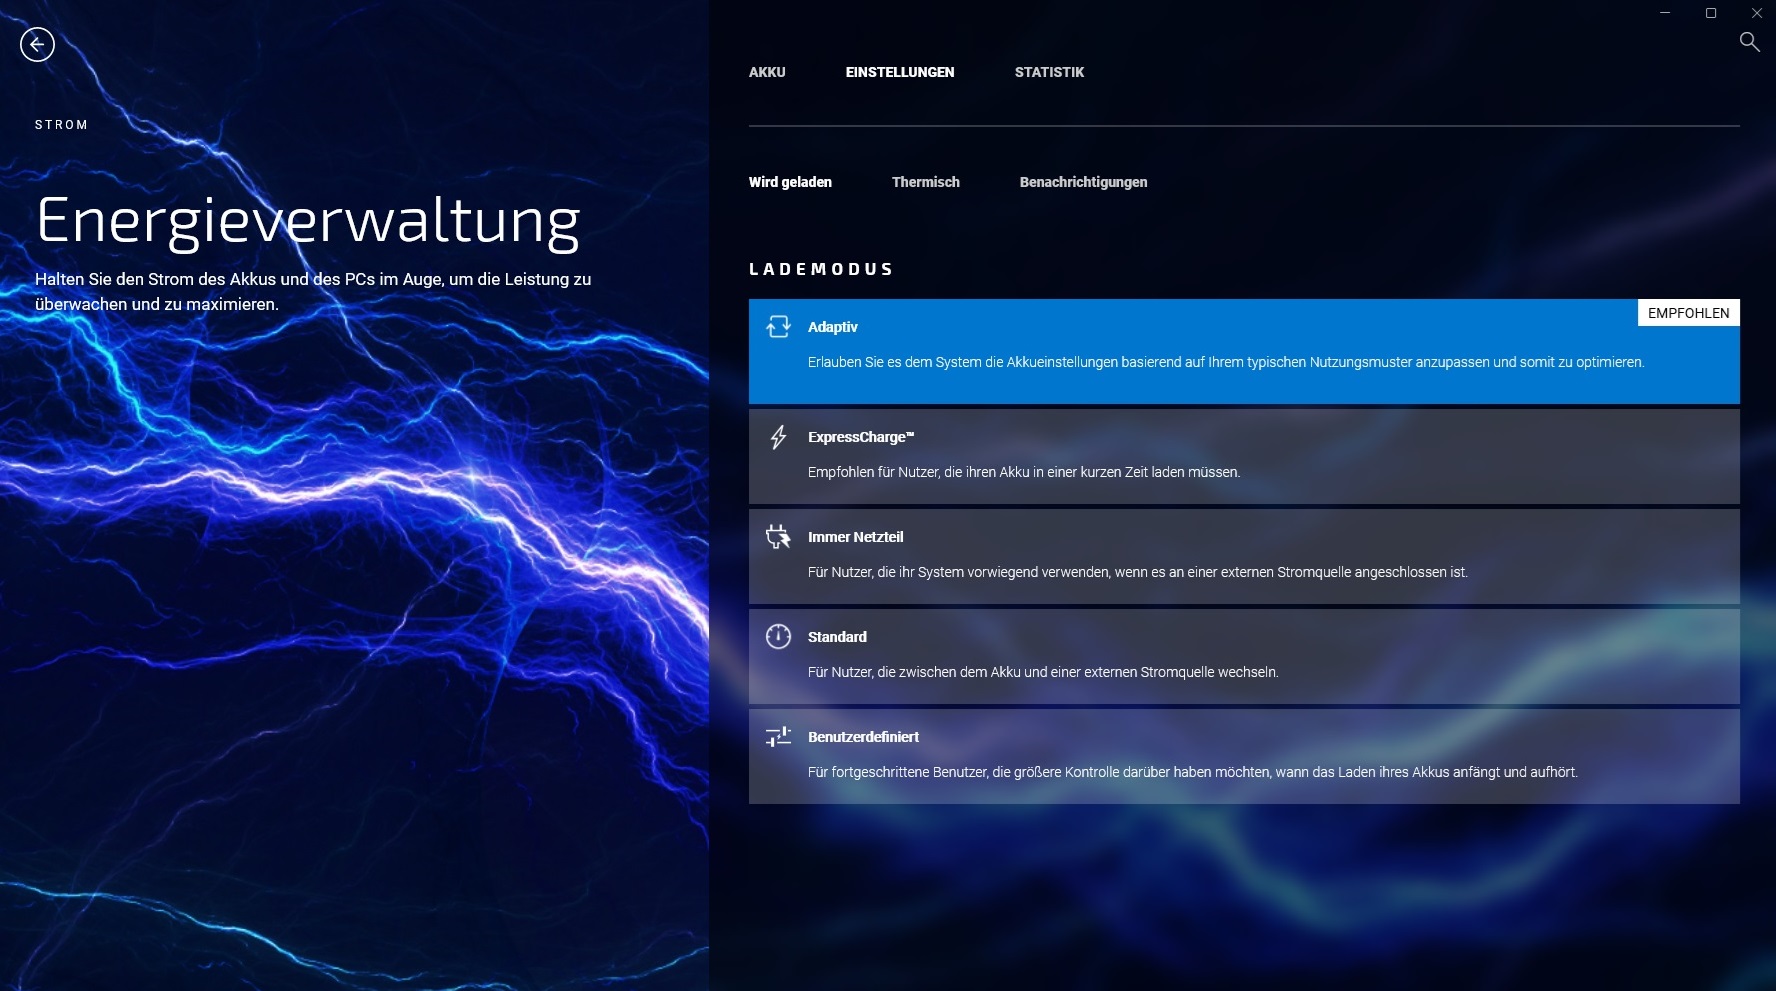
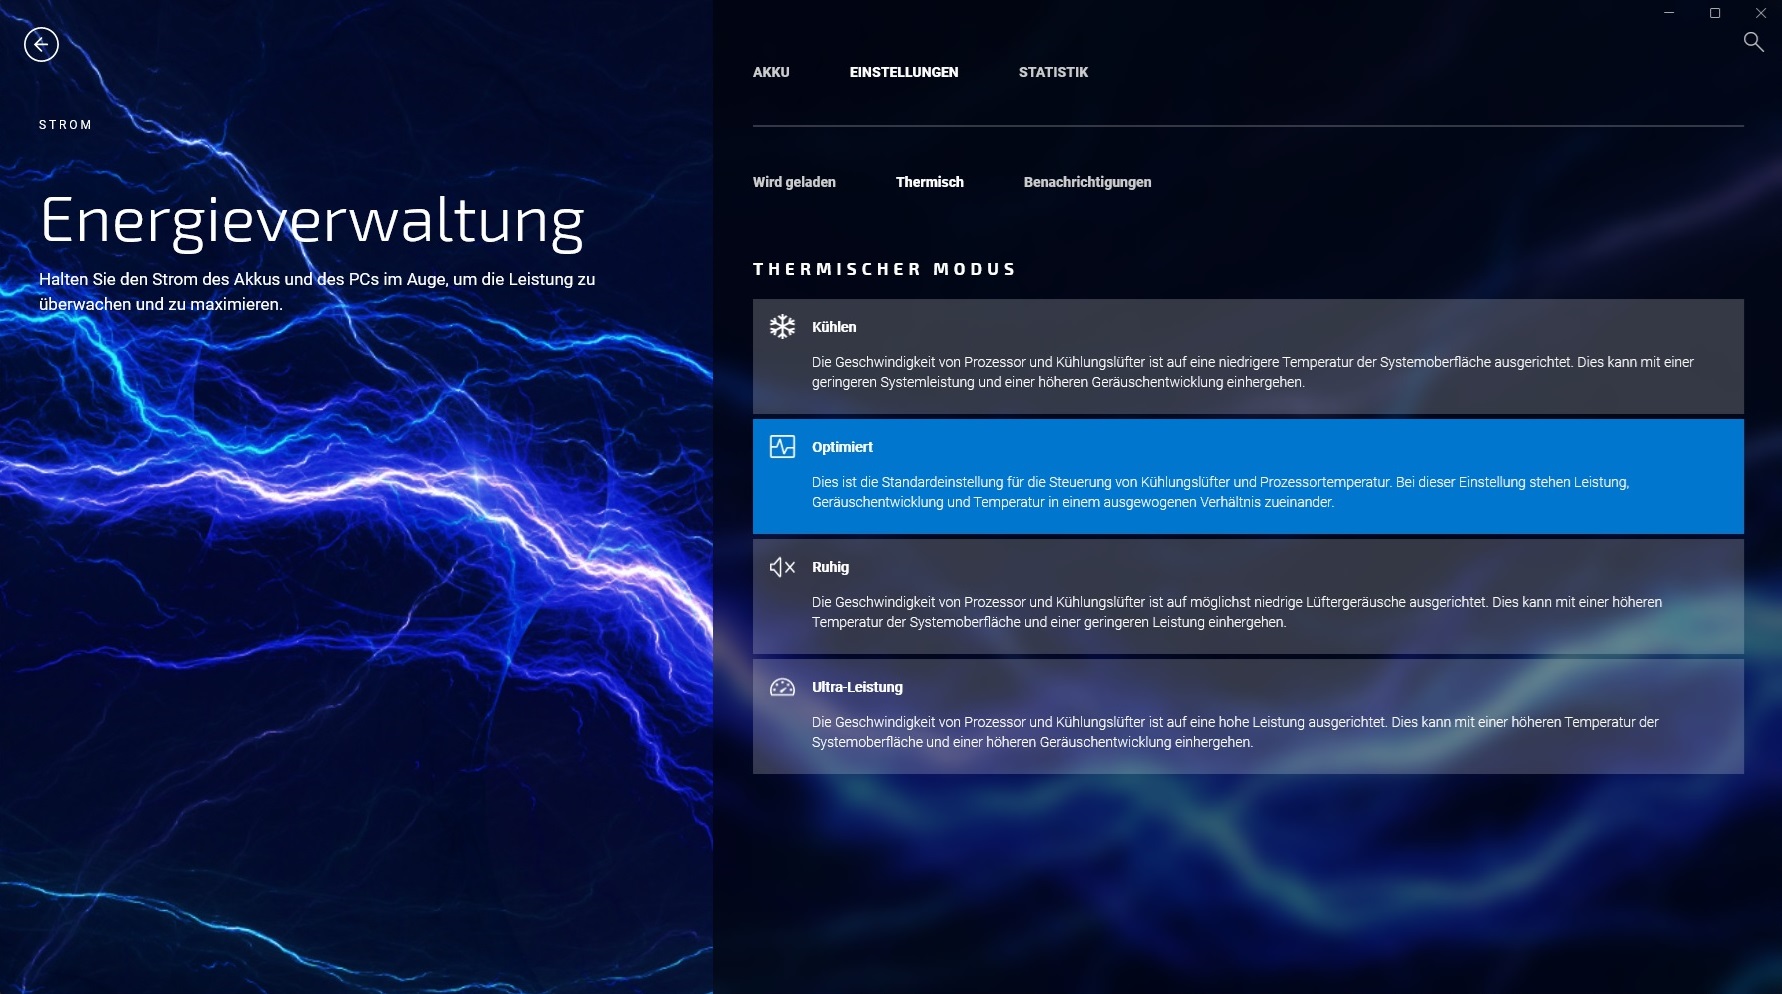
Önceden yüklenmiş Dell yazılımında çeşitli menülerin arkasına gizlenmiş birkaç güç modu vardır. Ölçümlerimize göre, bu modların 3D performansı üzerinde herhangi bir etkisi yok, daha ziyade dizüstü bilgisayarın ne kadar yüksek sesle çalıştığını etkiliyor (tabloya bakın). Bu nedenle tüm testlerimiz, kutudan çıkar çıkmaz varsayılan olarak etkinleştirilen "Optimize Edilmiş" modda gerçekleştirildi. Alternatif olarak, Alienware Komuta Merkezi de bir dizi özelleştirme seçeneği sunuyor.
| Witcher 3 (FHD/Ultra) | Sessiz | Optimize edilmiş | Soğutma | UltraPerformans |
| Gürültü | 40 - 41 dB(A) | 43 - 44 dB(A) | 46 - 47 dB(A) | 49 - 50 dB(A) |
| Performans | 84 fps | 84 fps | 84 fps | 84 fps |
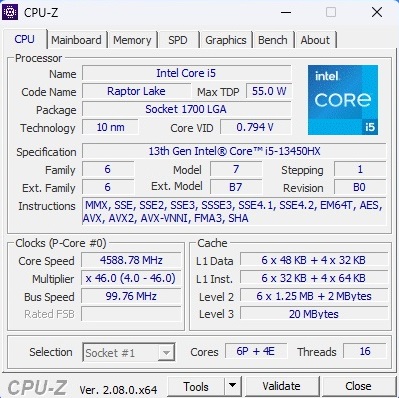
İşlemci
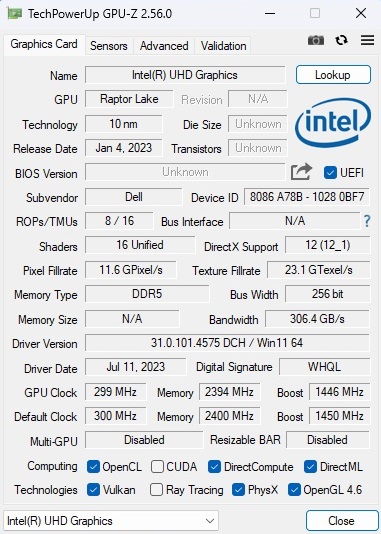
Core i7-13650HX ile karşılaştırıldığında, Core i5-13450HX sekiz verimlilik çekirdeği yerine yalnızca dörde sahiptir, ancak performans çekirdeklerinin sayısı altı olarak aynı kalır. Her iki CPU da Raptor Lake neslindendir ve geliştirilmiş 10 nm süreci kullanılarak üretilmiştir. Tüm CPU kıyaslamaları dikkate alındığında, Core i5-13450HX daha pahalı olan kardeşinden yaklaşık %15 daha yavaş ve Core i5-13500H (Medion Erazer Crawler E40) ve Core i7-13620H (Lenovo LOQ 15IRH8). Cinebench döngü testimiz sırasında skor zaman içinde biraz düştü, ancak ciddi bir performans düşüşü olmadı.
Cinebench R15 Multi Sustained Load
| CPU Performance rating - Percent | |
| Sınıf ortalaması Gaming | |
| Dell G15 5530 -2! | |
| Lenovo LOQ 15IRH8 Core i7 | |
| Ortalama Intel Core i5-13450HX | |
| Dell G15 5530, i5-13450HX RTX 4050 | |
| Medion Erazer Crawler E40 - MD 62518 | |
| Asus TUF A15 FA507 -2! | |
| HWBOT x265 Benchmark v2.2 - 4k Preset | |
| Sınıf ortalaması Gaming (11.5 - 44.4, n=102, son 2 yıl) | |
| Dell G15 5530 | |
| Ortalama Intel Core i5-13450HX (16.9 - 20.5, n=3) | |
| Medion Erazer Crawler E40 - MD 62518 | |
| Asus TUF A15 FA507 | |
| Dell G15 5530, i5-13450HX RTX 4050 | |
| Lenovo LOQ 15IRH8 Core i7 | |
| LibreOffice - 20 Documents To PDF | |
| Dell G15 5530, i5-13450HX RTX 4050 | |
| Ortalama Intel Core i5-13450HX (49.5 - 96.6, n=3) | |
| Medion Erazer Crawler E40 - MD 62518 | |
| Asus TUF A15 FA507 | |
| Sınıf ortalaması Gaming (33.2 - 88.8, n=102, son 2 yıl) | |
| Dell G15 5530 | |
| Lenovo LOQ 15IRH8 Core i7 | |
| R Benchmark 2.5 - Overall mean | |
| Asus TUF A15 FA507 | |
| Medion Erazer Crawler E40 - MD 62518 | |
| Ortalama Intel Core i5-13450HX (0.4582 - 0.4838, n=3) | |
| Dell G15 5530, i5-13450HX RTX 4050 | |
| Lenovo LOQ 15IRH8 Core i7 | |
| Dell G15 5530 | |
| Sınıf ortalaması Gaming (0.3439 - 0.59, n=102, son 2 yıl) | |
* ... daha küçük daha iyidir
AIDA64: FP32 Ray-Trace | FPU Julia | CPU SHA3 | CPU Queen | FPU SinJulia | FPU Mandel | CPU AES | CPU ZLib | FP64 Ray-Trace | CPU PhotoWorxx
| Performance rating | |
| Sınıf ortalaması Gaming | |
| Dell G15 5530 | |
| Asus TUF A15 FA507 | |
| Dell G15 5530, i5-13450HX RTX 4050 | |
| Ortalama Intel Core i5-13450HX | |
| Medion Erazer Crawler E40 - MD 62518 | |
| Lenovo LOQ 15IRH8 Core i7 | |
| AIDA64 / FP32 Ray-Trace | |
| Sınıf ortalaması Gaming (10227 - 85542, n=102, son 2 yıl) | |
| Dell G15 5530 | |
| Dell G15 5530, i5-13450HX RTX 4050 | |
| Asus TUF A15 FA507 | |
| Ortalama Intel Core i5-13450HX (13747 - 17767, n=3) | |
| Medion Erazer Crawler E40 - MD 62518 | |
| Lenovo LOQ 15IRH8 Core i7 | |
| AIDA64 / FPU Julia | |
| Sınıf ortalaması Gaming (51376 - 372155, n=102, son 2 yıl) | |
| Asus TUF A15 FA507 | |
| Dell G15 5530 | |
| Dell G15 5530, i5-13450HX RTX 4050 | |
| Ortalama Intel Core i5-13450HX (71834 - 83862, n=3) | |
| Medion Erazer Crawler E40 - MD 62518 | |
| Lenovo LOQ 15IRH8 Core i7 | |
| AIDA64 / CPU SHA3 | |
| Sınıf ortalaması Gaming (2180 - 10115, n=102, son 2 yıl) | |
| Dell G15 5530 | |
| Ortalama Intel Core i5-13450HX (3519 - 3530, n=3) | |
| Dell G15 5530, i5-13450HX RTX 4050 | |
| Medion Erazer Crawler E40 - MD 62518 | |
| Asus TUF A15 FA507 | |
| Lenovo LOQ 15IRH8 Core i7 | |
| AIDA64 / CPU Queen | |
| Sınıf ortalaması Gaming (49785 - 173351, n=86, son 2 yıl) | |
| Dell G15 5530 | |
| Asus TUF A15 FA507 | |
| Ortalama Intel Core i5-13450HX (85888 - 86148, n=3) | |
| Dell G15 5530, i5-13450HX RTX 4050 | |
| Medion Erazer Crawler E40 - MD 62518 | |
| Lenovo LOQ 15IRH8 Core i7 | |
| AIDA64 / FPU SinJulia | |
| Sınıf ortalaması Gaming (4424 - 33636, n=102, son 2 yıl) | |
| Asus TUF A15 FA507 | |
| Dell G15 5530 | |
| Ortalama Intel Core i5-13450HX (9325 - 9354, n=3) | |
| Dell G15 5530, i5-13450HX RTX 4050 | |
| Medion Erazer Crawler E40 - MD 62518 | |
| Lenovo LOQ 15IRH8 Core i7 | |
| AIDA64 / FPU Mandel | |
| Sınıf ortalaması Gaming (25115 - 196829, n=102, son 2 yıl) | |
| Asus TUF A15 FA507 | |
| Dell G15 5530 | |
| Dell G15 5530, i5-13450HX RTX 4050 | |
| Ortalama Intel Core i5-13450HX (34956 - 42825, n=3) | |
| Medion Erazer Crawler E40 - MD 62518 | |
| Lenovo LOQ 15IRH8 Core i7 | |
| AIDA64 / CPU AES | |
| Sınıf ortalaması Gaming (39258 - 247074, n=102, son 2 yıl) | |
| Dell G15 5530 | |
| Dell G15 5530, i5-13450HX RTX 4050 | |
| Ortalama Intel Core i5-13450HX (70296 - 70680, n=3) | |
| Asus TUF A15 FA507 | |
| Medion Erazer Crawler E40 - MD 62518 | |
| Lenovo LOQ 15IRH8 Core i7 | |
| AIDA64 / CPU ZLib | |
| Sınıf ortalaması Gaming (574 - 2531, n=102, son 2 yıl) | |
| Dell G15 5530 | |
| Dell G15 5530, i5-13450HX RTX 4050 | |
| Medion Erazer Crawler E40 - MD 62518 | |
| Ortalama Intel Core i5-13450HX (977 - 1002, n=3) | |
| Lenovo LOQ 15IRH8 Core i7 | |
| Asus TUF A15 FA507 | |
| AIDA64 / FP64 Ray-Trace | |
| Sınıf ortalaması Gaming (5509 - 45446, n=102, son 2 yıl) | |
| Dell G15 5530 | |
| Dell G15 5530, i5-13450HX RTX 4050 | |
| Ortalama Intel Core i5-13450HX (7428 - 9561, n=3) | |
| Asus TUF A15 FA507 | |
| Medion Erazer Crawler E40 - MD 62518 | |
| Lenovo LOQ 15IRH8 Core i7 | |
| AIDA64 / CPU PhotoWorxx | |
| Sınıf ortalaması Gaming (12271 - 89891, n=102, son 2 yıl) | |
| Dell G15 5530 | |
| Medion Erazer Crawler E40 - MD 62518 | |
| Ortalama Intel Core i5-13450HX (36014 - 36764, n=3) | |
| Dell G15 5530, i5-13450HX RTX 4050 | |
| Lenovo LOQ 15IRH8 Core i7 | |
| Asus TUF A15 FA507 | |
Sistem performansı
Karşılaştırmamızdaki tüm cihazlar sistem performansı açısından birbirine oldukça yakın. PCMark 10'da inceleme birimi, daha pahalı olan G15 modeliyle neredeyse aynı genel puanı elde etti.
CrossMark: Overall | Productivity | Creativity | Responsiveness
WebXPRT 3: Overall
WebXPRT 4: Overall
Mozilla Kraken 1.1: Total
| PCMark 10 / Score | |
| Sınıf ortalaması Gaming (5828 - 12414, n=93, son 2 yıl) | |
| Lenovo LOQ 15IRH8 Core i7 | |
| Medion Erazer Crawler E40 - MD 62518 | |
| Asus TUF A15 FA507 | |
| Dell G15 5530 | |
| Dell G15 5530, i5-13450HX RTX 4050 | |
| Ortalama Intel Core i5-13450HX, NVIDIA GeForce RTX 4050 Laptop GPU (n=1) | |
| PCMark 10 / Essentials | |
| Dell G15 5530 | |
| Lenovo LOQ 15IRH8 Core i7 | |
| Sınıf ortalaması Gaming (8810 - 11935, n=97, son 2 yıl) | |
| Asus TUF A15 FA507 | |
| Medion Erazer Crawler E40 - MD 62518 | |
| Dell G15 5530, i5-13450HX RTX 4050 | |
| Ortalama Intel Core i5-13450HX, NVIDIA GeForce RTX 4050 Laptop GPU (n=1) | |
| PCMark 10 / Productivity | |
| Sınıf ortalaması Gaming (6845 - 25323, n=95, son 2 yıl) | |
| Dell G15 5530 | |
| Lenovo LOQ 15IRH8 Core i7 | |
| Asus TUF A15 FA507 | |
| Medion Erazer Crawler E40 - MD 62518 | |
| Dell G15 5530, i5-13450HX RTX 4050 | |
| Ortalama Intel Core i5-13450HX, NVIDIA GeForce RTX 4050 Laptop GPU (n=1) | |
| PCMark 10 / Digital Content Creation | |
| Sınıf ortalaması Gaming (7602 - 19954, n=95, son 2 yıl) | |
| Lenovo LOQ 15IRH8 Core i7 | |
| Medion Erazer Crawler E40 - MD 62518 | |
| Dell G15 5530, i5-13450HX RTX 4050 | |
| Ortalama Intel Core i5-13450HX, NVIDIA GeForce RTX 4050 Laptop GPU (n=1) | |
| Asus TUF A15 FA507 | |
| Dell G15 5530 | |
| CrossMark / Overall | |
| Sınıf ortalaması Gaming (1366 - 2409, n=94, son 2 yıl) | |
| Lenovo LOQ 15IRH8 Core i7 | |
| Dell G15 5530 | |
| Medion Erazer Crawler E40 - MD 62518 | |
| Asus TUF A15 FA507 | |
| CrossMark / Productivity | |
| Sınıf ortalaması Gaming (1386 - 2254, n=94, son 2 yıl) | |
| Lenovo LOQ 15IRH8 Core i7 | |
| Dell G15 5530 | |
| Medion Erazer Crawler E40 - MD 62518 | |
| Asus TUF A15 FA507 | |
| CrossMark / Creativity | |
| Sınıf ortalaması Gaming (1343 - 2786, n=94, son 2 yıl) | |
| Dell G15 5530 | |
| Lenovo LOQ 15IRH8 Core i7 | |
| Medion Erazer Crawler E40 - MD 62518 | |
| Asus TUF A15 FA507 | |
| CrossMark / Responsiveness | |
| Lenovo LOQ 15IRH8 Core i7 | |
| Medion Erazer Crawler E40 - MD 62518 | |
| Sınıf ortalaması Gaming (1226 - 2334, n=94, son 2 yıl) | |
| Dell G15 5530 | |
| Asus TUF A15 FA507 | |
| WebXPRT 3 / Overall | |
| Sınıf ortalaması Gaming (220 - 532, n=98, son 2 yıl) | |
| Dell G15 5530 | |
| Asus TUF A15 FA507 | |
| Lenovo LOQ 15IRH8 Core i7 | |
| Dell G15 5530, i5-13450HX RTX 4050 | |
| Dell G15 5530, i5-13450HX RTX 4050 | |
| Ortalama Intel Core i5-13450HX, NVIDIA GeForce RTX 4050 Laptop GPU (281 - 281, n=2) | |
| Medion Erazer Crawler E40 - MD 62518 | |
| WebXPRT 4 / Overall | |
| Sınıf ortalaması Gaming (165 - 354, n=98, son 2 yıl) | |
| Dell G15 5530 | |
| Lenovo LOQ 15IRH8 Core i7 | |
| Medion Erazer Crawler E40 - MD 62518 | |
| Asus TUF A15 FA507 | |
| Mozilla Kraken 1.1 / Total | |
| Asus TUF A15 FA507 | |
| Dell G15 5530, i5-13450HX RTX 4050 | |
| Dell G15 5530, i5-13450HX RTX 4050 | |
| Ortalama Intel Core i5-13450HX, NVIDIA GeForce RTX 4050 Laptop GPU (531 - 531, n=2) | |
| Medion Erazer Crawler E40 - MD 62518 | |
| Dell G15 5530 | |
| Lenovo LOQ 15IRH8 Core i7 | |
| Sınıf ortalaması Gaming (391 - 590, n=100, son 2 yıl) | |
* ... daha küçük daha iyidir
| PCMark 10 Score | 6969 puan | |
Yardım | ||
| AIDA64 / Memory Copy | |
| Sınıf ortalaması Gaming (21750 - 129946, n=102, son 2 yıl) | |
| Dell G15 5530 | |
| Dell G15 5530, i5-13450HX RTX 4050 | |
| Ortalama Intel Core i5-13450HX (58673 - 58861, n=3) | |
| Medion Erazer Crawler E40 - MD 62518 | |
| Lenovo LOQ 15IRH8 Core i7 | |
| Asus TUF A15 FA507 | |
| AIDA64 / Memory Read | |
| Sınıf ortalaması Gaming (22956 - 118858, n=102, son 2 yıl) | |
| Ortalama Intel Core i5-13450HX (66626 - 69024, n=3) | |
| Dell G15 5530 | |
| Dell G15 5530, i5-13450HX RTX 4050 | |
| Medion Erazer Crawler E40 - MD 62518 | |
| Lenovo LOQ 15IRH8 Core i7 | |
| Asus TUF A15 FA507 | |
| AIDA64 / Memory Write | |
| Sınıf ortalaması Gaming (22297 - 135096, n=102, son 2 yıl) | |
| Medion Erazer Crawler E40 - MD 62518 | |
| Dell G15 5530, i5-13450HX RTX 4050 | |
| Dell G15 5530 | |
| Ortalama Intel Core i5-13450HX (58540 - 60196, n=3) | |
| Asus TUF A15 FA507 | |
| Lenovo LOQ 15IRH8 Core i7 | |
| AIDA64 / Memory Latency | |
| Lenovo LOQ 15IRH8 Core i7 | |
| Sınıf ortalaması Gaming (75.3 - 165.4, n=102, son 2 yıl) | |
| Medion Erazer Crawler E40 - MD 62518 | |
| Dell G15 5530, i5-13450HX RTX 4050 | |
| Ortalama Intel Core i5-13450HX (90 - 94.2, n=3) | |
| Dell G15 5530 | |
| Asus TUF A15 FA507 | |
* ... daha küçük daha iyidir
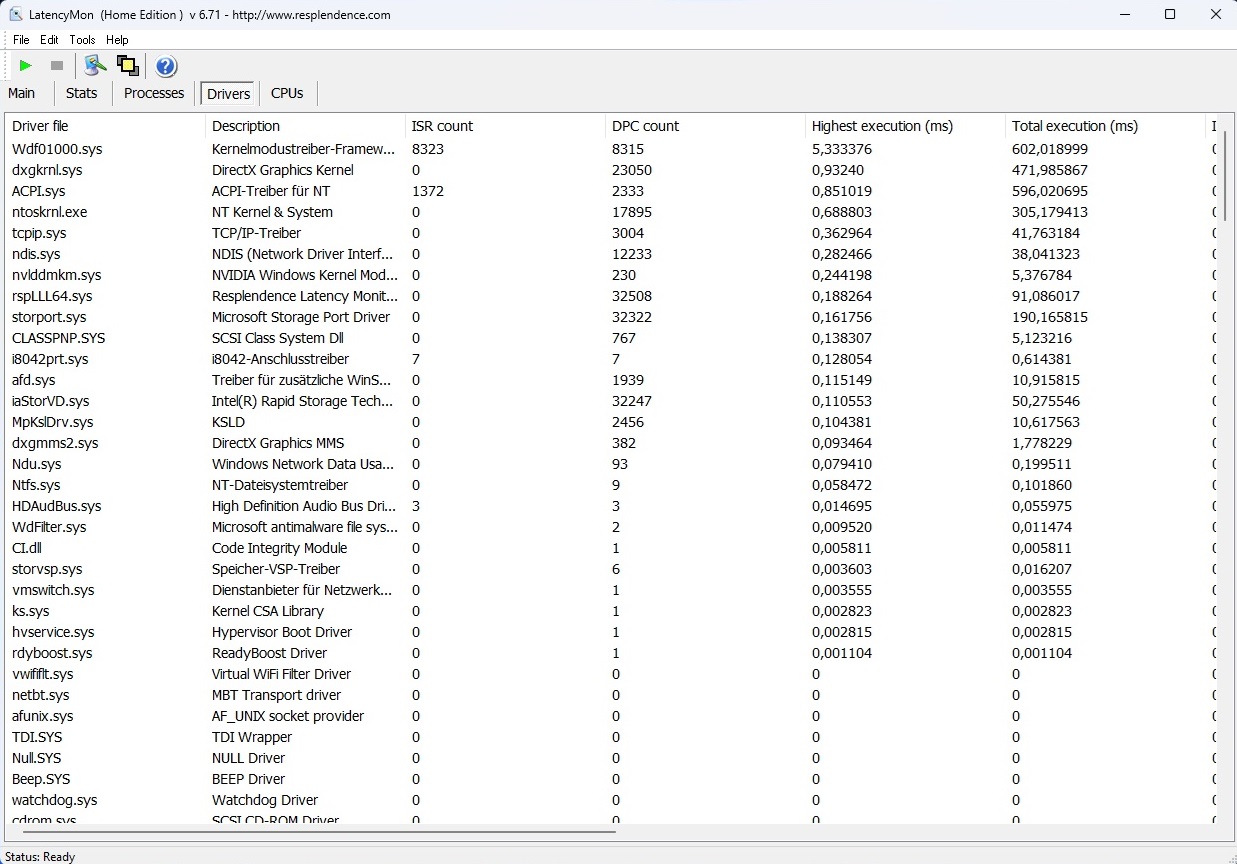
DPC gecikme süresi
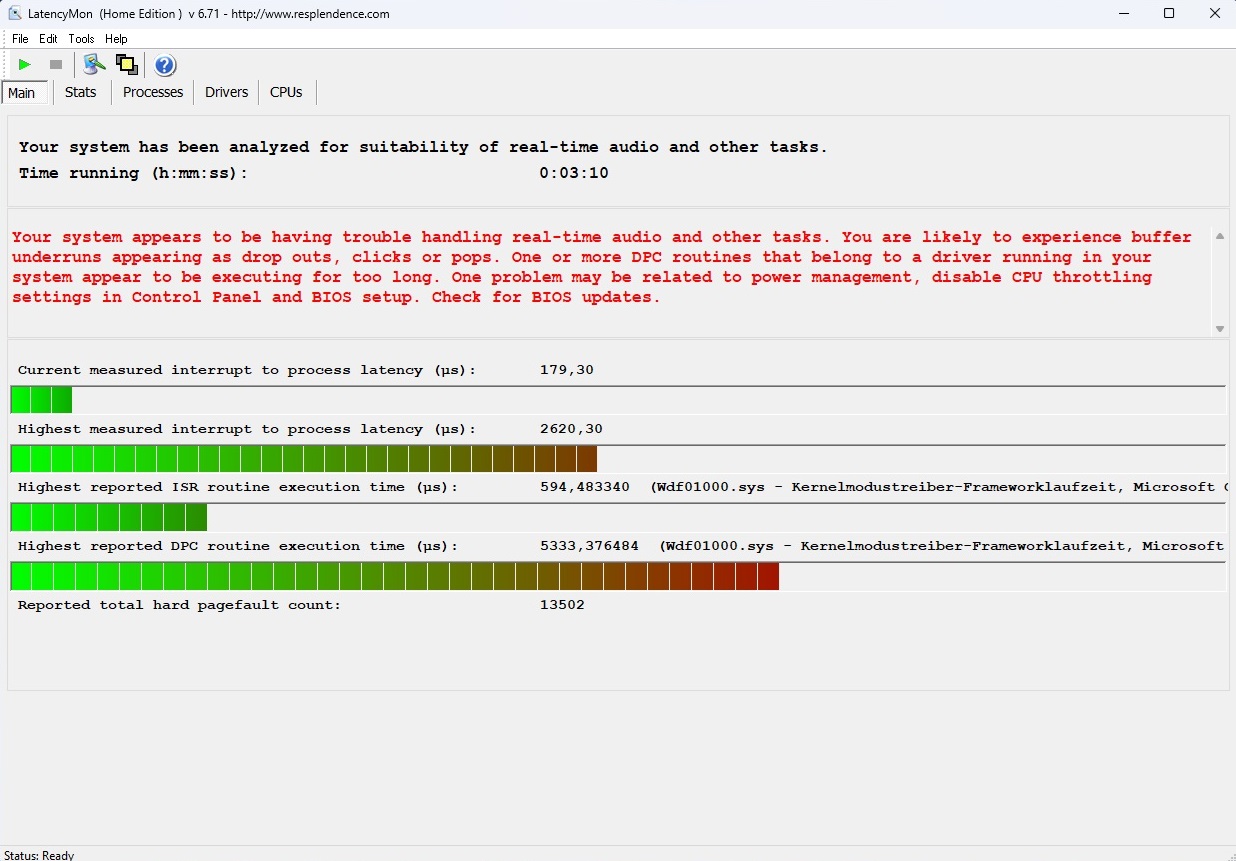
15 inçlik dizüstü bilgisayarın gecikme alanında zayıflıkları var. LatencyMon, dizüstü bilgisayarın - en azından kutudan çıkar çıkmaz - gerçek zamanlı ses ve video işlemede sorun yaşadığını bildirdi. Bununla birlikte, bu durum yalnızca dizüstü bilgisayarı bu tür amaçlar için kullanmayı düşünenleri etkilemelidir.
| DPC Latencies / LatencyMon - interrupt to process latency (max), Web, Youtube, Prime95 | |
| Dell G15 5530 | |
| Dell G15 5530, i5-13450HX RTX 4050 | |
| Medion Erazer Crawler E40 - MD 62518 | |
| Lenovo LOQ 15IRH8 Core i7 | |
* ... daha küçük daha iyidir
Yığın depolama
İlk bakışta, dizüstü bilgisayarın yığın depolama alanı mükemmel bir rakam çiziyor. Kompakt boyutuna rağmen, WDC tarafından üretilen 512 GB M.2 2230 sürücü bir dizi kıyaslamamızda son derece iyi bir performans gösterdi. Buna rağmen, döngü testimiz, sürekli yük veya stres altında sürücünün bazen rakiplerin hiçbirinde görülmeyen ciddi düzeyde bir yavaşlama yaşadığını ortaya koydu.

| Drive Performance rating - Percent | |
| Sınıf ortalaması Gaming | |
| Medion Erazer Crawler E40 - MD 62518 | |
| Dell G15 5530, i5-13450HX RTX 4050 | |
| Ortalama WD PC SN740 SDDQNQD-512G-1014 | |
| Lenovo LOQ 15IRH8 Core i7 | |
| Asus TUF A15 FA507 | |
| Dell G15 5530 | |
* ... daha küçük daha iyidir
Sustained Load Read: DiskSpd Read Loop, Queue Depth 8
Grafik kartı
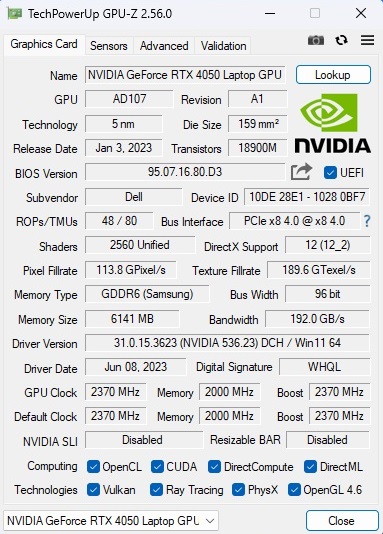
GeForce RTX 4050, Nvidia'nın Ada Lovelace serisinden popüler bir orta sınıf GPU'dur, ancak 6 GB GDDR6 video belleği ve 96 bit veri yolu günümüz standartlarına göre oldukça dardır. Gerçek performans büyük ölçüde soğutma sistemine ve belirtilen TGP'ye bağlıdır. Dell, G15 için RTX 4050 için izin verilen maksimum değere karşılık gelen 140 watt'lık bir TGP'ye karar verdi. Bu nedenle, 15 inçlik Dell dizüstü bilgisayarın 3D kıyaslamasında ortalamanın üzerinde performans göstermesi şaşırtıcı değildir, ancak bazı rakiplerin genellikle daha düşük TGP'de benzer sonuçlar elde ettiğini ve sonuç olarak daha verimli olduğunu belirtmeliyiz.
| 3DMark Performance rating - Percent | |
| Sınıf ortalaması Gaming | |
| Dell G15 5530 | |
| Medion Erazer Crawler E40 - MD 62518 | |
| Dell G15 5530, i5-13450HX RTX 4050 | |
| Lenovo LOQ 15IRH8 Core i7 | |
| Ortalama NVIDIA GeForce RTX 4050 Laptop GPU | |
| Asus TUF A15 FA507 -1! | |
| 3DMark 11 - 1280x720 Performance GPU | |
| Sınıf ortalaması Gaming (21841 - 80022, n=103, son 2 yıl) | |
| Dell G15 5530 | |
| Asus TUF A15 FA507 | |
| Medion Erazer Crawler E40 - MD 62518 | |
| Dell G15 5530, i5-13450HX RTX 4050 | |
| Lenovo LOQ 15IRH8 Core i7 | |
| Ortalama NVIDIA GeForce RTX 4050 Laptop GPU (13339 - 32642, n=41) | |
| 3DMark 11 Performance | 28326 puan | |
| 3DMark Ice Storm Standard Score | 222203 puan | |
| 3DMark Cloud Gate Standard Score | 58346 puan | |
| 3DMark Fire Strike Score | 19919 puan | |
| 3DMark Time Spy Score | 9091 puan | |
Yardım | ||
| Blender | |
| v3.3 Classroom OPTIX/RTX | |
| Dell G15 5530, i5-13450HX RTX 4050 | |
| Ortalama NVIDIA GeForce RTX 4050 Laptop GPU (25 - 37, n=40) | |
| Medion Erazer Crawler E40 - MD 62518 | |
| Asus TUF A15 FA507 | |
| Asus TUF A15 FA507 | |
| Lenovo LOQ 15IRH8 Core i7 | |
| Dell G15 5530 | |
| Sınıf ortalaması Gaming (9 - 32, n=103, son 2 yıl) | |
| v3.3 Classroom CUDA | |
| Ortalama NVIDIA GeForce RTX 4050 Laptop GPU (47 - 68, n=39) | |
| Dell G15 5530, i5-13450HX RTX 4050 | |
| Asus TUF A15 FA507 | |
| Asus TUF A15 FA507 | |
| Lenovo LOQ 15IRH8 Core i7 | |
| Medion Erazer Crawler E40 - MD 62518 | |
| Dell G15 5530 | |
| Sınıf ortalaması Gaming (15 - 228, n=103, son 2 yıl) | |
| v3.3 Classroom CPU | |
| Lenovo LOQ 15IRH8 Core i7 | |
| Ortalama NVIDIA GeForce RTX 4050 Laptop GPU (243 - 907, n=40) | |
| Dell G15 5530, i5-13450HX RTX 4050 | |
| Asus TUF A15 FA507 | |
| Asus TUF A15 FA507 | |
| Medion Erazer Crawler E40 - MD 62518 | |
| Dell G15 5530 | |
| Sınıf ortalaması Gaming (122 - 565, n=99, son 2 yıl) | |
* ... daha küçük daha iyidir
Oyun performansı
Oyun performansı, sentetik kıyaslamalarda gördüğümüze benzer. RTX 4050 genellikle çoğu modern oyunu 1080p'de ve maksimum ayarlarda sorunsuzca çalıştıracak kadar hızlıdır. Sadece çok zorlu oyunları oynarken işler zorlaşıyor, örneğin Starfield. En az bir tane almanızı öneririz GeForce RTX 4070 daha yüksek çözünürlükler (QHD veya üzeri) kullanmak istiyorsanız.
| Performance rating - Percent | |
| Sınıf ortalaması Gaming | |
| Dell G15 5530 | |
| Lenovo LOQ 15IRH8 Core i7 | |
| Dell G15 5530, i5-13450HX RTX 4050 | |
| Medion Erazer Crawler E40 - MD 62518 | |
| Ortalama NVIDIA GeForce RTX 4050 Laptop GPU | |
| Asus TUF A15 FA507 | |
| The Witcher 3 - 1920x1080 Ultra Graphics & Postprocessing (HBAO+) | |
| Sınıf ortalaması Gaming (104.7 - 240, n=7, son 2 yıl) | |
| Dell G15 5530 | |
| Lenovo LOQ 15IRH8 Core i7 | |
| Dell G15 5530, i5-13450HX RTX 4050 | |
| Asus TUF A15 FA507 | |
| Medion Erazer Crawler E40 - MD 62518 | |
| Ortalama NVIDIA GeForce RTX 4050 Laptop GPU (18.5 - 94.7, n=40) | |
| GTA V - 1920x1080 Highest AA:4xMSAA + FX AF:16x | |
| Sınıf ortalaması Gaming (67.1 - 186.9, n=90, son 2 yıl) | |
| Dell G15 5530 | |
| Medion Erazer Crawler E40 - MD 62518 | |
| Dell G15 5530, i5-13450HX RTX 4050 | |
| Lenovo LOQ 15IRH8 Core i7 | |
| Asus TUF A15 FA507 | |
| Ortalama NVIDIA GeForce RTX 4050 Laptop GPU (14.9 - 101.7, n=35) | |
| Final Fantasy XV Benchmark - 1920x1080 High Quality | |
| Sınıf ortalaması Gaming (64.2 - 215, n=91, son 2 yıl) | |
| Dell G15 5530 | |
| Medion Erazer Crawler E40 - MD 62518 | |
| Dell G15 5530, i5-13450HX RTX 4050 | |
| Lenovo LOQ 15IRH8 Core i7 | |
| Asus TUF A15 FA507 | |
| Ortalama NVIDIA GeForce RTX 4050 Laptop GPU (15.5 - 122.3, n=39) | |
| Strange Brigade - 1920x1080 ultra AA:ultra AF:16 | |
| Sınıf ortalaması Gaming (113.6 - 458, n=83, son 2 yıl) | |
| Dell G15 5530 | |
| Lenovo LOQ 15IRH8 Core i7 | |
| Asus TUF A15 FA507 | |
| Medion Erazer Crawler E40 - MD 62518 | |
| Dell G15 5530, i5-13450HX RTX 4050 | |
| Ortalama NVIDIA GeForce RTX 4050 Laptop GPU (21.2 - 156.6, n=38) | |
| Dota 2 Reborn - 1920x1080 ultra (3/3) best looking | |
| Lenovo LOQ 15IRH8 Core i7 | |
| Sınıf ortalaması Gaming (84.8 - 252, n=104, son 2 yıl) | |
| Dell G15 5530, i5-13450HX RTX 4050 | |
| Dell G15 5530 | |
| Medion Erazer Crawler E40 - MD 62518 | |
| Ortalama NVIDIA GeForce RTX 4050 Laptop GPU (73.5 - 175.6, n=39) | |
| Asus TUF A15 FA507 | |
| X-Plane 11.11 - 1920x1080 high (fps_test=3) | |
| Dell G15 5530 | |
| Lenovo LOQ 15IRH8 Core i7 | |
| Dell G15 5530, i5-13450HX RTX 4050 | |
| Sınıf ortalaması Gaming (55.5 - 148.5, n=106, son 2 yıl) | |
| Medion Erazer Crawler E40 - MD 62518 | |
| Ortalama NVIDIA GeForce RTX 4050 Laptop GPU (55.5 - 117, n=40) | |
| Asus TUF A15 FA507 | |
| Lies of P - 1920x1080 Best Preset | |
| XMG Focus 15 E23 | |
| Ortalama NVIDIA GeForce RTX 4050 Laptop GPU (101.4 - 105.7, n=3) | |
| Dell G15 5530, i5-13450HX RTX 4050 | |
| The Crew Motorfest - 1920x1080 Ultra Preset | |
| XMG Focus 15 E23 | |
| Dell G15 5530, i5-13450HX RTX 4050 | |
| Ortalama NVIDIA GeForce RTX 4050 Laptop GPU (59 - 59, n=3) | |
| Starfield - 1920x1080 Ultra Preset | |
| Sınıf ortalaması Gaming (n=1son 2 yıl) | |
| Dell G15 5530, i5-13450HX RTX 4050 | |
| Ortalama NVIDIA GeForce RTX 4050 Laptop GPU (35.7 - 37.3, n=3) | |
| XMG Focus 15 E23 | |
| Armored Core 6 - 1920x1080 Maximum Preset | |
| XMG Focus 15 E23 | |
| Ortalama NVIDIA GeForce RTX 4050 Laptop GPU (79 - 87.8, n=3) | |
| Dell G15 5530, i5-13450HX RTX 4050 | |
| Sınıf ortalaması Gaming (n=1son 2 yıl) | |
| Atlas Fallen - 1920x1080 Very High Preset | |
| Ortalama NVIDIA GeForce RTX 4050 Laptop GPU (81.1 - 94.2, n=3) | |
| Dell G15 5530, i5-13450HX RTX 4050 | |
| XMG Focus 15 E23 | |
| Baldur's Gate 3 - 1920x1080 Ultra Preset AA:T | |
| Sınıf ortalaması Gaming (59.4 - 246, n=104, son 2 yıl) | |
| XMG Focus 15 E23 | |
| Dell G15 5530, i5-13450HX RTX 4050 | |
| Ortalama NVIDIA GeForce RTX 4050 Laptop GPU (48.3 - 81.3, n=11) | |
| Ratchet & Clank Rift Apart - 1920x1080 Very High Preset AA:T | |
| XMG Focus 15 E23 | |
| Ortalama NVIDIA GeForce RTX 4050 Laptop GPU (32.9 - 45.8, n=3) | |
| Dell G15 5530, i5-13450HX RTX 4050 | |
| Resident Evil 4 Remake - 1920x1080 Max Preset | |
| Dell G15 5530, i5-13450HX RTX 4050 | |
| Ortalama NVIDIA GeForce RTX 4050 Laptop GPU (36.8 - 53.9, n=2) | |
| XMG Focus 15 E23 | |
Biz kullandık Bu Witcher 3 (yaklaşık 60 dakika boyunca FHD/Ultra'da çalıştırarak) her bir dizüstü bilgisayarın 3D uygulamalarda uzun bir süre boyunca nasıl performans gösterdiğini öğrenmek için. Sonuç: kare hızları G15 5530'da oldukça tutarlı kaldı.
Witcher 3 FPS chart
| düşük | orta | yüksek | ultra | |
|---|---|---|---|---|
| GTA V (2015) | 178 | 168.6 | 96.6 | |
| The Witcher 3 (2015) | 84 | |||
| Dota 2 Reborn (2015) | 170 | 156.1 | 154.1 | 146.8 |
| Final Fantasy XV Benchmark (2018) | 120.3 | 84.1 | ||
| X-Plane 11.11 (2018) | 153.1 | 139.6 | 108.5 | |
| Strange Brigade (2018) | 203 | 171.4 | 145.1 | |
| Company of Heroes 3 (2023) | 127 | 70.2 | 68.7 | |
| Resident Evil 4 Remake (2023) | 88.6 | 80.9 | 53.9 | |
| Ratchet & Clank Rift Apart (2023) | 67.7 | 40.2 | 32.9 | |
| Atlas Fallen (2023) | 114.3 | 104.1 | 83.3 | |
| Armored Core 6 (2023) | 103.8 | 96.7 | 79 | |
| Starfield (2023) | 55.9 | 43.7 | 37.3 | |
| The Crew Motorfest (2023) | 60 | 60 | 59 | |
| Lies of P (2023) | 132.8 | 113.3 | 101.4 | |
| Baldur's Gate 3 (2023) | 84.4 | 71.3 | 69.3 |
Emisyonlar
Gürültü emisyonları
Dell G15 5530 boştayken çoğunlukla güzel ve sessiz kalır. Fanlar ya tamamen hareketsiz ya da makul bir gürültü seviyesinde çalışıyor. Oldukça nadiren hızlanırlar, ancak bu, video oynatma ve web'de gezinme gibi günlük görevler sırasında daha sık meydana gelebilir. Bununla birlikte, "Optimize" modda oyun oynarken ortaya çıkan gürültü miktarı yaklaşık 44 dB(A) ile bir RTX 4050 dizüstü bilgisayar için ortalamanın altında.
Ses yüksekliği
| Boşta |
| 25 / 26 / 30 dB |
| Çalışırken |
| 38 / 50 dB |
 | ||
30 dB sessiz 40 dB(A) duyulabilirlik 50 dB(A) gürültülü |
||
min: | ||
| Dell G15 5530, i5-13450HX RTX 4050 GeForce RTX 4050 Laptop GPU, i5-13450HX | Medion Erazer Crawler E40 - MD 62518 GeForce RTX 4050 Laptop GPU, i5-13500H | Lenovo LOQ 15IRH8 Core i7 GeForce RTX 4050 Laptop GPU, i7-13620H | Asus TUF A15 FA507 GeForce RTX 4050 Laptop GPU, R7 7735HS | Dell G15 5530 GeForce RTX 4060 Laptop GPU, i7-13650HX | |
|---|---|---|---|---|---|
| Noise | -4% | -8% | 12% | 6% | |
| kapalı / ortam * (dB) | 25 | 23 8% | 23.69 5% | 23.3 7% | 20.41 18% |
| Idle Minimum * (dB) | 25 | 23 8% | 29.03 -16% | 23.3 7% | 26.85 -7% |
| Idle Average * (dB) | 26 | 23 12% | 29.03 -12% | 23.3 10% | 26.85 -3% |
| Idle Maximum * (dB) | 30 | 28.02 7% | 29.03 3% | 23.3 22% | 26.85 10% |
| Load Average * (dB) | 38 | 50.21 -32% | 48.7 -28% | 29.6 22% | 27.65 27% |
| Witcher 3 ultra * (dB) | 44 | 51.46 -17% | 48.5 -10% | 43 2% | 47.9 -9% |
| Load Maximum * (dB) | 50 | 56.79 -14% | 48.7 3% | 43 14% | 47.86 4% |
* ... daha küçük daha iyidir
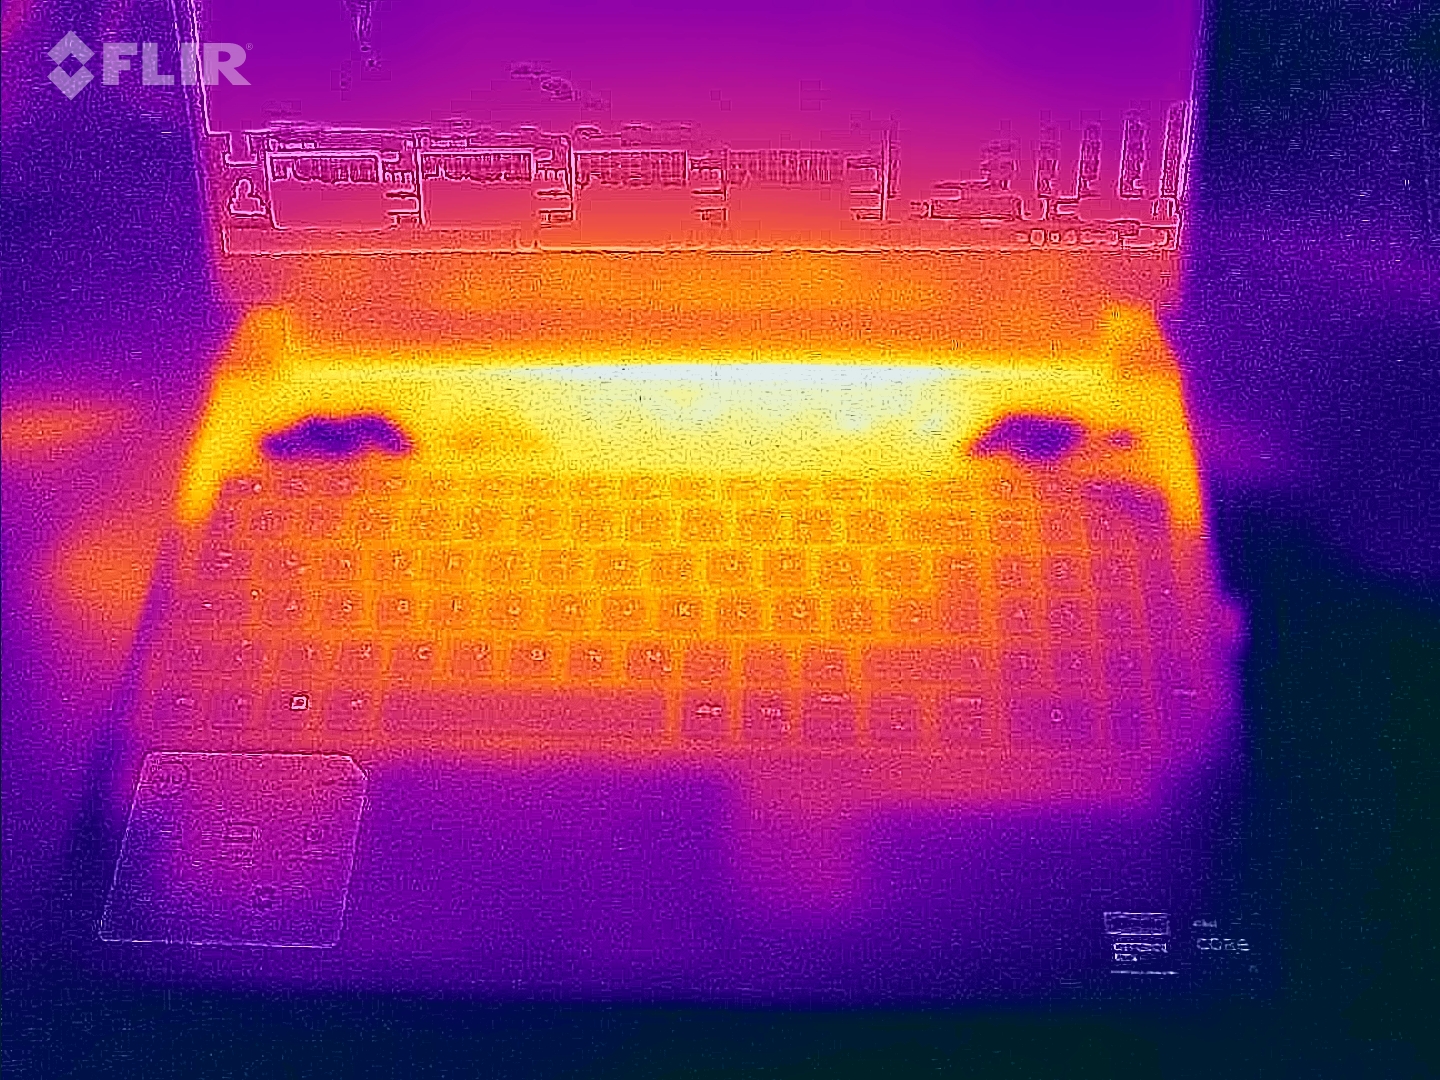
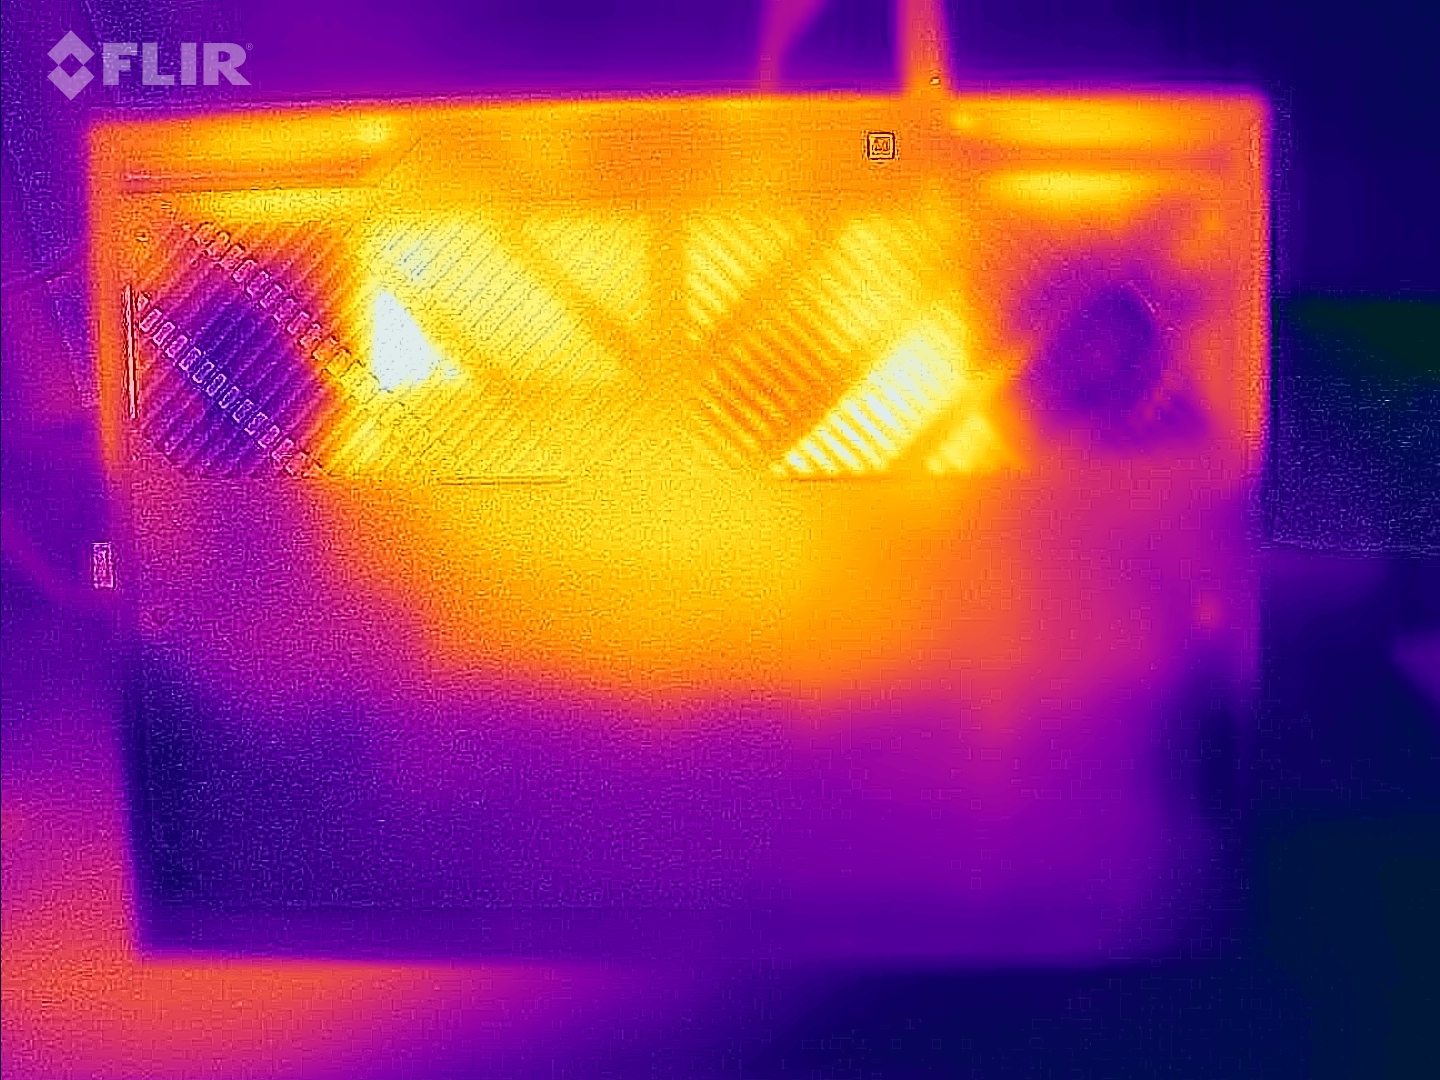
Sıcaklık
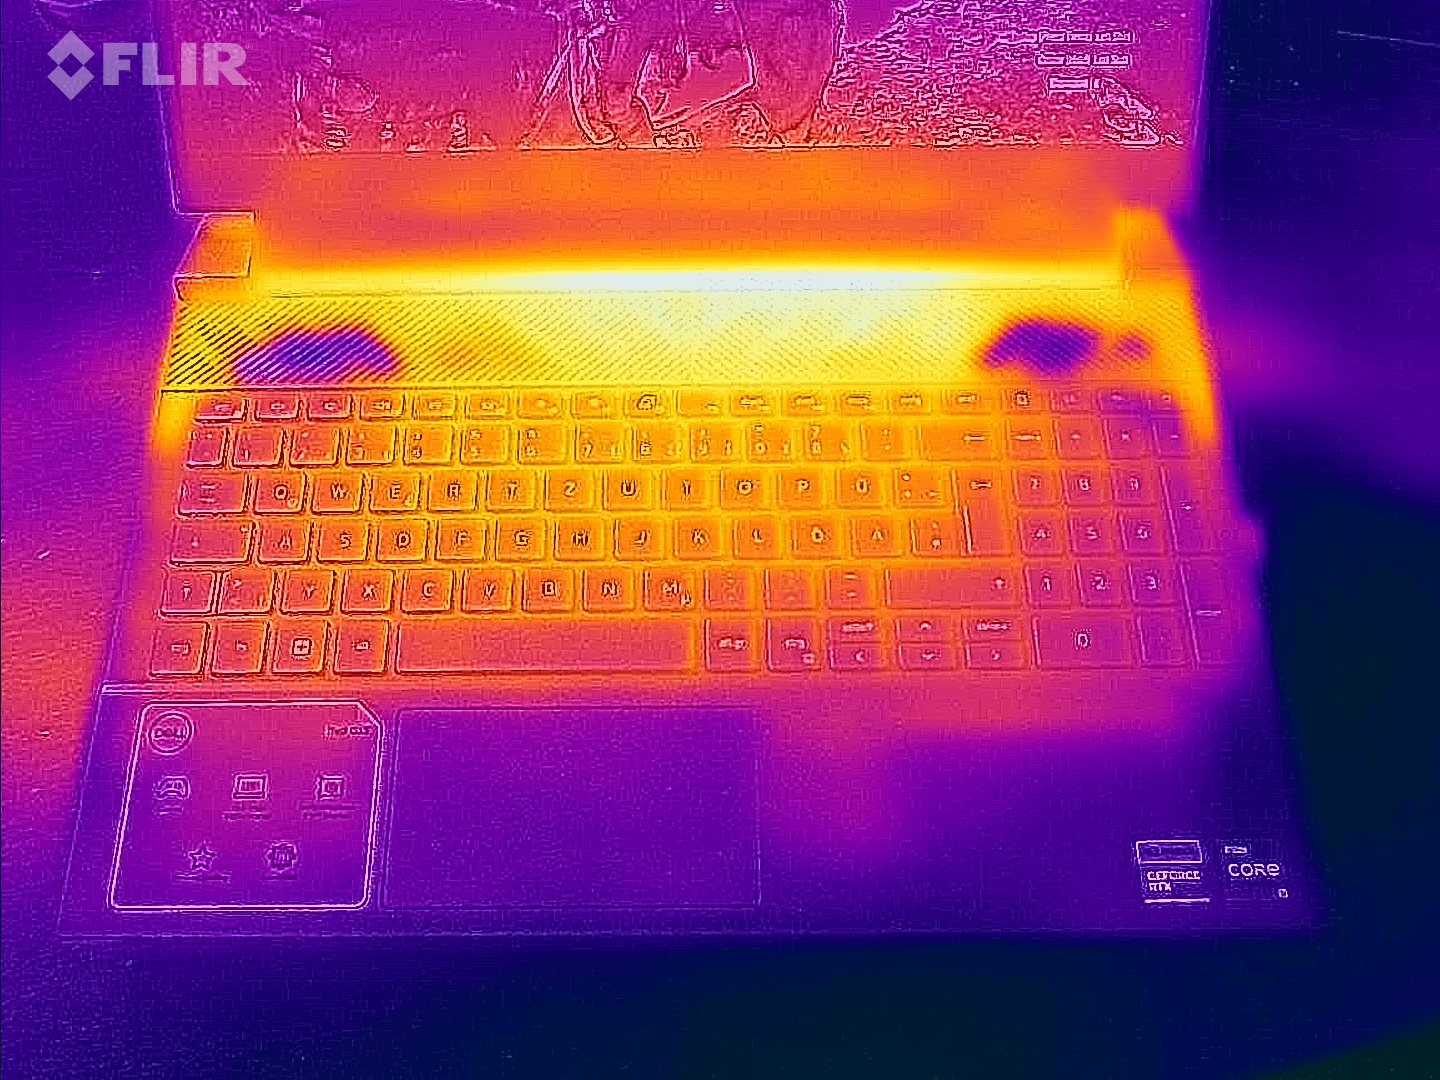
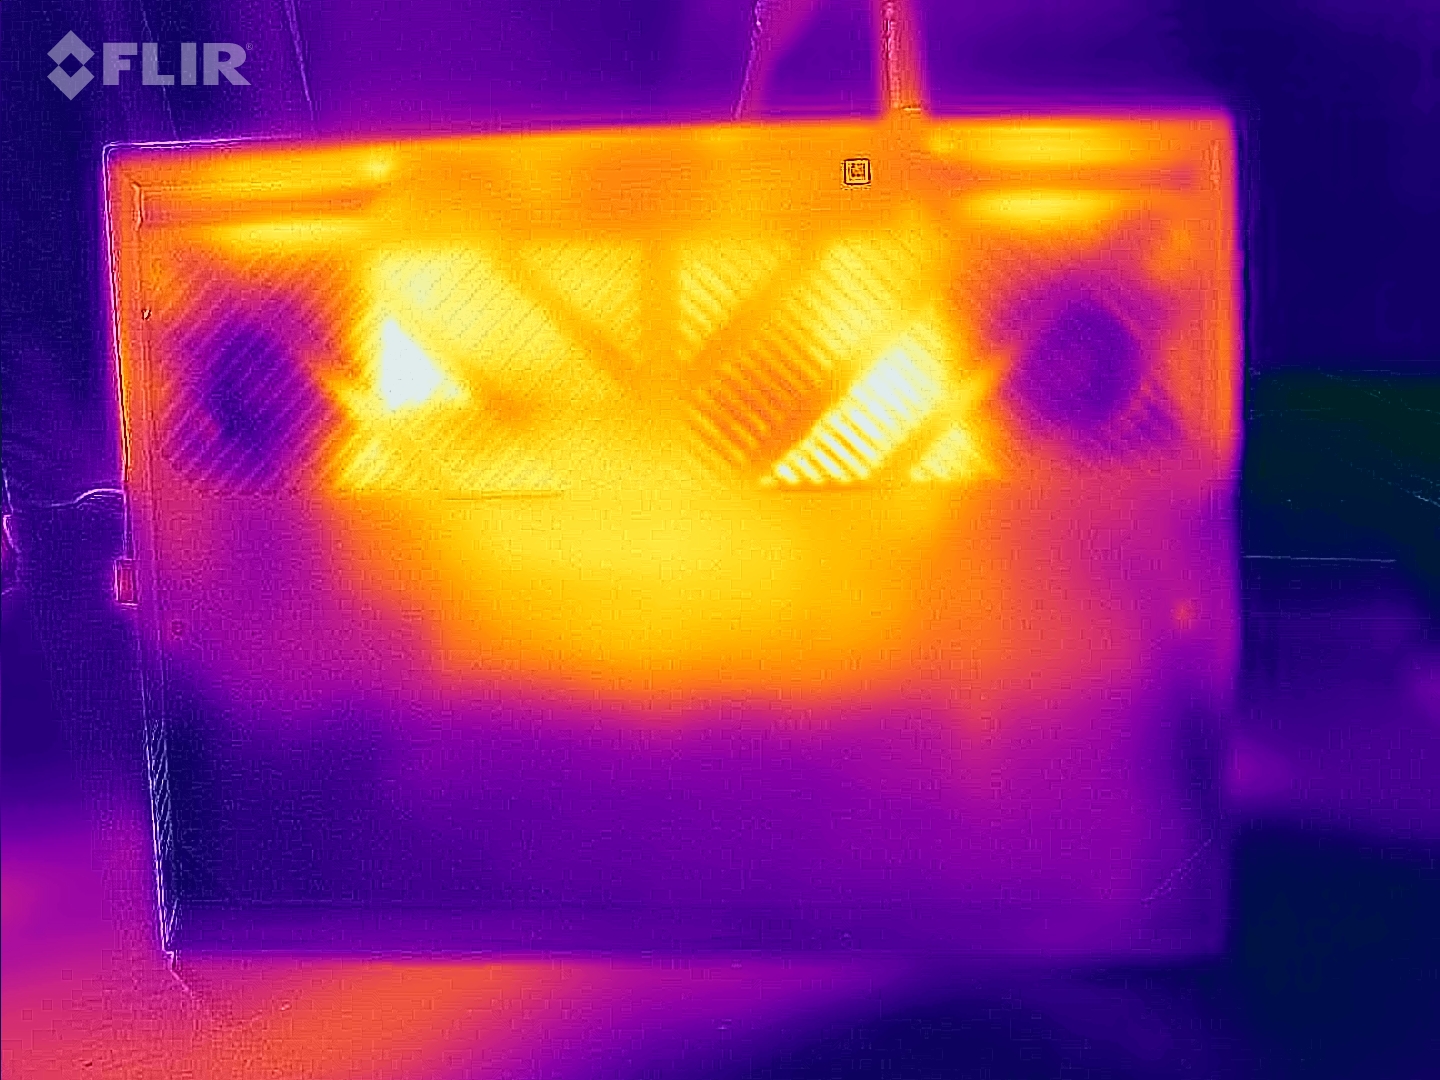
Ortalama olarak, kasa sıcaklıkları daha pahalı olan G15 modelinden biraz daha düşüktür. The Witcher 3'u 60 dakika çalıştırdıktan sonra, klavye güvertesinde ve alt panelde ölçülen maksimum sıcaklıklar sırasıyla 54°C (129,4°F) ve 52°C (125,6°F) olup teoride oldukça yüksektir. Bununla birlikte, avuç içi dayanağı hiçbir zaman 32°C'den (89,6°F) daha fazla ısınmadığından, cihazı kucağınıza koymamanız koşuluyla, daha uzun oyun oturumları pek sorun olmayacaktır.
(-) Üst taraftaki maksimum sıcaklık, 40.4 °C / 105 F ortalamasına kıyasla 58 °C / 136 F'dir. , Gaming sınıfı için 21.2 ile 68.8 °C arasında değişir.
(-) Alt kısım, 43.2 °C / 110 F ortalamasına kıyasla maksimum 57 °C / 135 F'ye kadar ısınır
(+) Boşta kullanımda, üst tarafın ortalama sıcaklığı 26 °C / 79 F olup, cihazın 33.9 °C / 93 F.
(-) The Witcher 3 oynarken, üst tarafın ortalama sıcaklığı 41.7 °C / 107 F olup, cihazın 33.9 °C / 93 F.
(+) Avuç içi dayanakları ve dokunmatik yüzey maksimum (32 °C / 89.6 F) cilt sıcaklığına ulaşıyor ve bu nedenle sıcak değil.
(-) Benzer cihazların avuç içi dayanağı alanının ortalama sıcaklığı 28.8 °C / 83.8 F (-3.2 °C / -5.8 F) idi.
| Dell G15 5530, i5-13450HX RTX 4050 GeForce RTX 4050 Laptop GPU, i5-13450HX | Medion Erazer Crawler E40 - MD 62518 GeForce RTX 4050 Laptop GPU, i5-13500H | Lenovo LOQ 15IRH8 Core i7 GeForce RTX 4050 Laptop GPU, i7-13620H | Asus TUF A15 FA507 GeForce RTX 4050 Laptop GPU, R7 7735HS | Dell G15 5530 GeForce RTX 4060 Laptop GPU, i7-13650HX | |
|---|---|---|---|---|---|
| Heat | 24% | -6% | 13% | -7% | |
| Maximum Upper Side * (°C) | 58 | 36 38% | 46.4 20% | 48.9 16% | 54 7% |
| Maximum Bottom * (°C) | 57 | 36 37% | 59.2 -4% | 44.6 22% | 62.2 -9% |
| Idle Upper Side * (°C) | 30 | 26 13% | 34.4 -15% | 27.1 10% | 33.4 -11% |
| Idle Bottom * (°C) | 29 | 27 7% | 36.2 -25% | 27.5 5% | 33.4 -15% |
* ... daha küçük daha iyidir
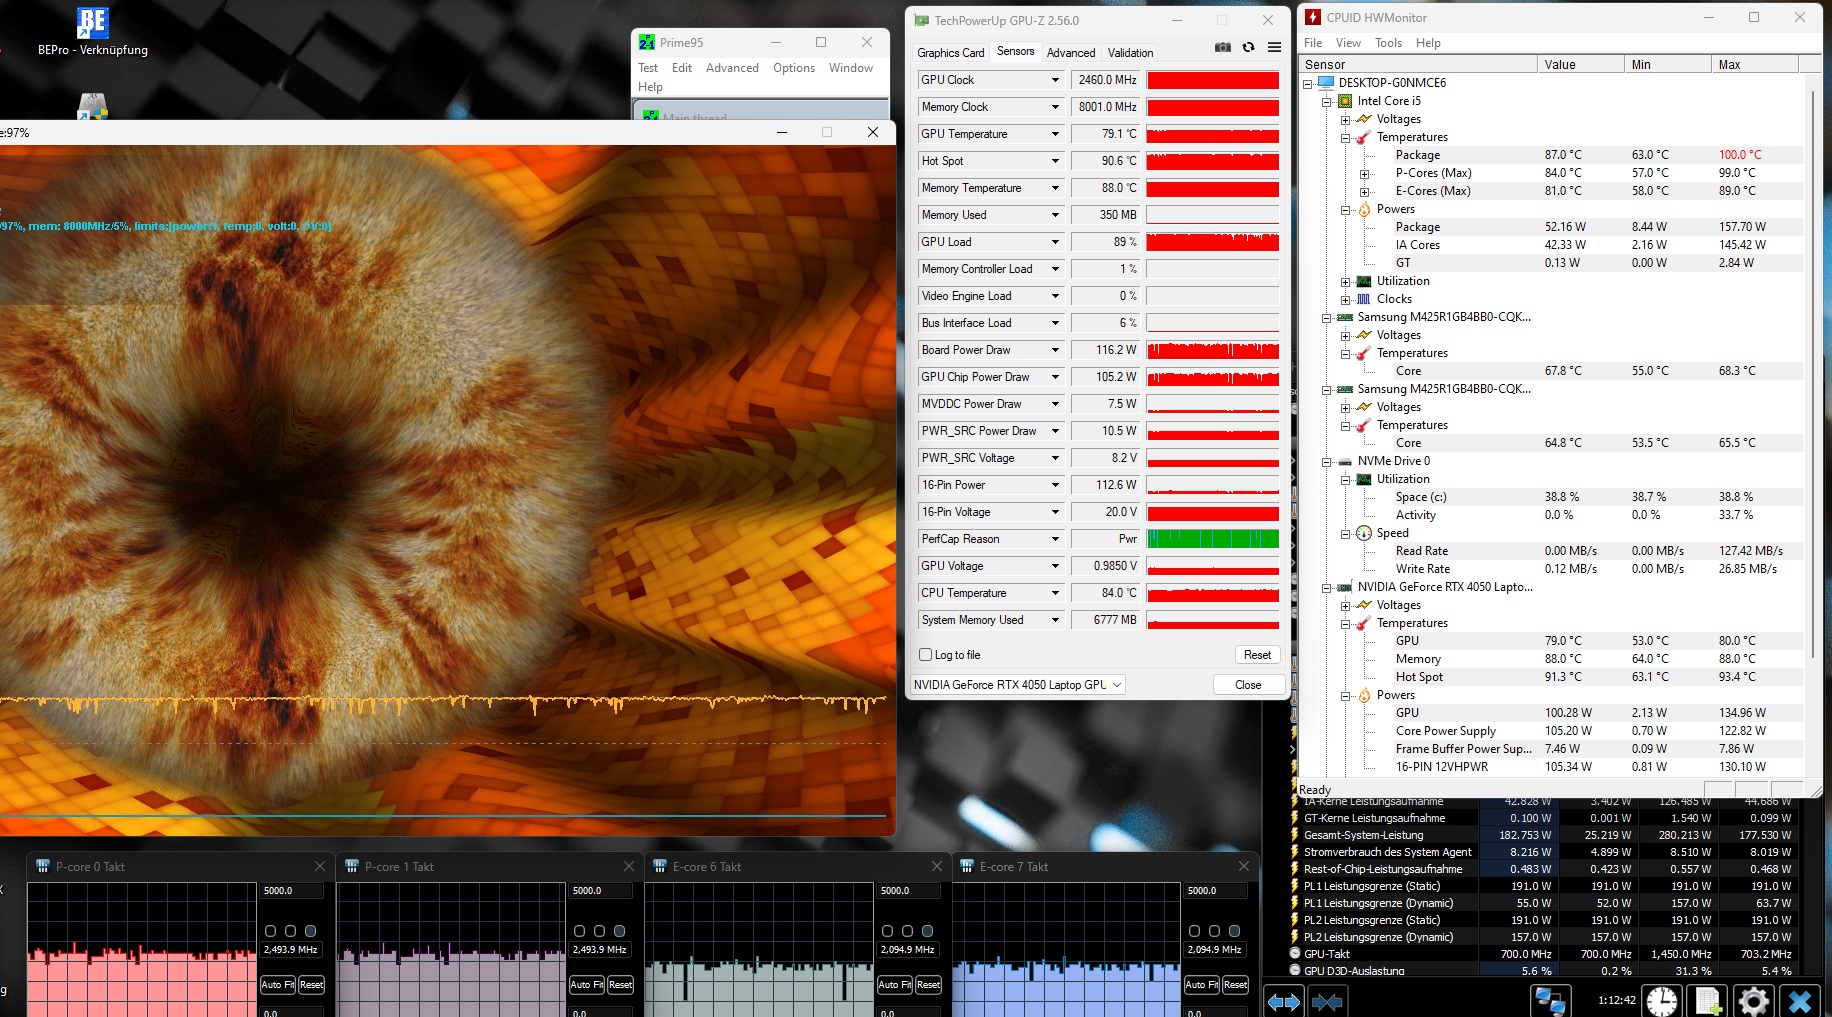
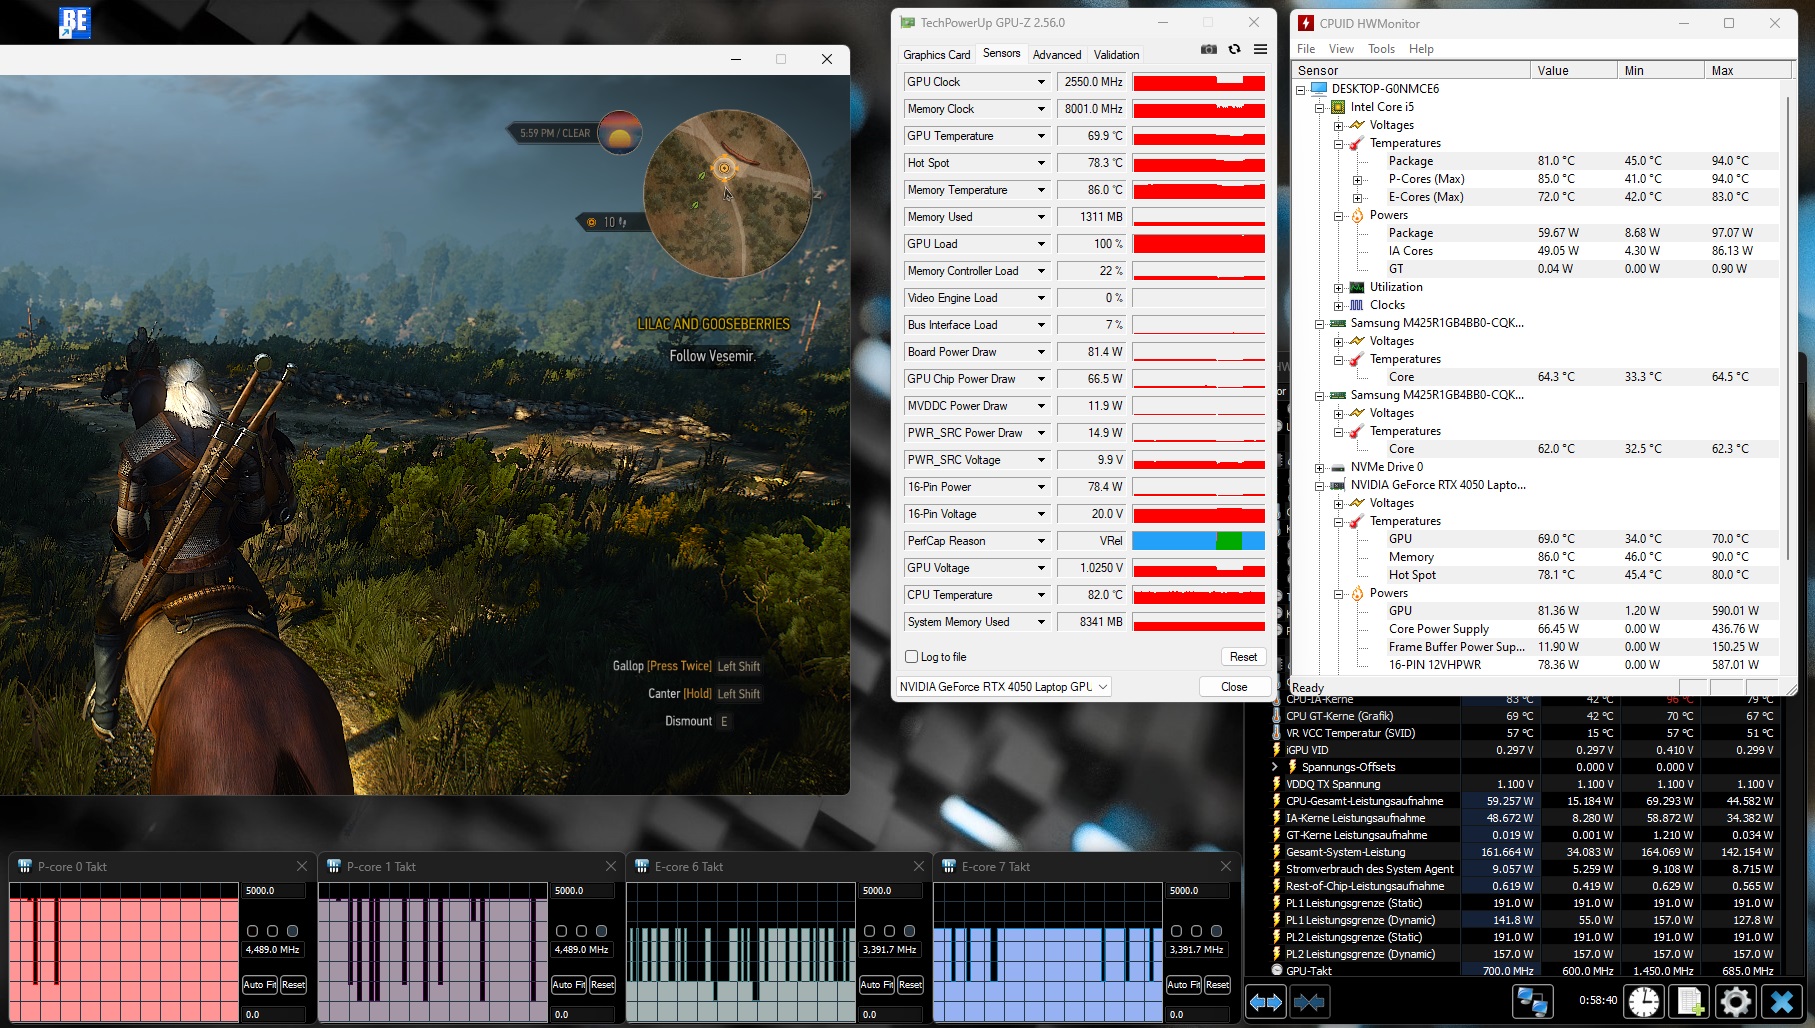
Stres testi
Özellikle CPU, FurMark & Prime95 kullanılarak gerçekleştirilen stres testi sırasında zorlandı. Core i5-13450HX, kısa bir süre 100°C'ye (212°F) ulaştıktan sonra saat hızını düşürerek sıcaklıkların 80 ila 90°C'de (176 ila 194°F) dengelenmesine neden oldu. GeForce RTX 4050 bir saat sonra "sadece" 79°C'ye (174,2°F) ulaştı, ancak sıcak nokta sıcaklığı yaklaşık 91°C (195,8°F).
Konuşmacılar
Dizüstü bilgisayar ortalama ses kalitesine sahip. Hoparlörlerin maksimum ses seviyesi iyi ancak bas sesleri zayıf.
Dell G15 5530, i5-13450HX RTX 4050 ses analizi
(+) | hoparlörler nispeten yüksek sesle çalabilir (86 dB)
Bas 100 - 315Hz
(-) | neredeyse hiç bas yok - ortalama olarak medyandan 32% daha düşük
(±) | Bas doğrusallığı ortalamadır (14% delta - önceki frekans)
Ortalar 400 - 2000 Hz
(+) | dengeli ortalar - medyandan yalnızca 3.5% uzakta
(+) | orta frekanslar doğrusaldır (4.3% deltadan önceki frekansa)
Yüksekler 2 - 16 kHz
(+) | dengeli yüksekler - medyandan yalnızca 2.4% uzakta
(+) | yüksekler doğrusaldır (4.2% deltadan önceki frekansa)
Toplam 100 - 16.000 Hz
(±) | Genel sesin doğrusallığı ortalamadır (18% ortancaya göre fark)
Aynı sınıfla karşılaştırıldığında
» Bu sınıftaki tüm test edilen cihazların %56%'si daha iyi, 9% benzer, 36% daha kötüydü
» En iyisinin deltası 6% idi, ortalama 18% idi, en kötüsü 132% idi
Test edilen tüm cihazlarla karşılaştırıldığında
» Test edilen tüm cihazların %38'si daha iyi, 8 benzer, % 54 daha kötüydü
» En iyisinin deltası 4% idi, ortalama 23% idi, en kötüsü 134% idi
Medion Erazer Crawler E40 - MD 62518 ses analizi
(±) | hoparlör ses yüksekliği ortalama ama iyi (81.47 dB)
Bas 100 - 315Hz
(-) | neredeyse hiç bas yok - ortalama olarak medyandan 32.7% daha düşük
(±) | Bas doğrusallığı ortalamadır (11% delta - önceki frekans)
Ortalar 400 - 2000 Hz
(+) | dengeli ortalar - medyandan yalnızca 4.6% uzakta
(±) | Ortaların doğrusallığı ortalamadır (7.1% delta - önceki frekans)
Yüksekler 2 - 16 kHz
(+) | dengeli yüksekler - medyandan yalnızca 3.1% uzakta
(+) | yüksekler doğrusaldır (5.7% deltadan önceki frekansa)
Toplam 100 - 16.000 Hz
(±) | Genel sesin doğrusallığı ortalamadır (21.8% ortancaya göre fark)
Aynı sınıfla karşılaştırıldığında
» Bu sınıftaki tüm test edilen cihazların %78%'si daha iyi, 6% benzer, 16% daha kötüydü
» En iyisinin deltası 6% idi, ortalama 18% idi, en kötüsü 132% idi
Test edilen tüm cihazlarla karşılaştırıldığında
» Test edilen tüm cihazların %62'si daha iyi, 7 benzer, % 31 daha kötüydü
» En iyisinin deltası 4% idi, ortalama 23% idi, en kötüsü 134% idi
Güç yönetimi
Güç tüketimi
Bulgularımız dizüstü bilgisayarın güç tüketimi konusunda ikiye bölünmüş durumda. G15 boştayken sadece ortalama 12 watt tüketiyor, bu da bir oyun dizüstü bilgisayarı için çok küçük bir miktar olsa da, yük altında ihtiyaç duyduğu 100 ila 262 watt, sunulan performansa göre son derece yüksek.
| Kapalı / Bekleme modu | |
| Boşta | |
| Çalışırken |
|
Key:
min: | |
| Dell G15 5530, i5-13450HX RTX 4050 i5-13450HX, GeForce RTX 4050 Laptop GPU | Medion Erazer Crawler E40 - MD 62518 i5-13500H, GeForce RTX 4050 Laptop GPU | Lenovo LOQ 15IRH8 Core i7 i7-13620H, GeForce RTX 4050 Laptop GPU | Asus TUF A15 FA507 R7 7735HS, GeForce RTX 4050 Laptop GPU | Dell G15 5530 i7-13650HX, GeForce RTX 4060 Laptop GPU | Sınıf ortalaması Gaming | |
|---|---|---|---|---|---|---|
| Power Consumption | -58% | -148% | -30% | -53% | -123% | |
| Idle Minimum * (Watt) | 2 | 10 -400% | 18.52 -826% | 8 -300% | 8.4 -320% | 13.1 ? -555% |
| Idle Average * (Watt) | 12 | 15.3 -28% | 22.54 -88% | 12.1 -1% | 14.98 -25% | 19 ? -58% |
| Idle Maximum * (Watt) | 27 | 15.5 43% | 29.79 -10% | 12.5 54% | 15.56 42% | 24.6 ? 9% |
| Load Average * (Watt) | 100 | 88 12% | 94.5 5% | 74.9 25% | 96.8 3% | 111.3 ? -11% |
| Witcher 3 ultra * (Watt) | 161.9 | 155 4% | 154.4 5% | 136.6 16% | 186 -15% | |
| Load Maximum * (Watt) | 262 | 202.47 23% | 190.4 27% | 185 29% | 271.42 -4% | 260 ? 1% |
* ... daha küçük daha iyidir
Power consumption Witcher 3 / Stresstest
Power consumption with external monitor
Pil ömrü
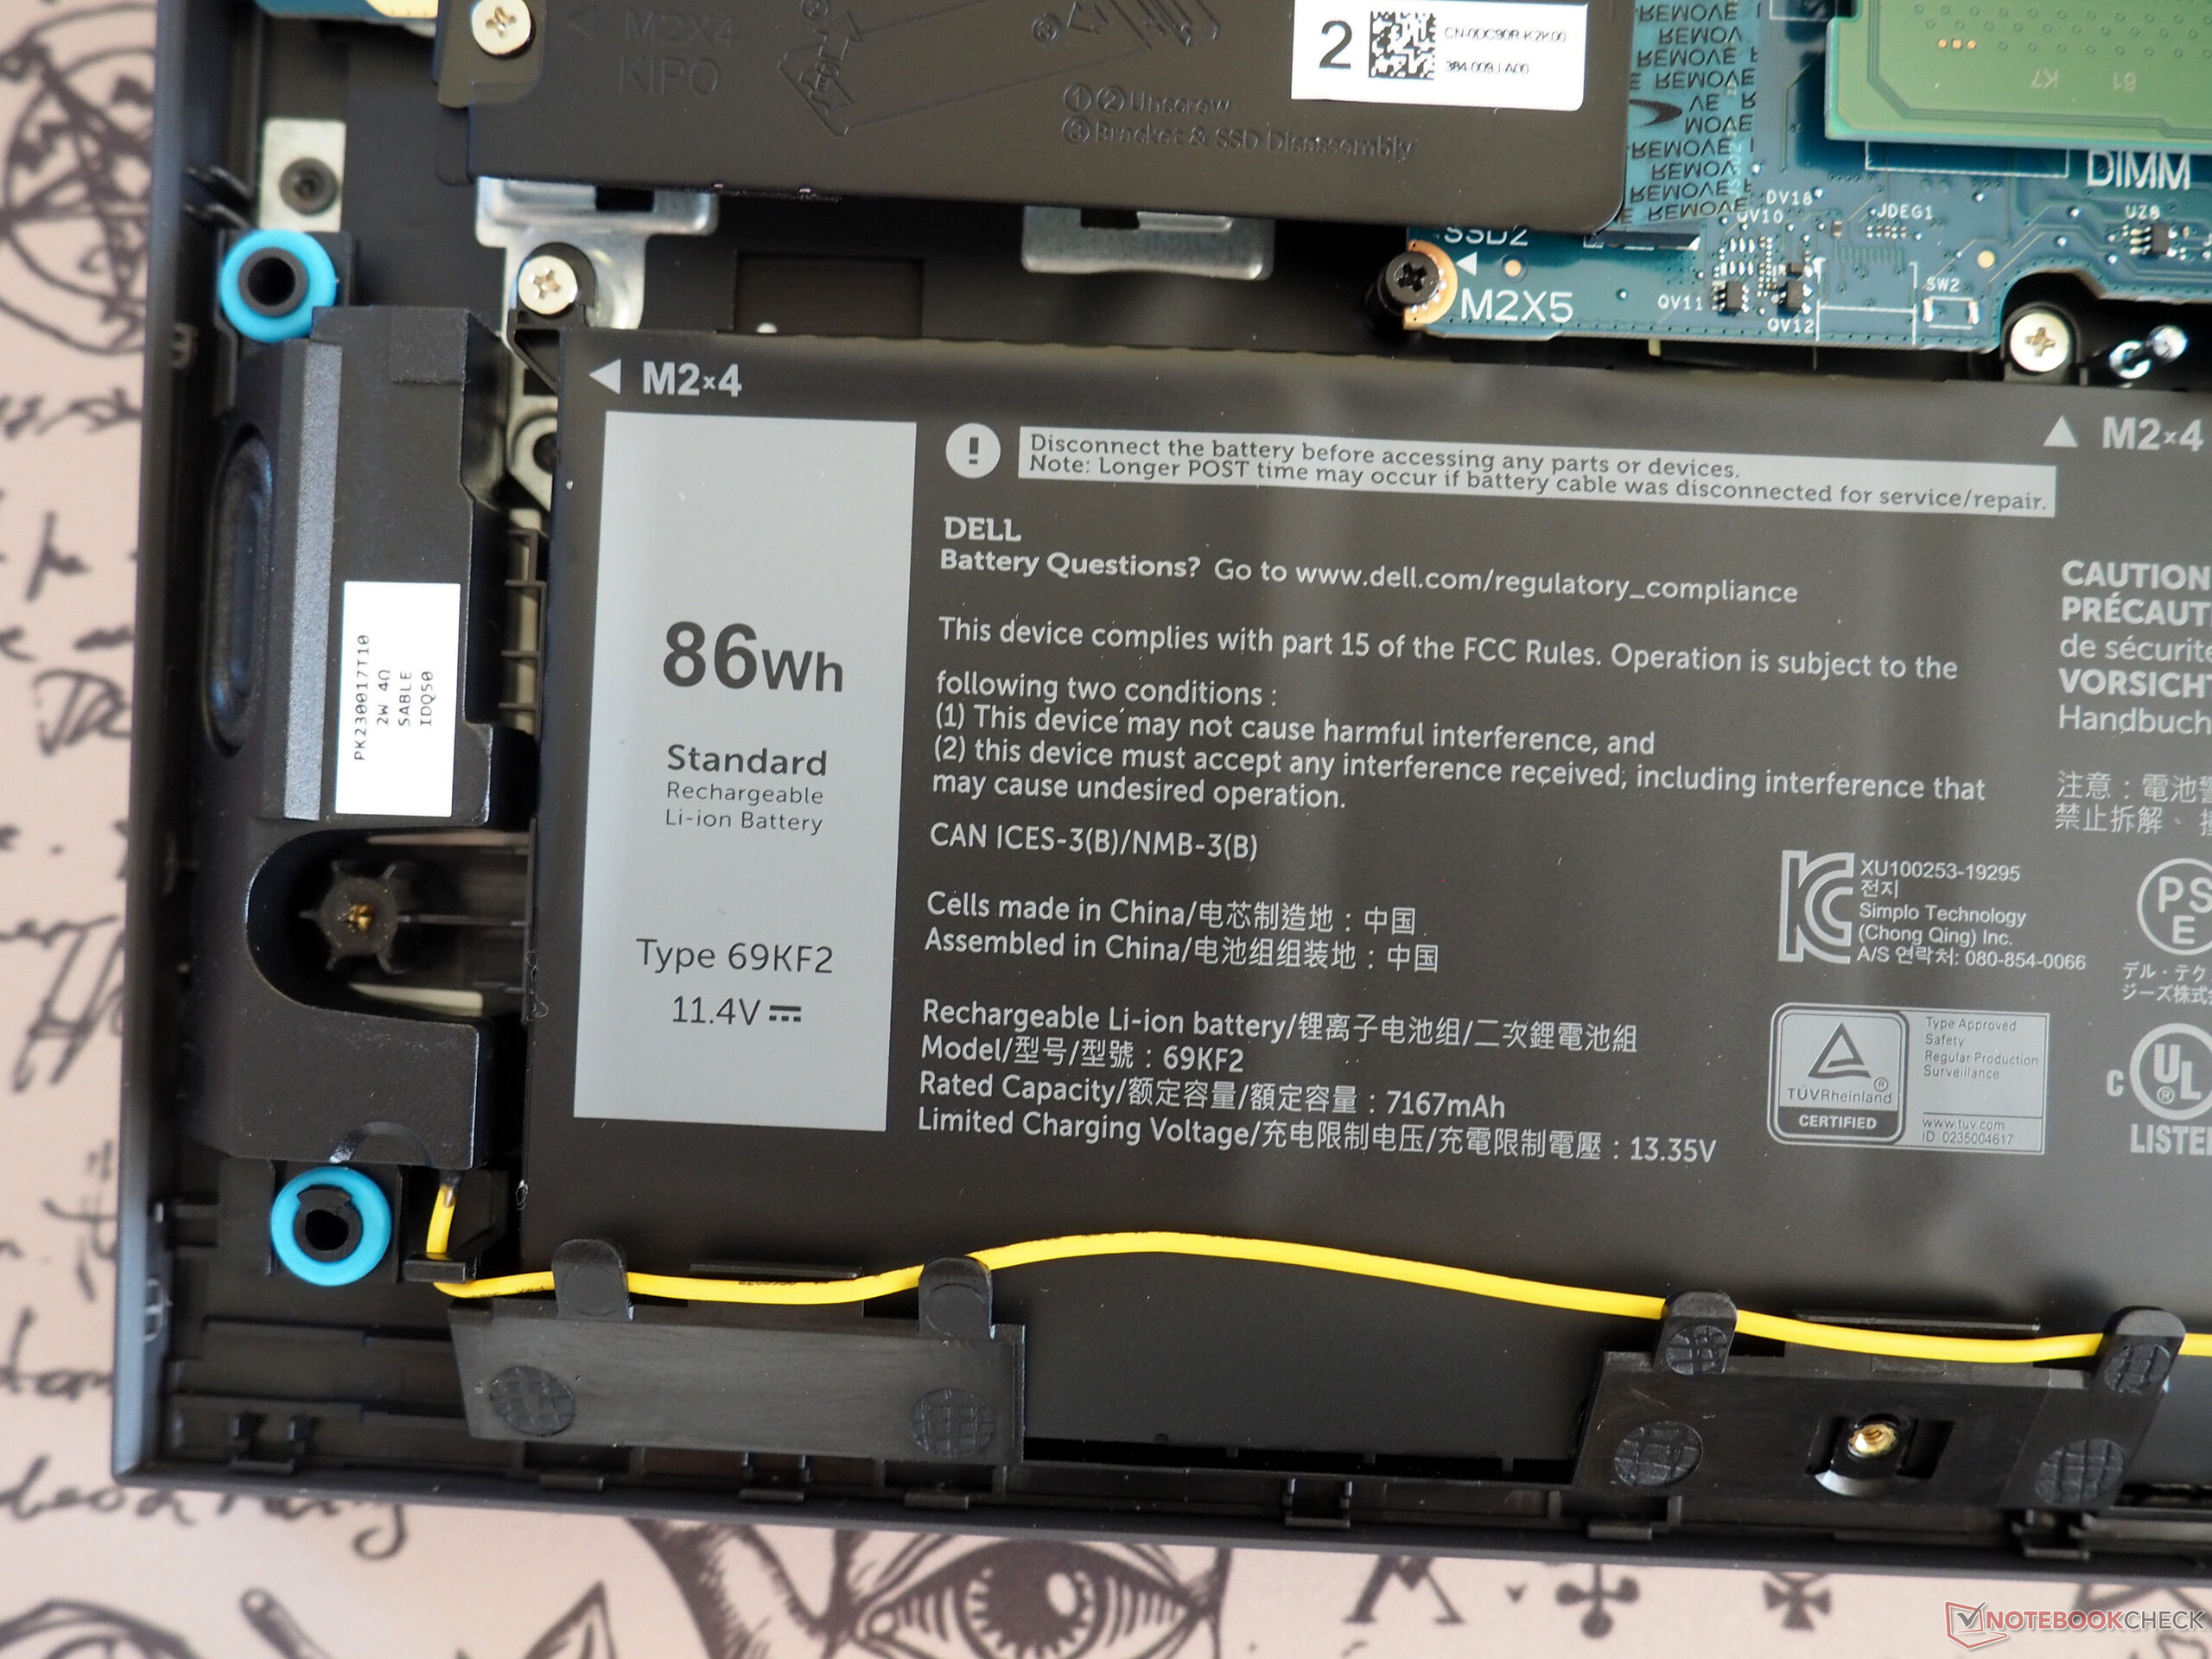
G15'in pil ömrü, özellikle grafik geçişi sayesinde oldukça iyi. Wi-Fi testimizde (ekran parlaklığı 150 cd/m²'ye düşürülmüş halde), 86 Wh'lık devasa pilden yaklaşık 7 saatlik bir kullanım elde etmeyi başardık.
| Dell G15 5530, i5-13450HX RTX 4050 i5-13450HX, GeForce RTX 4050 Laptop GPU, 86 Wh | Medion Erazer Crawler E40 - MD 62518 i5-13500H, GeForce RTX 4050 Laptop GPU, 54 Wh | Lenovo LOQ 15IRH8 Core i7 i7-13620H, GeForce RTX 4050 Laptop GPU, 60 Wh | Asus TUF A15 FA507 R7 7735HS, GeForce RTX 4050 Laptop GPU, 90 Wh | Dell G15 5530 i7-13650HX, GeForce RTX 4060 Laptop GPU, 86 Wh | Sınıf ortalaması Gaming | |
|---|---|---|---|---|---|---|
| Pil Çalışma Süresi | -42% | -17% | 65% | -8% | 0% | |
| WiFi v1.3 (h) | 7.1 | 4.1 -42% | 5.9 -17% | 11.7 65% | 6.5 -8% | 7.08 ? 0% |
| H.264 (h) | 3.9 | 6.1 | 12.5 | 6.8 | 8.27 ? | |
| Load (h) | 1.2 | 1 | 0.8 | 1.496 ? | ||
| Witcher 3 ultra (h) | 0.8 |
Artılar
Eksiler
Karar
Dell G15 5530 ile Core i5-13450HX ve GeForce RTX 4050 güçlü ve zayıf yönlerinin çoğunu miras alır daha pahalı kardeş bir i7-13650HX ve RTX 4060. Cihazın artı yönleri arasında nispeten iyi bir ekrana, sağlam bir pil ömrüne ve makul bir fiyat/performans değerine sahip olması sayılabilir.
Eksi tarafında ise oldukça ağır ve tıknaz bir kasa, gereksiz yere hantal bir şarj cihazı ve yetersiz port seçimi (USB4 ve kart okuyucu yok) var. Dell ayrıca sürekli stres altında SSD'nin büyük ölçüde yavaşlamasını ve yük altında güç kullanımını ele almak için çalışmalıdır.
Her halükarda G15 5530, 1.000 € (1.090 ABD Doları) fiyat aralığında uygun bir oyun makinesi arayan bütçe bilincine sahip oyuncular için genel olarak harika bir seçenektir.
İncelemede bahsedilen rakipler (Medion Crawler E40, Asus TUF A15 ve Lenovo LOQ 15) büyük ölçüde benzer performans sağlar, ancak bazen başka avantajlar ve dezavantajlar sunar.
Fiyat ve bulunabilirlik
Core i5-13450HX ve GeForce RTX 4050'ye sahip Dell G15 5530 şu anda Amazon Almanya'dan 950 € karşılığında temin edilebilir. ABD'de benzer özelliklere sahip bir versiyonu doğrudan Dell'den 900 ABD dolarına veya Core i7-13650HX ve RTX 4060'lı modeli Amazon ABD'den 1.200 ABD dolarına alabilirsiniz.
Dell G15 5530, i5-13450HX RTX 4050
- 01/23/2024 v7 (old)
Florian Glaser
Şeffaflık
İncelenecek cihazların seçimi editör ekibimiz tarafından yapılır. Test örneği, bu incelemenin amacı doğrultusunda üretici veya perakendeci tarafından yazara ödünç olarak sağlanmıştır. Borç verenin bu inceleme üzerinde herhangi bir etkisi olmadığı gibi, üretici de yayınlanmadan önce bu incelemenin bir kopyasını almamıştır. Bu incelemeyi yayınlama zorunluluğu yoktu. Bağımsız bir medya şirketi olarak Notebookcheck, üreticilerin, perakendecilerin veya yayıncıların otoritesine tabi değildir.
Notebookcheck bu şekilde test yapıyor
Notebookcheck, tüm sonuçların karşılaştırılabilir olmasını sağlamak için her yıl yüzlerce dizüstü bilgisayarı ve akıllı telefonu standart prosedürler kullanarak bağımsız olarak inceliyor. Yaklaşık 20 yıldır test yöntemlerimizi sürekli olarak geliştirdik ve bu süreçte endüstri standartlarını belirledik. Test laboratuvarlarımızda deneyimli teknisyenler ve editörler tarafından yüksek kaliteli ölçüm ekipmanları kullanılmaktadır. Bu testler çok aşamalı bir doğrulama sürecini içerir. Karmaşık derecelendirme sistemimiz, nesnelliği koruyan yüzlerce sağlam temellere dayanan ölçüm ve kıyaslamaya dayanmaktadır.Price comparison

