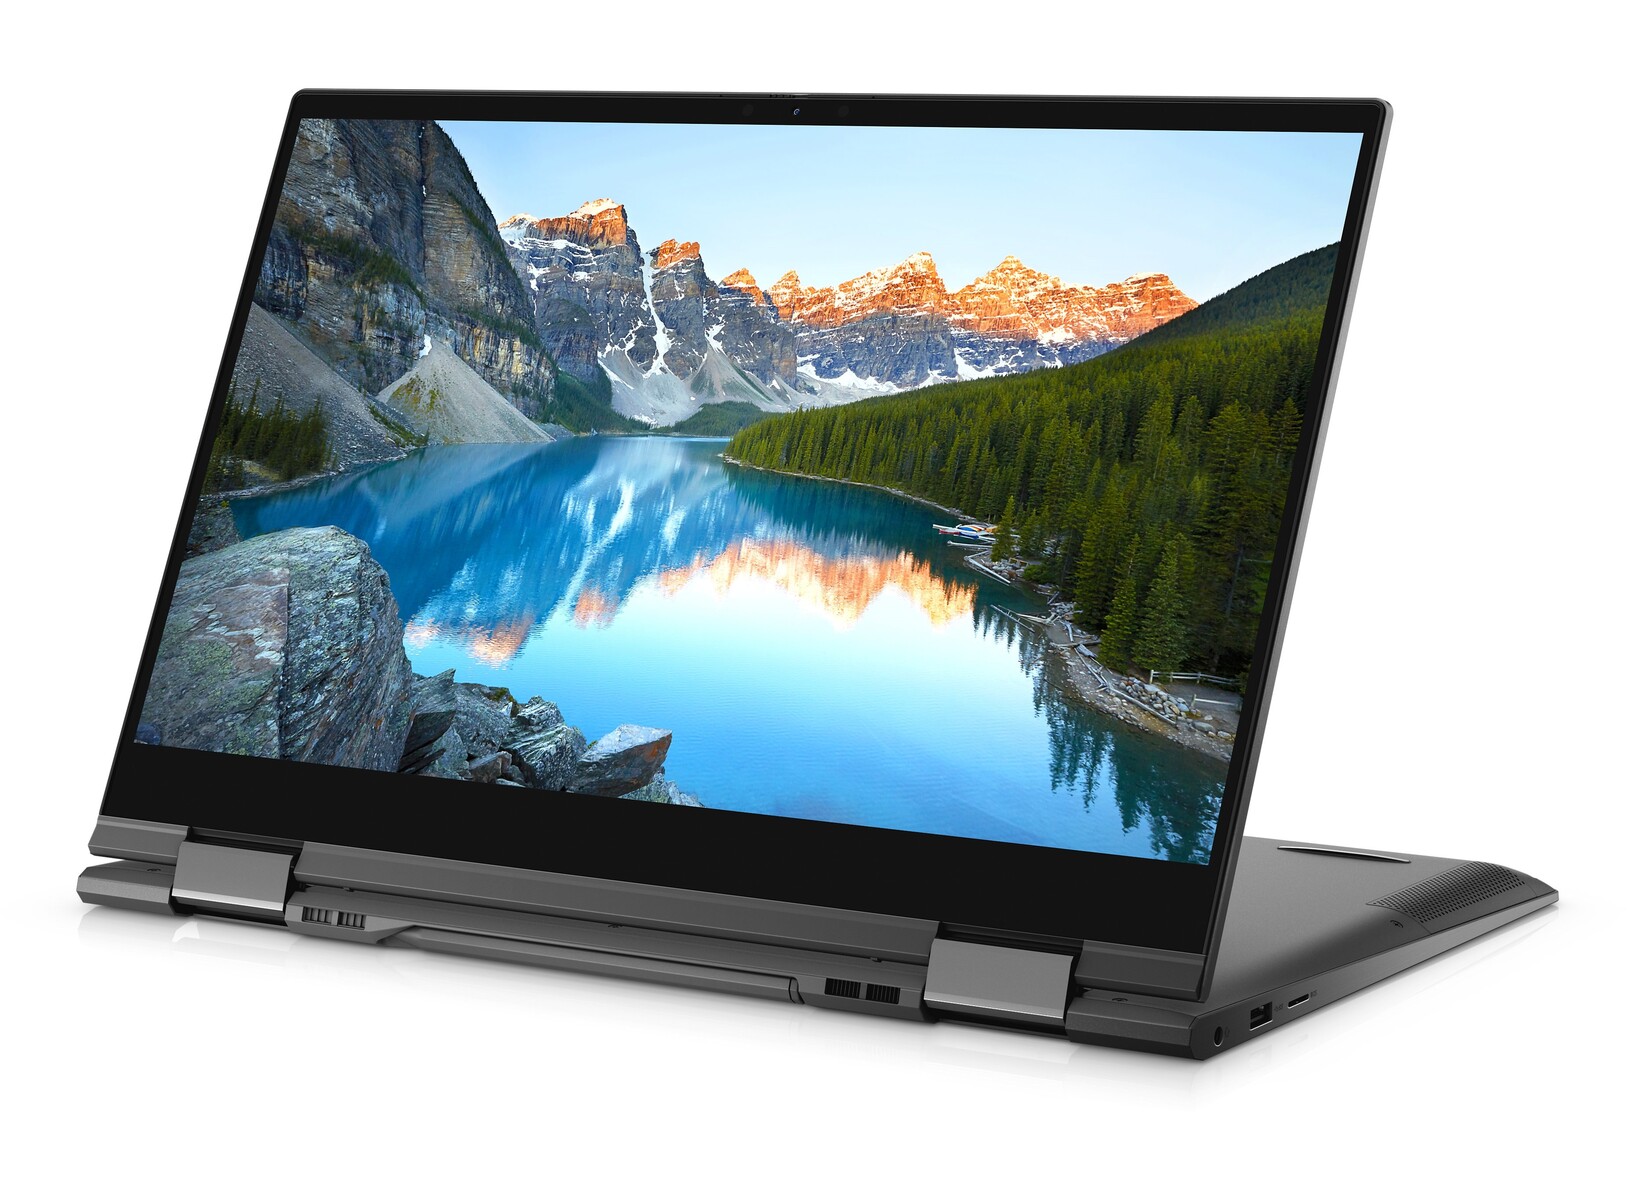
Dell Inspiron 15 7000 7506 2'si 1 Arada Siyah Baskı - Gümüş Sürüm: Fark Nedir?
Genellikle bir dizüstü bilgisayar birden fazla renk seçeneğiyle geldiğinde, donanımla ilgili diğer her şey aynı kalır. Inspiron 15 7506 2'si 1 Arada Gümüş Sürüm ve Inspiron 15 7506 2'si 1 Arada Siyah Sürüm söz konusu olduğunda Dell, aralarında hem dahili hem de harici olarak birkaç önemli fark bulunan iki dizüstü bilgisayar yaptı. Aslında, farklar o kadar büyük olabilir ki, Black Edition şu anda Silver Edition'dan en az 500 $ daha fazla satılıyor. Bu inceleme, Black Edition'ı daha yüksek fiyat etiketini haklı çıkarmak için bu kadar özel kılan şeylere değinecek.Test birimimiz Core i7-1165G7 CPU, 16 GB lehimli RAM, 1 TB NVMe SSD, 4K UHD dokunmatik ekran ve Intel Iris ile yapılandırılmış olarak geliyor. Xe Max ayrık grafikler. Black Edition aynı fiziksel özelliklerin çoğunu paylaştığından ilk olarak Inspiron 15 7506 2'si 1 arada Silver Edition incelememize göz atmanızı öneririz.Daha fazla Dell incelemesi: Alienware m15 R3XPS 15 9500Inspiron 15 5502Latitude 3510Precision 3551
potential competitors in comparison
Derecelendirme | Tarih | Modeli | Ağırlık | Yükseklik | Boyut | Çözünürlük | Fiyat |
|---|---|---|---|---|---|---|---|
| 82.4 % v7 (old) | 02/2021 | Dell Inspiron 15 7000 7506 2-in-1 Black Edition i7-1165G7, Xe MAX | 1.9 kg | 17.94 mm | 15.60" | 3840x2160 | |
| 87.3 % v7 (old) | Samsung Galaxy Book Flex 15-NP950 i7-1065G7, GeForce MX250 | 1.6 kg | 14.9 mm | 15.60" | 1920x1080 | ||
| 82.8 % v7 (old) | 09/2022 | HP Envy x360 15-ee0257ng R5 4500U, Vega 6 | 2 kg | 18.9 mm | 15.60" | 1920x1080 | |
| 88.3 % v7 (old) | 06/2020 | Microsoft Surface Book 3 15 i7-1065G7, GeForce GTX 1660 Ti Max-Q | 1.9 kg | 23 mm | 15.00" | 3240x2160 | |
| 86.5 % v7 (old) | 03/2020 | Asus ZenBook Flip 15 UX563FD-A1027T i7-10510U, GeForce GTX 1050 Max-Q | 1.9 kg | 19.9 mm | 15.60" | 3840x2160 | |
| 84.8 % v7 (old) | 04/2020 | Lenovo Yoga C740-15IML i7-10510U, UHD Graphics 620 | 1.9 kg | 17.25 mm | 15.60" | 1920x1080 | |
| 81.2 % v7 (old) | 01/2021 | Dell Inspiron 15 7506 2-in-1 P97F i5-1135G7, Iris Xe G7 80EUs | 1.8 kg | 17.94 mm | 15.60" | 1920x1080 |
Durum
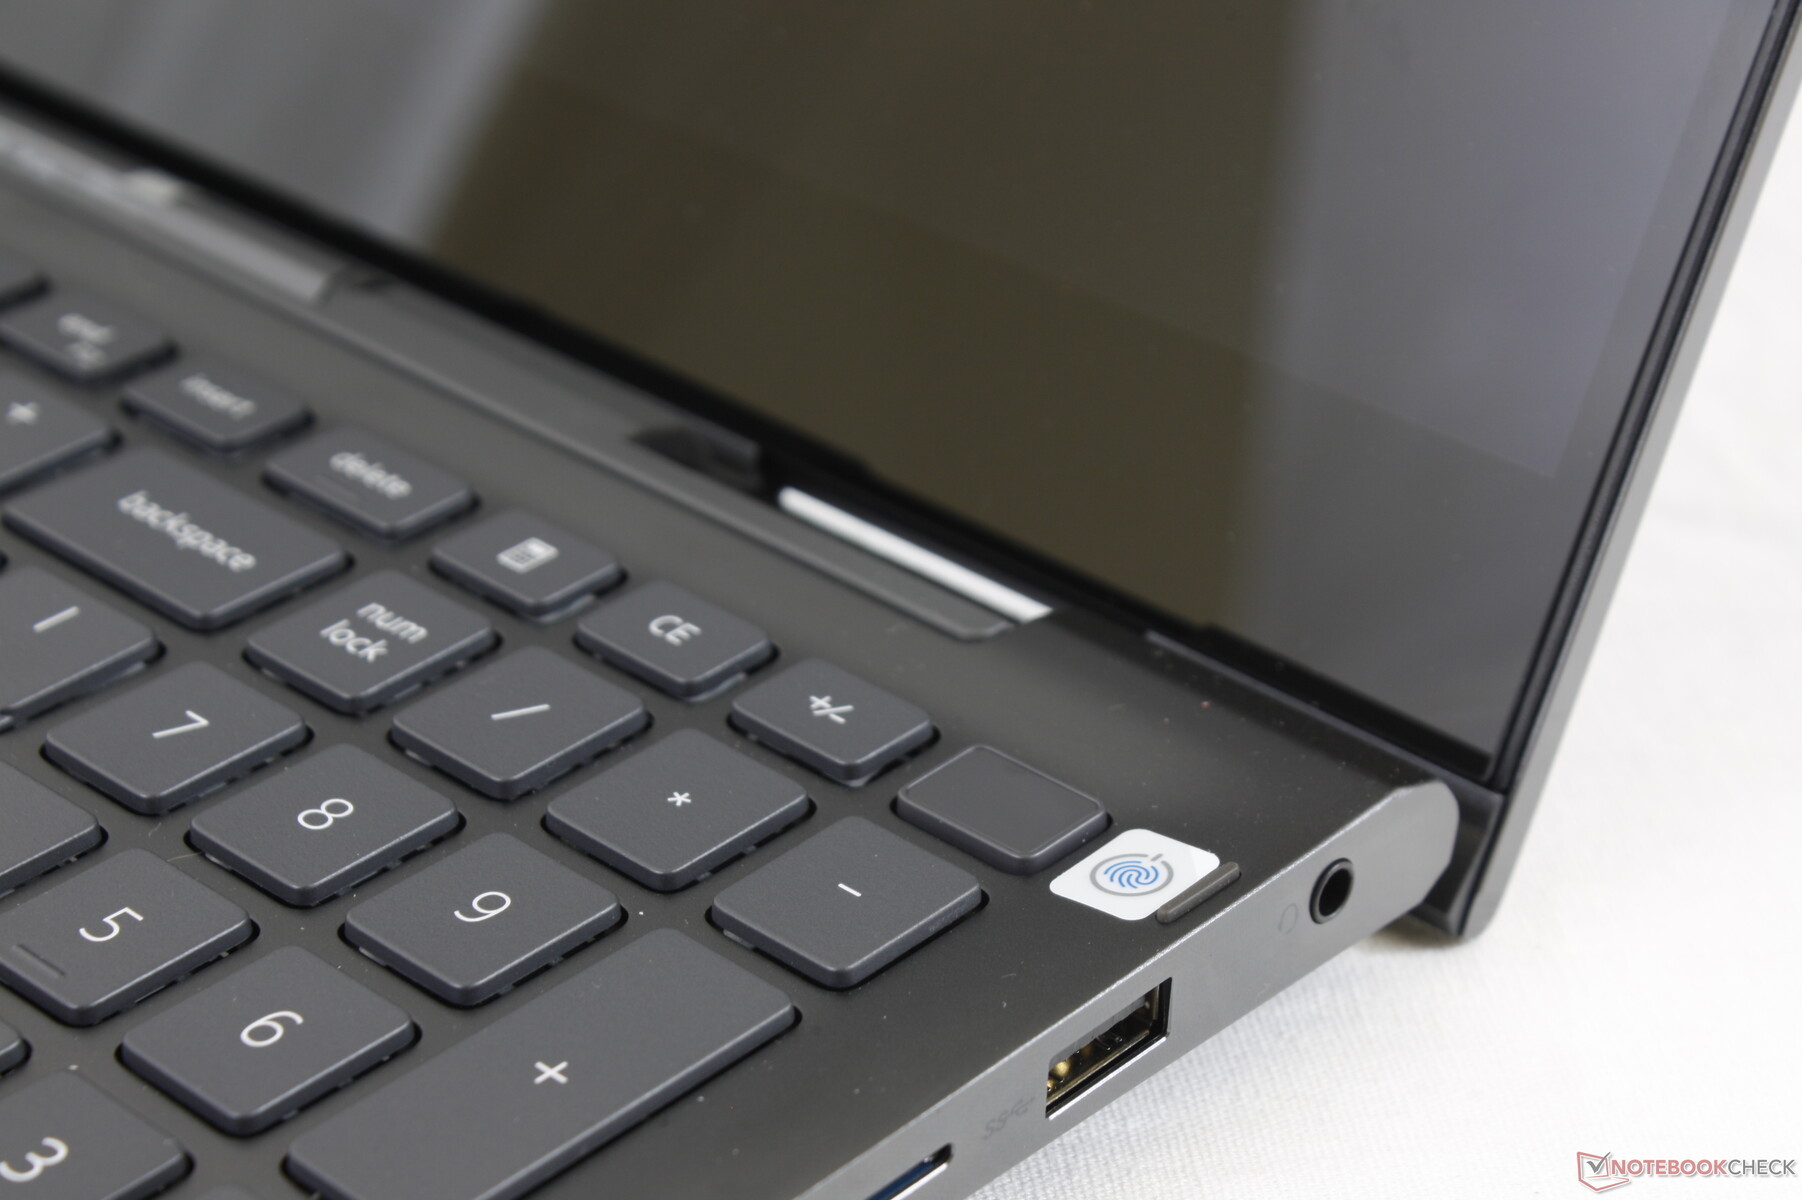
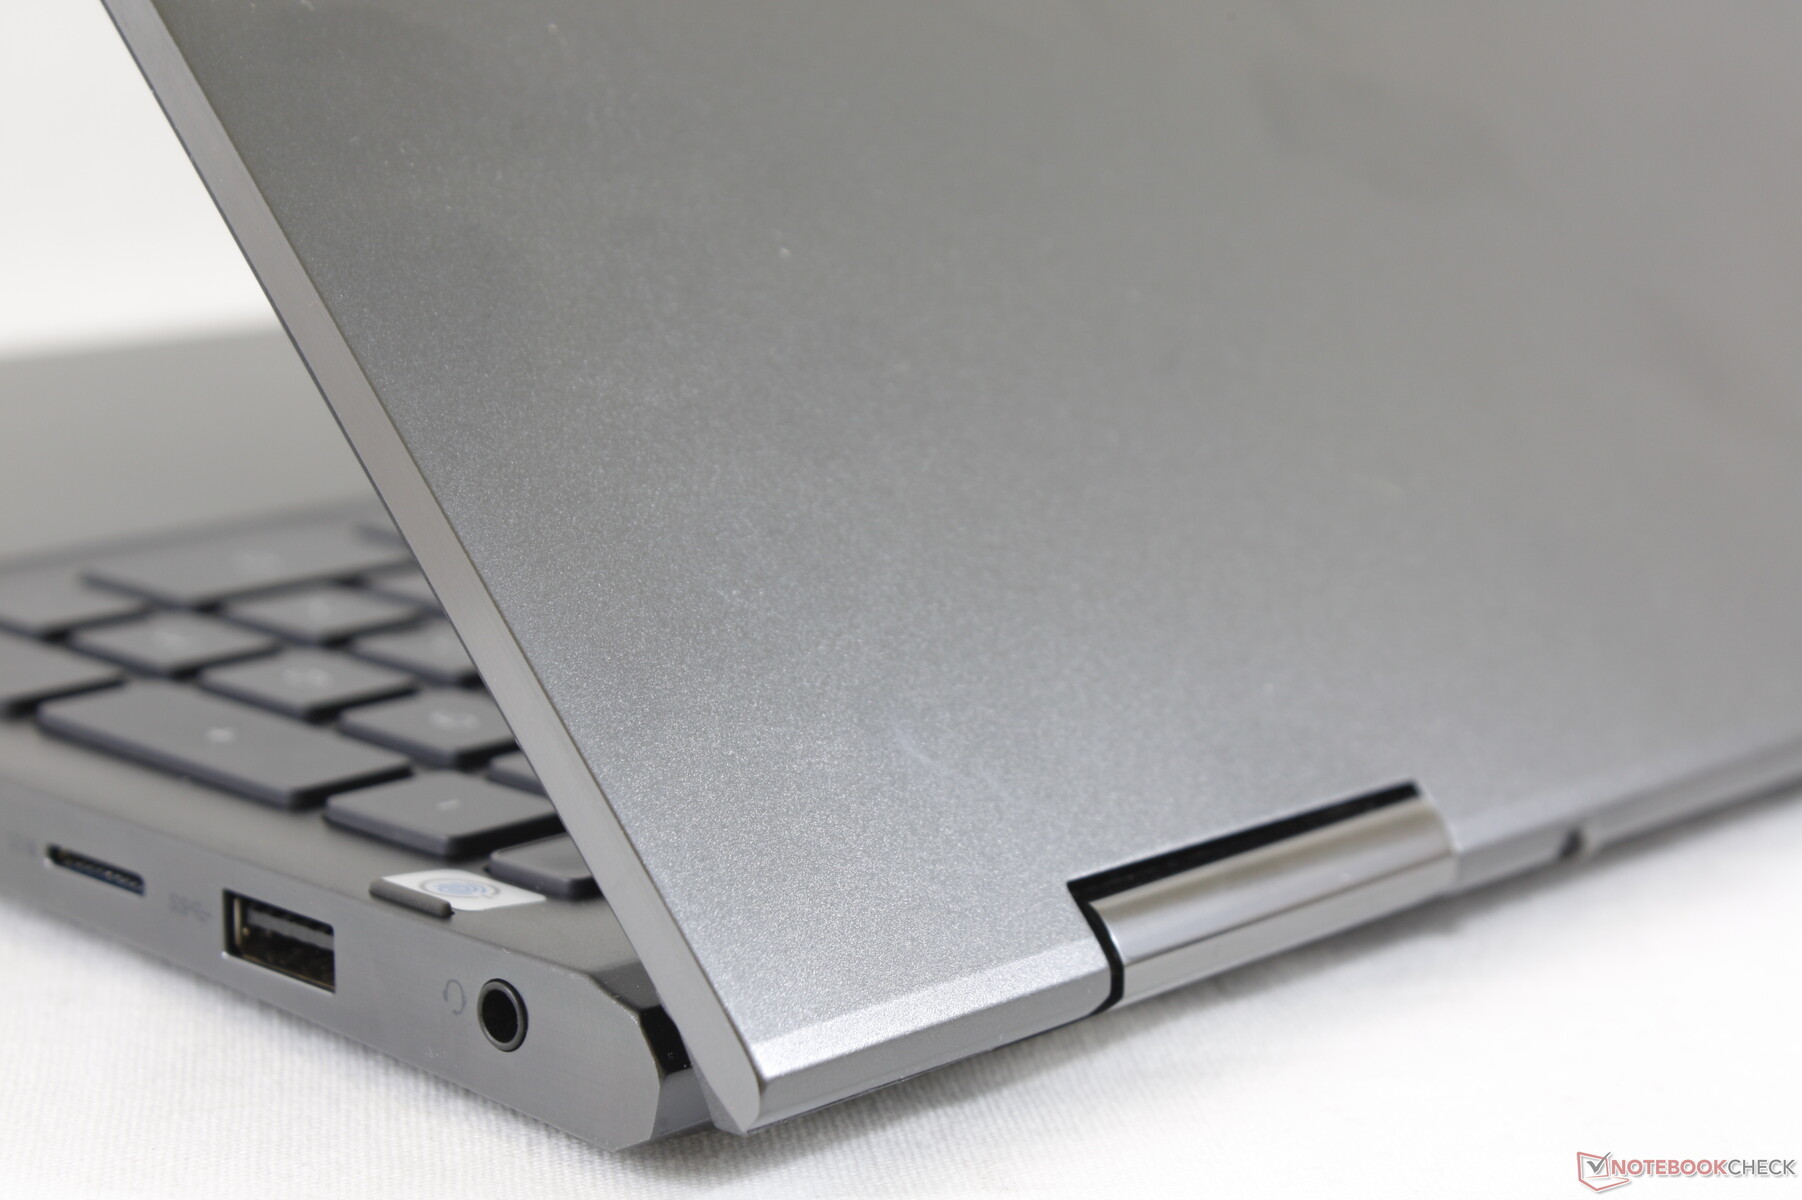
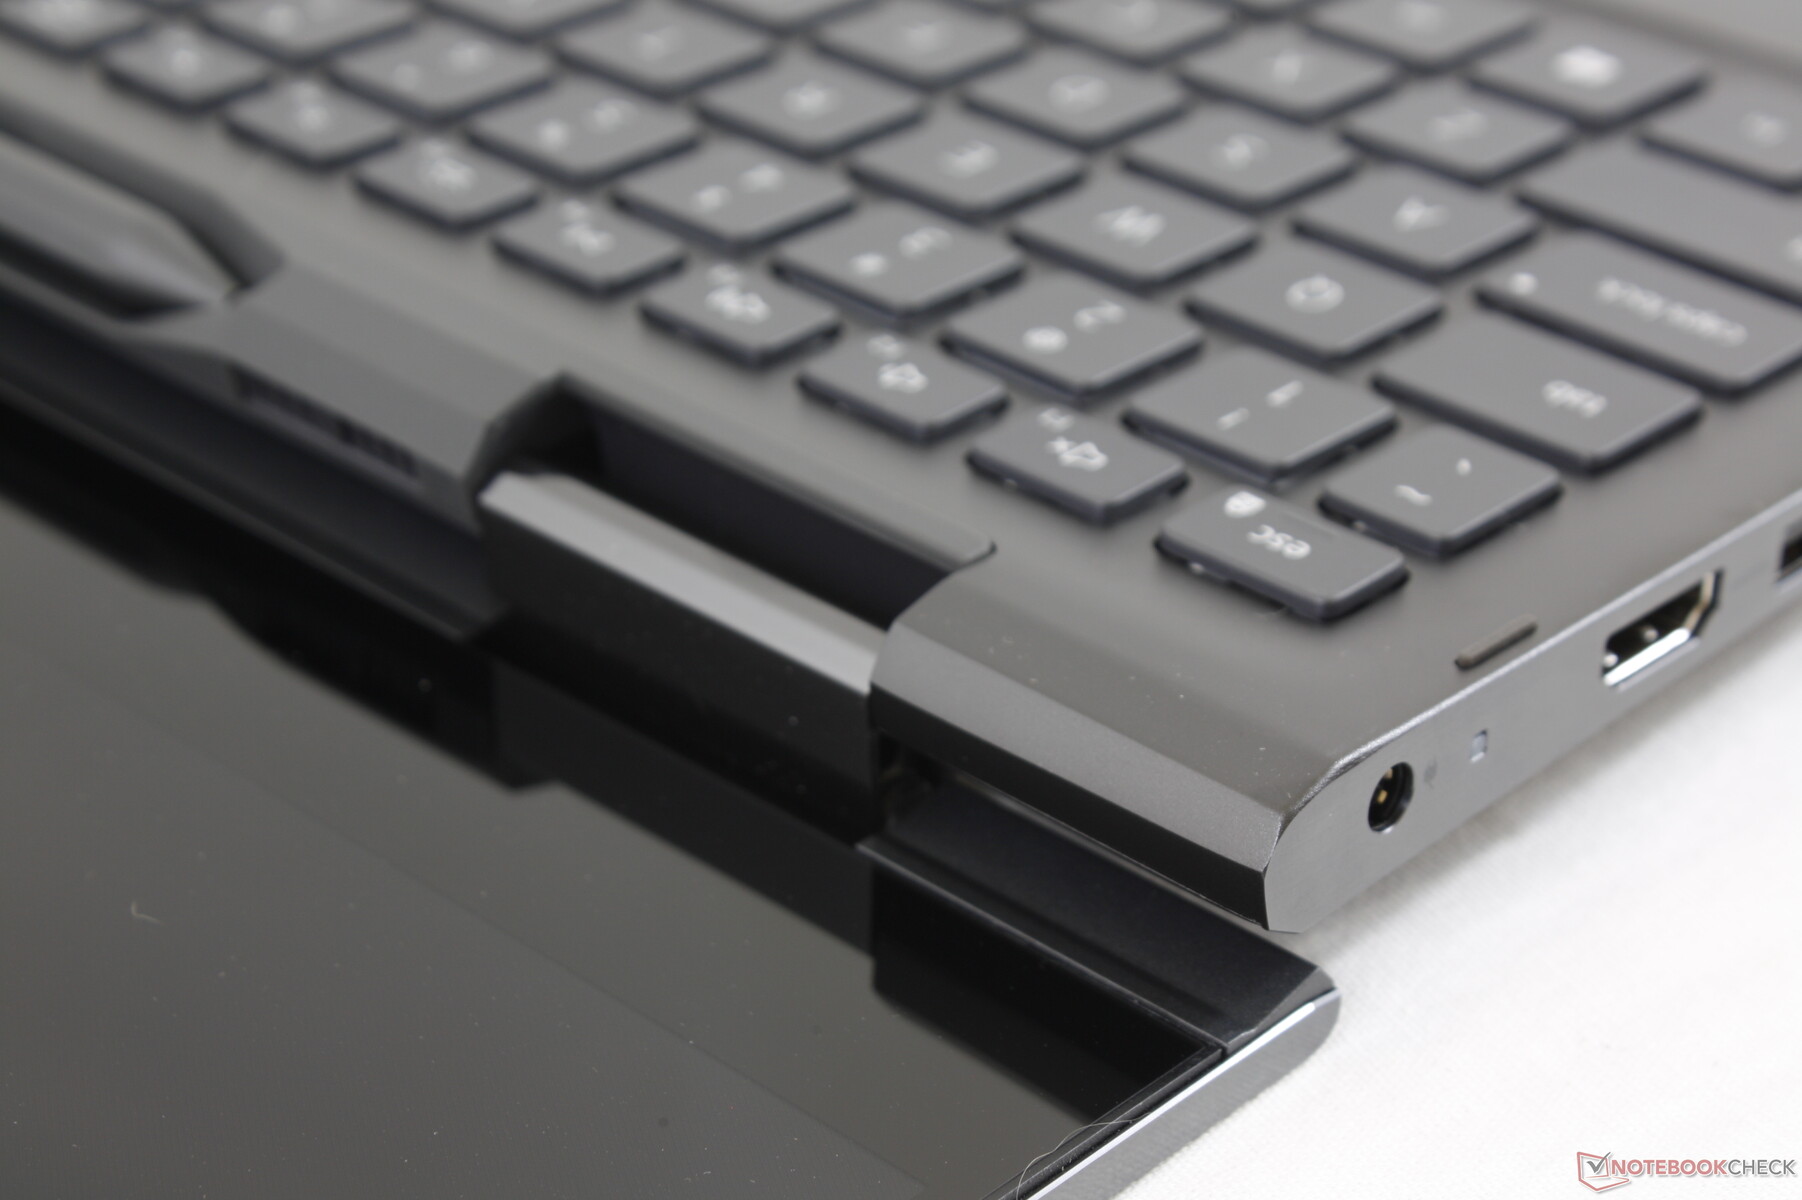
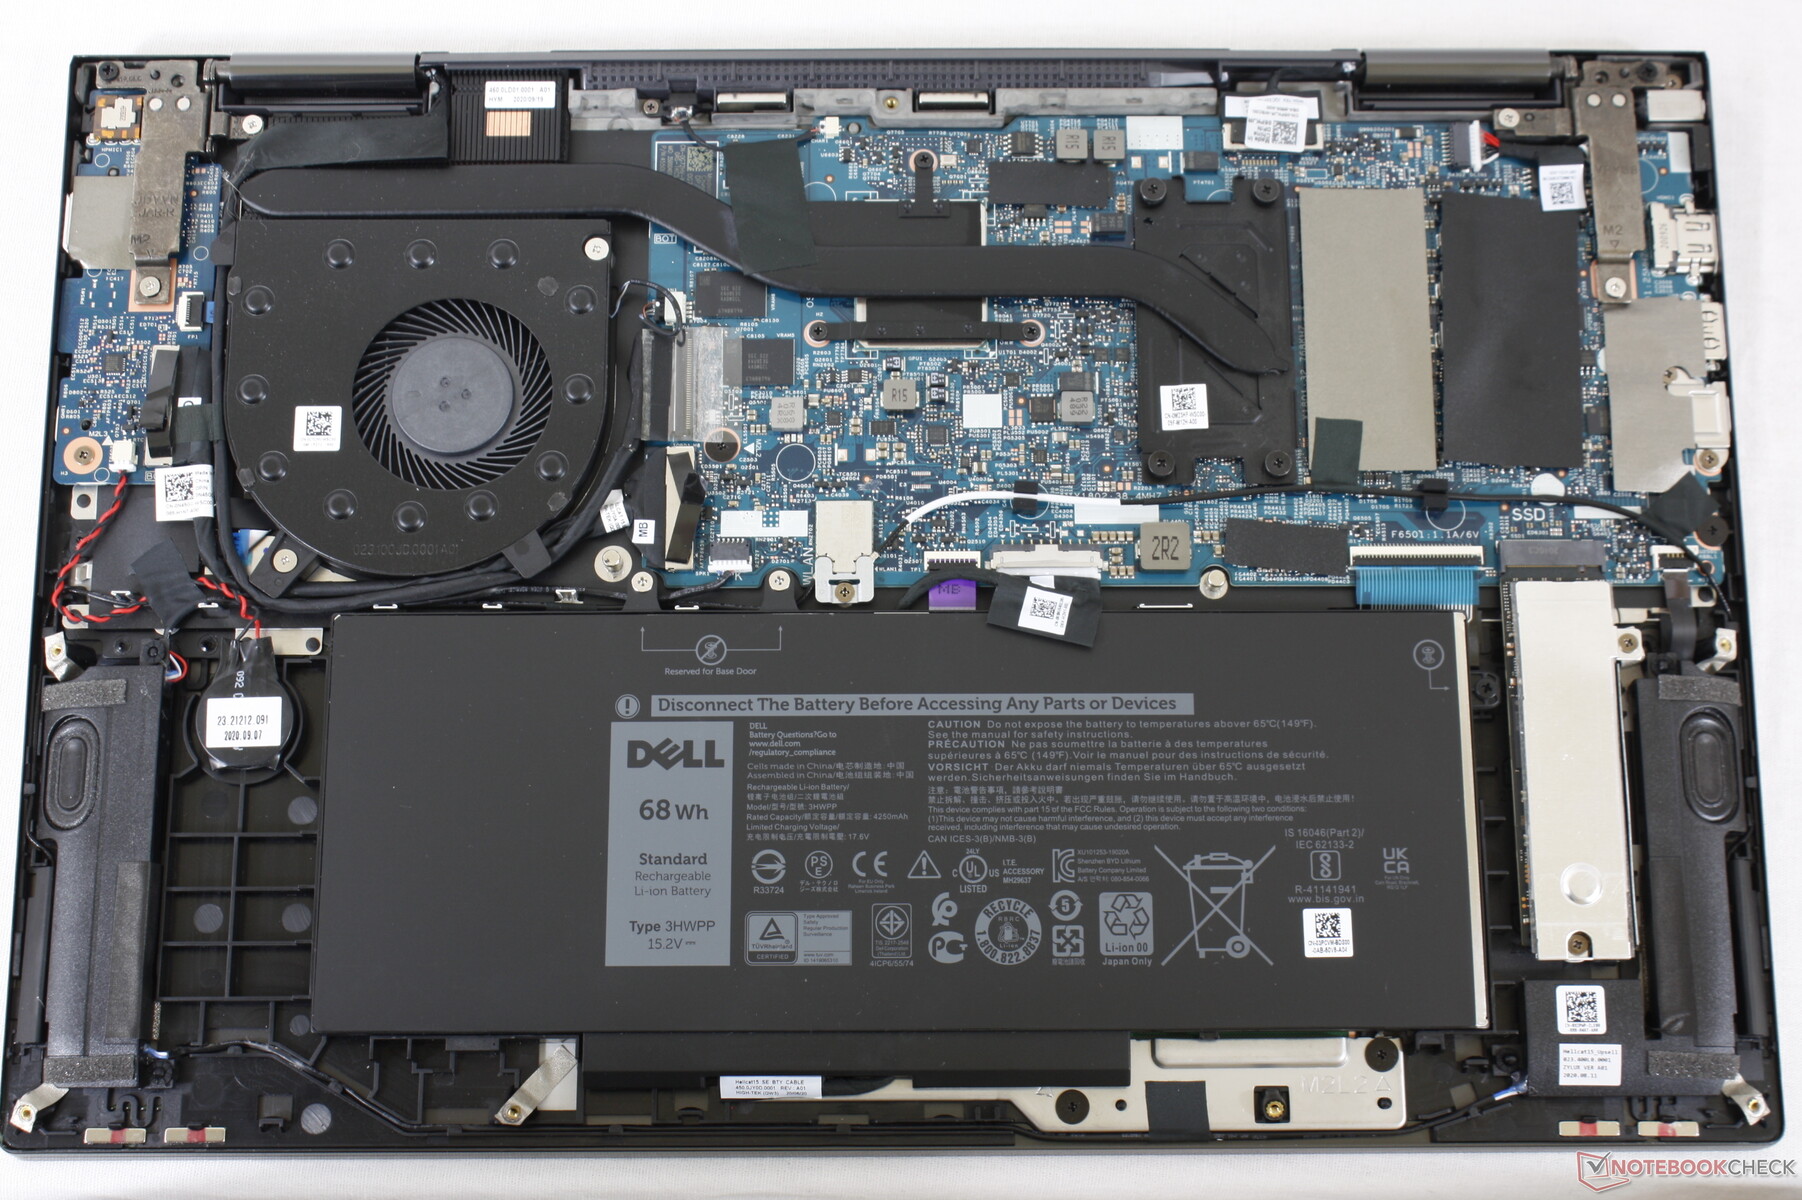
Alüminyum kasa, Inspiron 15 7506 2'si 1 Arada Silver Edition ile aynıdır, ancak bir avuç küçük görsel farklılığa sahiptir. Bazı özellikler yalnızca belirli modellerde bulunur; bu, basit renk seçimlerinden daha fazlası olduğundan, kullanıcıların dikkatli bir şekilde seçim yapması gerektiği anlamına gelir. Bunun ötesinde, her iki dizüstü bilgisayar da benzer ilk izlenimler için aynı malzemeleri, klavyeyi, tıklama alanını ve diğer fiziksel özellikleri kullanır. Inspiron 15 7506 2'si 1 Arada Gümüş ve Siyah Sürümler arasındaki başlıca farklar şunlardır: Silver EditionBlack EditionCPU Core i5-1135G7 Core i7-1165G7GPU'ya kadar GeForce'a kadar GeForce MX330 w / 2 GB GDDR5 VRAM En çok Iris Xe Max w / 4 GB LPDDR4X VRAMRAM 16 GB'a kadar 3200 MHz (2x SODIMM) 16 GB'a kadar 4267 MHz (Lehimli) Ekran1080p dokunmatik ekran4K UHD dokunmatik ekranPortsHDMI 1.4Tam boyutlu SD kart okuyucuHDMI 2.0MicroSD kart okuyucuWLAN Intel AX201 (çıkarılabilir) Intel AX201 (lehimli) IR KameraNoYesPen GarageNoYesDell Active PenPN350M, ayrı olarak satılır 1,91 kg Fiyat> 700 ABD Doları> 1500 ABD Doları
Bağlantı
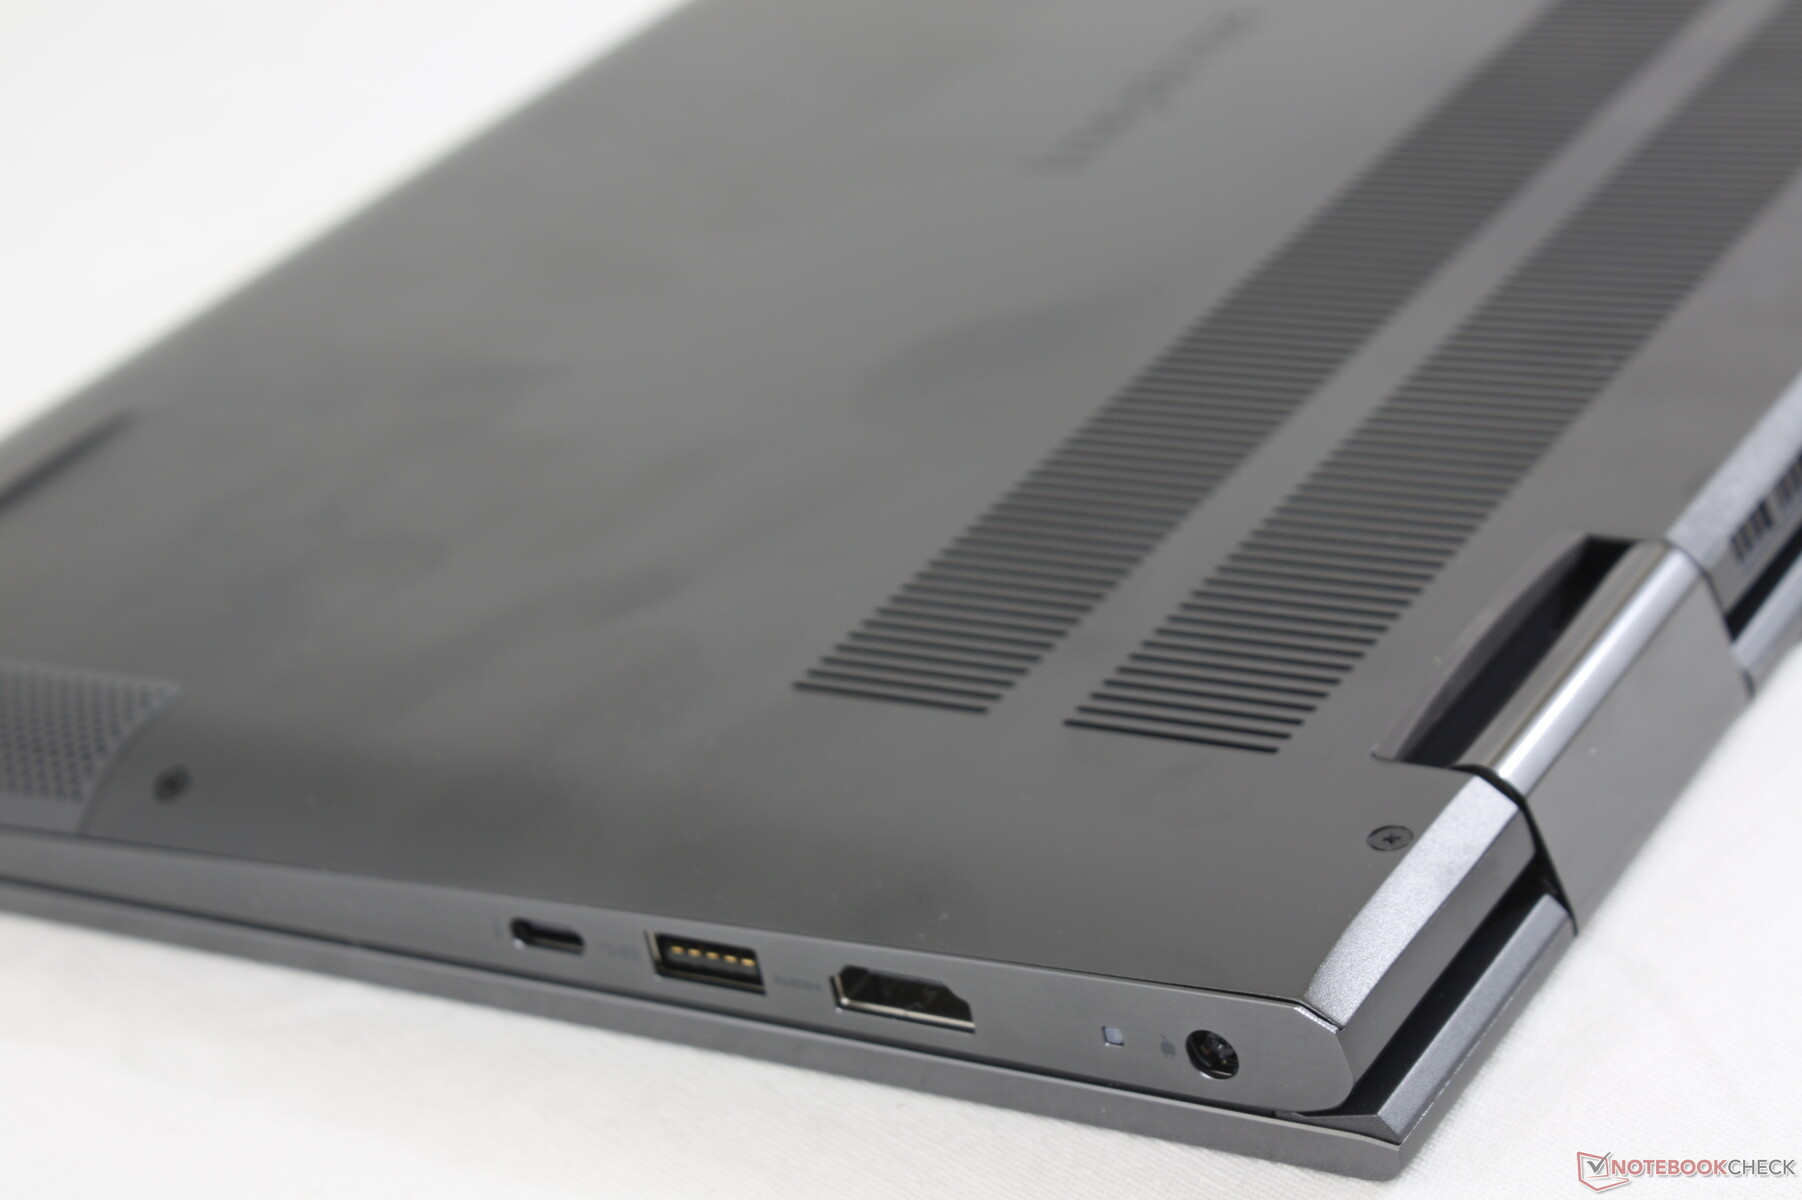
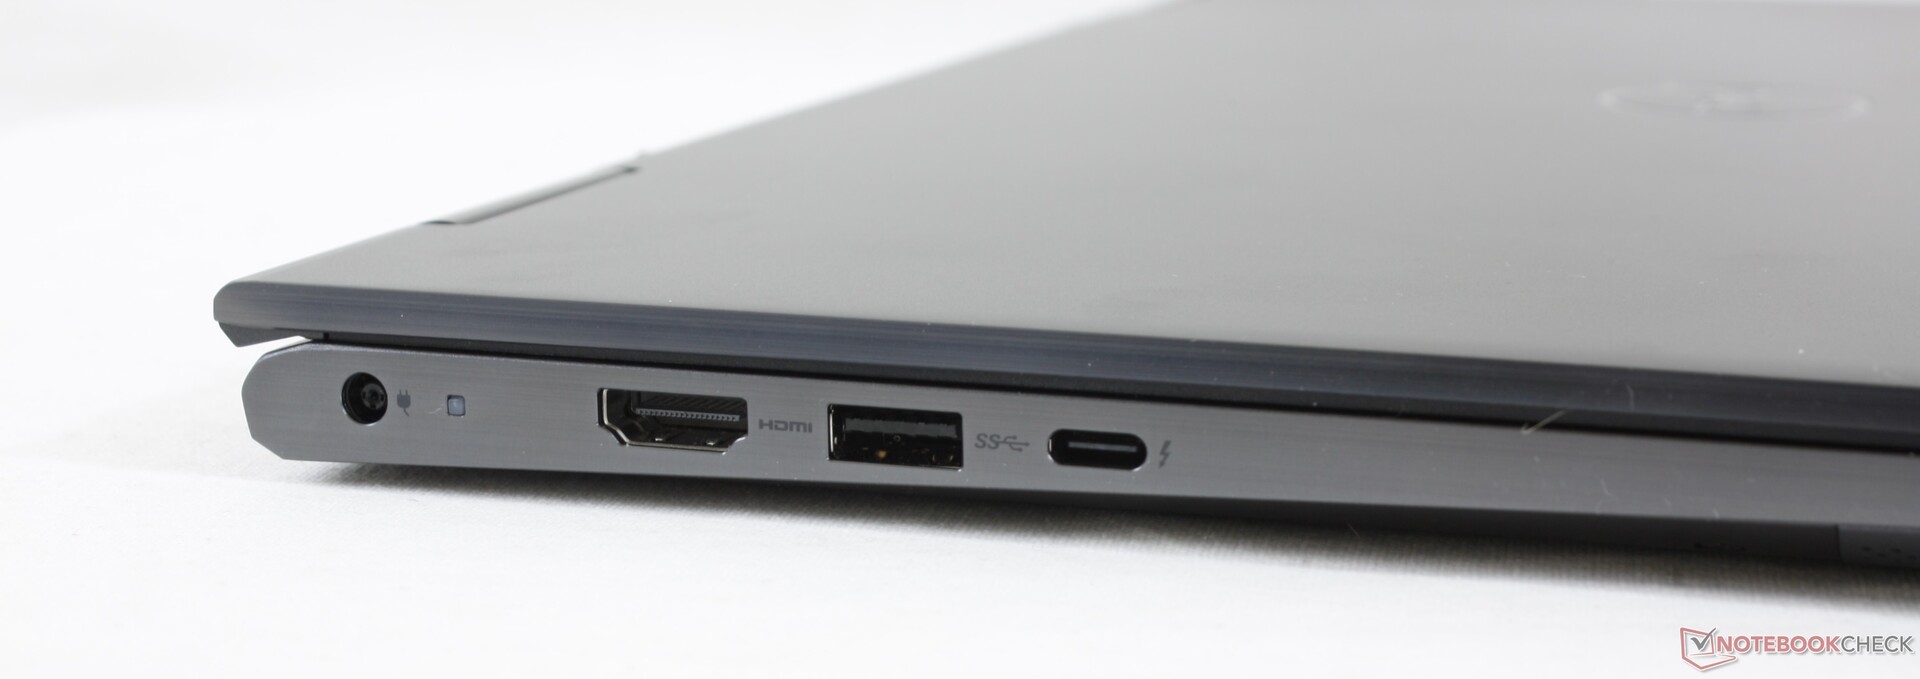
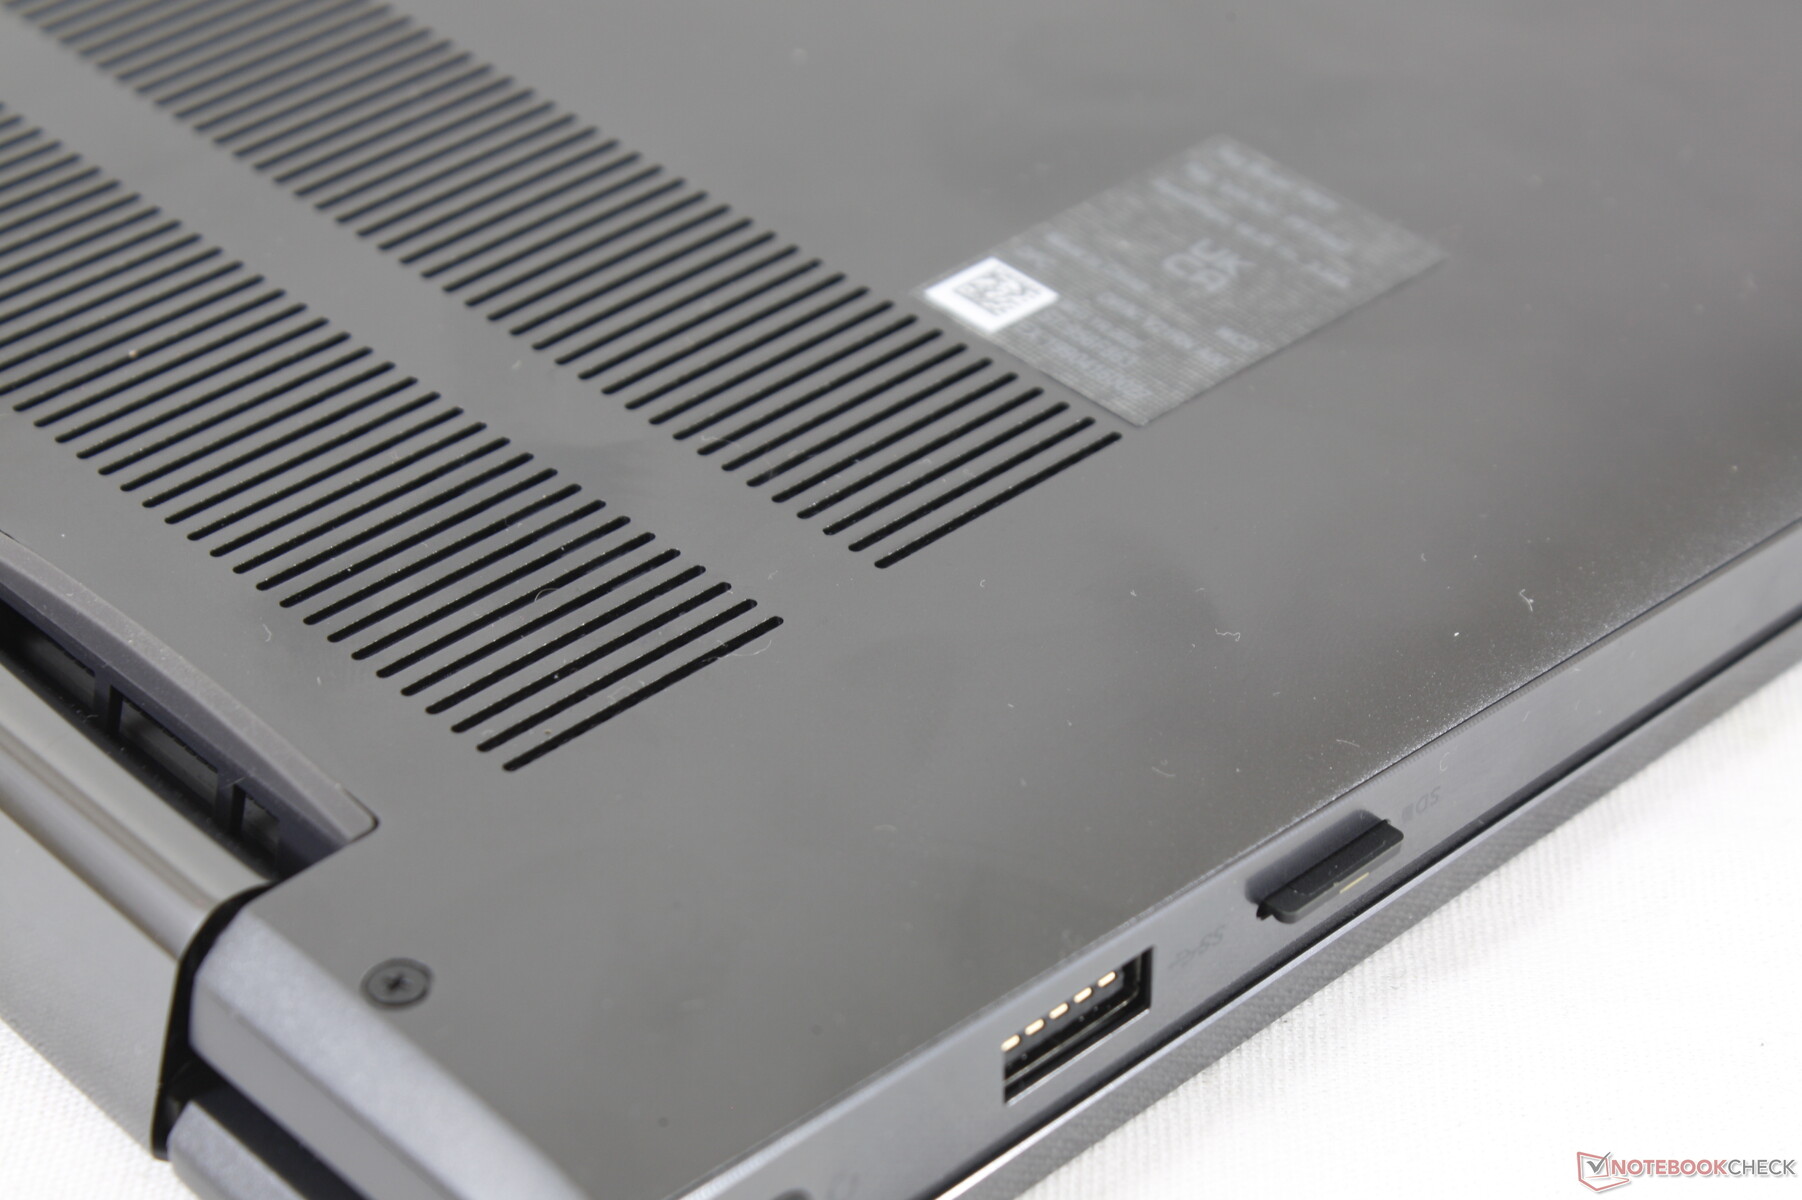
Black Edition, Silver Edition'daki tam boyutlu SD okuyucuyu daha küçük bir MicroSD okuyucu ile değiştirir. MicroSD'den tam boyutlu SD adaptörlerine oldukça yaygın olduğu için bu uygunsuz bir değişiklik.
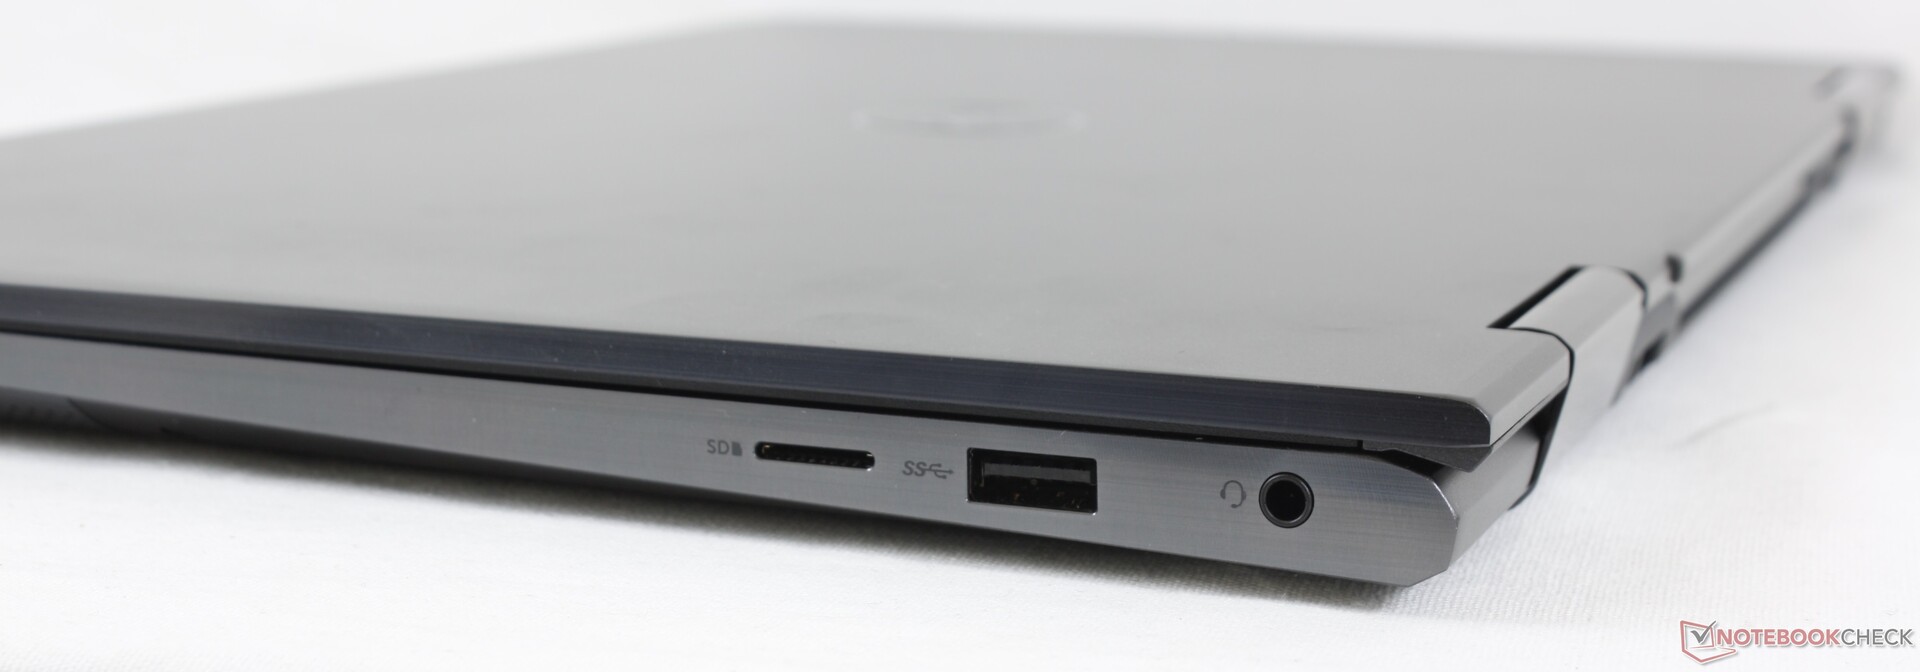
SD Kart Okuyucu
SD kart okuyucusundan aktarım hızları, Silver Edition'daki kadar yavaştır. 1 GB boyutundaki resmi UHS-II kartımızdan masaüstüne taşımak yaklaşık 50 saniye sürer.
| SD Card Reader | |
| average JPG Copy Test (av. of 3 runs) | |
| Microsoft Surface Book 3 15 (Toshiba Exceria Pro M501 microSDXC 64GB) | |
| Samsung Galaxy Book Flex 15-NP950 (Toshiba Exceria Pro M501 microSDXC 64GB) | |
| HP Envy x360 15-ee0257ng (Toshiba Exceria Pro SDXC 64 GB UHS-II) | |
| Asus ZenBook Flip 15 UX563FD-A1027T (Toshiba Exceria Pro SDXC 64 GB UHS-II) | |
| Dell Inspiron 15 7506 2-in-1 P97F (Toshiba Exceria Pro SDXC 64 GB UHS-II) | |
| Dell Inspiron 15 7000 7506 2-in-1 Black Edition (Toshiba Exceria Pro M501 microSDXC 32GB) | |
| maximum AS SSD Seq Read Test (1GB) | |
| Microsoft Surface Book 3 15 (Toshiba Exceria Pro M501 microSDXC 64GB) | |
| Samsung Galaxy Book Flex 15-NP950 (Toshiba Exceria Pro M501 microSDXC 64GB) | |
| HP Envy x360 15-ee0257ng (Toshiba Exceria Pro SDXC 64 GB UHS-II) | |
| Dell Inspiron 15 7506 2-in-1 P97F (Toshiba Exceria Pro SDXC 64 GB UHS-II) | |
| Dell Inspiron 15 7000 7506 2-in-1 Black Edition (Toshiba Exceria Pro M501 microSDXC 32GB) | |
İletişim
Netgear RAX200 yönlendiricimizle eşleştirildiğinde hiçbir bağlantı sorunu yaşamadık. Ancak aktarım hızları, Silver Edition modelinde kaydettiğimizden daha yavaş.
| Networking | |
| iperf3 transmit AX12 | |
| Lenovo Yoga C740-15IML | |
| Samsung Galaxy Book Flex 15-NP950 | |
| Dell Inspiron 15 7506 2-in-1 P97F | |
| Dell Inspiron 15 7000 7506 2-in-1 Black Edition | |
| Microsoft Surface Book 3 15 | |
| Asus ZenBook Flip 15 UX563FD-A1027T | |
| HP Envy x360 15-ee0257ng | |
| iperf3 receive AX12 | |
| Lenovo Yoga C740-15IML | |
| Dell Inspiron 15 7506 2-in-1 P97F | |
| Samsung Galaxy Book Flex 15-NP950 | |
| Microsoft Surface Book 3 15 | |
| Asus ZenBook Flip 15 UX563FD-A1027T | |
| Dell Inspiron 15 7000 7506 2-in-1 Black Edition | |
| HP Envy x360 15-ee0257ng | |
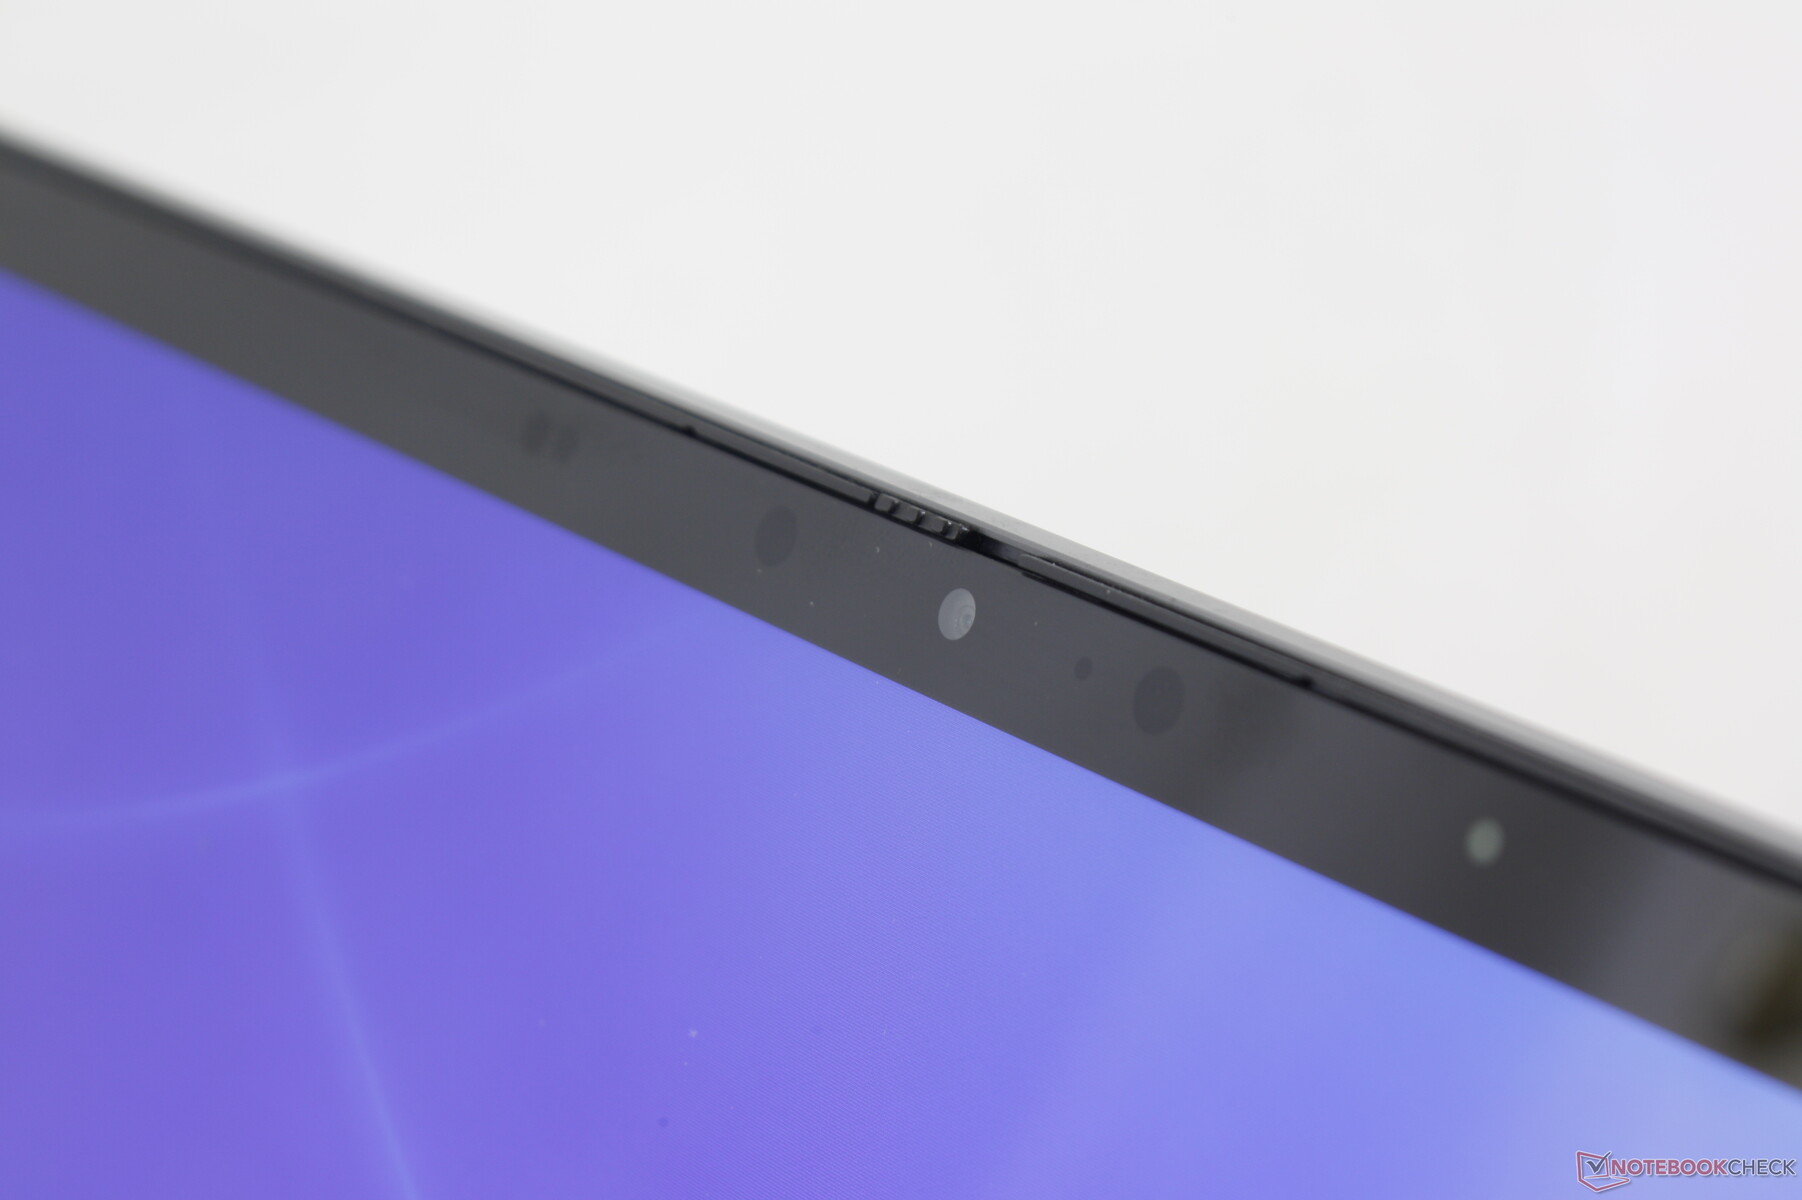
Web kamerası


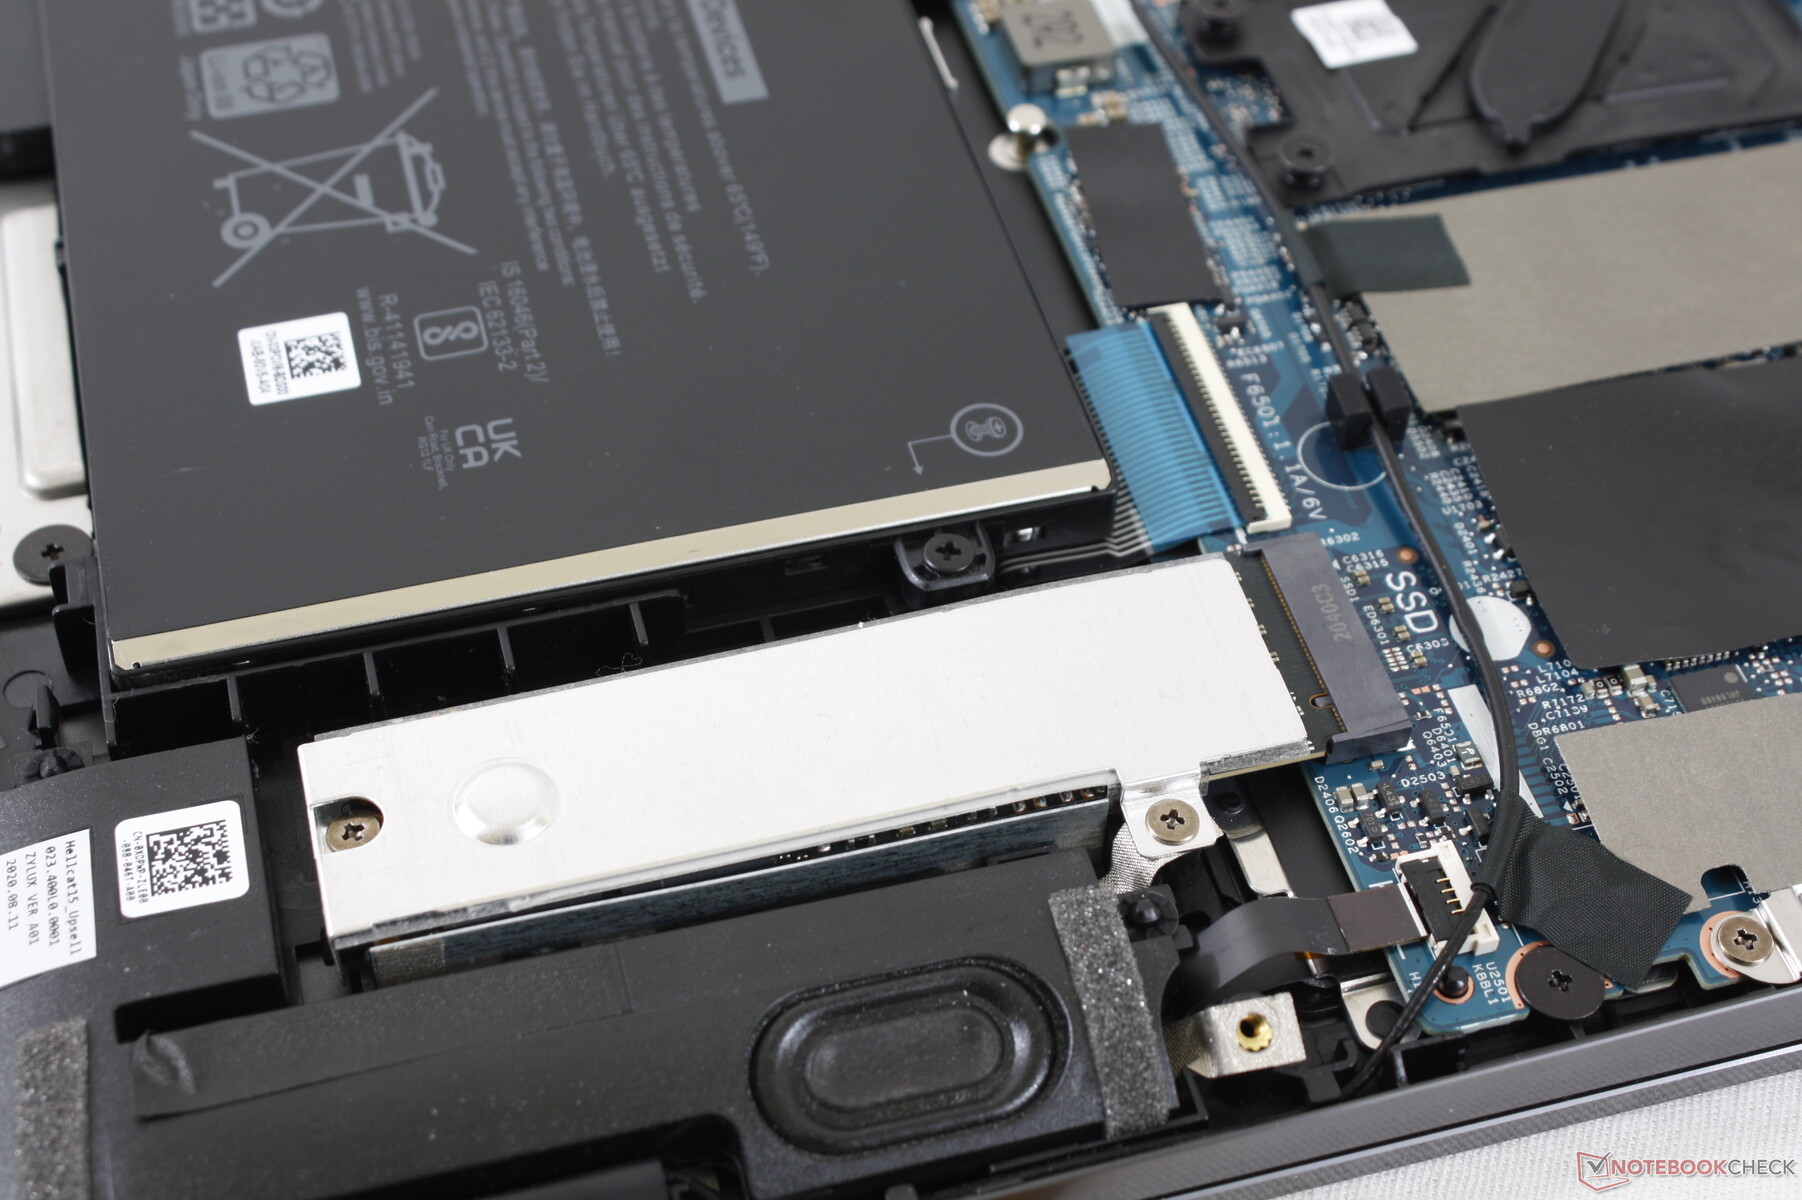
Maintenance
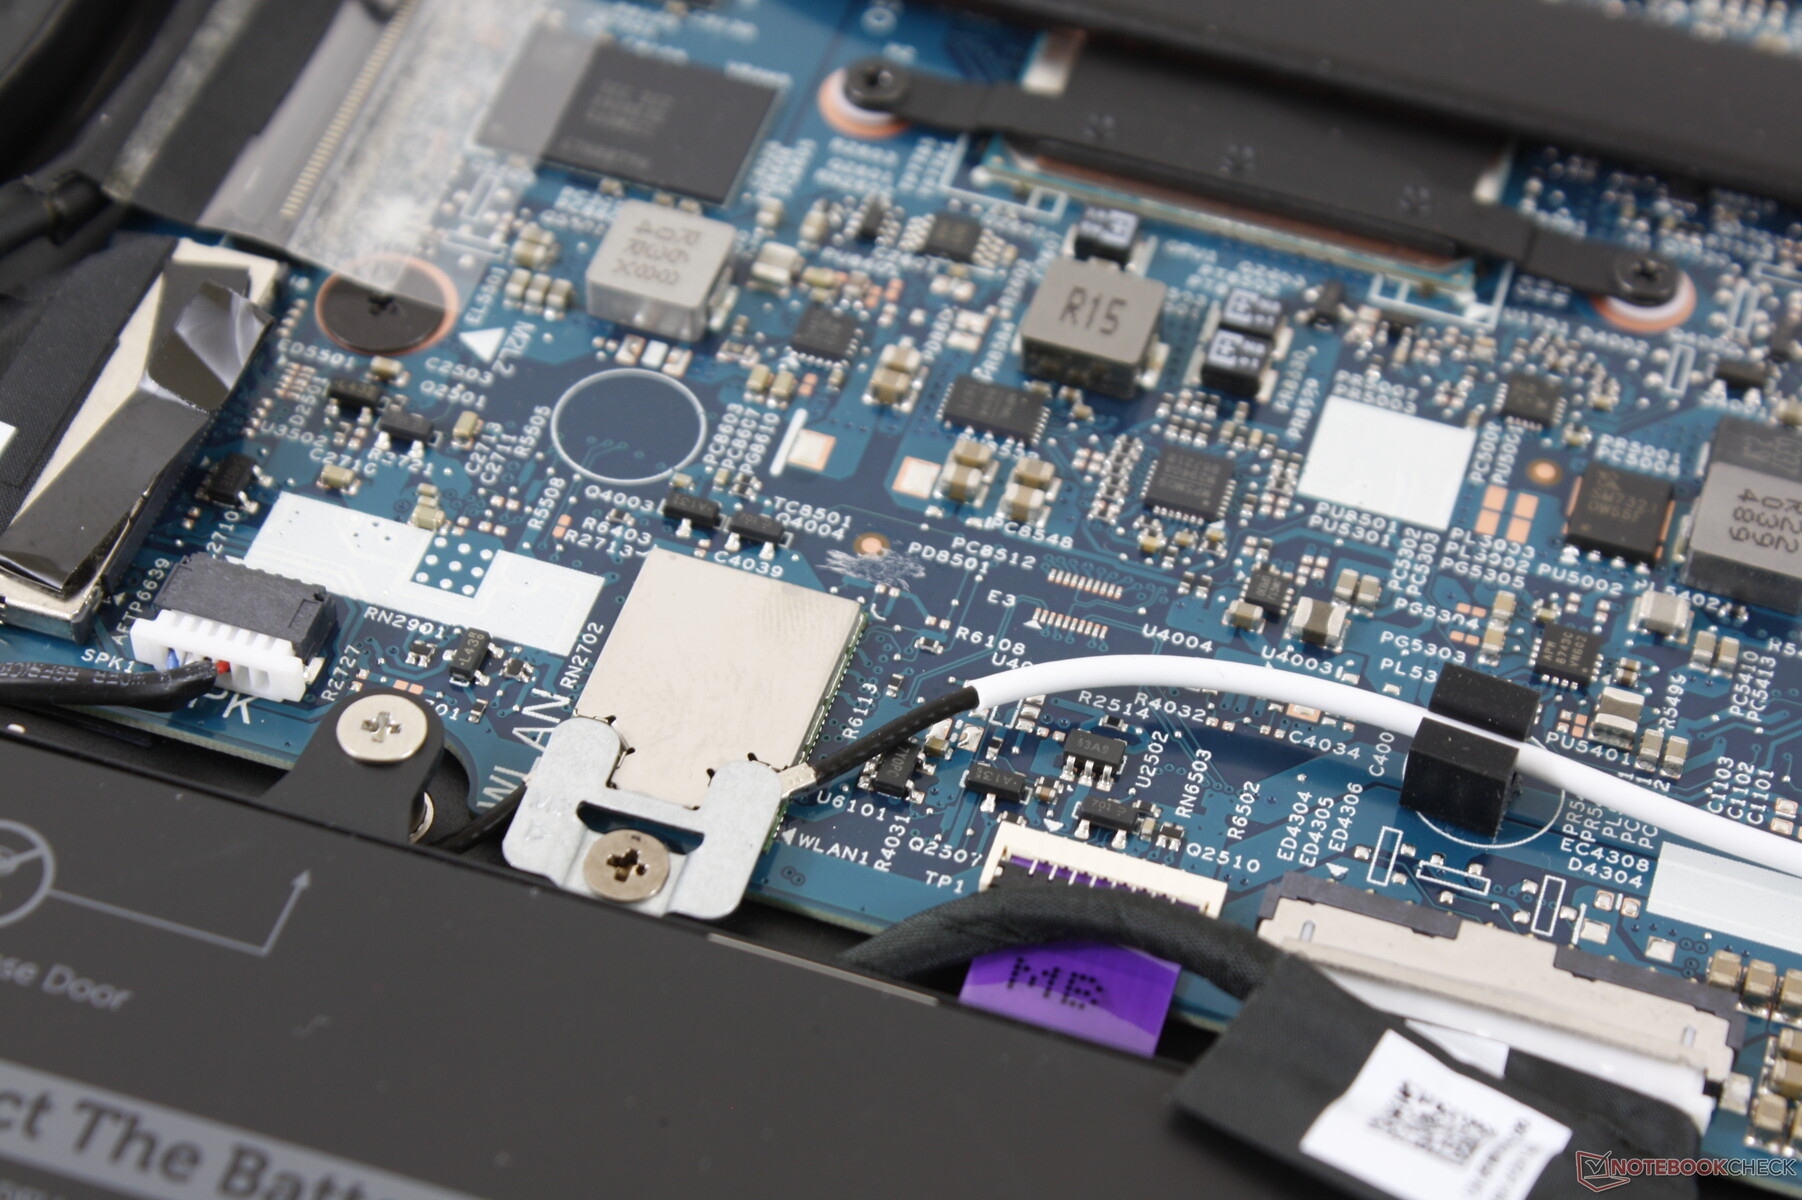
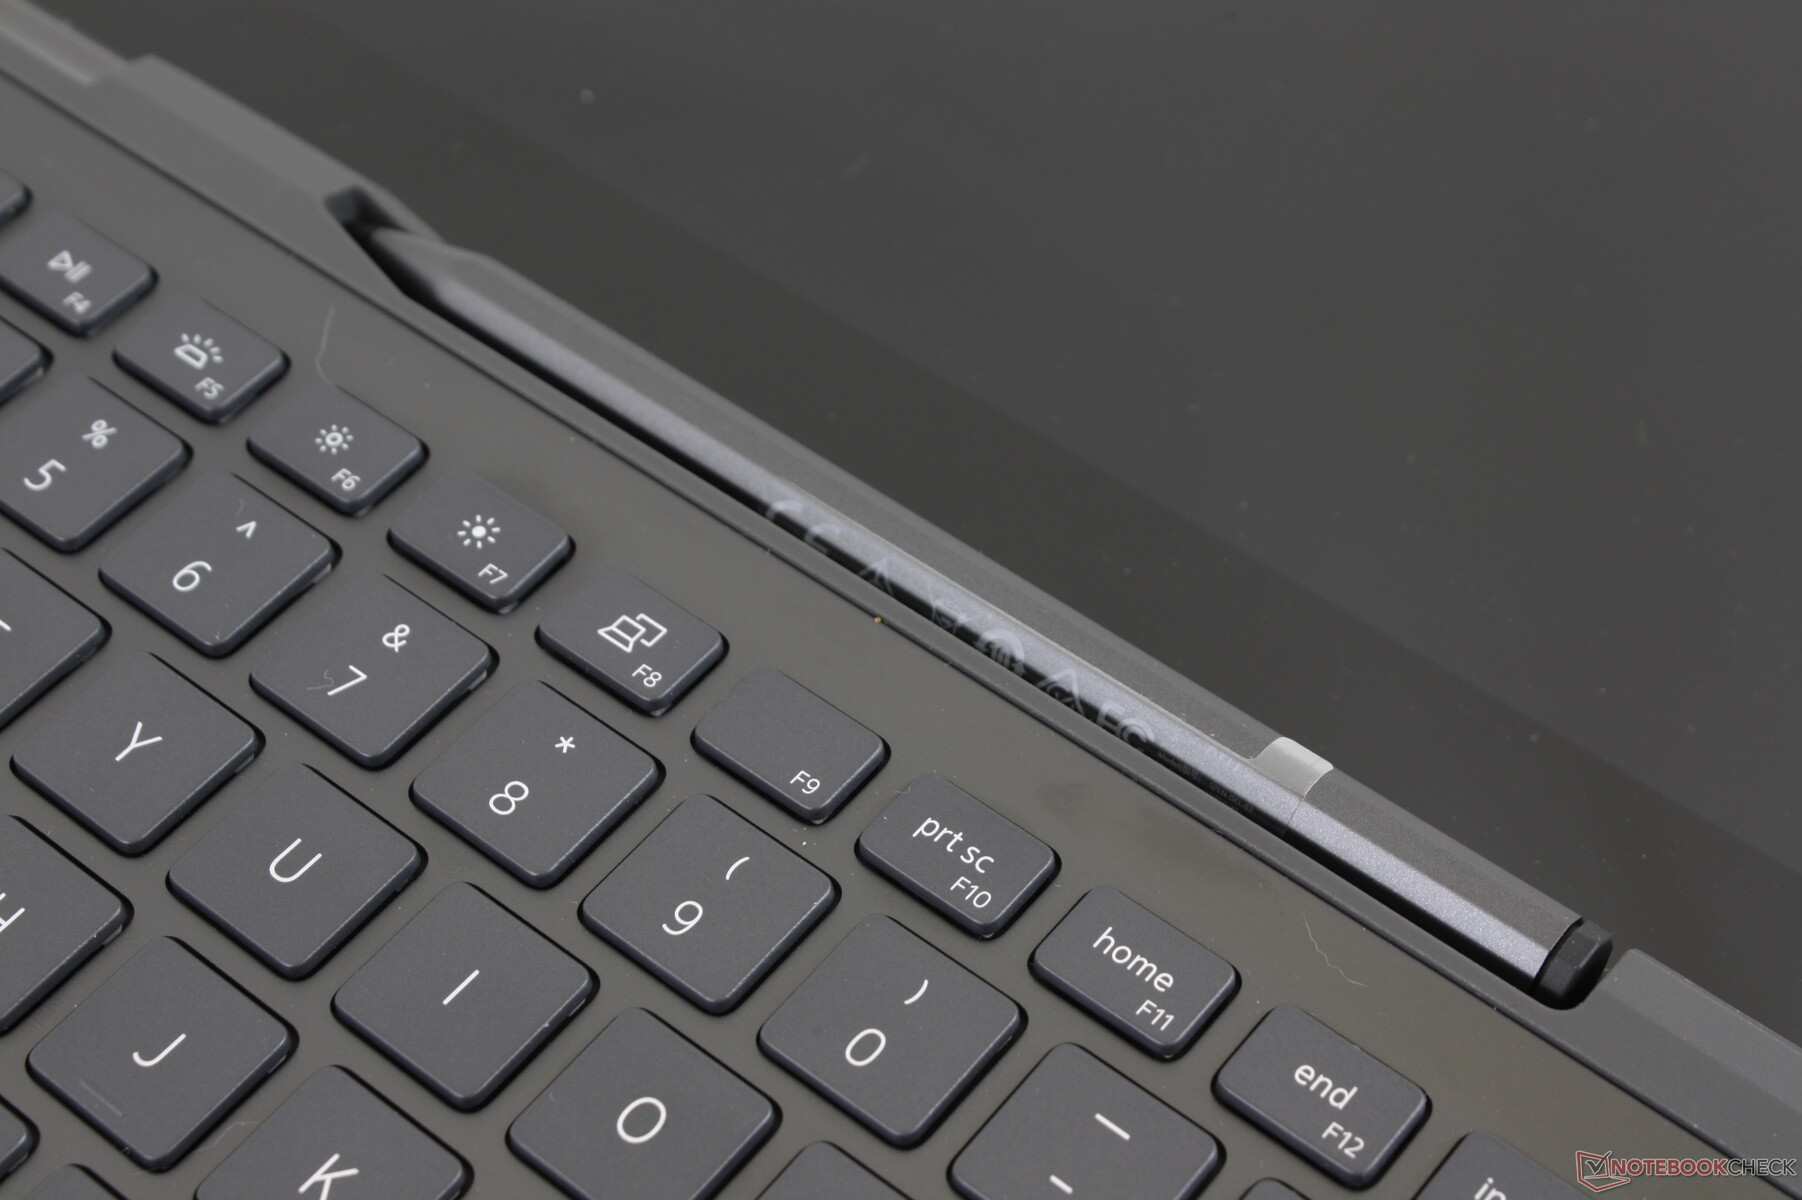
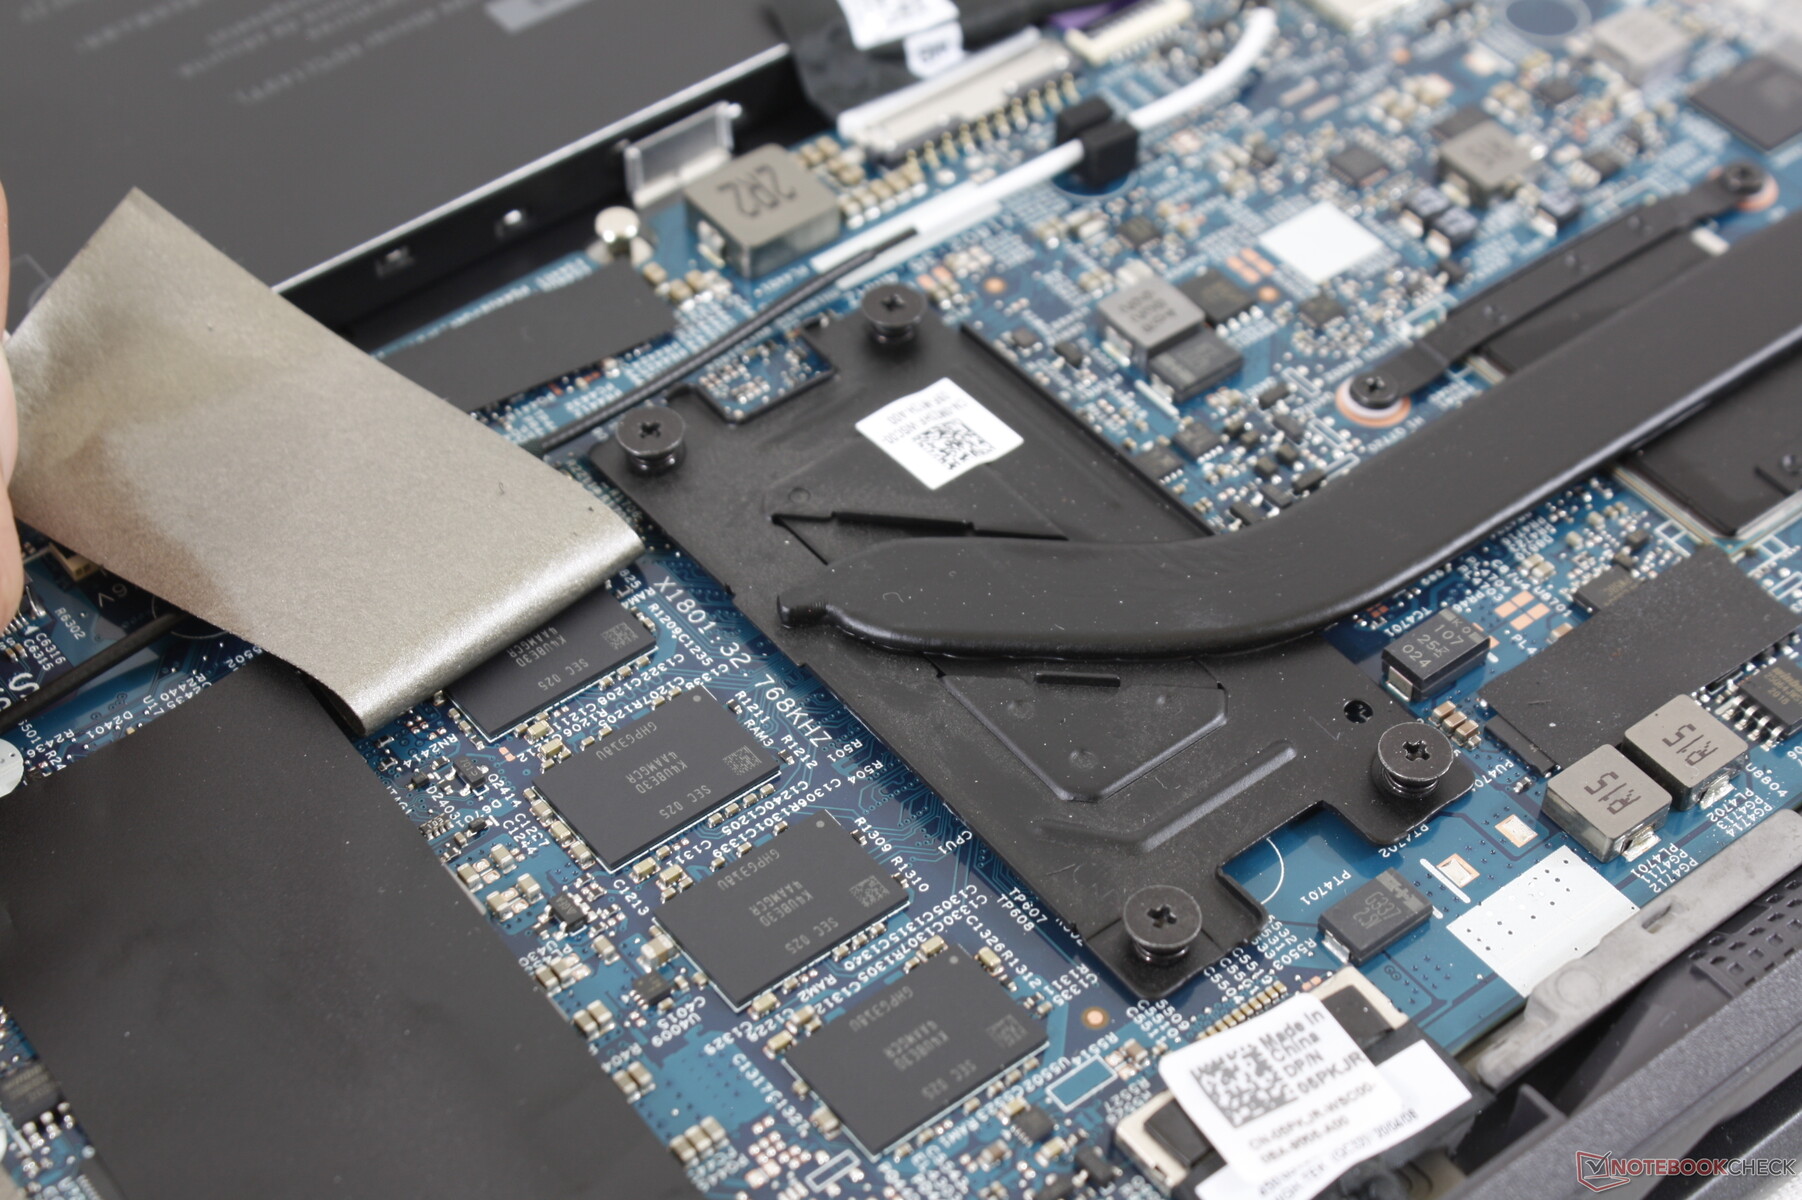
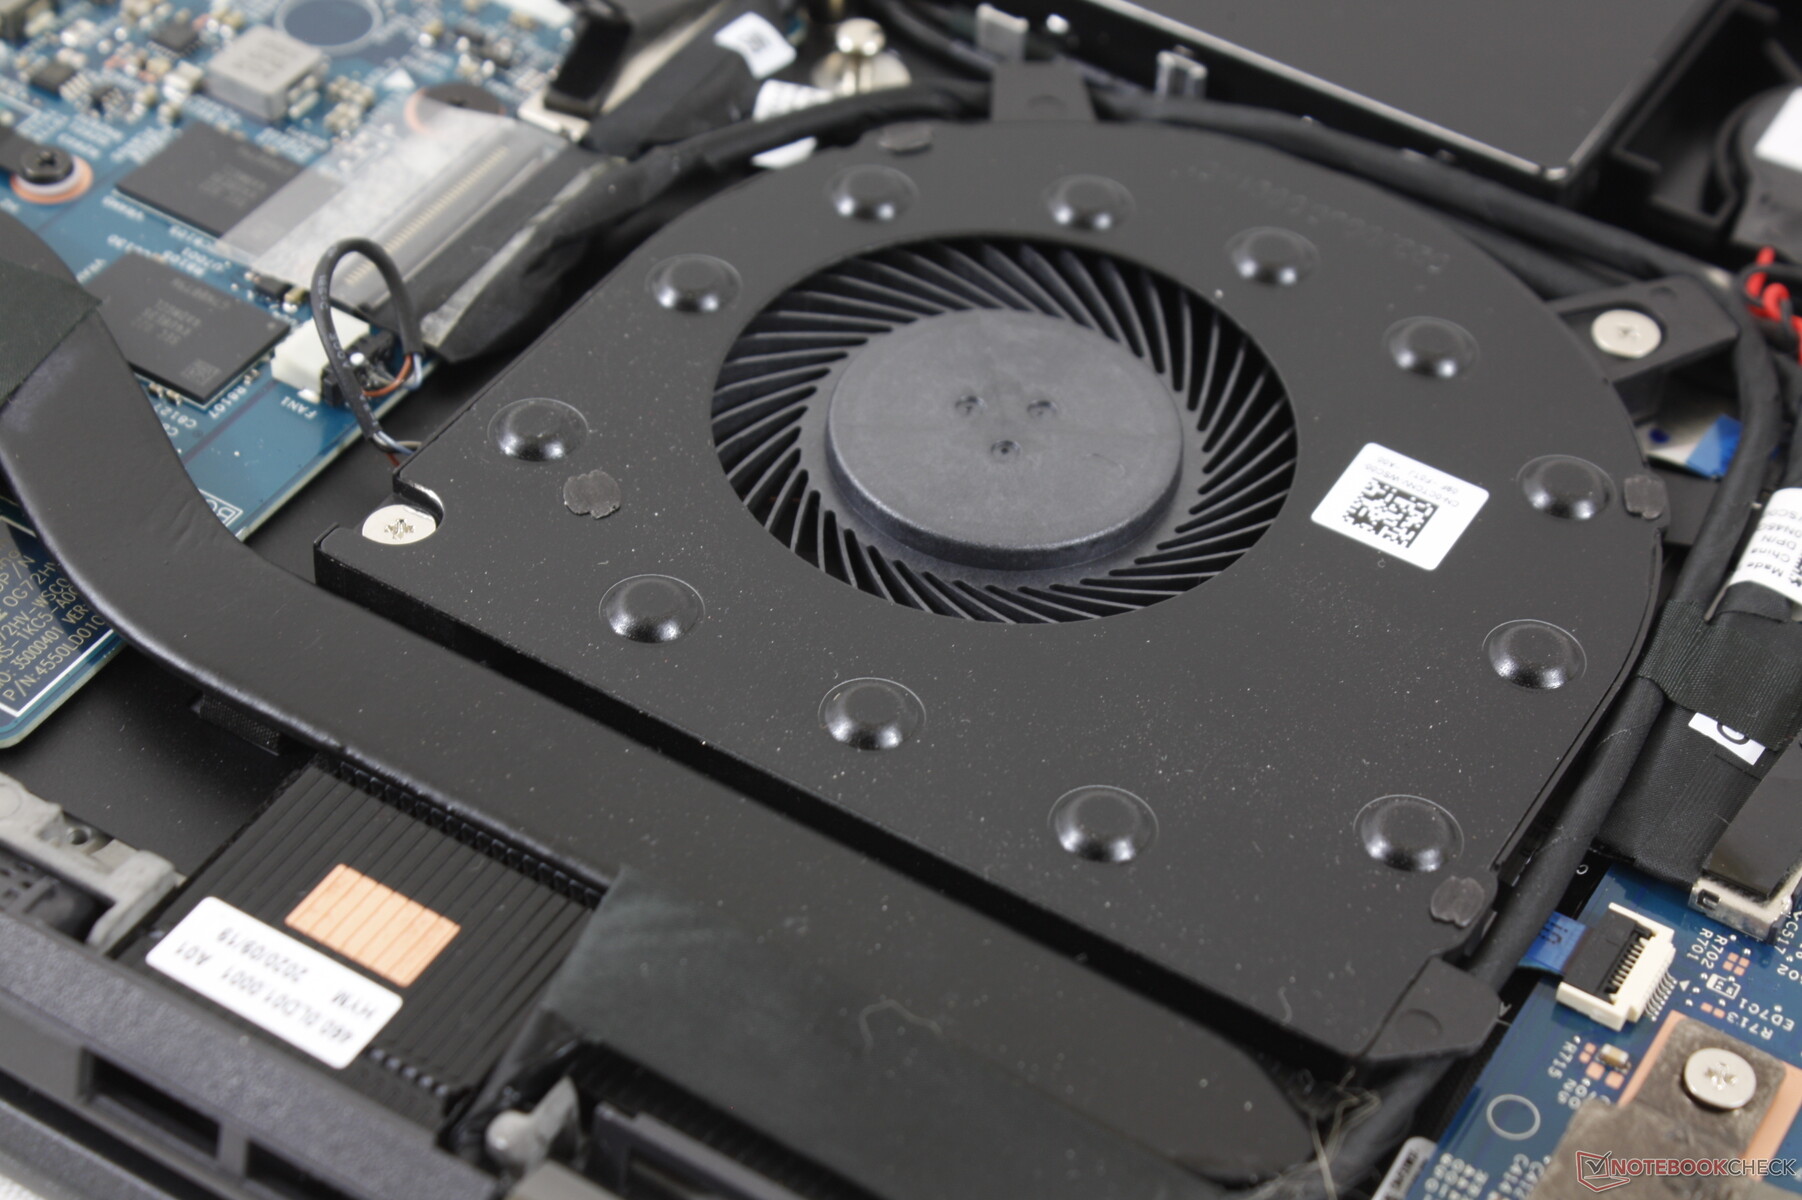
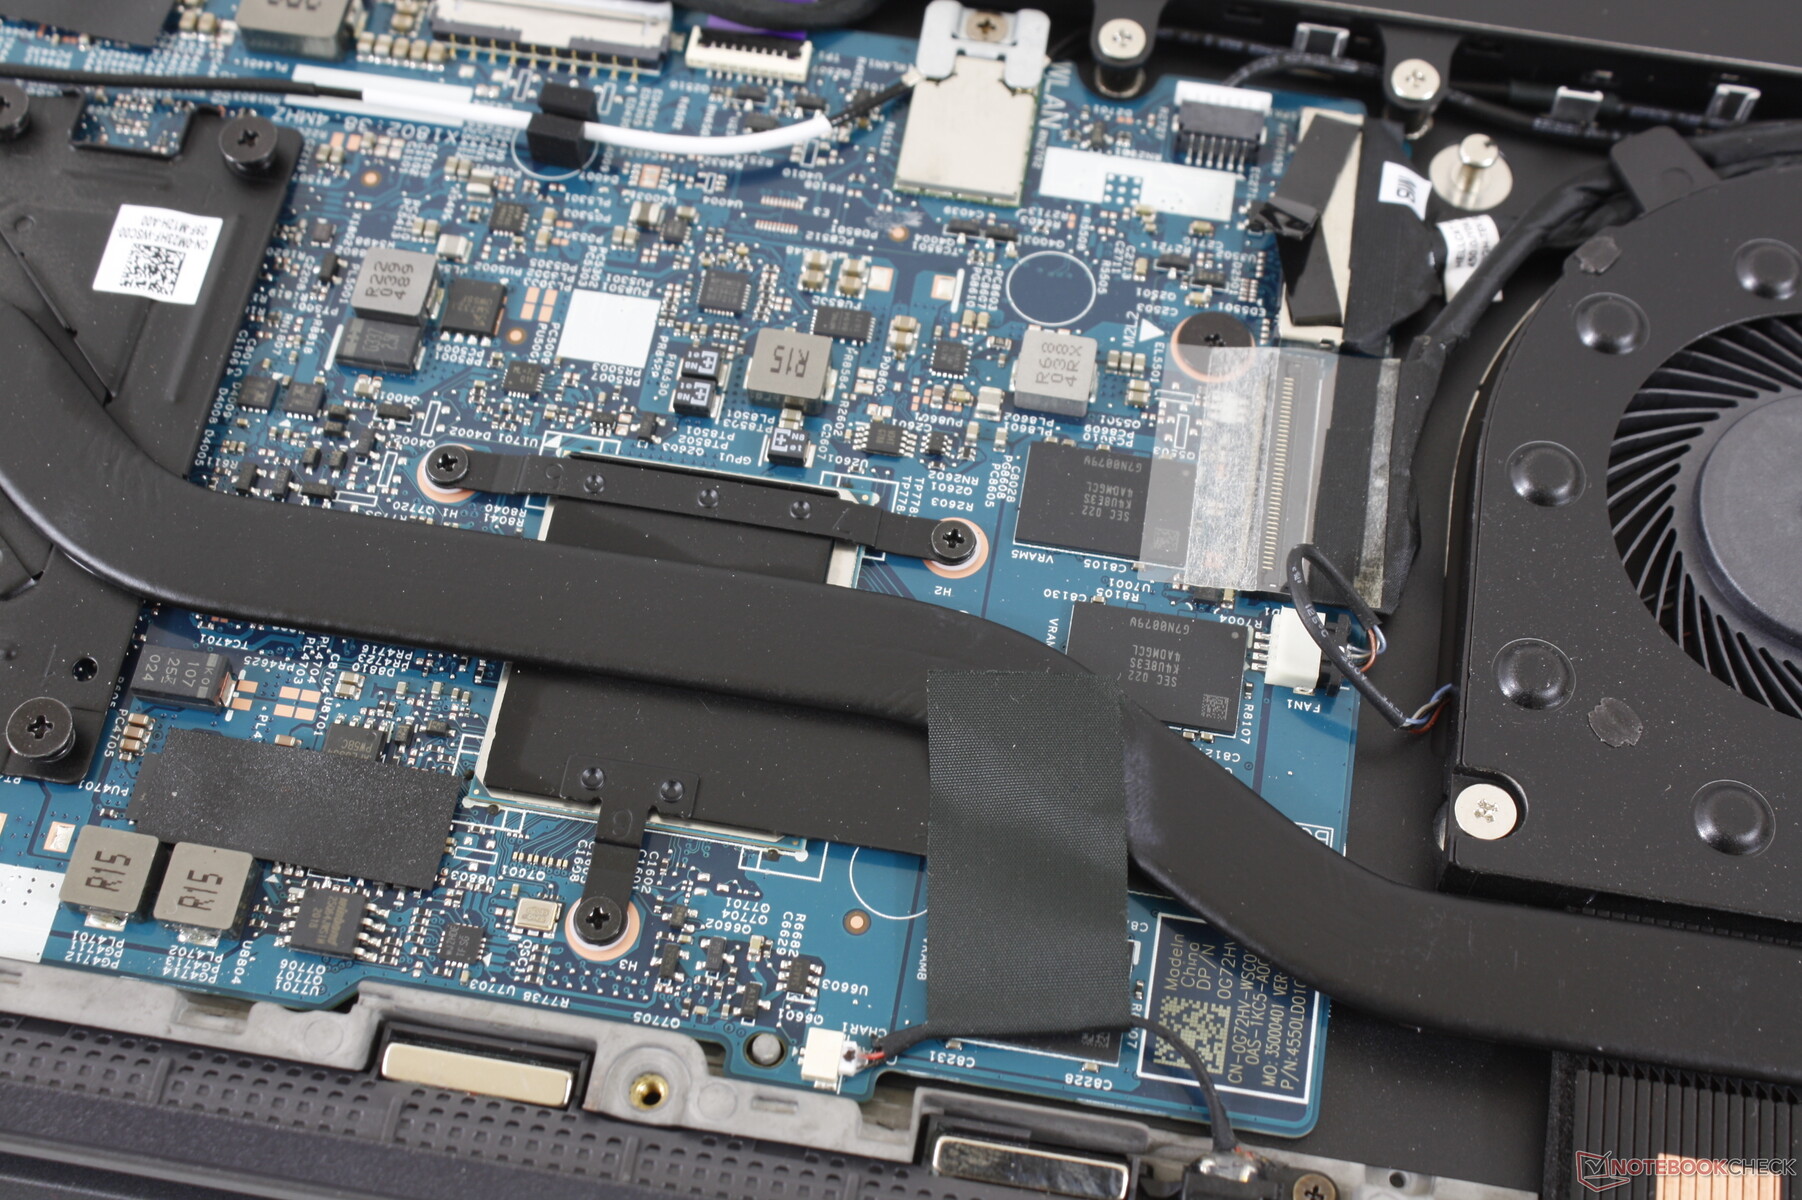
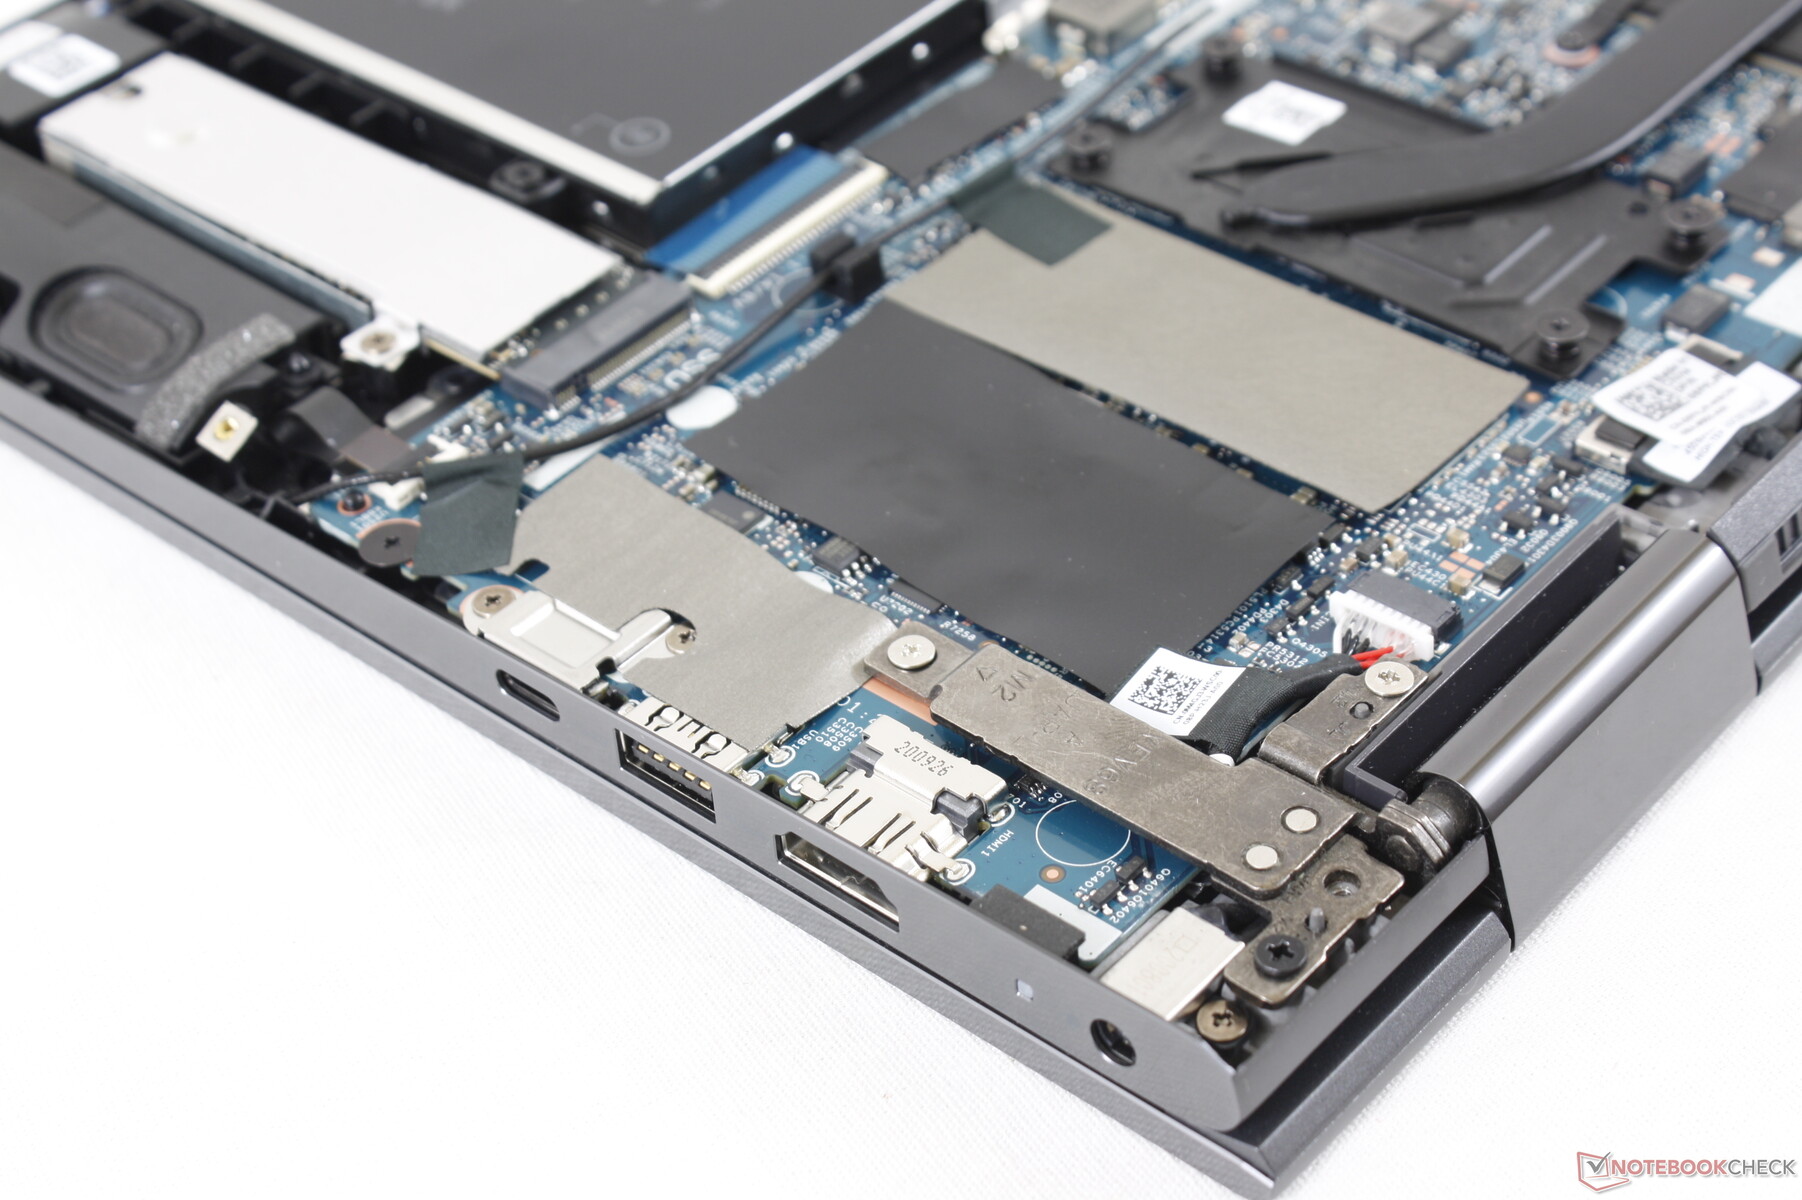
The bottom panel is very easy to remove and service. Nonetheless, keep in mind that both RAM and WLAN are soldered here unlike on the Silver Edition.
Accessories and Warranty
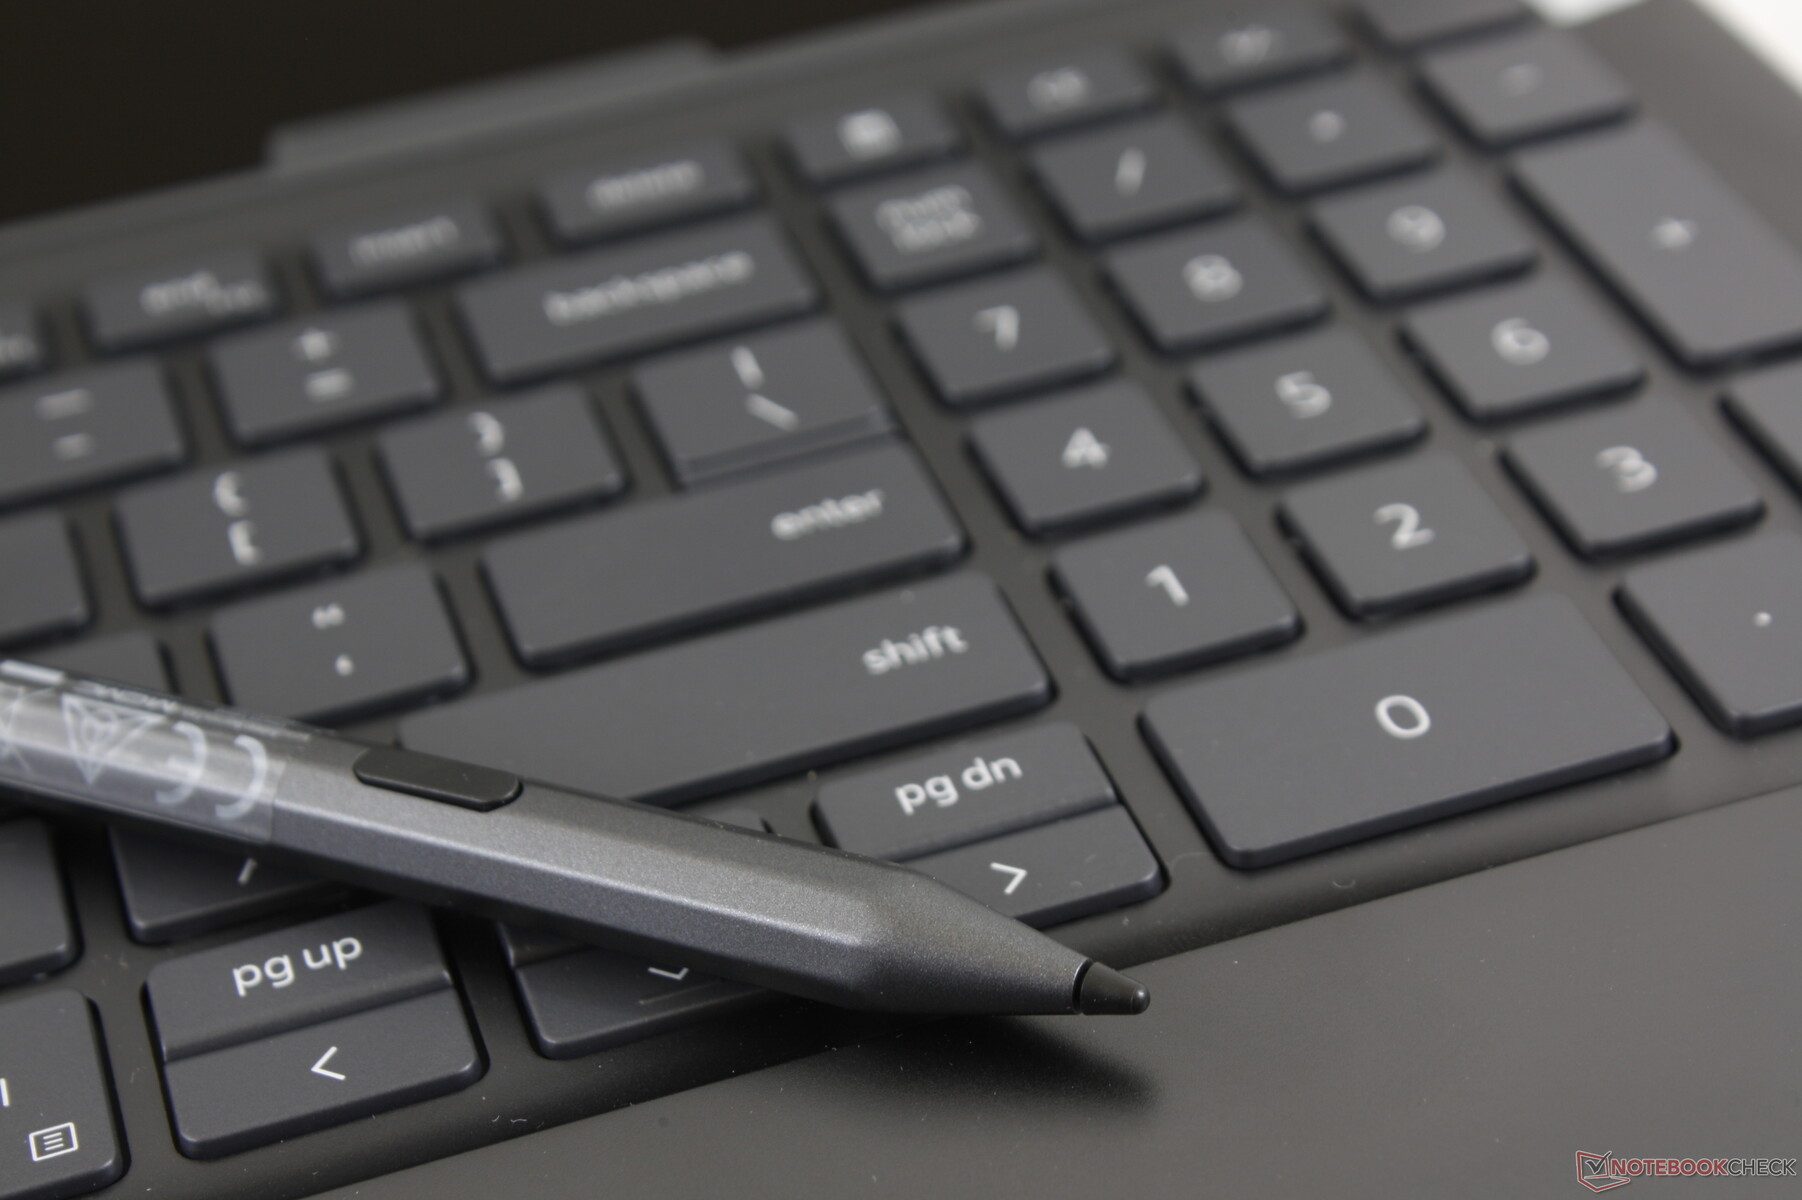
The box includes the Dell PN771M active pen. We find the pen to be more ergonomic than the Lenovo pen on the Yoga C940 because the Dell is thicker and easier to grip.
The standard one-year limited warranty applies with plenty of extensions options if purchased from Dell.
Input Devices
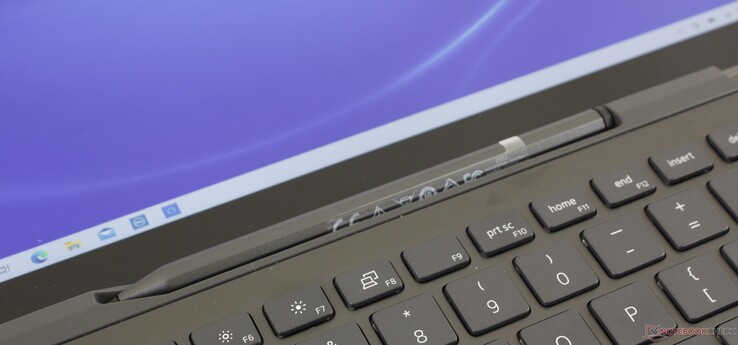
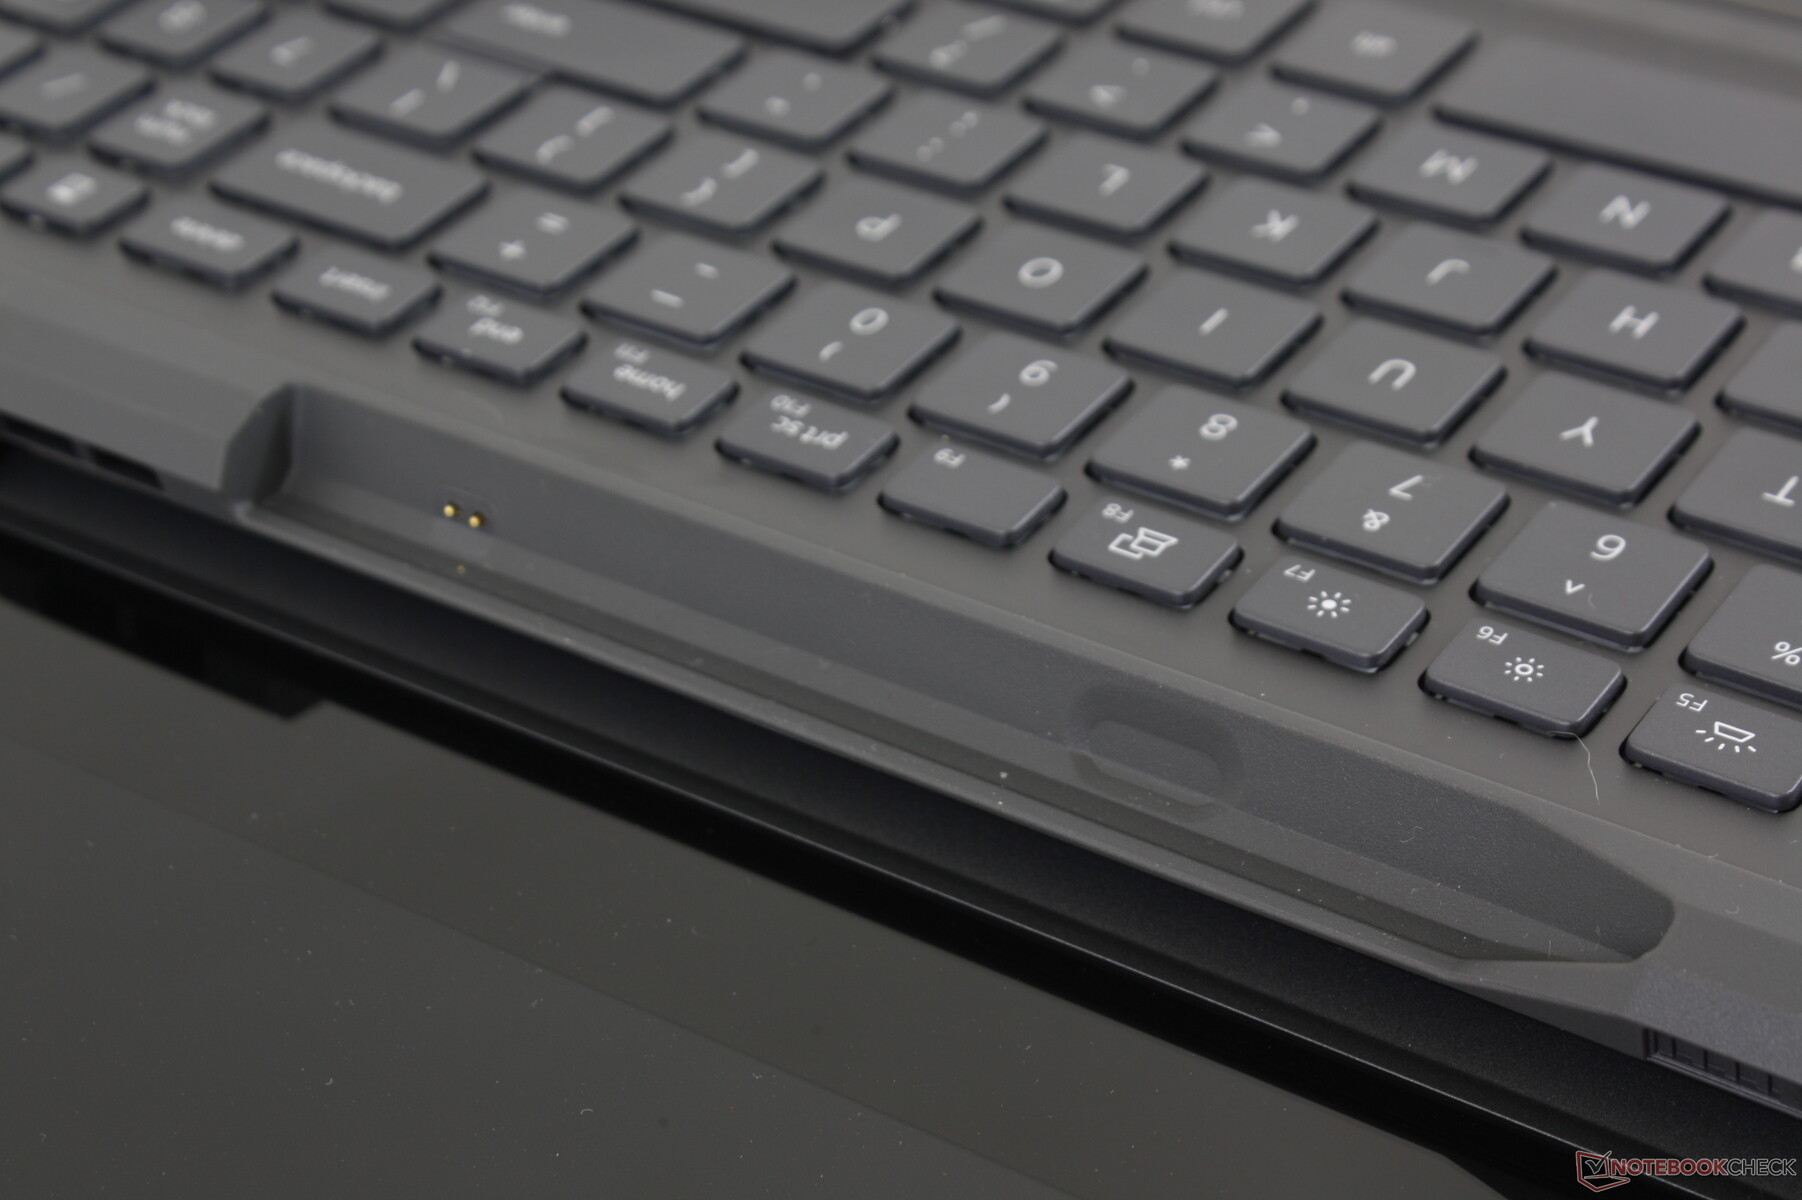
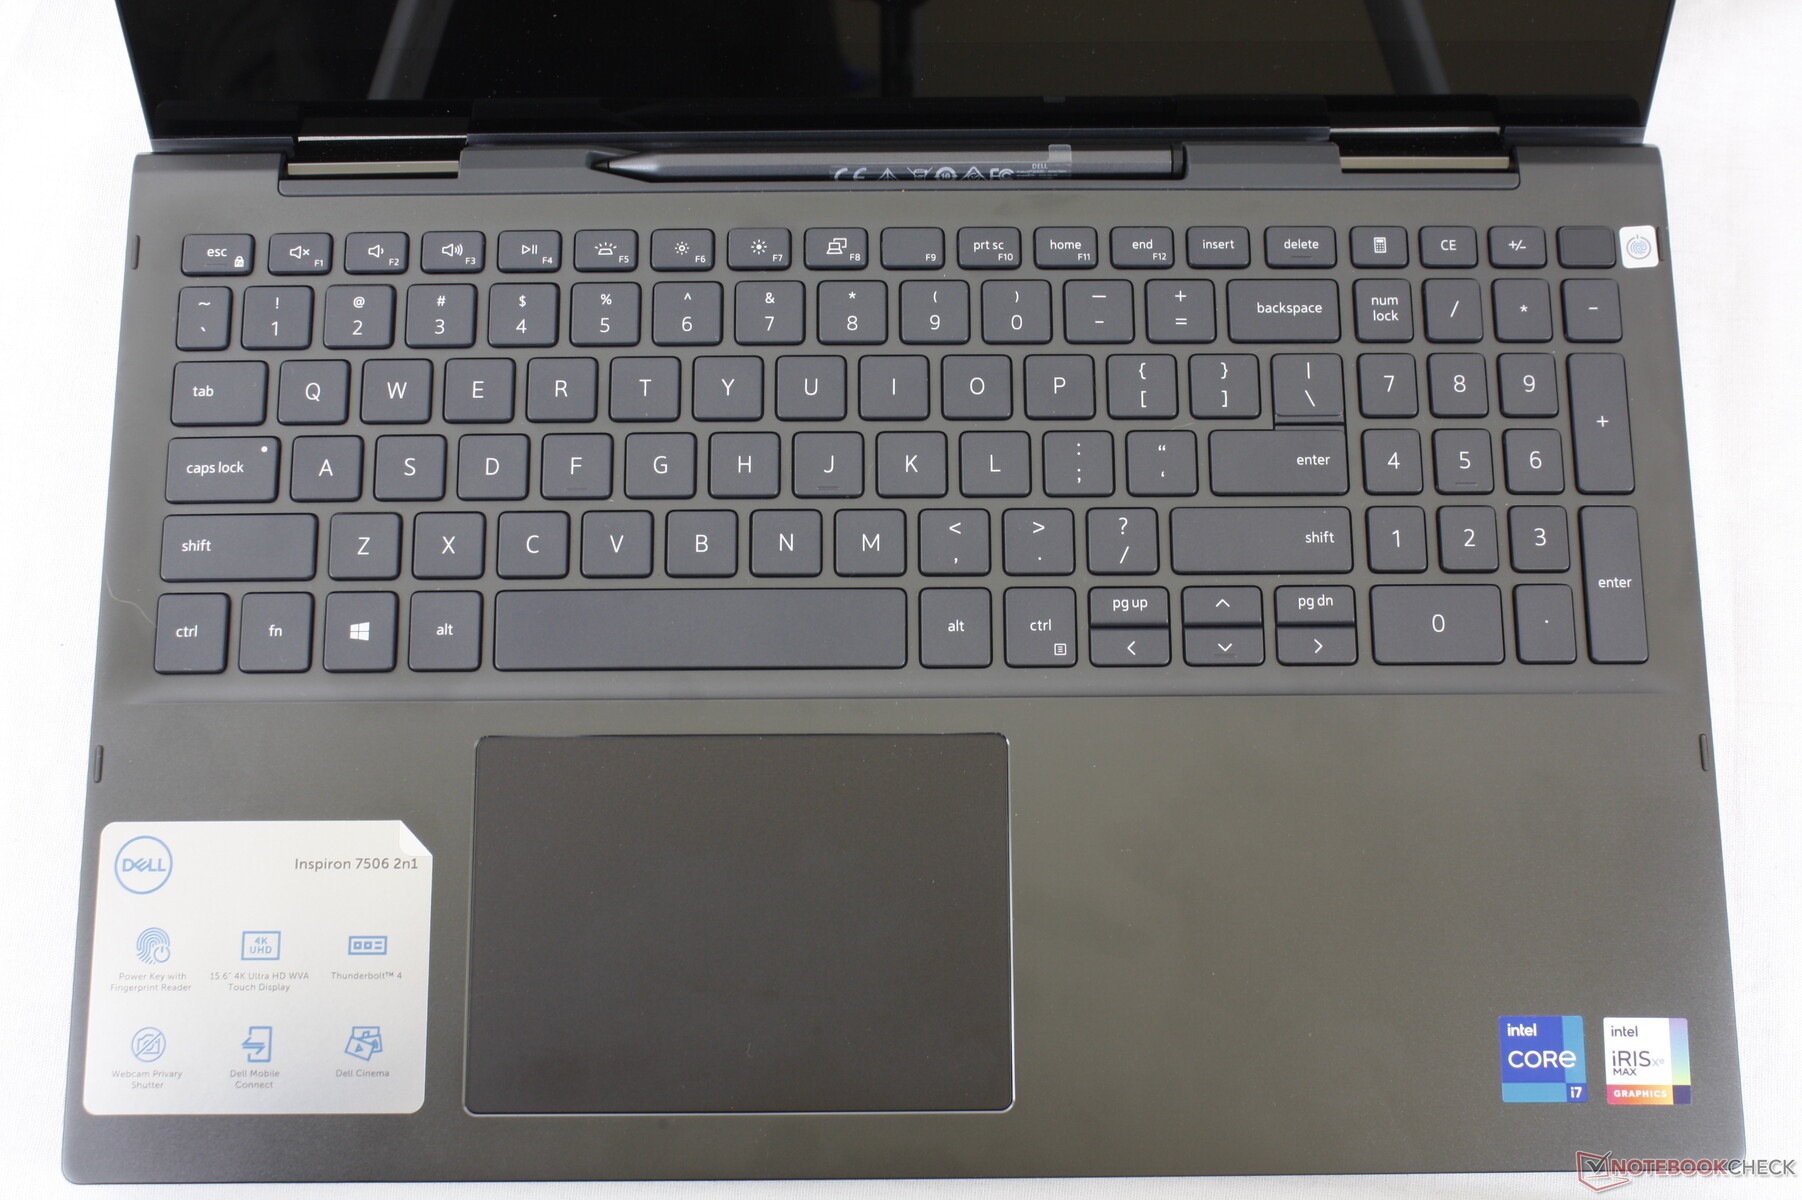
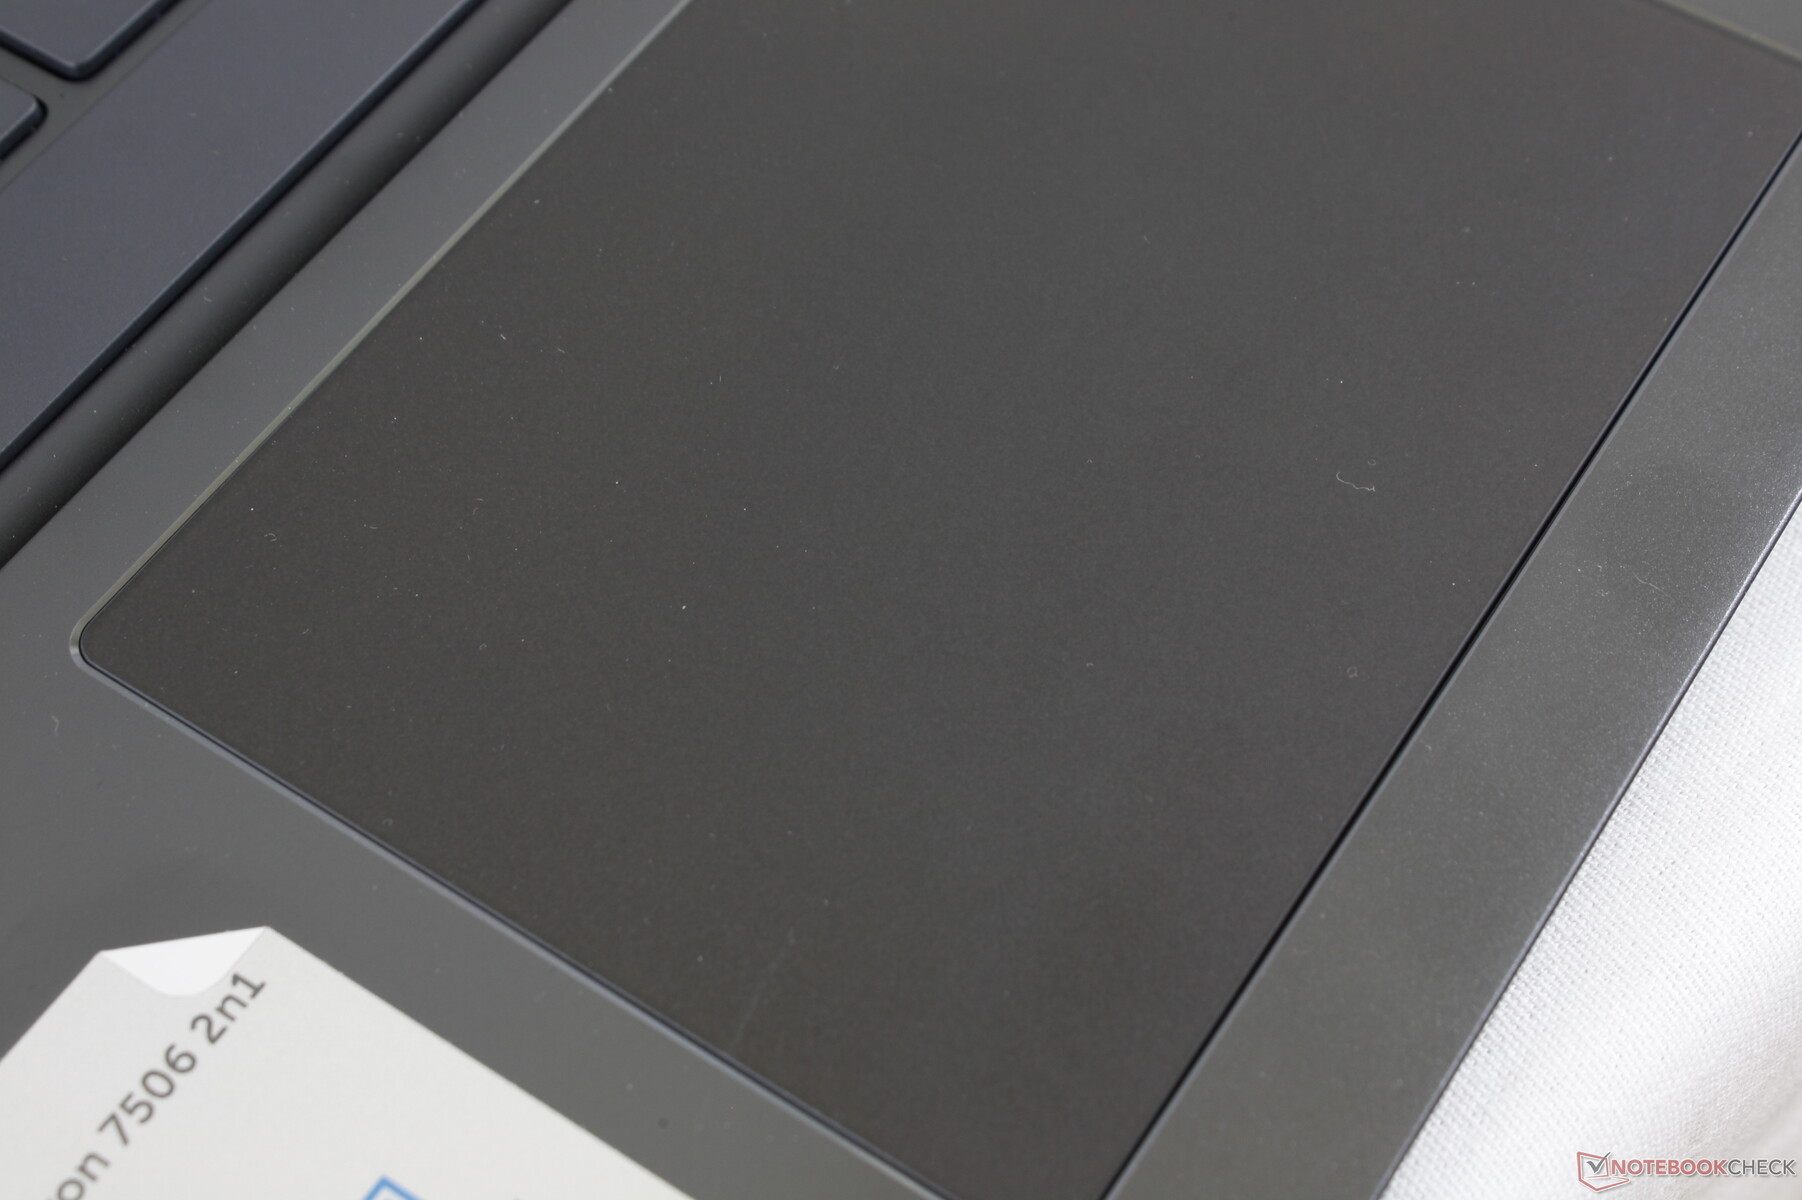
Though the Black Edition shares the same keyboard and clickpad as on the Silver Edition, the symbols on each key are actually much easier to see since the white font contrasts better with the black key caps when compared to the gray font and silver keycaps of the Silver Edition.
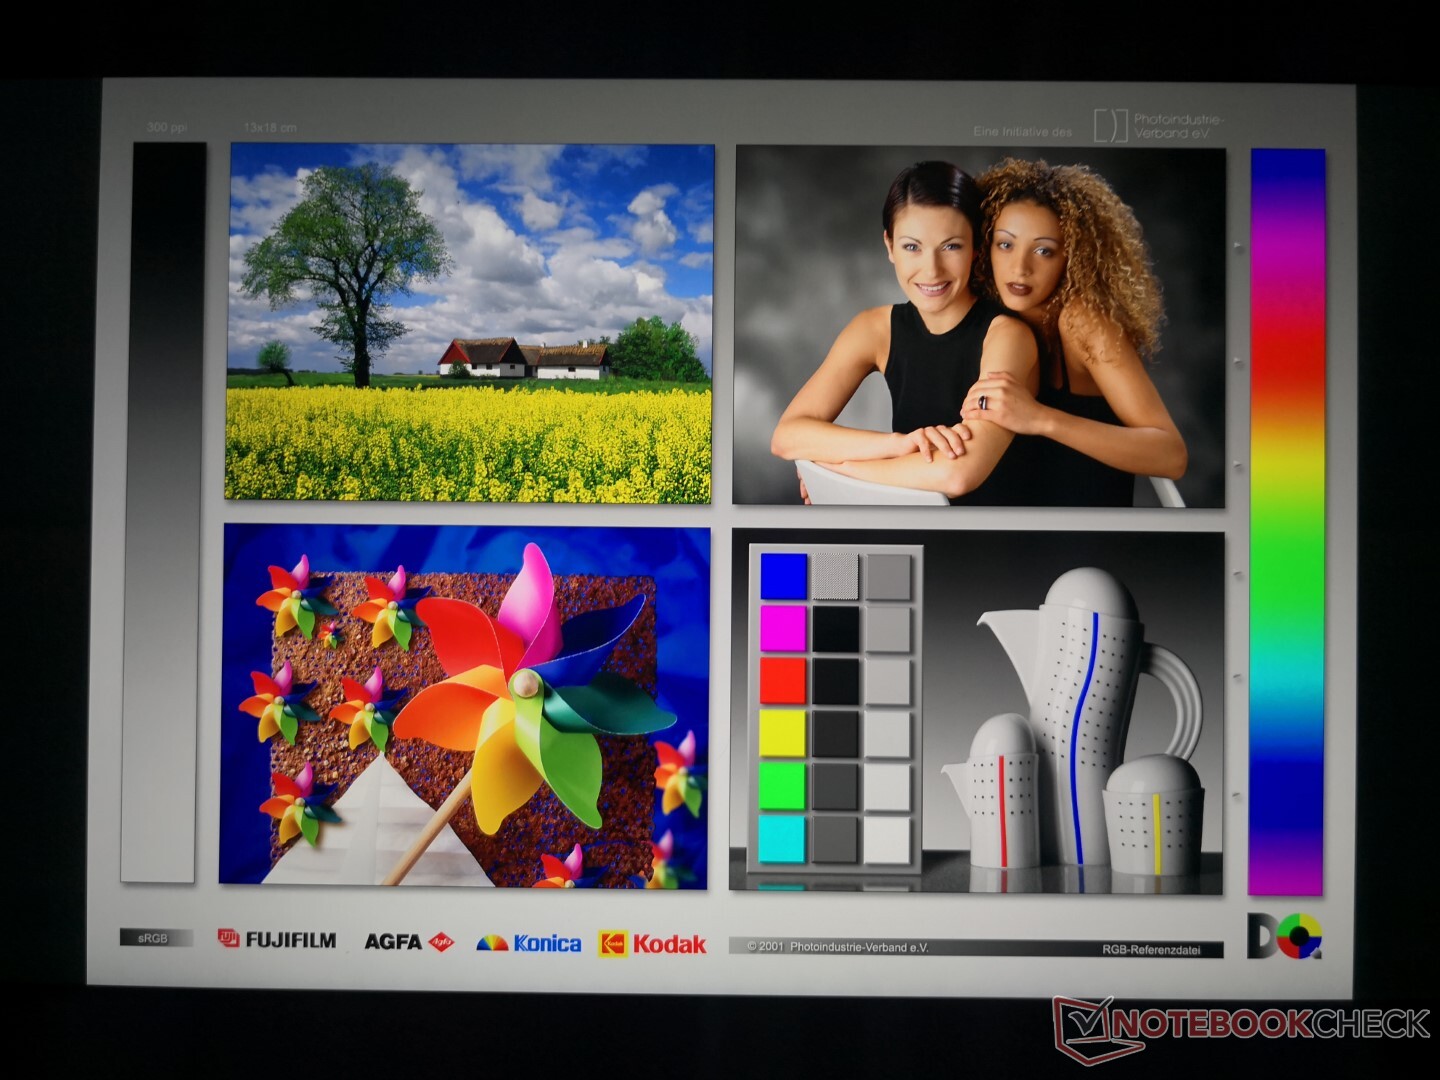
Display
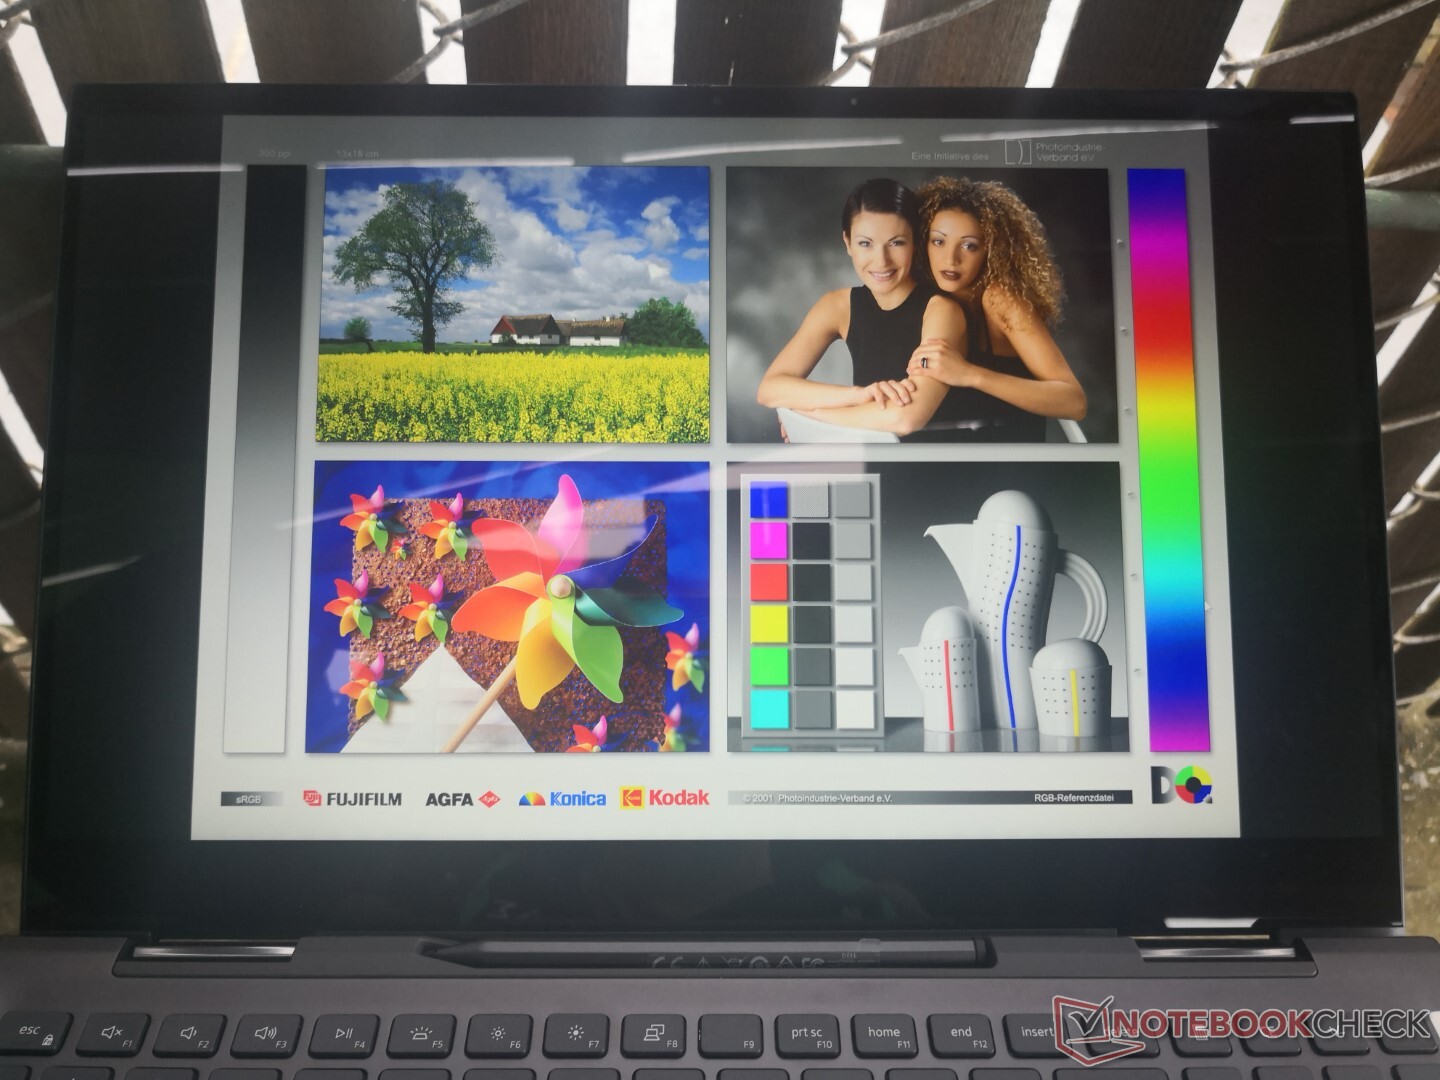
Versions of the AU Optronics B156ZAN IPS panel on our Inspiron Black Edition can also be found on the 4K Inspiron 15 7577 and 4K Precision 7550. Interestingly, however, color coverage is more similar to the Inspiron 7577 while being narrower than on the Precision 7550. Contrast ratio is high at over 1000:1 but the slow black-white and gray-gray response times lead to noticeable ghosting. When accounting for these attributes as whole, the 4K panel here is a mid-range offering that doesn't quite reach the same colors or brightness levels of an XPS 15 but is still better than the base 1080p options on most other laptops.
| |||||||||||||||||||||||||
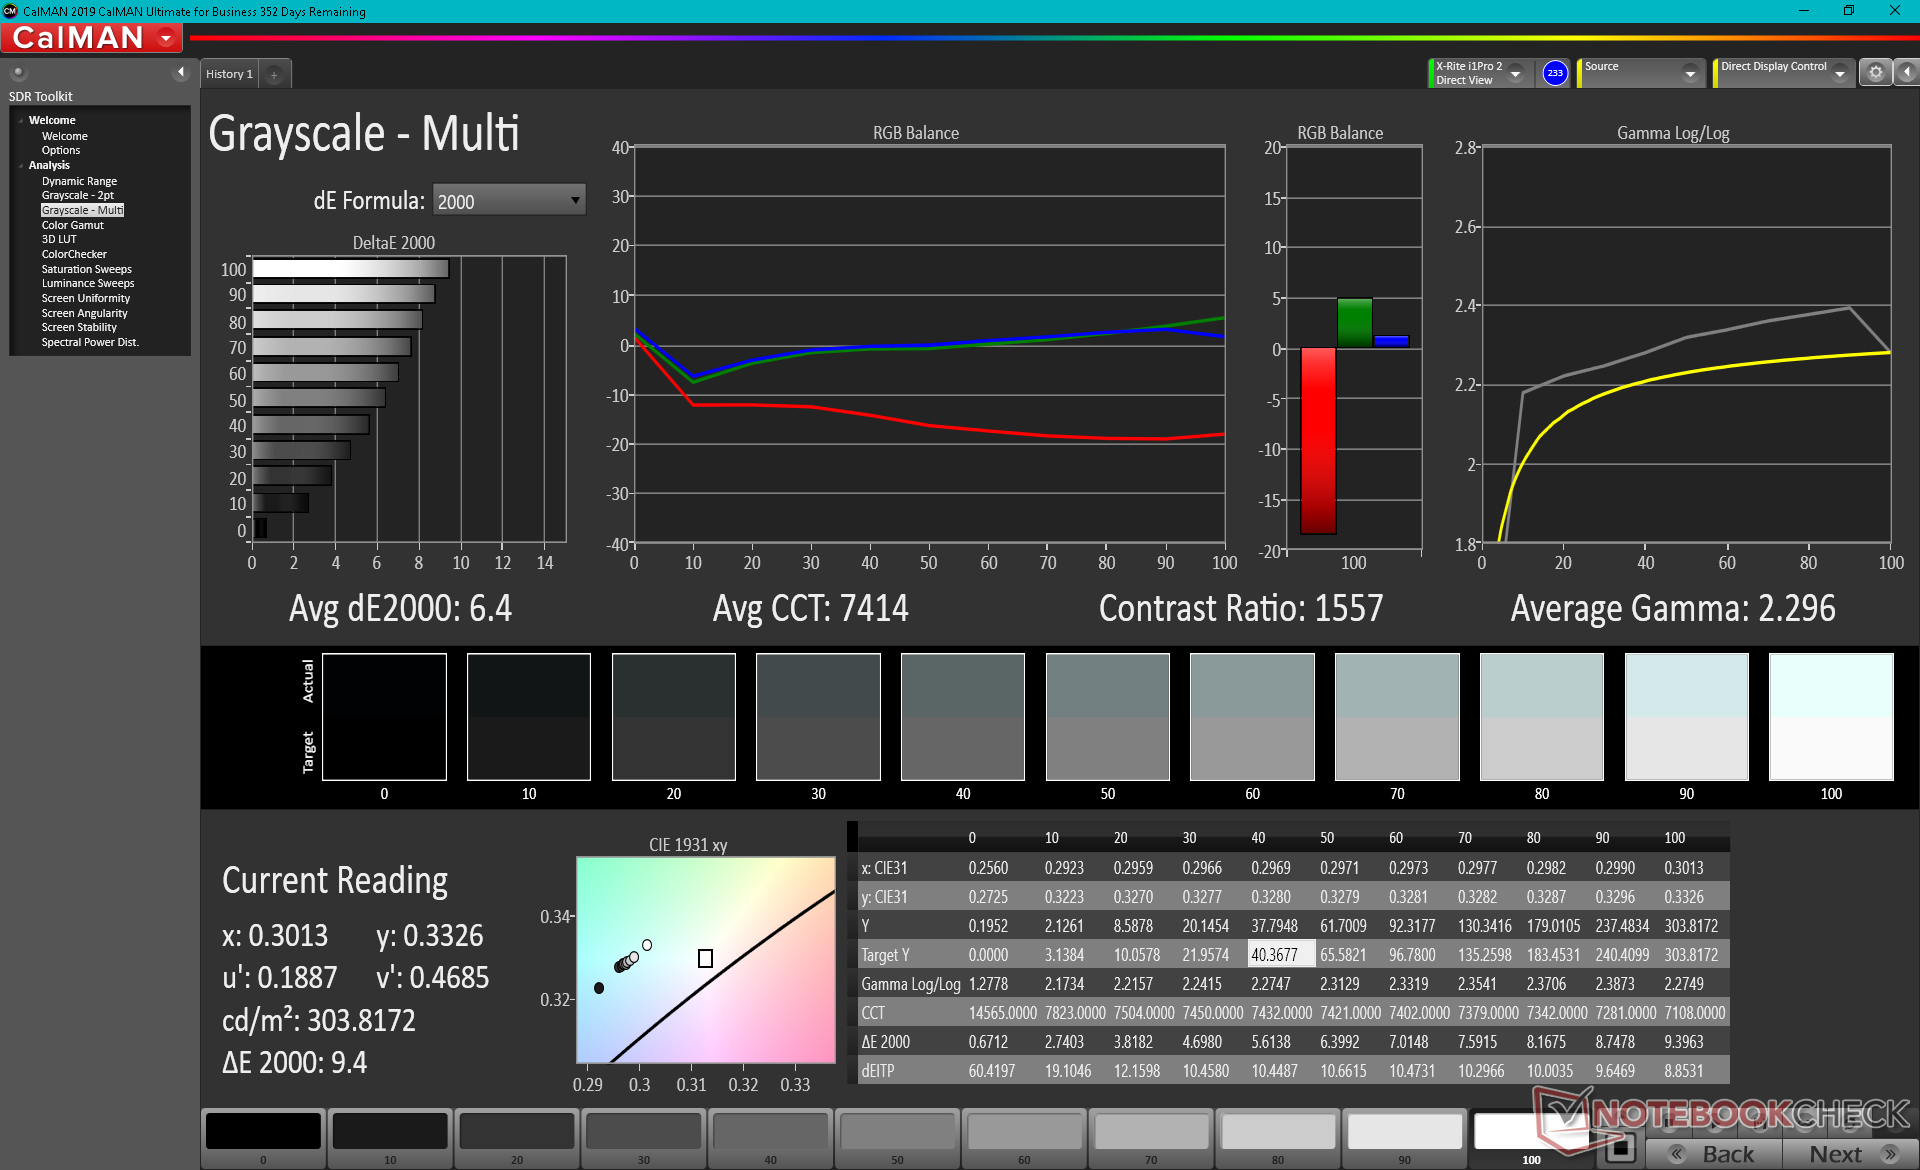
Aydınlatma: 93 %
Batarya modunda parlaklık: 303.8 cd/m²
Kontrast: 1266:1 (Siyah: 0.24 cd/m²)
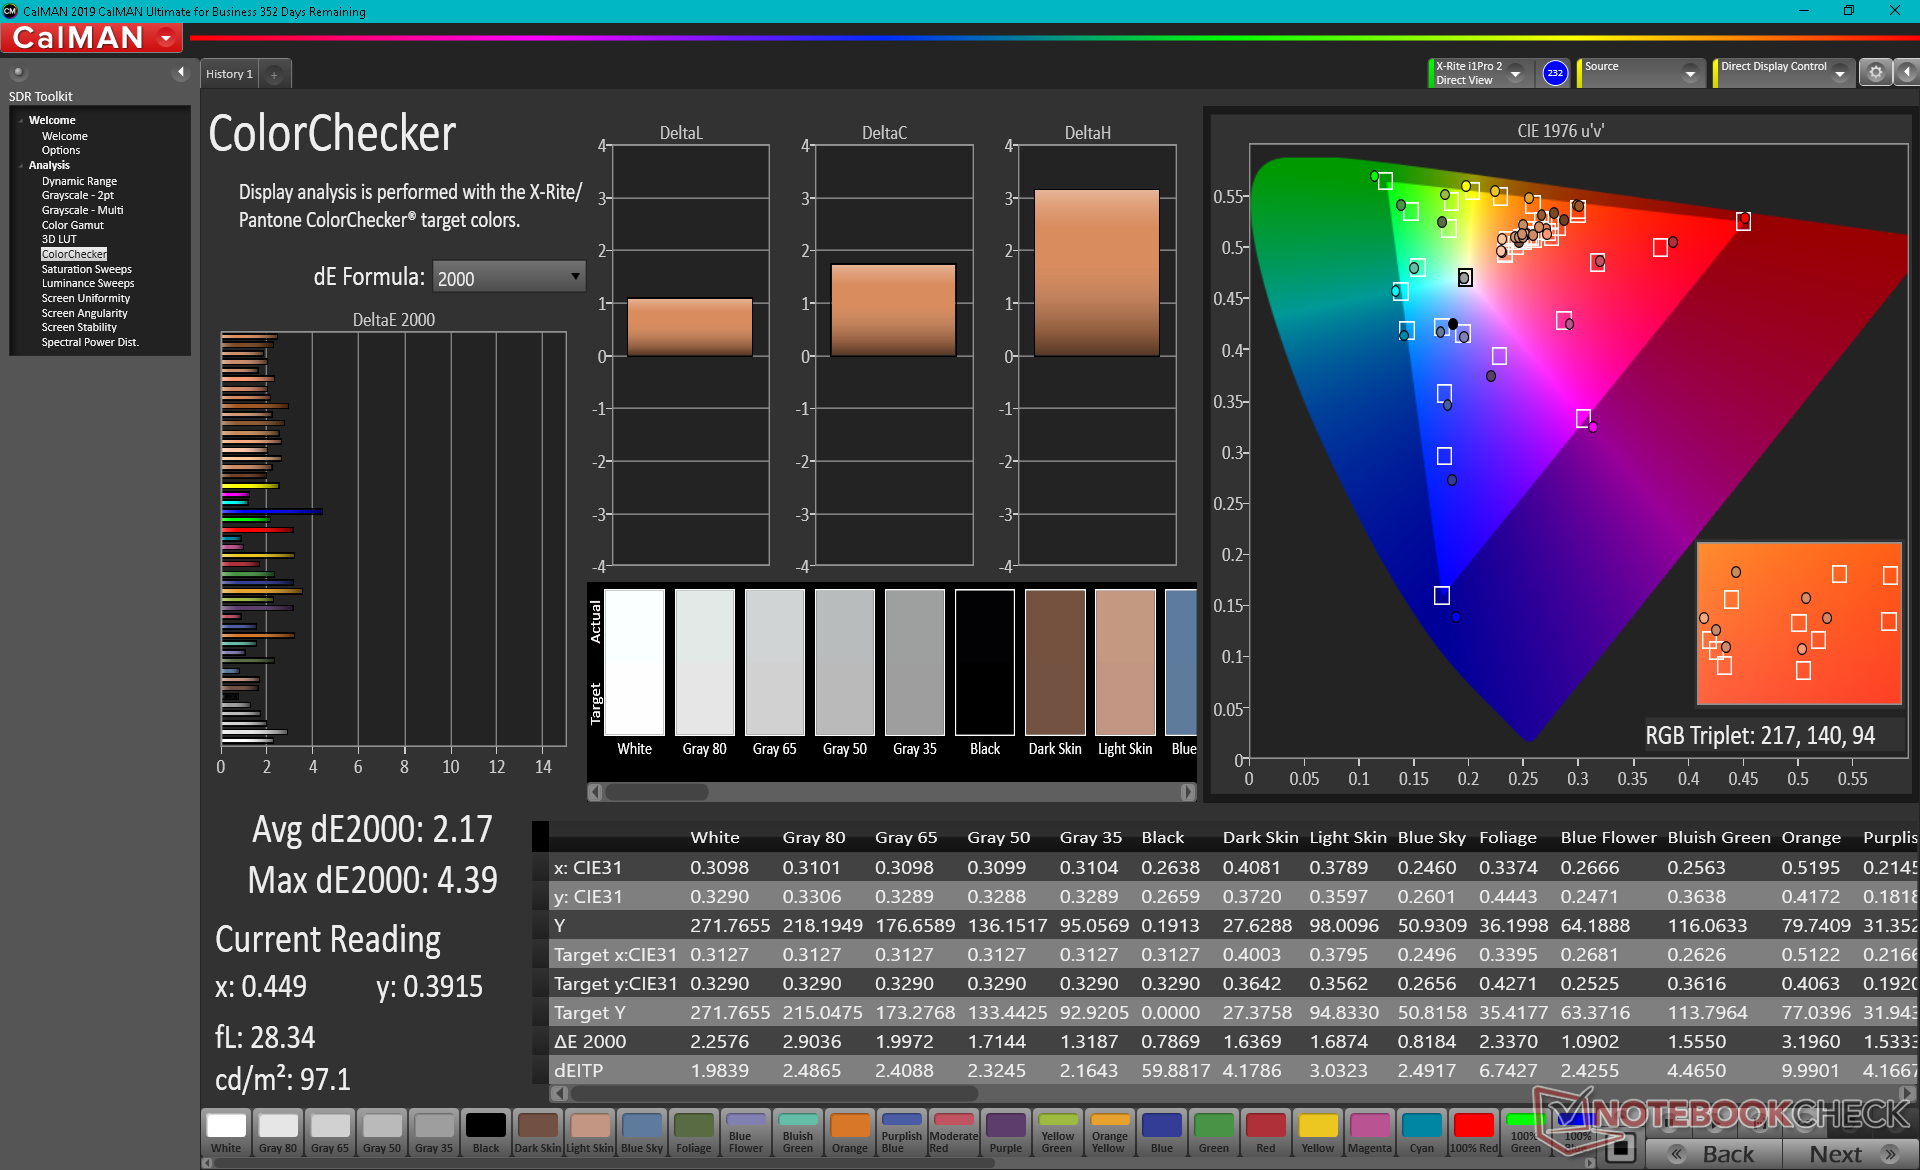
ΔE ColorChecker Calman: 4.58 | ∀{0.5-29.43 Ø4.72}
calibrated: 2.17
ΔE Greyscale Calman: 6.4 | ∀{0.09-98 Ø4.97}
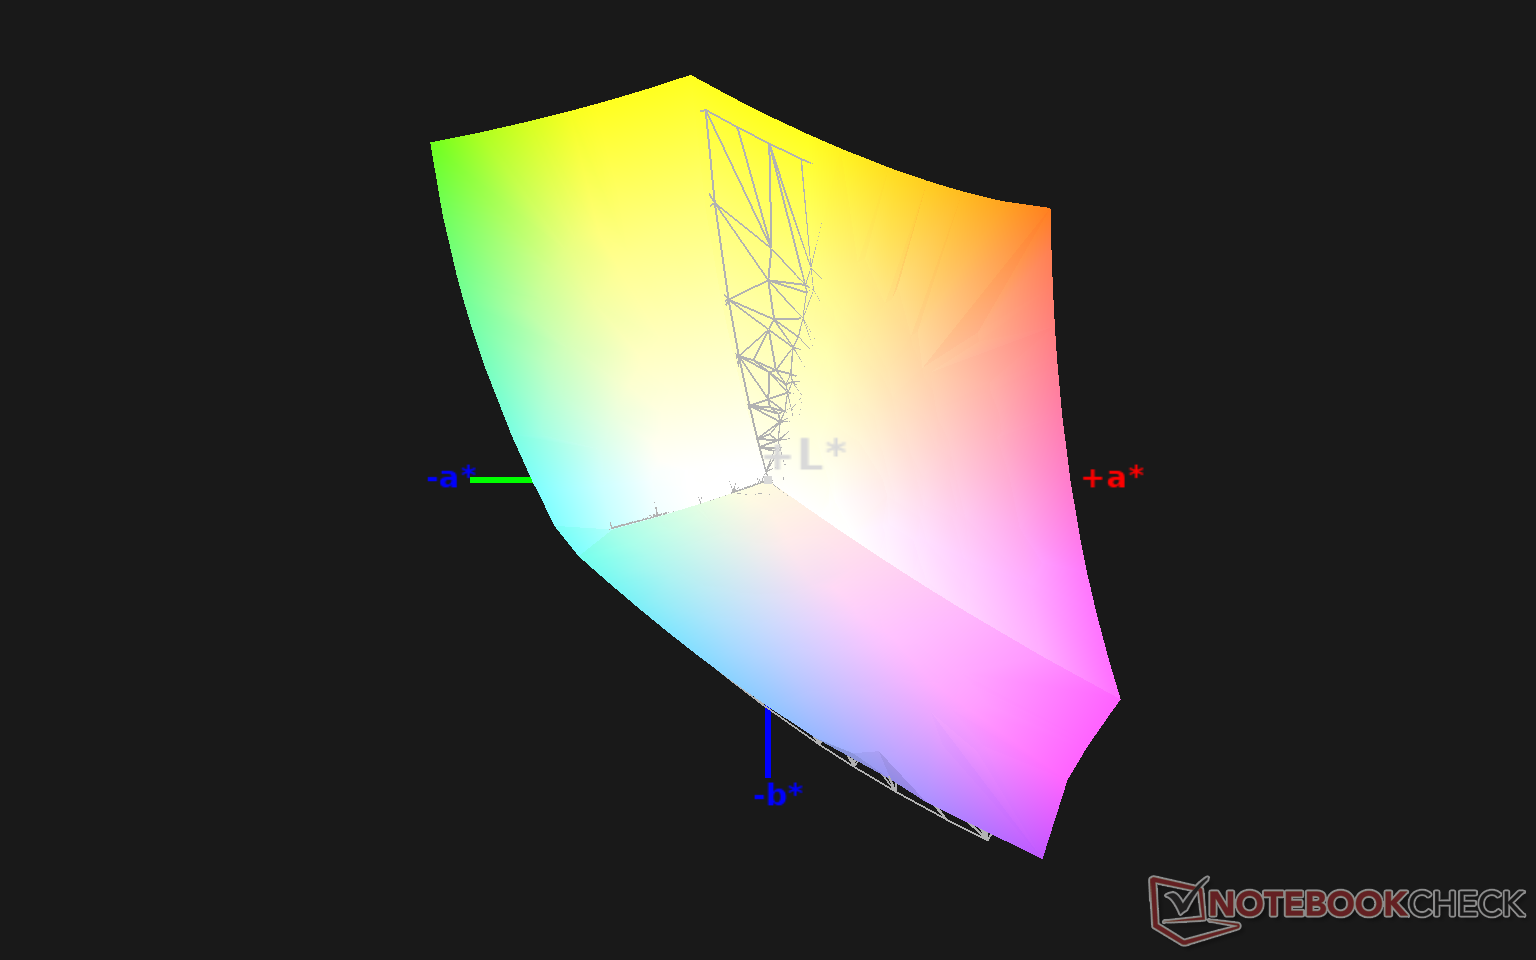
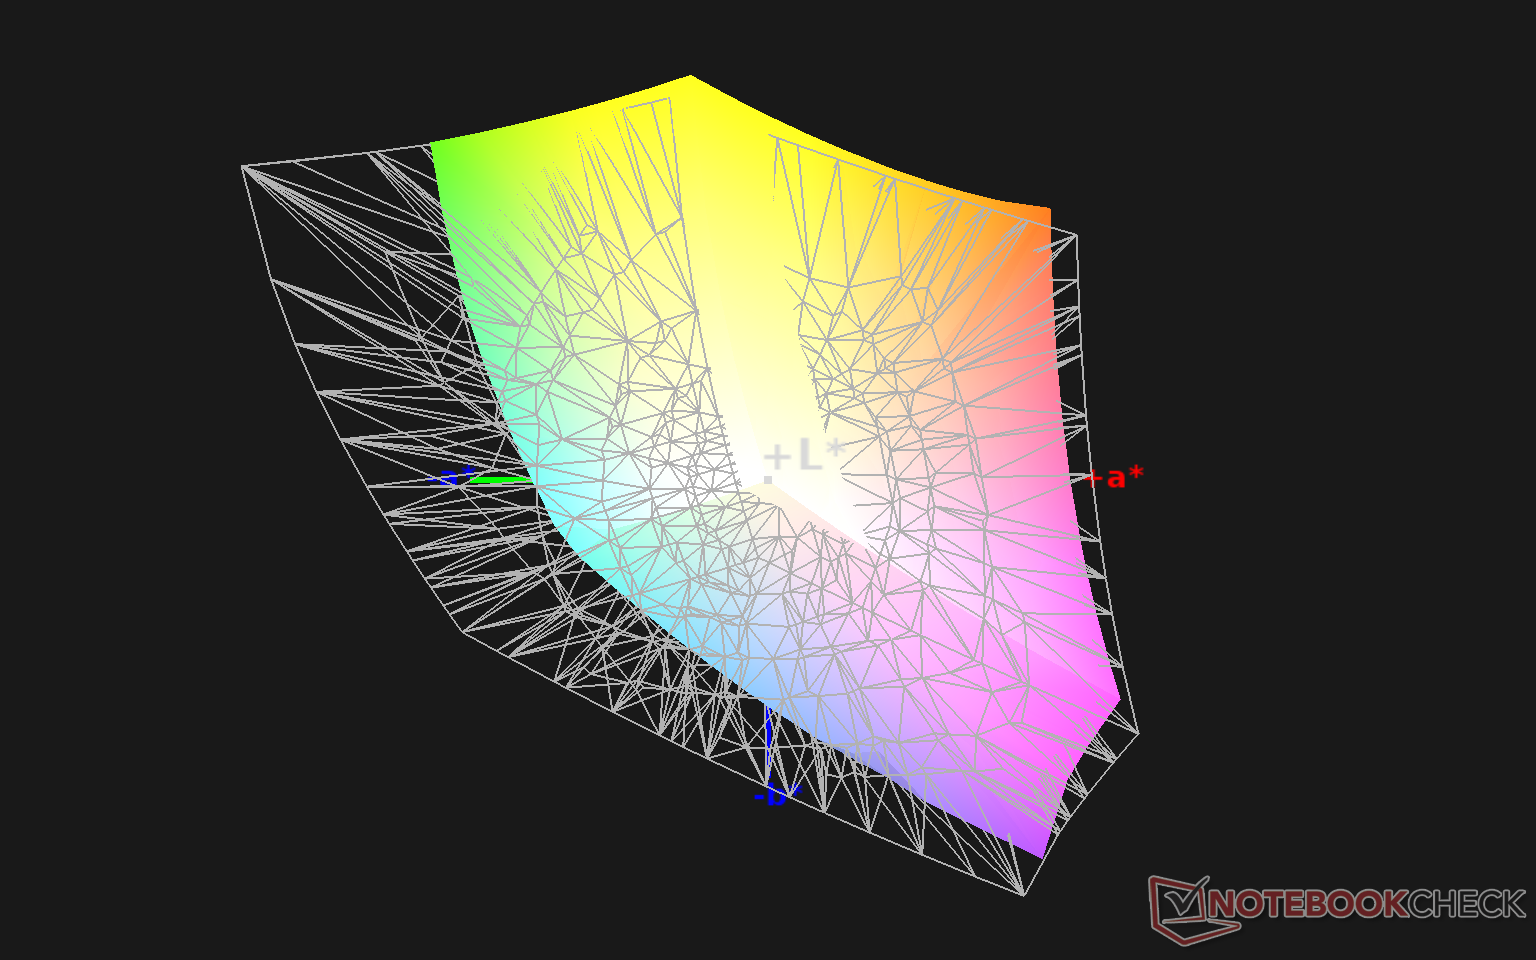
99% sRGB (Argyll 1.6.3 3D)
66.7% AdobeRGB 1998 (Argyll 1.6.3 3D)
74.6% AdobeRGB 1998 (Argyll 3D)
99% sRGB (Argyll 3D)
74.3% Display P3 (Argyll 3D)
Gamma: 2.3
CCT: 7414 K
| Dell Inspiron 15 7000 7506 2-in-1 Black Edition AU Optronics B156ZAN, IPS, 15.6", 3840x2160 | HP Envy x360 15-ee0257ng BOE NV156FHM-N4T, IPS, 15.6", 1920x1080 | Microsoft Surface Book 3 15 LG Philips LGD0554, IPS, 15", 3240x2160 | Asus ZenBook Flip 15 UX563FD-A1027T BOE HF NE156QUM-N64, IPS, 15.6", 3840x2160 | Lenovo Yoga C740-15IML B156HAN02.5, IPS LED, 15.6", 1920x1080 | Dell Inspiron 15 7000 7577 4K Name: AU Optronics B156ZAN, IPS, 15.6", 3840x2160 | |
|---|---|---|---|---|---|---|
| Display | -43% | -13% | -7% | -45% | -6% | |
| Display P3 Coverage (%) | 74.3 | 40.43 -46% | 61.5 -17% | 66.2 -11% | 39.04 -47% | 68.4 -8% |
| sRGB Coverage (%) | 99 | 59.6 -40% | 92.7 -6% | 97.2 -2% | 57.9 -42% | 97.1 -2% |
| AdobeRGB 1998 Coverage (%) | 74.6 | 41.77 -44% | 63.6 -15% | 68.3 -8% | 40.33 -46% | 69.6 -7% |
| Response Times | 38% | 29% | -6% | 7% | 26% | |
| Response Time Grey 50% / Grey 80% * (ms) | 55.2 ? | 34 ? 38% | 38 ? 31% | 60 ? -9% | 50.8 ? 8% | 35.2 ? 36% |
| Response Time Black / White * (ms) | 34 ? | 21 ? 38% | 25 ? 26% | 35 ? -3% | 32.4 ? 5% | 28.4 ? 16% |
| PWM Frequency (Hz) | 250 ? | |||||
| Screen | -34% | 24% | 17% | -38% | -5% | |
| Brightness middle (cd/m²) | 303.8 | 314 3% | 428 41% | 351 16% | 286 -6% | 322.9 6% |
| Brightness (cd/m²) | 296 | 280 -5% | 413 40% | 335 13% | 268 -9% | 309 4% |
| Brightness Distribution (%) | 93 | 72 -23% | 89 -4% | 87 -6% | 83 -11% | 90 -3% |
| Black Level * (cd/m²) | 0.24 | 0.275 -15% | 0.23 4% | 0.31 -29% | 0.2 17% | 0.36 -50% |
| Contrast (:1) | 1266 | 1142 -10% | 1861 47% | 1132 -11% | 1430 13% | 897 -29% |
| Colorchecker dE 2000 * | 4.58 | 5.94 -30% | 2.65 42% | 1.74 62% | 7.3 -59% | 3.99 13% |
| Colorchecker dE 2000 max. * | 9.4 | 21.71 -131% | 8.12 14% | 2.76 71% | 21.7 -131% | 8.97 5% |
| Colorchecker dE 2000 calibrated * | 2.17 | 5.15 -137% | 0.92 58% | 5.1 -135% | ||
| Greyscale dE 2000 * | 6.4 | 2.97 54% | 3.99 38% | 2.22 65% | 7 -9% | 5.3 17% |
| Gamma | 2.3 96% | 2.4 92% | 3.12 71% | 2.35 94% | 2.35 94% | 2.041 108% |
| CCT | 7414 88% | 6581 99% | 6309 103% | 6667 97% | 5847 111% | 6941 94% |
| Color Space (Percent of AdobeRGB 1998) (%) | 66.7 | 38.1 -43% | 58 -13% | 62 -7% | 36.9 -45% | 62.9 -6% |
| Color Space (Percent of sRGB) (%) | 99 | 59.1 -40% | 93 -6% | 97 -2% | 57.5 -42% | 96.8 -2% |
| Toplam Ortalama (Program / Ayarlar) | -13% /
-27% | 13% /
18% | 1% /
9% | -25% /
-34% | 5% /
-1% |
* ... daha küçük daha iyidir
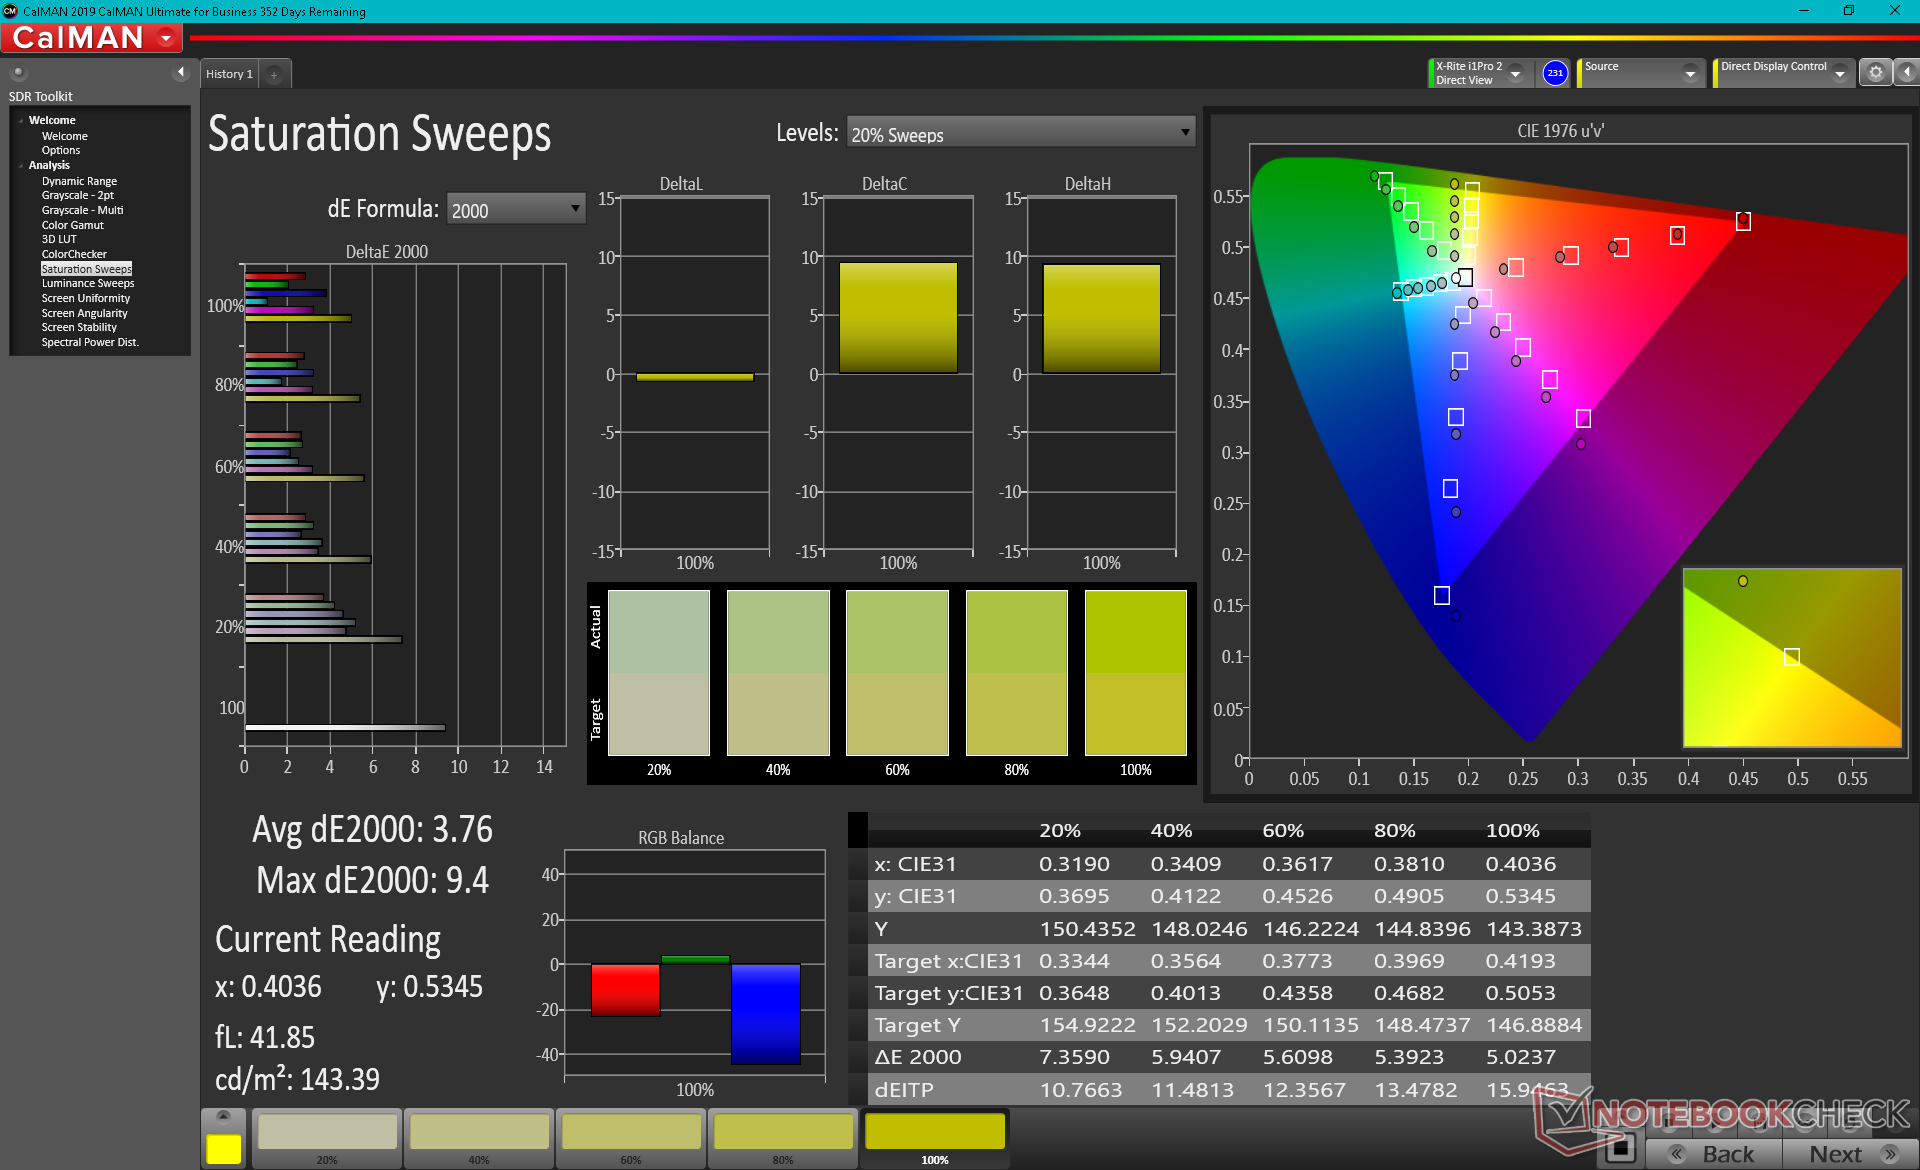
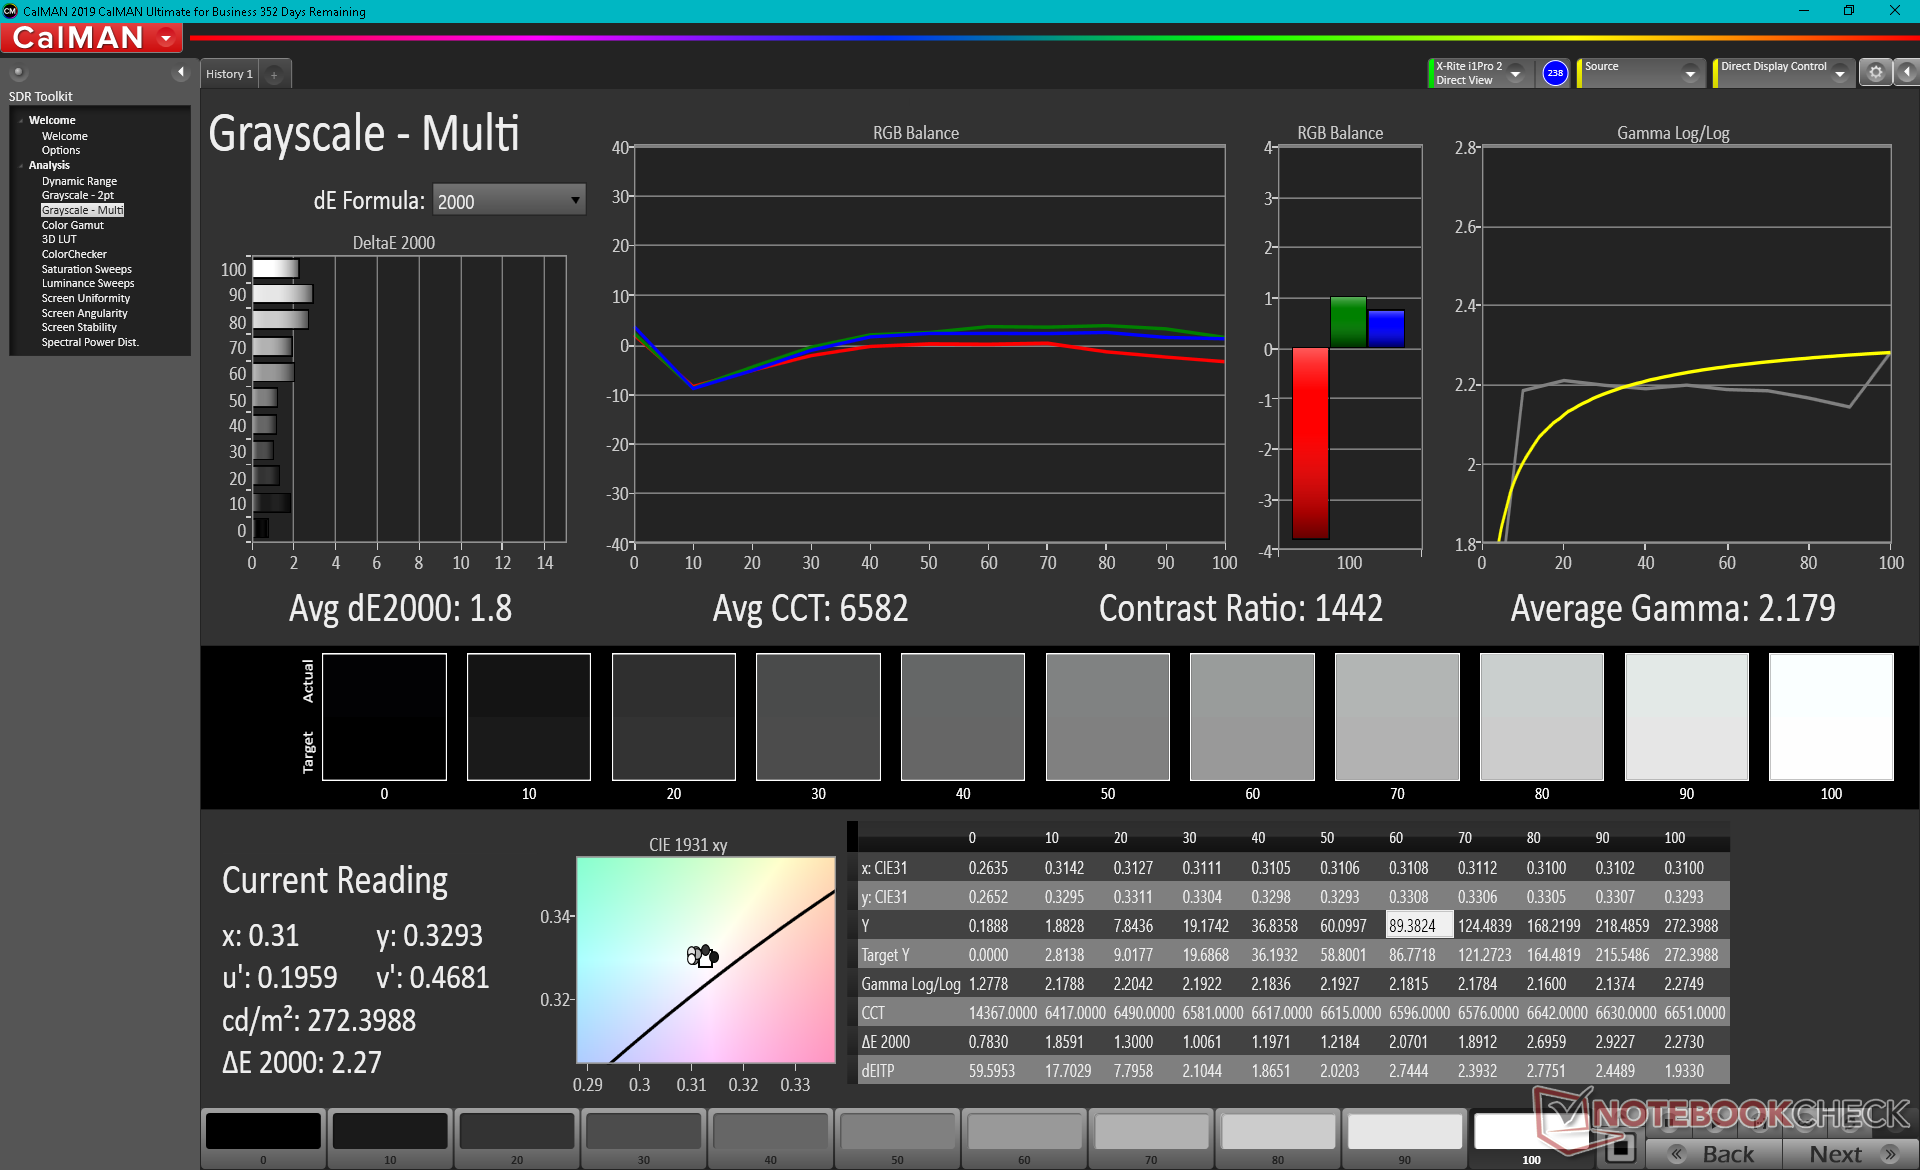
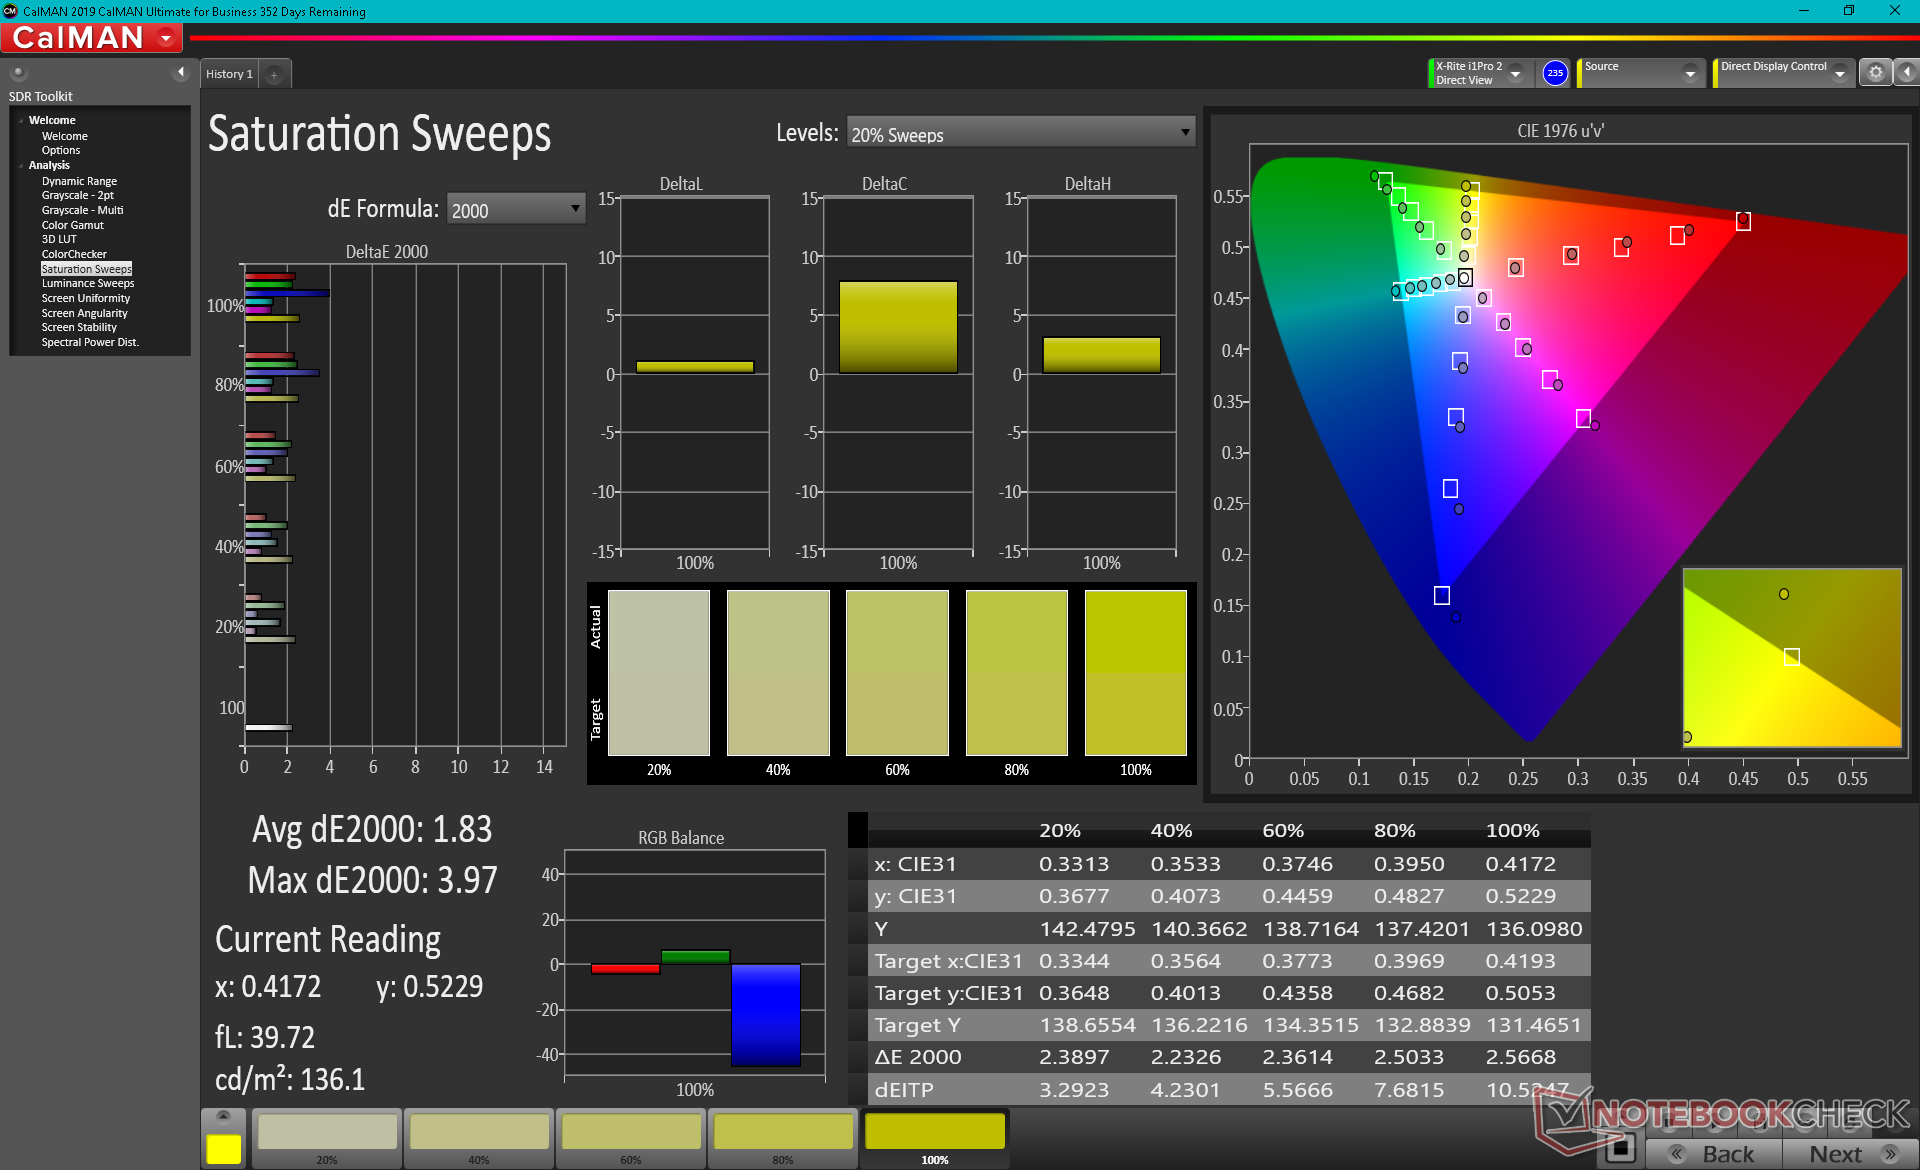
Color space is nearly identical to the FHD panel on the standard Silver Edition at 99 percent of sRGB. Thus, moving up to the 4K panel option will result in crisper texts and images but not deeper colors.
Color temperature is far too cool out of the box for a poor average grayscale DeltaE value of 6.4. Calibrating the panel ourselves addresses this drawback for much more accurate colors as shown by our CalMan measurements below. We recommend applying our calibrated ICC profile above to get the most out of the display if you don't have a colorimeter of your own.

Yanıt Sürelerini Görüntüle
| ↔ Tepki Süresi Siyahtan Beyaza | ||
|---|---|---|
| 34 ms ... yükseliş ↗ ve sonbahar↘ birleşimi | ↗ 19.2 ms yükseliş | 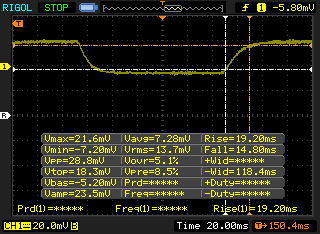 |
| ↘ 14.8 ms sonbahar | ||
| Ekran, testlerimizde yavaş yanıt oranları gösteriyor ve oyuncular için yetersiz olacaktır. Karşılaştırıldığında, test edilen tüm cihazlar 0.1 (minimum) ile 240 (maksimum) ms arasında değişir. » Tüm cihazların 91 %'si daha iyi. Bu, ölçülen yanıt süresinin test edilen tüm cihazların ortalamasından (19.8 ms) daha kötü olduğu anlamına gelir. | ||
| ↔ Tepki Süresi %50 Griden %80 Griye | ||
| 55.2 ms ... yükseliş ↗ ve sonbahar↘ birleşimi | ↗ 26.8 ms yükseliş | 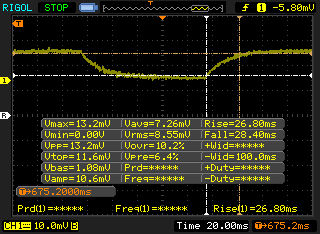 |
| ↘ 28.4 ms sonbahar | ||
| Ekran, testlerimizde yavaş yanıt oranları gösteriyor ve oyuncular için yetersiz olacaktır. Karşılaştırıldığında, test edilen tüm cihazlar 0.165 (minimum) ile 636 (maksimum) ms arasında değişir. » Tüm cihazların 92 %'si daha iyi. Bu, ölçülen yanıt süresinin test edilen tüm cihazların ortalamasından (31 ms) daha kötü olduğu anlamına gelir. | ||
Ekran Titremesi / PWM (Darbe Genişliği Modülasyonu)
| Ekran titriyor / PWM algılanmadı | 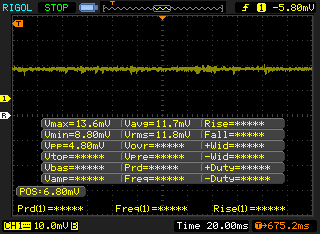 | ||
Karşılaştırıldığında: Test edilen tüm cihazların %52 %'si ekranı karartmak için PWM kullanmıyor. PWM tespit edilirse, ortalama 7763 (minimum: 5 - maksimum: 343500) Hz ölçüldü. | |||
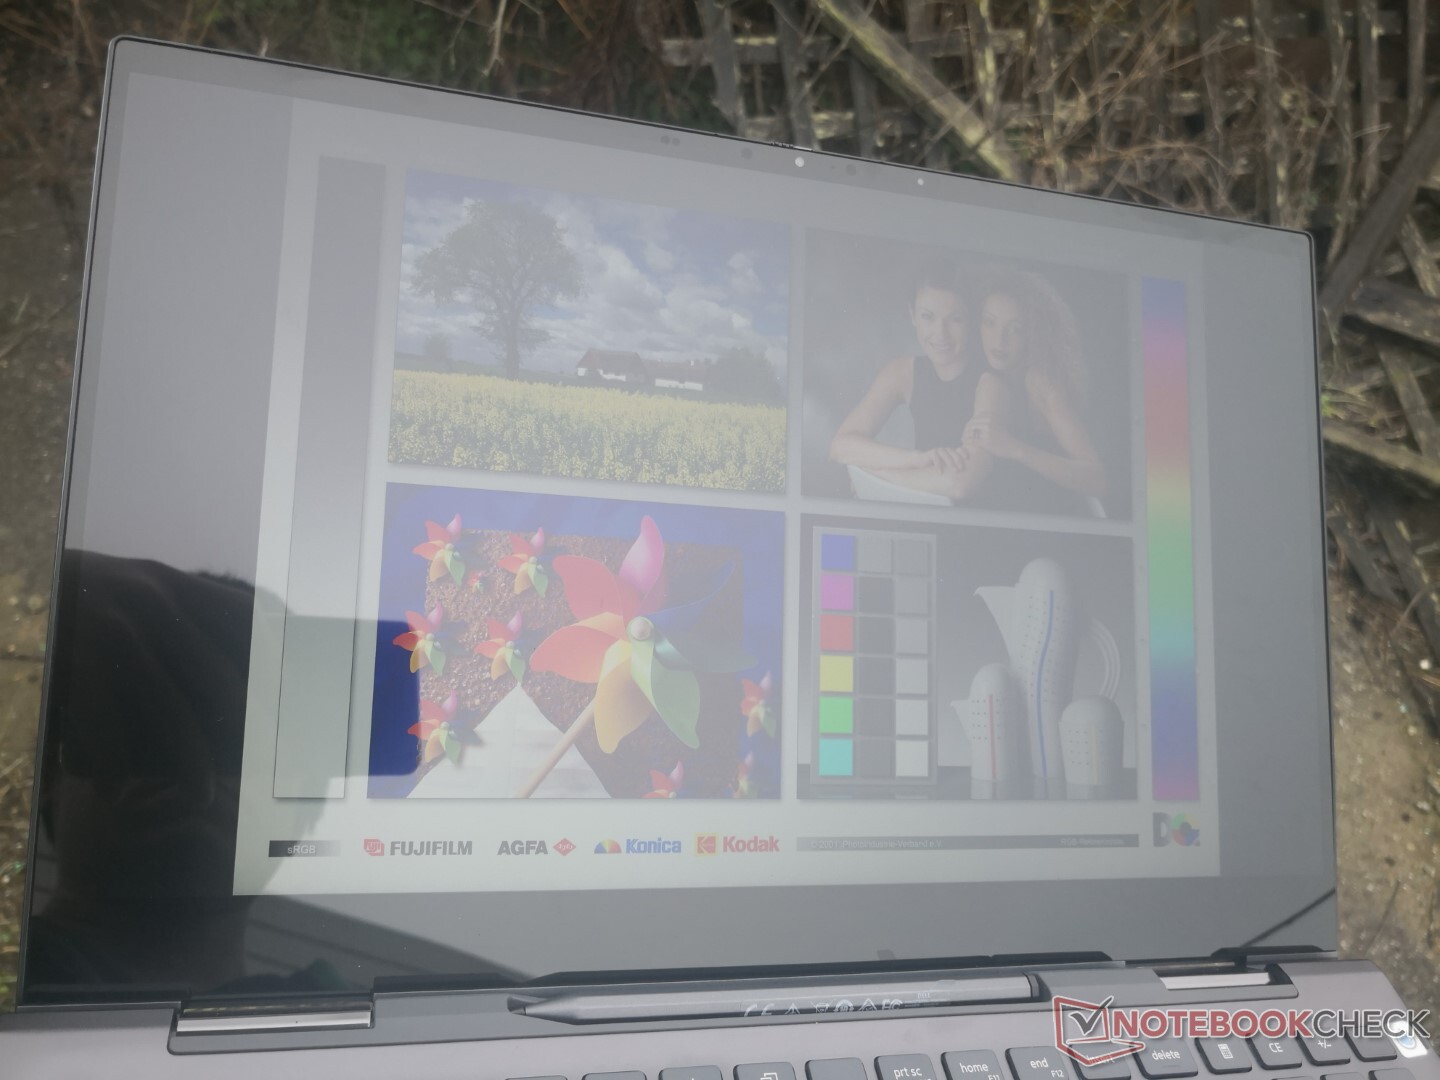
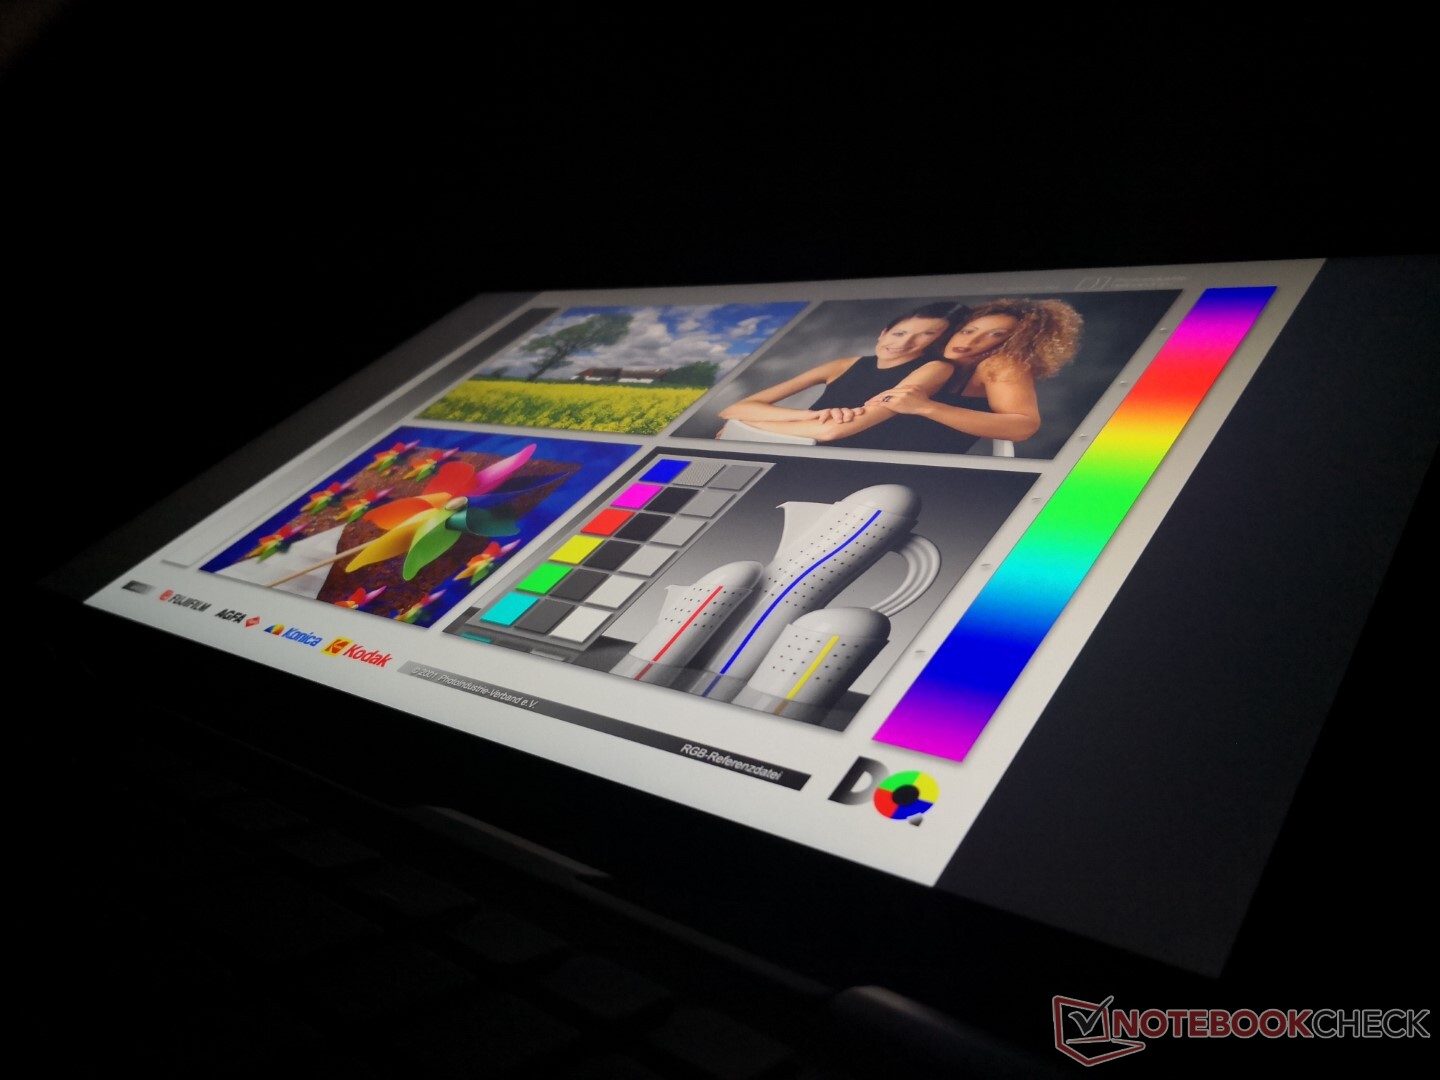
Outdoor visibility is similar to the Silver Edition since both share almost the same brightness levels and color reproduction despite their native resolution differences. However, Black Edition owners will likely want to bump up the text scaling to avoid squinting at small letters.
Performance
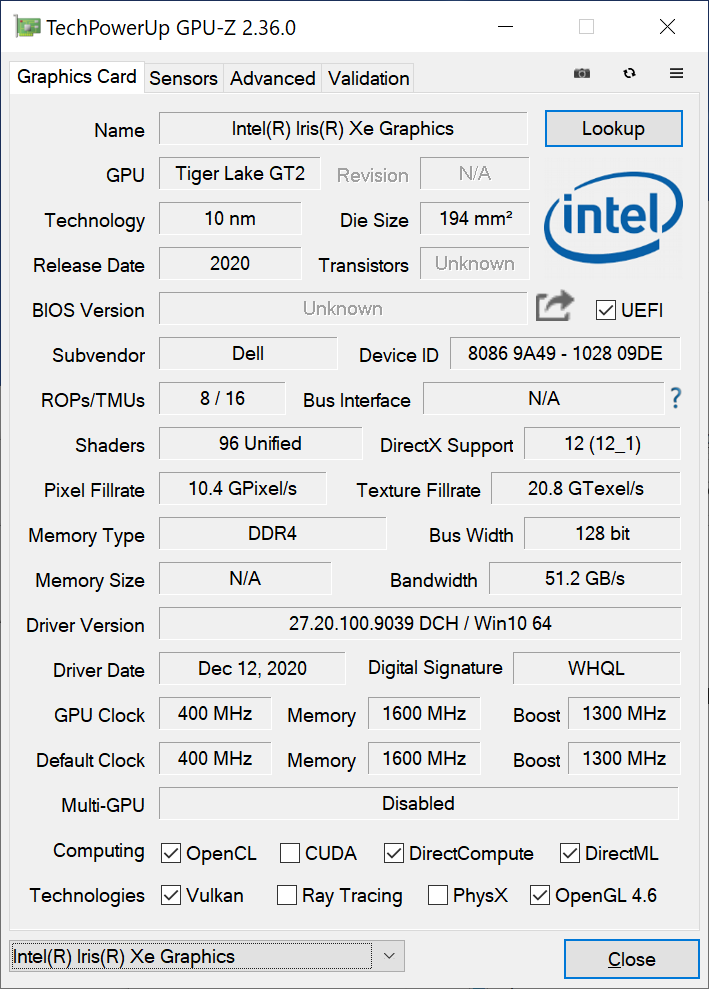
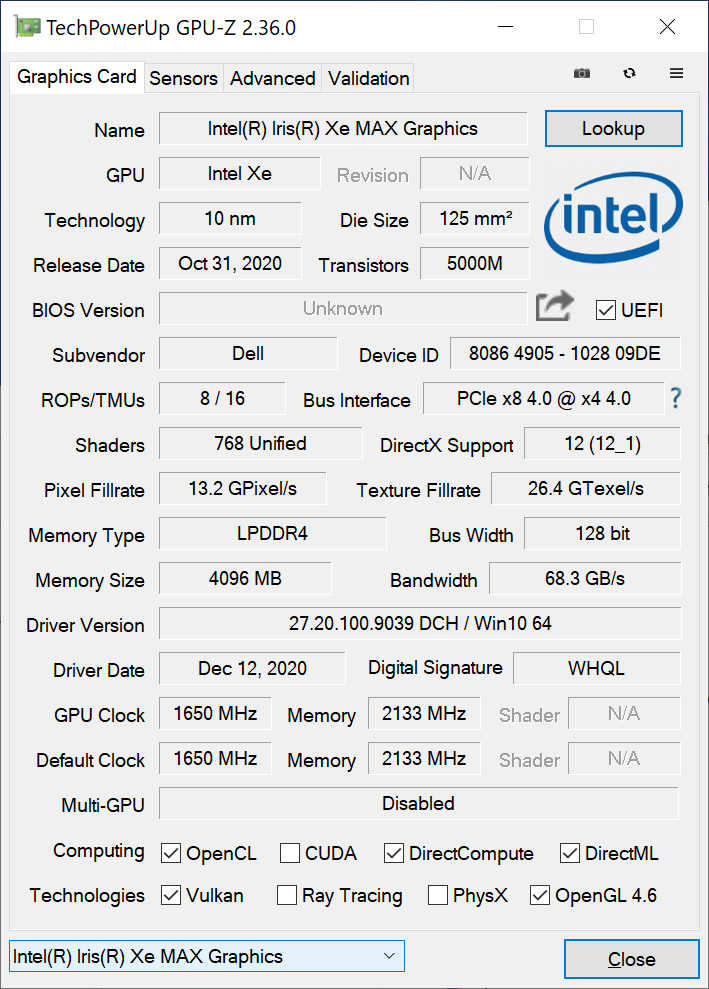
The biggest feature of the Inspiron 15 7506 2-in-1 Black Edition is its Iris Xe Max discrete GPU as there are currently very few laptops with such an option. Intel has made it clear that the GPU was designed primarily for editors and prosumers rather than gamers which our benchmarks below will show. Though there are no AMD variants available at the moment, users can still configure the Silver Edition with the GeForce MX330 instead if they wish.
It's worth noting that we ran into a handful of software issues and crashes when the unit first shipped to us. Fortunately, most of these problems were addressed after updating to the latest graphics driver at the time of review (27.20.100.9039). Owners should definitely become familiar with the Intel Graphics Command Center software for updating and fine-tuning the Xe Max GPU.
All benchmarks below were performed on Dell Ultra Performance mode for the highest possible scores.
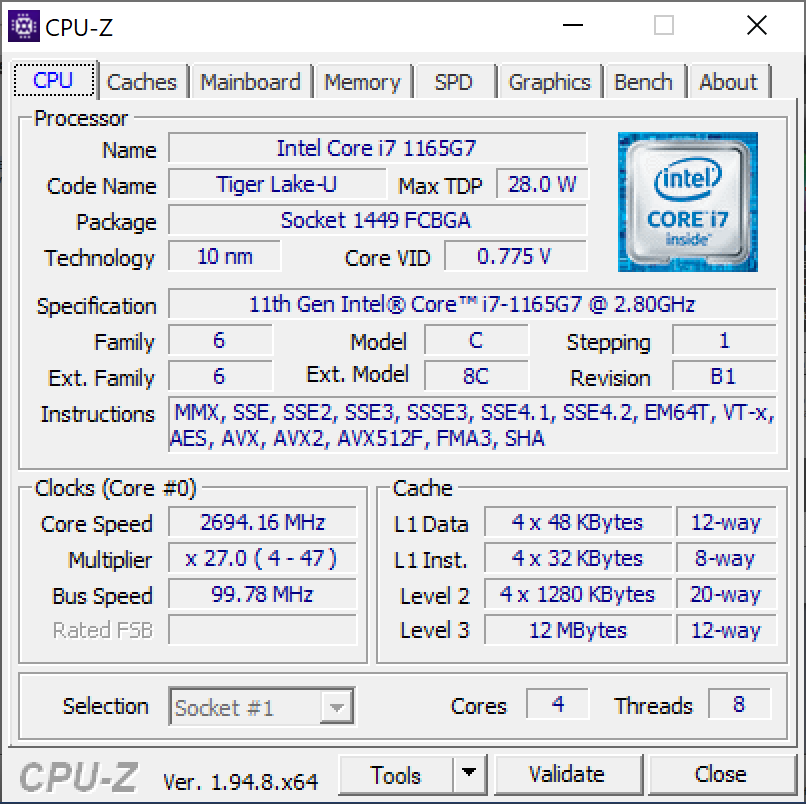
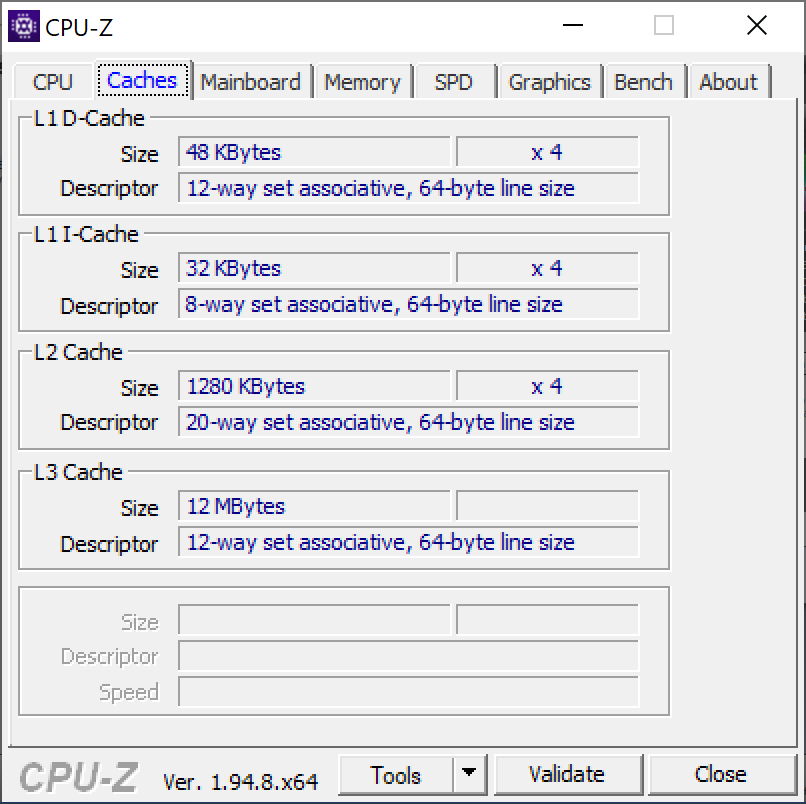
Processor
Raw CPU performance is about 5 to 8 percent slower than the average Core i7-1165G7 in our database. Though minor, this is enough to put it slightly below the Core i5-1135G7 in the Inspiron 15 7506 2-in-1 Silver Edition even though the Black Edition is supposed to house the faster processor. Multi-thread performance is still about 20 to 25 percent faster than the last generation Core i7-1065G7 in the Microsoft Surface Book 3.
The less expensive AMD Ryzen 5 4500U offers similar multi-thread performance as our Core i7-1165G7 while being 10 to 15 percent slower in single-threaded workloads.
Cinebench R15: CPU Multi 64Bit | CPU Single 64Bit
Blender: v2.79 BMW27 CPU
7-Zip 18.03: 7z b 4 -mmt1 | 7z b 4
Geekbench 5.5: Single-Core | Multi-Core
HWBOT x265 Benchmark v2.2: 4k Preset
LibreOffice : 20 Documents To PDF
R Benchmark 2.5: Overall mean
| Cinebench R20 / CPU (Multi Core) | |
| Lenovo ThinkPad E15 Gen2-20T9S00K00 | |
| MSI Prestige 15 A10SC | |
| Dell Inspiron 15 7506 2-in-1 P97F | |
| HP Envy x360 15-ee0257ng | |
| Ortalama Intel Core i7-1165G7 (1060 - 2657, n=81) | |
| Dell Inspiron 15 7000 7506 2-in-1 Black Edition | |
| Asus ZenBook Flip 15 UX563FD-A1027T | |
| Microsoft Surface Book 3 15 | |
| HP Pavilion x360 15-dq0065cl | |
| Durabook S15ABG2 | |
| Dell Inspiron 15 5000 5502 | |
| Asus Vivobook 15 F512DA-SH31 | |
| Cinebench R20 / CPU (Single Core) | |
| Ortalama Intel Core i7-1165G7 (442 - 589, n=81) | |
| Dell Inspiron 15 7506 2-in-1 P97F | |
| Dell Inspiron 15 7000 7506 2-in-1 Black Edition | |
| Dell Inspiron 15 5000 5502 | |
| Asus ZenBook Flip 15 UX563FD-A1027T | |
| Lenovo ThinkPad E15 Gen2-20T9S00K00 | |
| MSI Prestige 15 A10SC | |
| Microsoft Surface Book 3 15 | |
| HP Envy x360 15-ee0257ng | |
| HP Pavilion x360 15-dq0065cl | |
| Durabook S15ABG2 | |
| Asus Vivobook 15 F512DA-SH31 | |
| Cinebench R15 / CPU Multi 64Bit | |
| Lenovo ThinkPad E15 Gen2-20T9S00K00 | |
| MSI Prestige 15 A10SC | |
| HP Envy x360 15-ee0257ng | |
| Ortalama Intel Core i7-1165G7 (553 - 1027, n=86) | |
| Asus ZenBook Flip 15 UX563FD-A1027T | |
| Dell Inspiron 15 7506 2-in-1 P97F | |
| Dell Inspiron 15 7000 7506 2-in-1 Black Edition | |
| Microsoft Surface Book 3 15 | |
| HP Pavilion x360 15-dq0065cl | |
| Durabook S15ABG2 | |
| Dell Inspiron 15 5000 5502 | |
| Asus Vivobook 15 F512DA-SH31 | |
| Cinebench R15 / CPU Single 64Bit | |
| Ortalama Intel Core i7-1165G7 (115 - 230, n=78) | |
| Dell Inspiron 15 7000 7506 2-in-1 Black Edition | |
| Dell Inspiron 15 7506 2-in-1 P97F | |
| Asus ZenBook Flip 15 UX563FD-A1027T | |
| Dell Inspiron 15 5000 5502 | |
| MSI Prestige 15 A10SC | |
| Lenovo ThinkPad E15 Gen2-20T9S00K00 | |
| Microsoft Surface Book 3 15 | |
| HP Envy x360 15-ee0257ng | |
| HP Pavilion x360 15-dq0065cl | |
| Durabook S15ABG2 | |
| Asus Vivobook 15 F512DA-SH31 | |
| Blender / v2.79 BMW27 CPU | |
| Asus Vivobook 15 F512DA-SH31 | |
| Dell Inspiron 15 5000 5502 | |
| Durabook S15ABG2 | |
| Microsoft Surface Book 3 15 | |
| HP Envy x360 15-ee0257ng | |
| Ortalama Intel Core i7-1165G7 (468 - 1138, n=80) | |
| Dell Inspiron 15 7000 7506 2-in-1 Black Edition | |
| Dell Inspiron 15 7506 2-in-1 P97F | |
| Lenovo ThinkPad E15 Gen2-20T9S00K00 | |
| 7-Zip 18.03 / 7z b 4 -mmt1 | |
| Ortalama Intel Core i7-1165G7 (4478 - 5507, n=80) | |
| Dell Inspiron 15 7000 7506 2-in-1 Black Edition | |
| Dell Inspiron 15 7506 2-in-1 P97F | |
| Dell Inspiron 15 5000 5502 | |
| Lenovo ThinkPad E15 Gen2-20T9S00K00 | |
| HP Envy x360 15-ee0257ng | |
| Microsoft Surface Book 3 15 | |
| Durabook S15ABG2 | |
| Asus Vivobook 15 F512DA-SH31 | |
| 7-Zip 18.03 / 7z b 4 | |
| Lenovo ThinkPad E15 Gen2-20T9S00K00 | |
| HP Envy x360 15-ee0257ng | |
| Dell Inspiron 15 7506 2-in-1 P97F | |
| Dell Inspiron 15 7000 7506 2-in-1 Black Edition | |
| Ortalama Intel Core i7-1165G7 (15347 - 27405, n=80) | |
| Microsoft Surface Book 3 15 | |
| Durabook S15ABG2 | |
| Dell Inspiron 15 5000 5502 | |
| Asus Vivobook 15 F512DA-SH31 | |
| Geekbench 5.5 / Single-Core | |
| Ortalama Intel Core i7-1165G7 (1302 - 1595, n=77) | |
| Dell Inspiron 15 7000 7506 2-in-1 Black Edition | |
| Dell Inspiron 15 7506 2-in-1 P97F | |
| Dell Inspiron 15 5000 5502 | |
| Microsoft Surface Book 3 15 | |
| Asus ZenBook Flip 15 UX563FD-A1027T | |
| Lenovo ThinkPad E15 Gen2-20T9S00K00 | |
| HP Envy x360 15-ee0257ng | |
| Durabook S15ABG2 | |
| Asus Vivobook 15 F512DA-SH31 | |
| Geekbench 5.5 / Multi-Core | |
| Lenovo ThinkPad E15 Gen2-20T9S00K00 | |
| Dell Inspiron 15 7000 7506 2-in-1 Black Edition | |
| Ortalama Intel Core i7-1165G7 (3078 - 5926, n=77) | |
| HP Envy x360 15-ee0257ng | |
| Dell Inspiron 15 7506 2-in-1 P97F | |
| Microsoft Surface Book 3 15 | |
| Asus ZenBook Flip 15 UX563FD-A1027T | |
| Durabook S15ABG2 | |
| Dell Inspiron 15 5000 5502 | |
| Asus Vivobook 15 F512DA-SH31 | |
| HWBOT x265 Benchmark v2.2 / 4k Preset | |
| Lenovo ThinkPad E15 Gen2-20T9S00K00 | |
| Dell Inspiron 15 7506 2-in-1 P97F | |
| Dell Inspiron 15 7000 7506 2-in-1 Black Edition | |
| Ortalama Intel Core i7-1165G7 (1.39 - 8.47, n=80) | |
| HP Envy x360 15-ee0257ng | |
| Microsoft Surface Book 3 15 | |
| Durabook S15ABG2 | |
| Dell Inspiron 15 5000 5502 | |
| Asus Vivobook 15 F512DA-SH31 | |
| LibreOffice / 20 Documents To PDF | |
| Asus Vivobook 15 F512DA-SH31 | |
| HP Envy x360 15-ee0257ng | |
| Durabook S15ABG2 | |
| Microsoft Surface Book 3 15 | |
| Dell Inspiron 15 5000 5502 | |
| Lenovo ThinkPad E15 Gen2-20T9S00K00 | |
| Dell Inspiron 15 7506 2-in-1 P97F | |
| Ortalama Intel Core i7-1165G7 (21.5 - 88.1, n=78) | |
| Dell Inspiron 15 7000 7506 2-in-1 Black Edition | |
| R Benchmark 2.5 / Overall mean | |
| Asus Vivobook 15 F512DA-SH31 | |
| Durabook S15ABG2 | |
| Microsoft Surface Book 3 15 | |
| Dell Inspiron 15 5000 5502 | |
| Dell Inspiron 15 7506 2-in-1 P97F | |
| HP Envy x360 15-ee0257ng | |
| Lenovo ThinkPad E15 Gen2-20T9S00K00 | |
| Dell Inspiron 15 7000 7506 2-in-1 Black Edition | |
| Ortalama Intel Core i7-1165G7 (0.552 - 1.002, n=80) | |
* ... daha küçük daha iyidir
System Performance
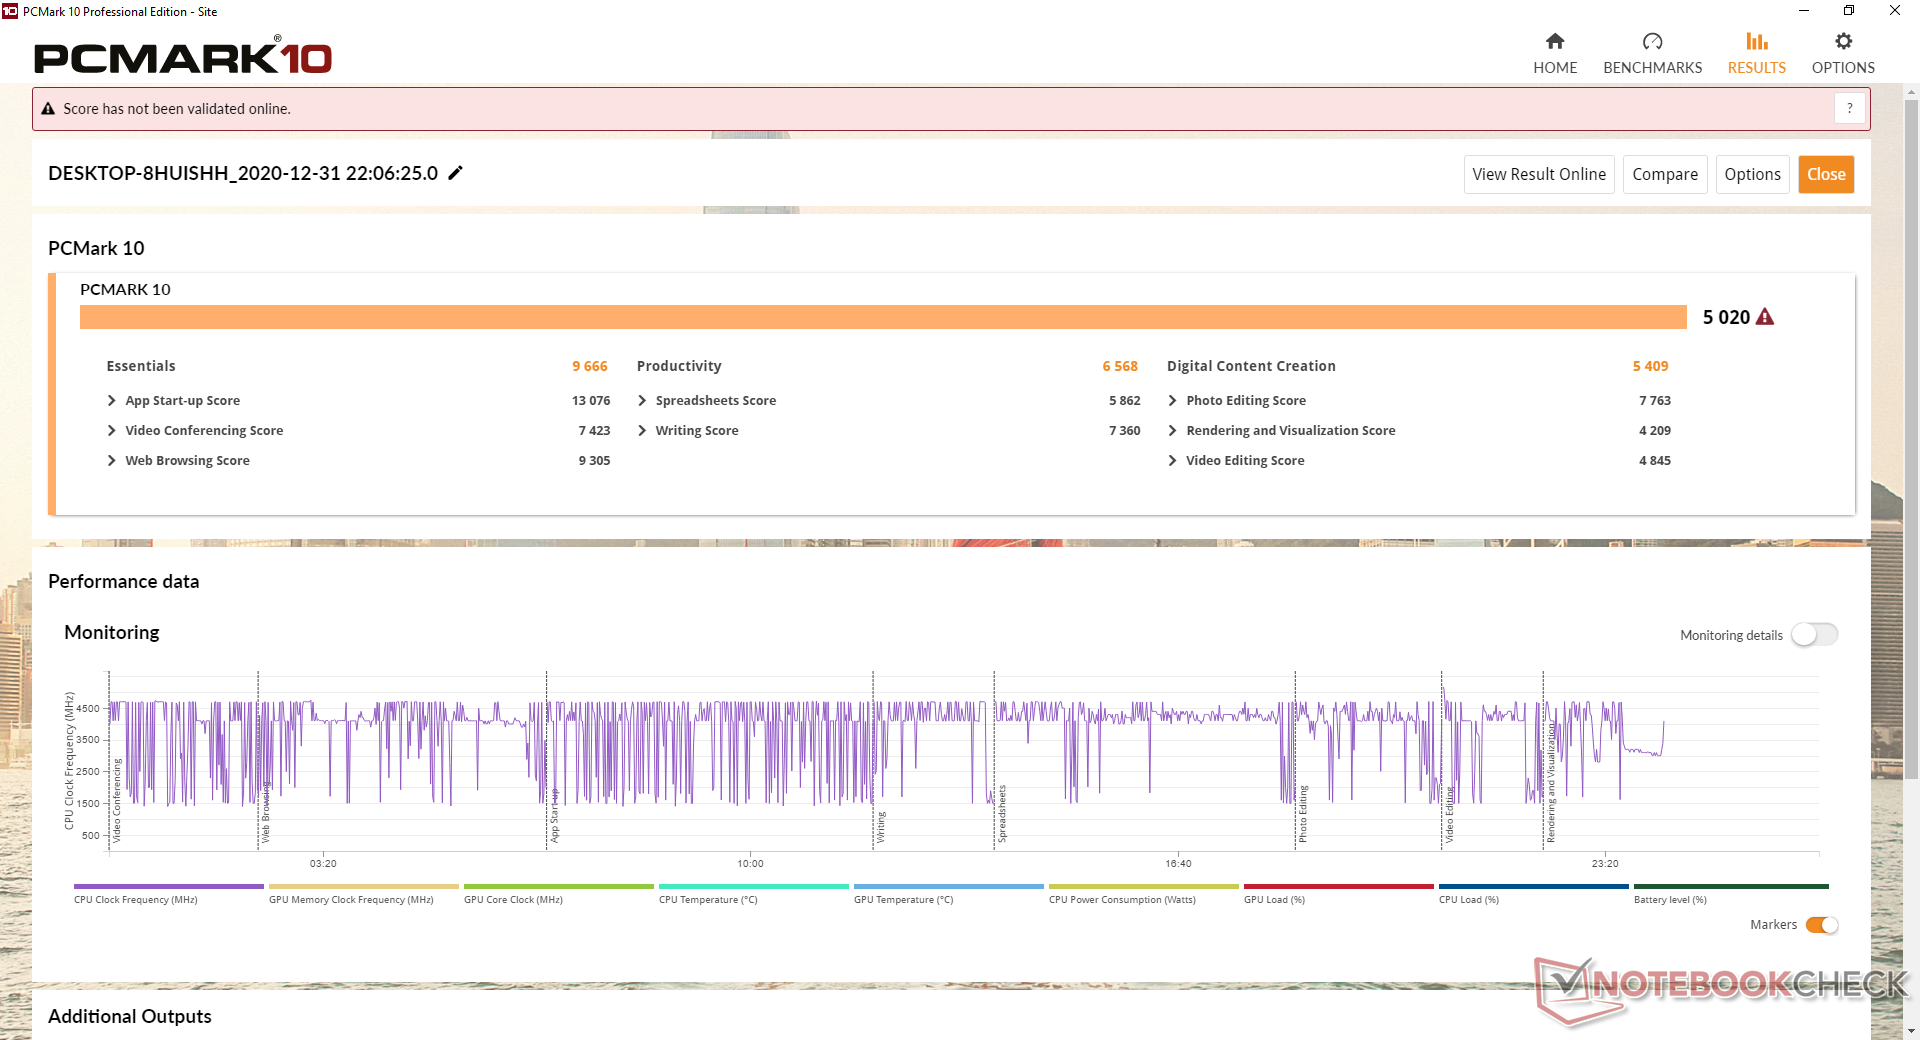
PCMark 10 scores are high when compared to other convertibles with integrated GPUs especially in Digital Content Creation likely because of the Xe Max GPU.
| PCMark 10 | |
| Score | |
| Dell Inspiron 15 7000 7506 2-in-1 Black Edition | |
| HP Envy x360 15-ee0257ng | |
| Samsung Galaxy Book Flex 15-NP950 | |
| Lenovo Yoga C740-15IML | |
| Dell Inspiron 15 7506 2-in-1 P97F | |
| Microsoft Surface Book 3 15 | |
| Asus ZenBook Flip 15 UX563FD-A1027T | |
| Essentials | |
| Lenovo Yoga C740-15IML | |
| Dell Inspiron 15 7000 7506 2-in-1 Black Edition | |
| Dell Inspiron 15 7506 2-in-1 P97F | |
| Asus ZenBook Flip 15 UX563FD-A1027T | |
| Samsung Galaxy Book Flex 15-NP950 | |
| HP Envy x360 15-ee0257ng | |
| Microsoft Surface Book 3 15 | |
| Productivity | |
| Samsung Galaxy Book Flex 15-NP950 | |
| Lenovo Yoga C740-15IML | |
| HP Envy x360 15-ee0257ng | |
| Asus ZenBook Flip 15 UX563FD-A1027T | |
| Microsoft Surface Book 3 15 | |
| Dell Inspiron 15 7000 7506 2-in-1 Black Edition | |
| Dell Inspiron 15 7506 2-in-1 P97F | |
| Digital Content Creation | |
| Dell Inspiron 15 7000 7506 2-in-1 Black Edition | |
| HP Envy x360 15-ee0257ng | |
| Samsung Galaxy Book Flex 15-NP950 | |
| Dell Inspiron 15 7506 2-in-1 P97F | |
| Microsoft Surface Book 3 15 | |
| Lenovo Yoga C740-15IML | |
| Asus ZenBook Flip 15 UX563FD-A1027T | |
| PCMark 8 | |
| Home Score Accelerated v2 | |
| Dell Inspiron 15 7000 7506 2-in-1 Black Edition | |
| HP Envy x360 15-ee0257ng | |
| Dell Inspiron 15 7506 2-in-1 P97F | |
| Samsung Galaxy Book Flex 15-NP950 | |
| Lenovo Yoga C740-15IML | |
| Microsoft Surface Book 3 15 | |
| Asus ZenBook Flip 15 UX563FD-A1027T | |
| Work Score Accelerated v2 | |
| Lenovo Yoga C740-15IML | |
| Samsung Galaxy Book Flex 15-NP950 | |
| HP Envy x360 15-ee0257ng | |
| Microsoft Surface Book 3 15 | |
| Asus ZenBook Flip 15 UX563FD-A1027T | |
| Dell Inspiron 15 7000 7506 2-in-1 Black Edition | |
| Dell Inspiron 15 7506 2-in-1 P97F | |
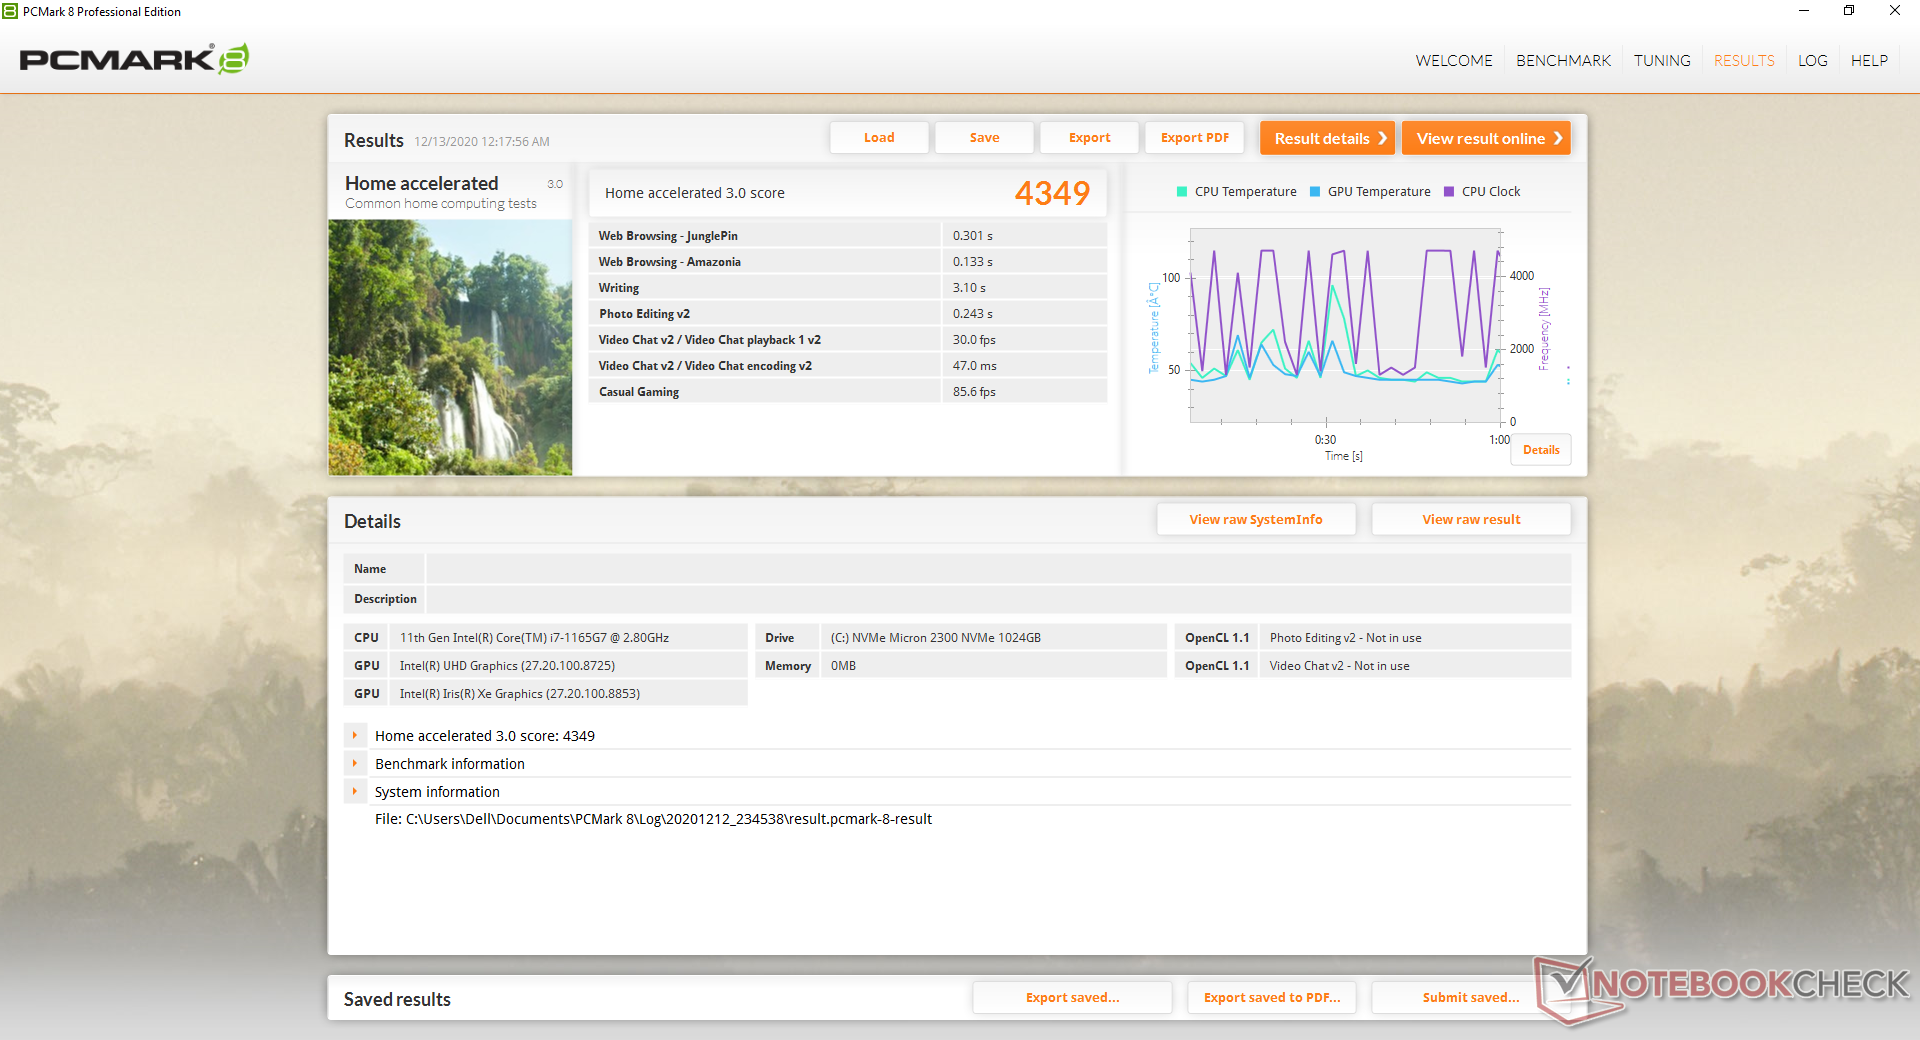
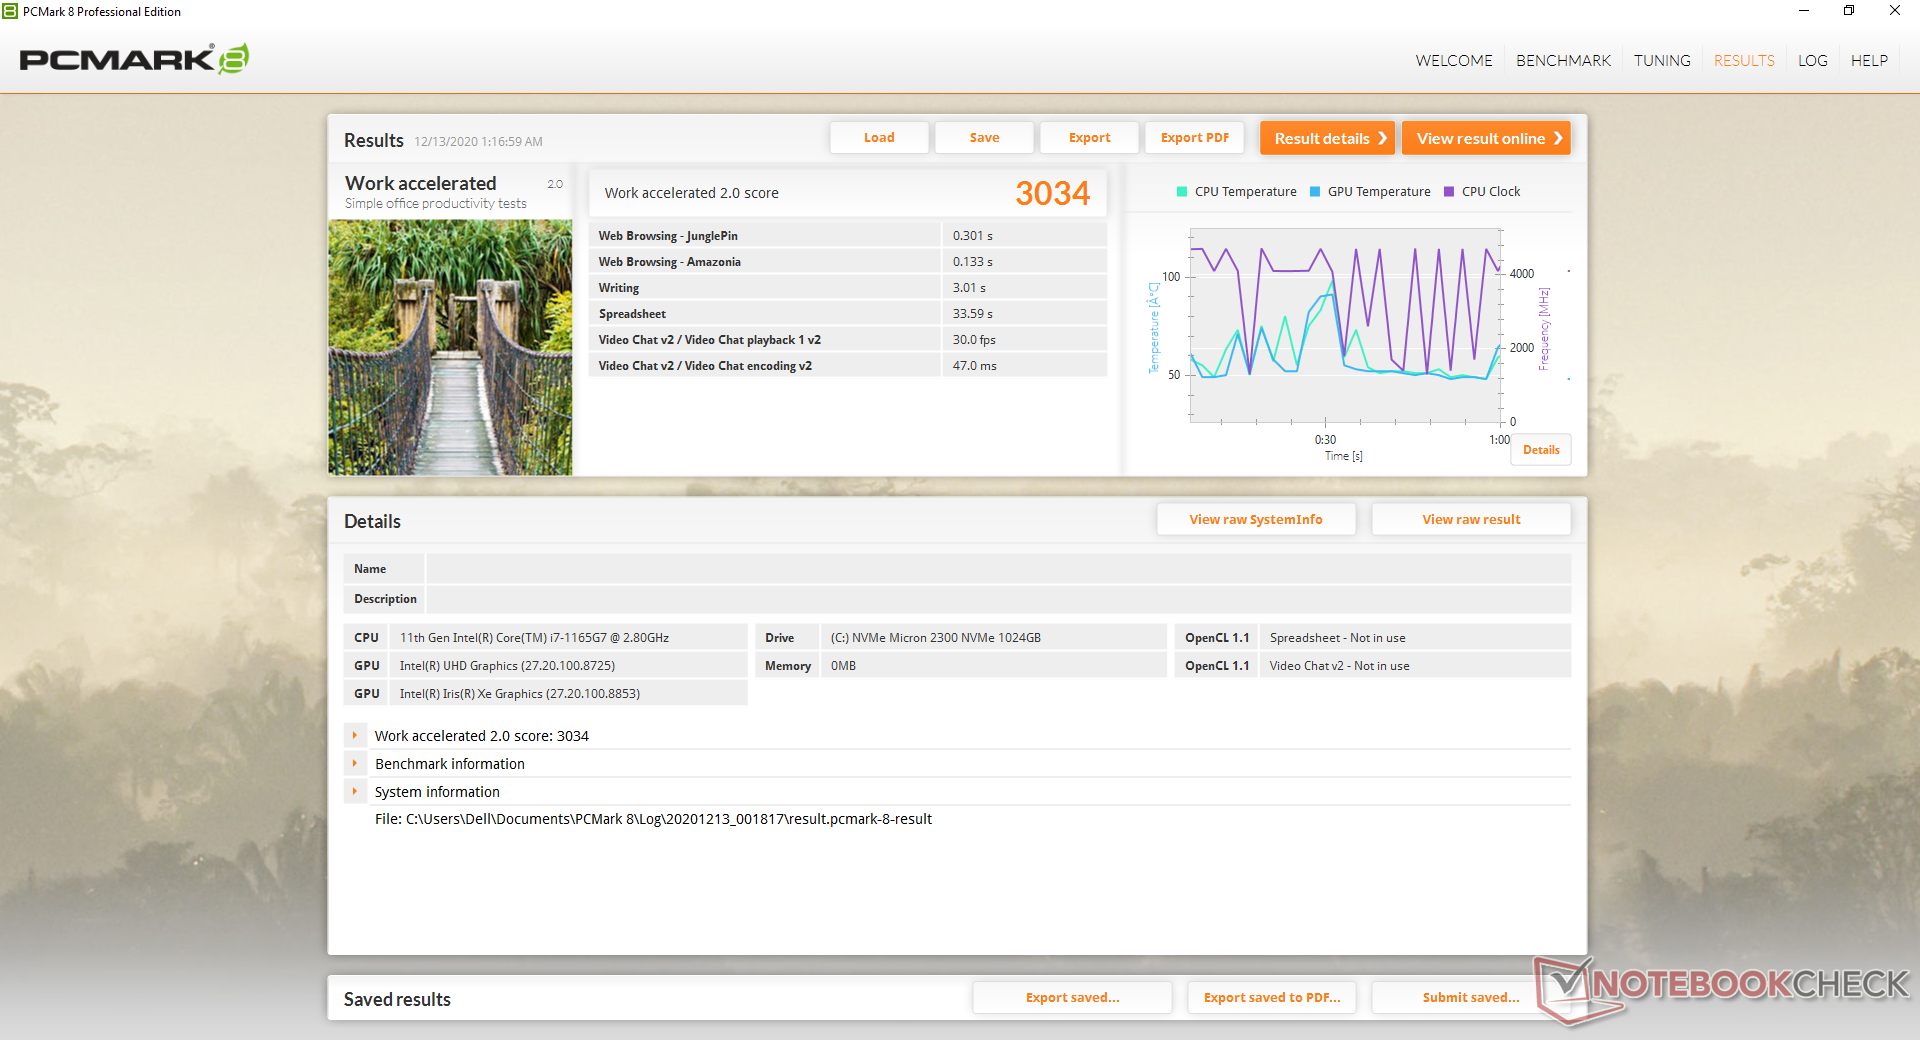
| PCMark 8 Home Score Accelerated v2 | 4349 puan | |
| PCMark 8 Work Score Accelerated v2 | 3034 puan | |
| PCMark 10 Score | 5020 puan | |
Yardım | ||
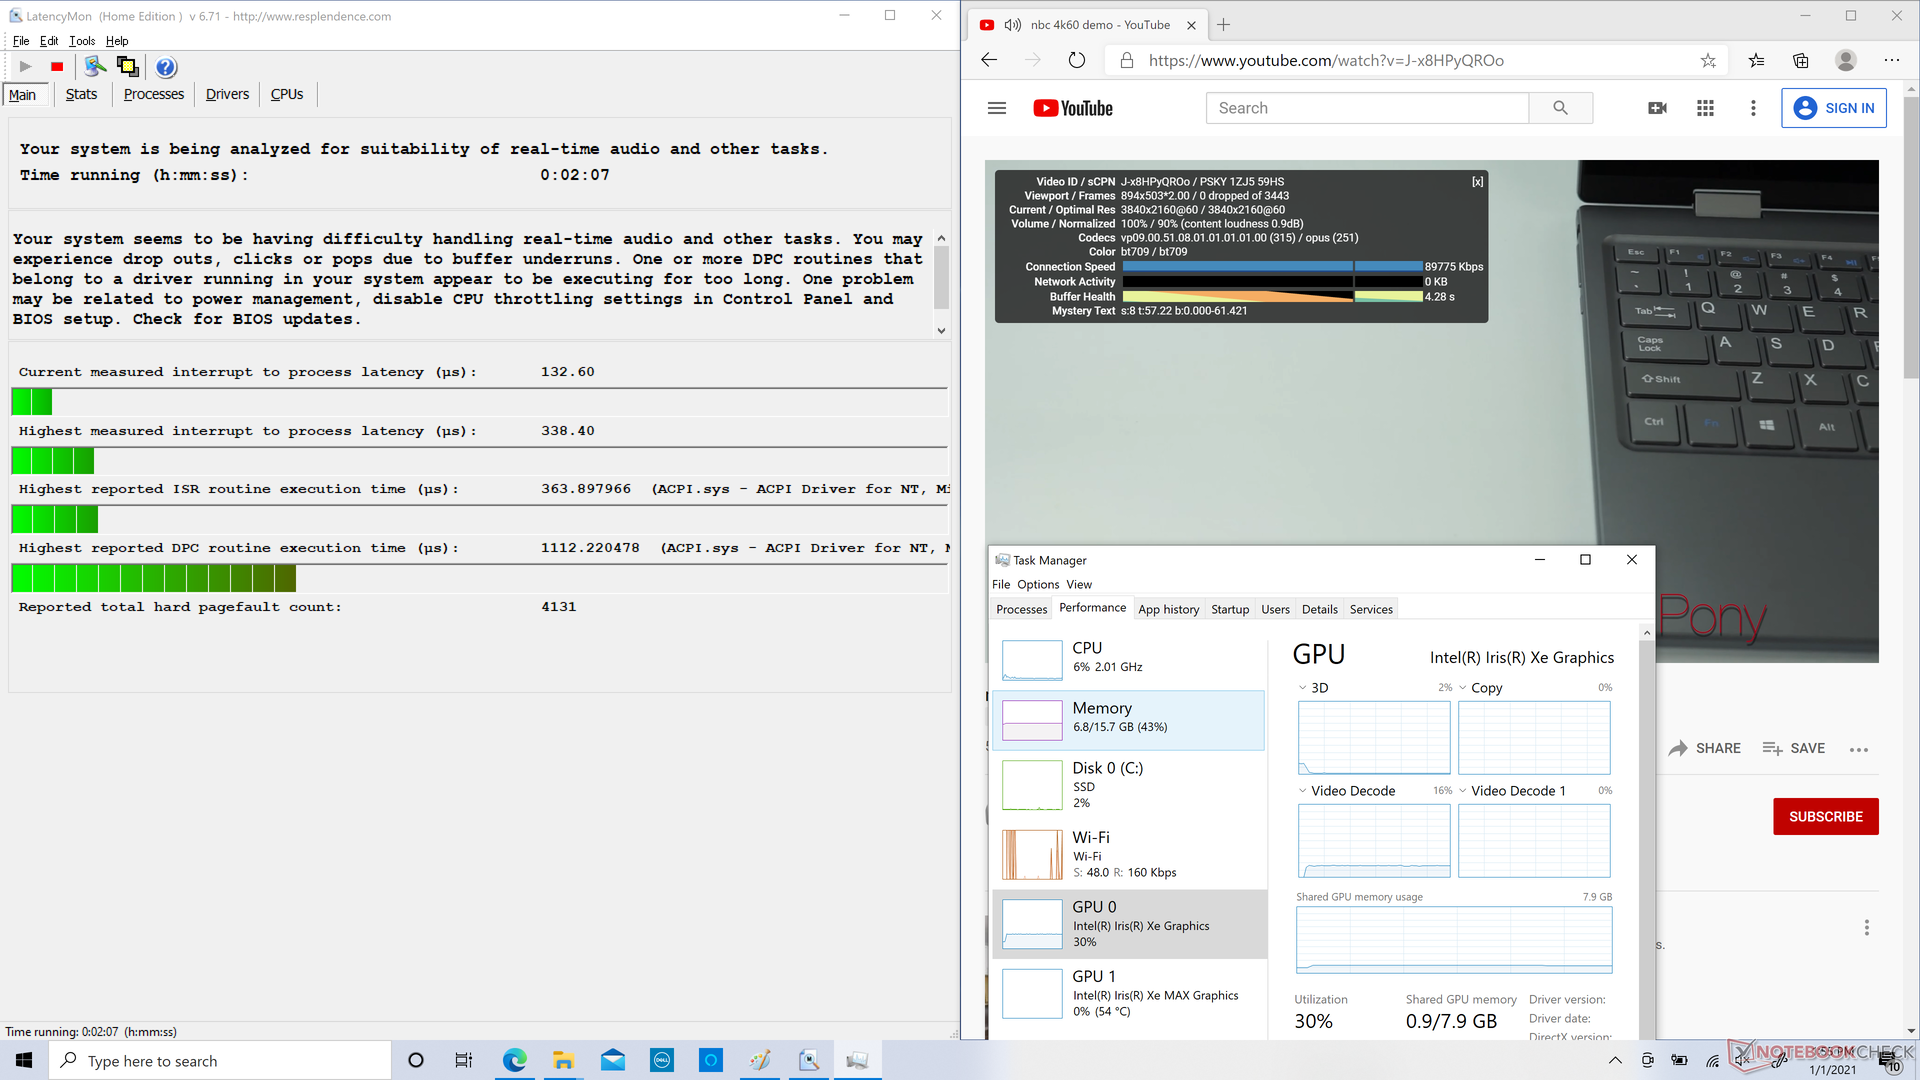
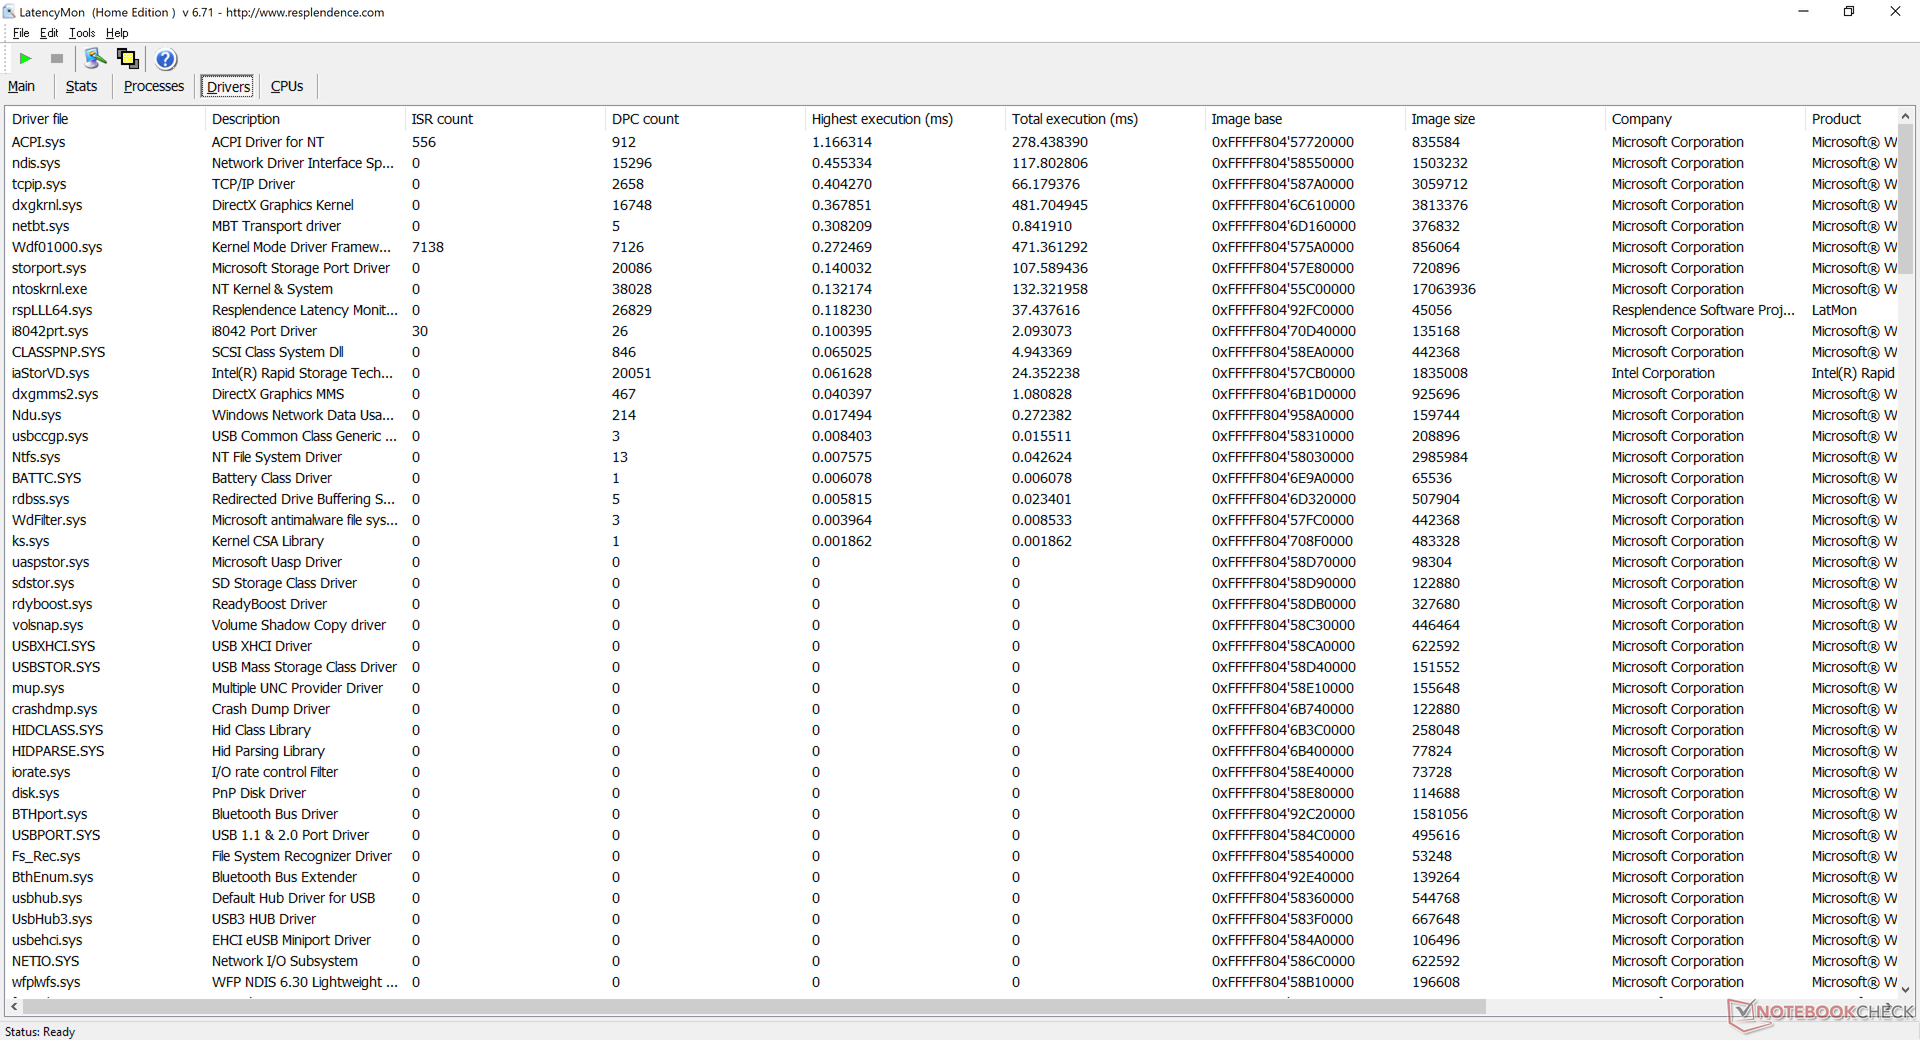
DPC Latency
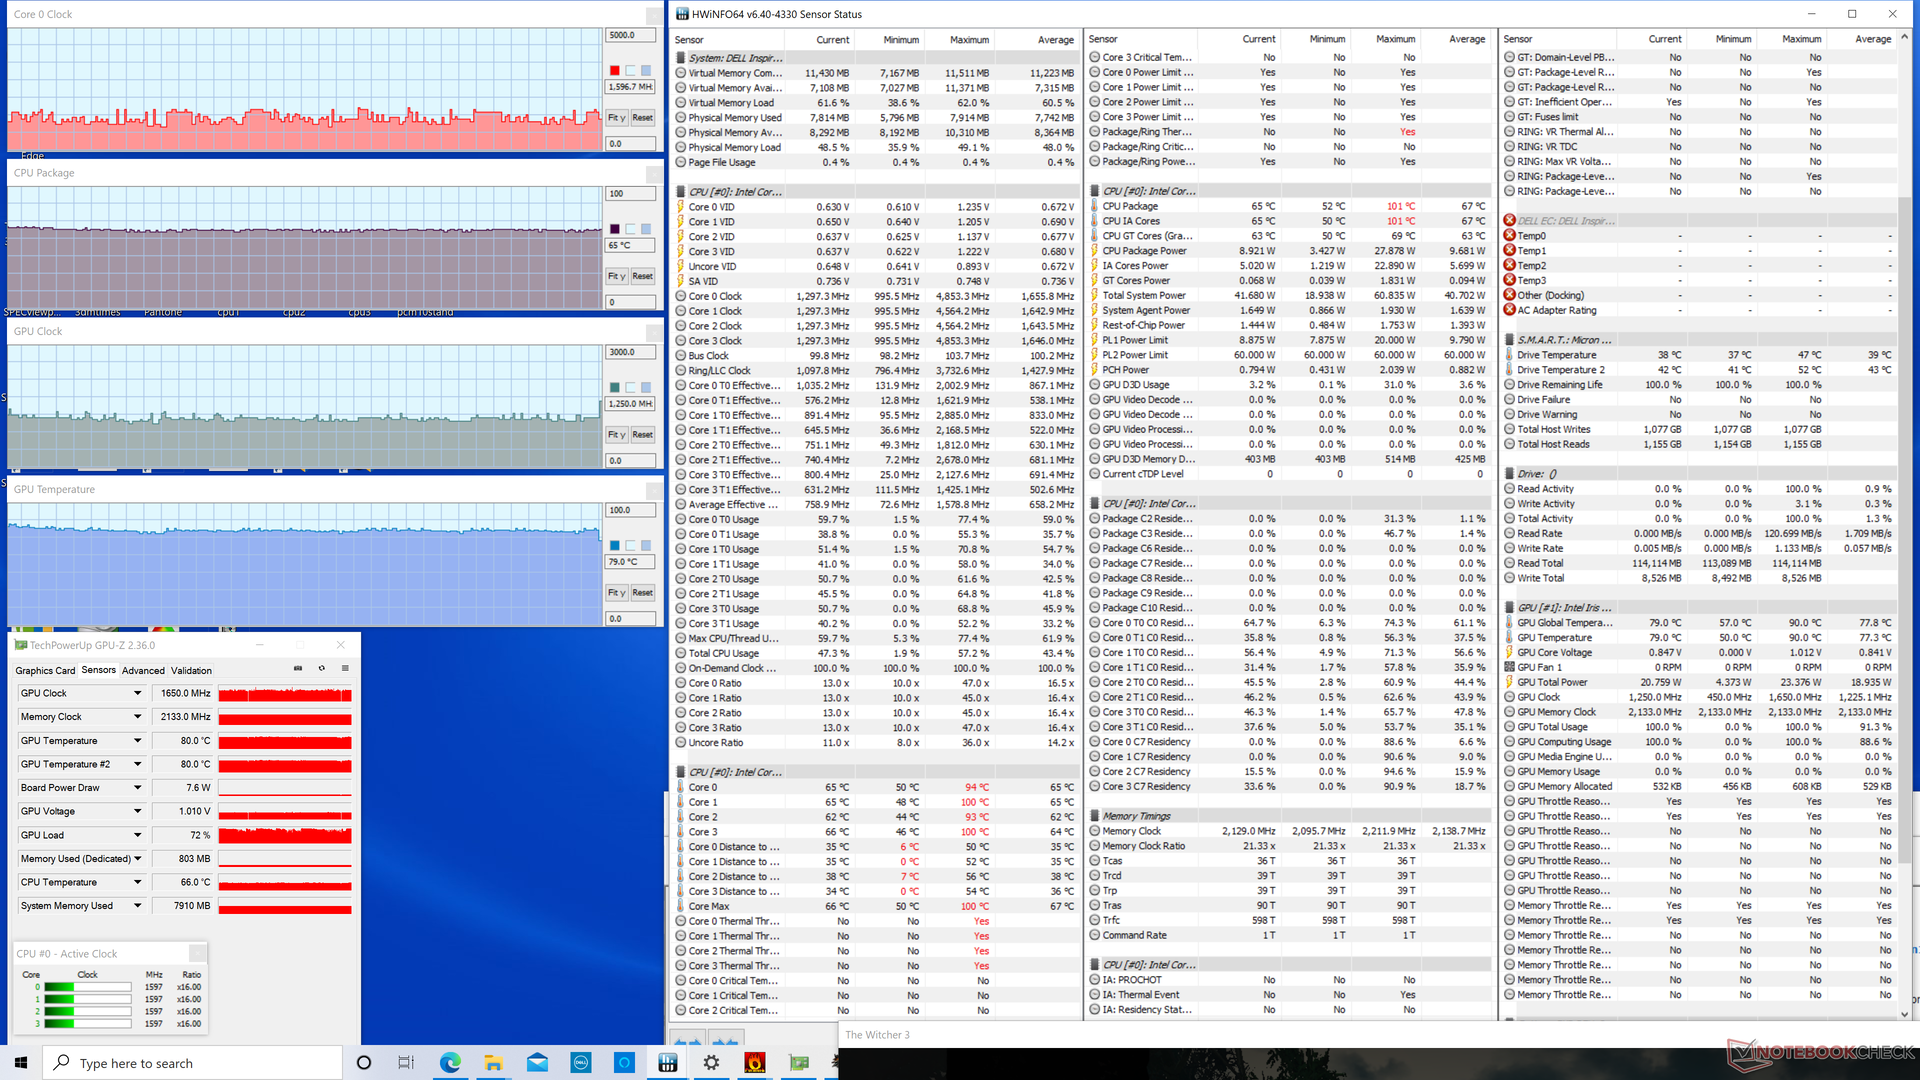
LatencyMon shows minor DPC latency issues related to ACPI.sys. 4K UHD video playback at 60 FPS is otherwise smooth and with no dropped frames during our minute-long test. GPU utilization sits at 30 percent compared to ~50 percent on last year's Iris Plus G7 platform.
| DPC Latencies / LatencyMon - interrupt to process latency (max), Web, Youtube, Prime95 | |
| Dell Inspiron 15 7506 2-in-1 P97F | |
| Microsoft Surface Book 3 15 | |
| Samsung Galaxy Book Flex 15-NP950 | |
| HP Envy x360 15-ee0257ng | |
| Dell Inspiron 15 7000 7506 2-in-1 Black Edition | |
* ... daha küçük daha iyidir
Storage Devices
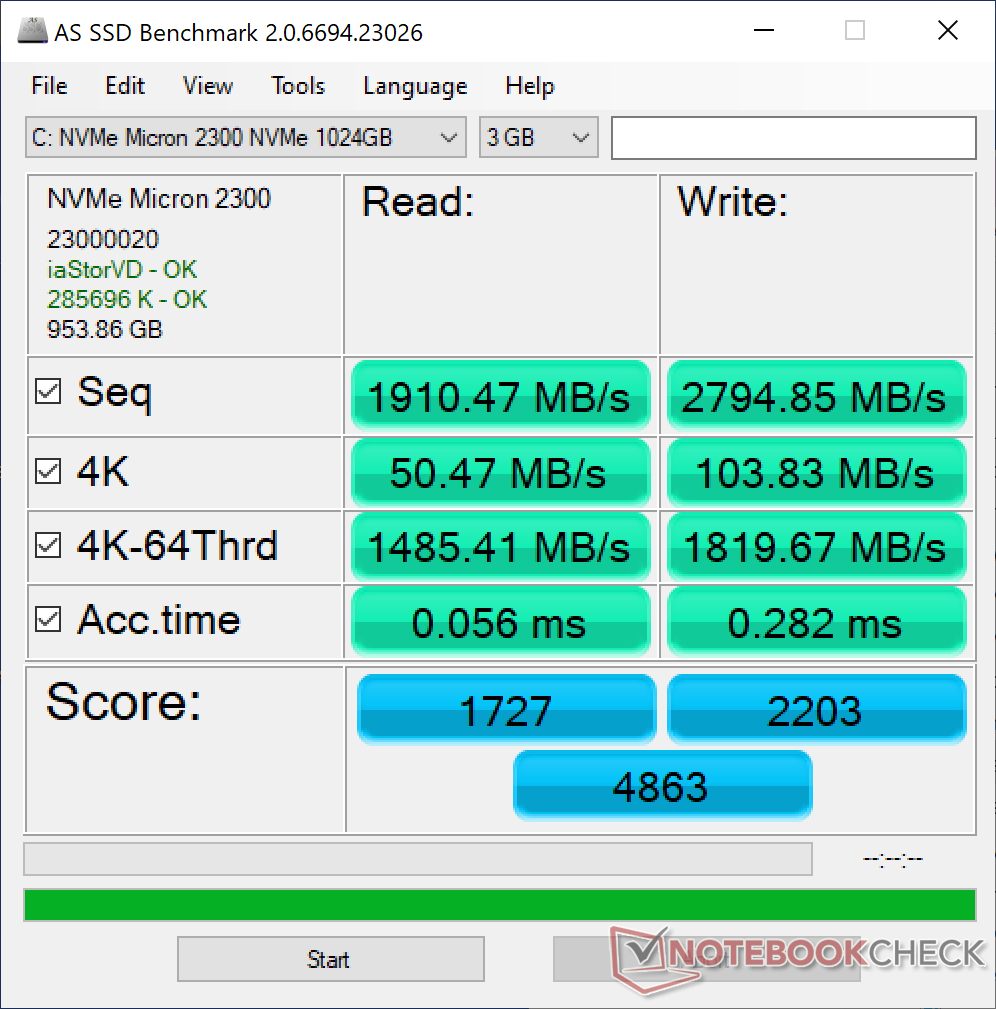
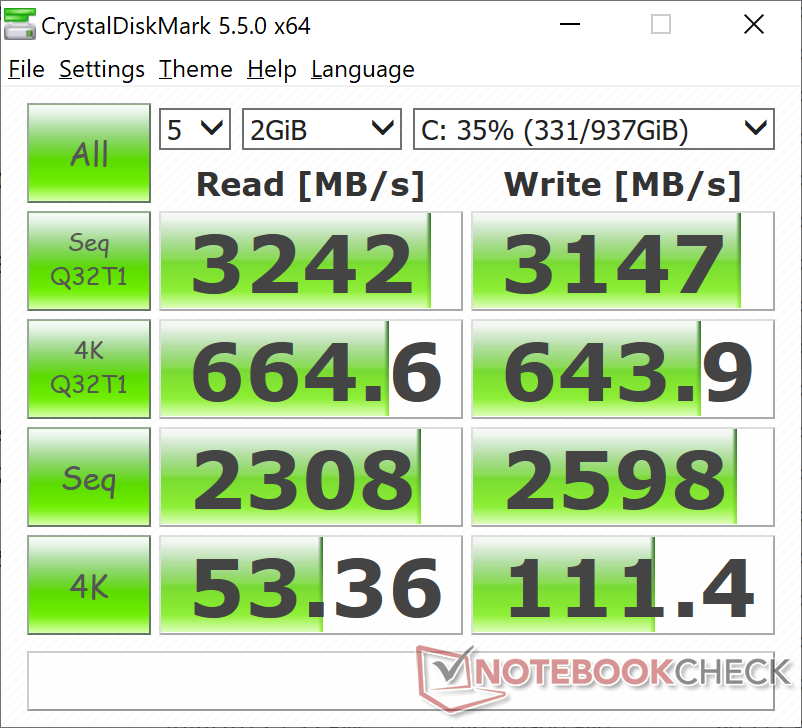
Our test unit comes with a Micron 2300 NVMe SSD with theoretical read and write rates of up to 3300 MB/s and 2700 MB/s, respectively. In comparison, our base Silver Edition unit comes with a Toshiba drive and so Dell may be sourcing from multiple drive makers for its Inspiron 15 7506 2-in-1 series.
The Micron drive may have problems reaching its full potential. When running DiskSpd in a loop, read rates would top out at just 1090 MB/s possibly due to interrupting background activity or reaching thermal limits.
More HDD and SSD benchmark comparisons can be found on our table here.
| Dell Inspiron 15 7000 7506 2-in-1 Black Edition Micron 2300 1TB MTFDHBA1T0TDV | HP Envy x360 15-ee0257ng Intel SSD 660p SSDPEKNW512G8 | Microsoft Surface Book 3 15 SK hynix BC501 HFM256GDGTNG | Asus ZenBook Flip 15 UX563FD-A1027T Samsung SSD PM981 MZVLB1T0HALR | Lenovo Yoga C740-15IML Samsung SSD PM981 MZVLB512HAJQ | Dell Inspiron 15 7506 2-in-1 P97F Toshiba KBG40ZNS256G NVMe | |
|---|---|---|---|---|---|---|
| AS SSD | -37% | -39% | -9% | 0% | -70% | |
| Seq Read (MB/s) | 1910 | 1587 -17% | 1625 -15% | 2739 43% | 2732 43% | 1470 -23% |
| Seq Write (MB/s) | 2795 | 864 -69% | 461.3 -83% | 1307 -53% | 1477 -47% | 324.2 -88% |
| 4K Read (MB/s) | 50.5 | 51.6 2% | 37.2 -26% | 47.43 -6% | 57.7 14% | 37.25 -26% |
| 4K Write (MB/s) | 103.8 | 125.1 21% | 100.9 -3% | 126 21% | 136.3 31% | 98 -6% |
| 4K-64 Read (MB/s) | 1485 | 323.1 -78% | 501 -66% | 1013 -32% | 1021 -31% | 796 -46% |
| 4K-64 Write (MB/s) | 1820 | 724 -60% | 311.7 -83% | 1371 -25% | 1651 -9% | 152.6 -92% |
| Access Time Read * (ms) | 0.056 | 0.101 -80% | 0.072 -29% | 0.082 -46% | 0.062 -11% | 0.146 -161% |
| Access Time Write * (ms) | 0.282 | 0.046 84% | 0.036 87% | 0.029 90% | 0.028 90% | 0.577 -105% |
| Score Read (Points) | 1727 | 533 -69% | 701 -59% | 1335 -23% | 1352 -22% | 980 -43% |
| Score Write (Points) | 2203 | 935 -58% | 459 -79% | 1628 -26% | 1935 -12% | 283 -87% |
| Score Total (Points) | 4863 | 1725 -65% | 1470 -70% | 3582 -26% | 3929 -19% | 1714 -65% |
| Copy ISO MB/s (MB/s) | 1892 | 1323 -30% | 1931 2% | 1972 4% | 353.5 -81% | |
| Copy Program MB/s (MB/s) | 649 | 340.8 -47% | 457.9 -29% | 642 -1% | 194.1 -70% | |
| Copy Game MB/s (MB/s) | 1558 | 823 -47% | 1242 -20% | 1090 -30% | 239 -85% | |
| CrystalDiskMark 5.2 / 6 | -39% | -51% | -14% | -7% | -53% | |
| Write 4K (MB/s) | 111.4 | 104.5 -6% | 87.4 -22% | 137.8 24% | 142.3 28% | 99.3 -11% |
| Read 4K (MB/s) | 53.4 | 49.7 -7% | 38.14 -29% | 44.15 -17% | 47.56 -11% | 32.1 -40% |
| Write Seq (MB/s) | 2598 | 981 -62% | 610 -77% | 2073 -20% | 2185 -16% | 353.1 -86% |
| Read Seq (MB/s) | 2308 | 1517 -34% | 1029 -55% | 2165 -6% | 2235 -3% | 1370 -41% |
| Write 4K Q32T1 (MB/s) | 644 | 398.8 -38% | 280.3 -56% | 431.9 -33% | 515 -20% | 171.1 -73% |
| Read 4K Q32T1 (MB/s) | 665 | 338.4 -49% | 259.6 -61% | 427.7 -36% | 413.4 -38% | 350.8 -47% |
| Write Seq Q32T1 (MB/s) | 3147 | 982 -69% | 829 -74% | 2253 -28% | 2981 -5% | 325.9 -90% |
| Read Seq Q32T1 (MB/s) | 3242 | 1650 -49% | 2037 -37% | 3480 7% | 3565 10% | 2197 -32% |
| Toplam Ortalama (Program / Ayarlar) | -38% /
-38% | -45% /
-44% | -12% /
-11% | -4% /
-3% | -62% /
-64% |
* ... daha küçük daha iyidir

Disk Throttling: DiskSpd Read Loop, Queue Depth 8
GPU Performance
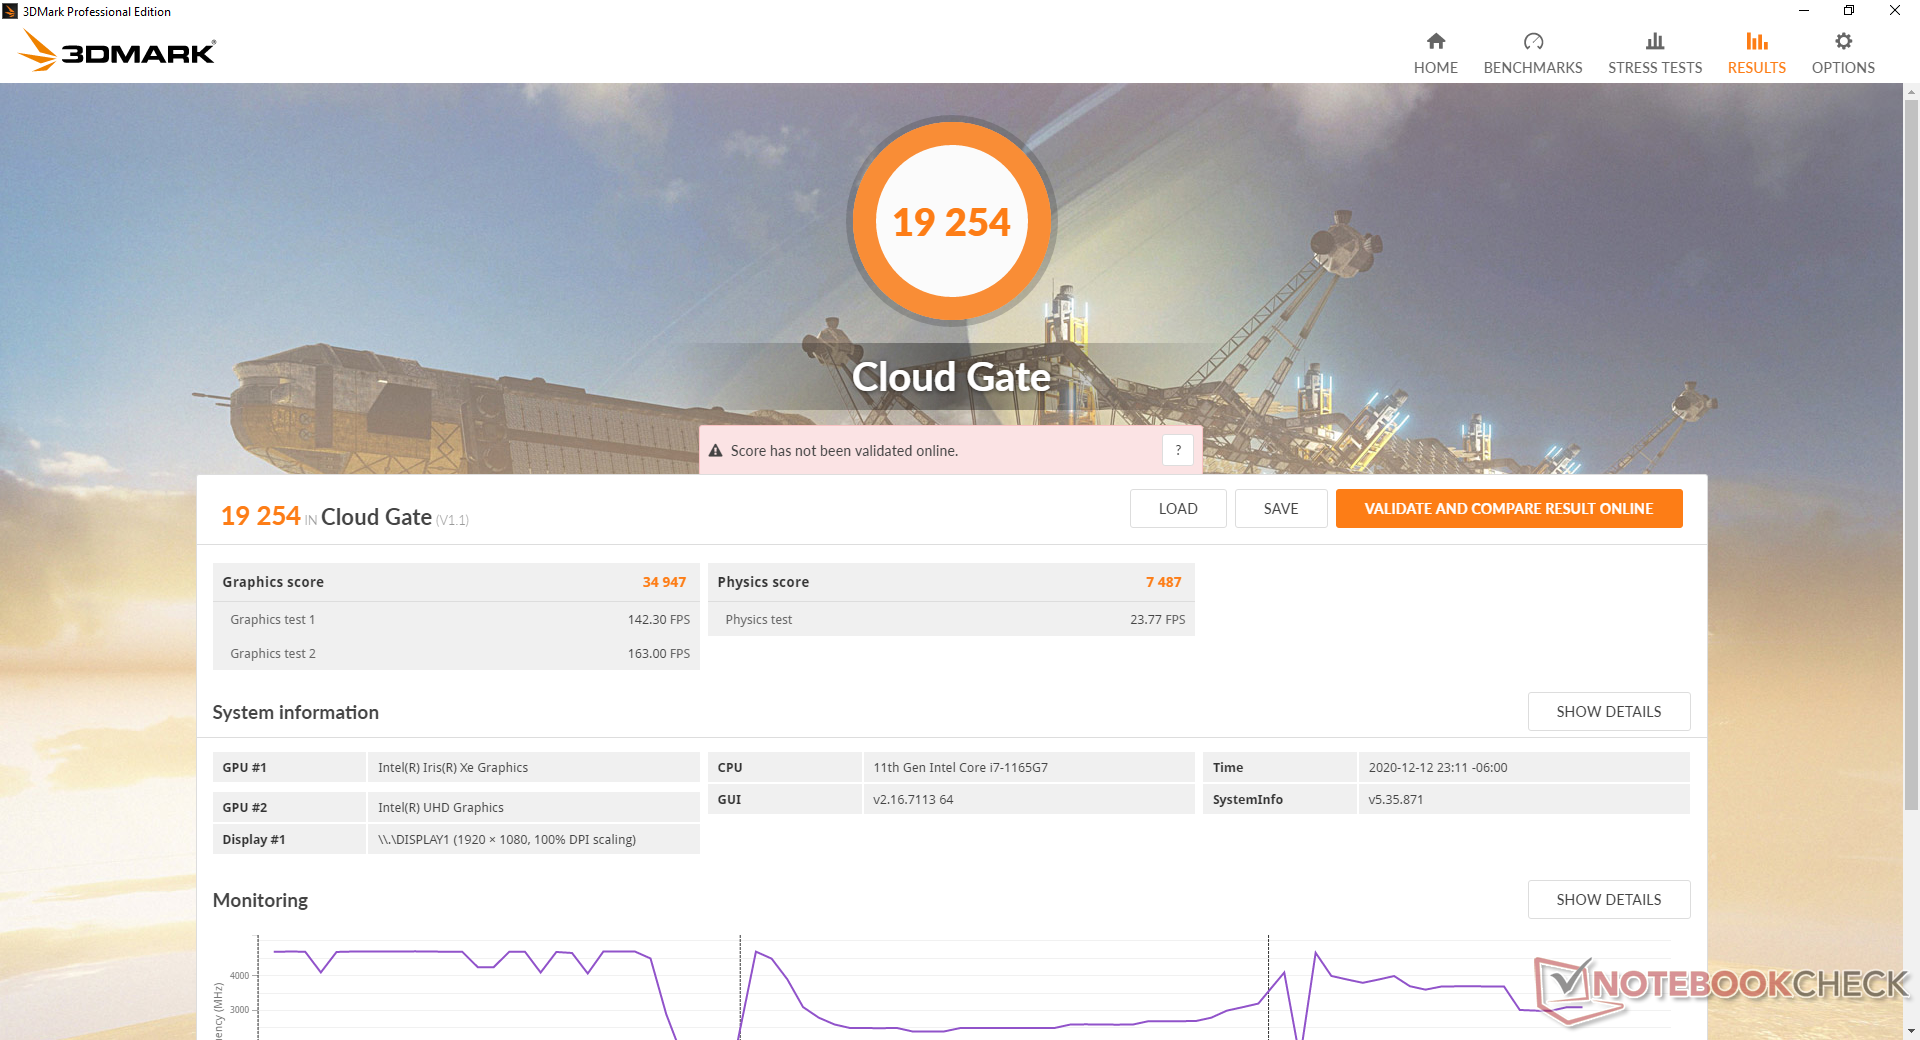
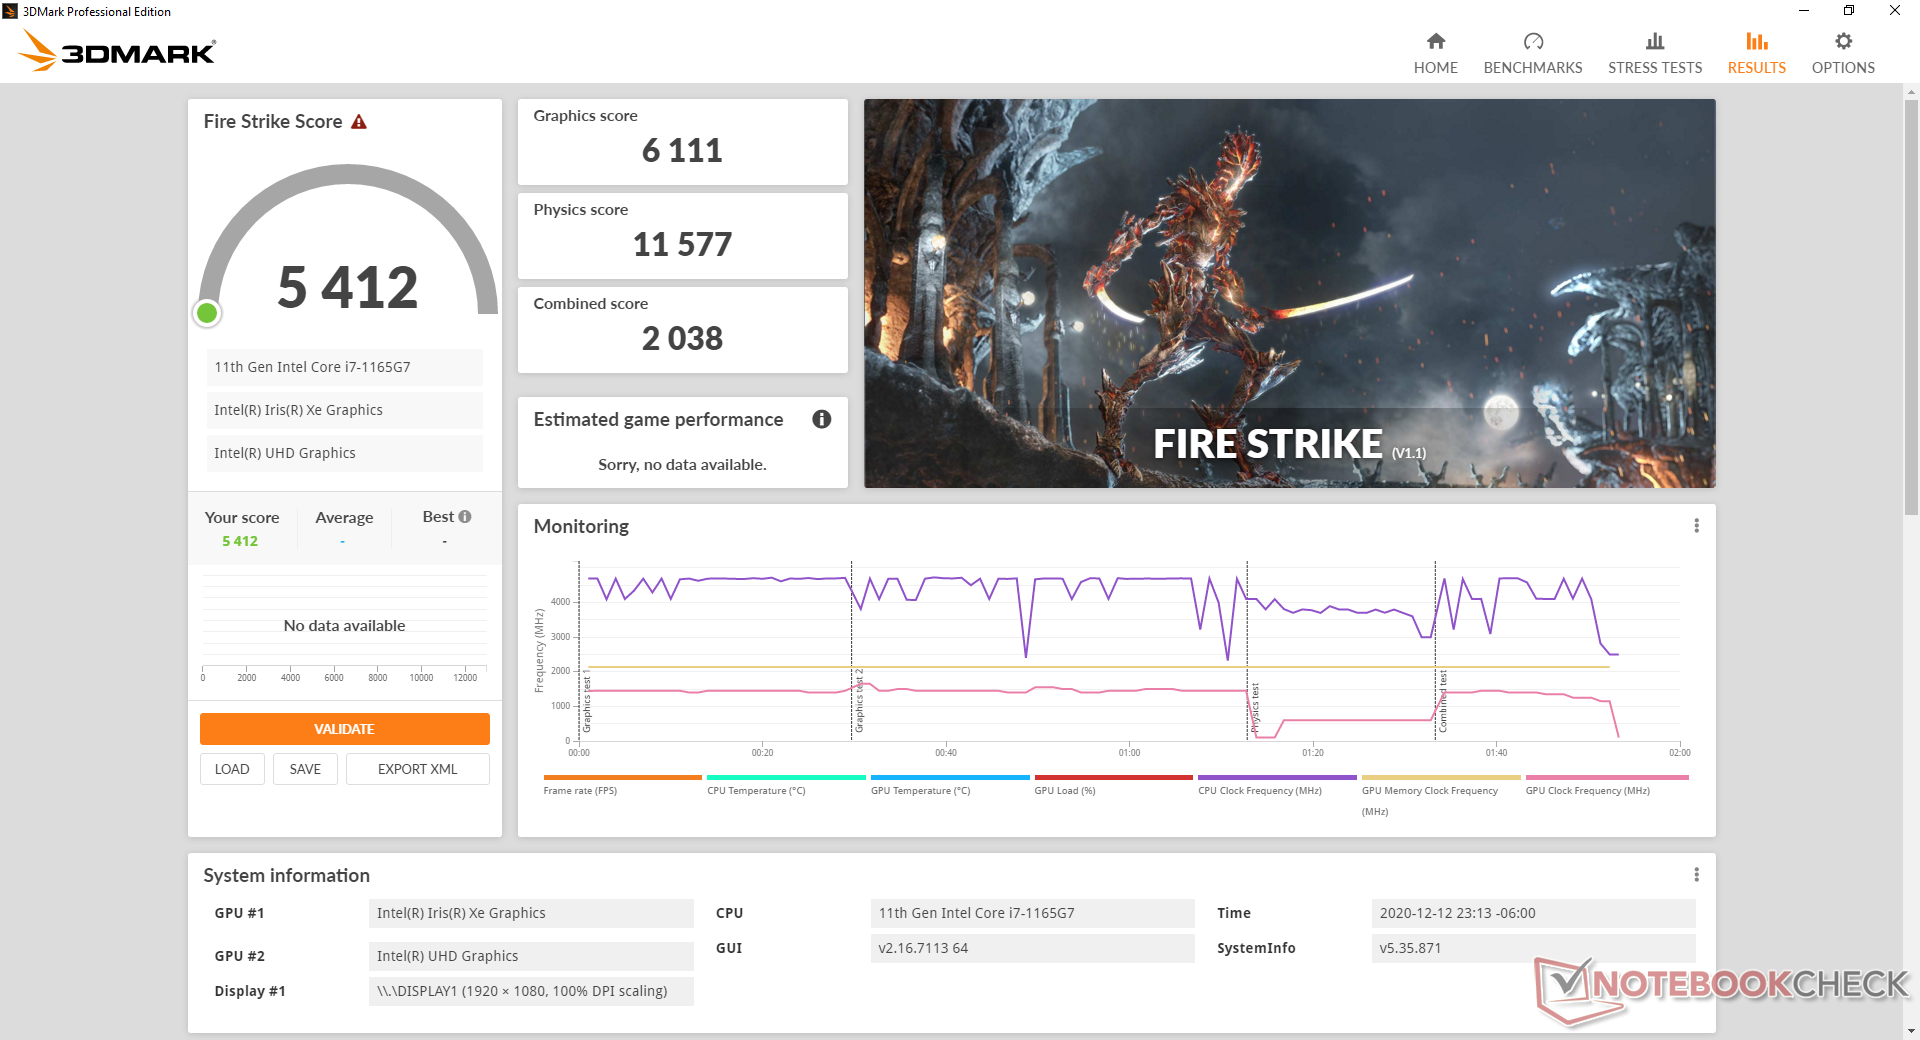
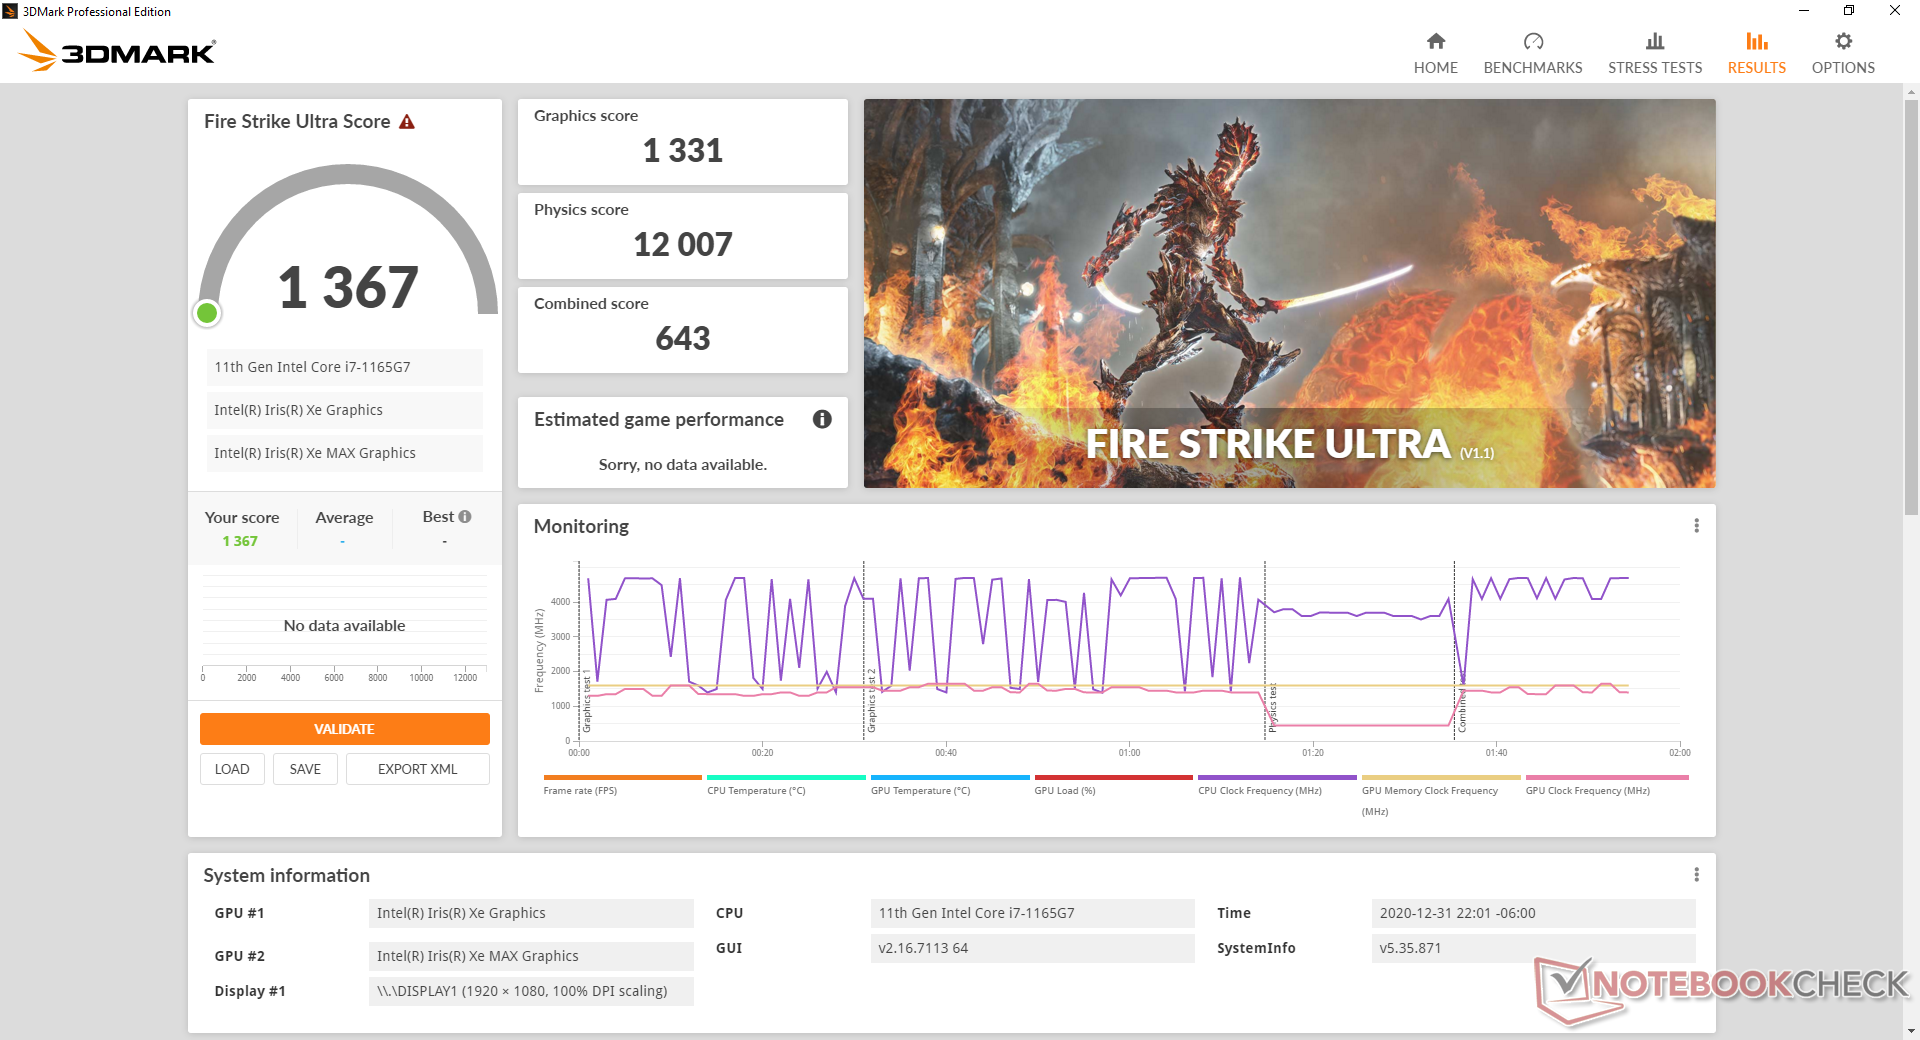
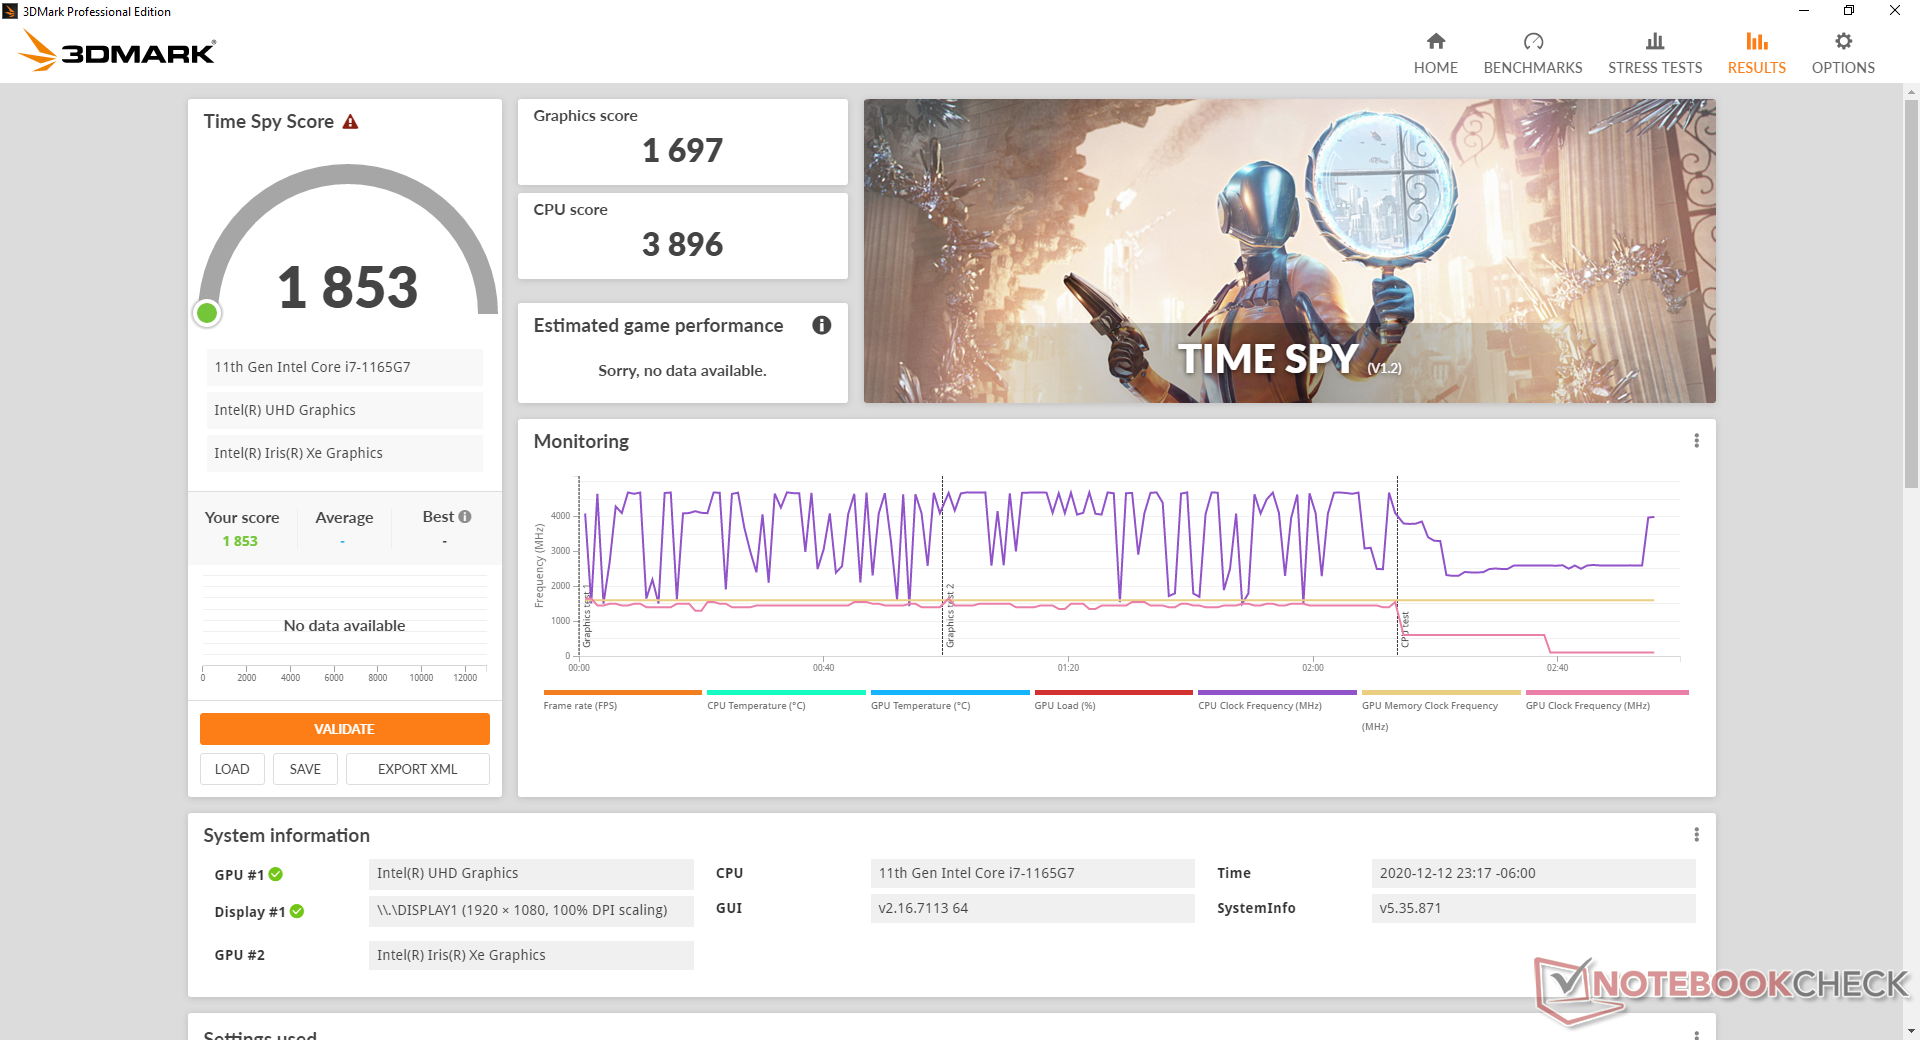
Raw graphics performance is about 10 to 15 percent faster than the Iris Xe 96 EUs or 60 to 70 percent faster than the GeForce MX330 according to 3DMark benchmarks. Intel says the GPU isn't designed for gaming and the benchmarks prove this with frame rates that can be up to 50 percent slower than the GeForce MX350 in popular titles like GTA V or DOTA 2. Even in games where Intel comes out ahead, the unsteady frame rates and lack of adaptive sync impact the overall experience. The Iris Xe Max feels more like an overclocked integrated Iris Xe rather than a proper discrete GPU at least from a gaming perspective.
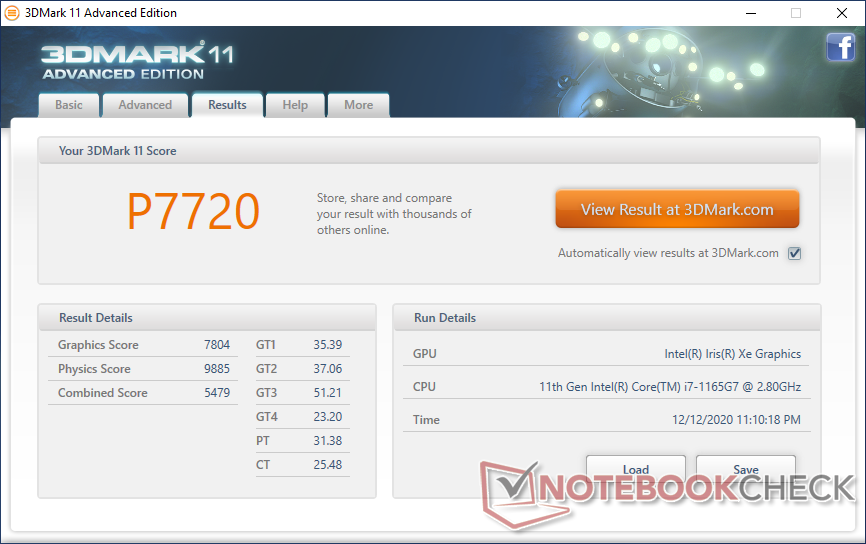
| 3DMark 06 Standard Score | 22466 puan | |
| 3DMark 11 Performance | 7720 puan | |
| 3DMark Cloud Gate Standard Score | 19254 puan | |
| 3DMark Fire Strike Score | 5412 puan | |
| 3DMark Time Spy Score | 1853 puan | |
Yardım | ||
| düşük | orta | yüksek | ultra | QHD | 4K | |
|---|---|---|---|---|---|---|
| GTA V (2015) | 65.9 | 60.7 | 24 | |||
| The Witcher 3 (2015) | 54.2 | 53.7 | 33.8 | 17.7 | 11.2 | |
| Dota 2 Reborn (2015) | 59.1 | 40.3 | 38.3 | 38.4 | 20.1 | |
| Final Fantasy XV Benchmark (2018) | 46.1 | 24.2 | 17 | |||
| X-Plane 11.11 (2018) | 33.4 | 34.4 | 29.7 | |||
| Strange Brigade (2018) | 87.4 | 39.1 | 33 | 28.5 | 20.1 | 11 |
Emissions
System Noise
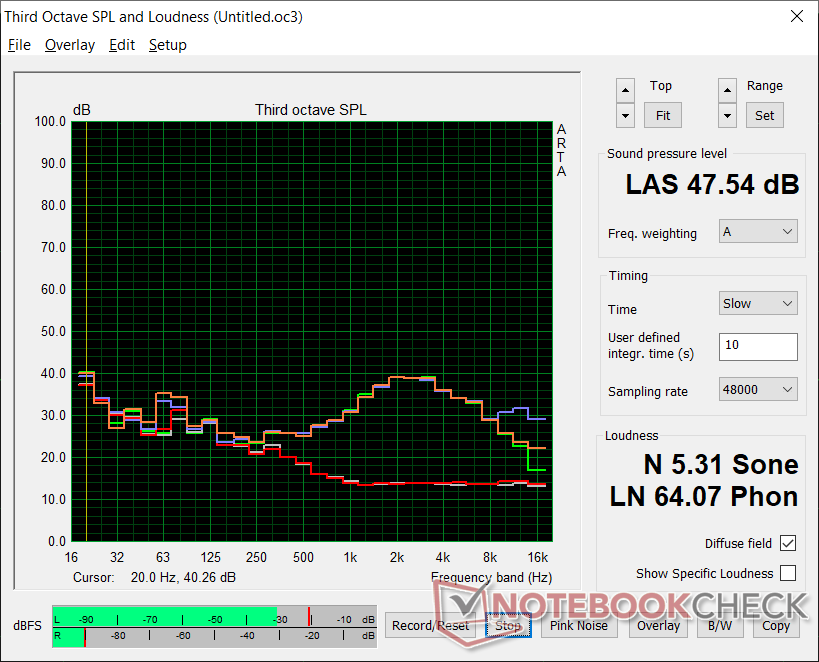
Like the Silver Edition, the fan in the Black Edition is almost always silent or quiet during low loads like browsing or video streaming. Fan noise would typically top out at just 30.3 dB(A) or 32.8 dB(A) against a silent background of 27.3 dB(A) when under such scenarios.
If running higher loads, the Black Edition will become noisier faster than the Silver Edition. Running the first 90-second benchmark scene in 3DMark 06, for example, would induce a fan noise of 47.4 dB(A) whereas the Silver Edition would remain silent. Maximum fan noise is otherwise the same between the two laptops; it just takes a bit longer for the Silver Edition to reach that point.
| Dell Inspiron 15 7000 7506 2-in-1 Black Edition Xe MAX, i7-1165G7, Micron 2300 1TB MTFDHBA1T0TDV | Samsung Galaxy Book Flex 15-NP950 GeForce MX250, i7-1065G7, Samsung SSD PM981a MZVLB512HBJQ | HP Envy x360 15-ee0257ng Vega 6, R5 4500U, Intel SSD 660p SSDPEKNW512G8 | Microsoft Surface Book 3 15 GeForce GTX 1660 Ti Max-Q, i7-1065G7, SK hynix BC501 HFM256GDGTNG | Asus ZenBook Flip 15 UX563FD-A1027T GeForce GTX 1050 Max-Q, i7-10510U, Samsung SSD PM981 MZVLB1T0HALR | Lenovo Yoga C740-15IML UHD Graphics 620, i7-10510U, Samsung SSD PM981 MZVLB512HAJQ | Dell Inspiron 15 7506 2-in-1 P97F Iris Xe G7 80EUs, i5-1135G7, Toshiba KBG40ZNS256G NVMe | |
|---|---|---|---|---|---|---|---|
| Noise | 13% | 4% | 3% | 3% | 6% | 9% | |
| kapalı / ortam * (dB) | 27.3 | 24.9 9% | 27 1% | 30.2 -11% | 30.3 -11% | 29.3 -7% | 27.1 1% |
| Idle Minimum * (dB) | 27.3 | 24.9 9% | 27 1% | 30.2 -11% | 30.3 -11% | 29.3 -7% | 27.1 1% |
| Idle Average * (dB) | 27.3 | 24.9 9% | 27 1% | 30.2 -11% | 30.3 -11% | 29.3 -7% | 27.1 1% |
| Idle Maximum * (dB) | 27.3 | 24.9 9% | 27 1% | 30.2 -11% | 30.3 -11% | 29.6 -8% | 27.1 1% |
| Load Average * (dB) | 47.4 | 38.4 19% | 43.2 9% | 30.9 35% | 33.7 29% | 32.4 32% | 31.5 34% |
| Witcher 3 ultra * (dB) | 47.4 | 38.4 19% | 45.1 5% | 37.4 21% | 37.4 21% | ||
| Load Maximum * (dB) | 47.5 | 38.5 19% | 43.2 9% | 34.3 28% | 38.9 18% | 33.3 30% | 47.2 1% |
* ... daha küçük daha iyidir
Ses yüksekliği
| Boşta |
| 27.3 / 27.3 / 27.3 dB |
| Çalışırken |
| 47.4 / 47.5 dB |
 | ||
30 dB sessiz 40 dB(A) duyulabilirlik 50 dB(A) gürültülü |
||
min: | ||
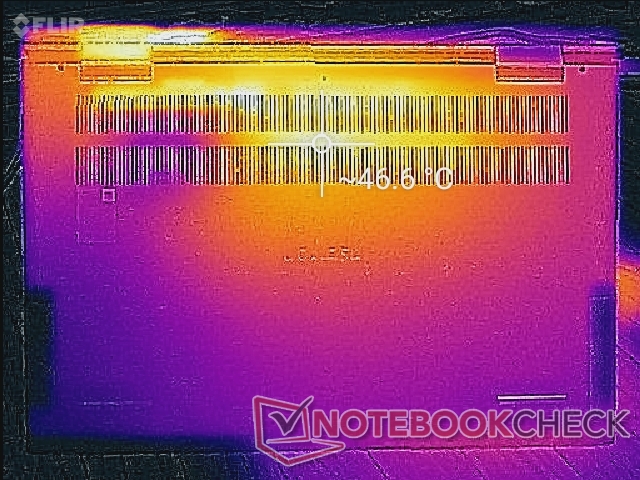
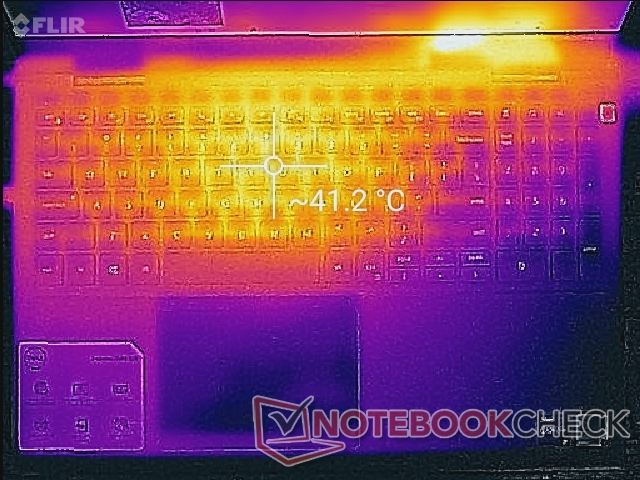
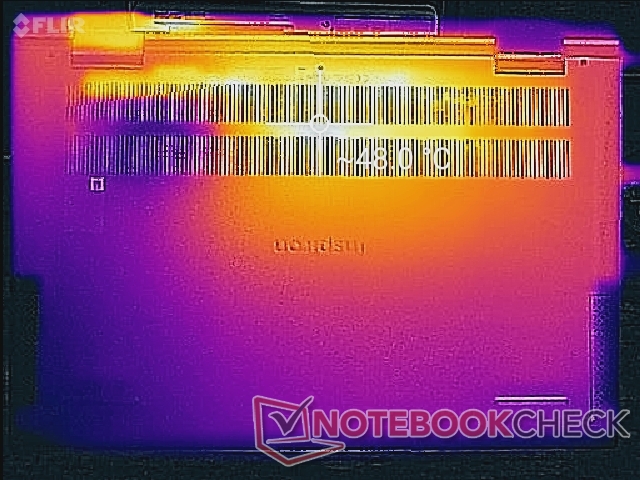
Temperature
Surface temperatures when under load can be warmer than on the Inspiron 15 7506 2-in-1 Silver Edition. The keyboard hot spot, for example, reaches almost 42 C when running Prime95 and FurMark compared to only 35 C on the regular Inspiron 15 7506 2-in-1. The presence of a discrete GPU is definitely part of the equation.
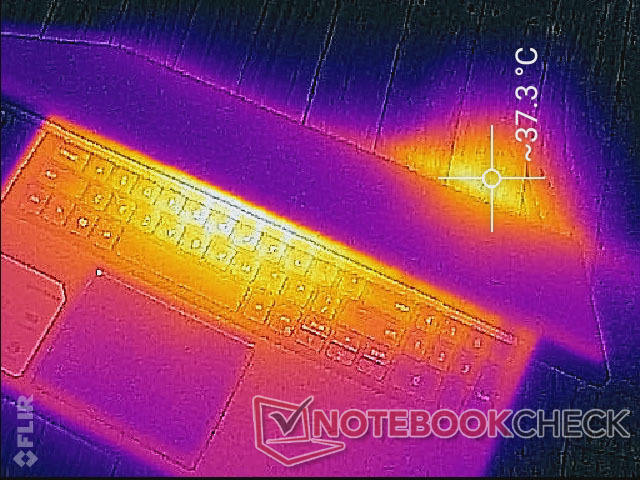
(±) Üst taraftaki maksimum sıcaklık, 36.8 °C / 98 F ortalamasına kıyasla 43 °C / 109 F'dir. , Multimedia sınıfı için 21 ile 71 °C arasında değişir.
(-) Alt kısım, 39.1 °C / 102 F ortalamasına kıyasla maksimum 48.8 °C / 120 F'ye kadar ısınır
(+) Boşta kullanımda, üst tarafın ortalama sıcaklığı 25.6 °C / 78 F olup, cihazın 31.3 °C / 88 F.
(±) The Witcher 3 oynarken, üst tarafın ortalama sıcaklığı 32.4 °C / 90 F olup, cihazın 31.3 °C / 88 F.
(+) Avuç içi dayanakları ve dokunmatik yüzey, maksimum 29.2 °C / 84.6 F ile cilt sıcaklığından daha soğuktur ve bu nedenle dokunulduğunda soğuktur.
(±) Benzer cihazların avuç içi dayanağı alanının ortalama sıcaklığı 28.7 °C / 83.7 F (-0.5 °C / -0.9 F) idi.
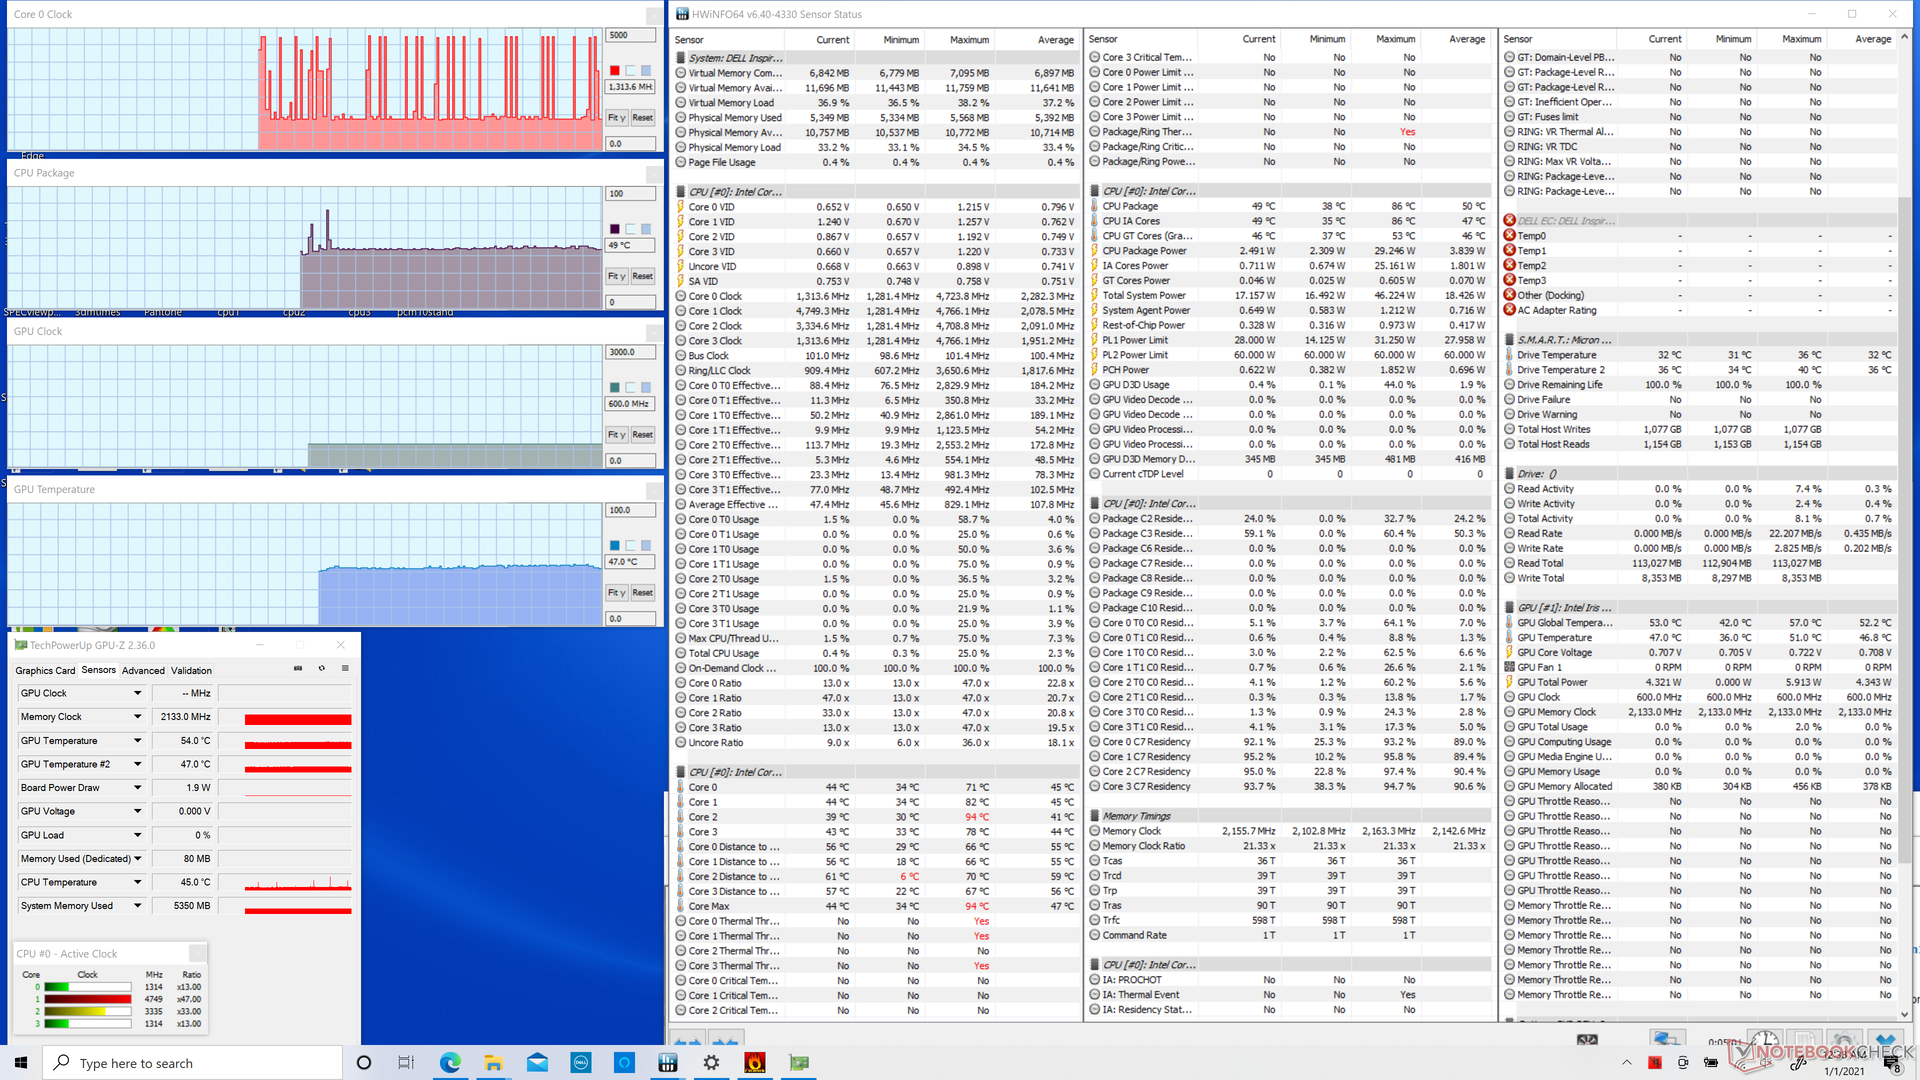
Stress Test
When running Prime95, CPU clock rates would boost to 3.4 GHz for the first few seconds and at a core temperature of 100 C. However, this falls very quickly to the 2.5 to 3.0 GHz range for a slightly cooler core temperature of 93 C to 96 C. These sustained clock rates are even lower than what we recorded on the Silver Edition which stabilizes at about 3.0 to 3.2 GHz instead when subjected to similar conditions.
Running on battery power will limit CPU performance. A 3DMark 11 run on batteries would return Physics and Graphics scores of 6483 and 7784 points, respectively, compared to 9885 and 7804 points when on mains.
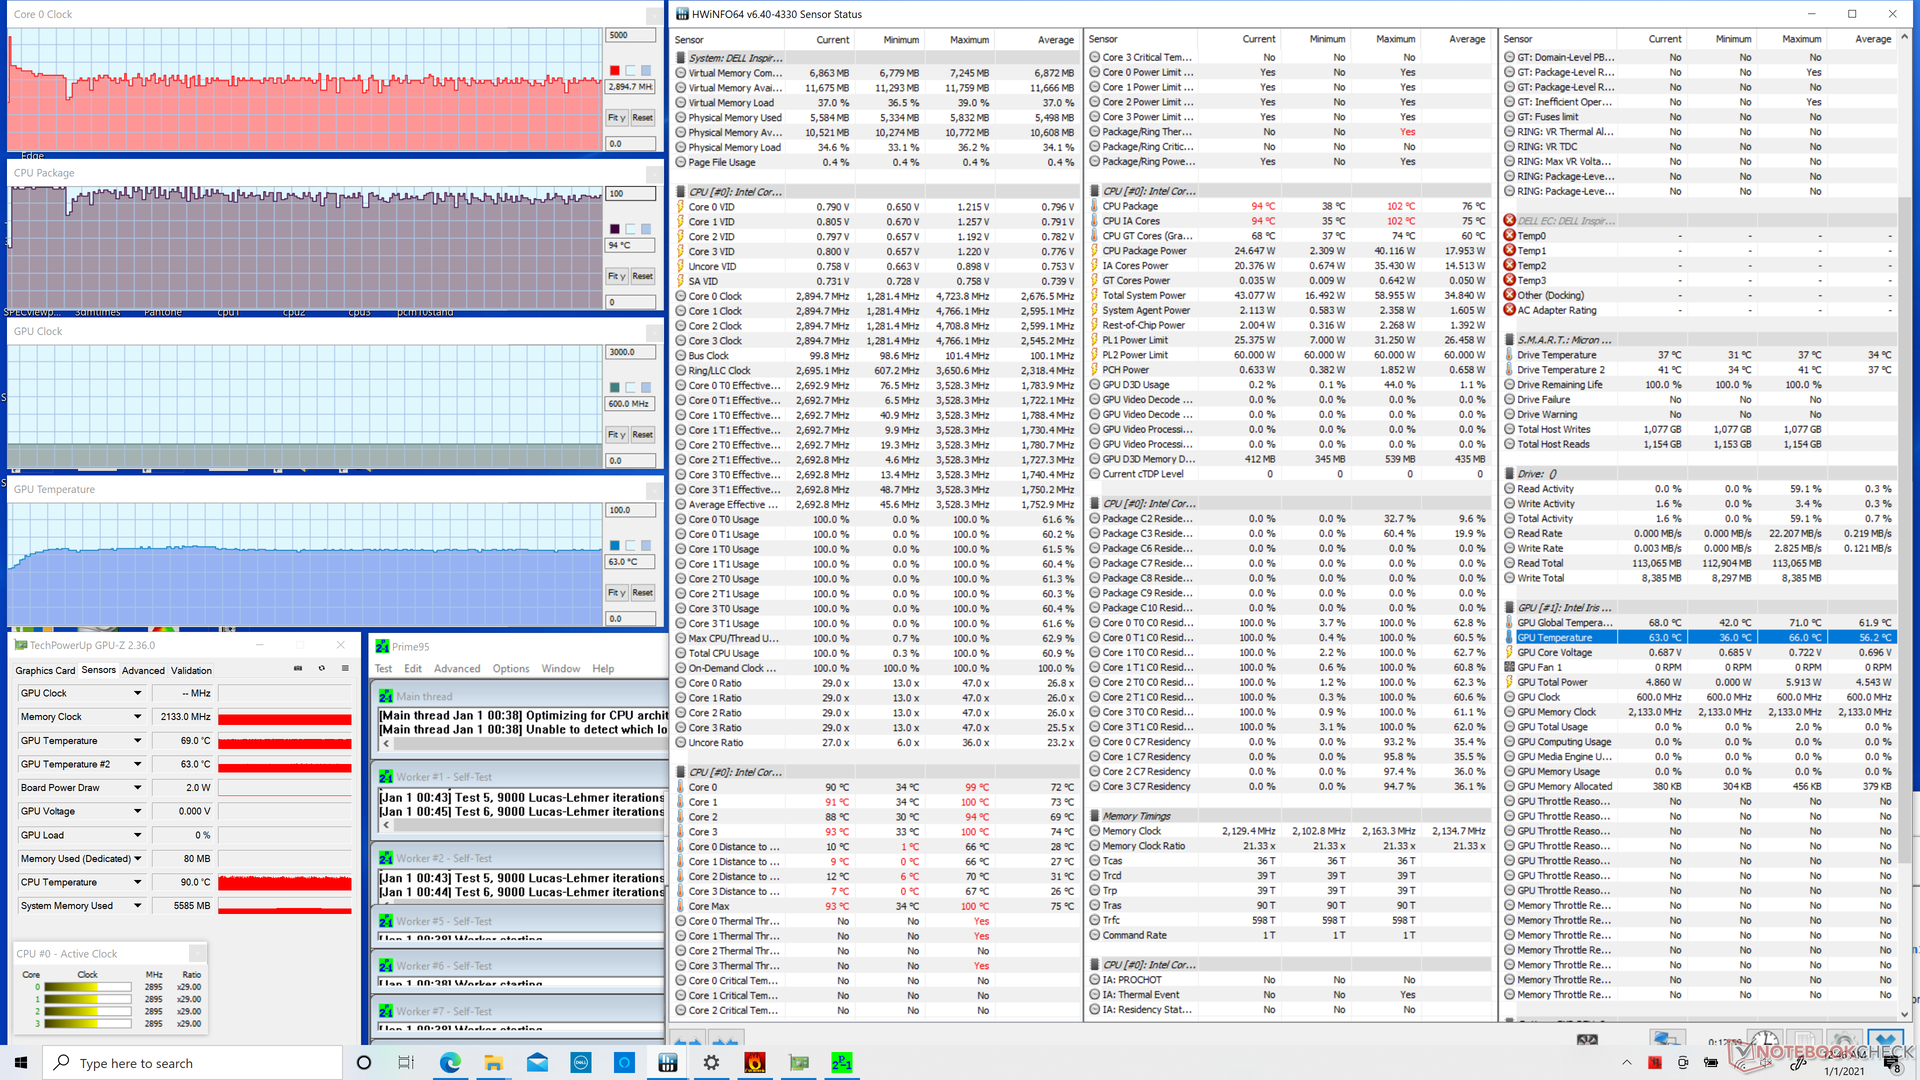
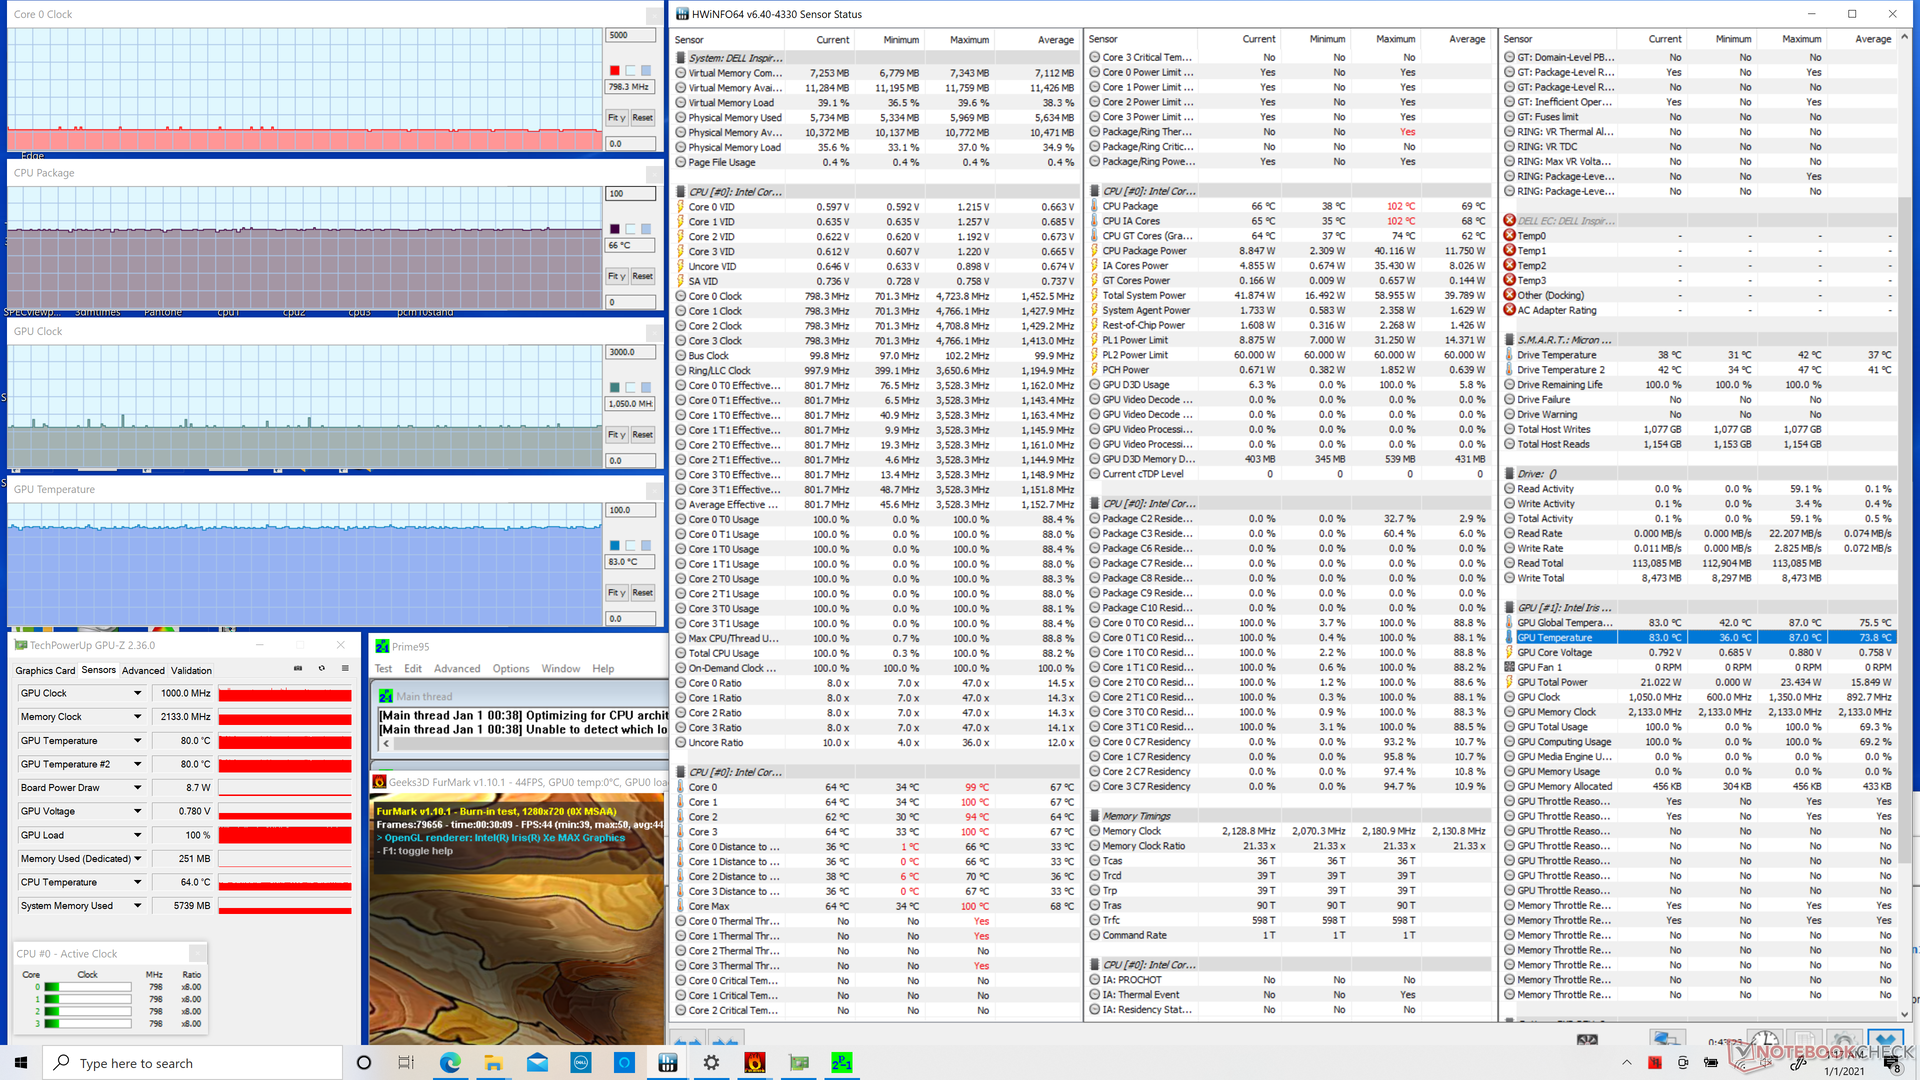
| CPU Clock (GHz) | GPU Clock (MHz) | Average CPU Temperature (°C) | Average GPU Temperature (°C) | |
| System Idle | -- | -- | 49 | 47 |
| Prime95 Stress | 2.5 - 3.0 | -- | 94 | 63 |
| Prime95 + FurMark Stress | 0.8 - 0.9 | 1050 | 66 | 83 |
| Witcher 3 Stress | ~1.6 | 1250 | 65 | 79 |
Speakers


Dell Inspiron 15 7000 7506 2-in-1 Black Edition ses analizi
(±) | hoparlör ses yüksekliği ortalama ama iyi (81.6 dB)
Bas 100 - 315Hz
(-) | neredeyse hiç bas yok - ortalama olarak medyandan 22.7% daha düşük
(±) | Bas doğrusallığı ortalamadır (11% delta - önceki frekans)
Ortalar 400 - 2000 Hz
(±) | daha yüksek ortalar - ortalama olarak medyandan 8.4% daha yüksek
(±) | Ortaların doğrusallığı ortalamadır (8.6% delta - önceki frekans)
Yüksekler 2 - 16 kHz
(+) | dengeli yüksekler - medyandan yalnızca 3.4% uzakta
(+) | yüksekler doğrusaldır (6.2% deltadan önceki frekansa)
Toplam 100 - 16.000 Hz
(±) | Genel sesin doğrusallığı ortalamadır (21.2% ortancaya göre fark)
Aynı sınıfla karşılaştırıldığında
» Bu sınıftaki tüm test edilen cihazların %73%'si daha iyi, 7% benzer, 20% daha kötüydü
» En iyisinin deltası 5% idi, ortalama 17% idi, en kötüsü 45% idi
Test edilen tüm cihazlarla karşılaştırıldığında
» Test edilen tüm cihazların %59'si daha iyi, 7 benzer, % 34 daha kötüydü
» En iyisinin deltası 4% idi, ortalama 23% idi, en kötüsü 134% idi
Apple MacBook 12 (Early 2016) 1.1 GHz ses analizi
(+) | hoparlörler nispeten yüksek sesle çalabilir (83.6 dB)
Bas 100 - 315Hz
(±) | azaltılmış bas - ortalama olarak medyandan 11.3% daha düşük
(±) | Bas doğrusallığı ortalamadır (14.2% delta - önceki frekans)
Ortalar 400 - 2000 Hz
(+) | dengeli ortalar - medyandan yalnızca 2.4% uzakta
(+) | orta frekanslar doğrusaldır (5.5% deltadan önceki frekansa)
Yüksekler 2 - 16 kHz
(+) | dengeli yüksekler - medyandan yalnızca 2% uzakta
(+) | yüksekler doğrusaldır (4.5% deltadan önceki frekansa)
Toplam 100 - 16.000 Hz
(+) | genel ses doğrusaldır (10.2% ortancaya göre fark)
Aynı sınıfla karşılaştırıldığında
» Bu sınıftaki tüm test edilen cihazların %7%'si daha iyi, 2% benzer, 91% daha kötüydü
» En iyisinin deltası 5% idi, ortalama 18% idi, en kötüsü 53% idi
Test edilen tüm cihazlarla karşılaştırıldığında
» Test edilen tüm cihazların %5'si daha iyi, 1 benzer, % 94 daha kötüydü
» En iyisinin deltası 4% idi, ortalama 23% idi, en kötüsü 134% idi
Energy Management
Power Consumption
Unsurprisingly, the Black Edition will be more demanding than the base Silver Edition option with no discrete GPU. Simply idling on desktop can draw up to 16 W on the Black Edition compared to just 9 W on the lesser Silver Edition. Running higher loads like 3DMark 06 or games can result in up to 70 percent higher power consumption than the Silver Edition. Of course, Black Edition owners get to enjoy 60 to 90 percent faster raw graphics performance than owners of the base Silver Edition model.
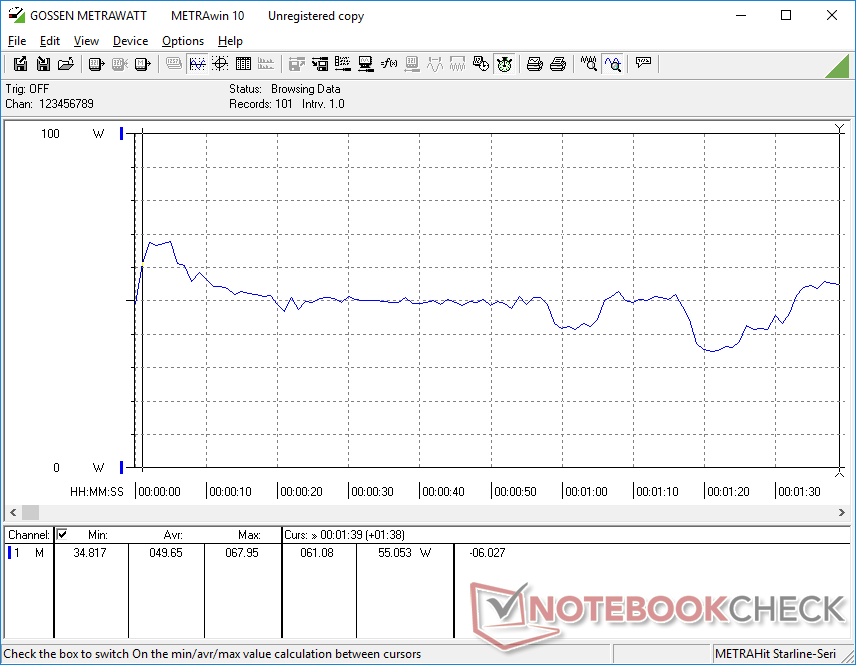
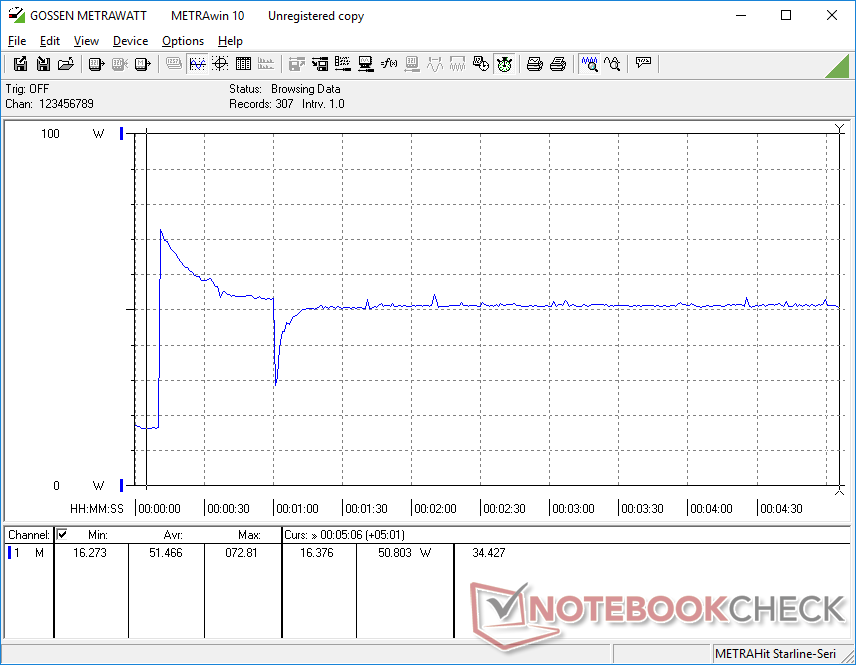
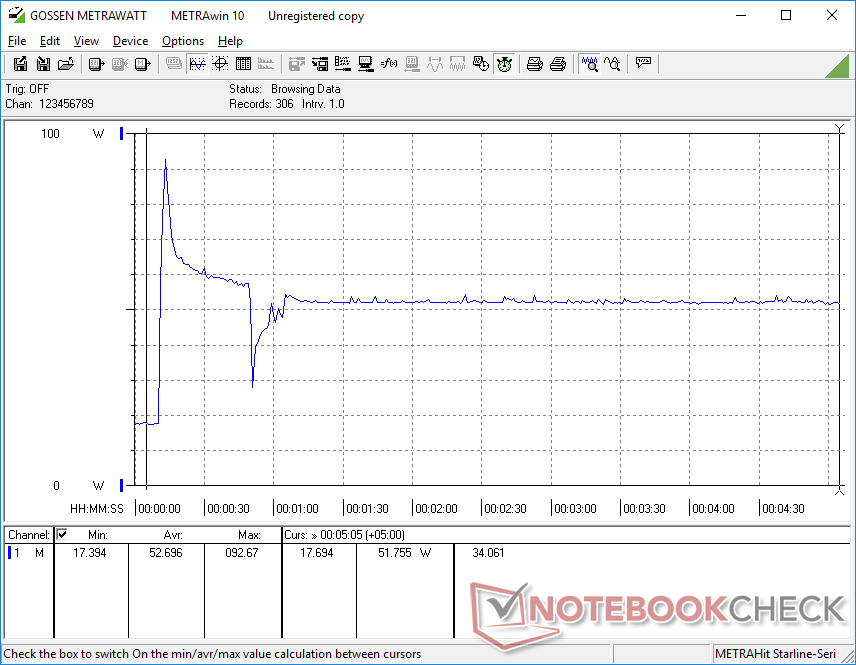
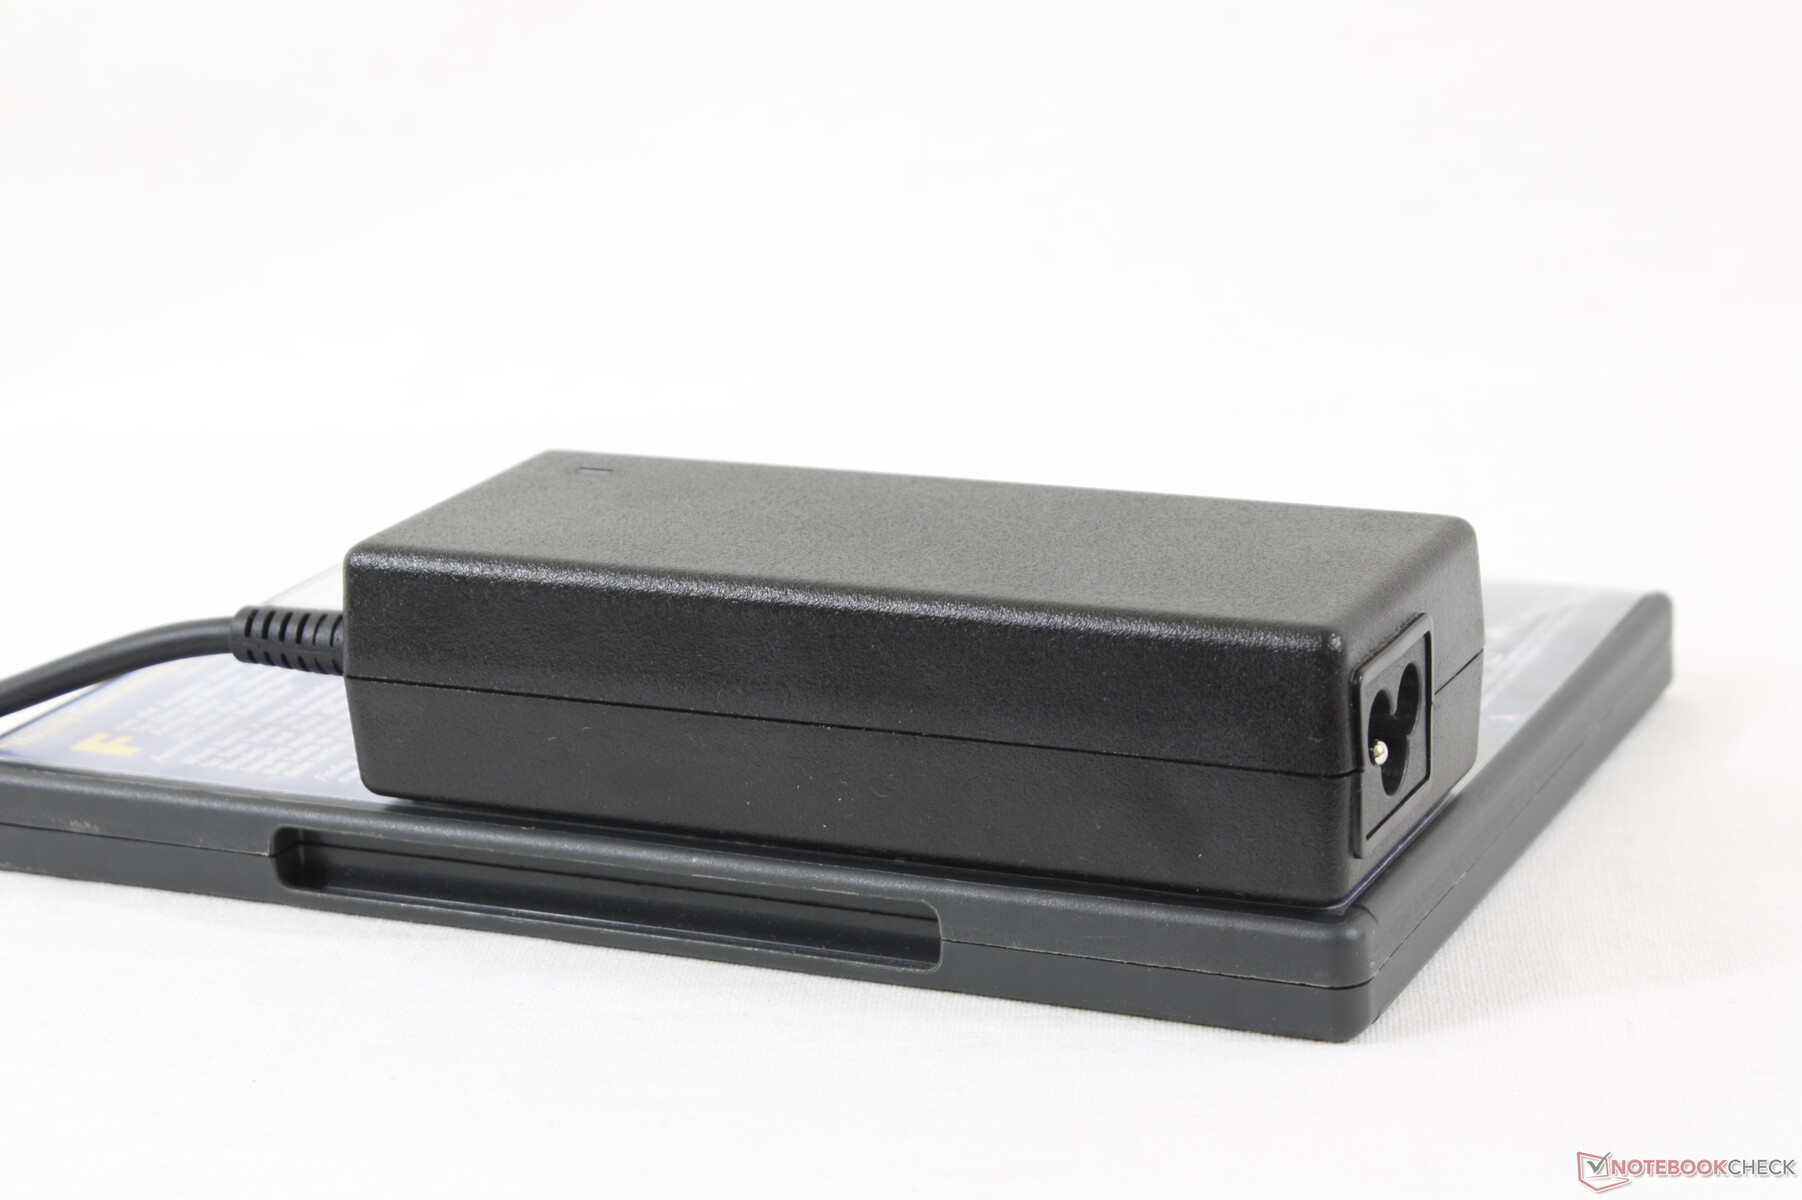
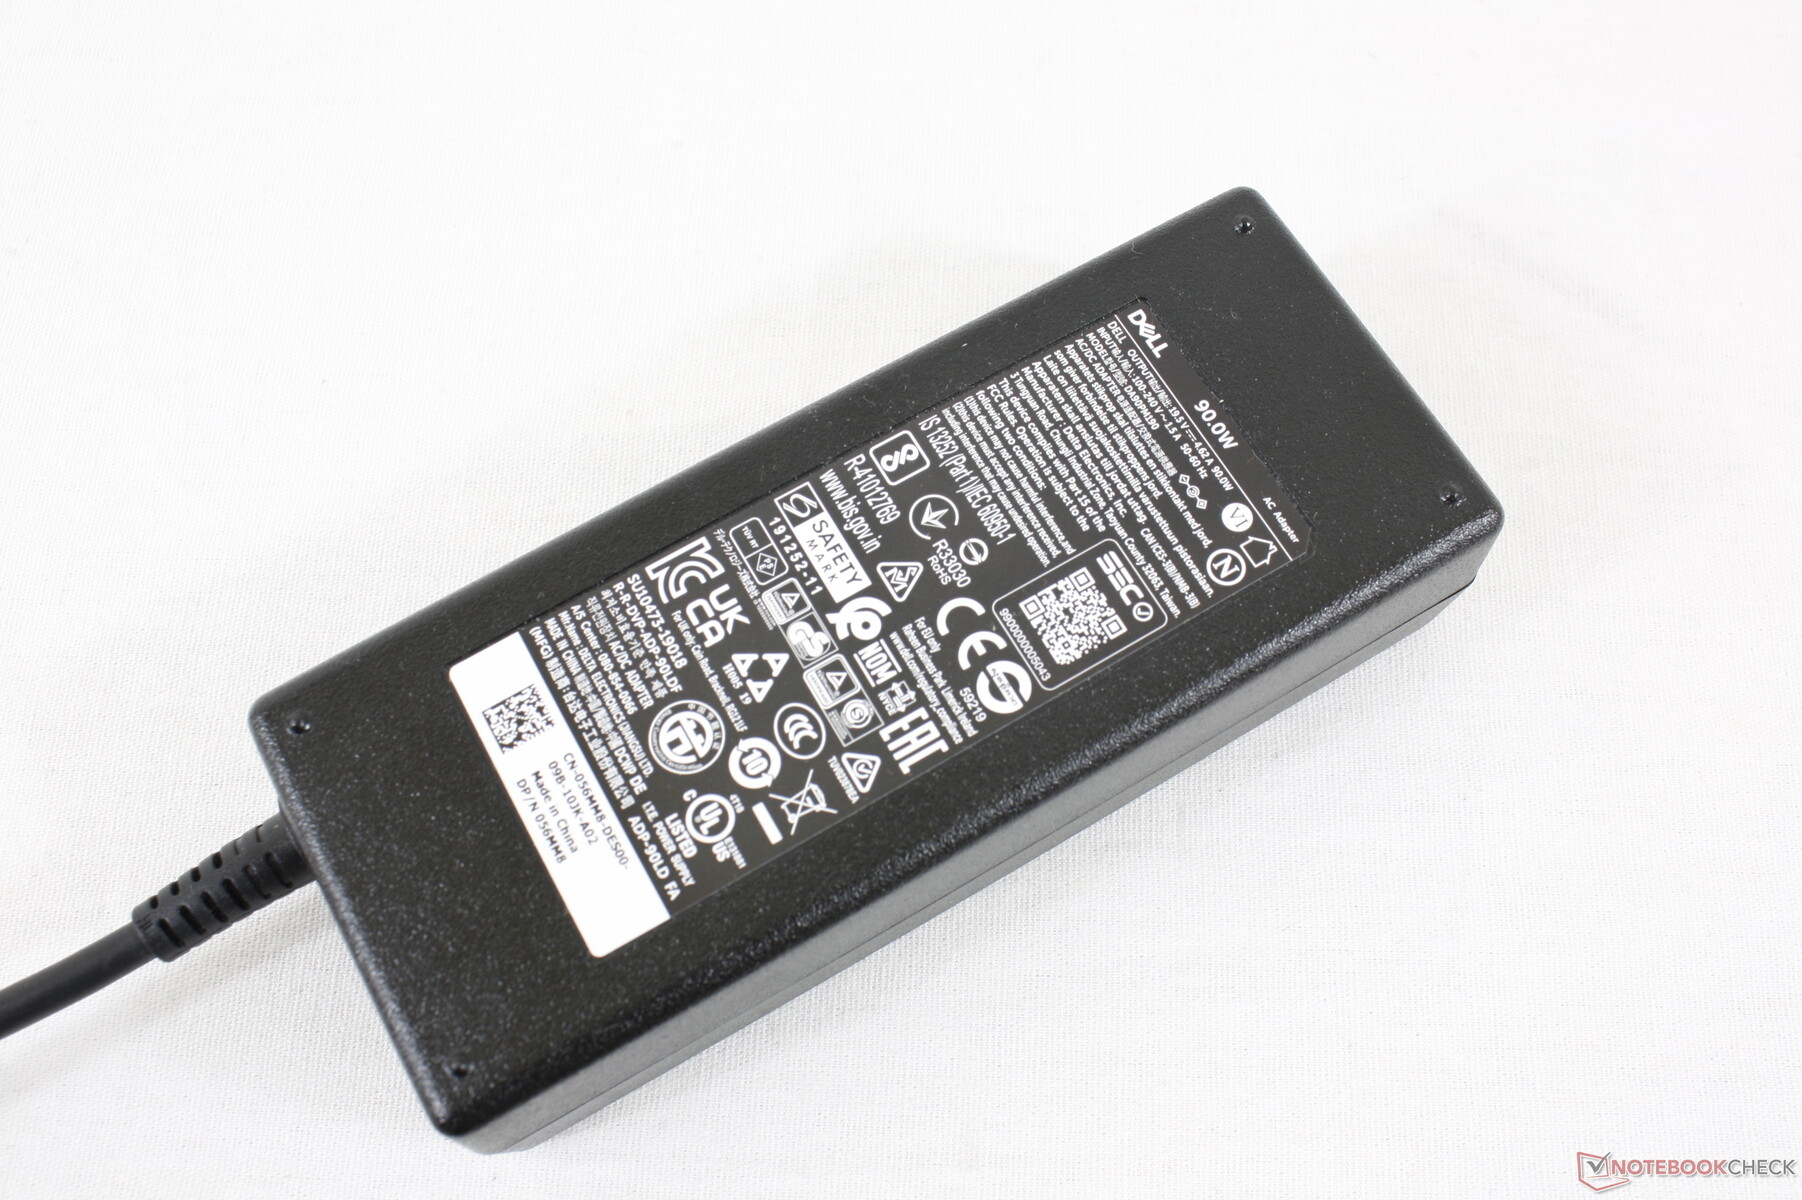
The Black Edition comes with a slightly larger (~12.5 x 5 x 3.2 cm) 90 W AC adapter compared to the 65 W adapter for the Silver Edition. We're able to measure a maximum draw of 92.7 W when running extreme loads, but this rate is only temporary as shown by the graphs below due to thermal limitations. The behavior mirrors our clock rate observations mentioned above in our Stress Test section.

| Kapalı / Bekleme modu | |
| Boşta | |
| Çalışırken |
|
Key:
min: | |
| Dell Inspiron 15 7000 7506 2-in-1 Black Edition i7-1165G7, Xe MAX, Micron 2300 1TB MTFDHBA1T0TDV, IPS, 3840x2160, 15.6" | Samsung Galaxy Book Flex 15-NP950 i7-1065G7, GeForce MX250, Samsung SSD PM981a MZVLB512HBJQ, IPS, QLED, 1920x1080, 15.6" | HP Envy x360 15-ee0257ng R5 4500U, Vega 6, Intel SSD 660p SSDPEKNW512G8, IPS, 1920x1080, 15.6" | Microsoft Surface Book 3 15 i7-1065G7, GeForce GTX 1660 Ti Max-Q, SK hynix BC501 HFM256GDGTNG, IPS, 3240x2160, 15" | Asus ZenBook Flip 15 UX563FD-A1027T i7-10510U, GeForce GTX 1050 Max-Q, Samsung SSD PM981 MZVLB1T0HALR, IPS, 3840x2160, 15.6" | Lenovo Yoga C740-15IML i7-10510U, UHD Graphics 620, Samsung SSD PM981 MZVLB512HAJQ, IPS LED, 1920x1080, 15.6" | Dell Inspiron 15 7506 2-in-1 P97F i5-1135G7, Iris Xe G7 80EUs, Toshiba KBG40ZNS256G NVMe, IPS, 1920x1080, 15.6" | |
|---|---|---|---|---|---|---|---|
| Power Consumption | 16% | 25% | -11% | -1% | 33% | 31% | |
| Idle Minimum * (Watt) | 4 | 4.2 -5% | 3.9 2% | 4.2 -5% | 2.3 43% | 2.97 26% | 3.9 2% |
| Idle Average * (Watt) | 15.5 | 8.7 44% | 7 55% | 7.4 52% | 10.3 34% | 7.2 54% | 6.9 55% |
| Idle Maximum * (Watt) | 16.2 | 11.3 30% | 10.5 35% | 9 44% | 11 32% | 9.9 39% | 8.5 48% |
| Load Average * (Watt) | 49.7 | 58 -17% | 48 3% | 78 -57% | 77 -55% | 40.8 18% | 30.5 39% |
| Witcher 3 ultra * (Watt) | 52.2 | 44.6 15% | 94.2 -80% | 68 -30% | 42.6 18% | ||
| Load Maximum * (Watt) | 92.7 | 67 28% | 65 30% | 108 -17% | 118 -27% | 64.7 30% | 69.7 25% |
* ... daha küçük daha iyidir
Battery Life
Battery capacity is almost 30 percent larger than on the regular Inspiron 15 7506 2-in-1. When subjected to the same WLAN conditions, our Black Edition unit would last about an hour longer at almost 10 hours.
Charging from empty to full capacity takes just under 2 hours. The system can also recharge via USB-C.
| Dell Inspiron 15 7000 7506 2-in-1 Black Edition i7-1165G7, Xe MAX, 68 Wh | Samsung Galaxy Book Flex 15-NP950 i7-1065G7, GeForce MX250, 69.7 Wh | HP Envy x360 15-ee0257ng R5 4500U, Vega 6, 51 Wh | Microsoft Surface Book 3 15 i7-1065G7, GeForce GTX 1660 Ti Max-Q, 82 Wh | Asus ZenBook Flip 15 UX563FD-A1027T i7-10510U, GeForce GTX 1050 Max-Q, 71 Wh | Lenovo Yoga C740-15IML i7-10510U, UHD Graphics 620, 60.3 Wh | Dell Inspiron 15 7506 2-in-1 P97F i5-1135G7, Iris Xe G7 80EUs, 53 Wh | |
|---|---|---|---|---|---|---|---|
| Pil Çalışma Süresi | 21% | -3% | 14% | 10% | 16% | -19% | |
| Reader / Idle (h) | 25 | 16.2 -35% | 19.5 -22% | 18.8 -25% | |||
| WiFi v1.3 (h) | 9.7 | 11.7 21% | 9.4 -3% | 8.5 -12% | 9.4 -3% | 10.4 7% | 8.3 -14% |
| Load (h) | 1.6 | 3 88% | 2.5 56% | 2 25% | 1.3 -19% |
Artılar
Eksiler
Verdict
The Inspiron 7506 2-in-1 Black Edition currently starts at $1500 USD compared to $700 or $800 for the Silver Edition. When even the Core i5 CPU in the Silver Edition can outperform our Core i7 Black Edition, however, the performance-per-dollar for this particular configuration just isn't the best to say the least. At that price point, Dell's own XPS 15 is arguably a more solid buy especially for graphics editors or content creators who can make use of the extra horsepower and better colors.
The Inspiron Black Edition targets a very niche audience who wants both a touchscreen convertible and the discrete Iris Xe Max GPU. Users who don't fall in that category might be better off spending their 1.5K on the Dell XPS 15 instead.
Users considering the Black Edition will likely want it mostly for the Iris Xe Max GPU. If so, keep in mind that its usage scenarios are much narrower when compared to the GeForce series. If you do even a bit of gaming, then the GeForce MX series is still recommended for its superior drivers, stability and compatibility. If you do a ton of encoding or Adobe Lightroom work, then the specialized Xe Max would be the better bet. Until prices start coming down, however, the Inspiron Black Edition is going to be a hard sell when compared to its Silver Edition counterpart or the XPS 15 series.
Price and availability
The Dell Inspiron 7506 2-in-1 Black Edition is now shipping at Best Buy for $1400 USD with similar specifications as our reviewed unit.
Amazon has a configuration as well, but the reseller is pricing it at almost $2000 USD.
Dell Inspiron 15 7000 7506 2-in-1 Black Edition
- 01/04/2021 v7 (old)
Allen Ngo
Price comparison

