Lenovo IdeaPad S740-15IRH Laptop: Bugüne kadar ki en iyi ama en pahalı IdeaPad
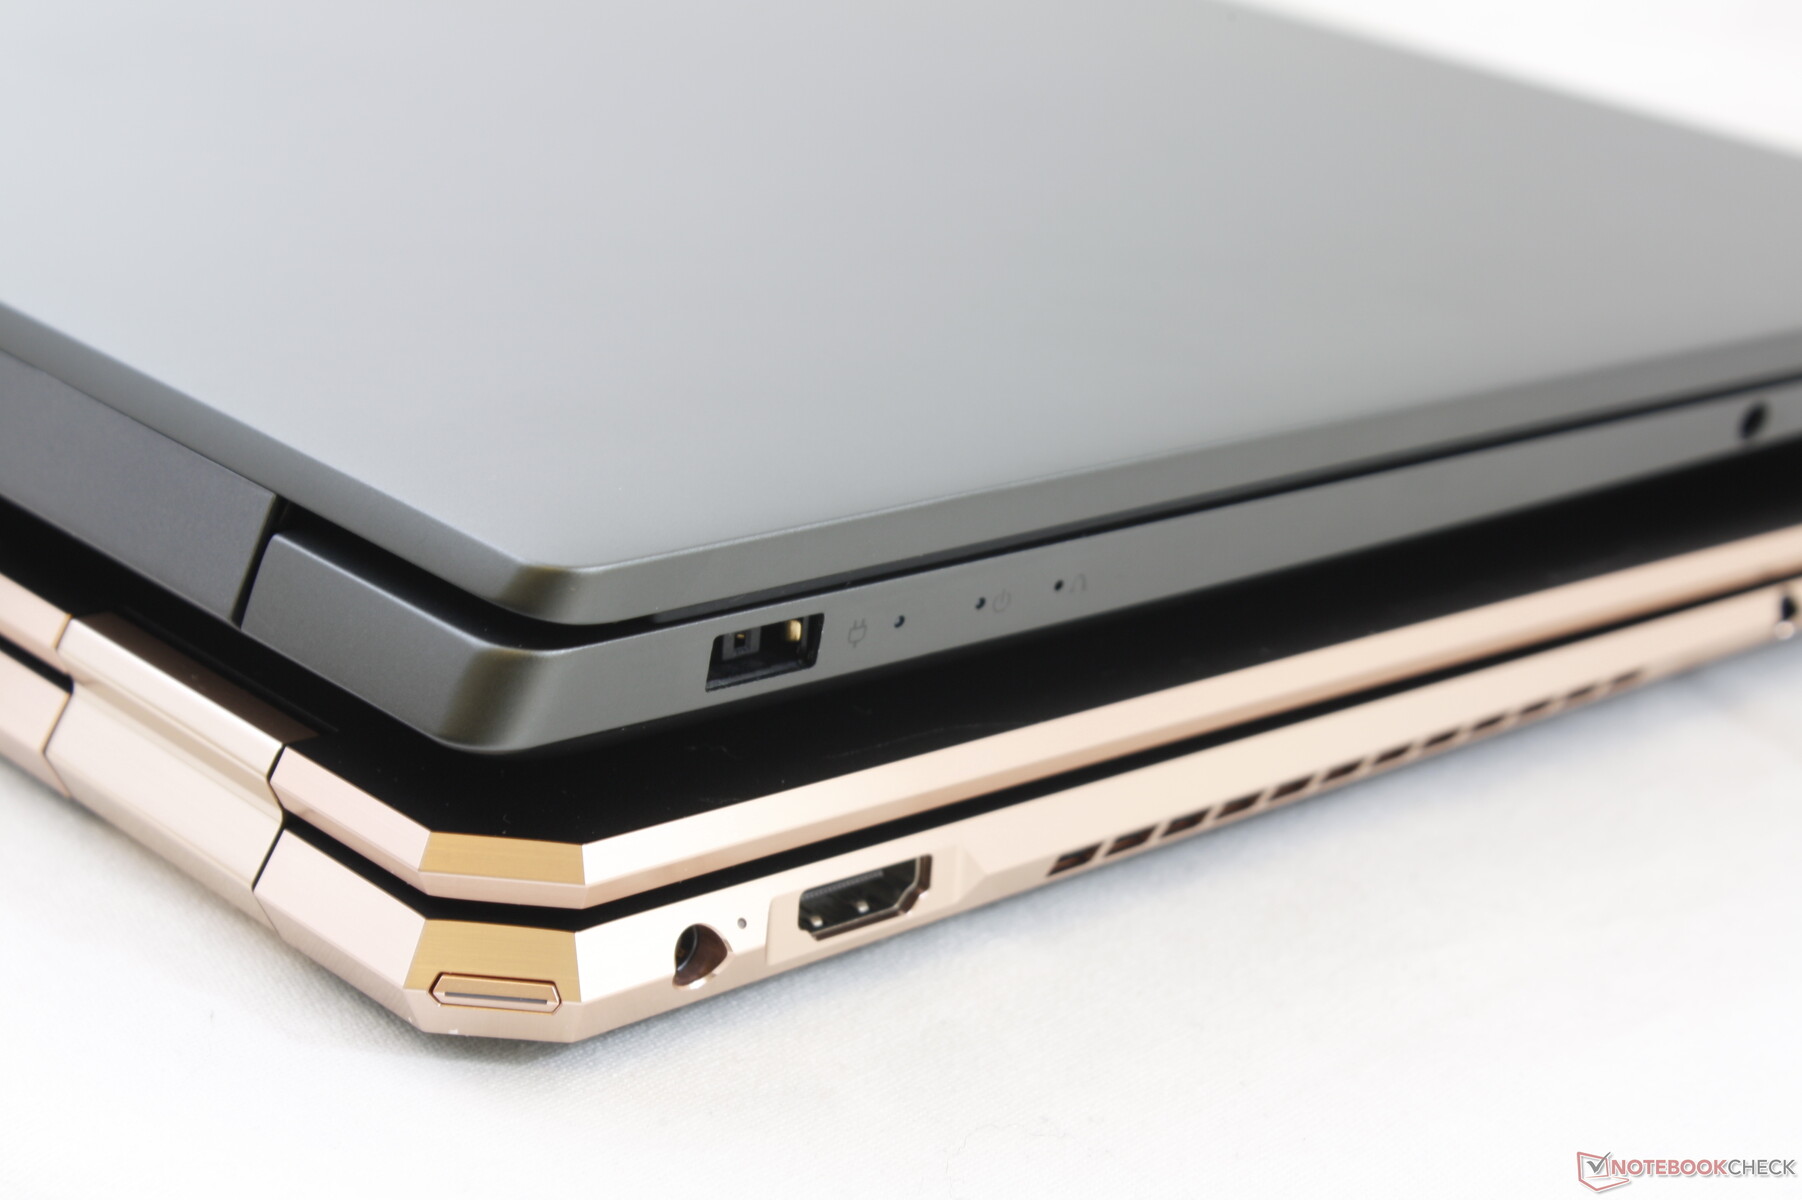
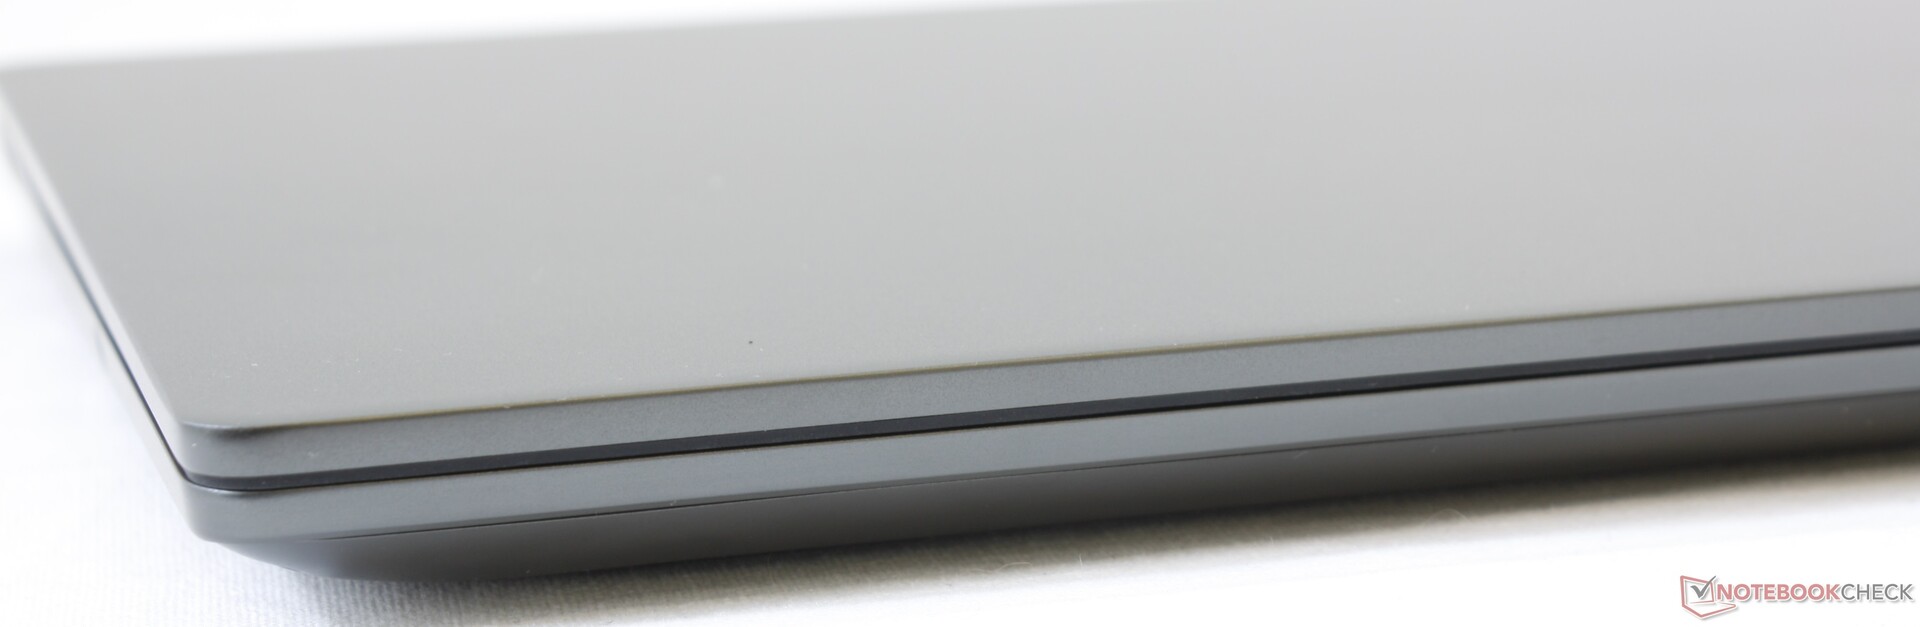
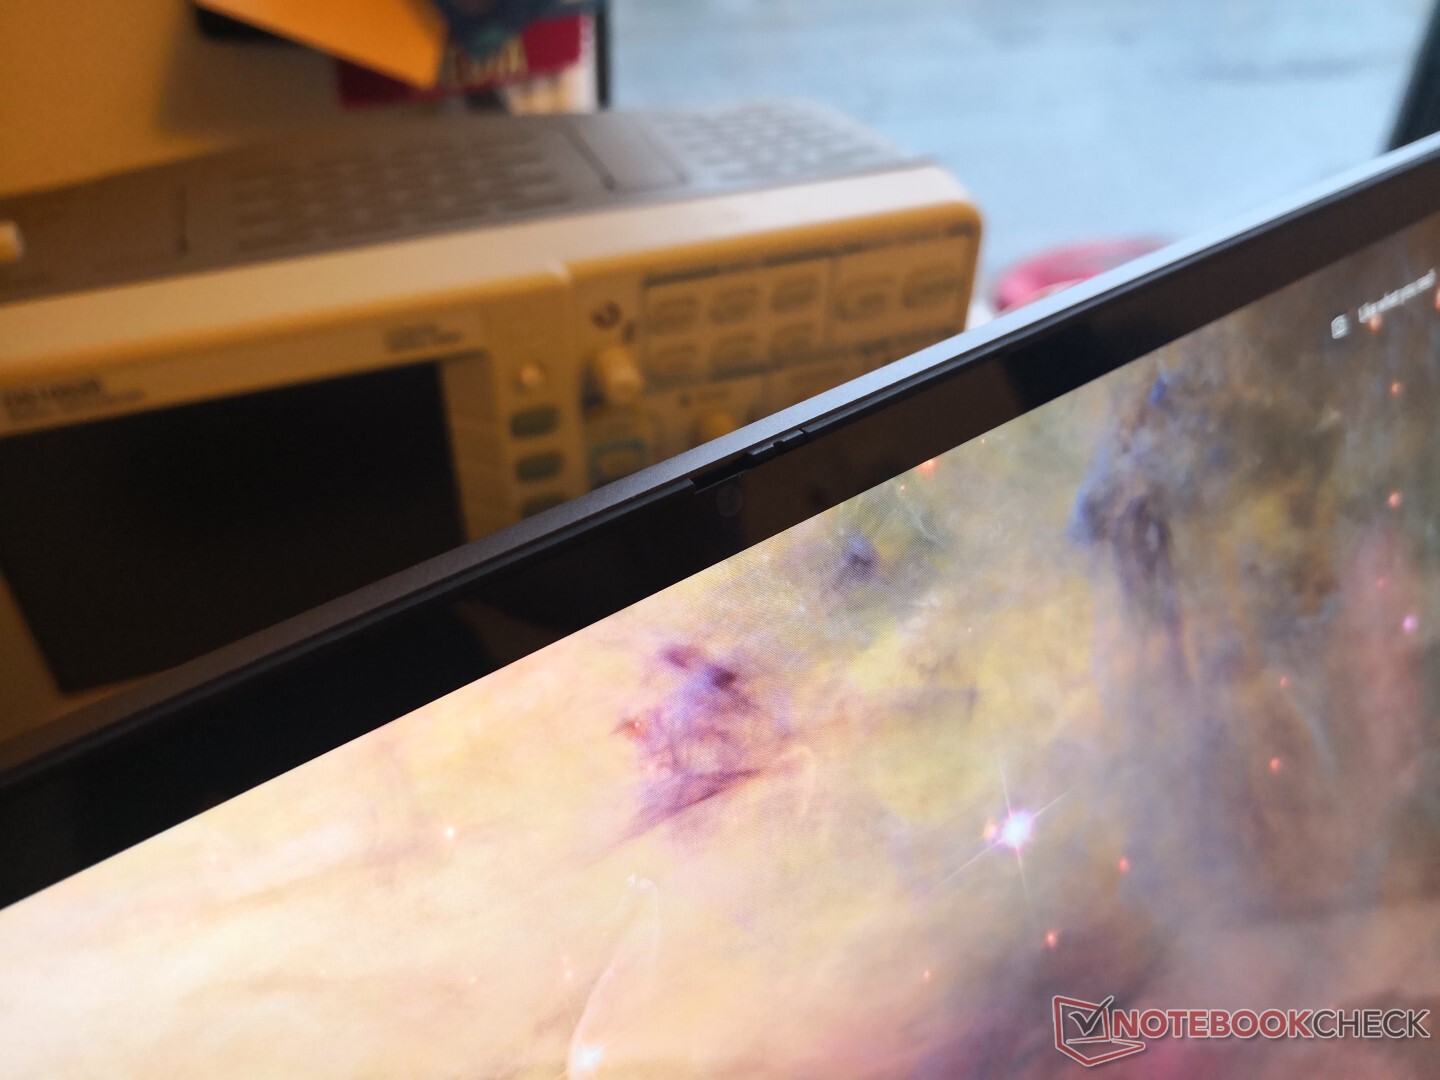
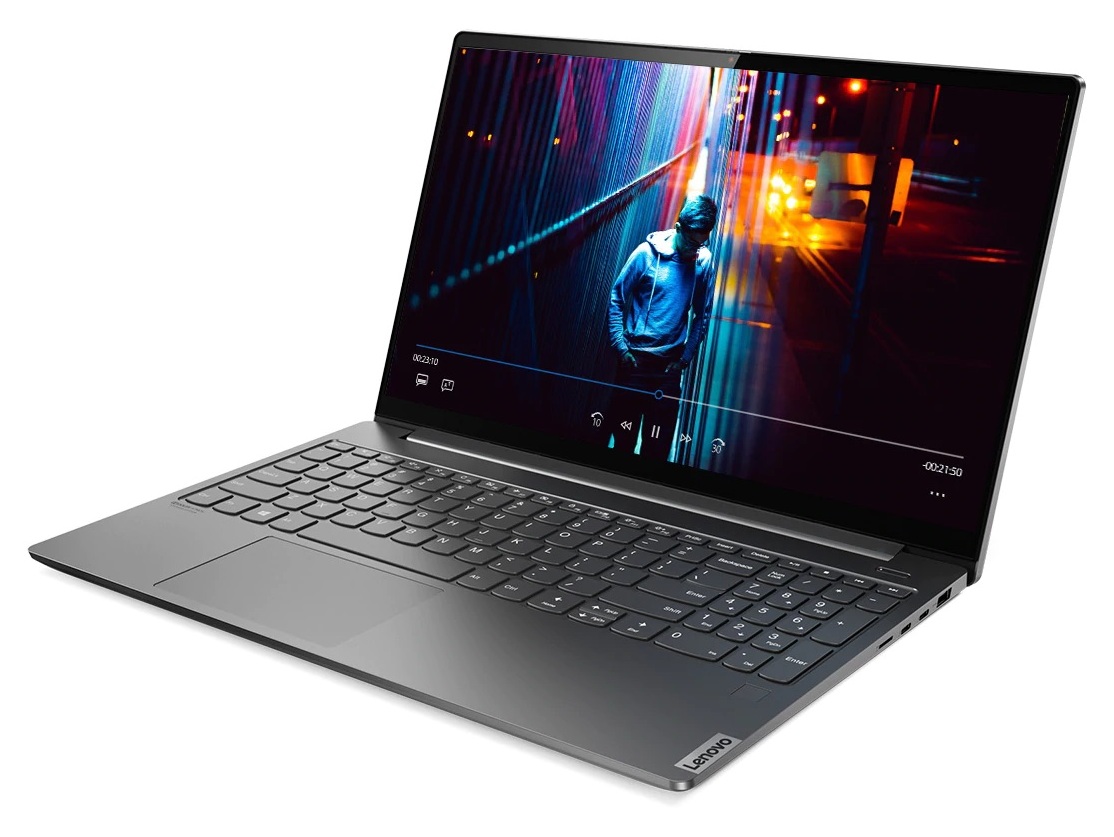
 vs. 2019 HP Spectre x360 15 (bottom). Note the significant difference in length")
Geleneksel olarak, IdeaPad serisi, Lenovo'nun üst düzey Yoga serisinin aksine daha sıkı bütçelerdeki kullanıcılar için tasarlanmış daha uygun fiyatlı PC'lere ev sahipliği yapmıştır. Örneğin IdeaPad 330S-15 ve IdeaPad S540-15, her biri 1000 doların altında bir fiyata satılıyor. Bugün burada sahip olduğumuz IdeaPad S740-15, çoğu üst düzey multimedya dizüstü bilgisayarlara benzer bir performans seviyesi için hem güçlü bir Core i7 H serisi CPU hem de GeForce GTX grafik sunarak tüm bunları pencereden dışarı atıyor. Lenovo'nun IdeaPad S740-15'e daha üst seviye bir alternatif olan Yoga C940 15 bile aynı CPU ve GPU ile birlikte geliyor. sadece 256 GB - 512 GB SSD depolama alanı. Daha küçük 2018 IdeaPad 730S 13'ü başardı. Sistem, Asus ZenBook Pro 15, HP Spectre x360 15, Dell XPS 15, MSI Prestige 15 ve Lenovo'nun kendi Yoga C740 15 gibi diğer yüksek performanslı 15,6 inç multimedya veya ofis dizüstü bilgisayarlarıyla rekabet ediyor .Daha fazla Lenovo yorum: Lenovo Yoga C740 15Lenovo Yoga C940 15Lenovo ThinkPad X1 CarbonLenovo ThinkPad P53Lenovo IdeaPad C340 15
Derecelendirme | Tarih | Modeli | Ağırlık | Yükseklik | Boyut | Çözünürlük | Fiyat |
|---|---|---|---|---|---|---|---|
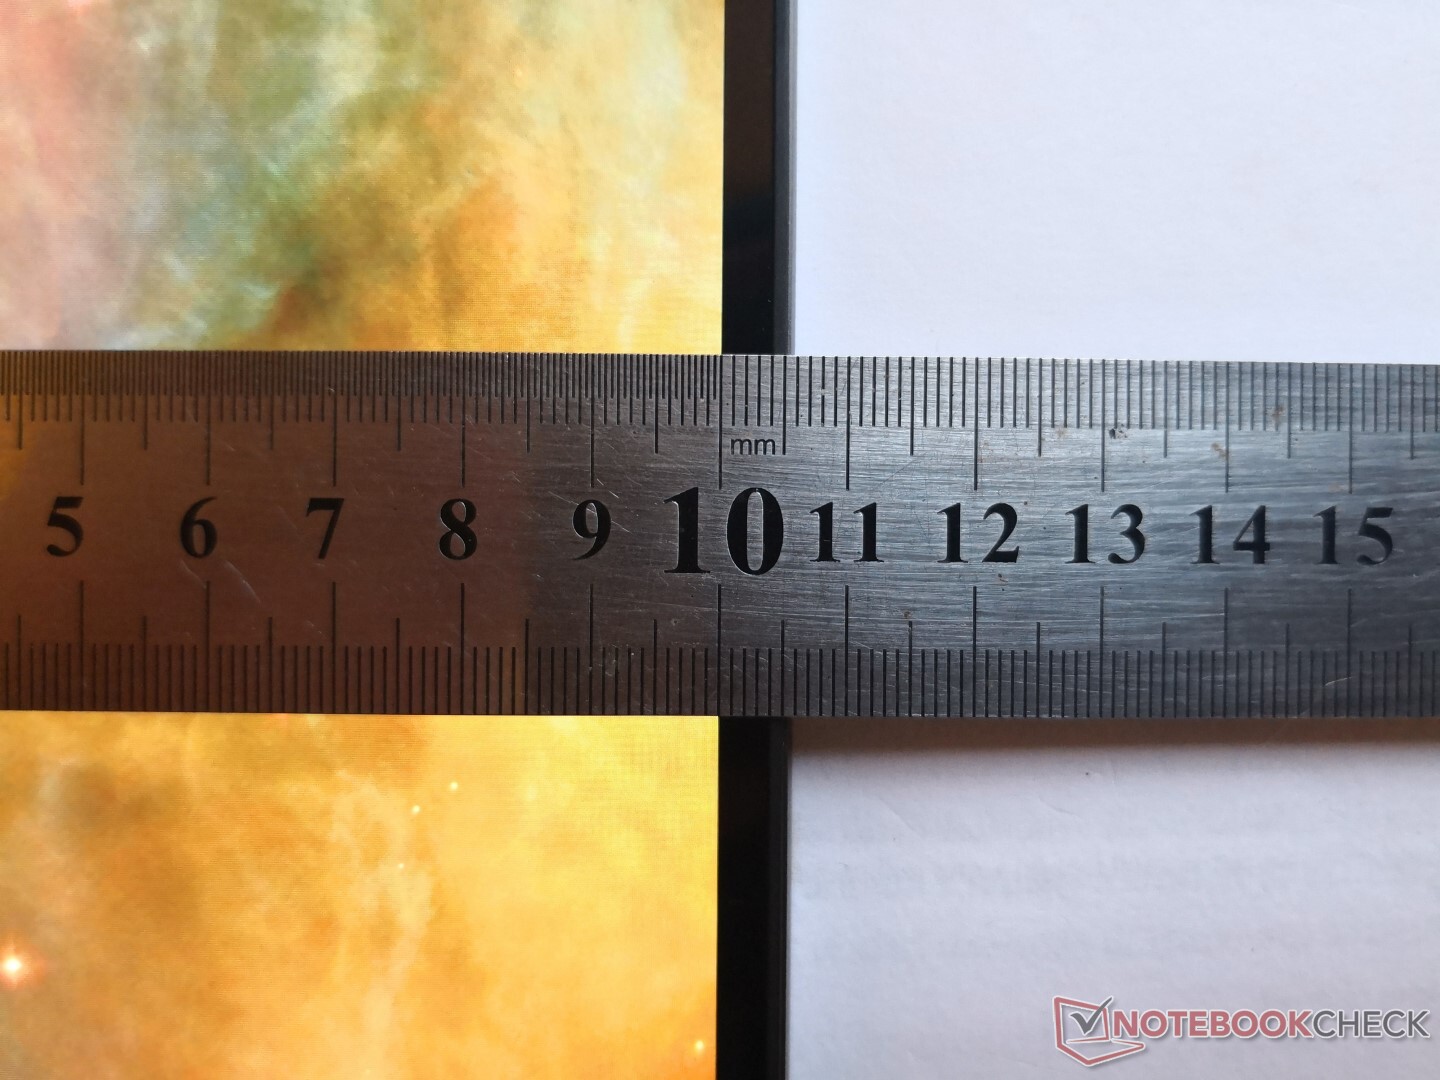
| 85.5 % v7 (old) | 02/2020 | Lenovo IdeaPad S740-15IRH i7-9750H, GeForce GTX 1650 Max-Q | 1.9 kg | 19.95 mm | 15.60" | 3840x2160 | |
| 87.8 % v7 (old) | 08/2019 | Dell XPS 15 7590 9980HK GTX 1650 i9-9980HK, GeForce GTX 1650 Mobile | 2 kg | 17 mm | 15.60" | 3840x2160 | |
| 85 % v7 (old) | HP Spectre X360 15-5ZV31AV i7-10510U, GeForce MX250 | 2.1 kg | 19.3 mm | 15.60" | 3840x2160 | ||
| 82.7 % v6 (old) | 08/2018 | Lenovo Yoga 730-15IKB i5-8550U, GeForce GTX 1050 Mobile | 1.9 kg | 17.2 mm | 15.60" | 3840x2160 | |
| 83.1 % v7 (old) | 10/2019 | Asus ZenBook 15 UX534FT-DB77 i7-8565U, GeForce GTX 1650 Max-Q | 1.7 kg | 18.9 mm | 15.60" | 1920x1080 |
Durum
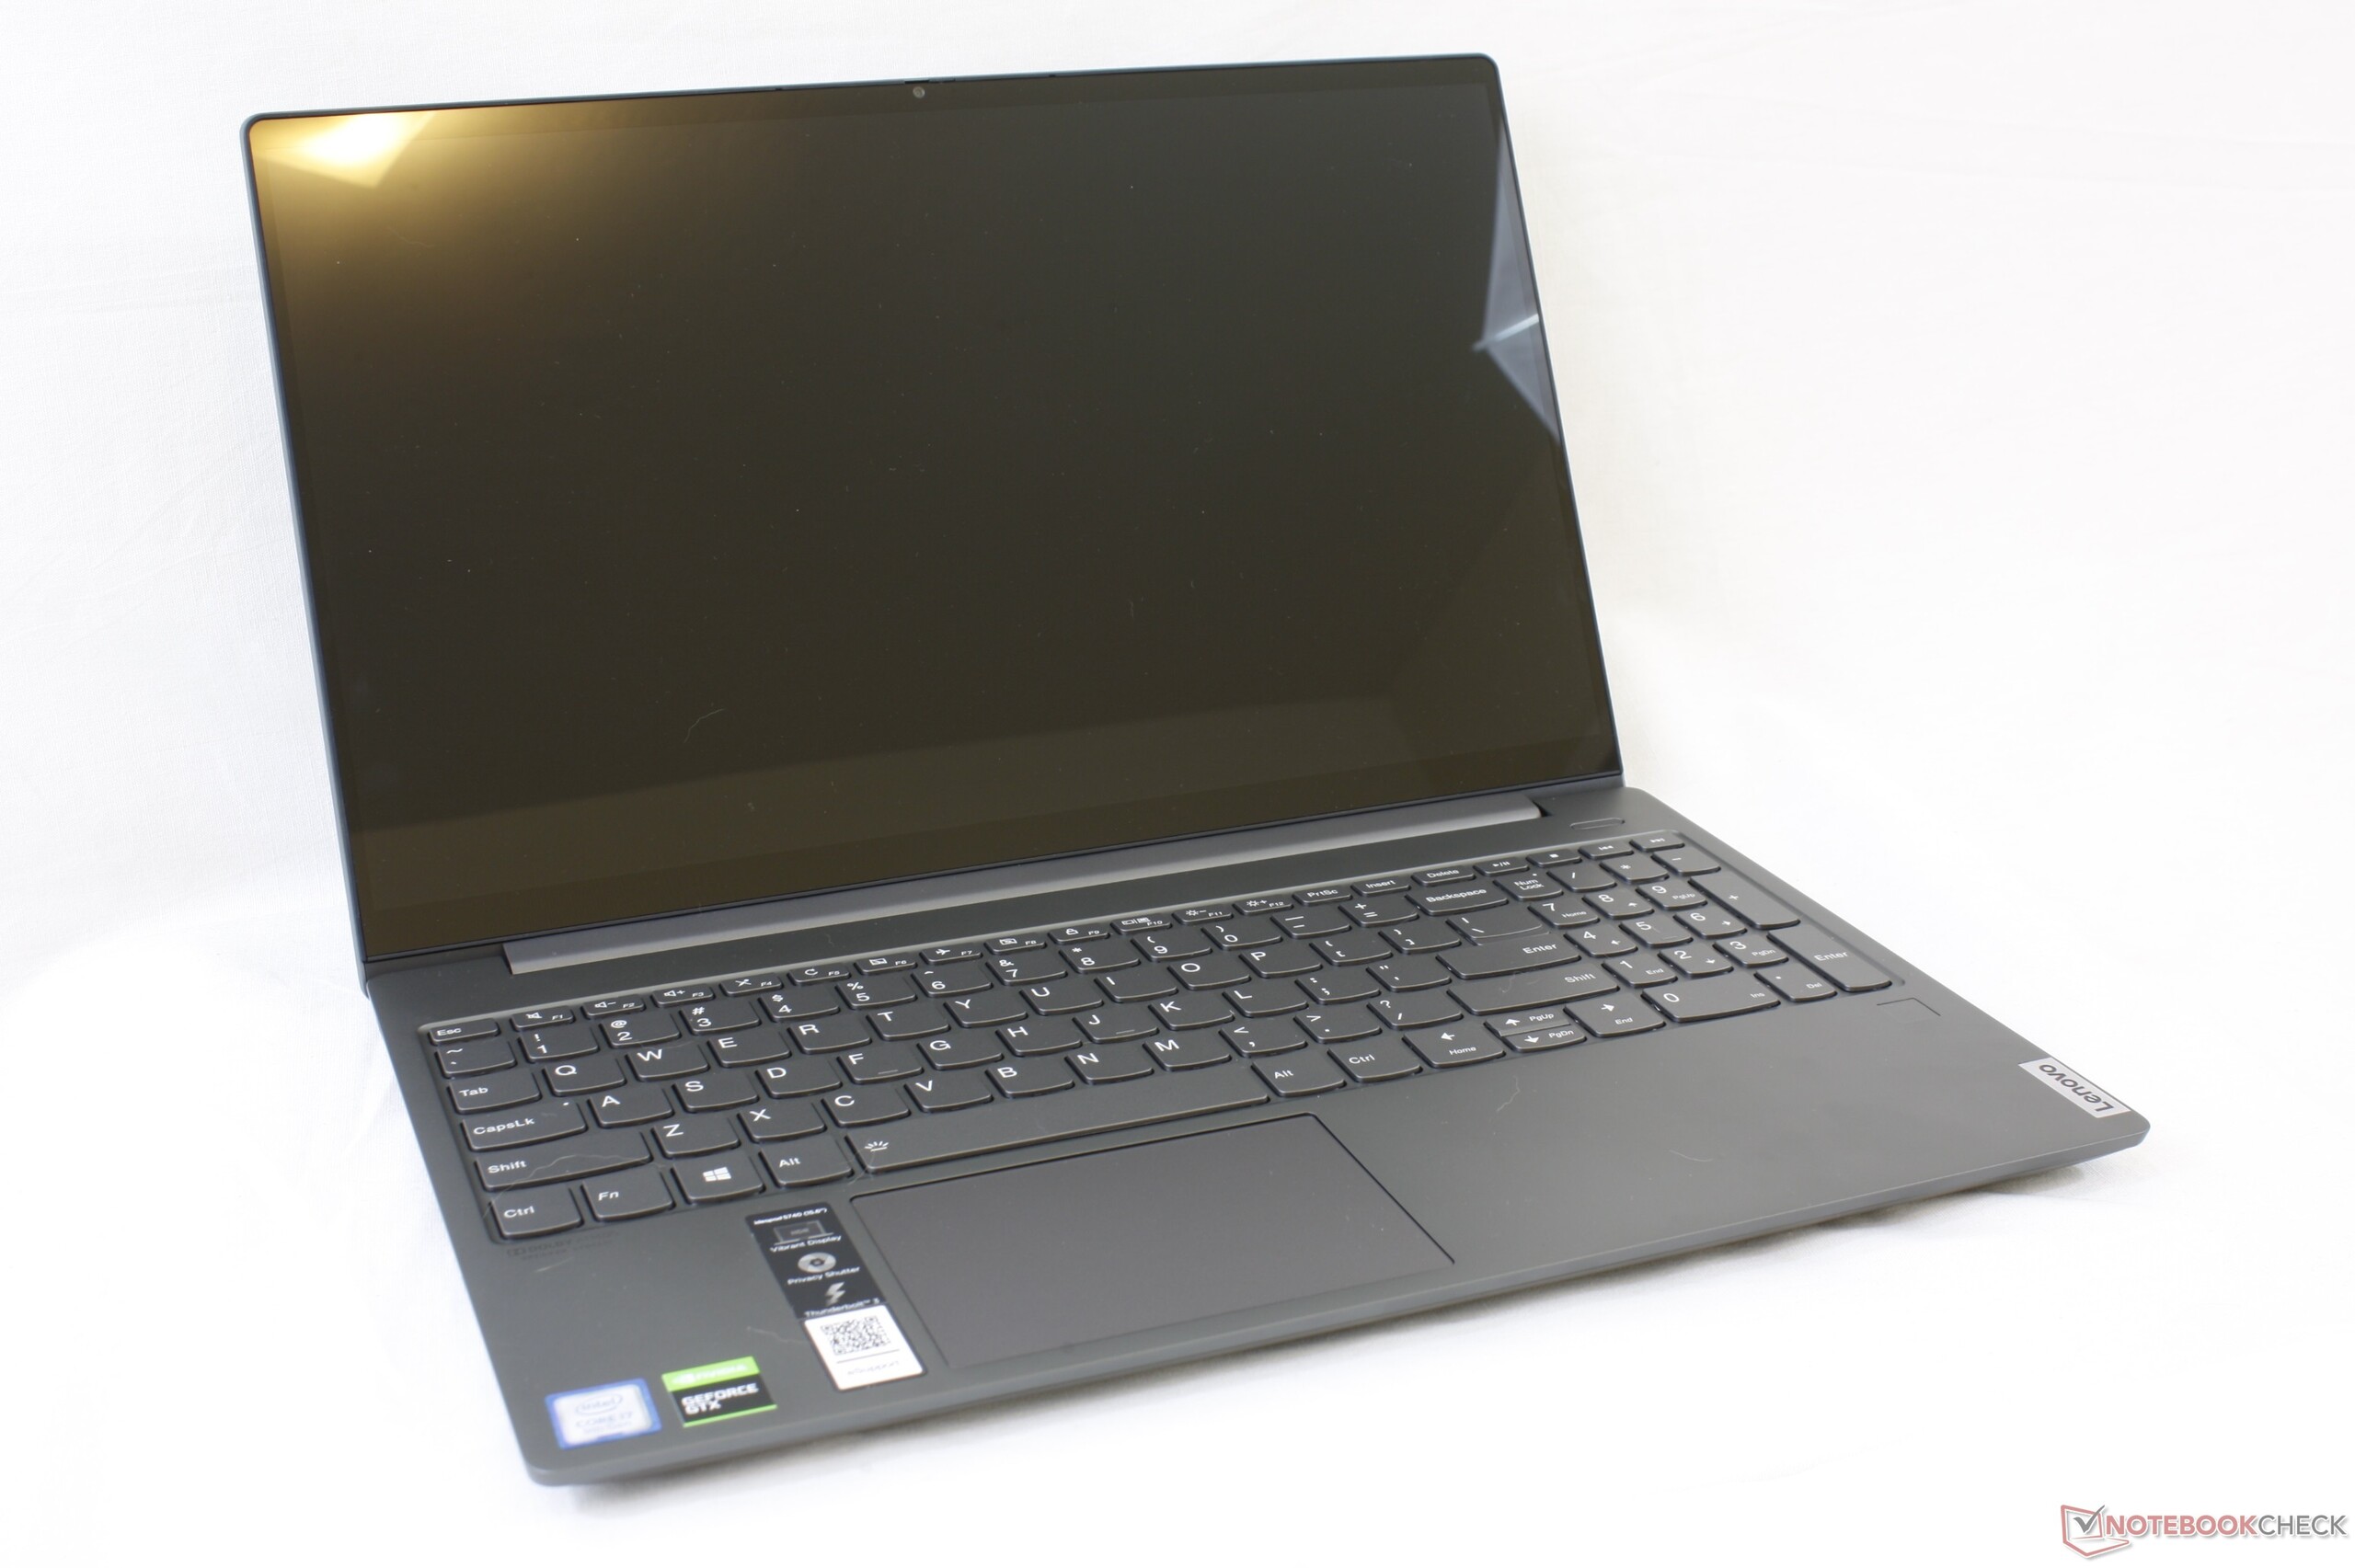
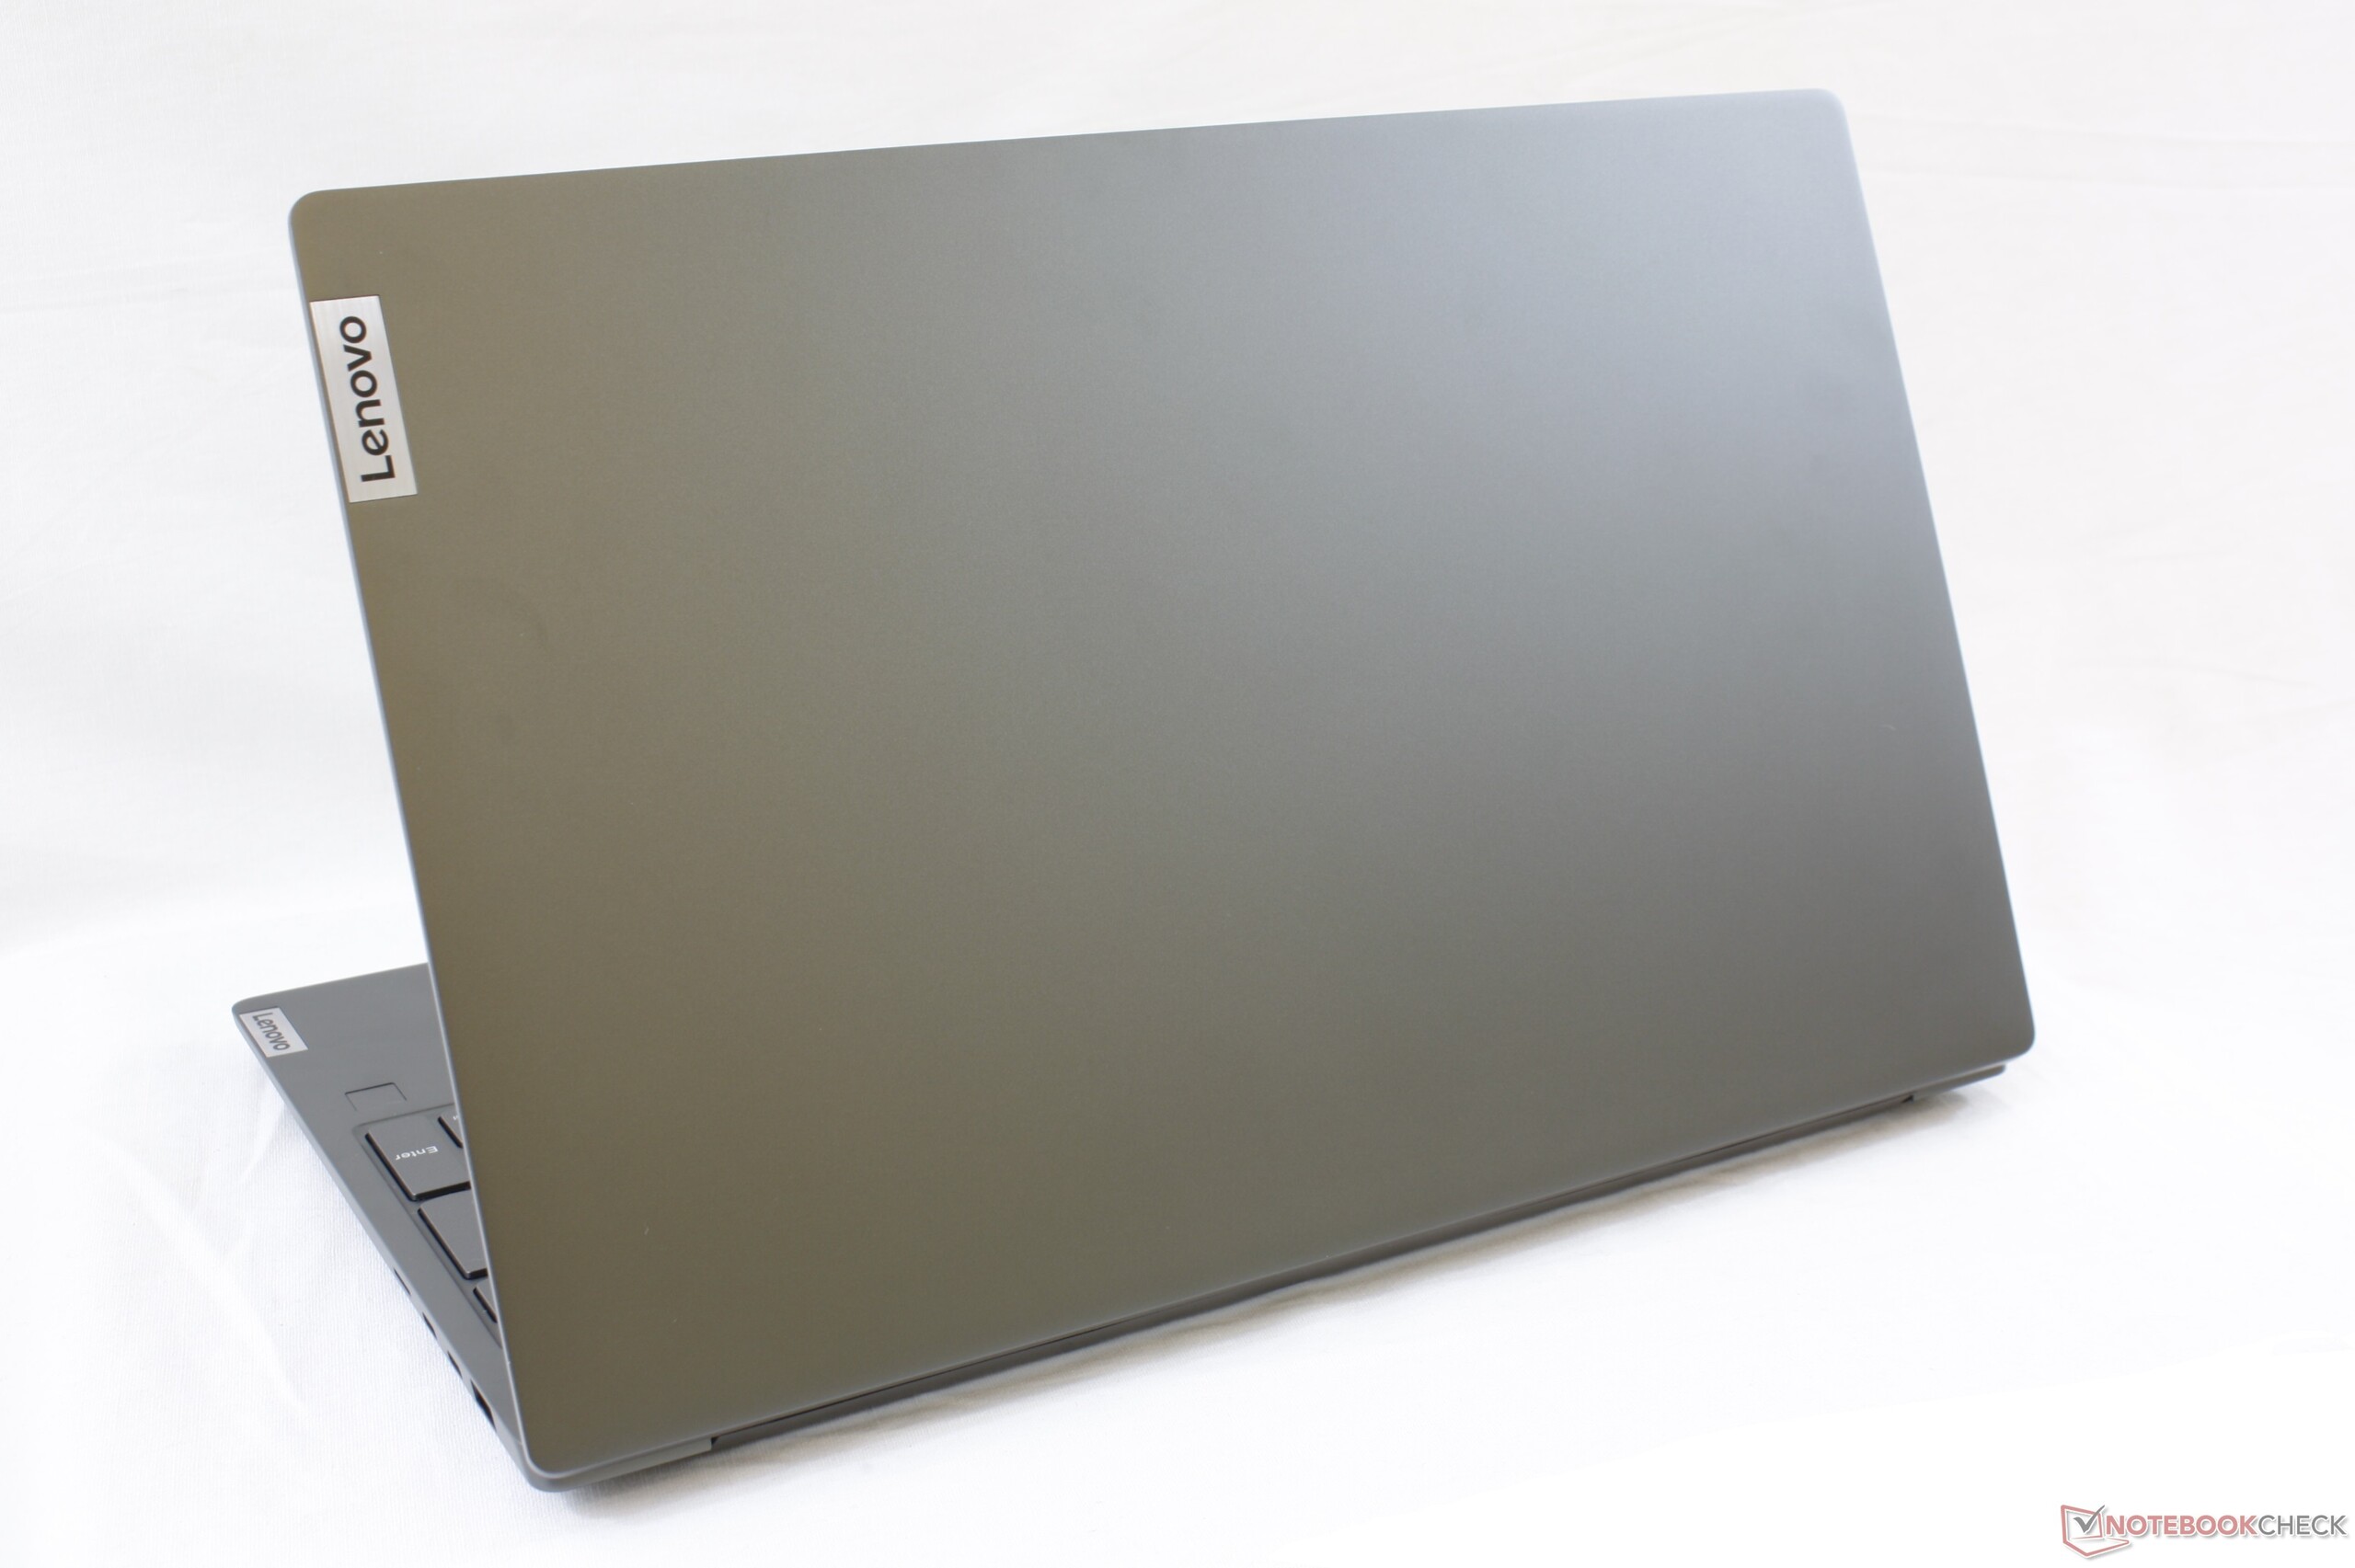
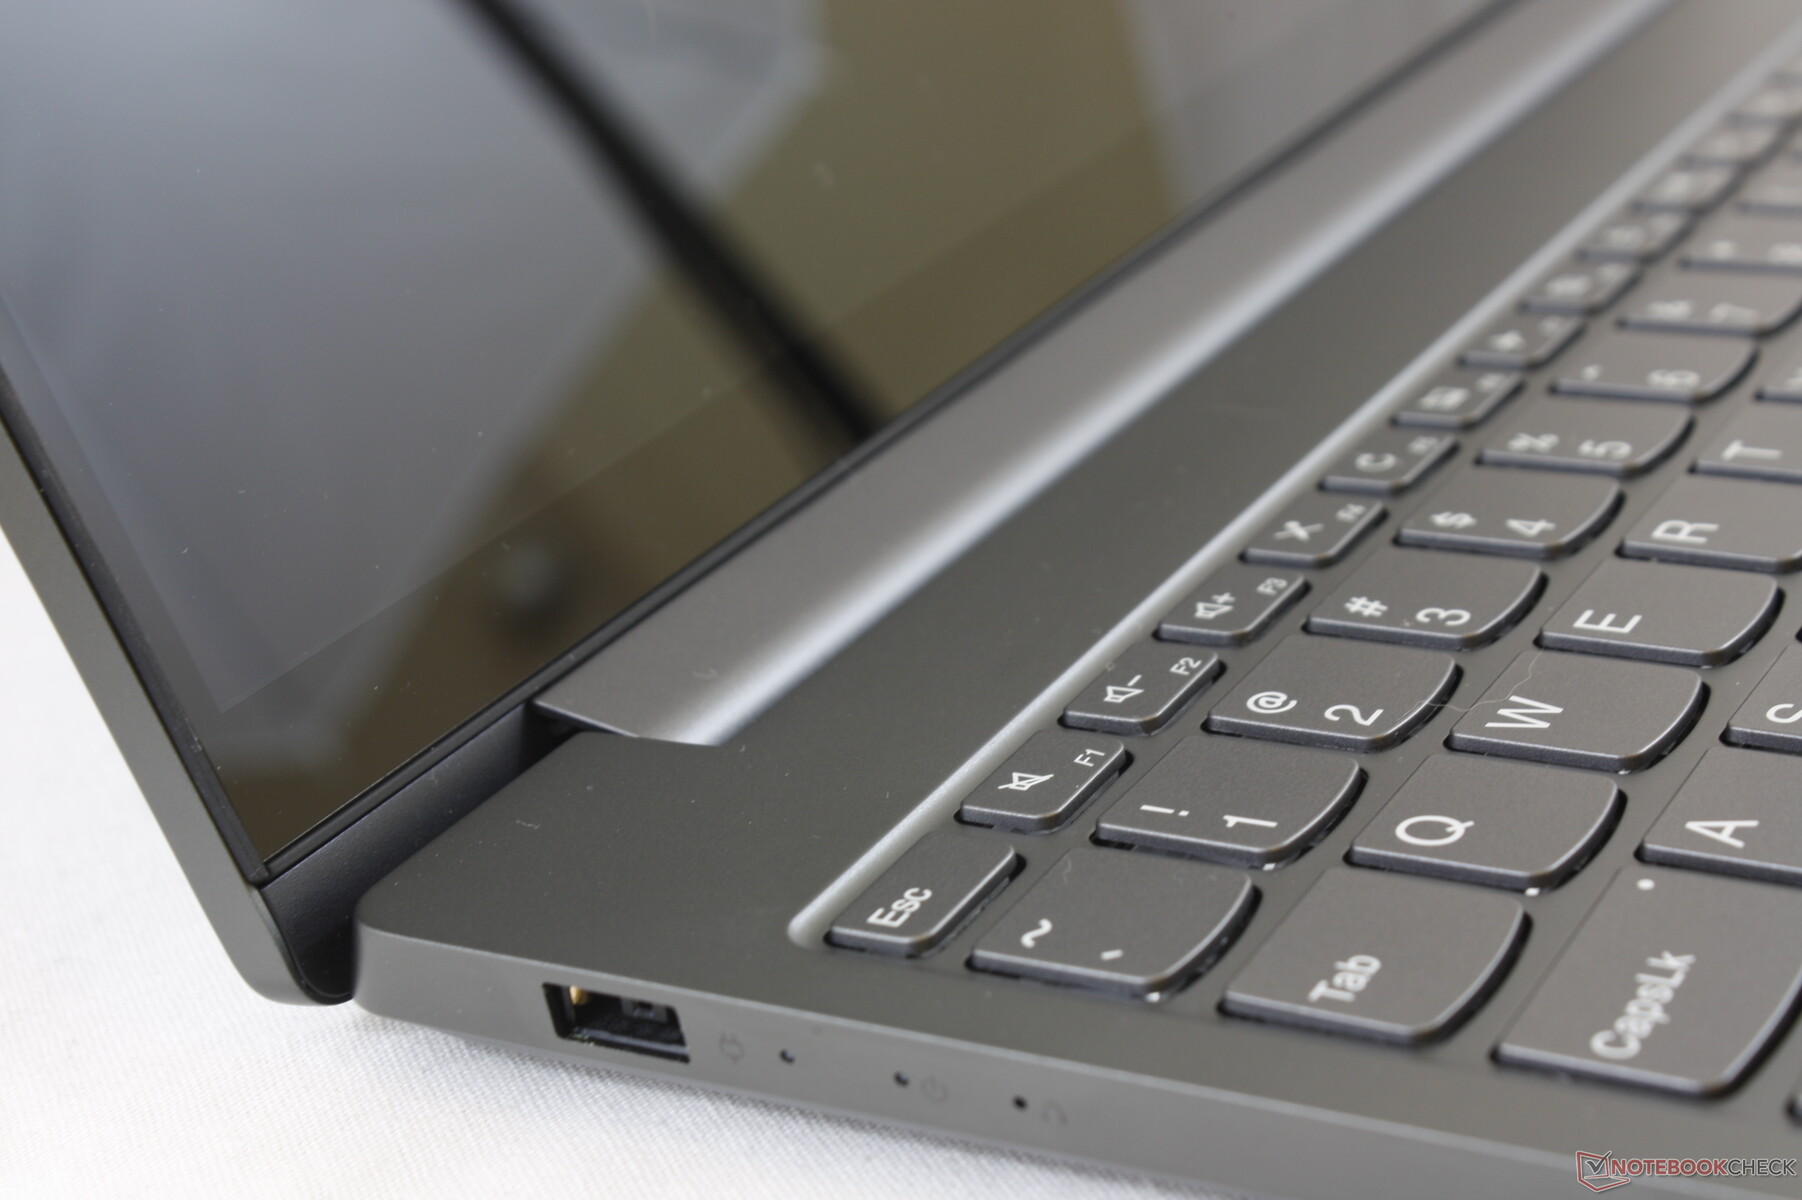
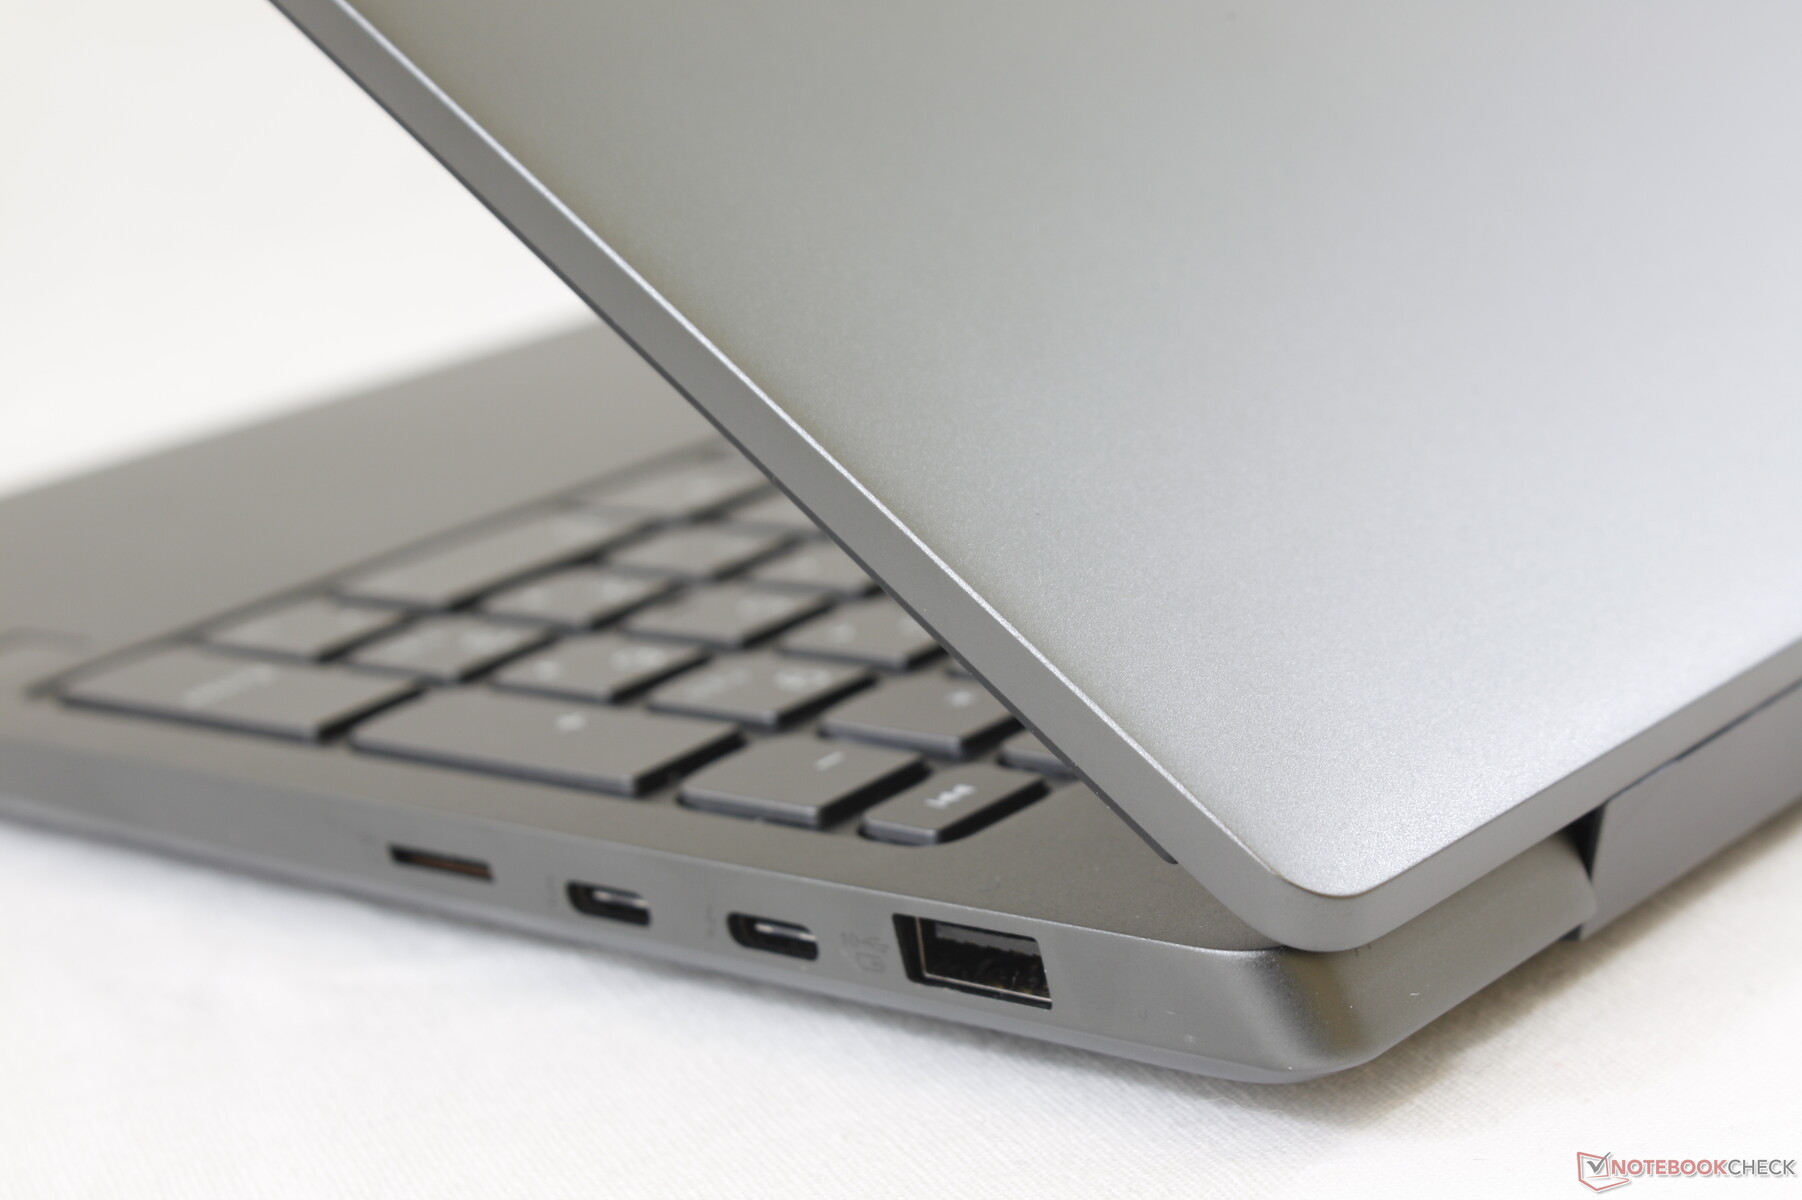
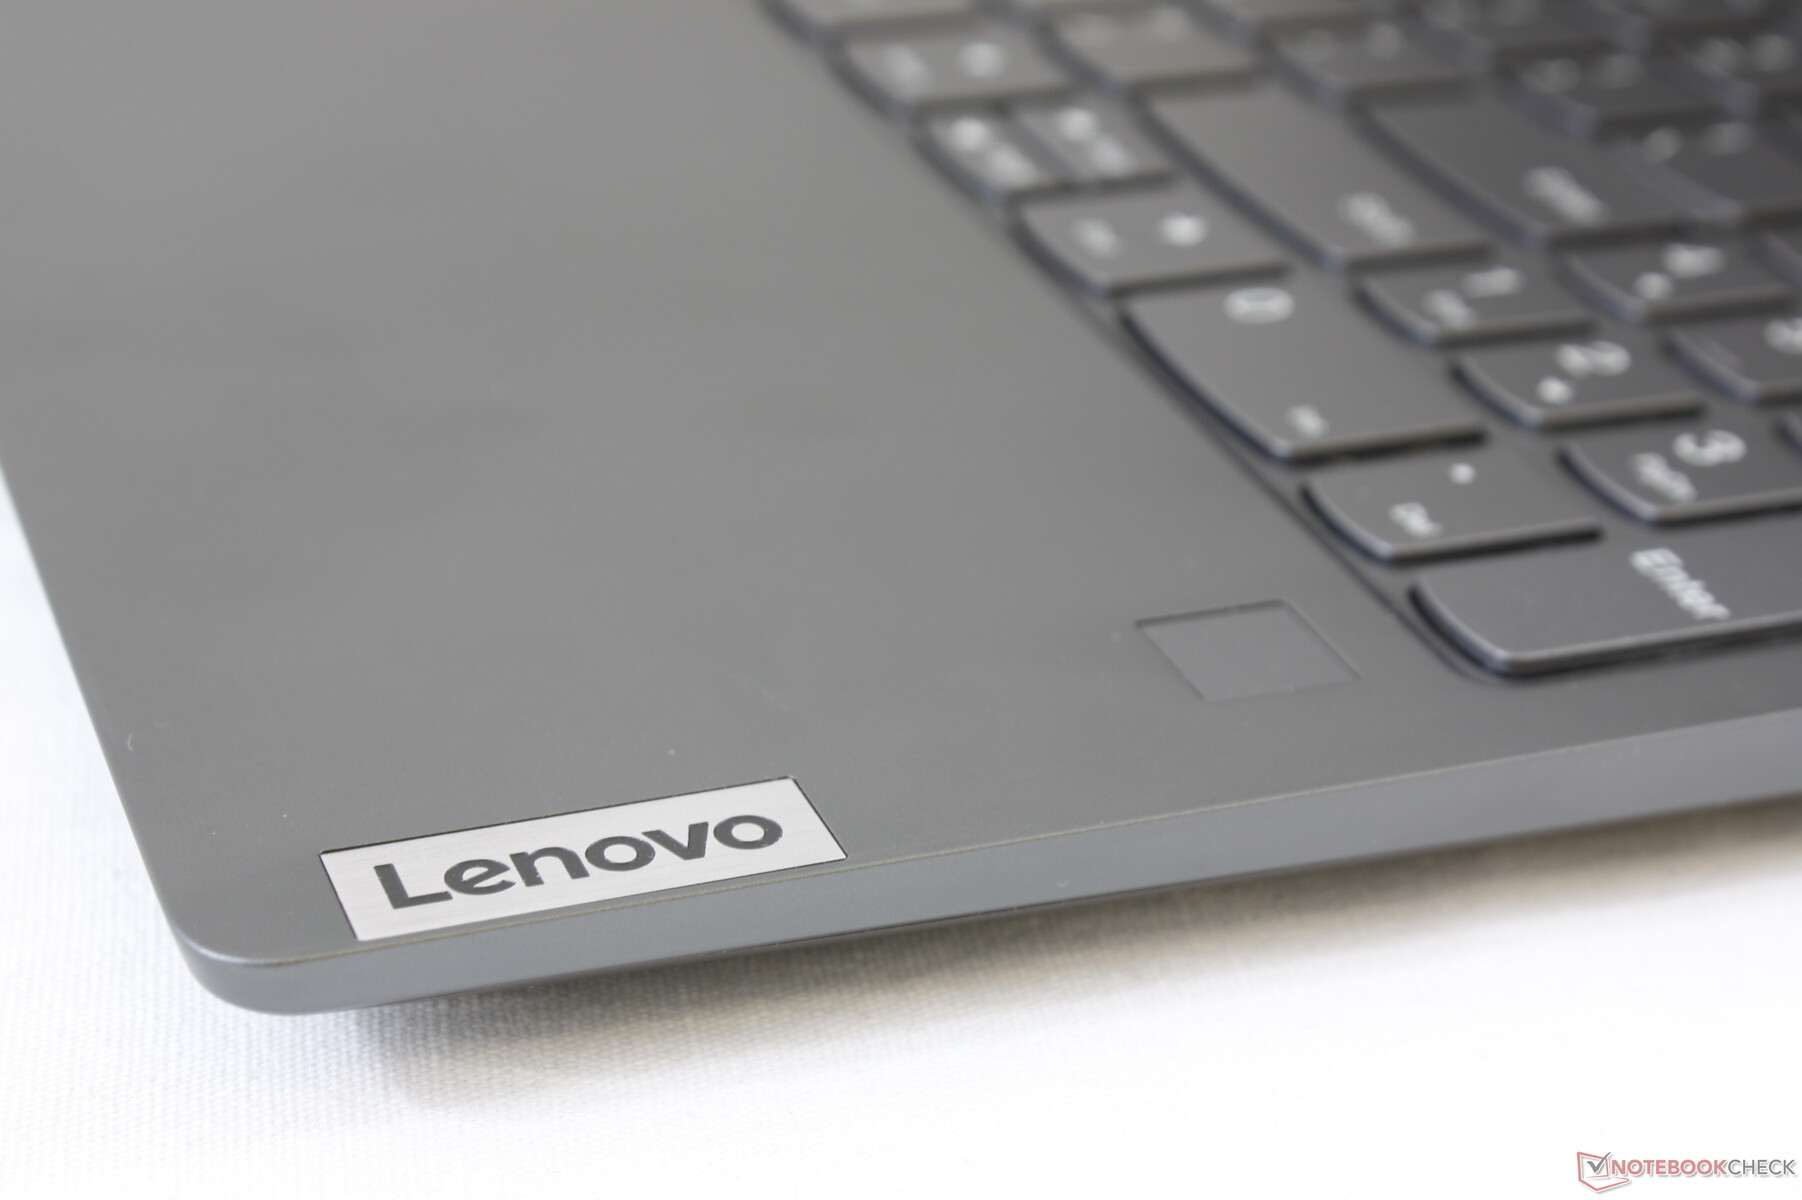
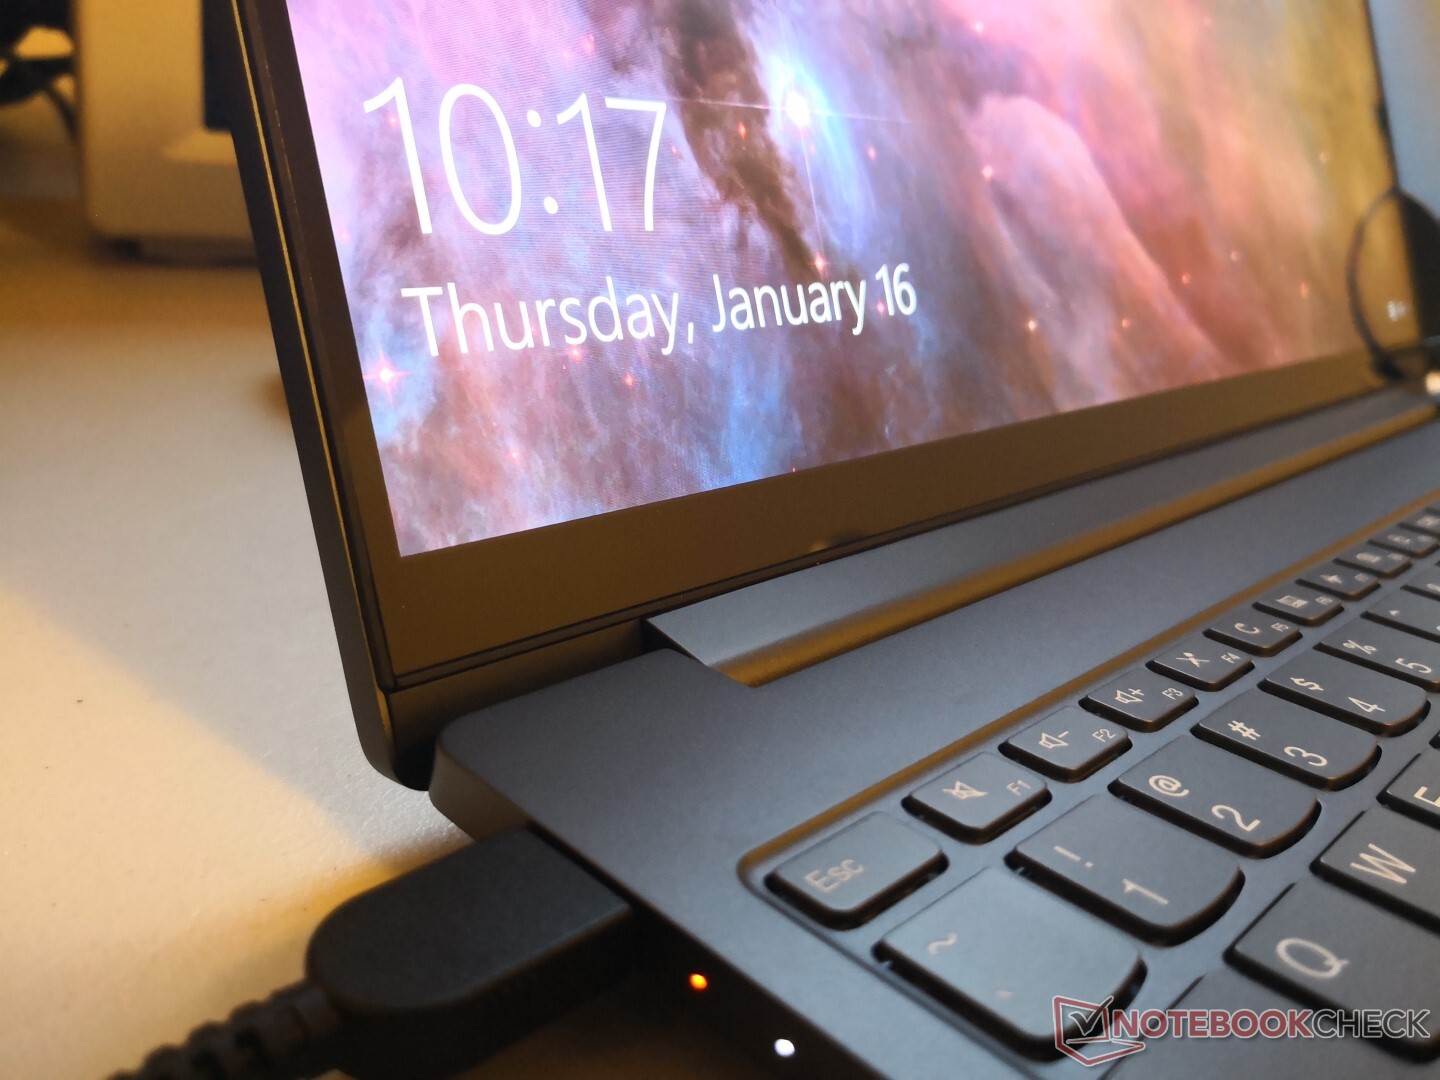
IdeaPad S740'taki "S" öneki, Lenovo'nun kapak tasarımları için ayırdığı "İnce" anlamına gelir. Adından da anlaşılacağı gibi, sistem başka bir IdeaPad modelinden ziyade son ThinkBook serileriyle daha çok ortak olan şık, pürüzsüz ve profesyonel bir görünüme sahiptir. Görsel olarak, şasi, Dell XPS 15 veya HP Spectre x360 15 gibi ağır vuruşlara karşı olumlu bir şekilde karşılaştırılır. IdeaPad ürünümüzün yüzeyleri XPS veya Spectre kadar güçlü değil, nispeten daha ince hissediyor. Taban ve kapağı bükmeye çalışırken gıcırtı daha belirgindir. Ancak bir IdeaPad için kesinlikle daha şık ve beklenenden daha yüksek kalitede. Keskin gözlü kullanıcılar, Lenovo'nun hem IdeaPad S740 hem de son Legion Y740 serisi için çok benzer şasi malzemeleri kullandığını fark edecekler. Daha lüks bir deneyim arayan kullanıcılar bunun yerine Yoga C940 15'i düşünmelidir.
Şasi boyutu ve ağırlığı, sırasıyla XPS 15'ten biraz daha büyük ve daha hafiftir. Daha önemli bir fark için Asus ZenBook 15, CPU beygir gücü pahasına fark edilir derecede daha küçük ve daha taşınabilir.
Bağlantı
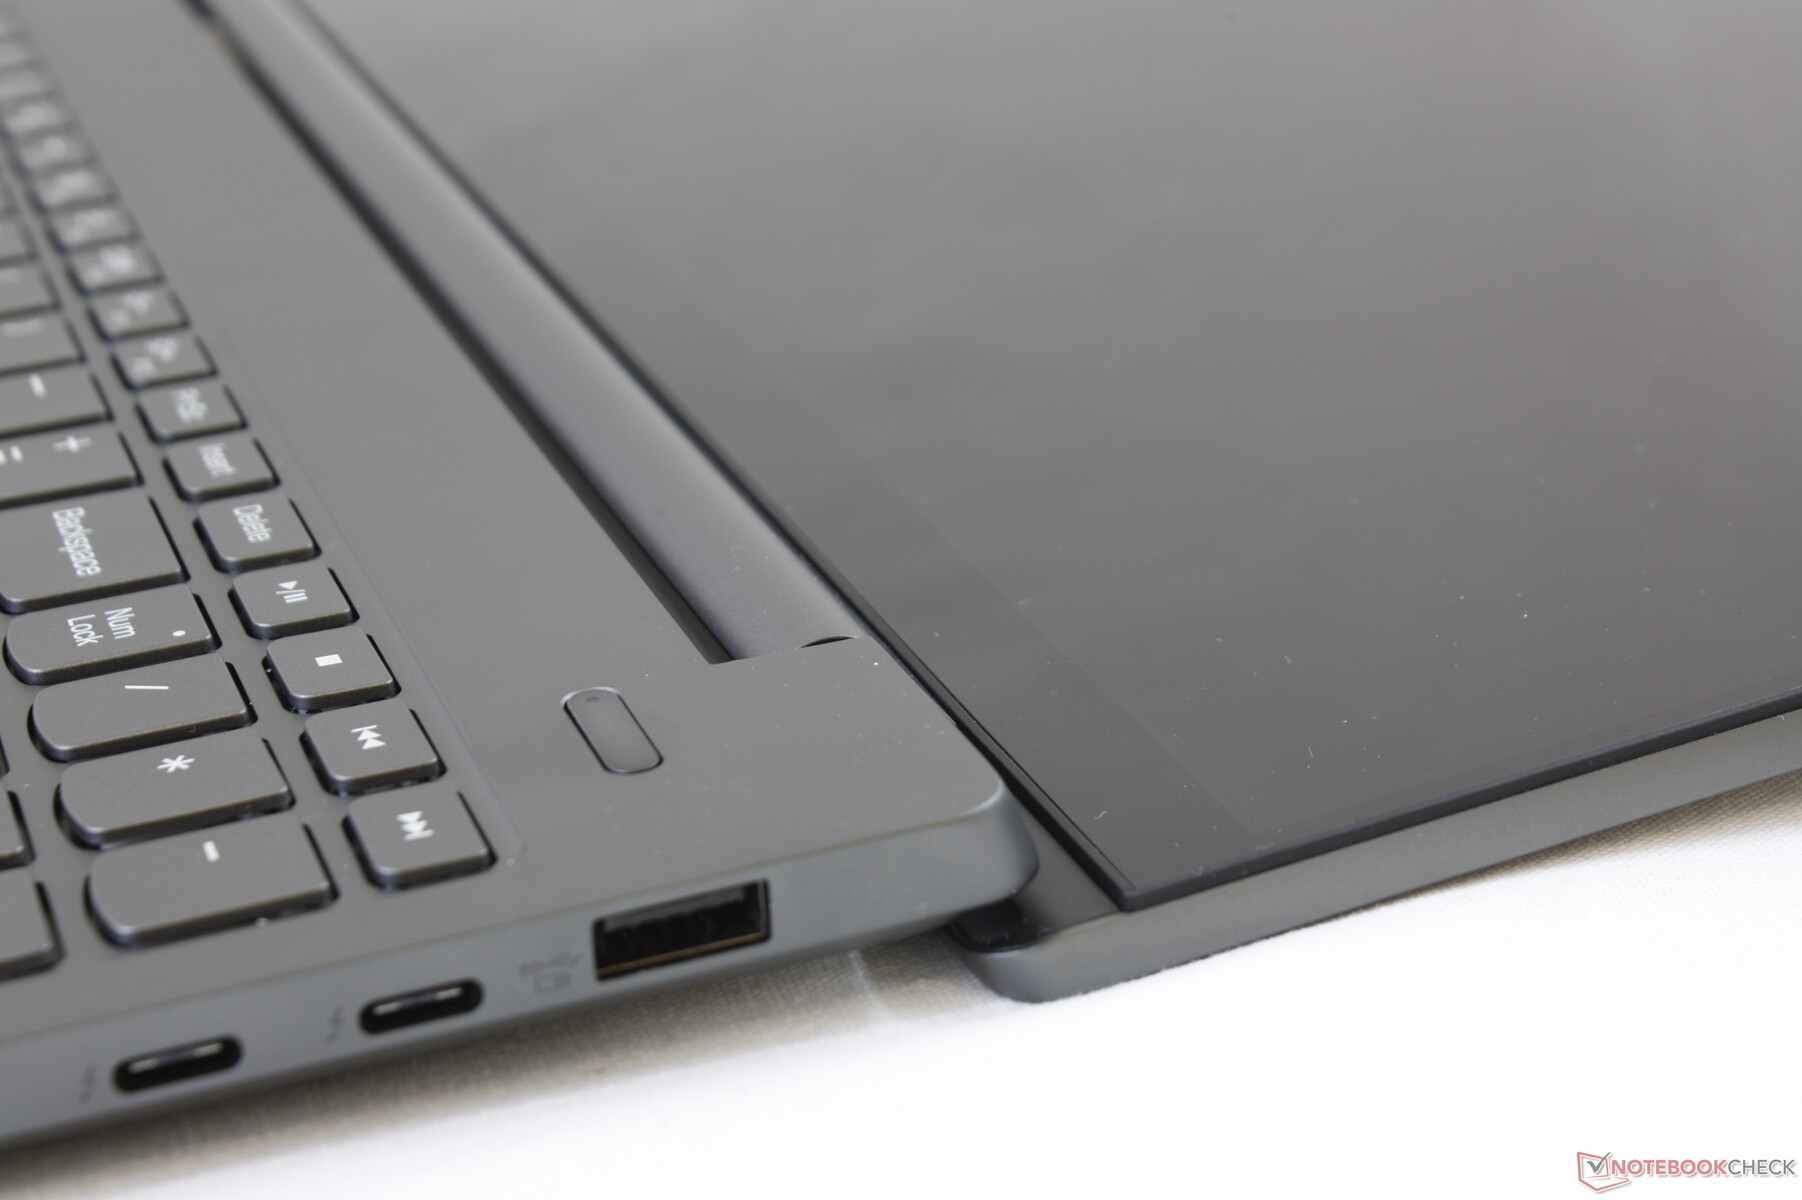
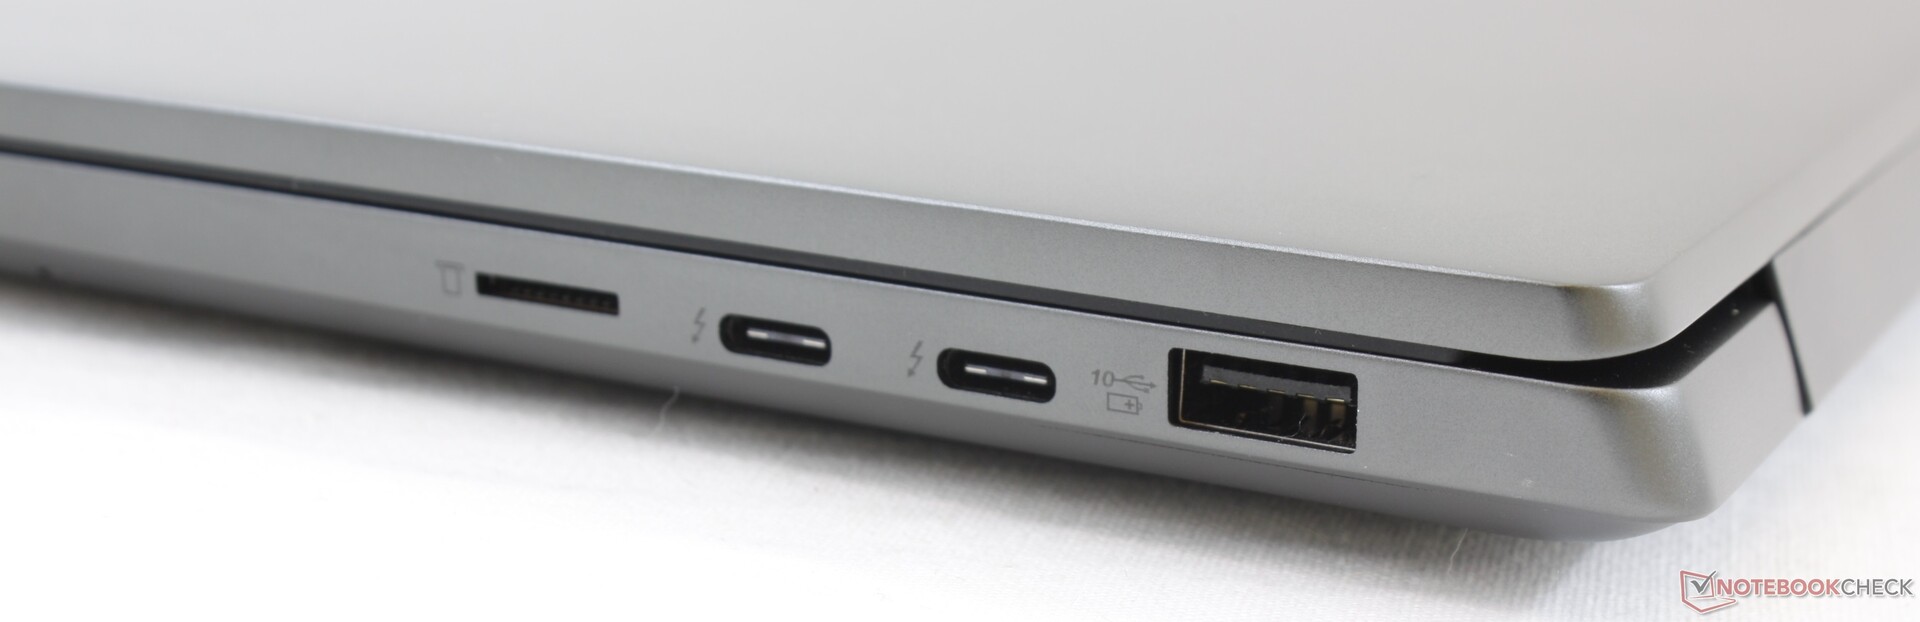
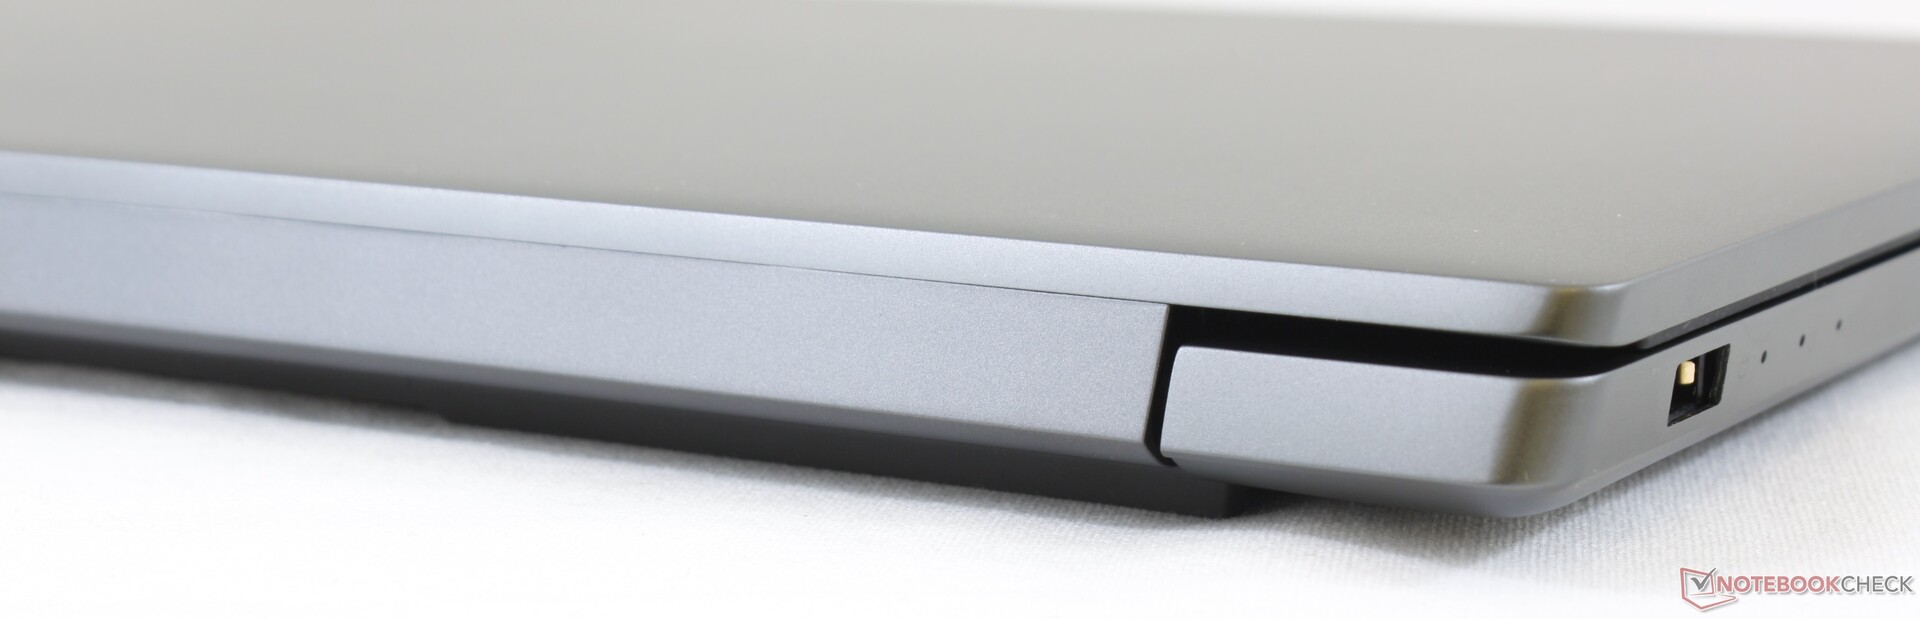
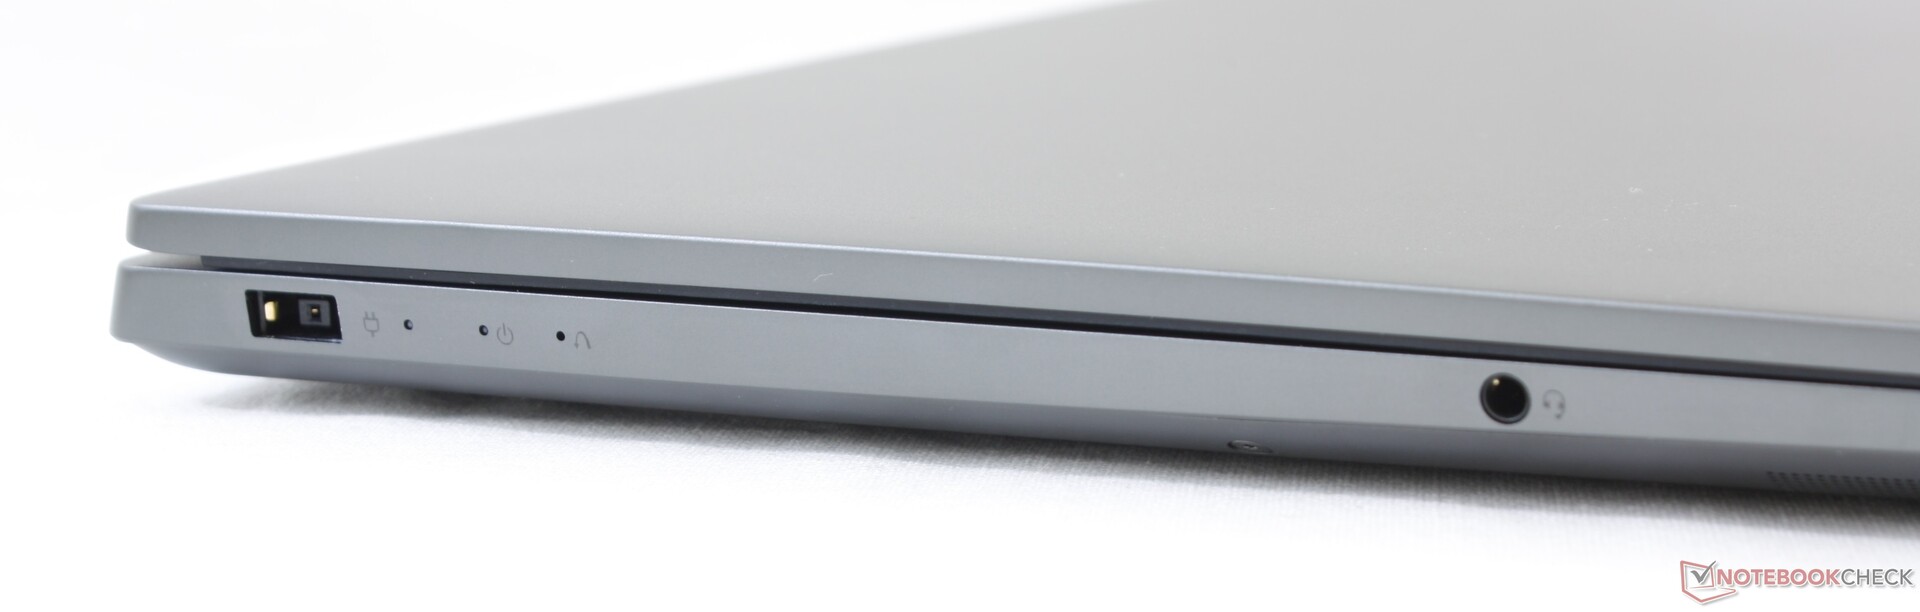
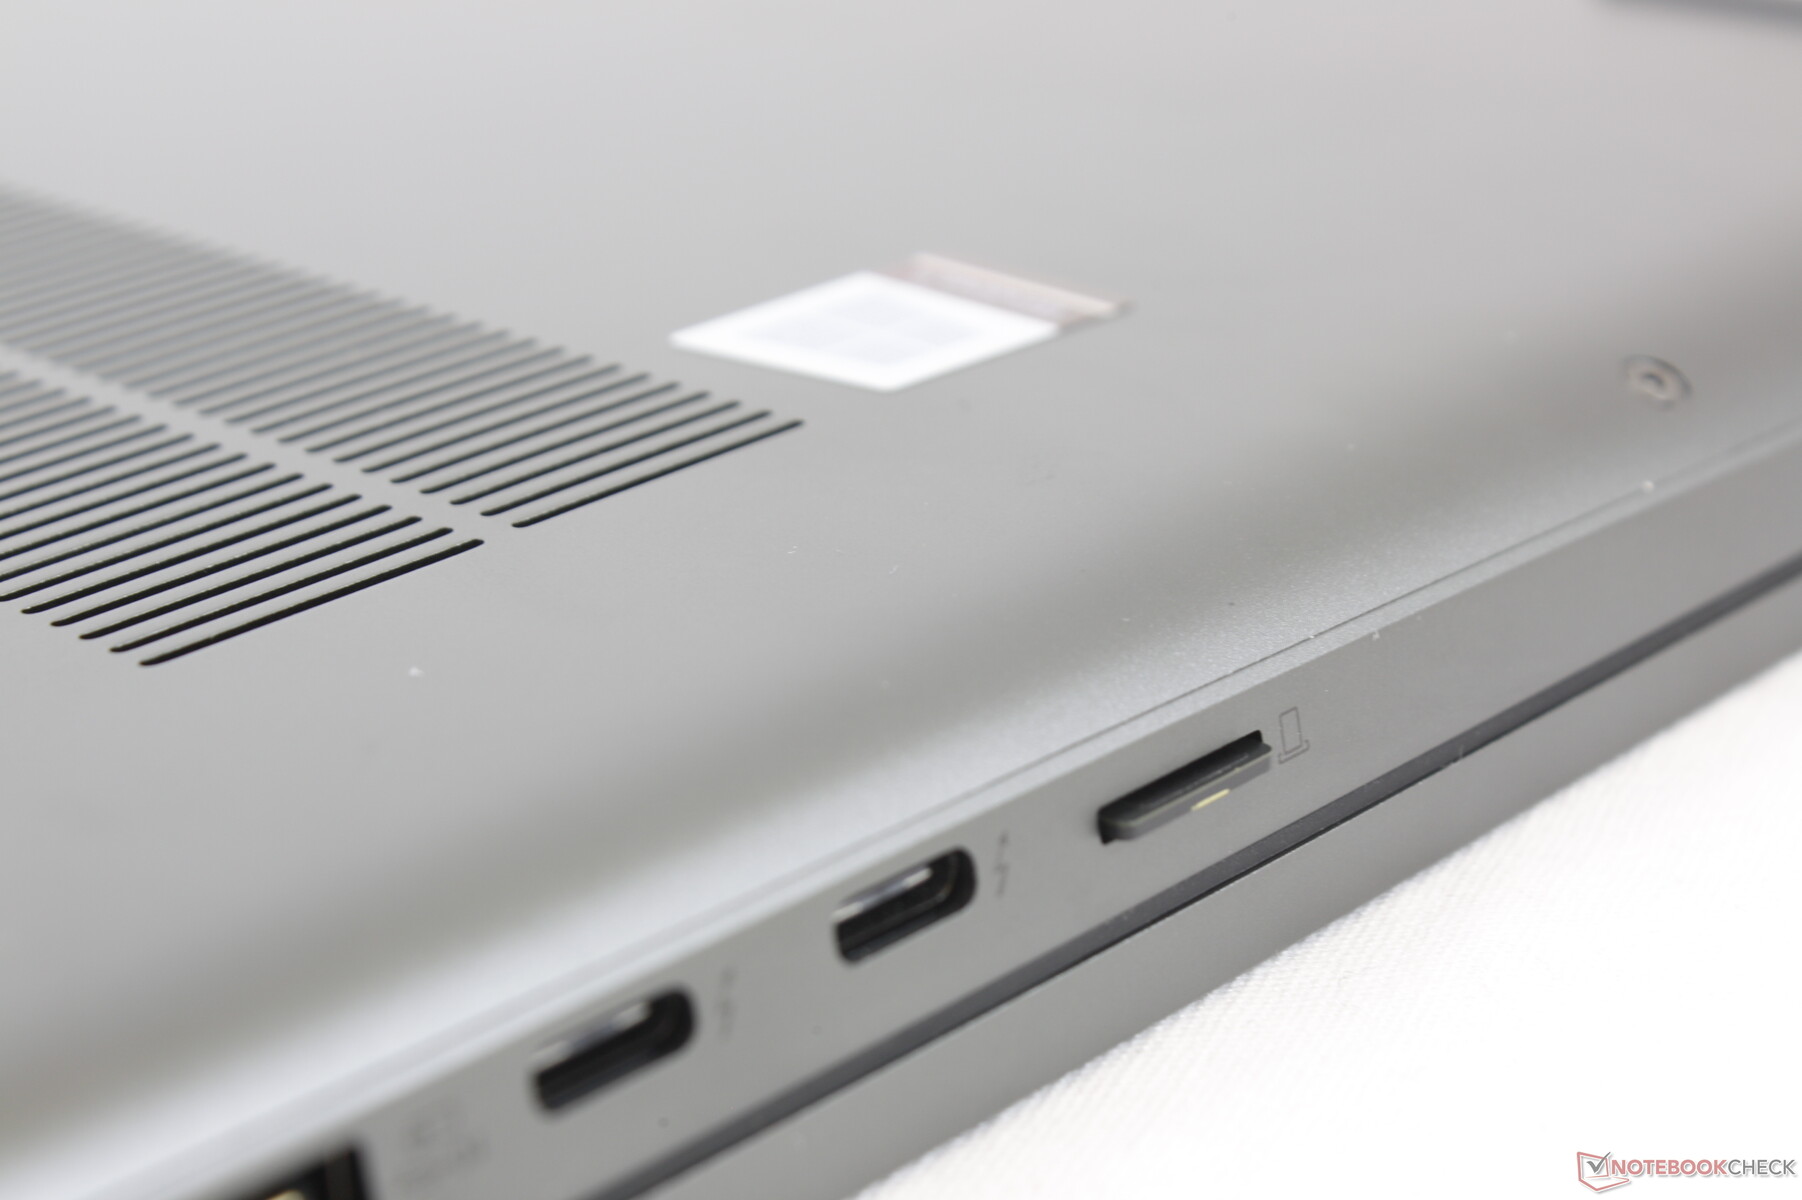
Limanlar seçenekleri karışık bir çanta. Birincisi, sistem hiçbir HDMI veya RJ-45 portu ve sadece bir USB Tip-A portu entegre ettiği için USB Tip C adaptörlerine ve yuvalara güvenmeye hazır olun. Büyük 15,6 inç ekran boyutu göz önüne alındığında, sınırlı bağlantı noktaları hayal kırıklığı yaratır. Razer Blade Stealth'de olduğu gibi daha simetrik bir liman konumlandırma daha cazip olurdu.
SD Kart Okuyucu
Yaylı MicroSD okuyucu ortalama hızdadır. Kartımızdan masaüstüne 1 GB değerinde fotoğraf aktarmak, Dell XPS 15'teki fotoğrafların yarısına kıyasla yaklaşık 13 saniye sürer.
| SD Card Reader | |
| average JPG Copy Test (av. of 3 runs) | |
| Dell XPS 15 7590 9980HK GTX 1650 (Toshiba Exceria Pro SDXC 64 GB UHS-II) | |
| HP Spectre X360 15-5ZV31AV (Toshiba Exceria Pro M501 UHS-II) | |
| MSI Prestige 15 A10SC (Toshiba Exceria Pro M501 UHS-II) | |
| Lenovo IdeaPad S740-15IRH (Toshiba Exceria Pro M501 UHS-II) | |
| Asus ZenBook 15 UX534FT-DB77 (Toshiba Exceria Pro SDXC 64 GB UHS-II) | |
| maximum AS SSD Seq Read Test (1GB) | |
| MSI Prestige 15 A10SC (Toshiba Exceria Pro M501 UHS-II) | |
| Dell XPS 15 7590 9980HK GTX 1650 (Toshiba Exceria Pro SDXC 64 GB UHS-II) | |
| HP Spectre X360 15-5ZV31AV (Toshiba Exceria Pro M501 UHS-II) | |
| Lenovo IdeaPad S740-15IRH (Toshiba Exceria Pro M501 UHS-II) | |
| Asus ZenBook 15 UX534FT-DB77 (Toshiba Exceria Pro SDXC 64 GB UHS-II) | |
İletişim
IdeaPad Y740 15, SKU'ya bağlı olarak Wi-Fi 5 (802.11ac) veya Wi-Fi 6 (802.11ax) ile birlikte gelir. Wi-Fi 5 test ünitemiz ile zamanımızda hiçbir bağlantı sorunu yaşamadık.
| Networking | |
| iperf3 transmit AX12 | |
| MSI Prestige 15 A10SC | |
| Lenovo Yoga 730-15IKB | |
| iperf3 receive AX12 | |
| MSI Prestige 15 A10SC | |
| Lenovo Yoga 730-15IKB | |
Bakım
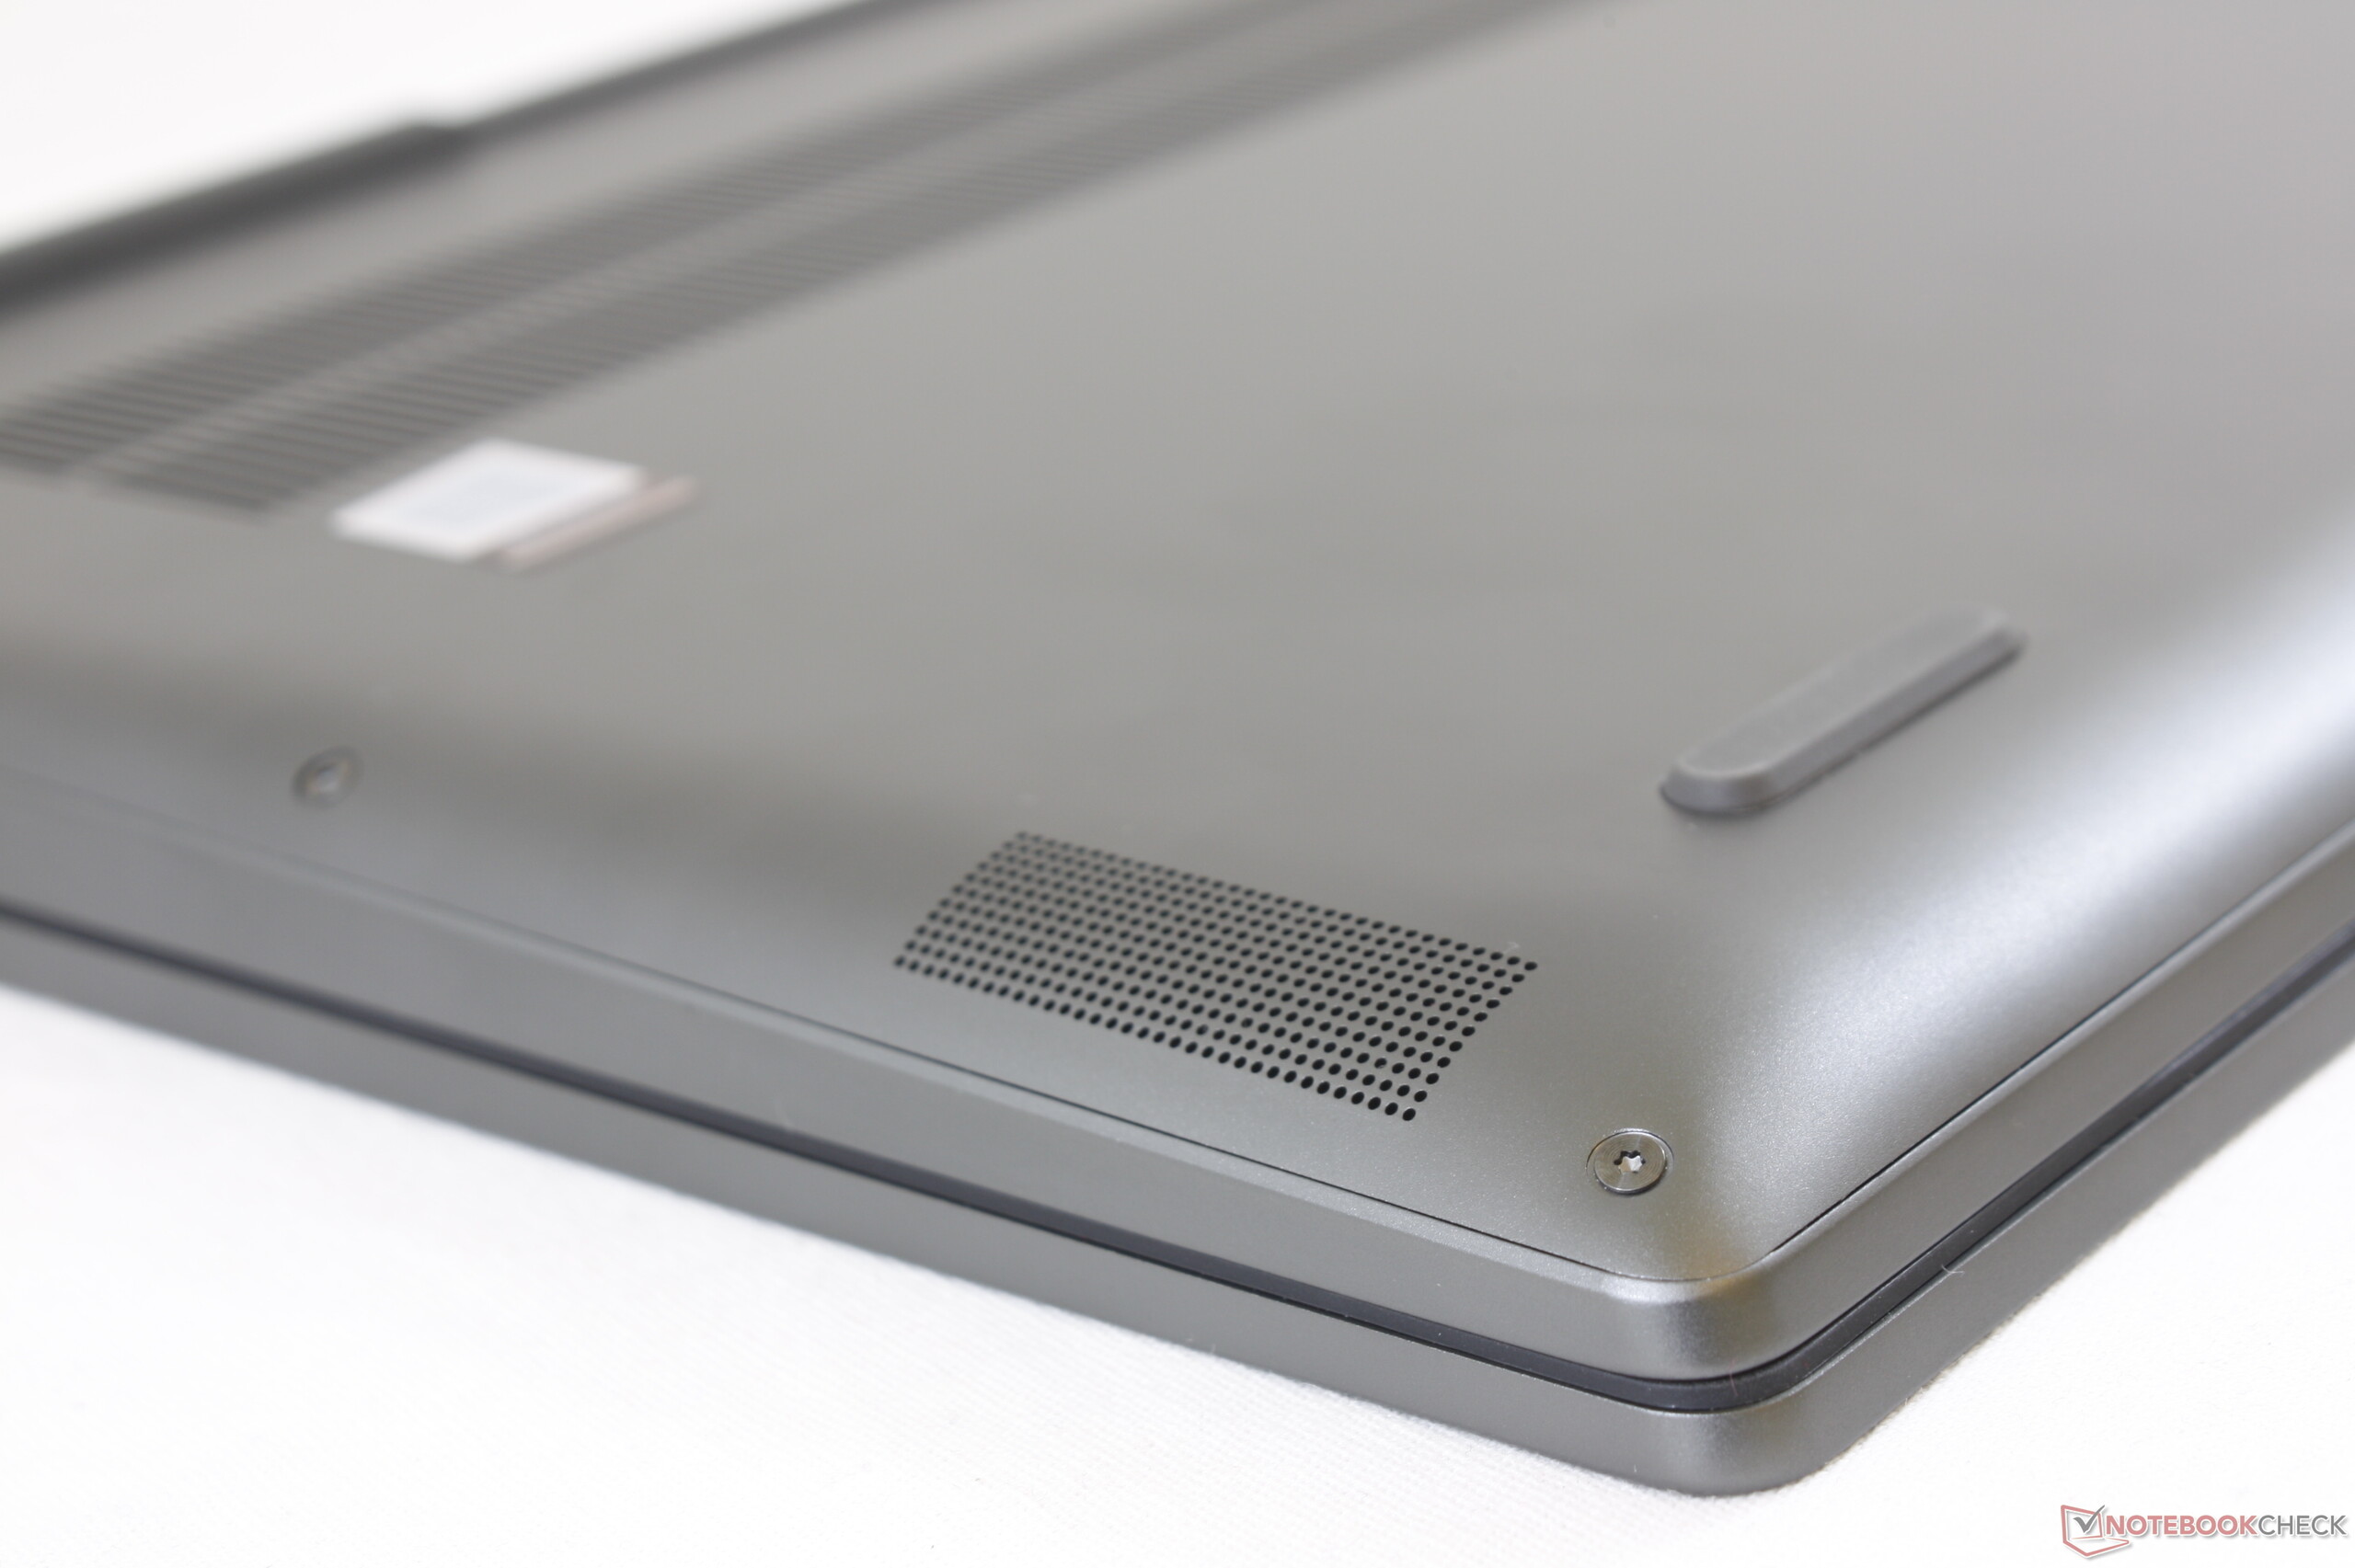
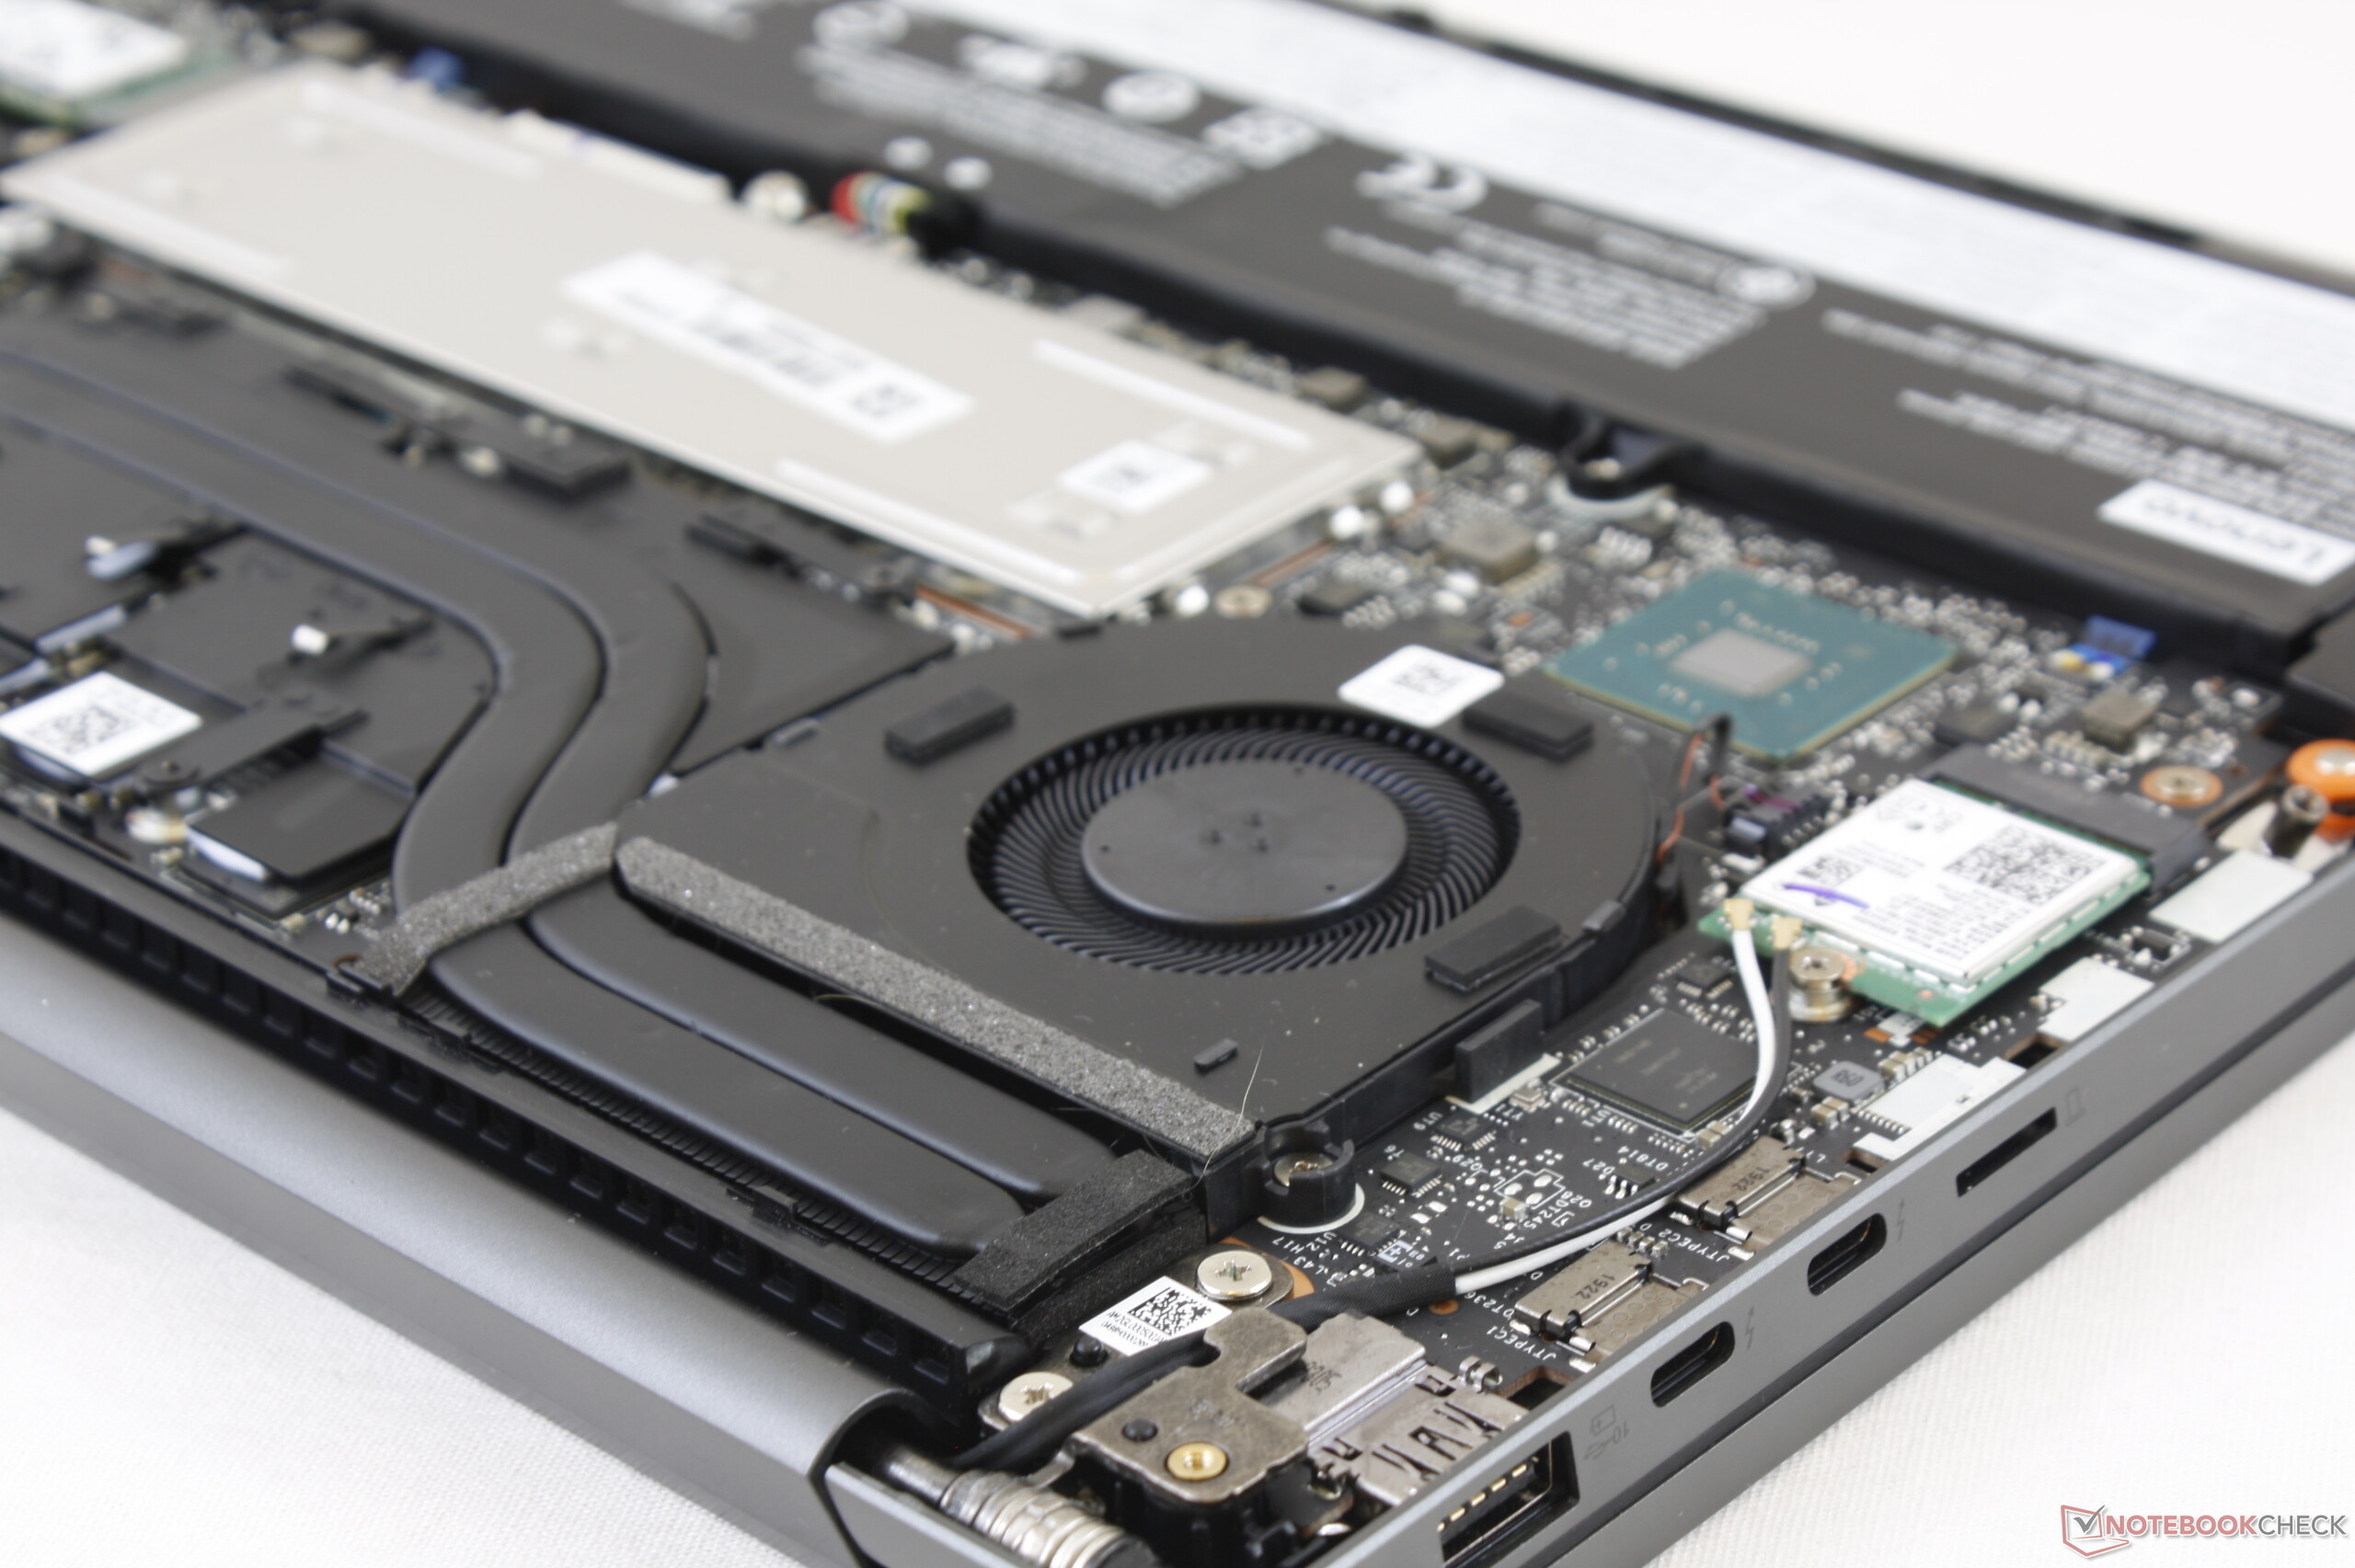
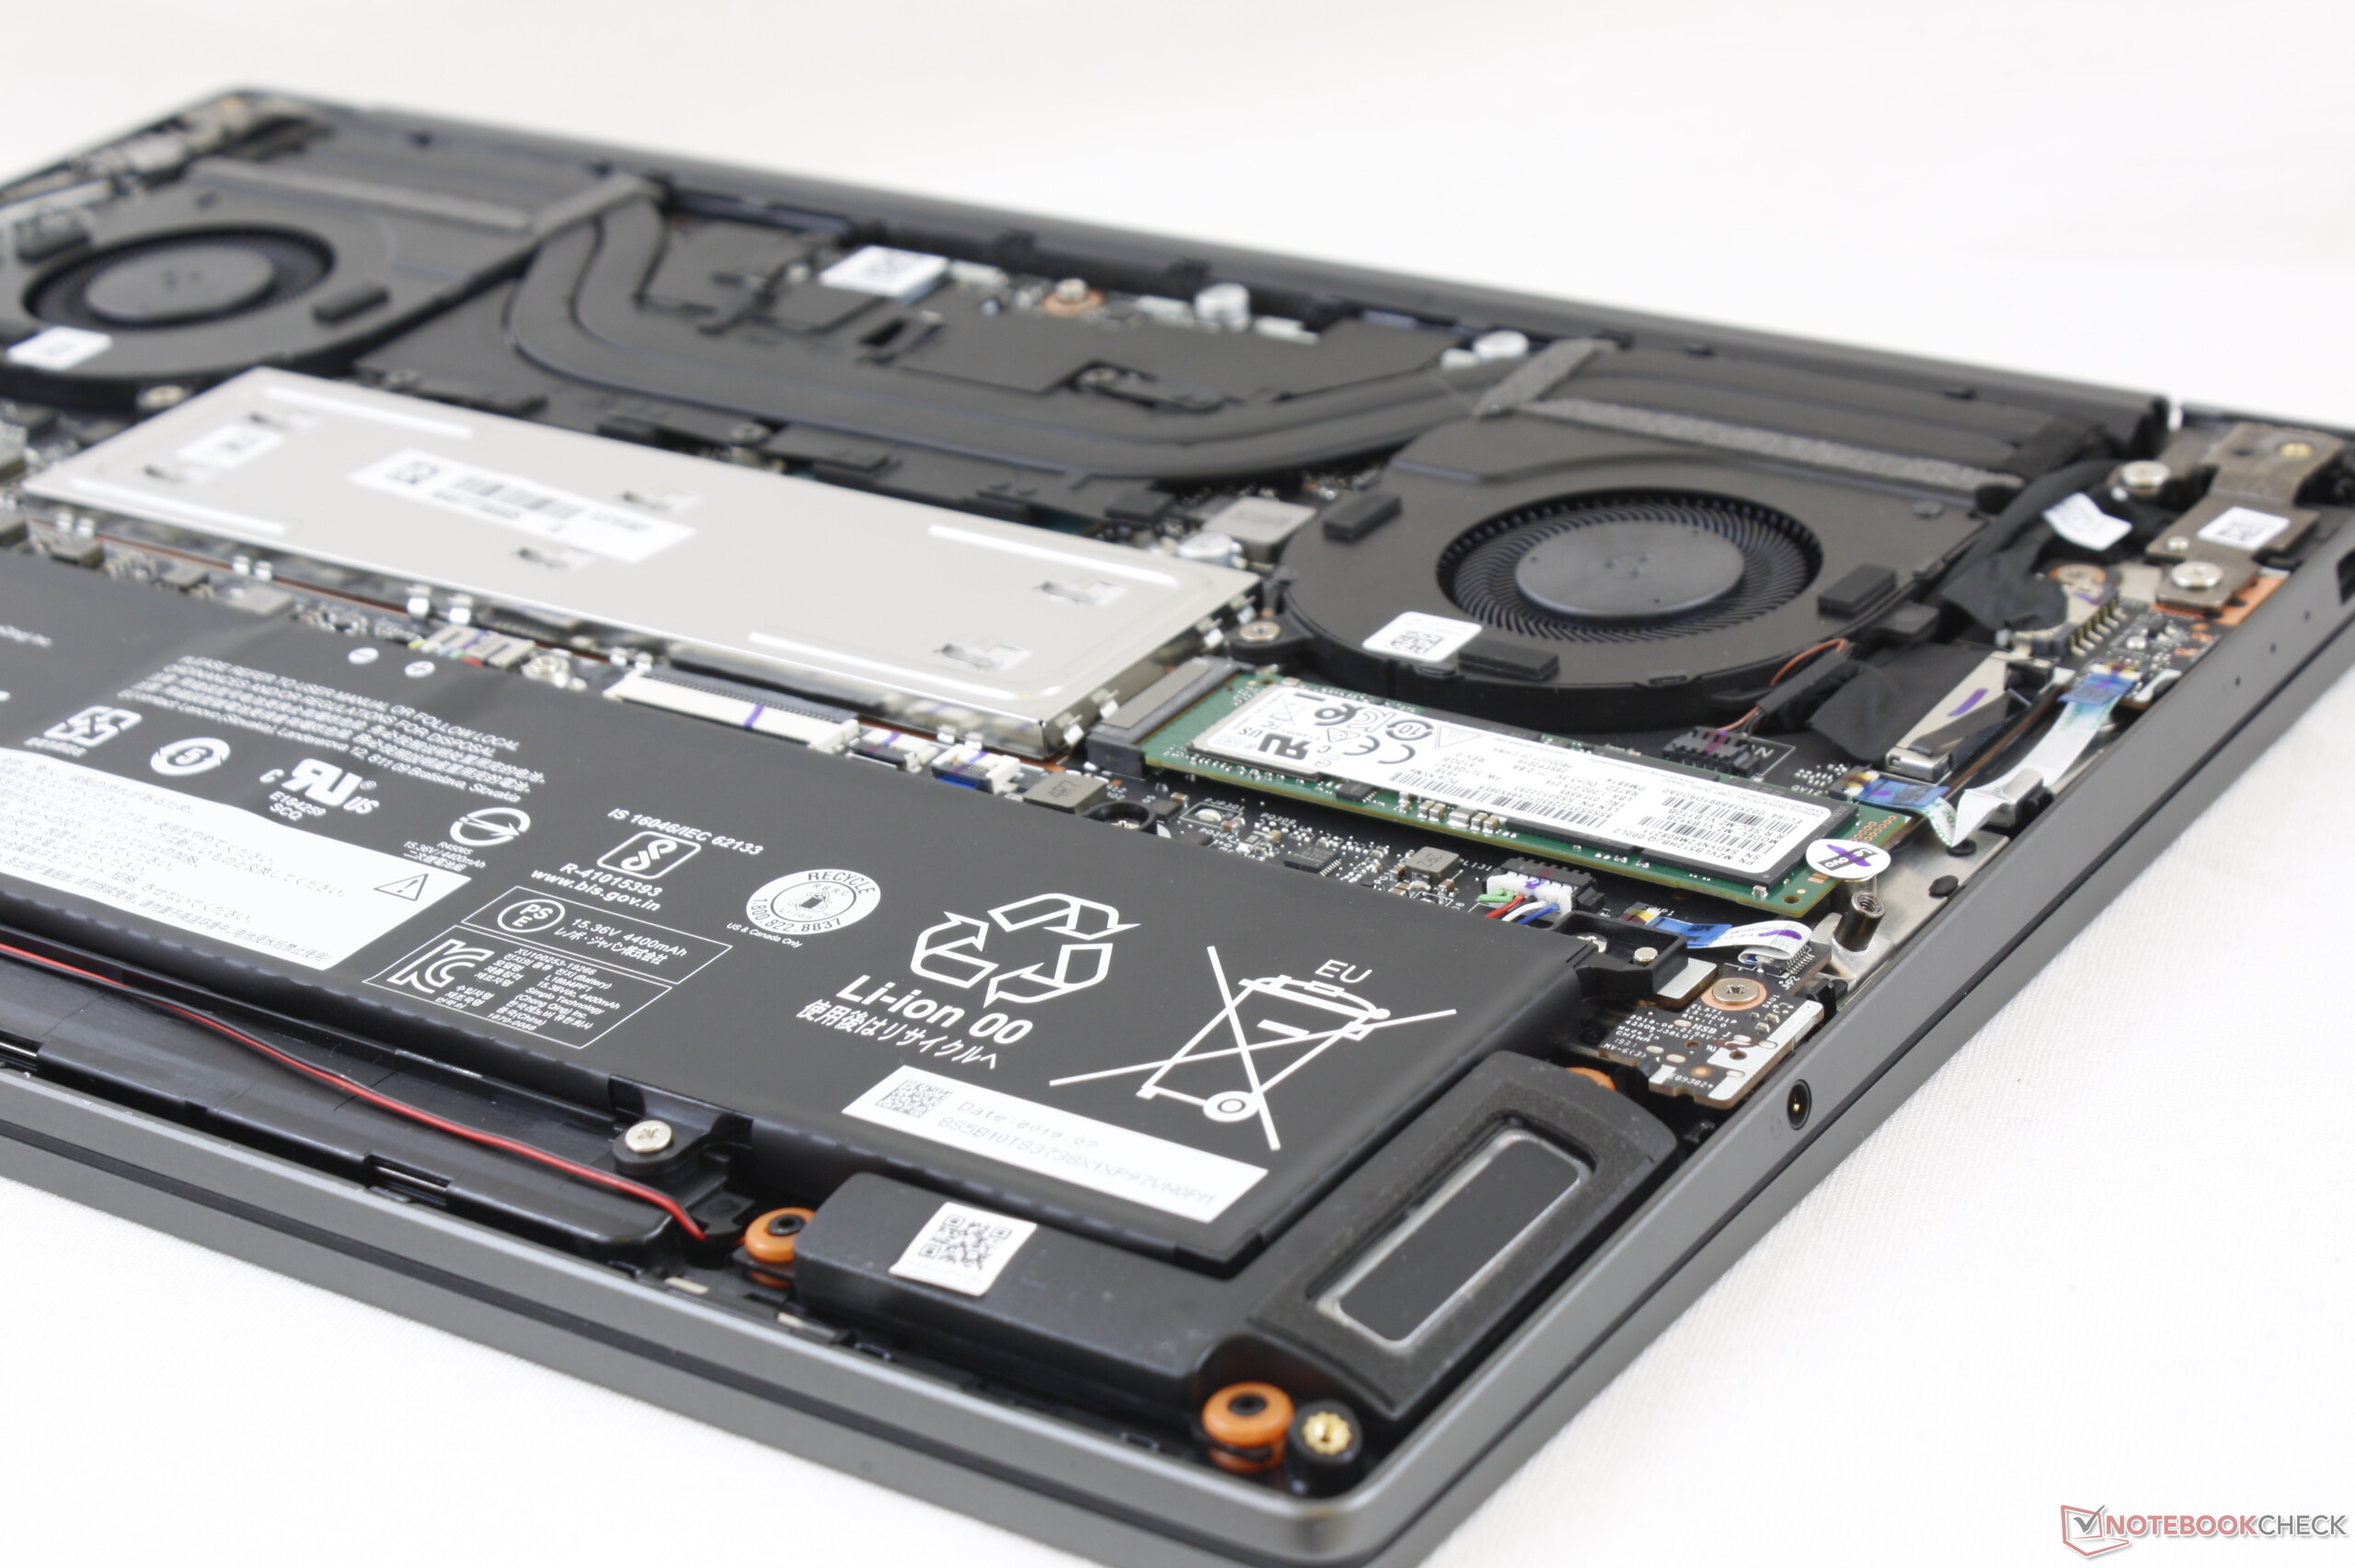
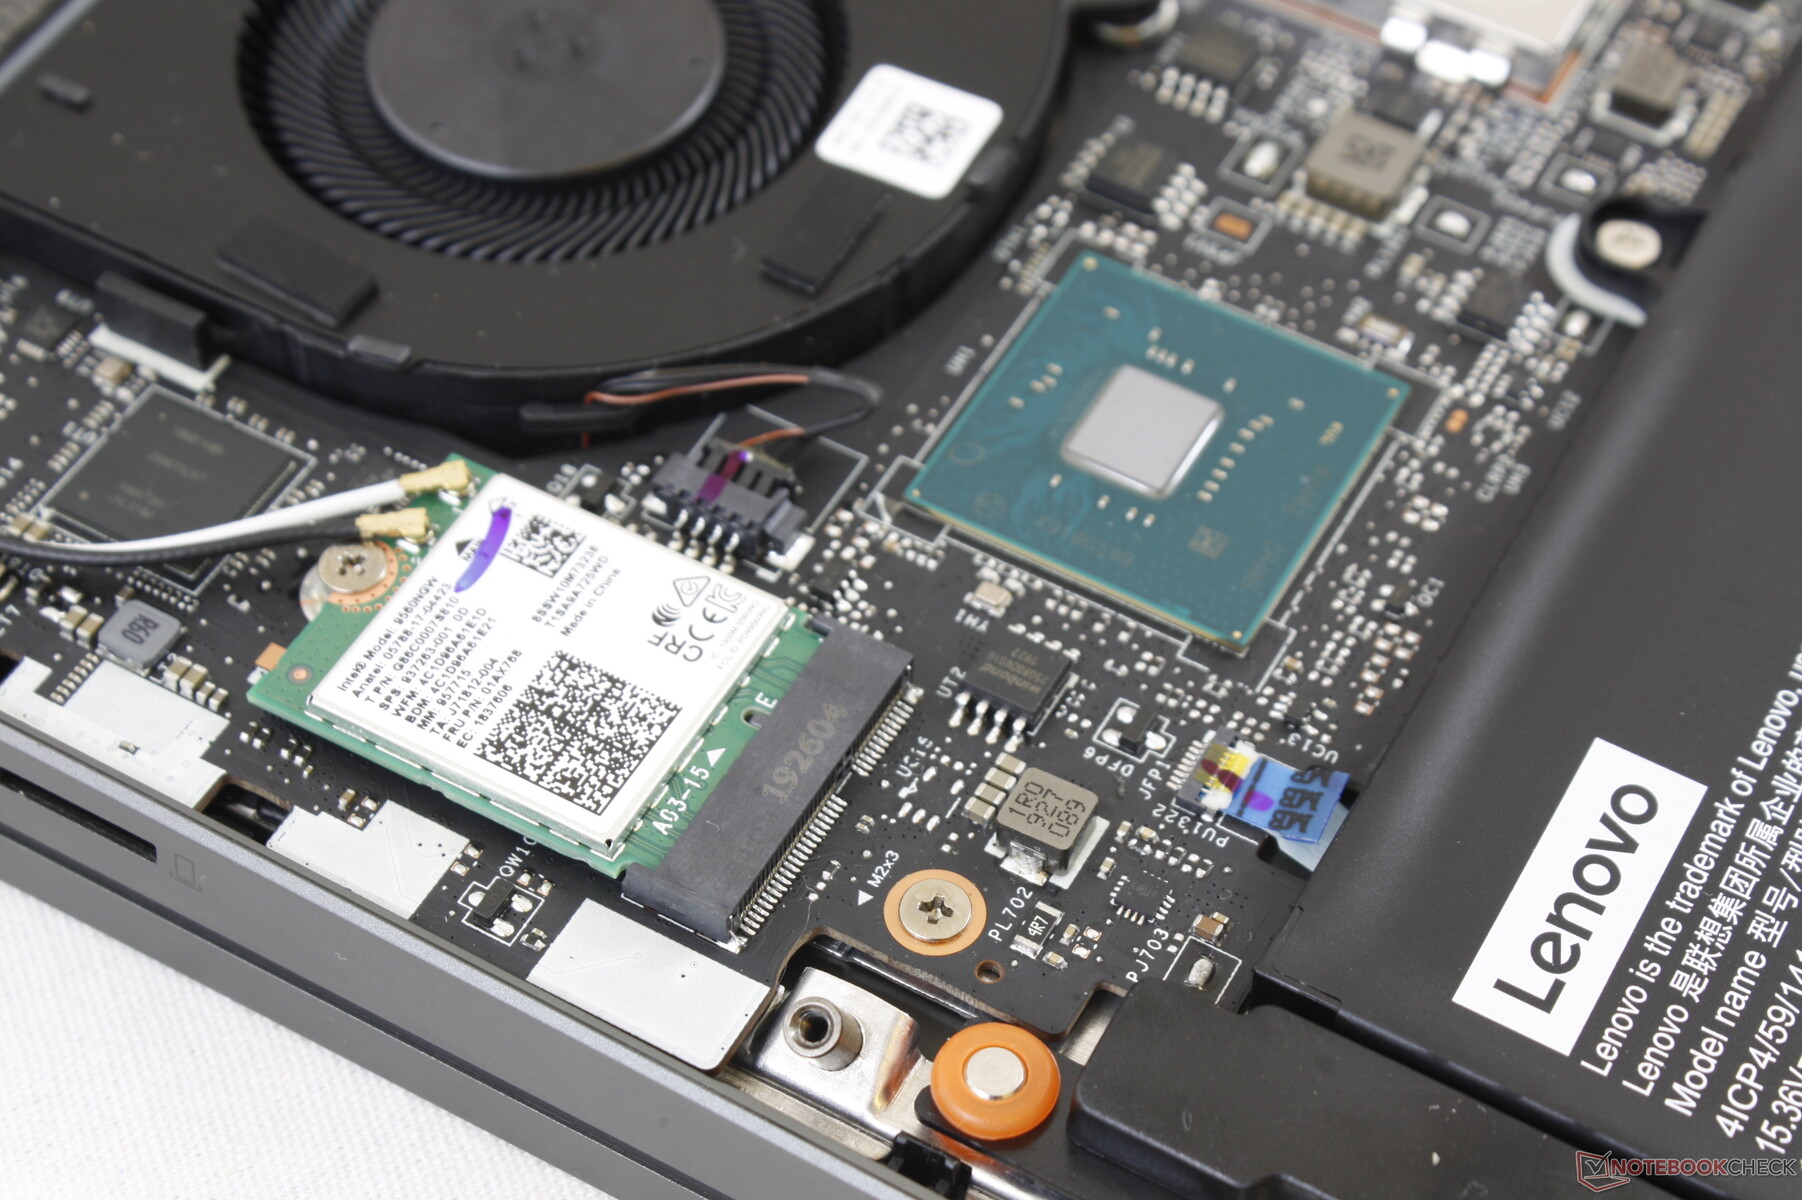
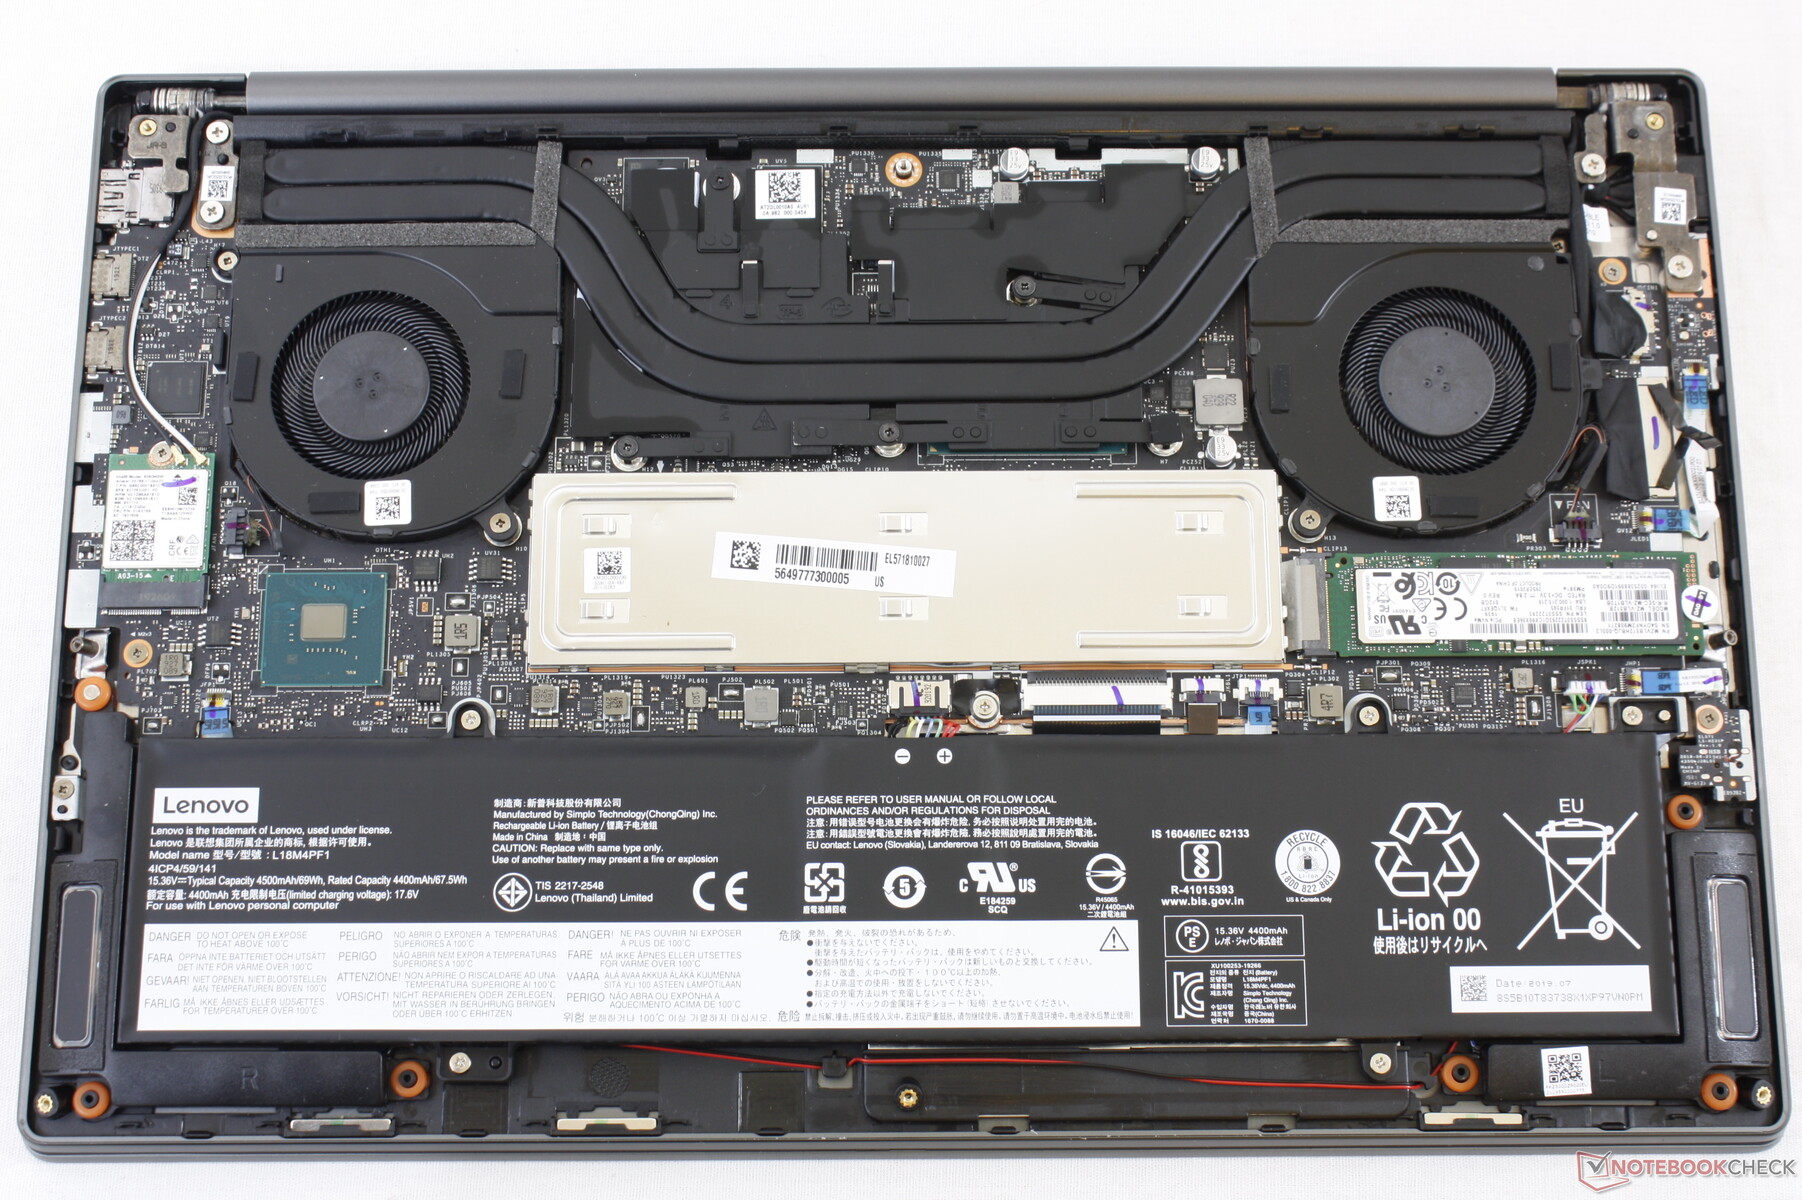
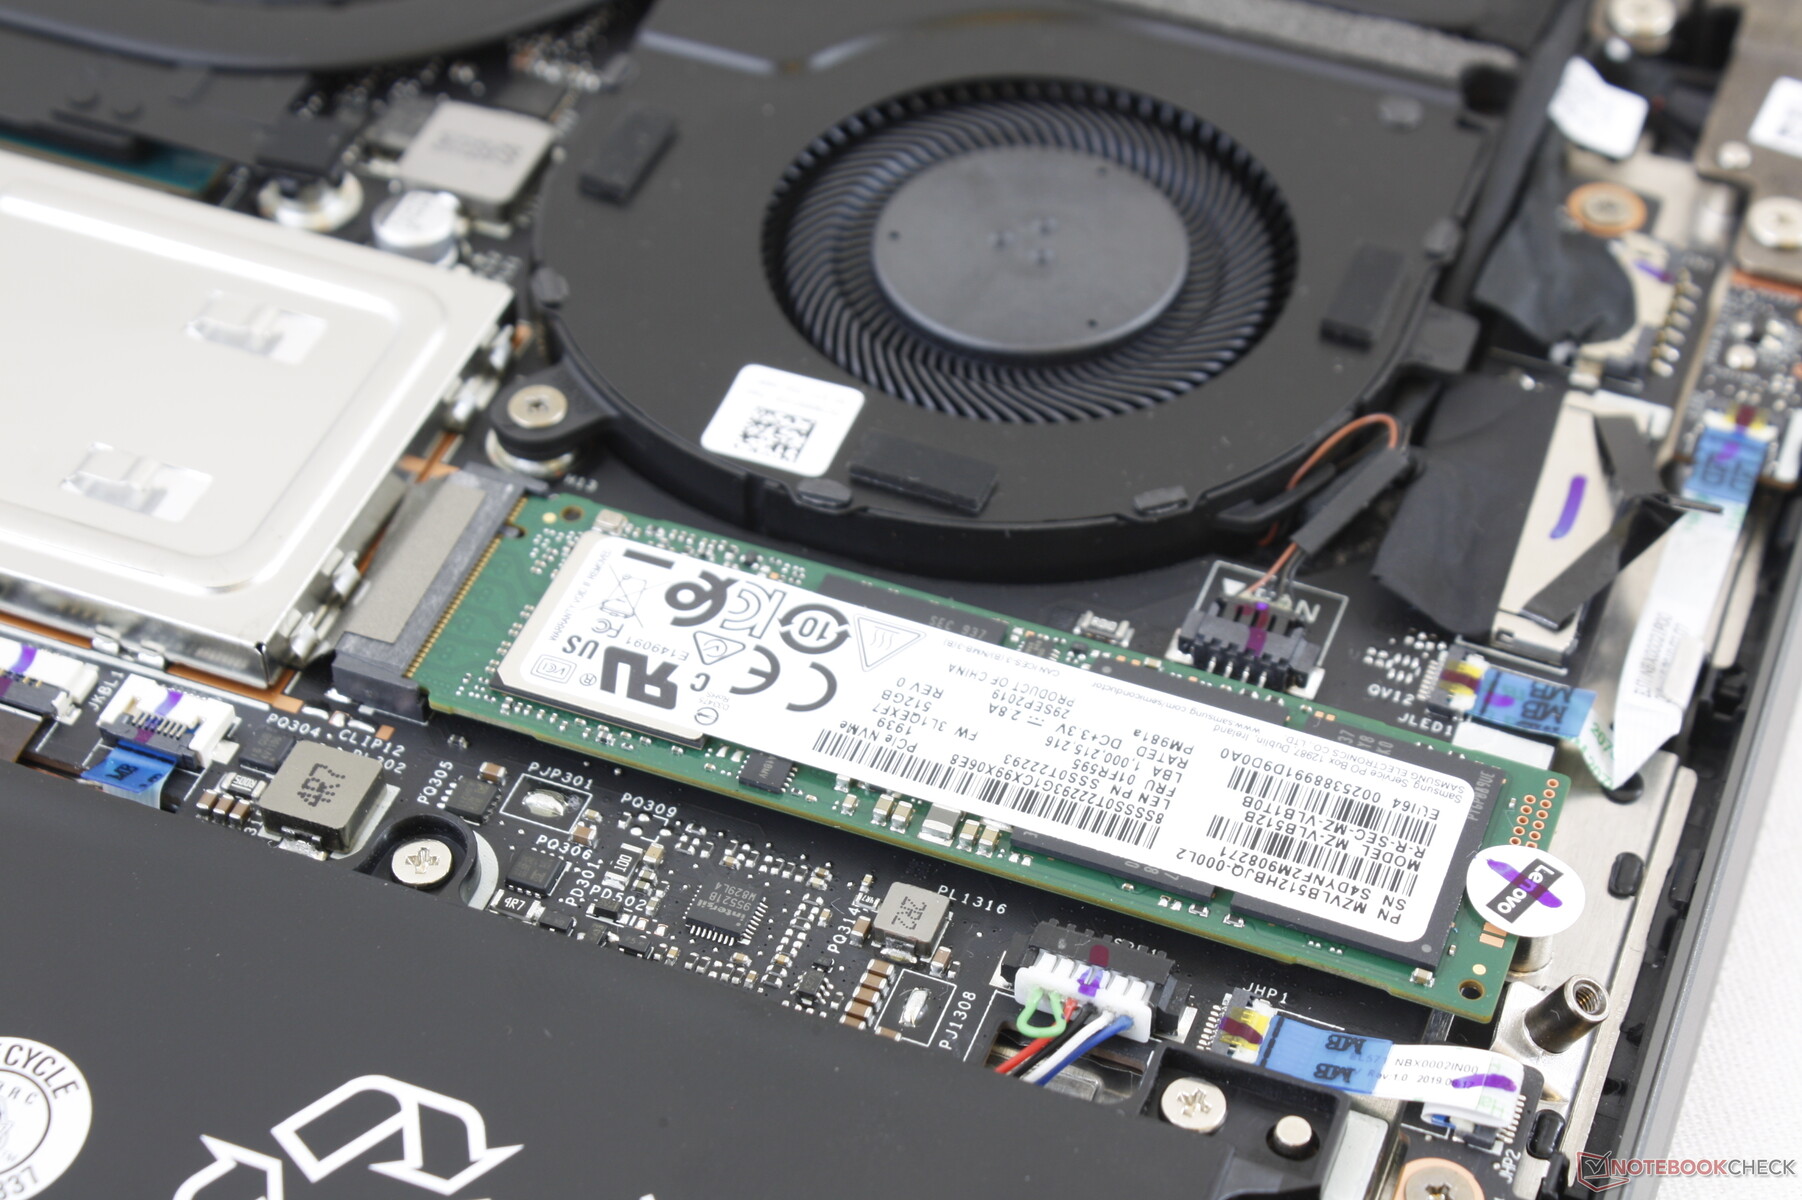
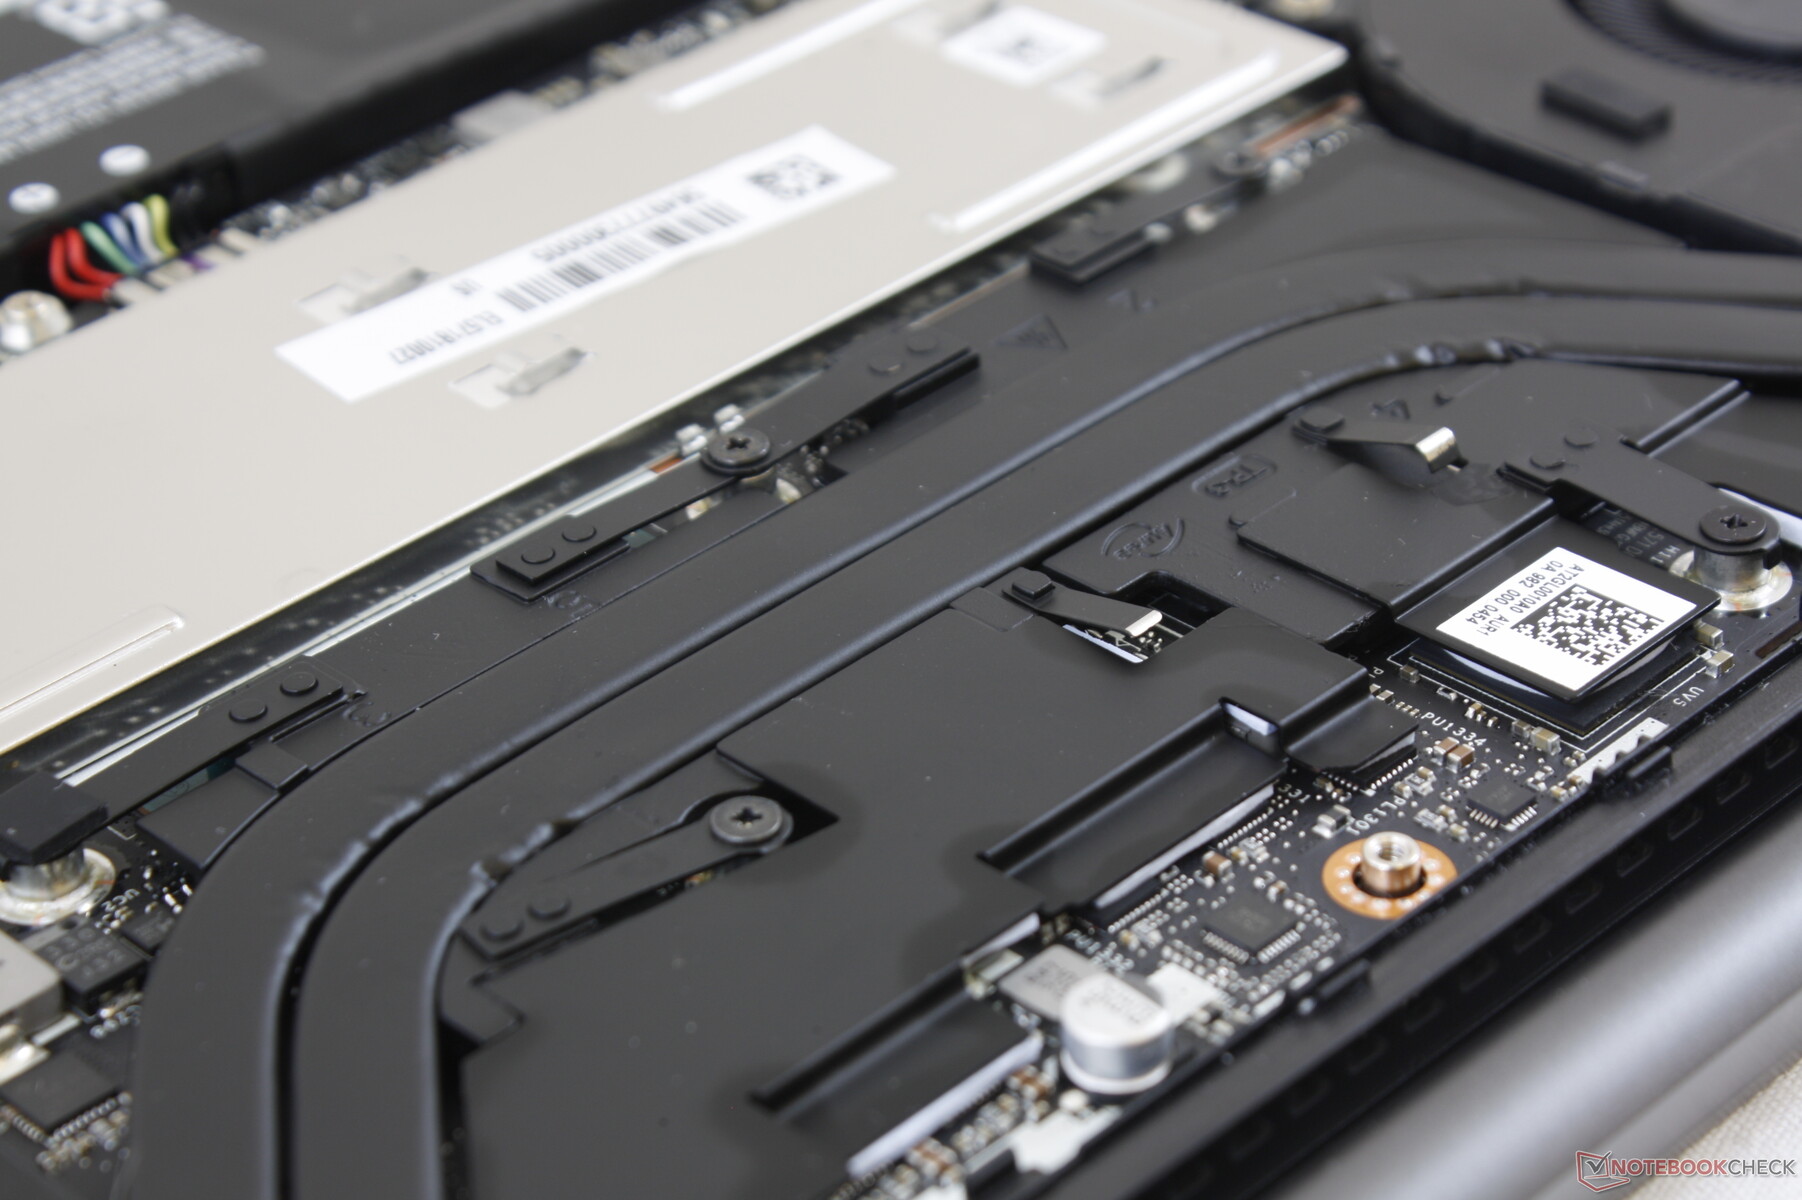
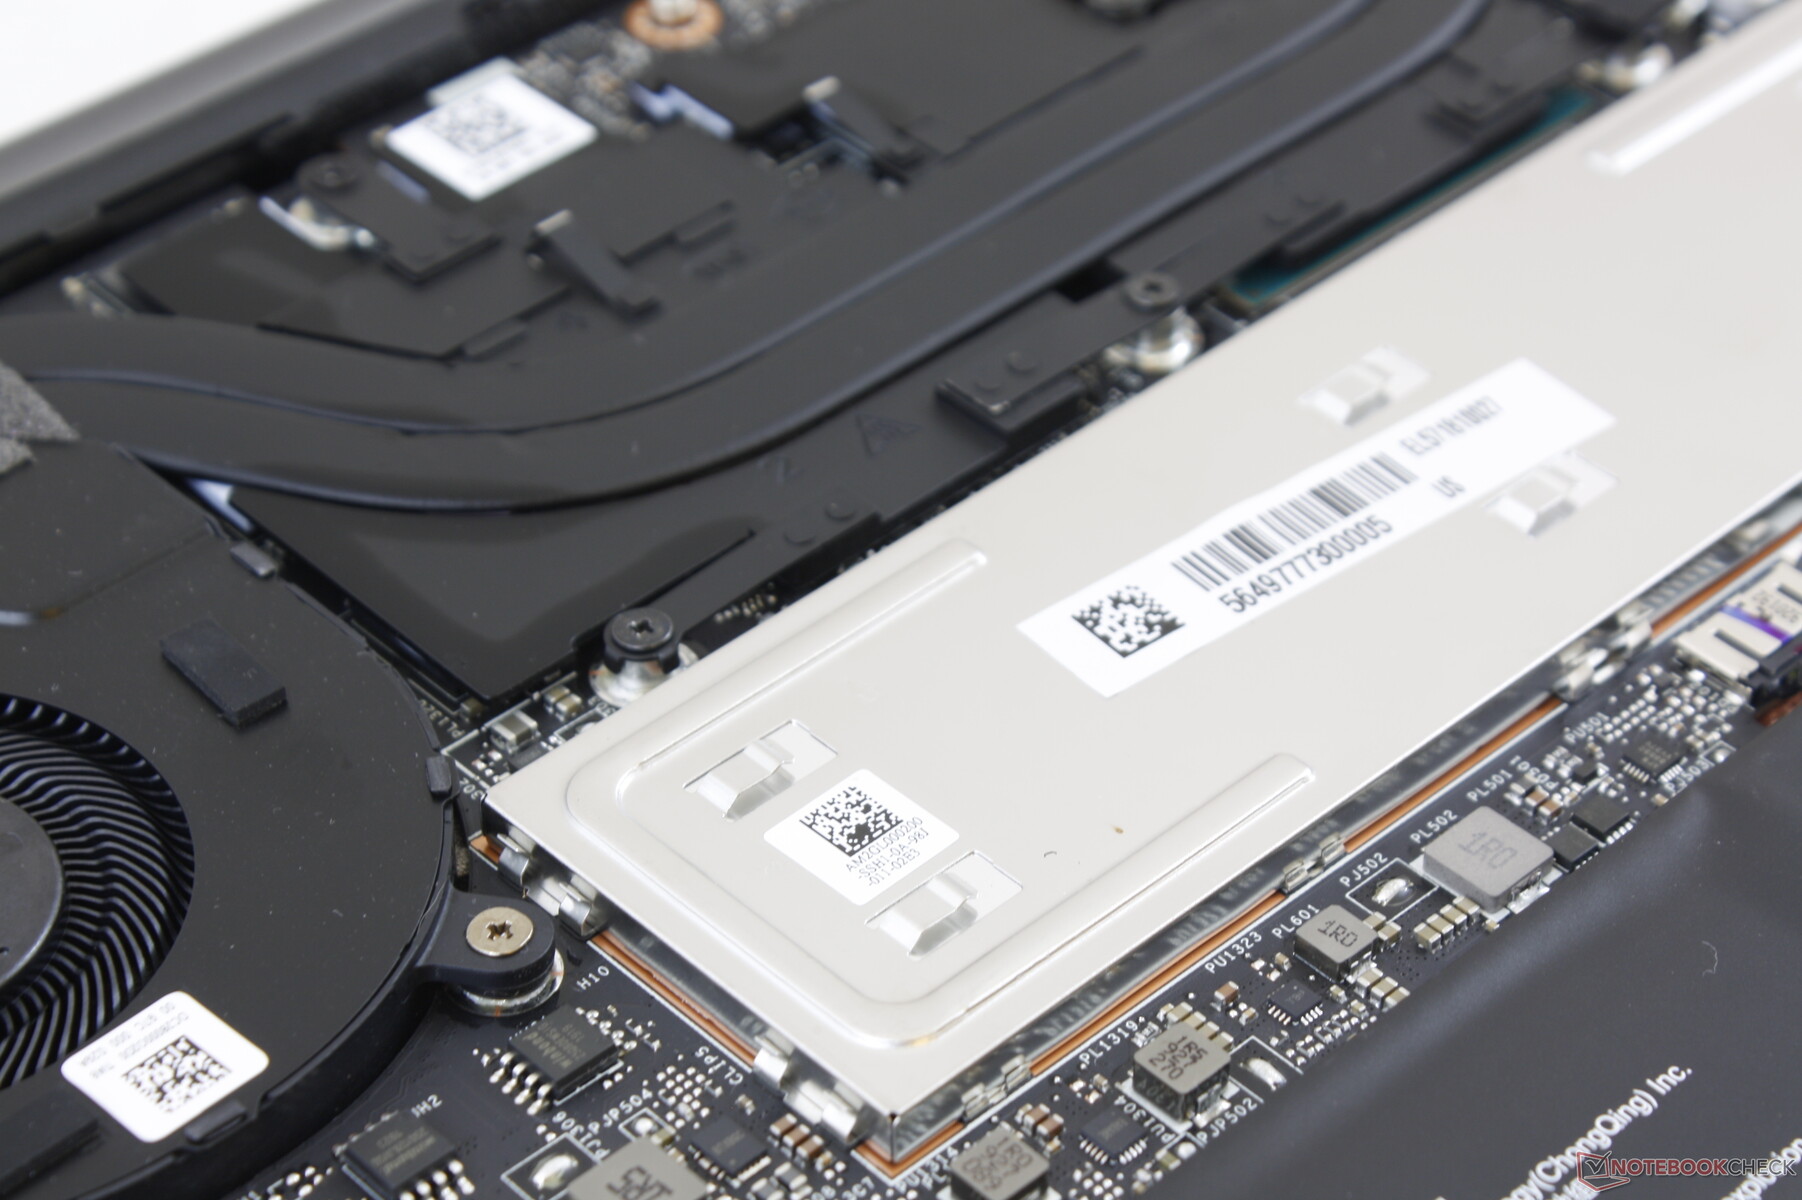
Alt panel, kauçuk tabanın altına gizlenmemiş sekiz T5 Torx vida ile sabitlenmiştir. Panelin kenarlarının hem keskin hem de sıkıca kilitlendiğini unutmayın. İçeri girdikten sonra kullanıcılar WLAN, M.2 SSD ve alüminyum plaka altında korunan her iki SODIMM yuvasını yükseltebilir.
Aksesuarlar ve Garanti
Kutuda AC adaptörü ve talimat kitapçığı dışında ekstra yoktur. Standart bir yıllık sınırlı garanti, dört yıla kadar uzatma ve kazara hasar koruması seçeneklerinde geçerlidir.
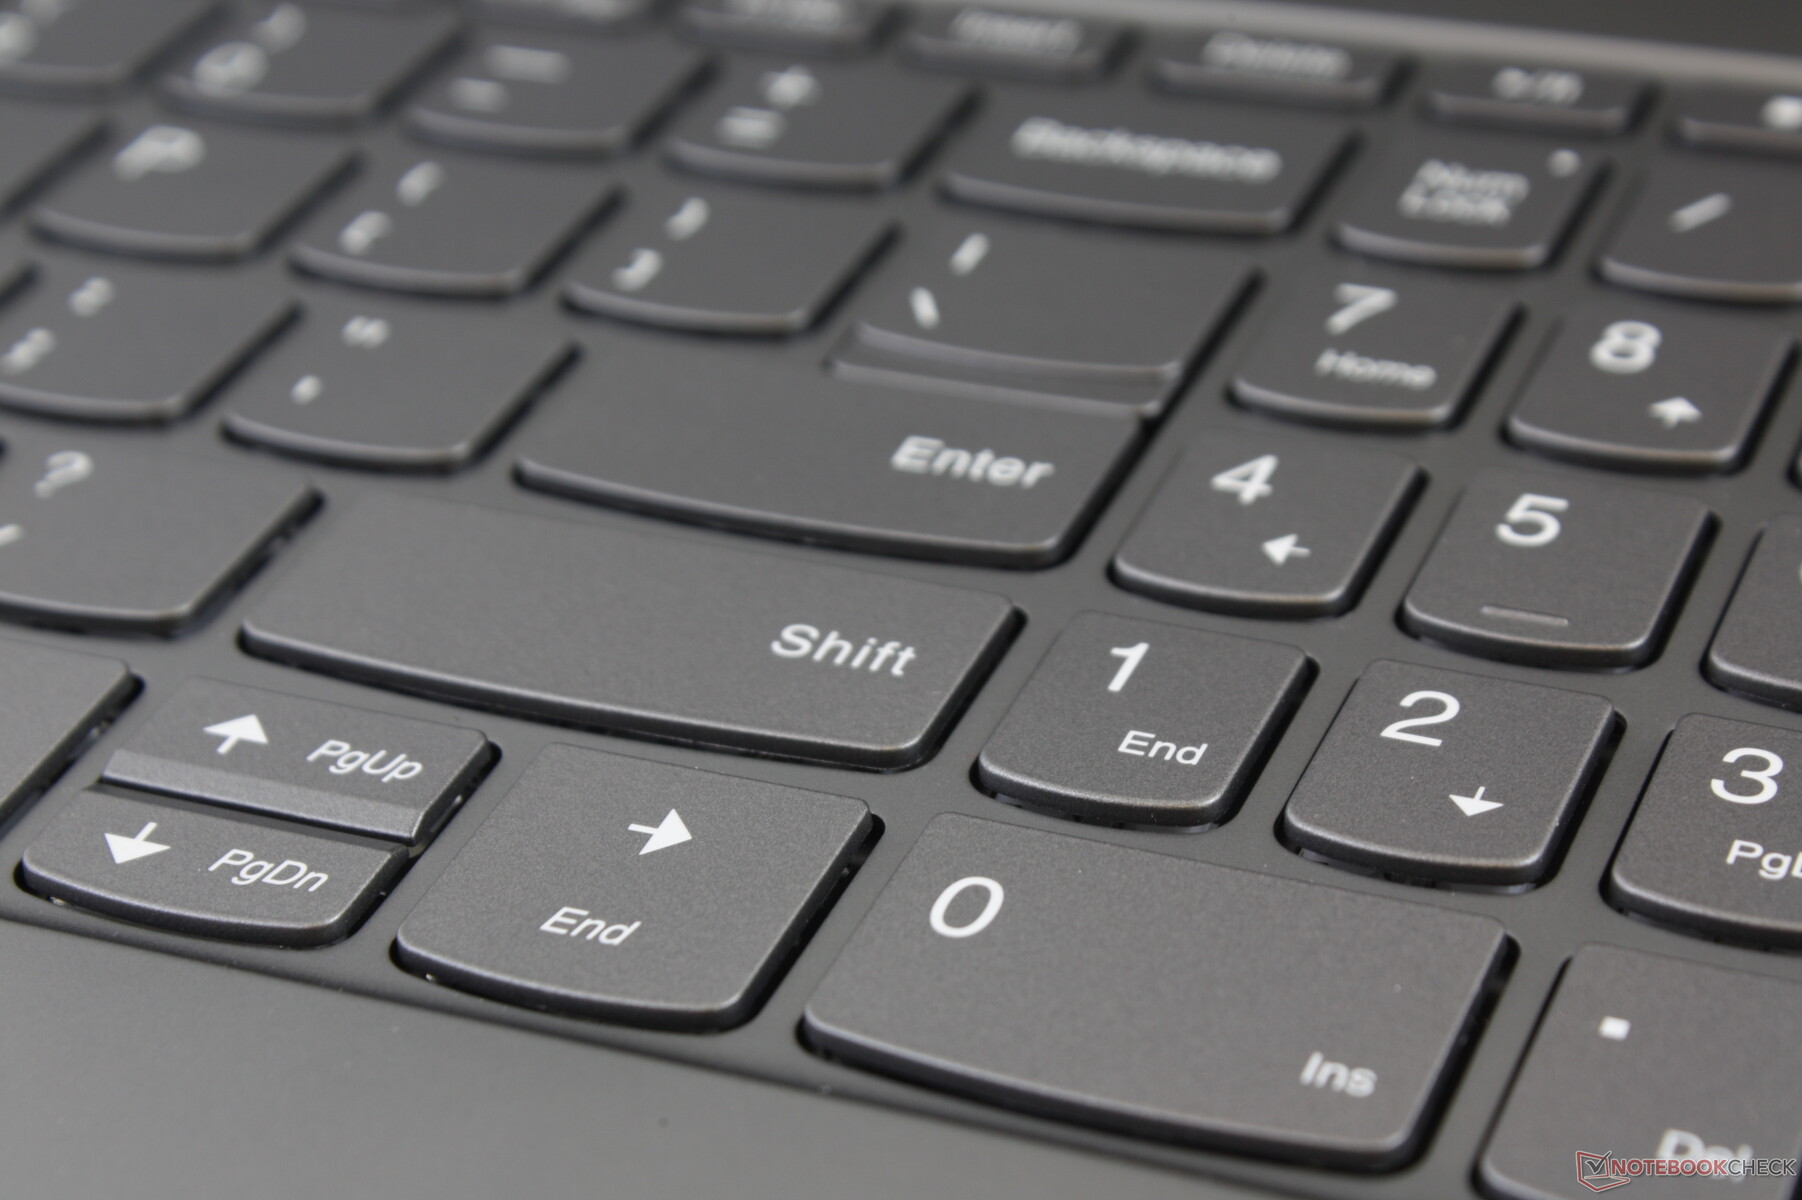
Giriş cihazları
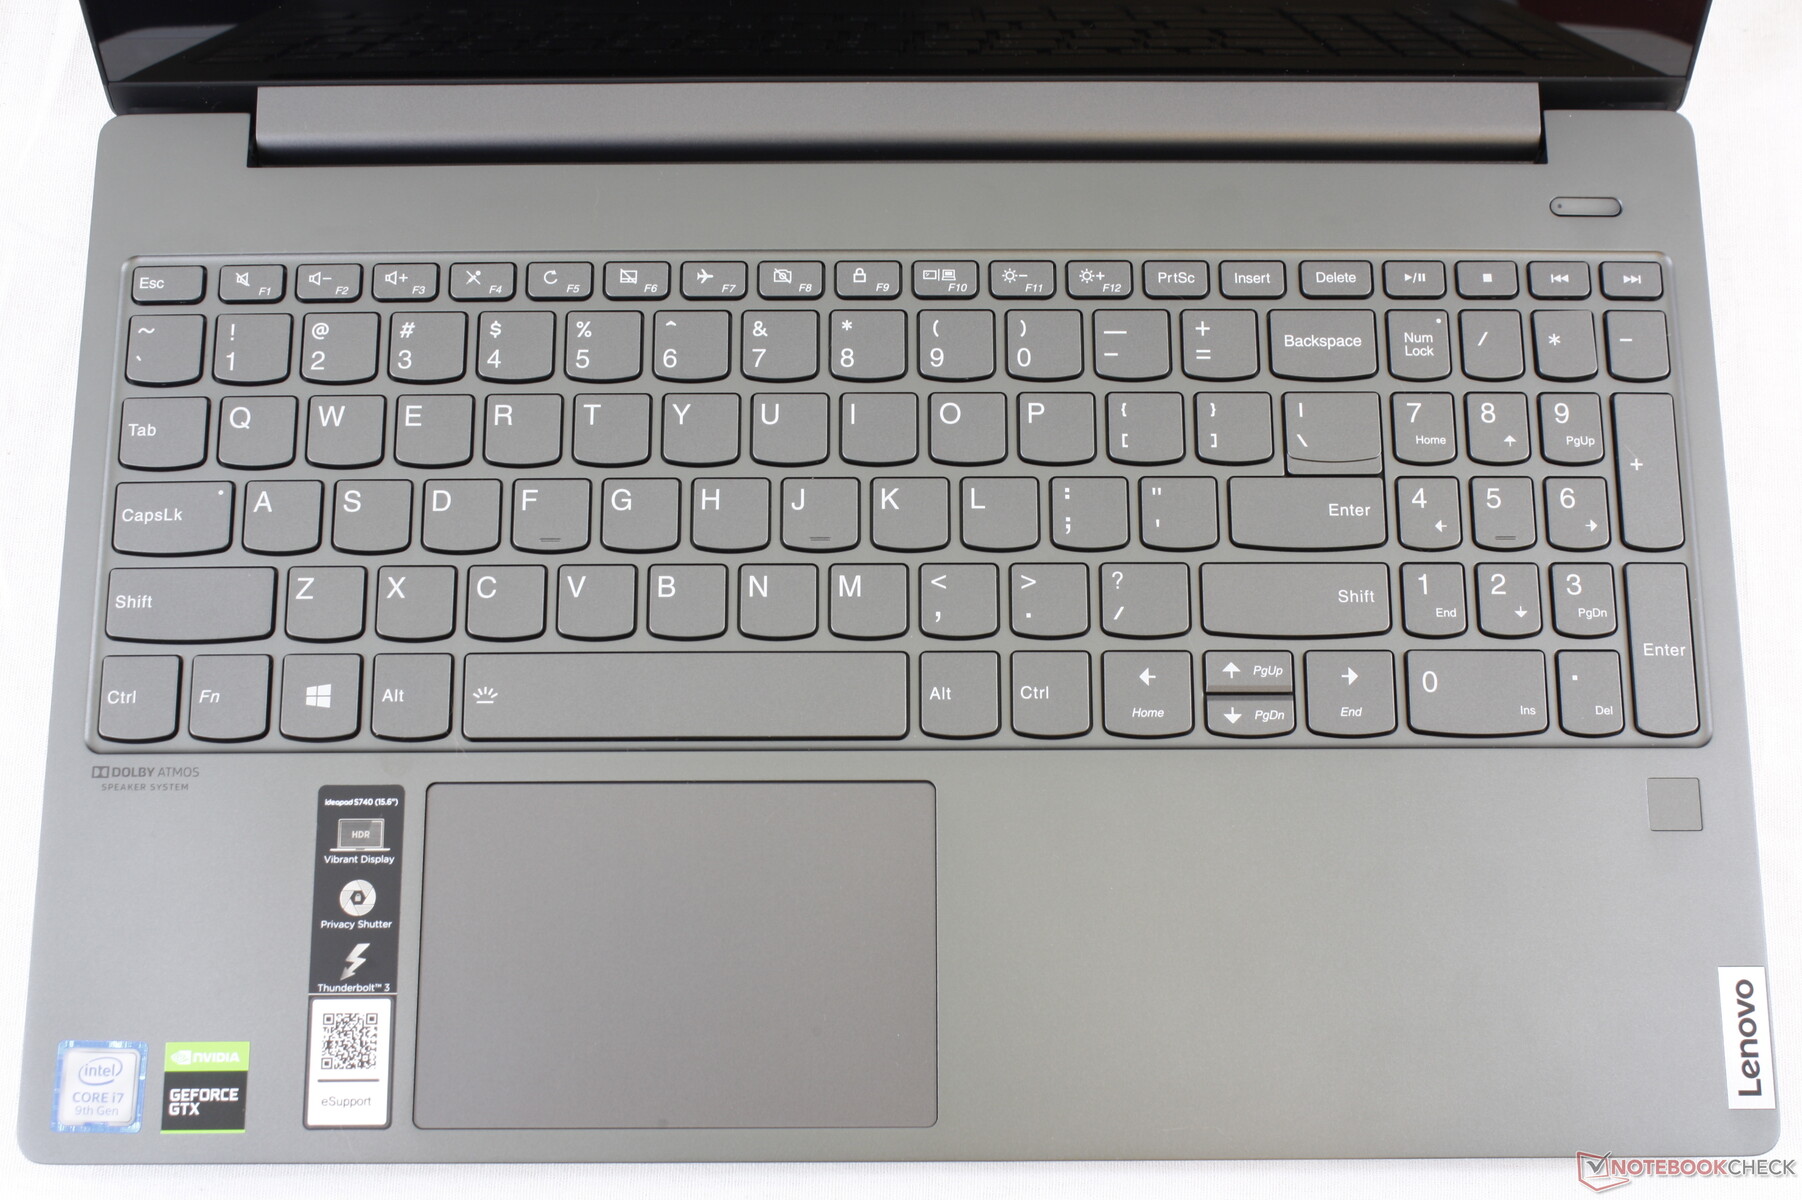
ThinkPad klavyeleri ile karşılaştırıldığında, IdeaPad klavyeleri daha zayıf geri bildirime sahip belirgin şekilde sığdır. Anahtarların daha sıkı ve yazmak için daha tatmin edici olduğu bir Spectre, XPS veya masaüstü PC'den geliyorsanız alışmak biraz zaman alacaktır. Bununla birlikte, Ultrabook'larda yazmaya zaten alışkınsanız, IdeaPad S740, özellikle Lenovo çoğu IdeaPad modelinde neredeyse aynı tuş kapaklarını kullandığından, o kadar farklı hissetmeyecektir.
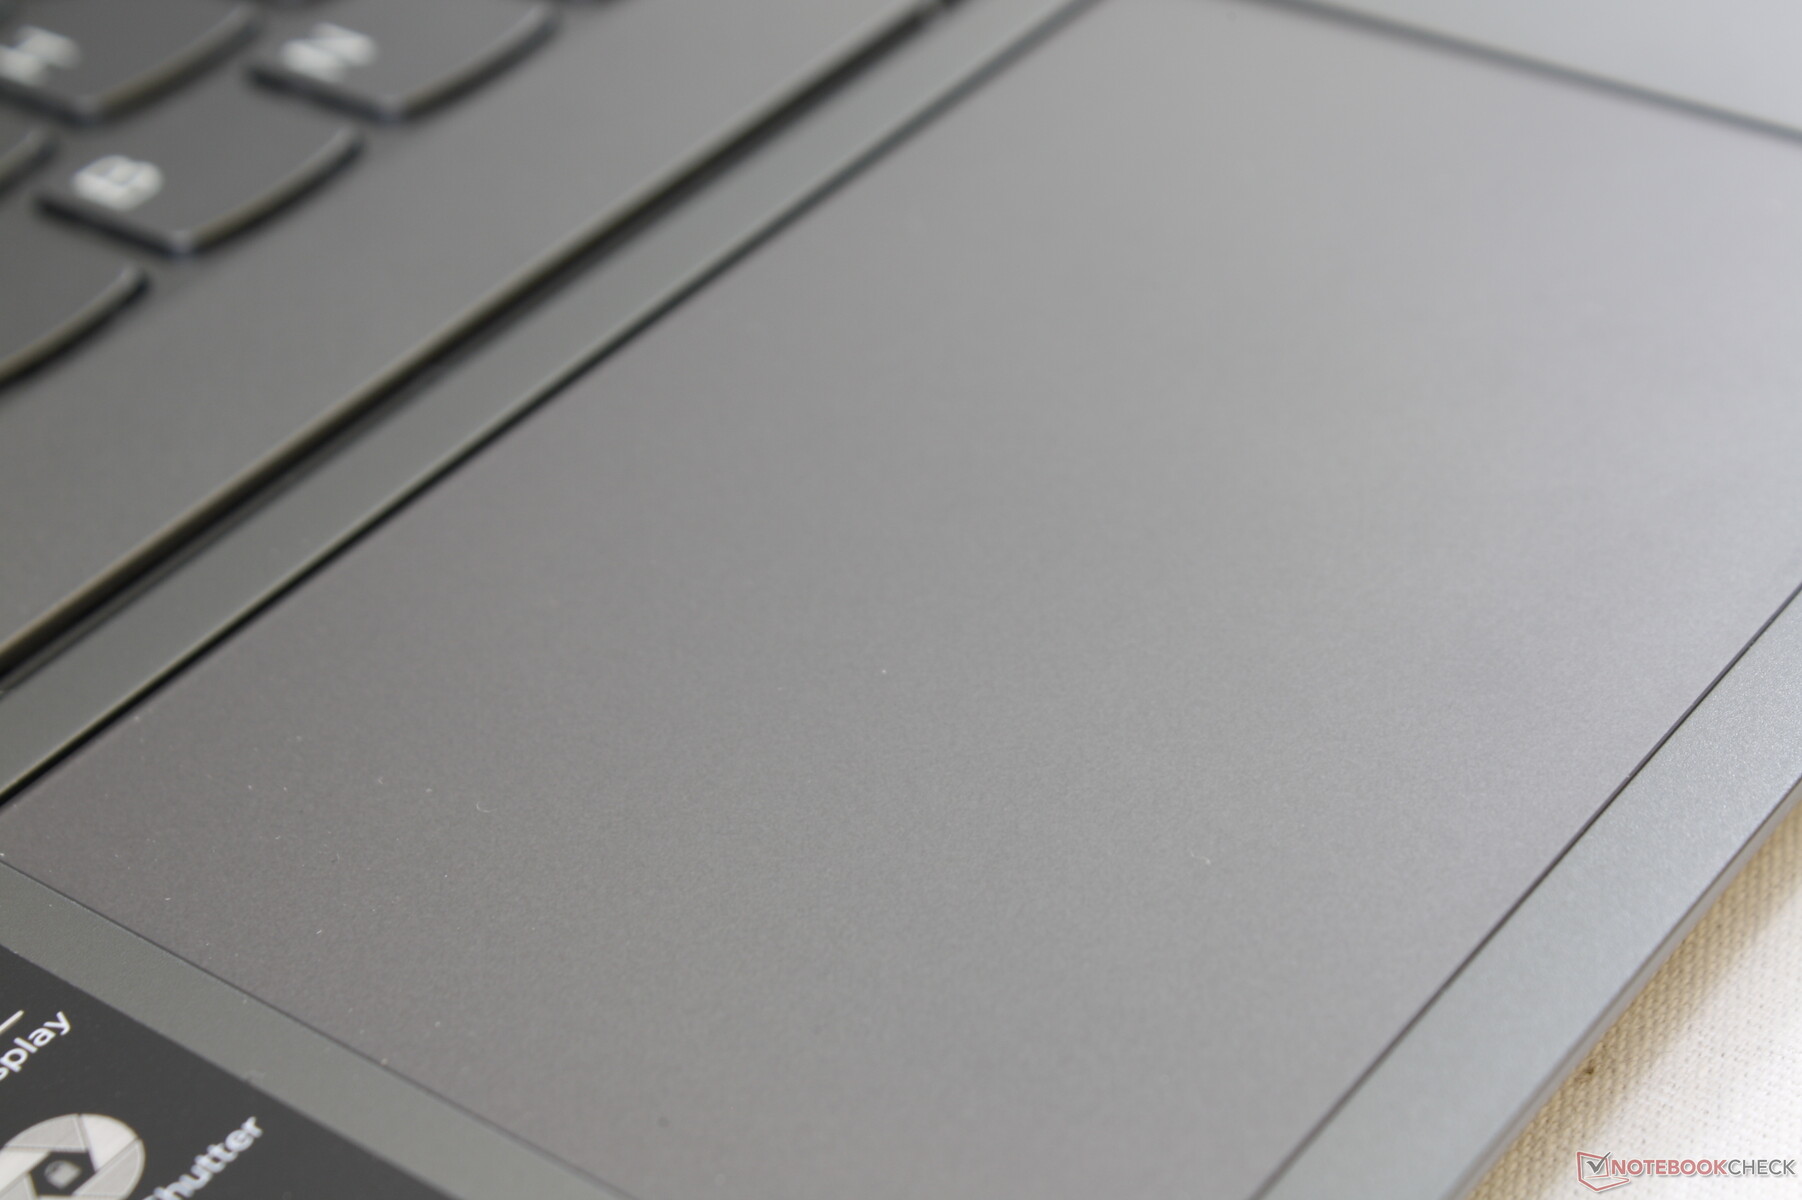
Dokunmatik
Tıklama alanı (10,5 x 7 cm) XPS 15'ten (10,5 x 8,5 cm) daha küçük ve 2019 Spectre x360 15'ten (12 x 6 cm) biraz daha büyük. Çok düşük hızlarda süzülürken yüzeyi diğer çoğu tıklama yüzeyinde olduğundan daha pürüzsüzdür. Entegre fare tuşları, yüksek perdeli işitsel tıklamaya rağmen zayıf geri bildirim ile seyahatte sığdır. Biz buna süngerimsi demesek de, özel ya da kayda değer bir şey de yok.

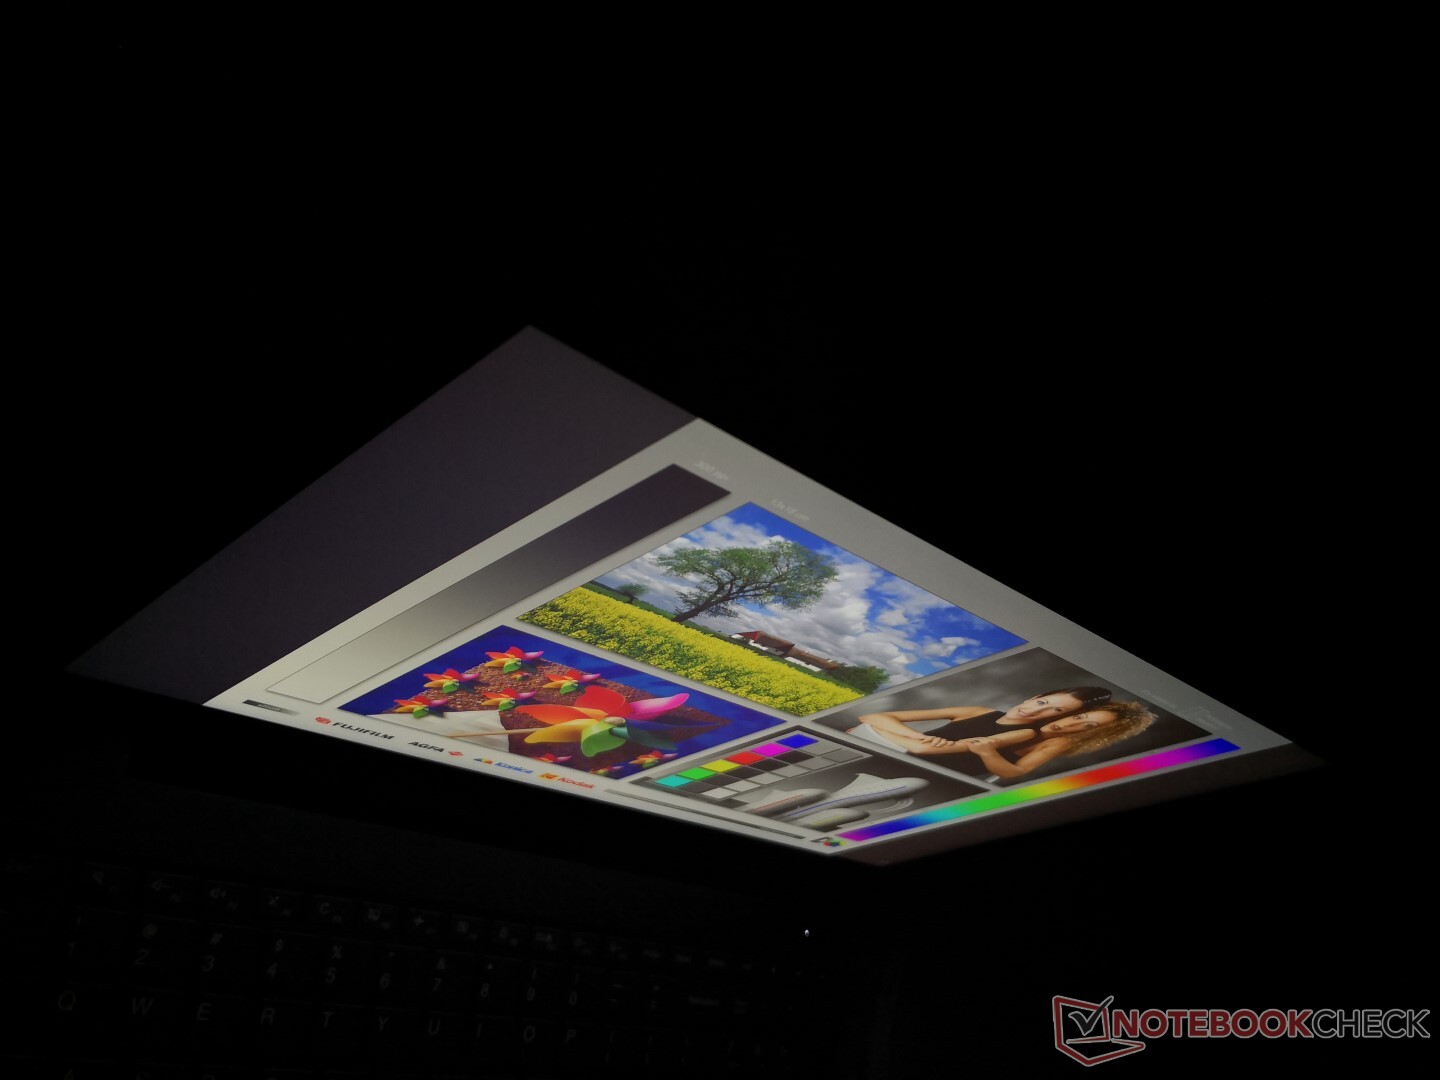
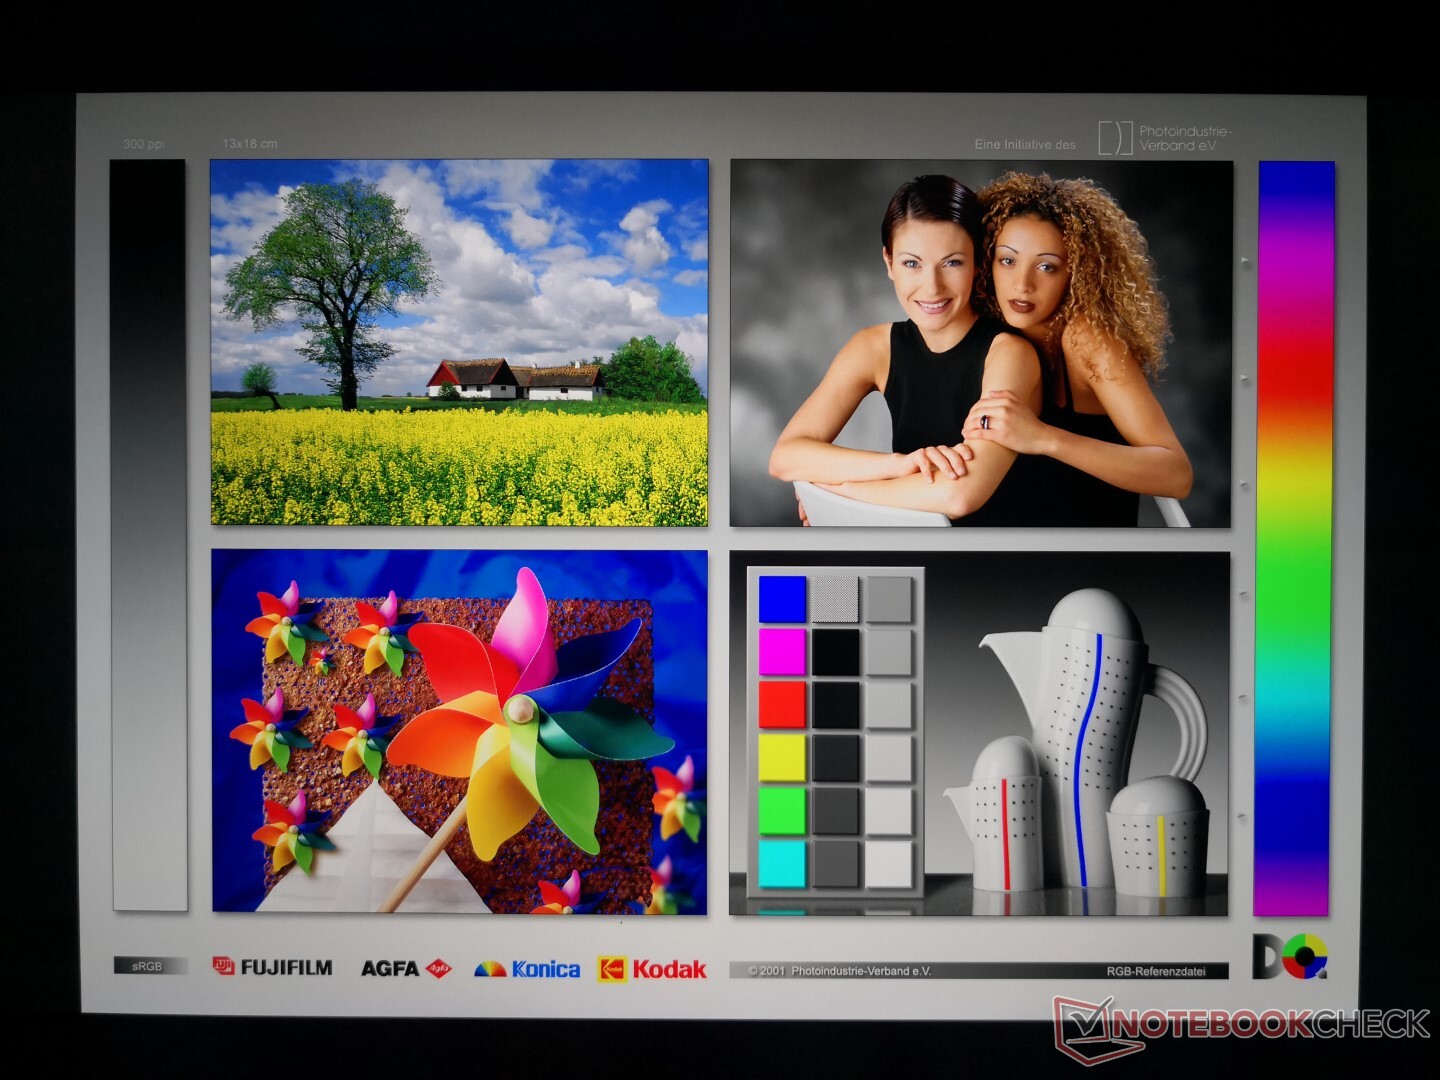
Görüntüle
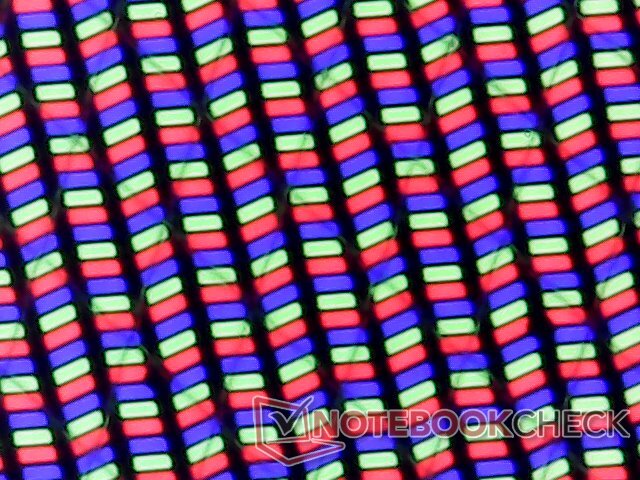
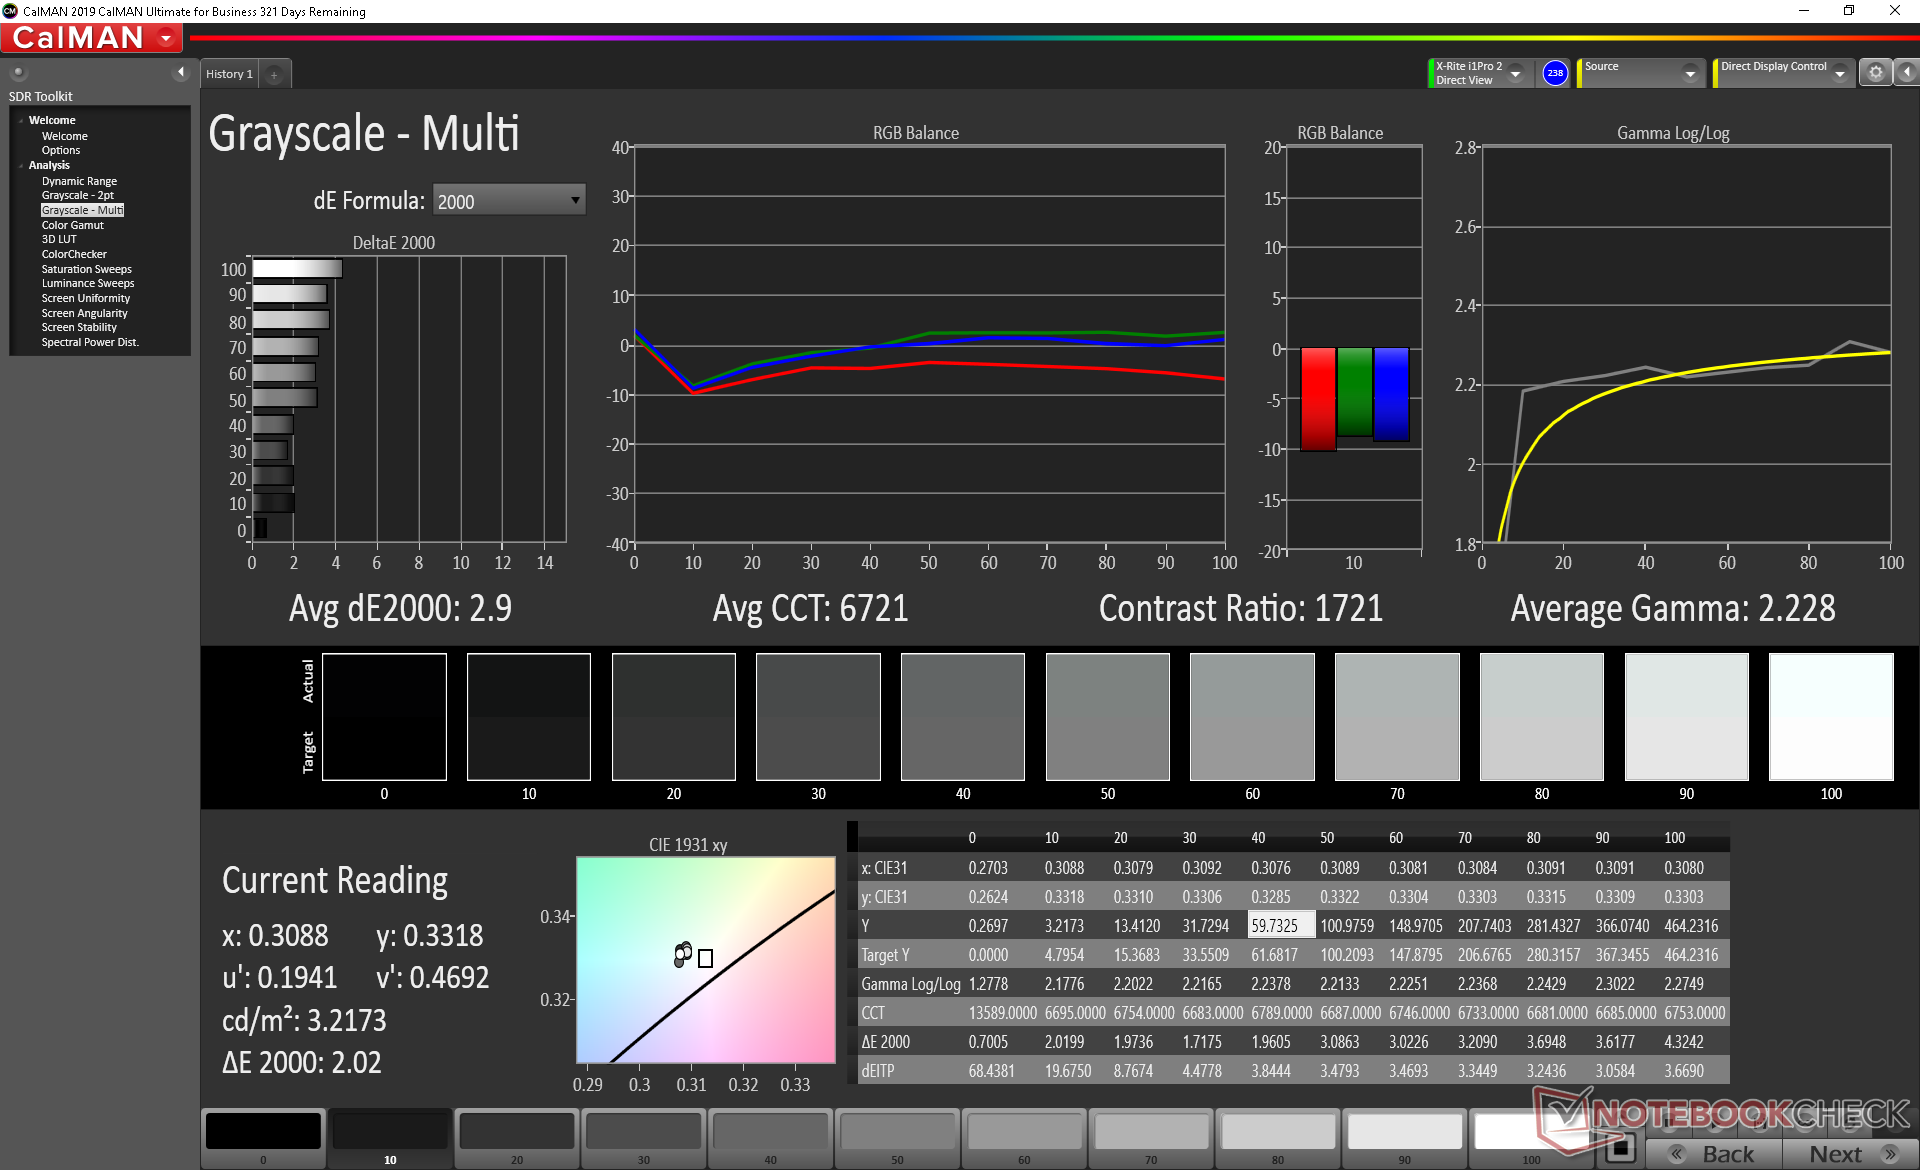
İki ekran seçeneği mevcuttur: 1080p veya 4K UHD Dolby Vision HDR. Her ikisi de 500 nit vaadiyle yeni MacBook Pro 16 kadar parlak olma vaadiyle parlıyor. Burada BOE HF NE156QUM-N55 IPS paneli, daha az fark edilir gölgeleme için HP Spectre x360 15'teki AU Optronics panelinden daha hızlı tepki süreleri sunuyor . Minimum düzensiz arka ışık kanaması ve amiral gemisi alternatifleriyle karşılaştırılabilir bir kontrast oranı ile yüksek kaliteli bir paneldir.

| |||||||||||||||||||||||||
Aydınlatma: 83 %
Batarya modunda parlaklık: 475.8 cd/m²
Kontrast: 1220:1 (Siyah: 0.39 cd/m²)
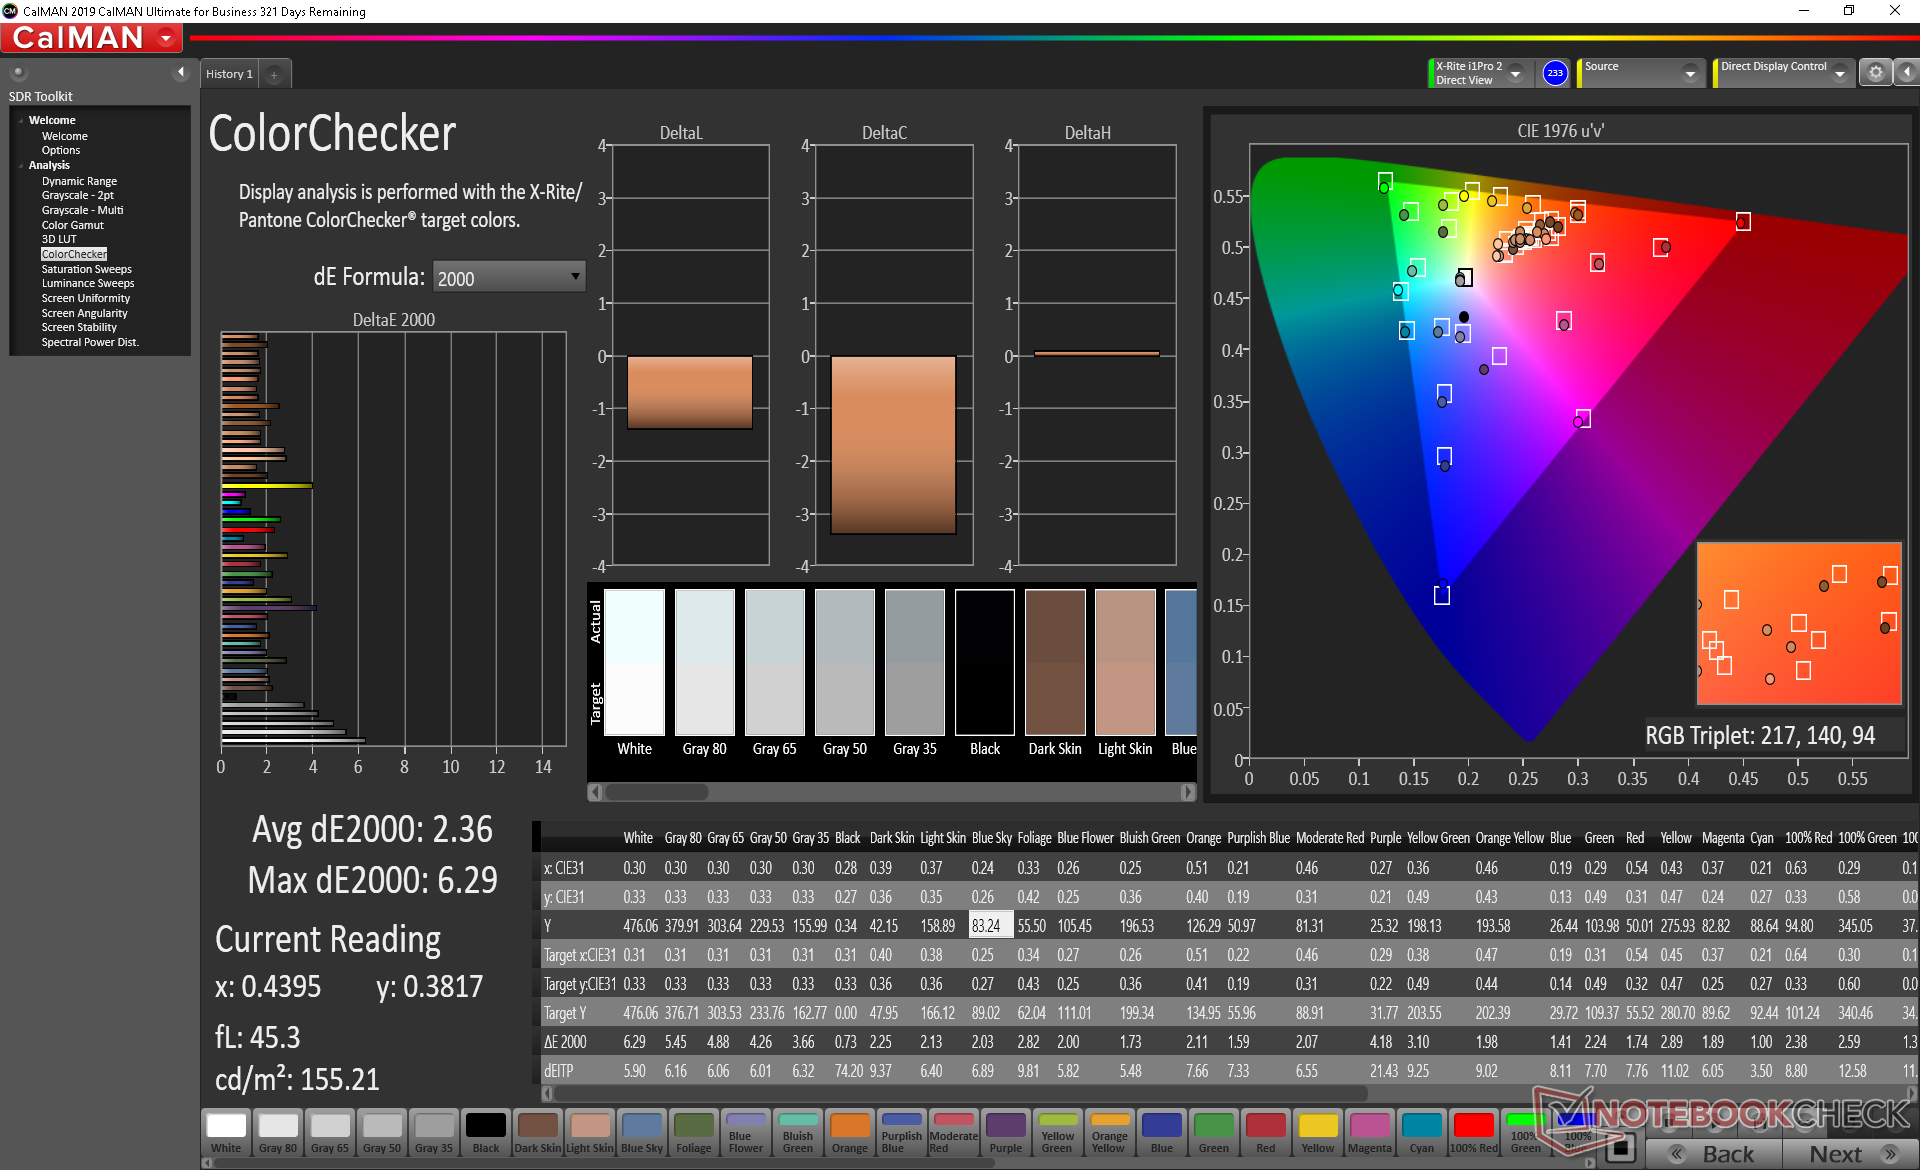
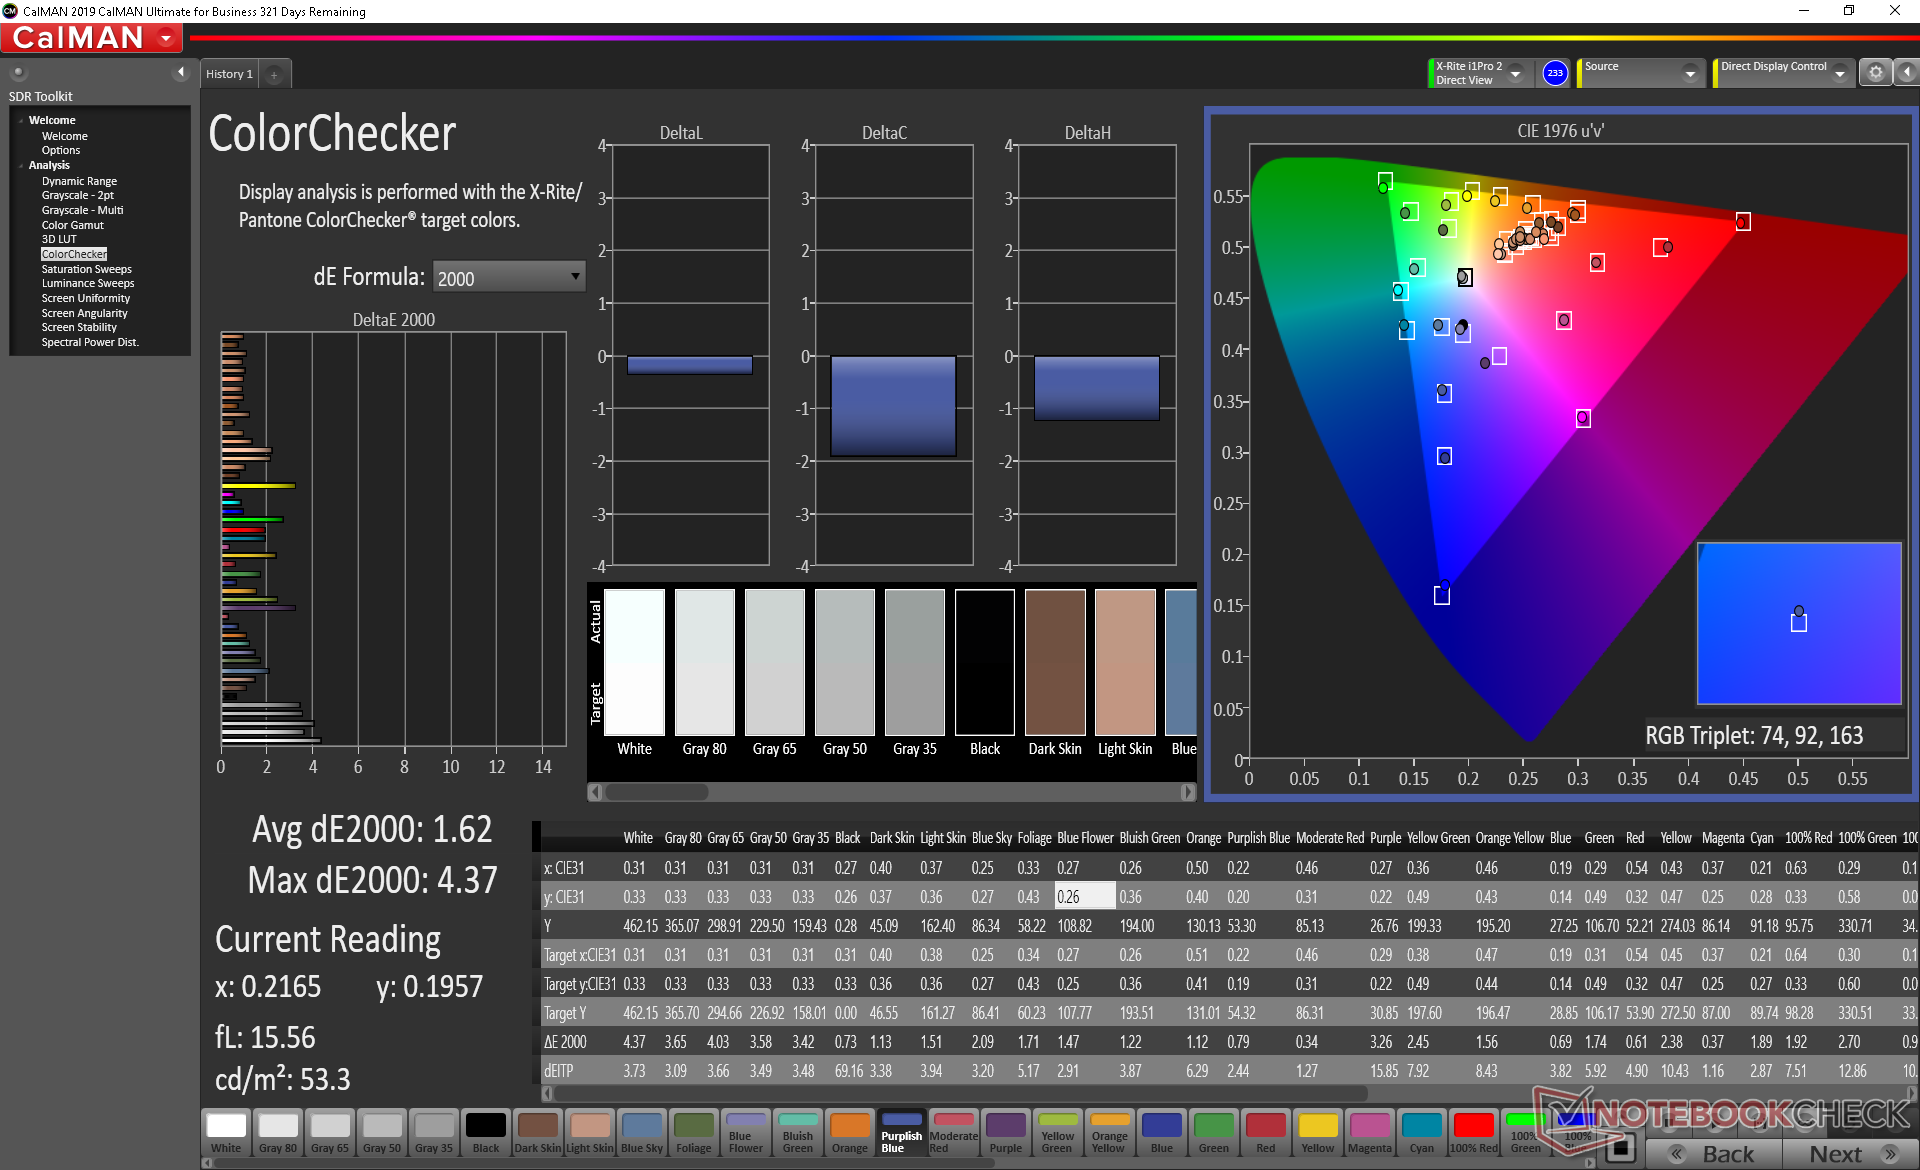
ΔE ColorChecker Calman: 2.36 | ∀{0.5-29.43 Ø4.71}
calibrated: 1.62
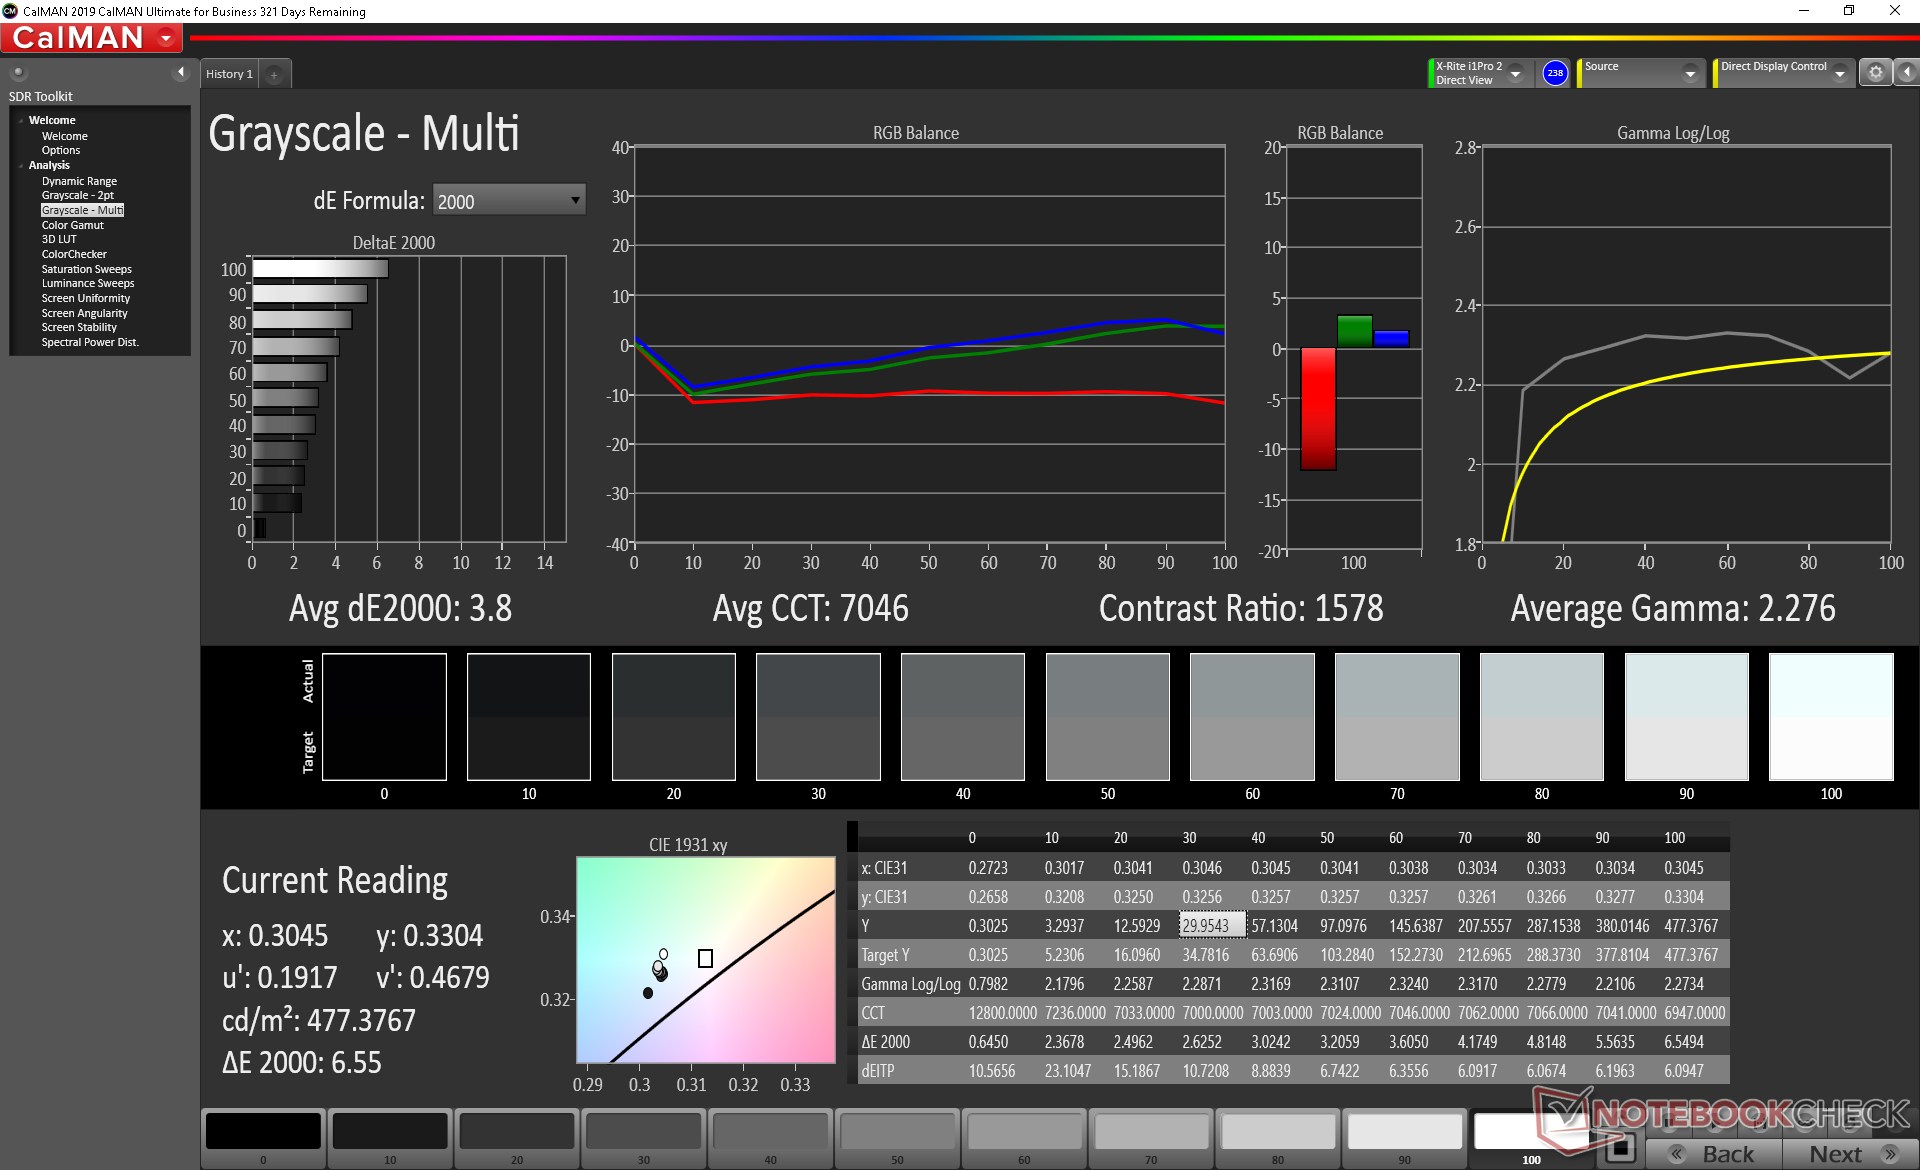
ΔE Greyscale Calman: 3.8 | ∀{0.09-98 Ø4.96}
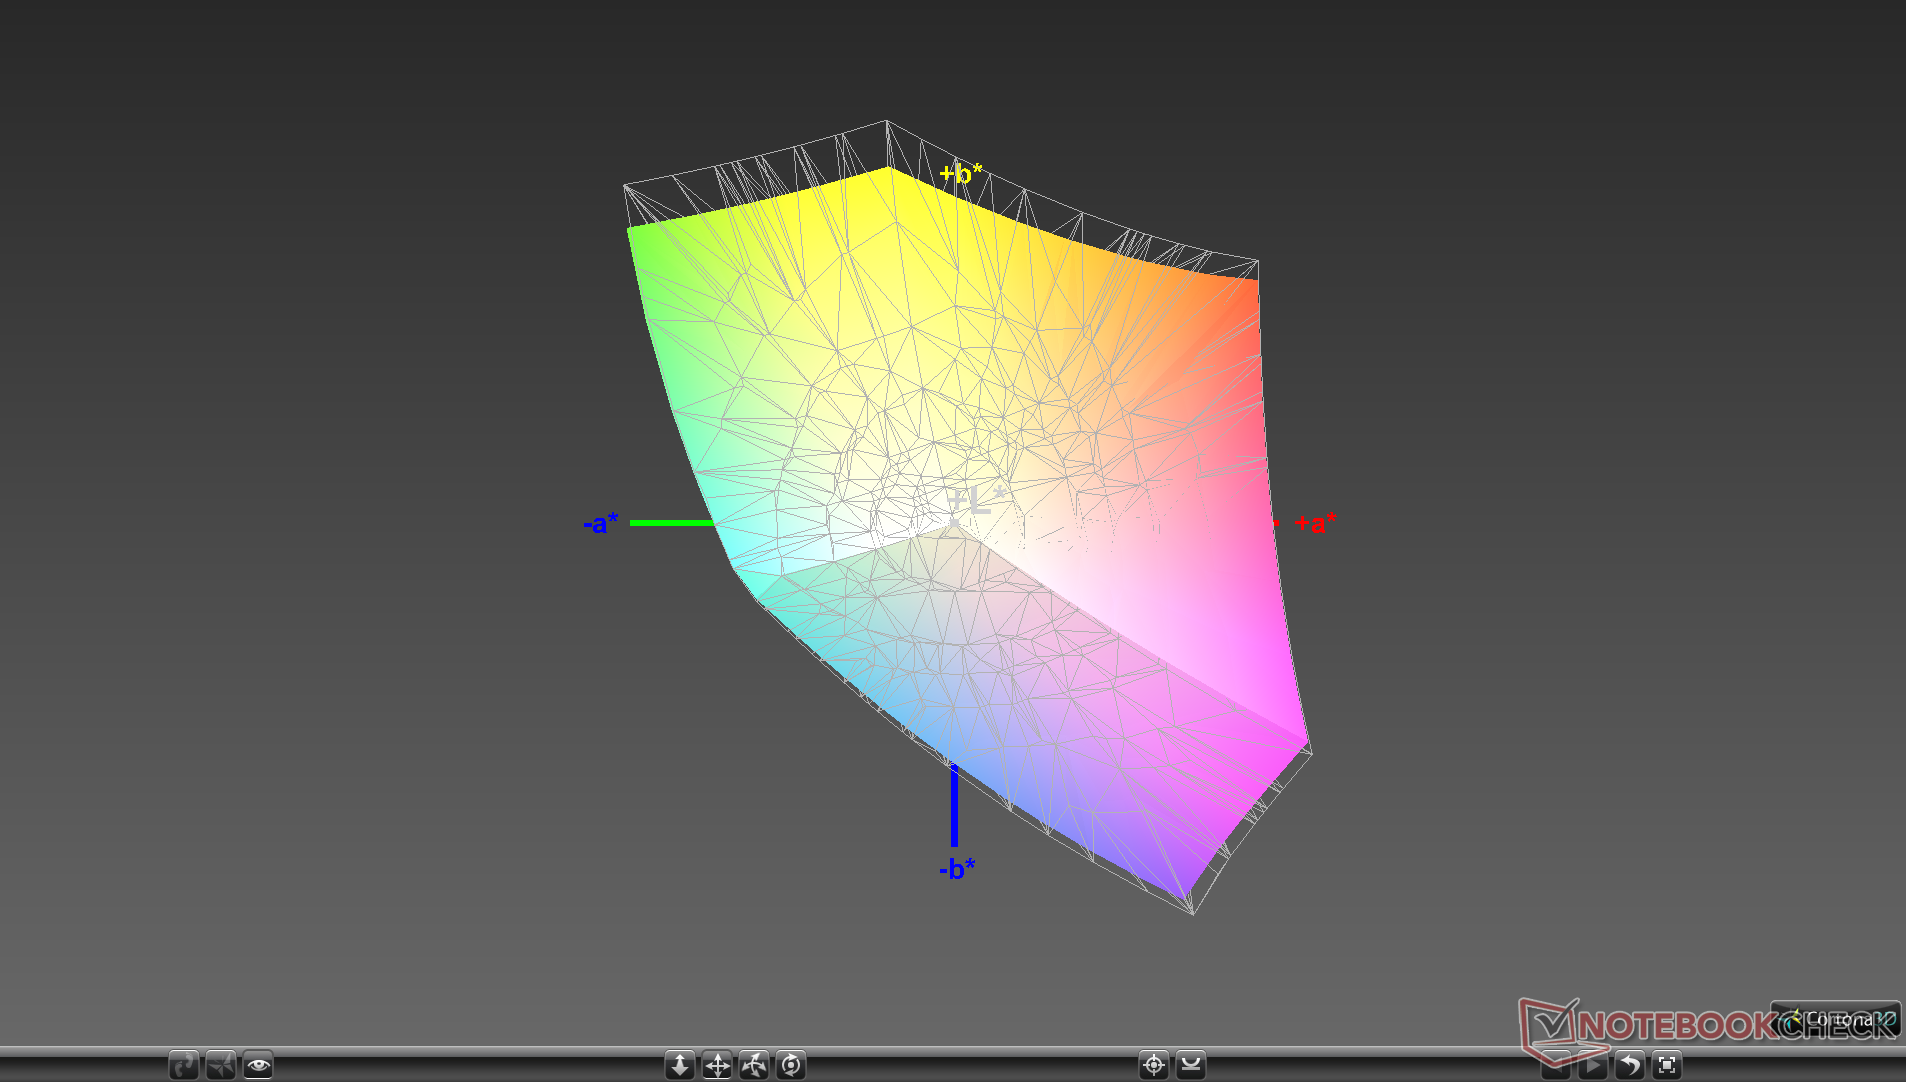
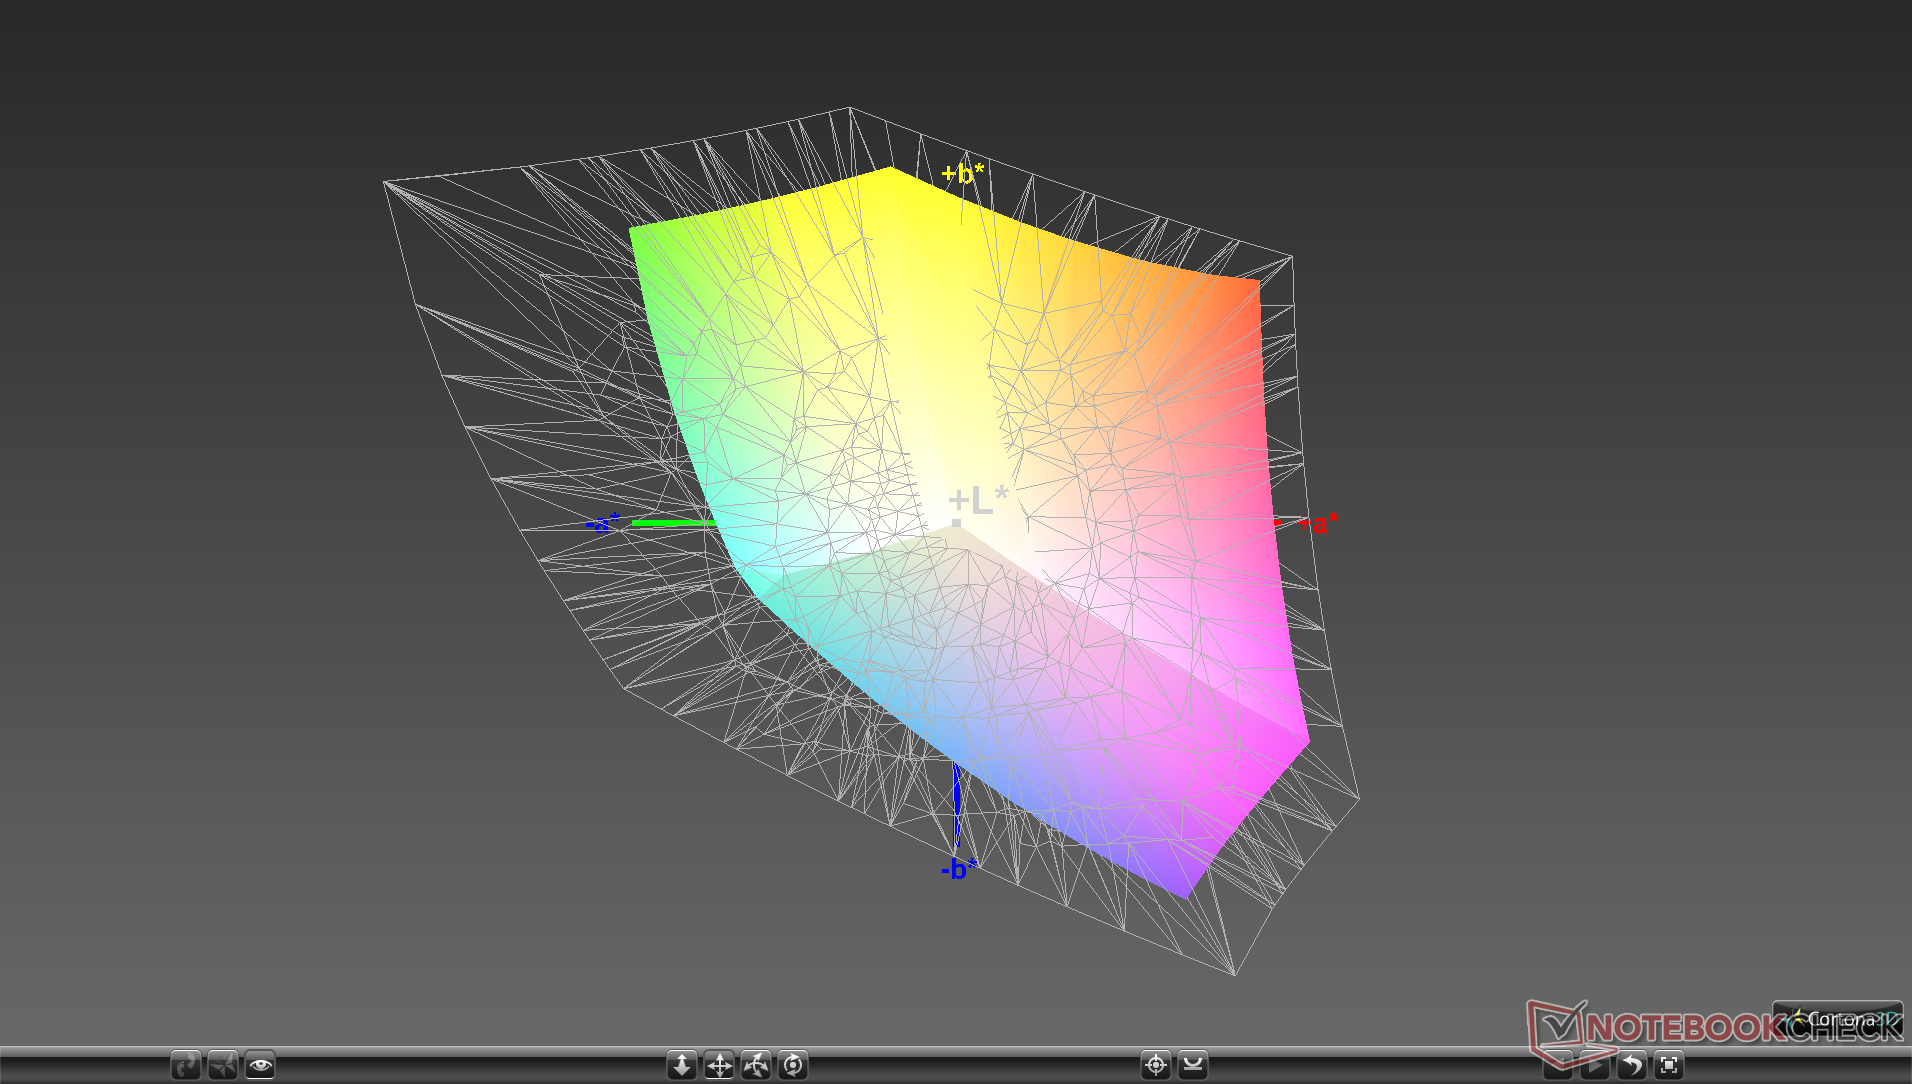
91.7% sRGB (Argyll 1.6.3 3D)
58% AdobeRGB 1998 (Argyll 1.6.3 3D)
63.1% AdobeRGB 1998 (Argyll 3D)
90.5% sRGB (Argyll 3D)
61.2% Display P3 (Argyll 3D)
Gamma: 2.28
CCT: 7046 K
| Lenovo IdeaPad S740-15IRH BOE HF NE156QUM-N55, IPS, 15.6", 3840x2160 | Dell XPS 15 7590 9980HK GTX 1650 Samsung 156WR04, SDCA029, OLED, 15.6", 3840x2160 | HP Spectre X360 15-5ZV31AV AU Optronics AUO30EB, IPS, 15.6", 3840x2160 | Lenovo Yoga 730-15IKB BOE HF NV156QUM-N51, IPS, 15.6", 3840x2160 | Asus ZenBook 15 UX534FT-DB77 BOE NV156FHM-N63, IPS, 15.6", 1920x1080 | MSI Prestige 15 A10SC Sharp LQ156D1JW42, IPS, 15.6", 3840x2160 | |
|---|---|---|---|---|---|---|
| Display | 33% | 8% | 5% | 3% | 32% | |
| Display P3 Coverage (%) | 61.2 | 88.1 44% | 68.3 12% | 68.7 12% | 66.6 9% | 82 34% |
| sRGB Coverage (%) | 90.5 | 99.6 10% | 94.3 4% | 90 -1% | 87.7 -3% | 98.3 9% |
| AdobeRGB 1998 Coverage (%) | 63.1 | 91.8 45% | 68.4 8% | 65.8 4% | 64.1 2% | 96.2 52% |
| Response Times | 93% | -46% | 12% | -12% | -50% | |
| Response Time Grey 50% / Grey 80% * (ms) | 40.4 ? | 2.3 ? 94% | 56.8 ? -41% | 34 ? 16% | 41.2 ? -2% | 60 ? -49% |
| Response Time Black / White * (ms) | 27.2 ? | 2.4 ? 91% | 40.8 ? -50% | 25 ? 8% | 33.2 ? -22% | 41.2 ? -51% |
| PWM Frequency (Hz) | 59.5 ? | 961 ? | 26040 ? | |||
| Screen | -22% | -13% | -19% | -39% | -8% | |
| Brightness middle (cd/m²) | 475.8 | 421.2 -11% | 284.6 -40% | 309 -35% | 312.6 -34% | 464.5 -2% |
| Brightness (cd/m²) | 439 | 417 -5% | 285 -35% | 299 -32% | 290 -34% | 451 3% |
| Brightness Distribution (%) | 83 | 94 13% | 85 2% | 84 1% | 85 2% | 92 11% |
| Black Level * (cd/m²) | 0.39 | 0.25 36% | 0.29 26% | 0.31 21% | 0.5 -28% | |
| Contrast (:1) | 1220 | 1138 -7% | 1066 -13% | 1008 -17% | 929 -24% | |
| Colorchecker dE 2000 * | 2.36 | 6.06 -157% | 3.52 -49% | 3.9 -65% | 5.78 -145% | 3.36 -42% |
| Colorchecker dE 2000 max. * | 6.29 | 11.89 -89% | 5.56 12% | 7.5 -19% | 8.86 -41% | 7.06 -12% |
| Colorchecker dE 2000 calibrated * | 1.62 | 3 -85% | 3.78 -133% | 3.42 -111% | ||
| Greyscale dE 2000 * | 3.8 | 2.8 26% | 3.2 16% | 4.58 -21% | 5.4 -42% | 1.3 66% |
| Gamma | 2.28 96% | 2.15 102% | 2.28 96% | 2.43 91% | 2.21 100% | 2.14 103% |
| CCT | 7046 92% | 6235 104% | 7070 92% | 7344 89% | 7864 83% | 6596 99% |
| Color Space (Percent of AdobeRGB 1998) (%) | 58 | 81 40% | 61.1 5% | 39 -33% | 57.1 -2% | 84.8 46% |
| Color Space (Percent of sRGB) (%) | 91.7 | 99.6 9% | 93.8 2% | 90 -2% | 87.4 -5% | 98.3 7% |
| Toplam Ortalama (Program / Ayarlar) | 35% /
8% | -17% /
-13% | -1% /
-10% | -16% /
-28% | -9% /
-6% |
* ... daha küçük daha iyidir
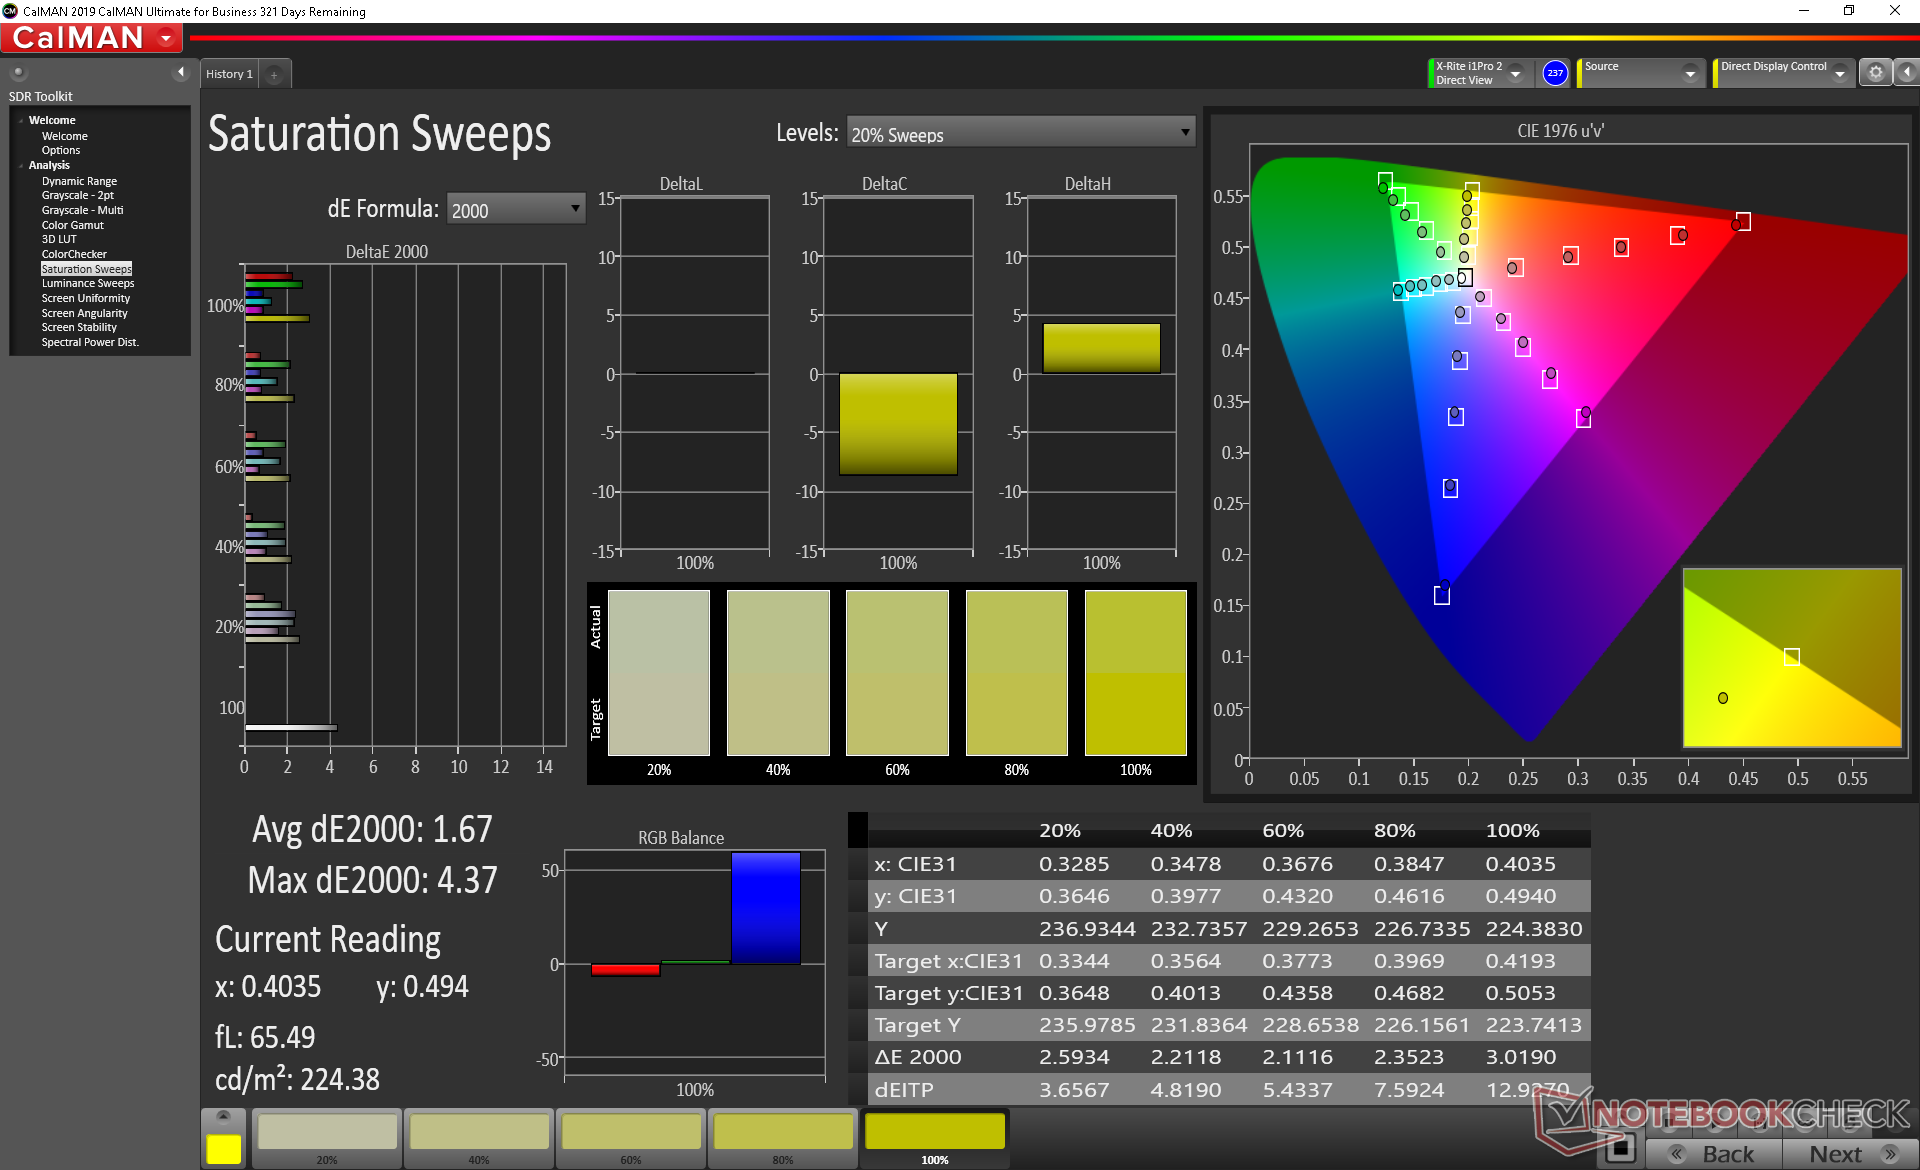
Renk alanı, 2019 sonunda HP Spectre x360 15'teki 4K UHD panel ile karşılaştırılabilir olmak için sırasıyla sRGB ve AdobeRGB standartlarının yaklaşık yüzde 92'sini ve yüzde 58'ini kapsıyor. Daha derin ve daha doğru renkler isteyen kullanıcılar, Sharp'lı diğer dizüstü bilgisayarları da düşünmelidir Razer Blade 15 veya Dell XPS 15 gibi IGZO veya OLED seçenekleri.
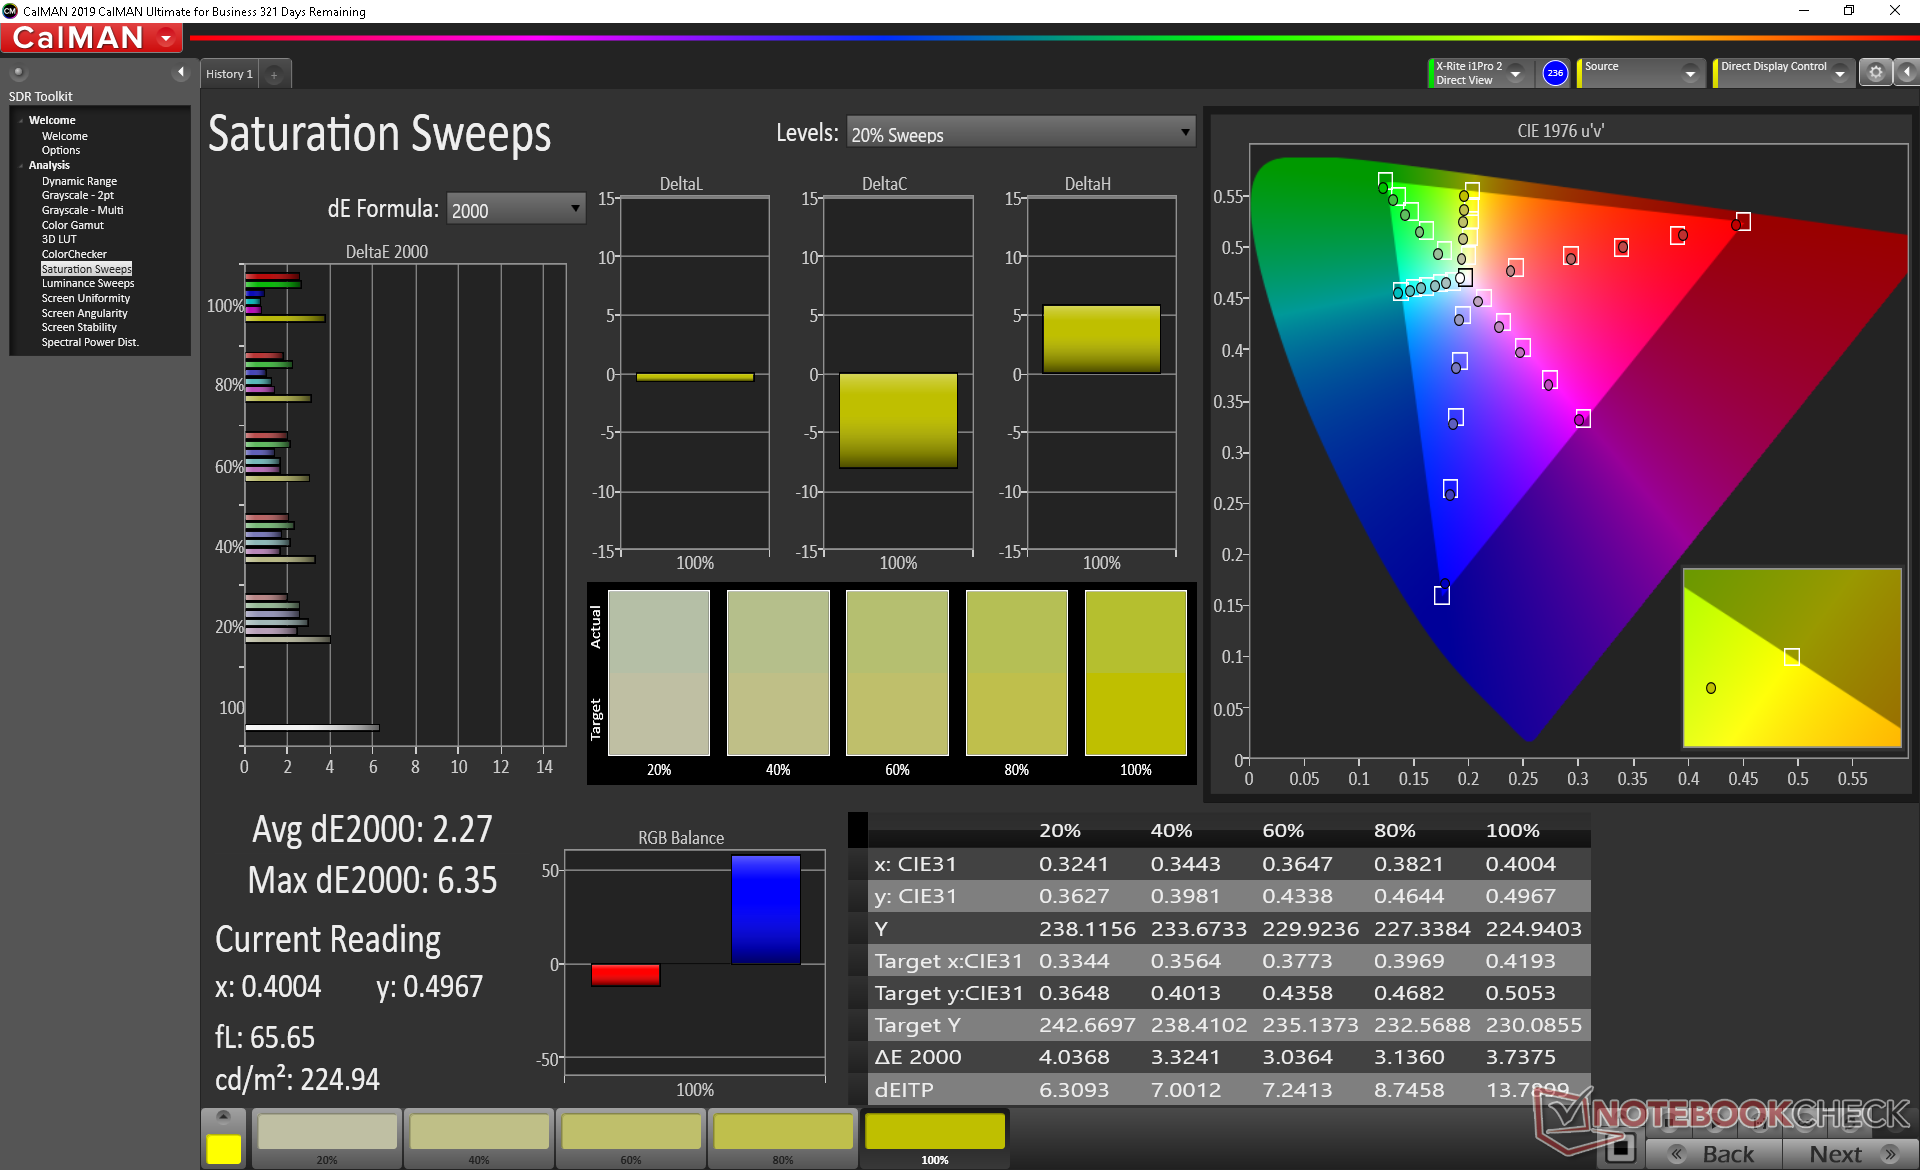
X-Rite kolorimetresi ile yapılan diğer ölçümler kutudan iyi gri tonlamalı ve renkler gösterir. Bununla birlikte, renk sıcaklığı 7000'in biraz üzerinde biraz fazla soğuk. Kendi kalibrasyonumuz bunu biraz daha doğru bir ekran için ele alıyor.
Yanıt Sürelerini Görüntüle
| ↔ Tepki Süresi Siyahtan Beyaza | ||
|---|---|---|
| 27.2 ms ... yükseliş ↗ ve sonbahar↘ birleşimi | ↗ 14.8 ms yükseliş | 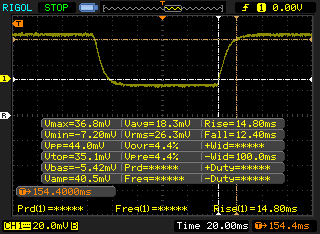 |
| ↘ 12.4 ms sonbahar | ||
| Ekran, testlerimizde nispeten yavaş yanıt oranları gösteriyor ve oyuncular için çok yavaş olabilir. Karşılaştırıldığında, test edilen tüm cihazlar 0.1 (minimum) ile 240 (maksimum) ms arasında değişir. » Tüm cihazların 69 %'si daha iyi. Bu, ölçülen yanıt süresinin test edilen tüm cihazların ortalamasından (19.8 ms) daha kötü olduğu anlamına gelir. | ||
| ↔ Tepki Süresi %50 Griden %80 Griye | ||
| 40.4 ms ... yükseliş ↗ ve sonbahar↘ birleşimi | ↗ 18 ms yükseliş | 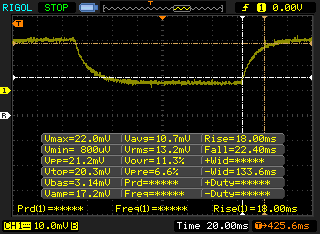 |
| ↘ 22 ms sonbahar | ||
| Ekran, testlerimizde yavaş yanıt oranları gösteriyor ve oyuncular için yetersiz olacaktır. Karşılaştırıldığında, test edilen tüm cihazlar 0.165 (minimum) ile 636 (maksimum) ms arasında değişir. » Tüm cihazların 64 %'si daha iyi. Bu, ölçülen yanıt süresinin test edilen tüm cihazların ortalamasından (30.9 ms) daha kötü olduğu anlamına gelir. | ||
Ekran Titremesi / PWM (Darbe Genişliği Modülasyonu)
| Ekran titriyor / PWM algılanmadı | 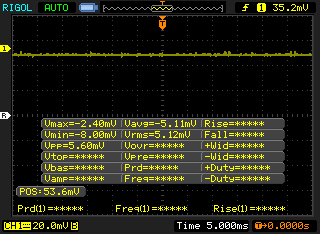 | ||
Karşılaştırıldığında: Test edilen tüm cihazların %52 %'si ekranı karartmak için PWM kullanmıyor. PWM tespit edilirse, ortalama 7741 (minimum: 5 - maksimum: 343500) Hz ölçüldü. | |||
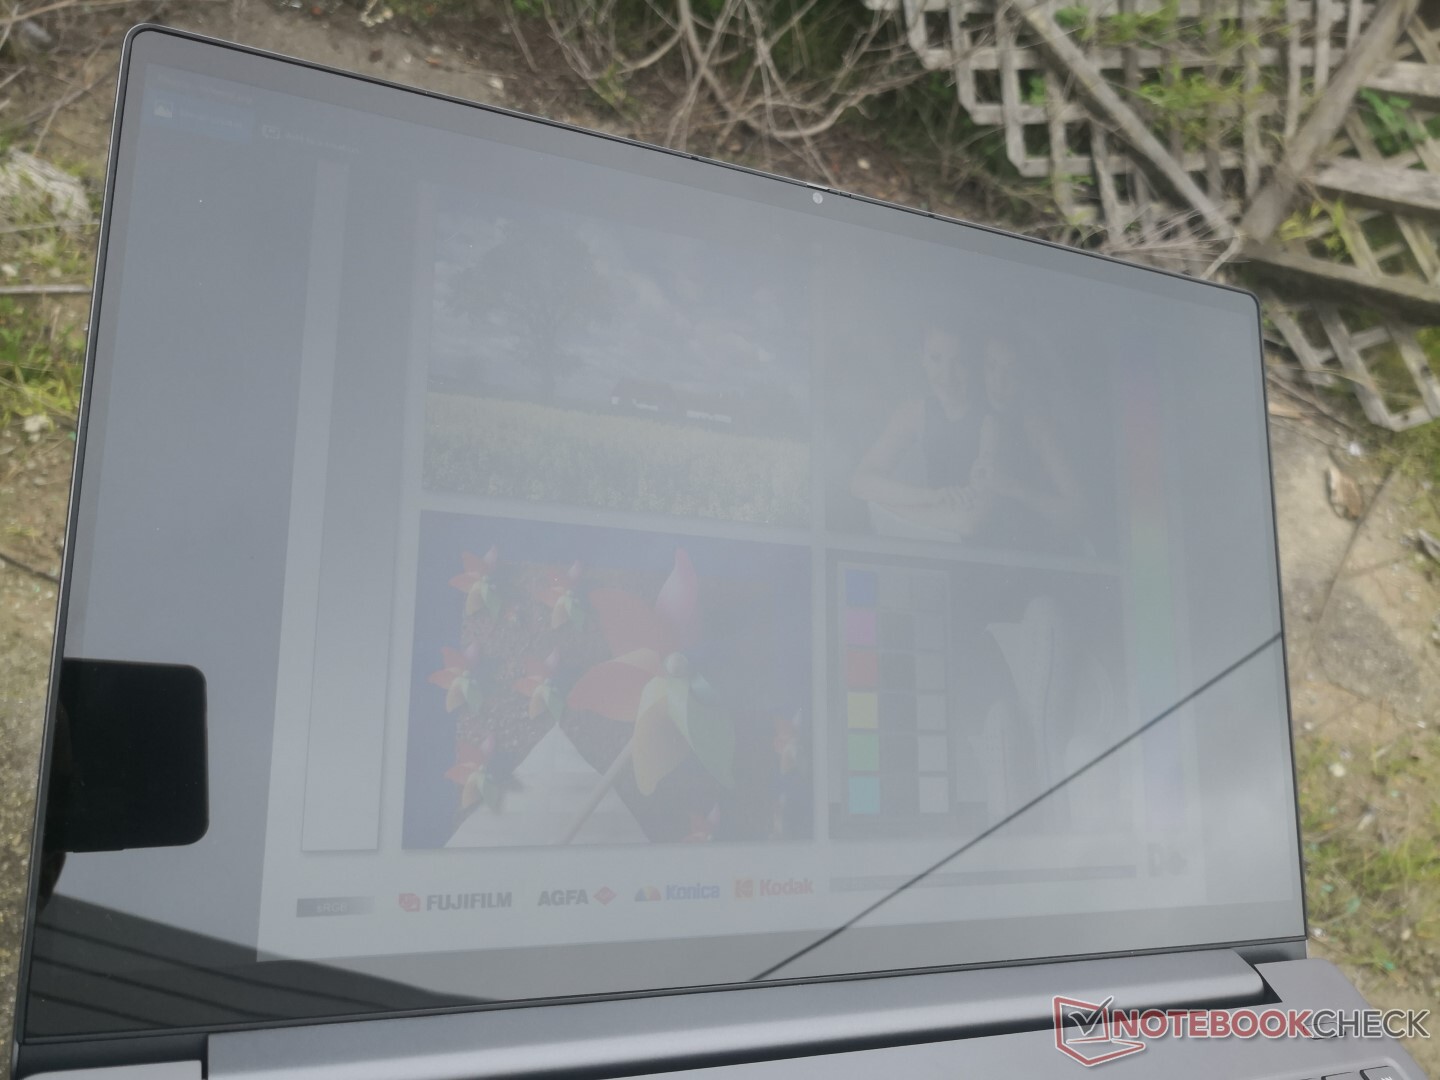
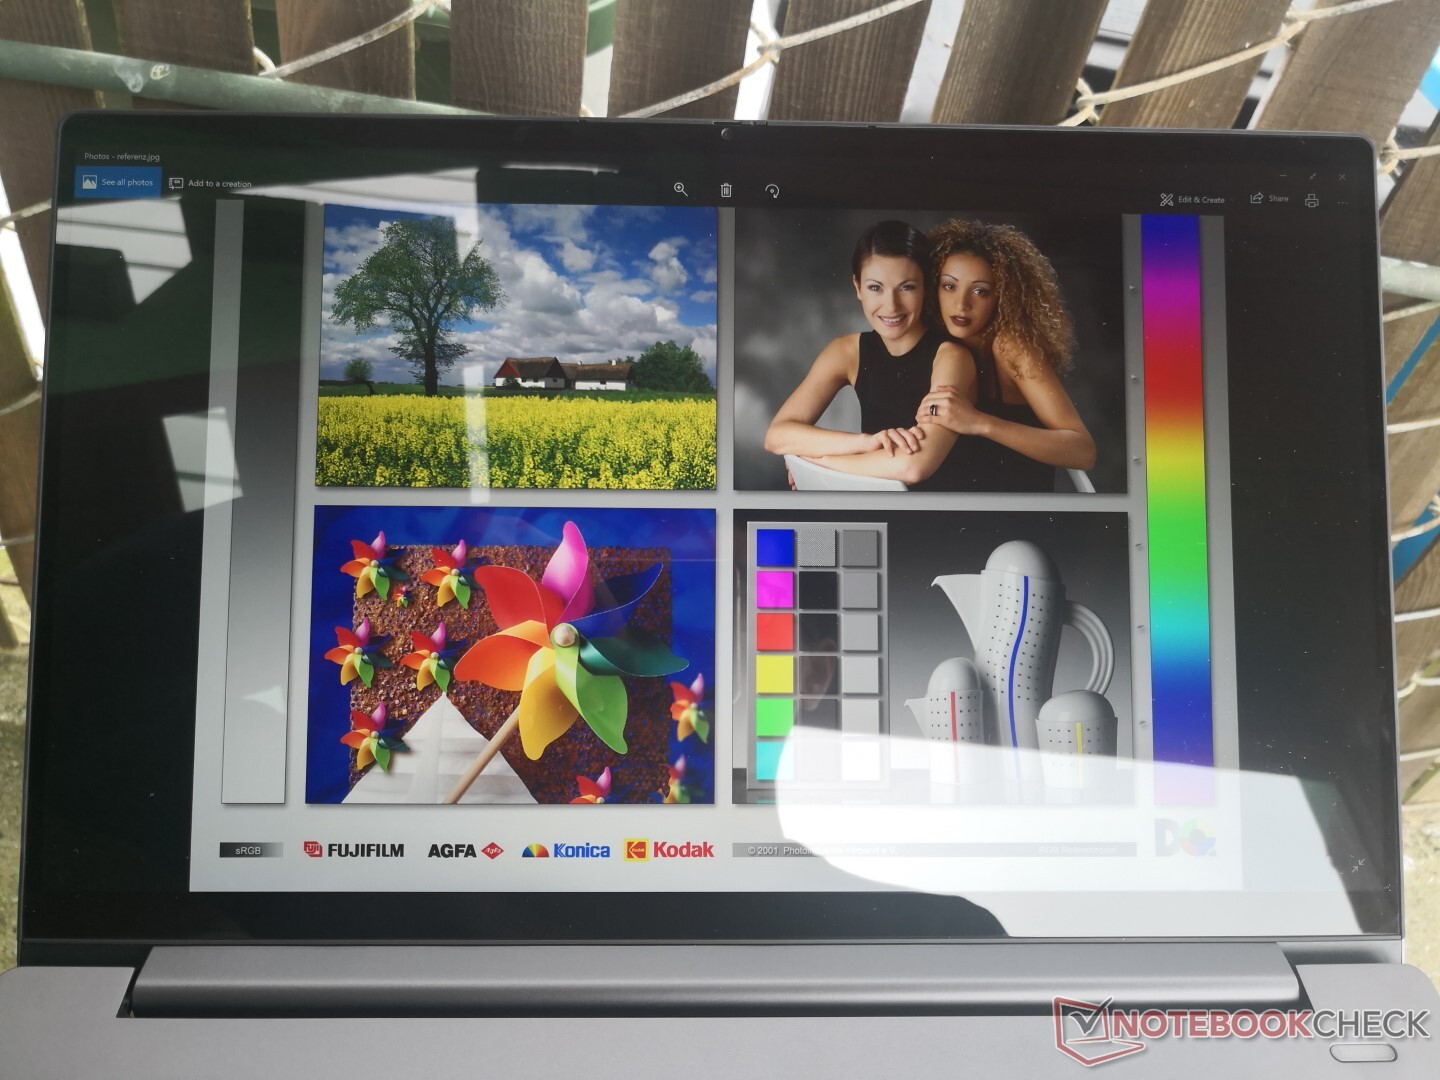
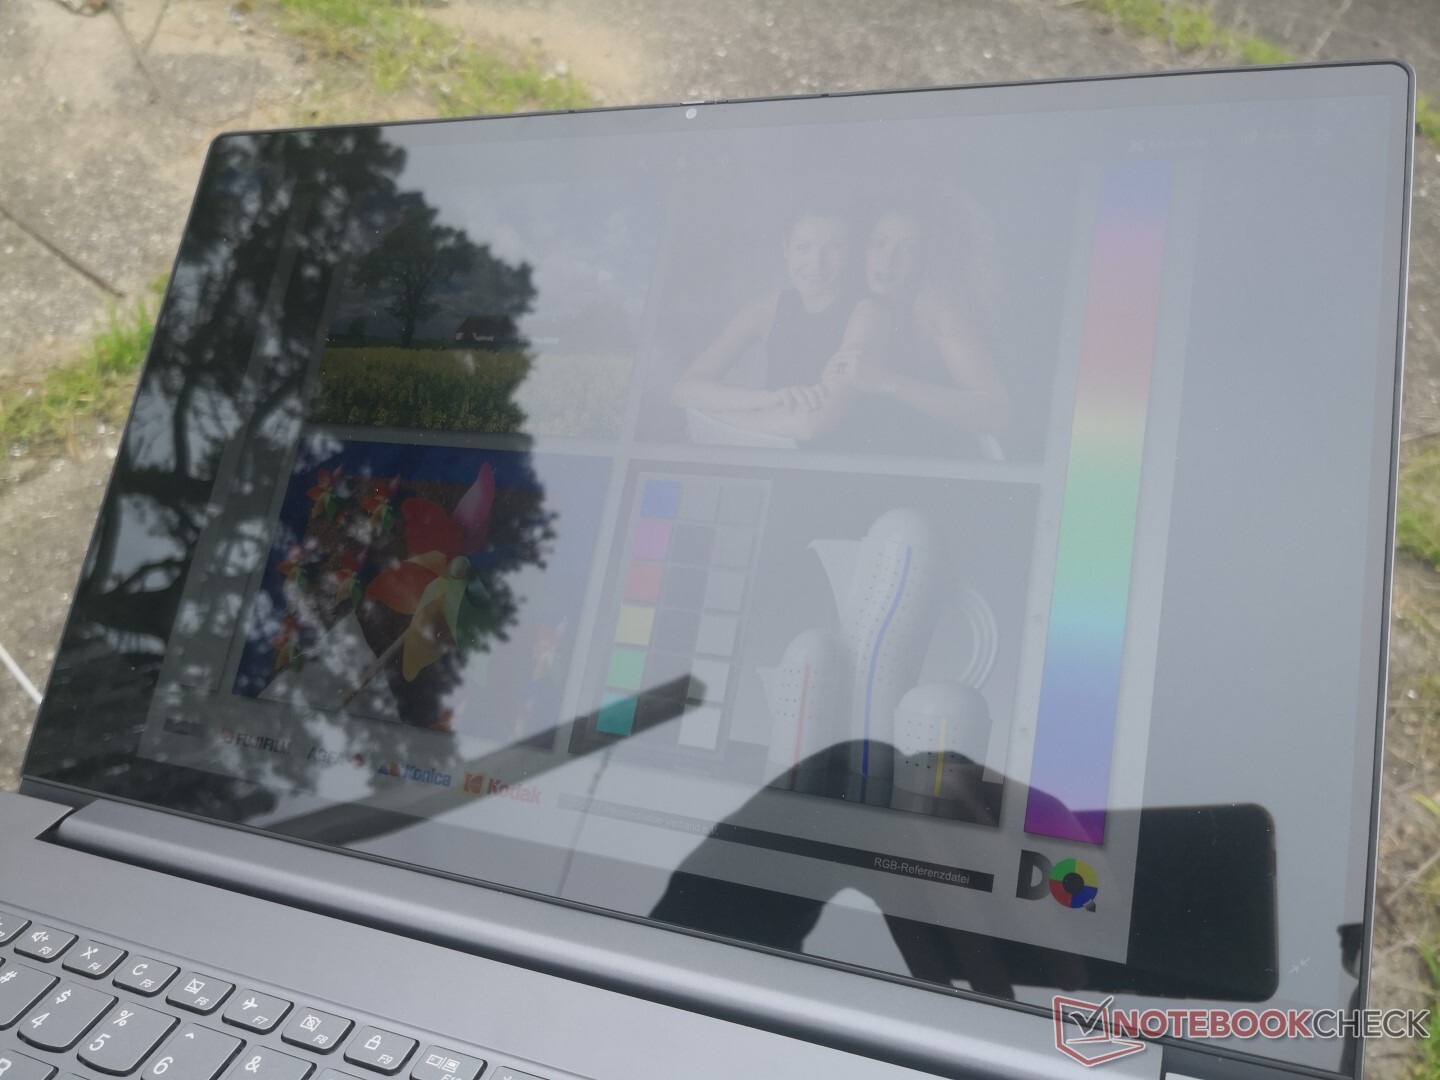
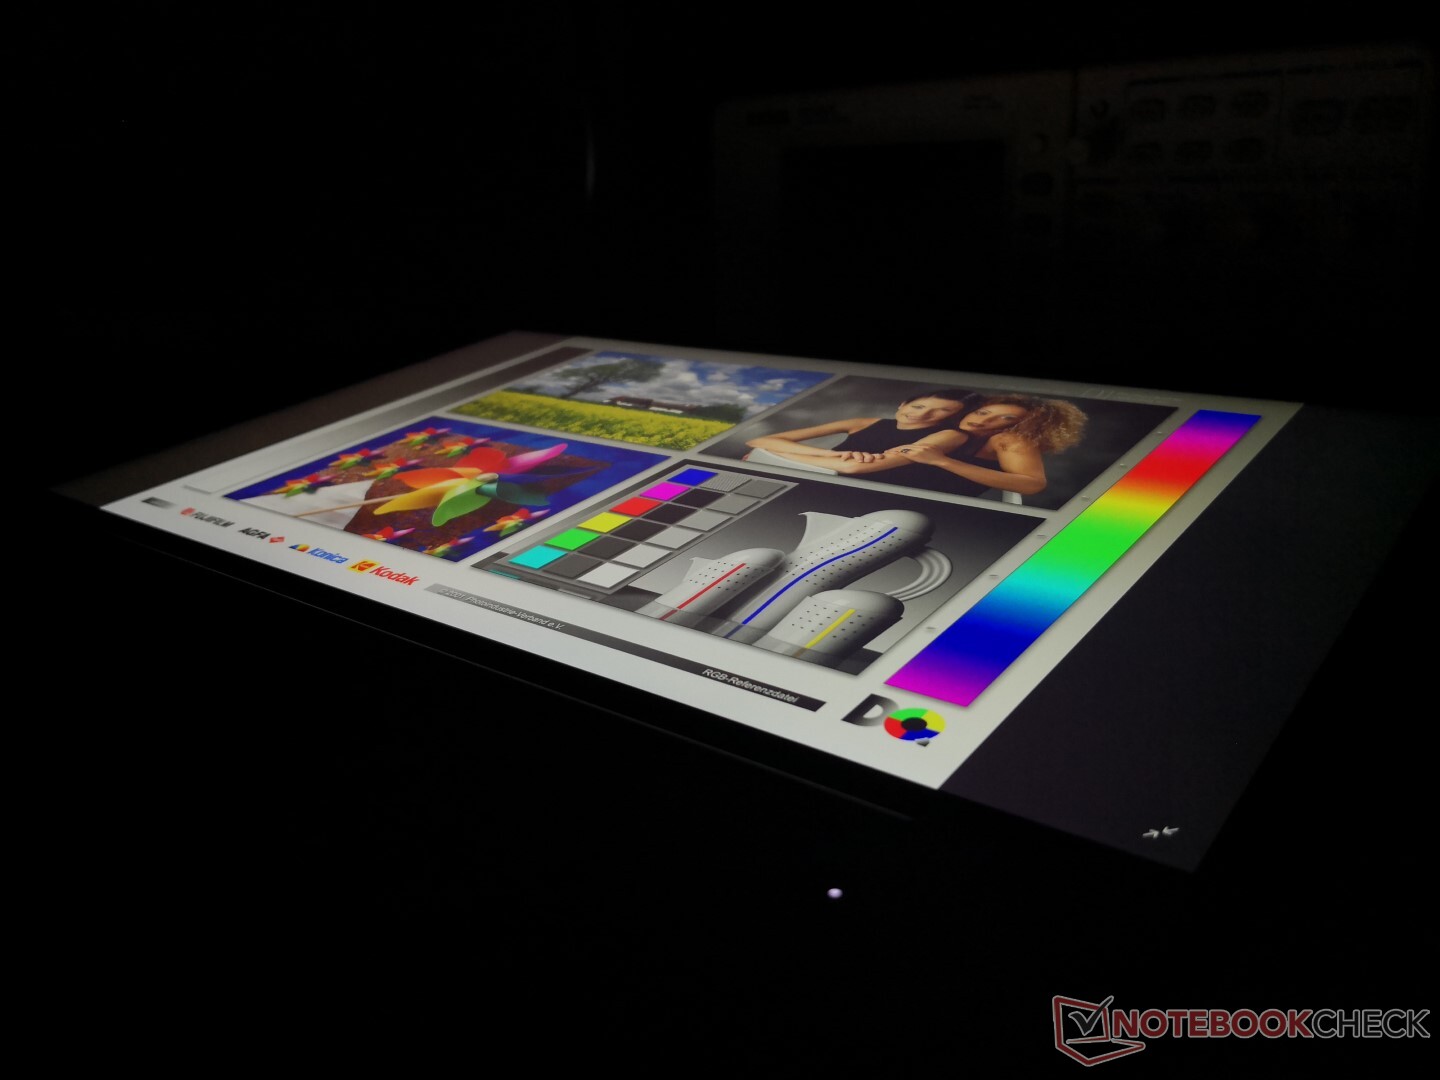
Dış mekan görünürlüğü, Lenovo'nun daha parlak arka ışığı nedeniyle diğer Ultrabook'ların çoğundan daha iyidir. Yine de, parlak ekran nedeniyle parlamaya hazır olun. Gölgede çalışmak, dış mekanlarda en iyi seçenek olmaya devam eder.
Verim
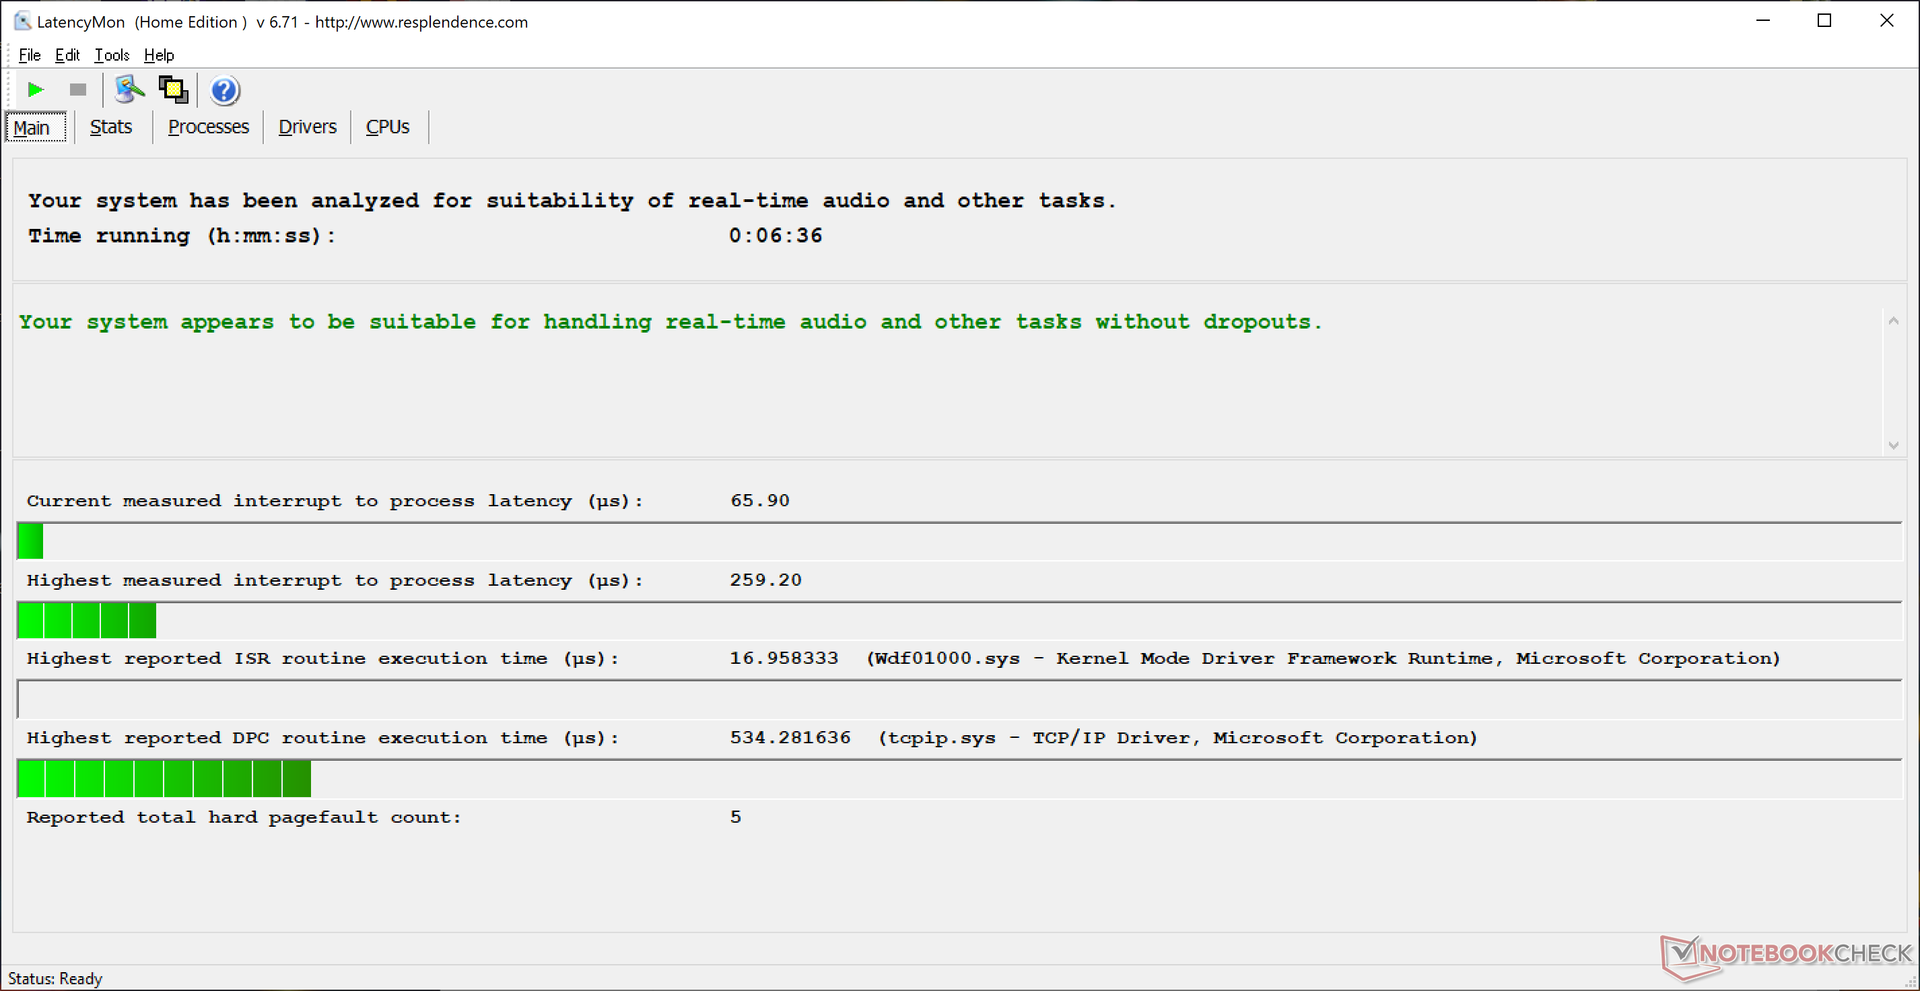
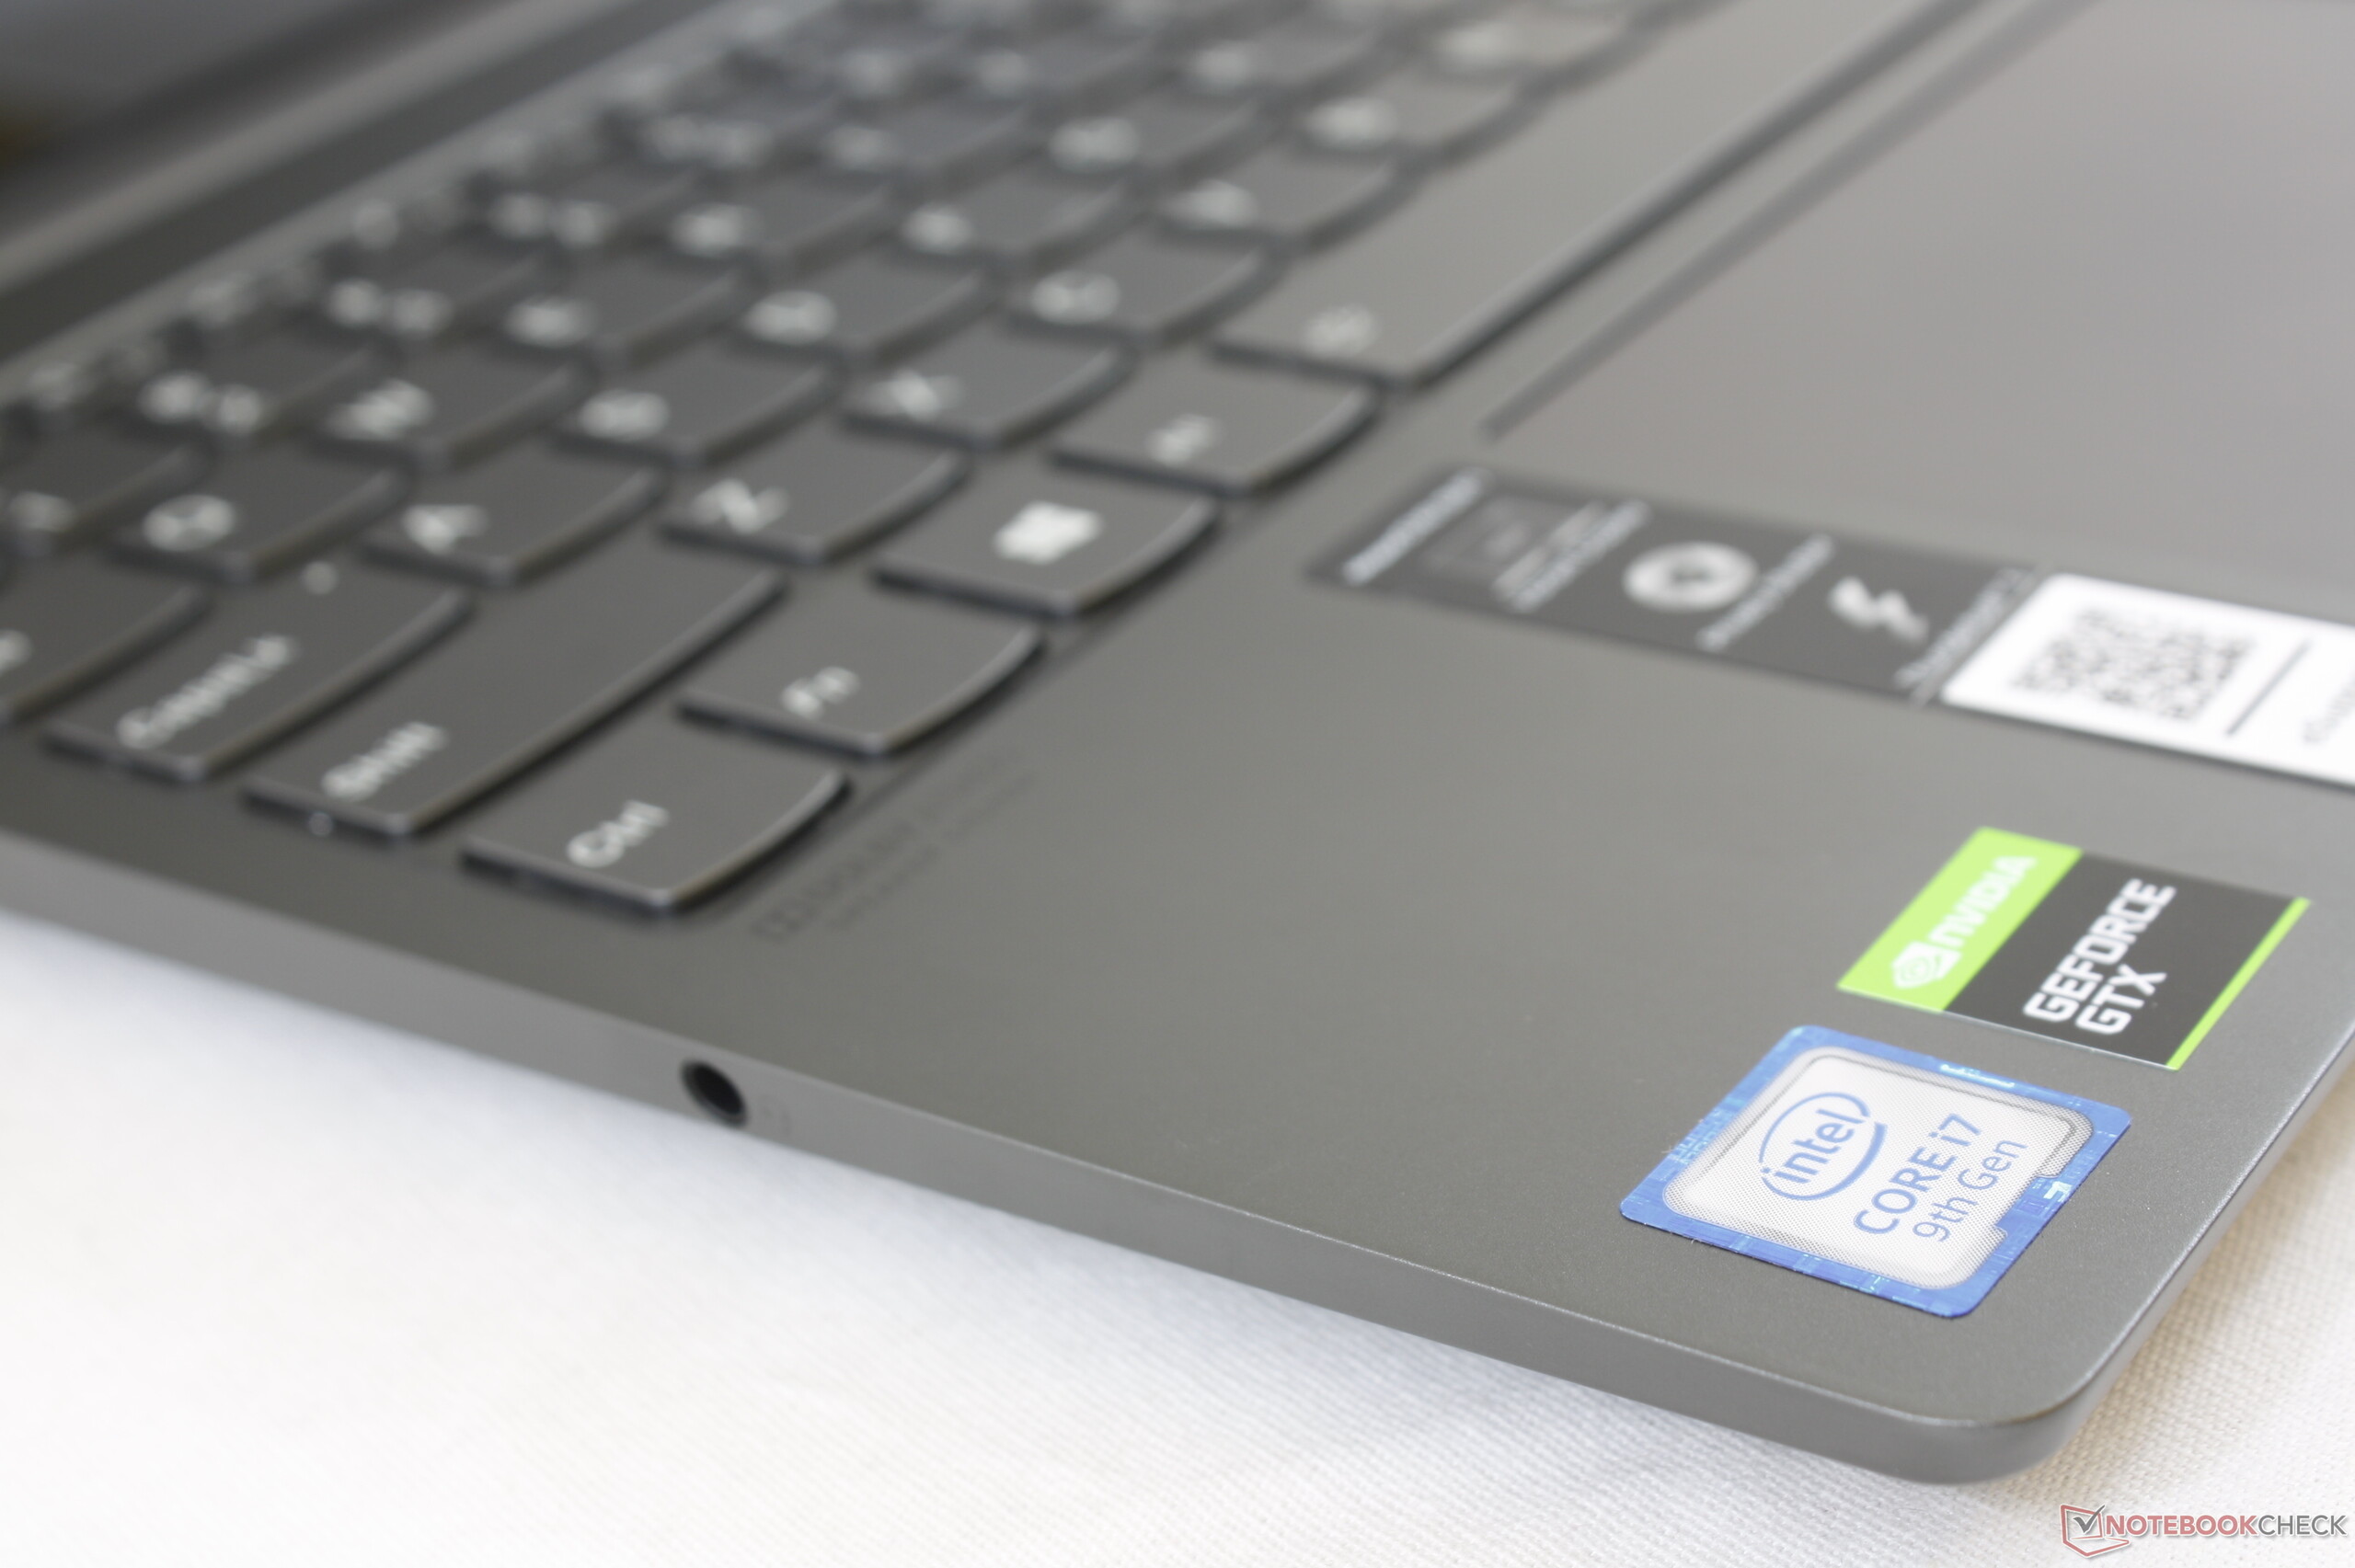
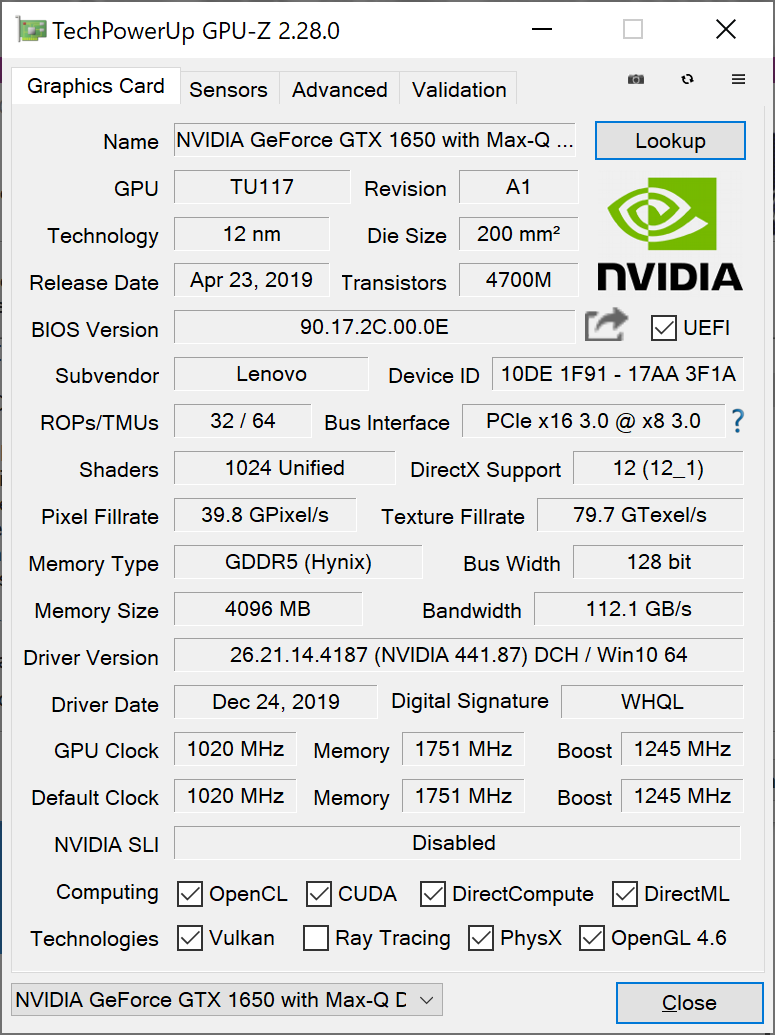
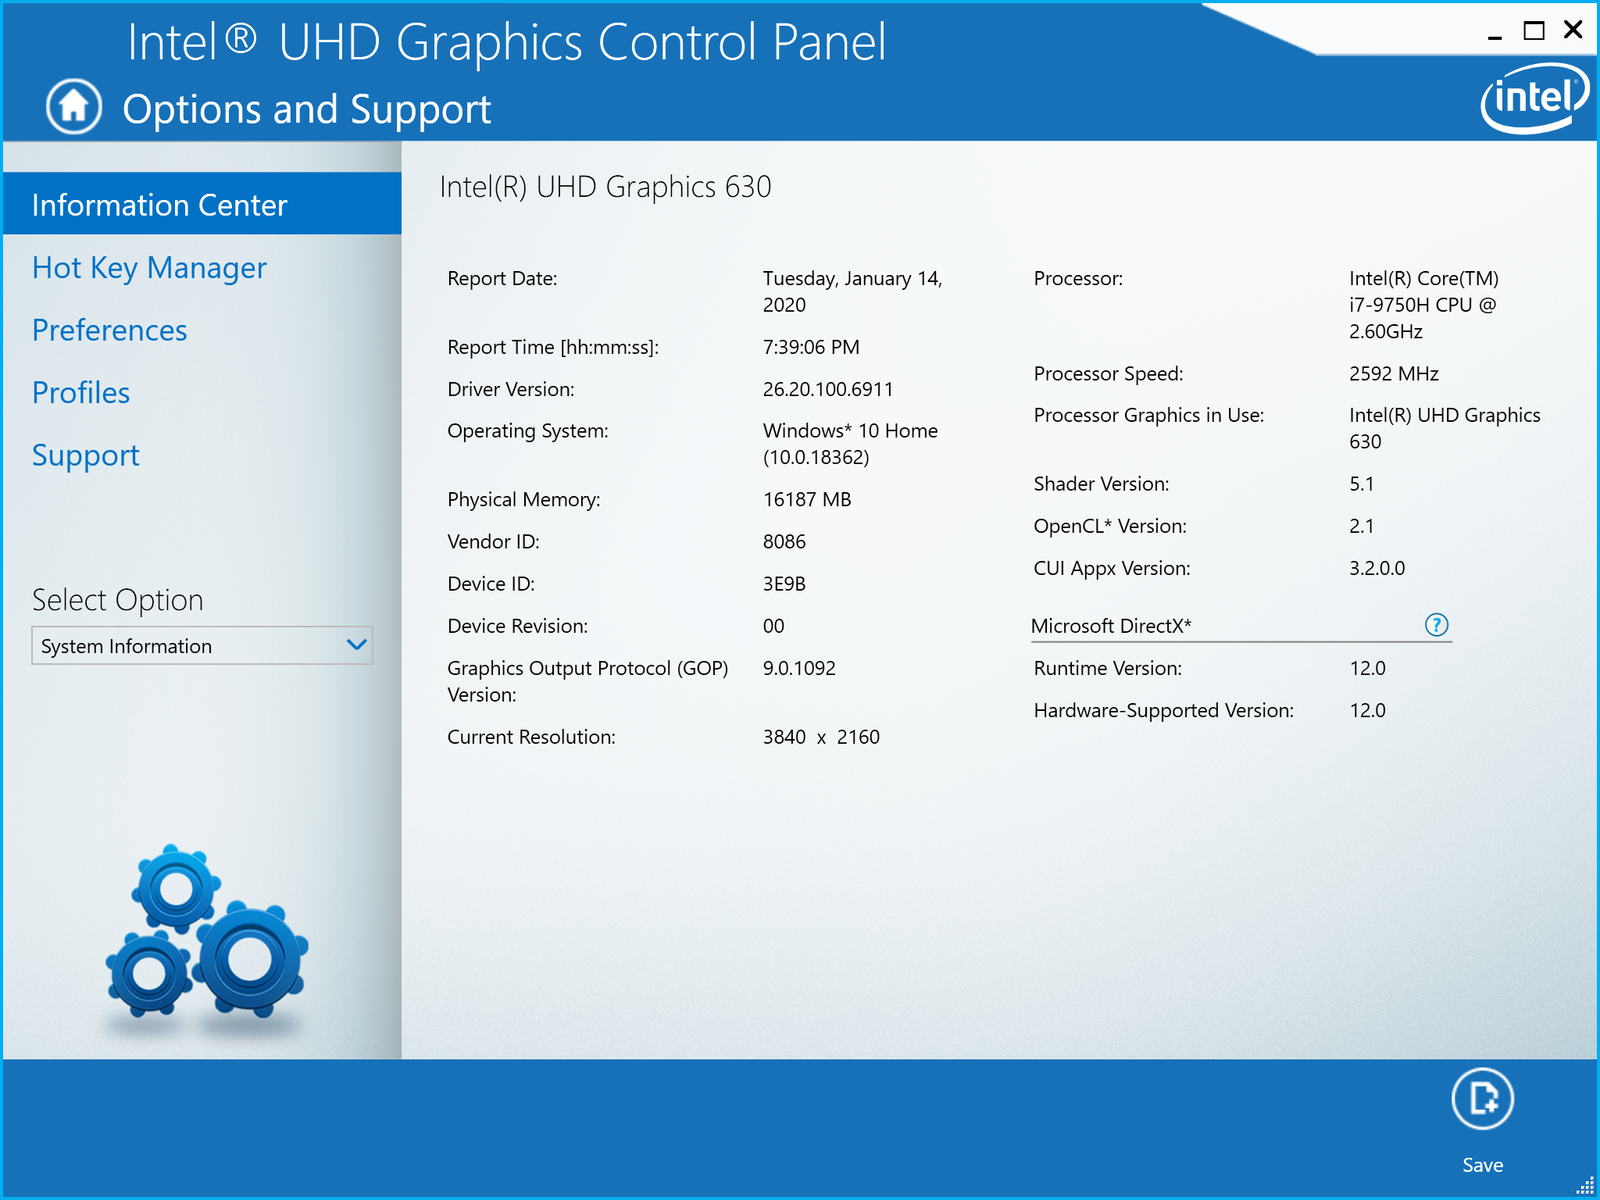
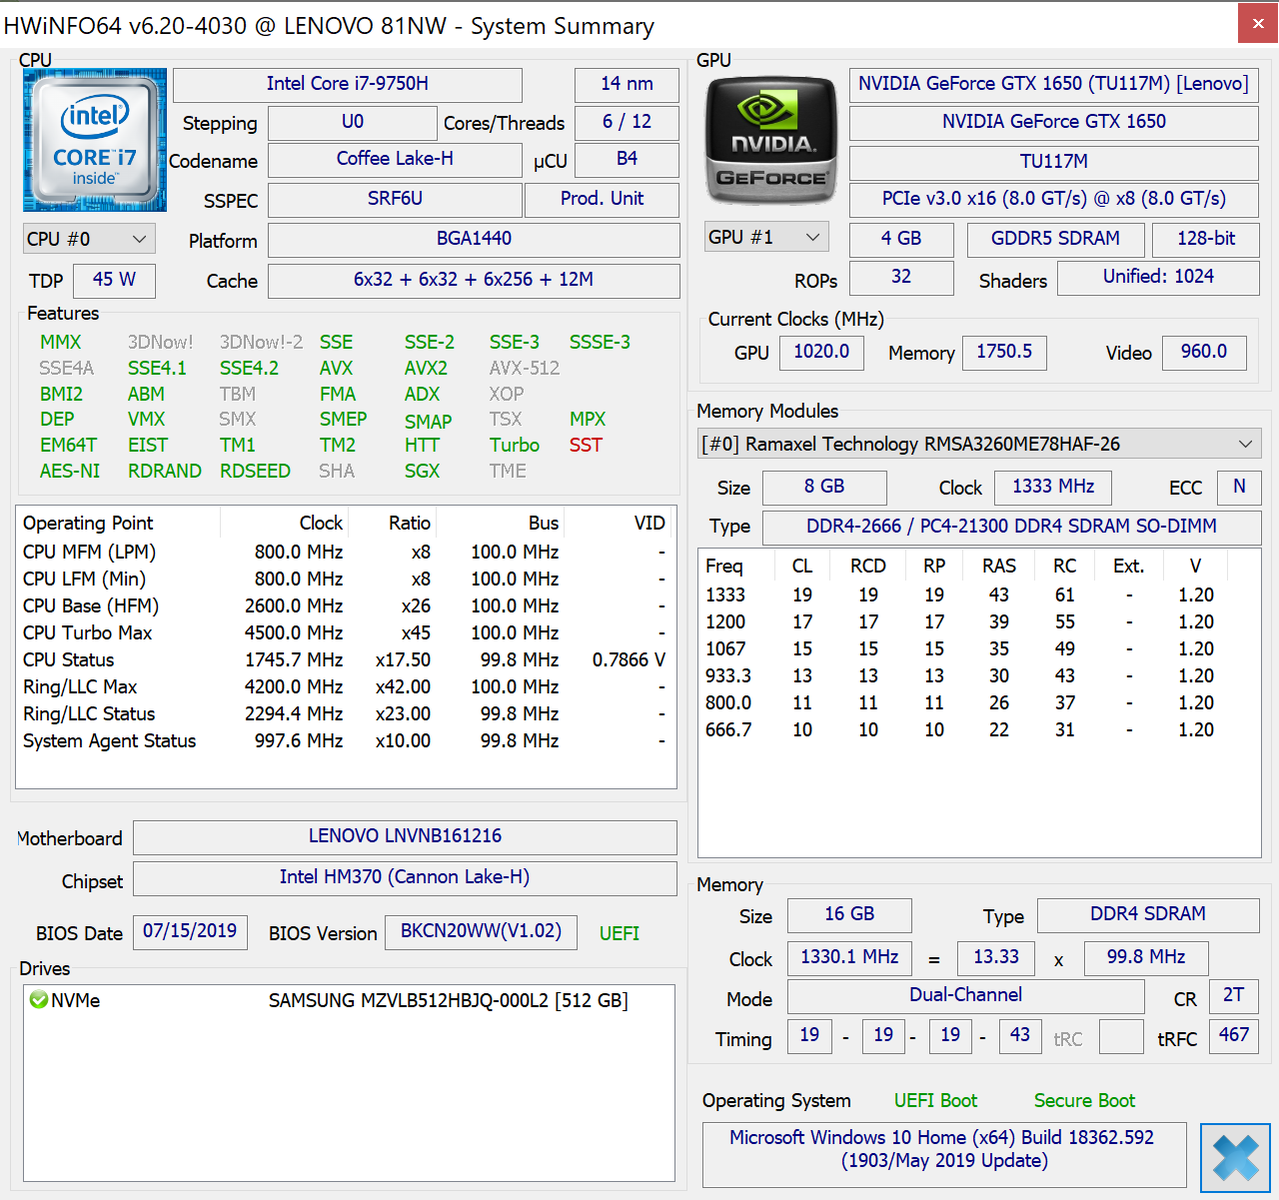
Core H serisi CPU ve GeForce Max-Q GPU, yalnızca Core U serisi CPU ve entegre GPU ile tipik Ultrabook'tan daha fazla güce ihtiyaç duyan performans kullanıcılarını hedefliyor. Son derece yapılandırılabilir HP Spectre x360 15 veya Dell XPS 15'in aksine, Lenovo Yoga Y740 15 şimdilik sadece Core i7 ve GTX 1650 Max-Q seçeneklerine sahip daha az SKU taşıyor.Nvidia Optimus, entegre UHD Graphics 630'a otomatik geçiş için standart olarak geliyor. Not GPU'nun, resmi Lenovo ürün sayfası bundan bahsetmese de standart GTX 1650 değil, daha yavaş GeForce GTX 1650 Max-Q sürümü olduğunu belirtiyor.LatencyMon, kablosuz etkinleştirildiğinde bile hiçbir DPC gecikme sorunu göstermiyor.
İşlemci
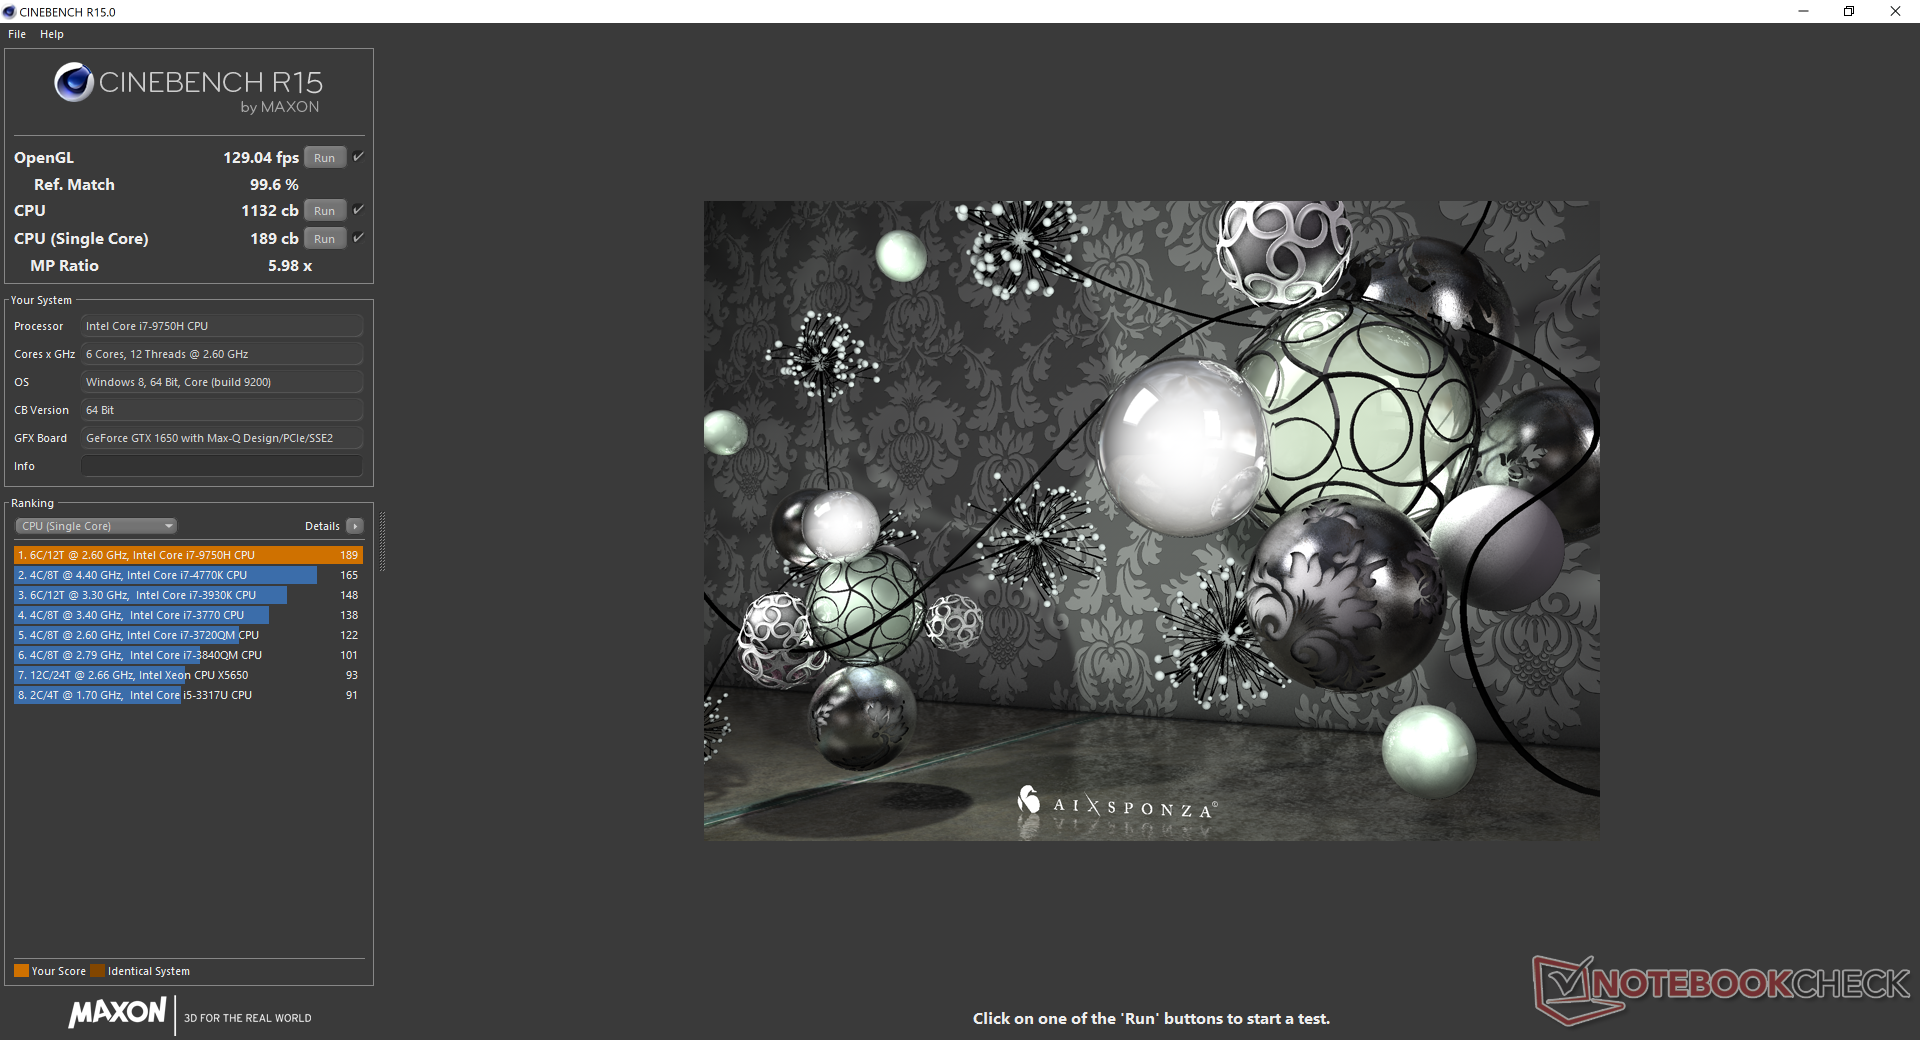
CineBench sonuçları, diğer 70 oyun dizüstü bilgisayarından alınan veritabanımızda ortalama Core i7-9750H'nin yüzde 1 ila 4'ü arasında. Core i7-8750H'den yükseltme yapan kullanıcılar çok büyük bir sıçrama beklememelidir, ancak herhangi bir Core i5 veya daha eski Core i7-7700HQ dizüstü bilgisayar sahipleri CPU performansında daha önemli kazanımlar görecektir. CineBench R15 Multi-Thread'ı bir döngüde çalıştırırken, aşırı işleme stresi altındayken yaklaşık yüzde 7'lik bir performans düşüşünü temsil etmek için 1138 puanlık başlangıç puanı zaman içinde yaklaşık 1060 puana düşer. İçin Core i7-9750H daha fazla teknik bilgi ve kıyaslama karşılaştırmaları.
| Cinebench R20 | |
| CPU (Single Core) | |
| Medion Erazer X15805 | |
| Corsair One i160 | |
| Dell XPS 13 7390 Core i7-10710U | |
| Microsoft Surface Laptop 3 15 i7-1065G7 | |
| Lenovo IdeaPad S740-15IRH | |
| Asus ROG Mothership GZ700GX | |
| Ortalama Intel Core i7-9750H (416 - 486, n=55) | |
| MSI GE75 9SG | |
| Dell G3 3590 | |
| MSI GE63 Raider 8SG | |
| Asus Zephyrus GX501 | |
| Asus ROG Zephyrus G15 GA502DU | |
| CPU (Multi Core) | |
| Corsair One i160 | |
| Asus ROG Mothership GZ700GX | |
| MSI GE75 9SG | |
| Medion Erazer X15805 | |
| Ortalama Intel Core i7-9750H (2017 - 3133, n=55) | |
| Lenovo IdeaPad S740-15IRH | |
| Dell XPS 13 7390 Core i7-10710U | |
| MSI GE63 Raider 8SG | |
| Dell G3 3590 | |
| Asus ROG Zephyrus G15 GA502DU | |
| Microsoft Surface Laptop 3 15 i7-1065G7 | |
| Asus Zephyrus GX501 | |
| Cinebench R15 | |
| CPU Single 64Bit | |
| Medion Erazer X15805 | |
| Corsair One i160 | |
| MSI GE75 9SG | |
| Lenovo IdeaPad S740-15IRH | |
| Asus ROG Mothership GZ700GX | |
| Microsoft Surface Laptop 3 15 i7-1065G7 | |
| Ortalama Intel Core i7-9750H (170 - 194, n=82) | |
| Dell XPS 13 7390 Core i7-10710U | |
| Dell G3 3590 | |
| MSI GE63 Raider 8SG | |
| Asus Zephyrus GX501 | |
| Asus ROG Zephyrus G15 GA502DU | |
| CPU Multi 64Bit | |
| Corsair One i160 | |
| Asus ROG Mothership GZ700GX | |
| MSI GE75 9SG | |
| Medion Erazer X15805 | |
| Ortalama Intel Core i7-9750H (952 - 1306, n=85) | |
| Lenovo IdeaPad S740-15IRH | |
| Dell XPS 13 7390 Core i7-10710U | |
| MSI GE63 Raider 8SG | |
| Asus ROG Zephyrus G15 GA502DU | |
| Dell G3 3590 | |
| Asus Zephyrus GX501 | |
| Microsoft Surface Laptop 3 15 i7-1065G7 | |
| Cinebench R11.5 | |
| CPU Single 64Bit | |
| Corsair One i160 | |
| Dell XPS 13 7390 Core i7-10710U | |
| MSI GE75 9SG | |
| Ortalama Intel Core i7-9750H (1.96 - 2.19, n=10) | |
| Asus Zephyrus GX501 | |
| Asus ROG Zephyrus G15 GA502DU | |
| CPU Multi 64Bit | |
| Corsair One i160 | |
| MSI GE75 9SG | |
| Ortalama Intel Core i7-9750H (11.3 - 14.1, n=10) | |
| Dell XPS 13 7390 Core i7-10710U | |
| Asus ROG Zephyrus G15 GA502DU | |
| Asus Zephyrus GX501 | |
| Cinebench R10 | |
| Rendering Multiple CPUs 32Bit | |
| Corsair One i160 | |
| MSI GE75 9SG | |
| Medion Erazer X15805 | |
| Ortalama Intel Core i7-9750H (28251 - 36304, n=13) | |
| Dell XPS 13 7390 Core i7-10710U | |
| Asus Zephyrus GX501 | |
| Asus ROG Zephyrus G15 GA502DU | |
| Rendering Single 32Bit | |
| Corsair One i160 | |
| Medion Erazer X15805 | |
| Dell XPS 13 7390 Core i7-10710U | |
| MSI GE75 9SG | |
| Ortalama Intel Core i7-9750H (6659 - 7214, n=13) | |
| Asus Zephyrus GX501 | |
| Asus ROG Zephyrus G15 GA502DU | |
| wPrime 2.10 - 1024m | |
| Asus ROG Zephyrus G15 GA502DU | |
| Dell XPS 13 7390 Core i7-10710U | |
| Ortalama Intel Core i7-9750H (n=1) | |
| MSI GE75 9SG | |
| Corsair One i160 | |
* ... daha küçük daha iyidir
Sistem performansı
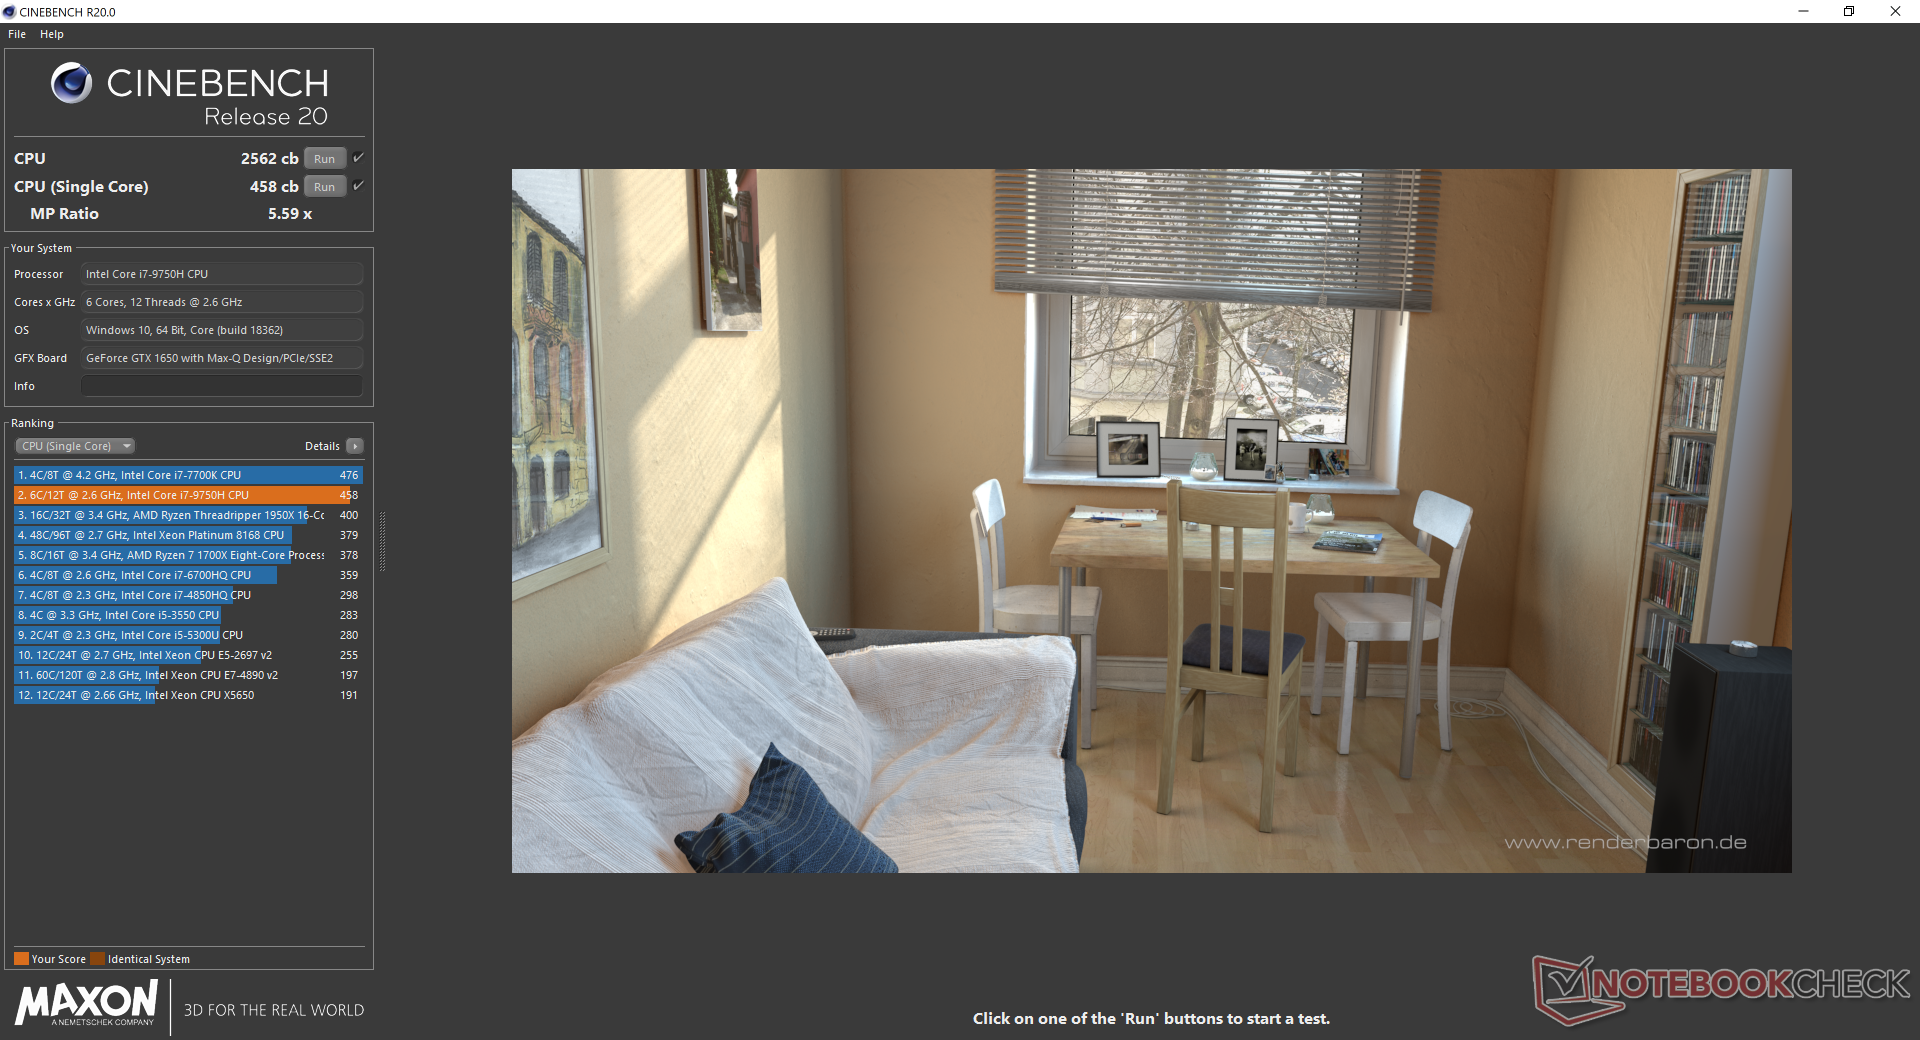
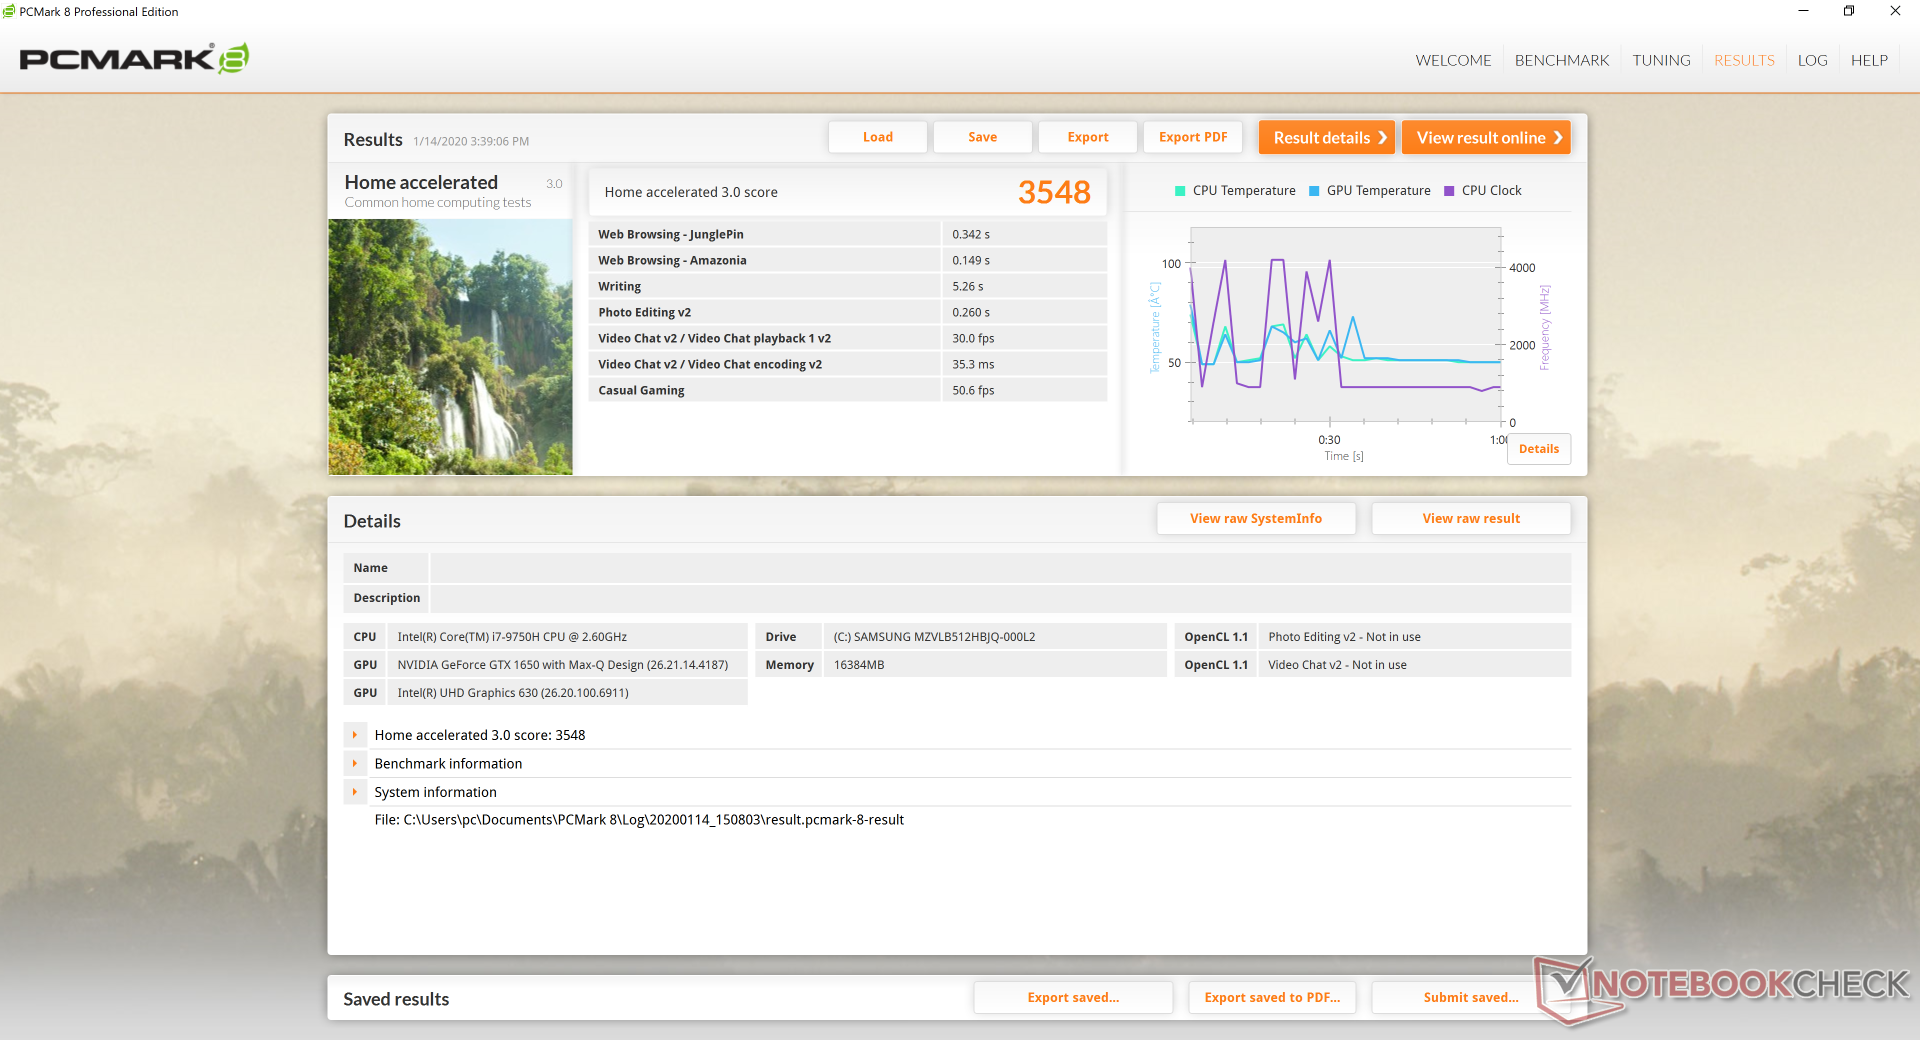
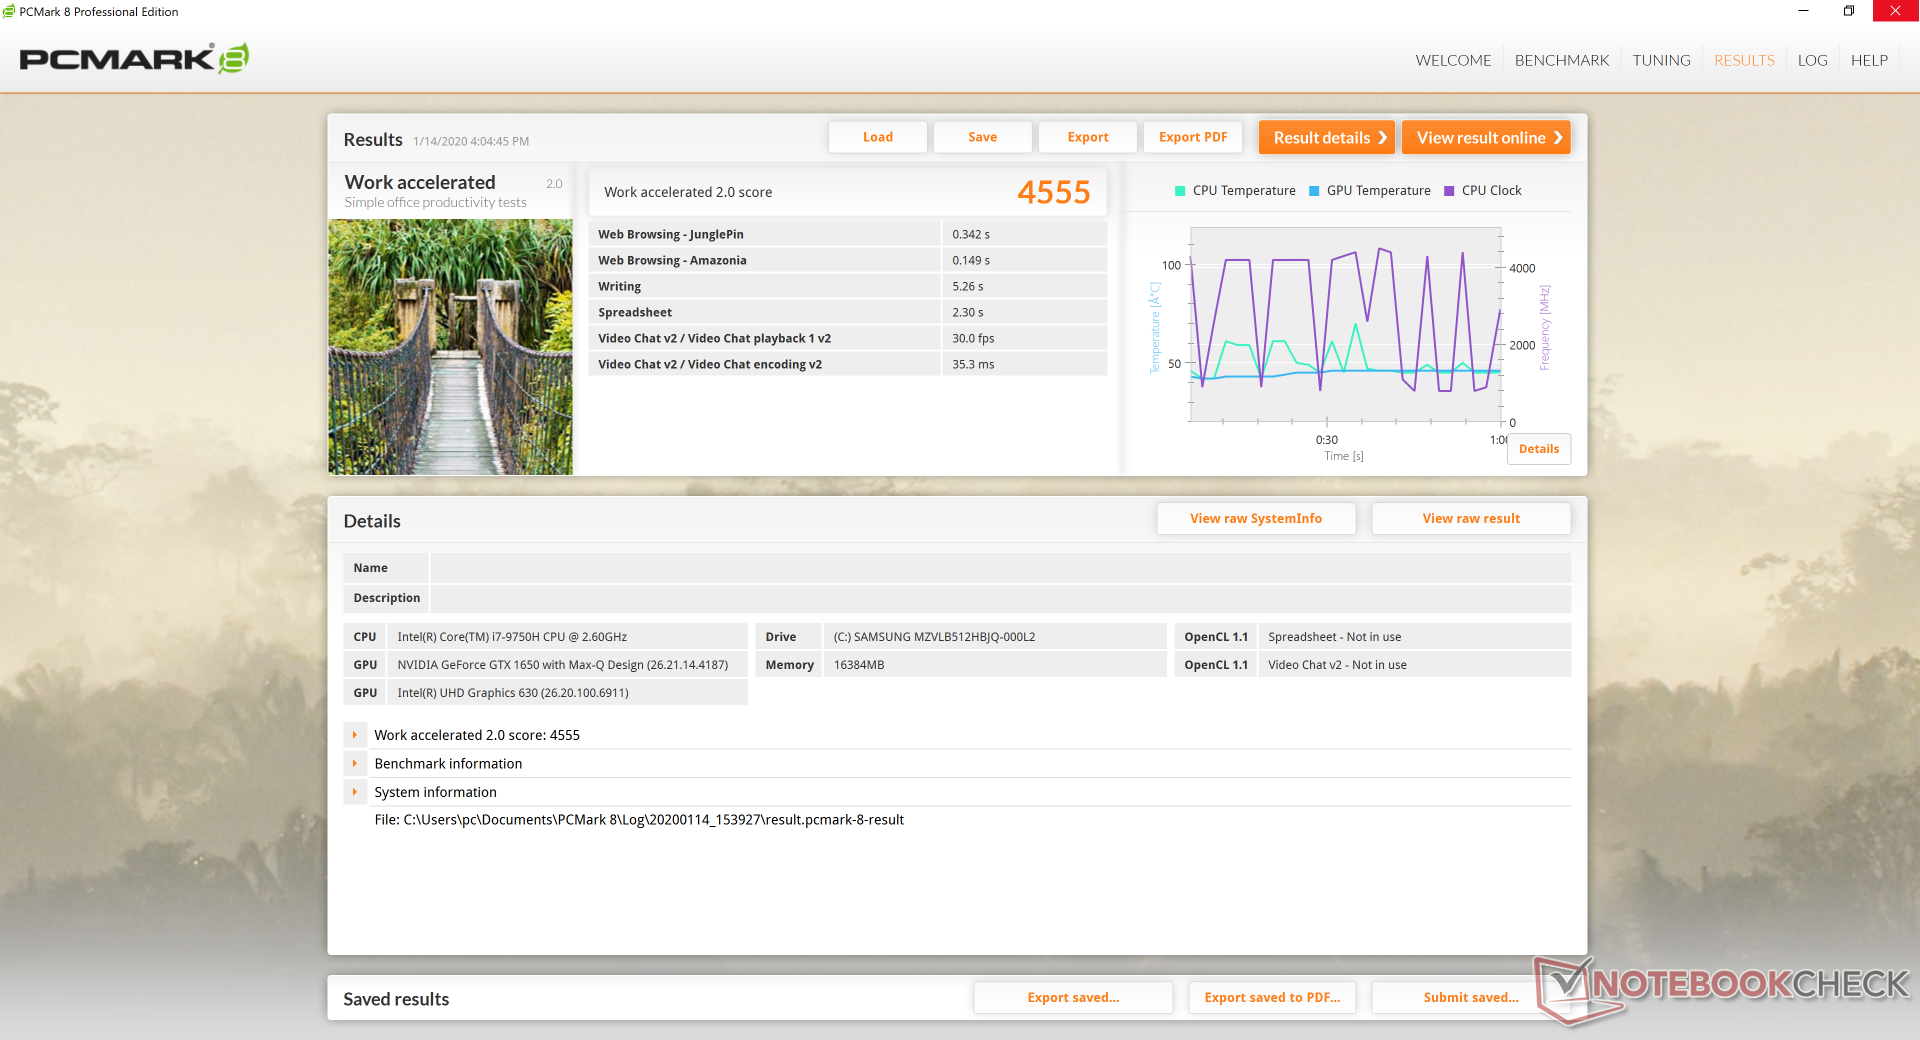
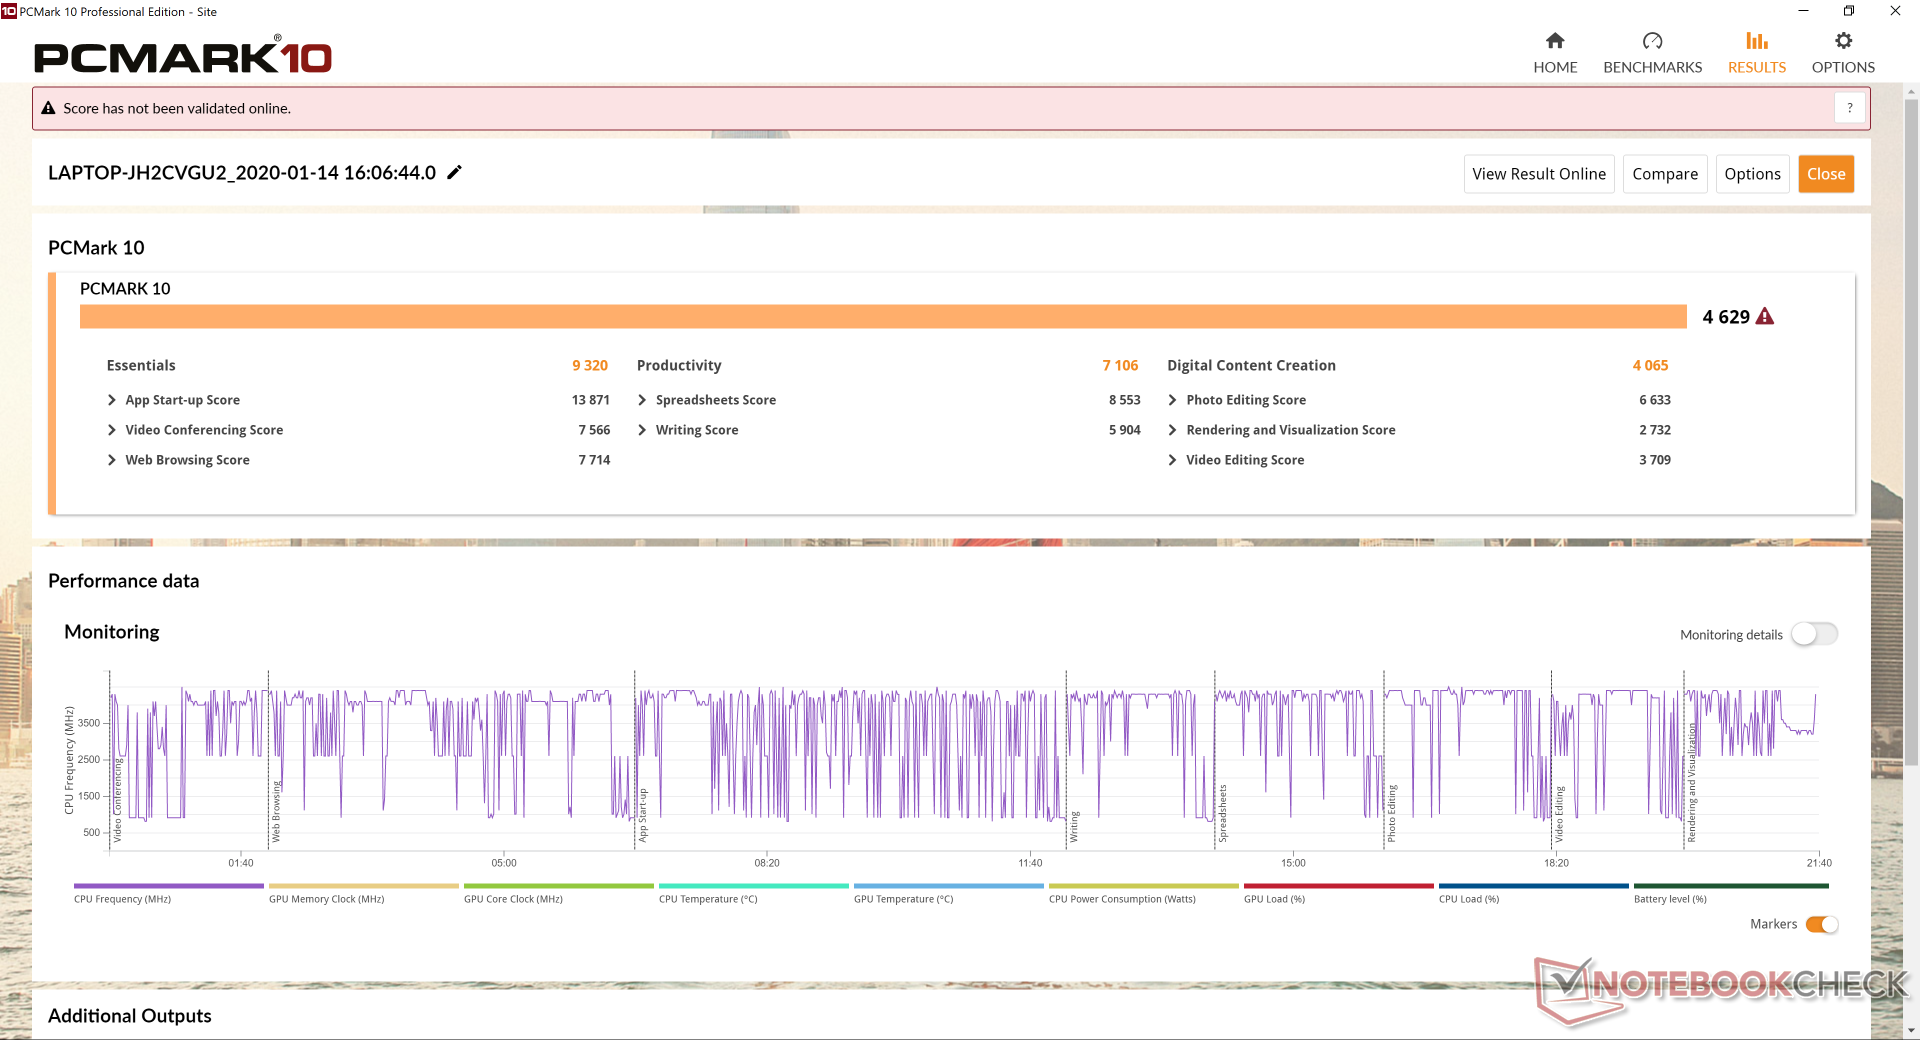
PCMark sonuçları, aynı Core i7-9750H CPU ve GTX 1650 Max-Q GPU'ya sahip diğer dizüstü bilgisayarların tek haneli yüzdelerindedir. Daha hızlı Dell XPS 15, daha hızlı Max-Q GTX 1650 GPU ve Core i9 CPU sayesinde her alt kategoride Lenovo'yu dışlıyor. Test ünitesiyle zamanımız boyunca hiçbir yazılım veya donanım sorunu yaşamadık. Bağlı Bekleme nedeniyle, kapak kapatıldığında güç tüketimi ve yüzey sıcaklıkları normalden çok daha yüksek olabilir.
| PCMark 8 | |
| Home Score Accelerated v2 | |
| Ortalama Intel Core i7-9750H, NVIDIA GeForce GTX 1650 Max-Q (3548 - 4069, n=2) | |
| Dell XPS 15 7590 9980HK GTX 1650 | |
| Asus ZenBook 15 UX534FT-DB77 | |
| Lenovo IdeaPad S740-15IRH | |
| MSI Prestige 15 A10SC | |
| Lenovo Yoga 730-15IKB | |
| HP Spectre X360 15-5ZV31AV | |
| Work Score Accelerated v2 | |
| Asus ZenBook 15 UX534FT-DB77 | |
| Ortalama Intel Core i7-9750H, NVIDIA GeForce GTX 1650 Max-Q (4555 - 5359, n=2) | |
| Dell XPS 15 7590 9980HK GTX 1650 | |
| HP Spectre X360 15-5ZV31AV | |
| Lenovo IdeaPad S740-15IRH | |
| MSI Prestige 15 A10SC | |
| Lenovo Yoga 730-15IKB | |
| PCMark 8 Home Score Accelerated v2 | 3548 puan | |
| PCMark 8 Work Score Accelerated v2 | 4555 puan | |
| PCMark 10 Score | 4629 puan | |
Yardım | ||
Depolama aygıtları
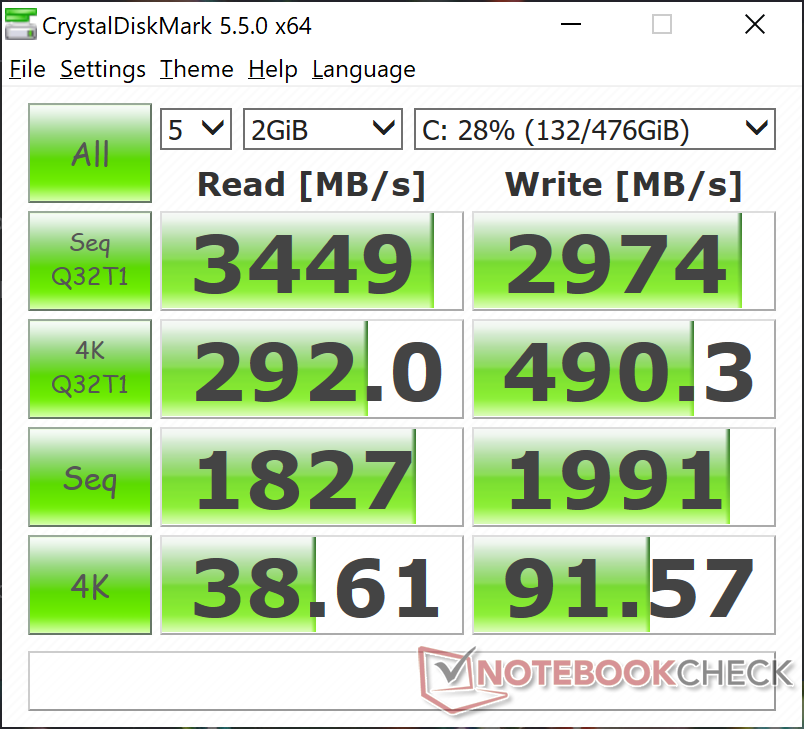
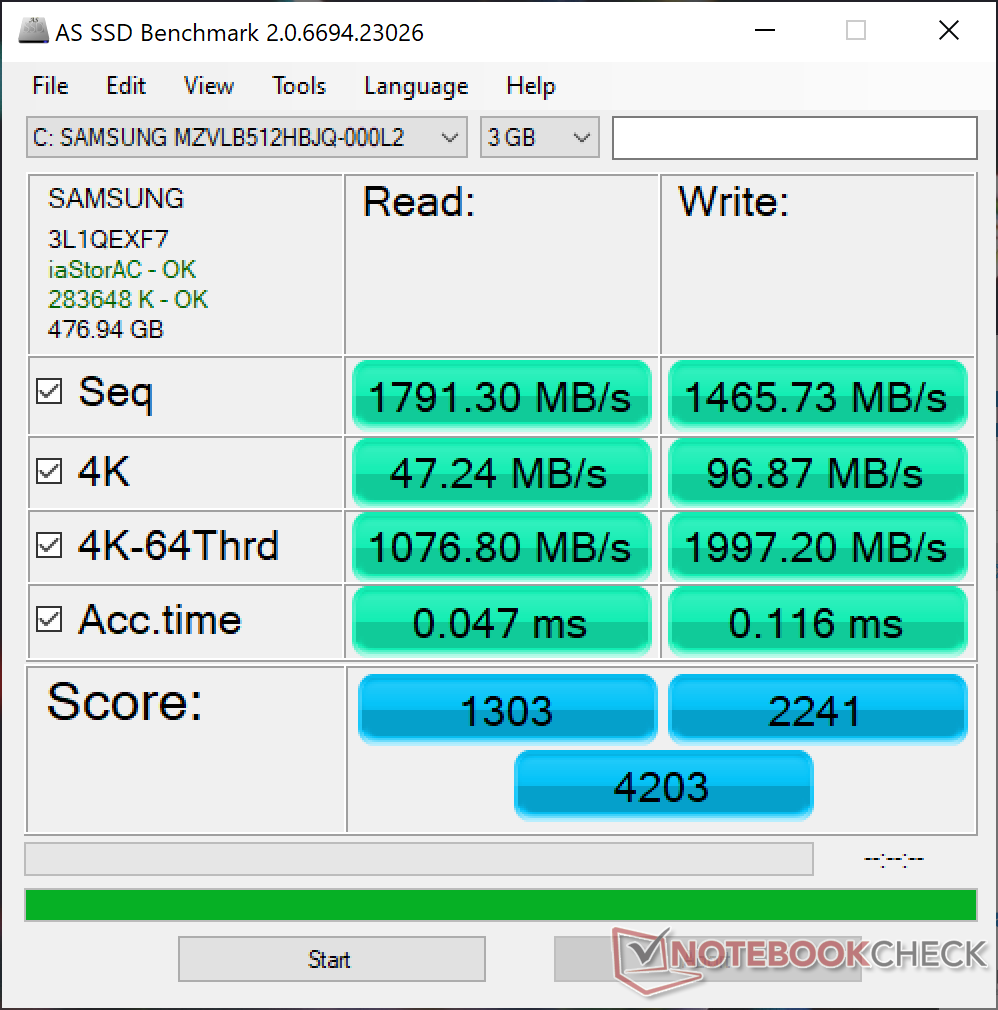
Yalnızca bir dahili depolama bölmesi kullanılabilir. Test birimimiz, bir IdeaPad dizüstü bilgisayar için şaşırtıcı olan daha küçük bir SK Hynix veya Intel parçası yerine üst düzey Samsung PM981 ile donatılmıştır. AS SSD'ye göre sıralı okuma ve yazma hızları ortalama 1800 MB / s ve 1500 MB / s'dir. Daha fazla performans karşılaştırması için SSD ve HDD tablolarımıza bakın.
| Lenovo IdeaPad S740-15IRH Samsung SSD PM981 MZVLB512HAJQ | Dell XPS 15 7590 9980HK GTX 1650 Toshiba XG6 KXG60ZNV1T02 | HP Spectre X360 15-5ZV31AV Intel SSD 660p 2TB SSDPEKNW020T8 | Lenovo Yoga 730-15IKB SK Hynix PC401 512GB M.2 (HFS512GD9TNG) | Asus ZenBook 15 UX534FT-DB77 Samsung SSD PM981 MZVLB1T0HALR | MSI Prestige 15 A10SC Samsung SSD PM981 MZVLB1T0HALR | |
|---|---|---|---|---|---|---|
| AS SSD | 4% | -24% | -26% | -4% | 4% | |
| Seq Read (MB/s) | 1791 | 1723 -4% | 1220 -32% | 2158 20% | 1887 5% | 1274 -29% |
| Seq Write (MB/s) | 1466 | 1386 -5% | 1152 -21% | 680 -54% | 1432 -2% | 1395 -5% |
| 4K Read (MB/s) | 47.24 | 43.25 -8% | 52.3 11% | 44.74 -5% | 52.3 11% | 50.3 6% |
| 4K Write (MB/s) | 96.9 | 98.3 1% | 146.6 51% | 123 27% | 146 51% | 119.8 24% |
| 4K-64 Read (MB/s) | 1077 | 1078 0% | 652 -39% | 623 -42% | 969 -10% | 1599 48% |
| 4K-64 Write (MB/s) | 1997 | 1456 -27% | 847 -58% | 486 -76% | 1375 -31% | 1455 -27% |
| Access Time Read * (ms) | 0.047 | 0.05 -6% | 0.077 -64% | 0.044 6% | 0.034 28% | 0.044 6% |
| Access Time Write * (ms) | 0.116 | 0.039 66% | 0.106 9% | 0.051 56% | 0.075 35% | 0.092 21% |
| Score Read (Points) | 1303 | 1294 -1% | 826 -37% | 884 -32% | 1210 -7% | 1777 36% |
| Score Write (Points) | 2241 | 1693 -24% | 1109 -51% | 677 -70% | 1664 -26% | 1714 -24% |
| Score Total (Points) | 4203 | 3638 -13% | 2371 -44% | 1951 -54% | 3483 -17% | 4411 5% |
| Copy ISO MB/s (MB/s) | 2127 | 3182 50% | 2070 -3% | 1641 -23% | 1375 -35% | 2830 33% |
| Copy Program MB/s (MB/s) | 828 | 984 19% | 571 -31% | 390 -53% | 468 -43% | 609 -26% |
| Copy Game MB/s (MB/s) | 1639 | 1824 11% | 1219 -26% | 574 -65% | 1287 -21% | 1424 -13% |
| CrystalDiskMark 5.2 / 6 | 5% | 1% | 12% | 13% | -5% | |
| Write 4K (MB/s) | 91.6 | 104.3 14% | 151.5 65% | 164.9 80% | 141.6 55% | 150.8 65% |
| Read 4K (MB/s) | 38.61 | 45.23 17% | 59.3 54% | 50.5 31% | 45.28 17% | 47.3 23% |
| Write Seq (MB/s) | 1991 | 1729 -13% | 1424 -28% | 1262 -37% | 1975 -1% | 981 -51% |
| Read Seq (MB/s) | 1827 | 1861 2% | 1609 -12% | 2054 12% | 2272 24% | 976 -47% |
| Write 4K Q32T1 (MB/s) | 490.3 | 509 4% | 393.6 -20% | 477.6 -3% | 458.6 -6% | 442.7 -10% |
| Read 4K Q32T1 (MB/s) | 292 | 388.5 33% | 369.4 27% | 550 88% | 391.4 34% | 499.7 71% |
| Write Seq Q32T1 (MB/s) | 2974 | 2813 -5% | 1946 -35% | 1400 -53% | 2393 -20% | 1706 -43% |
| Read Seq Q32T1 (MB/s) | 3449 | 2906 -16% | 1934 -44% | 2672 -23% | 3464 0% | 1758 -49% |
| Toplam Ortalama (Program / Ayarlar) | 5% /
4% | -12% /
-15% | -7% /
-12% | 5% /
2% | -1% /
1% |
* ... daha küçük daha iyidir

GPU Performansı
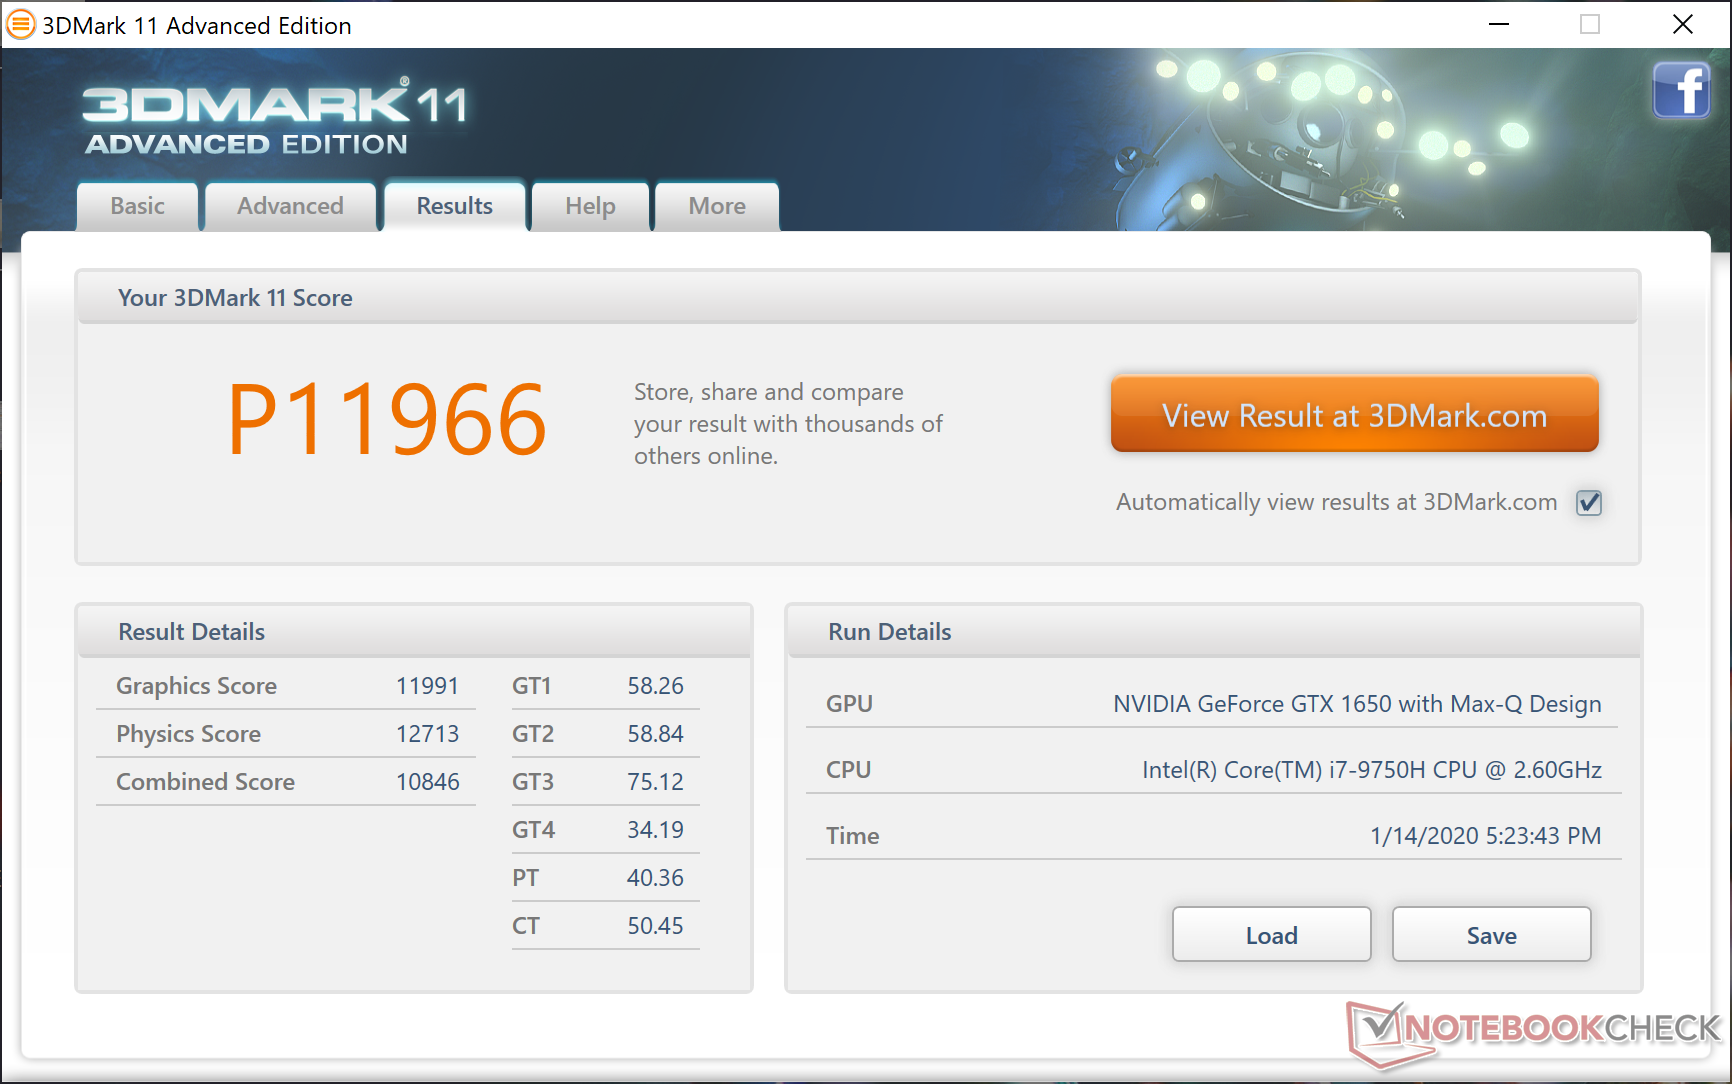
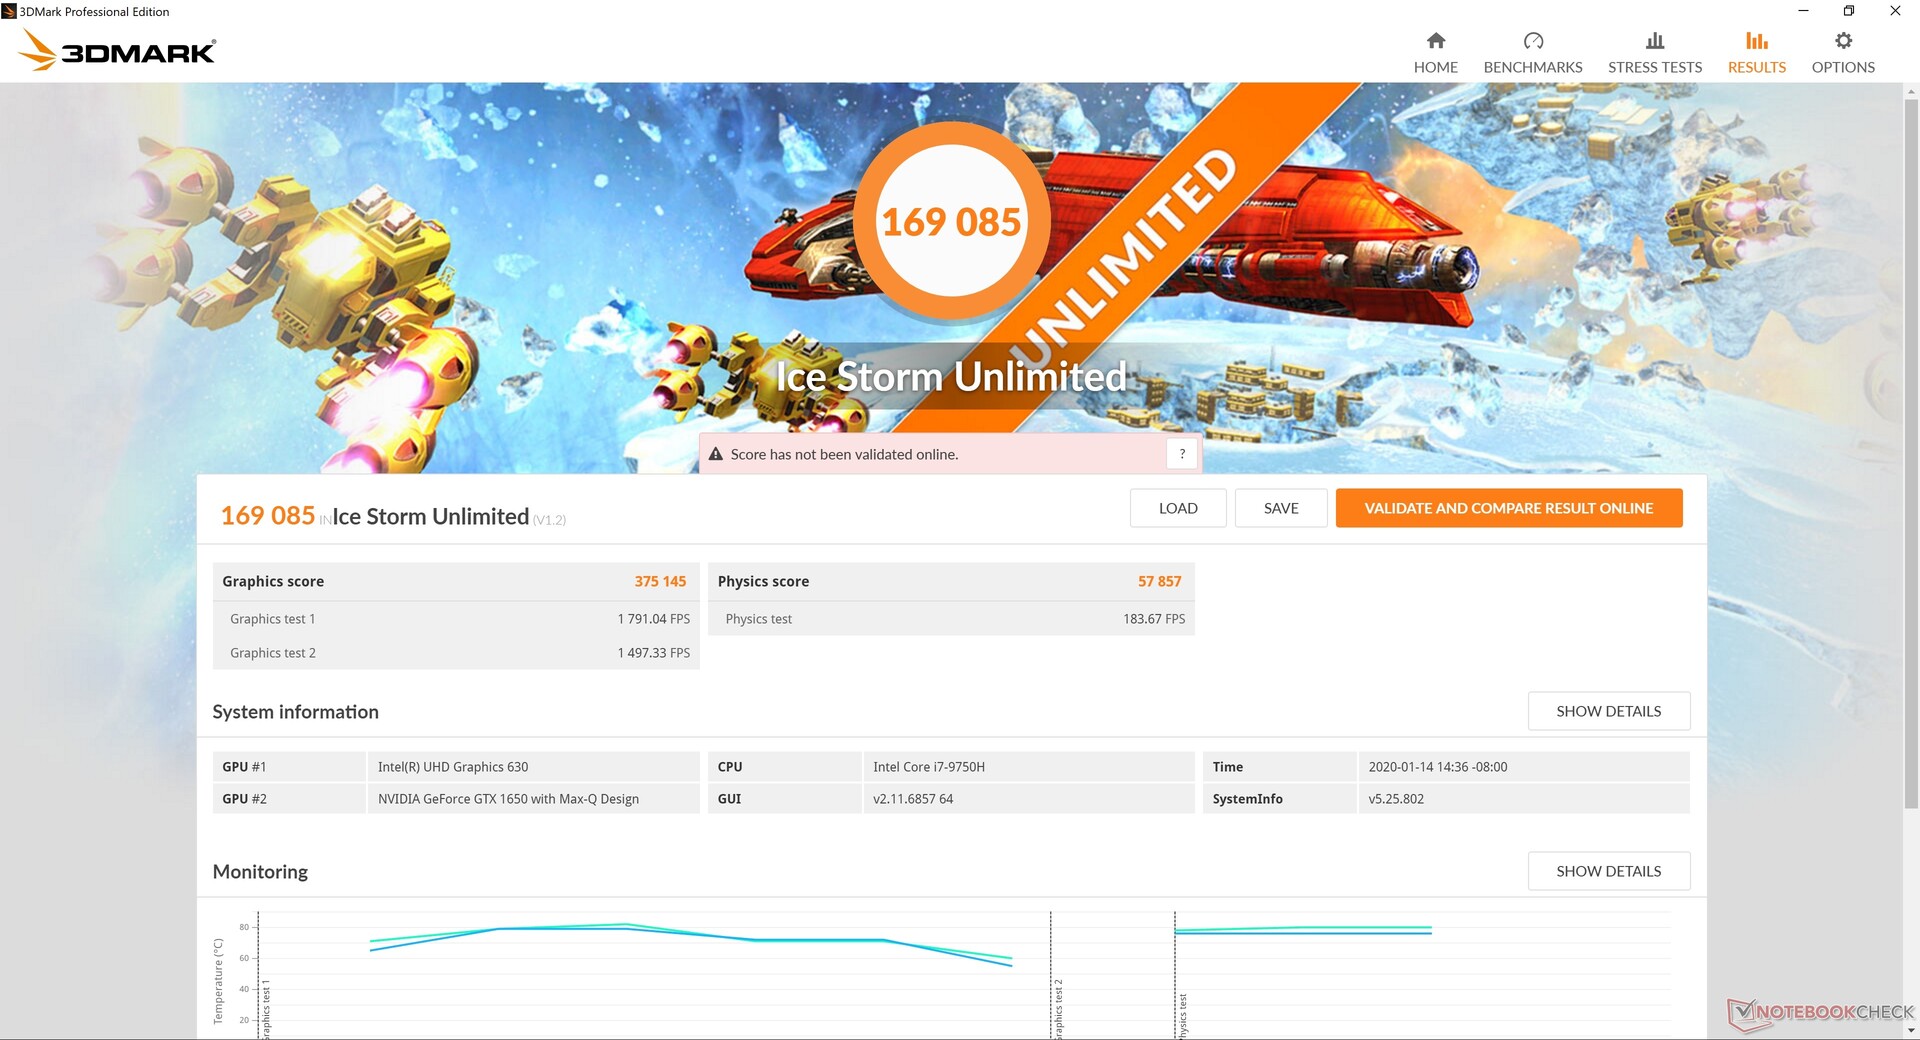
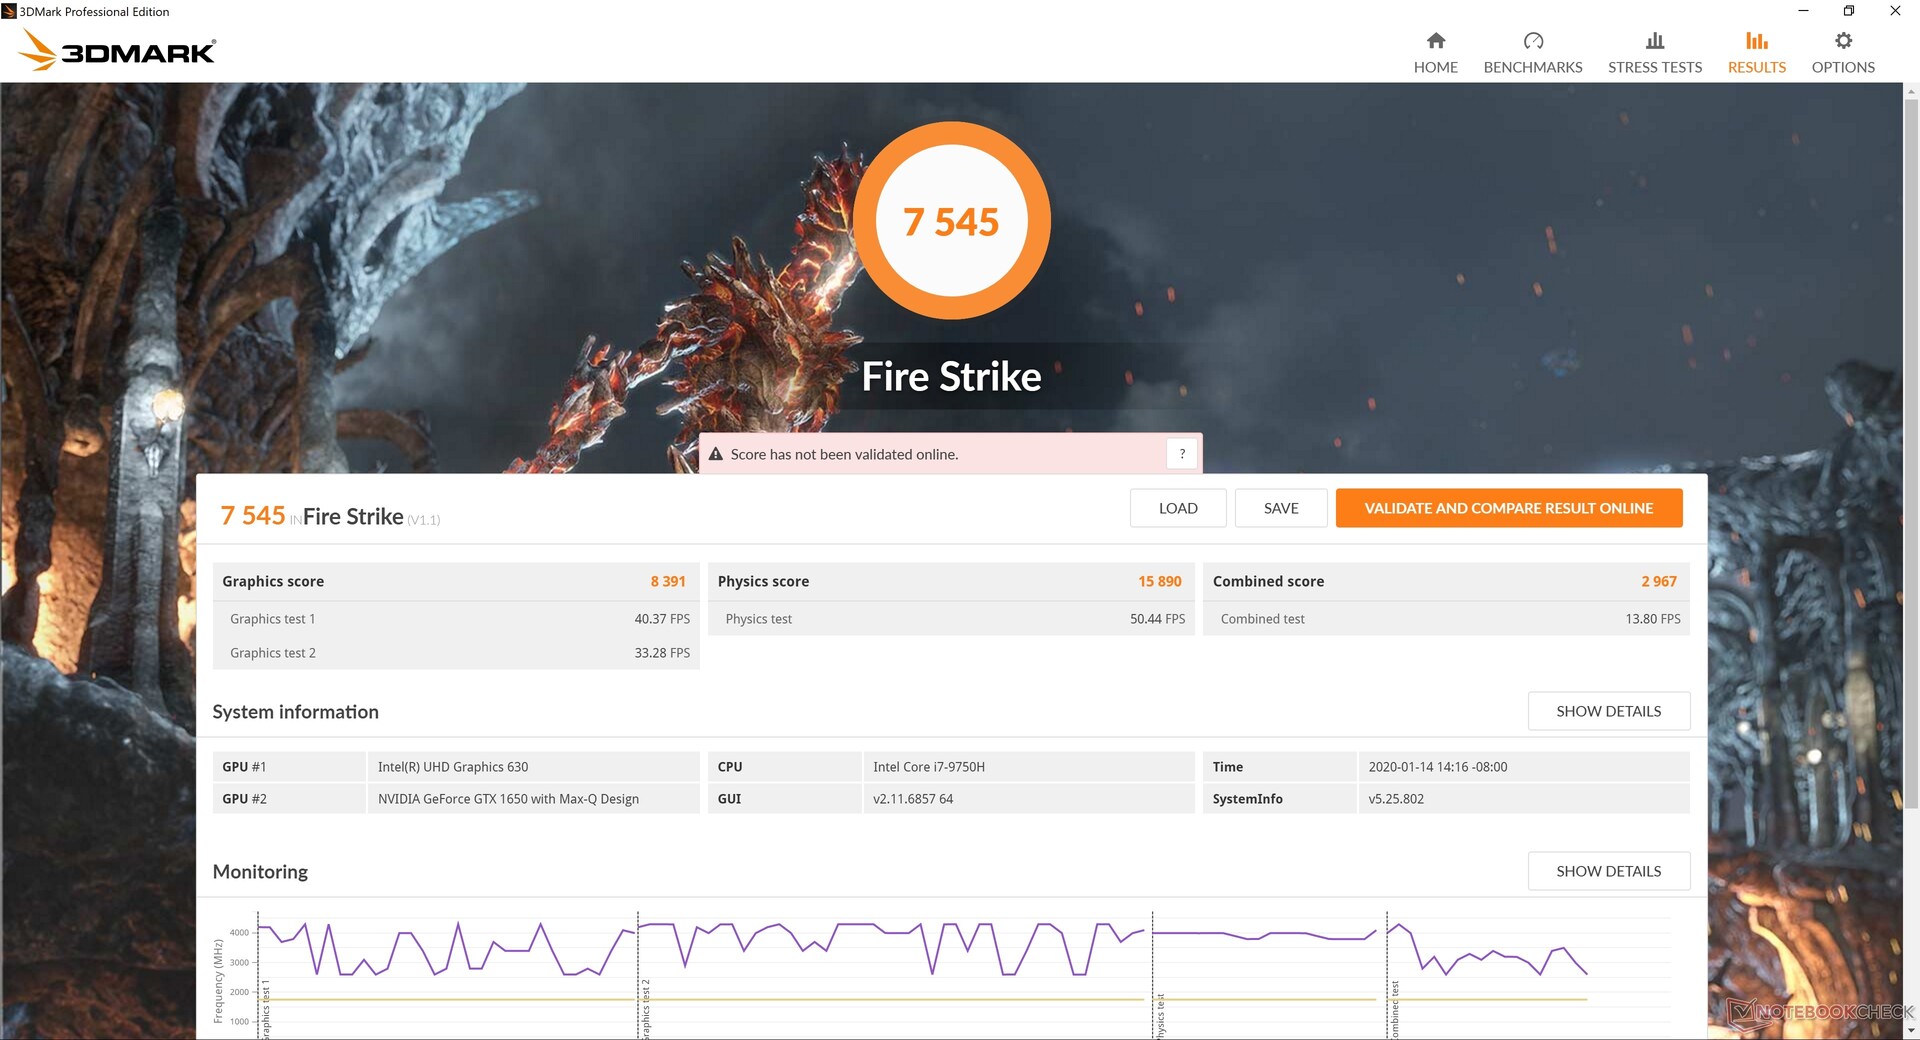
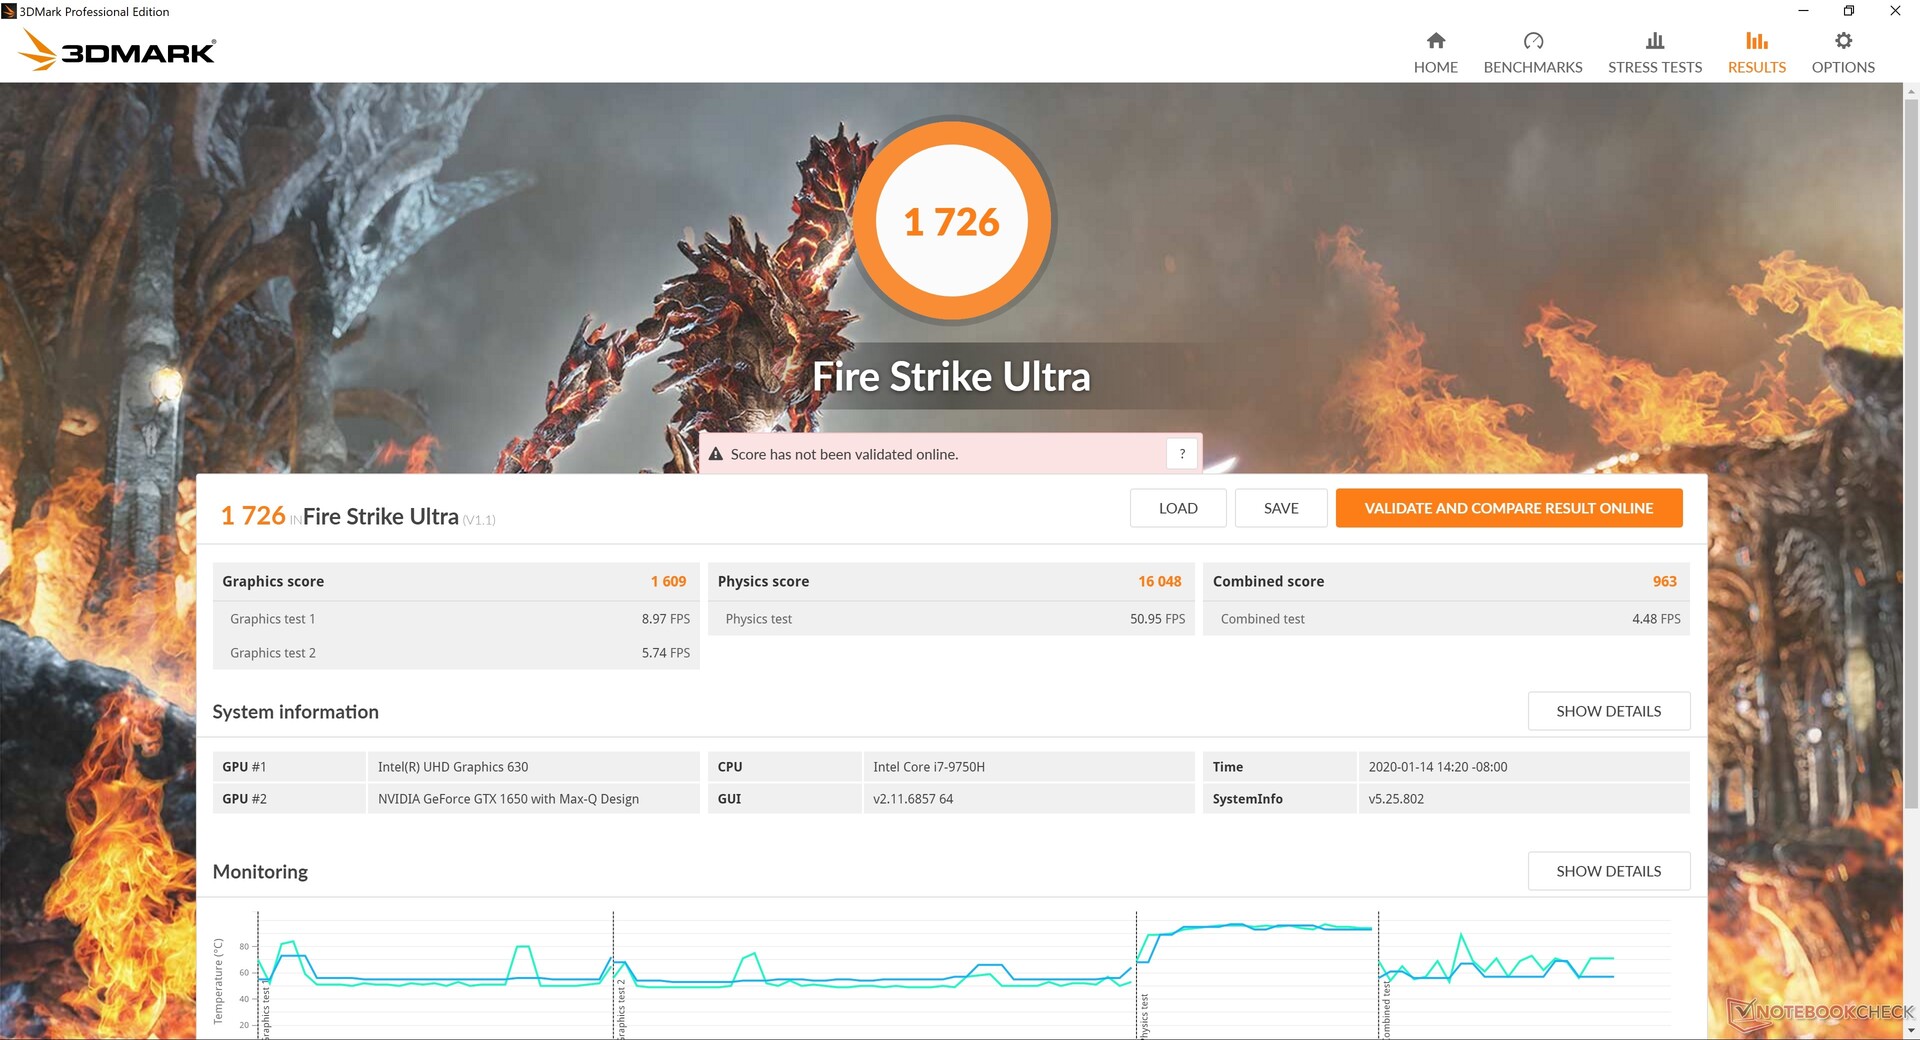
GeForce GTX 1650 Max-Q, Nvidia'nın Turing mimarisine dayanan en yavaş GTX GPU'sudur. Ham performans hala göreceli olarak mükemmel; 3DMark sonuçları, eski mobil GTX 1060'tan yalnızca yüzde 14 ila 26 daha yavaş veya masaüstü GTX 1650 referansımızdan yaklaşık yüzde 10 daha yavaş.
| 3DMark | |
| 1920x1080 Fire Strike Graphics | |
| Walmart EVOO Gaming 17 | |
| Schenker XMG Neo 15 XNE15M19 | |
| HP Omen 15-dc0015ng | |
| HP Gaming Pavilion 15-dk0009ng | |
| Asus Zephyrus S GX531GM | |
| MSI GT72S-6QEG16SR421BW | |
| Gainward GeForce GTX 1650 4 GB | |
| Lenovo IdeaPad S740-15IRH | |
| Ortalama NVIDIA GeForce GTX 1650 Max-Q (6985 - 8618, n=12) | |
| HP Spectre x360 15-df0126ng | |
| Lenovo Yoga 730-15IKB | |
| Asus Zenbook 14 UX433FN-A6023T | |
| 2560x1440 Time Spy Graphics | |
| Walmart EVOO Gaming 17 | |
| Schenker XMG Neo 15 XNE15M19 | |
| HP Gaming Pavilion 15-dk0009ng | |
| HP Omen 15-dc0015ng | |
| Asus Zephyrus S GX531GM | |
| Gainward GeForce GTX 1650 4 GB | |
| Lenovo IdeaPad S740-15IRH | |
| Ortalama NVIDIA GeForce GTX 1650 Max-Q (2836 - 3238, n=10) | |
| MSI GT72S-6QEG16SR421BW | |
| HP Spectre x360 15-df0126ng | |
| Lenovo Yoga 730-15IKB | |
| Asus Zenbook 14 UX433FN-A6023T | |
| 3DMark 11 | |
| 1280x720 Performance GPU | |
| Walmart EVOO Gaming 17 | |
| Schenker XMG Neo 15 XNE15M19 | |
| HP Omen 15-dc0015ng | |
| HP Gaming Pavilion 15-dk0009ng | |
| Gainward GeForce GTX 1650 4 GB | |
| Asus Zephyrus S GX531GM | |
| MSI GT72S-6QEG16SR421BW | |
| Lenovo IdeaPad S740-15IRH | |
| Ortalama NVIDIA GeForce GTX 1650 Max-Q (10248 - 12259, n=14) | |
| HP Spectre x360 15-df0126ng | |
| Lenovo Yoga 730-15IKB | |
| Asus Zenbook 14 UX433FN-A6023T | |
| 1280x720 Performance Combined | |
| Walmart EVOO Gaming 17 | |
| HP Gaming Pavilion 15-dk0009ng | |
| HP Omen 15-dc0015ng | |
| Schenker XMG Neo 15 XNE15M19 | |
| Gainward GeForce GTX 1650 4 GB | |
| Lenovo IdeaPad S740-15IRH | |
| MSI GT72S-6QEG16SR421BW | |
| Ortalama NVIDIA GeForce GTX 1650 Max-Q (6409 - 10846, n=13) | |
| HP Spectre x360 15-df0126ng | |
| Asus Zephyrus S GX531GM | |
| Lenovo Yoga 730-15IKB | |
| Asus Zenbook 14 UX433FN-A6023T | |
| 3DMark 11 Performance | 11966 puan | |
| 3DMark Ice Storm Standard Score | 42968 puan | |
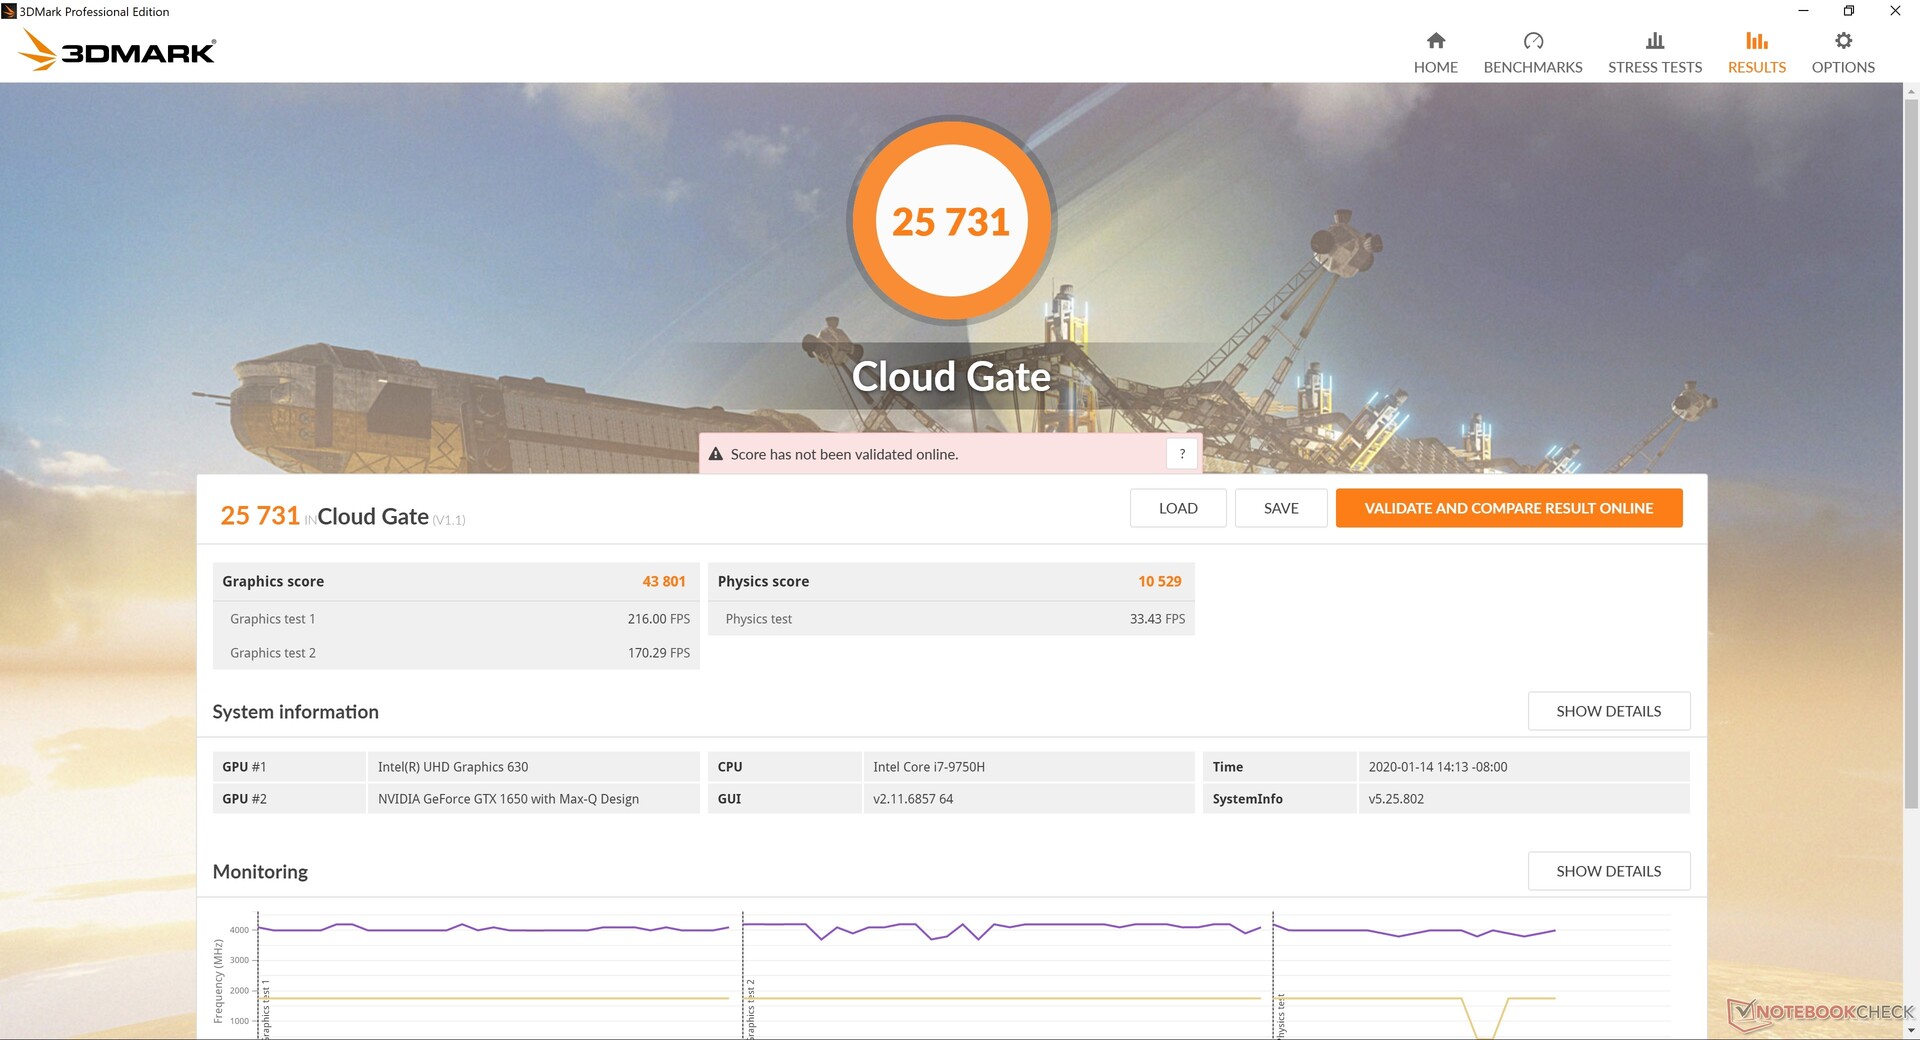
| 3DMark Cloud Gate Standard Score | 25731 puan | |
| 3DMark Fire Strike Score | 7545 puan | |
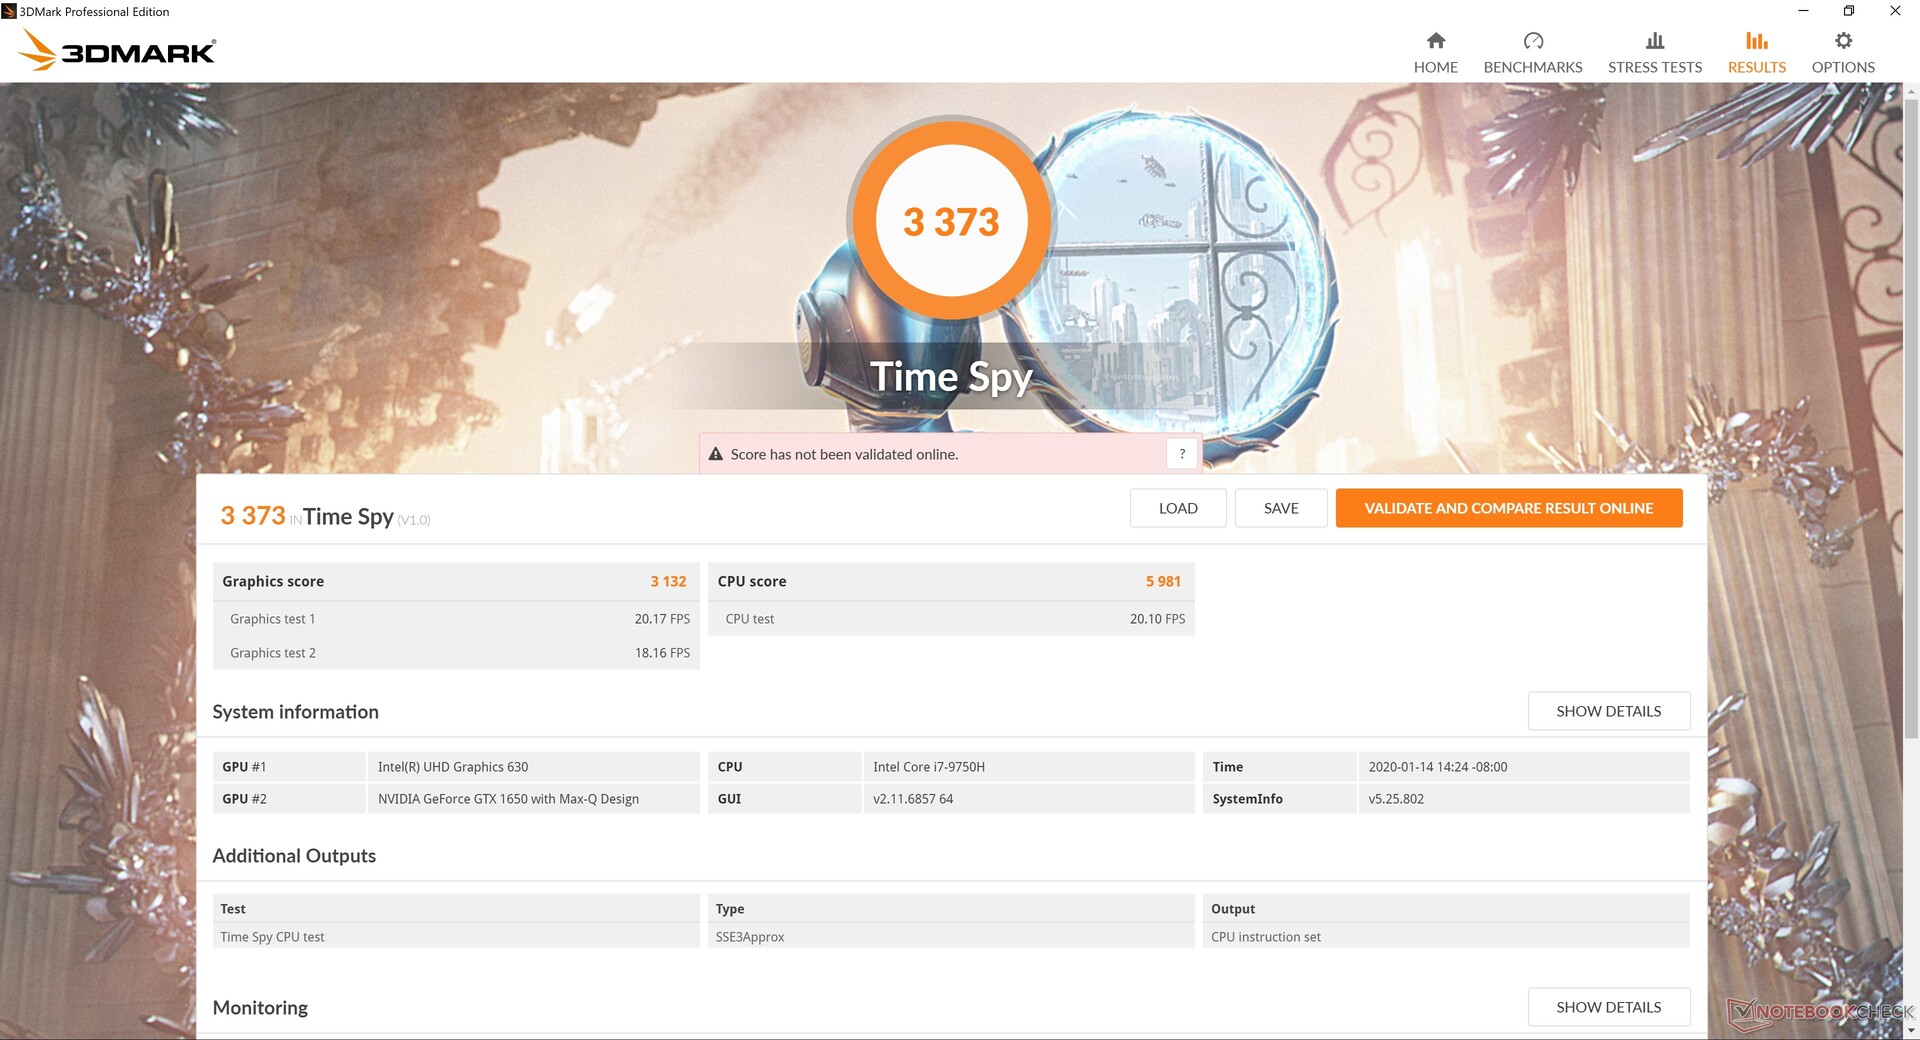
| 3DMark Time Spy Score | 3373 puan | |
Yardım | ||
Oyun Performansı
Çoğu oyun mobil GTX 1060'ın aksine 1080p'de çok iyi çalışıyor. Çoğu grafik ayarı azaldığı sürece 60 FPS'ye ulaşmak mümkündür. Yerel 4K UHD çözünürlüğünde zorlu başlıklar çalıştırıyorsanız iyi bir deneyim olmasını beklemeyin. Witcher 3'e bir saatten uzun süre devam etmek, gözlemlediğimizden farklı olarak tekrarlanan kare düşüşleri veya arka plan etkinliğini kesintiye uğratmamak için zaman içinde tutarlı kare hızları gösterir. HP Spectre x360 15.
| Shadow of the Tomb Raider - 1920x1080 Highest Preset AA:T | |
| MSI RTX 2060 Gaming Z 6G | |
| HP Pavilion Gaming 17-cd0085cl | |
| MSI GF65 9SD | |
| Asus TUF FX705GM | |
| Gainward GeForce GTX 1650 4 GB | |
| Lenovo IdeaPad S740-15IRH | |
| Asus G752VY | |
| Ortalama NVIDIA GeForce GTX 1650 Max-Q (33 - 45, n=6) | |
| Asus TUF FX705GE-EW096T | |
| Xiaomi Mi Notebook Pro i7 | |
| The Witcher 3 - 1920x1080 Ultra Graphics & Postprocessing (HBAO+) | |
| MSI RTX 2060 Gaming Z 6G | |
| MSI GF65 9SD | |
| HP Pavilion Gaming 17-cd0085cl | |
| Gainward GeForce GTX 1650 4 GB | |
| Asus TUF FX705GM | |
| Dell G3 3590 | |
| Lenovo IdeaPad S740-15IRH | |
| Ortalama NVIDIA GeForce GTX 1650 Max-Q (27.5 - 36.5, n=11) | |
| Asus TUF FX705GE-EW096T | |
| Xiaomi Mi Notebook Pro i7 | |
| düşük | orta | yüksek | ultra | |
|---|---|---|---|---|
| BioShock Infinite (2013) | 323.6 | 238.3 | 206.8 | 81.7 |
| The Witcher 3 (2015) | 188 | 114.8 | 60.4 | 34.4 |
| Shadow of the Tomb Raider (2018) | 117 | 56 | 47 | 41 |
Emisyonları
Sistem Gürültüsü
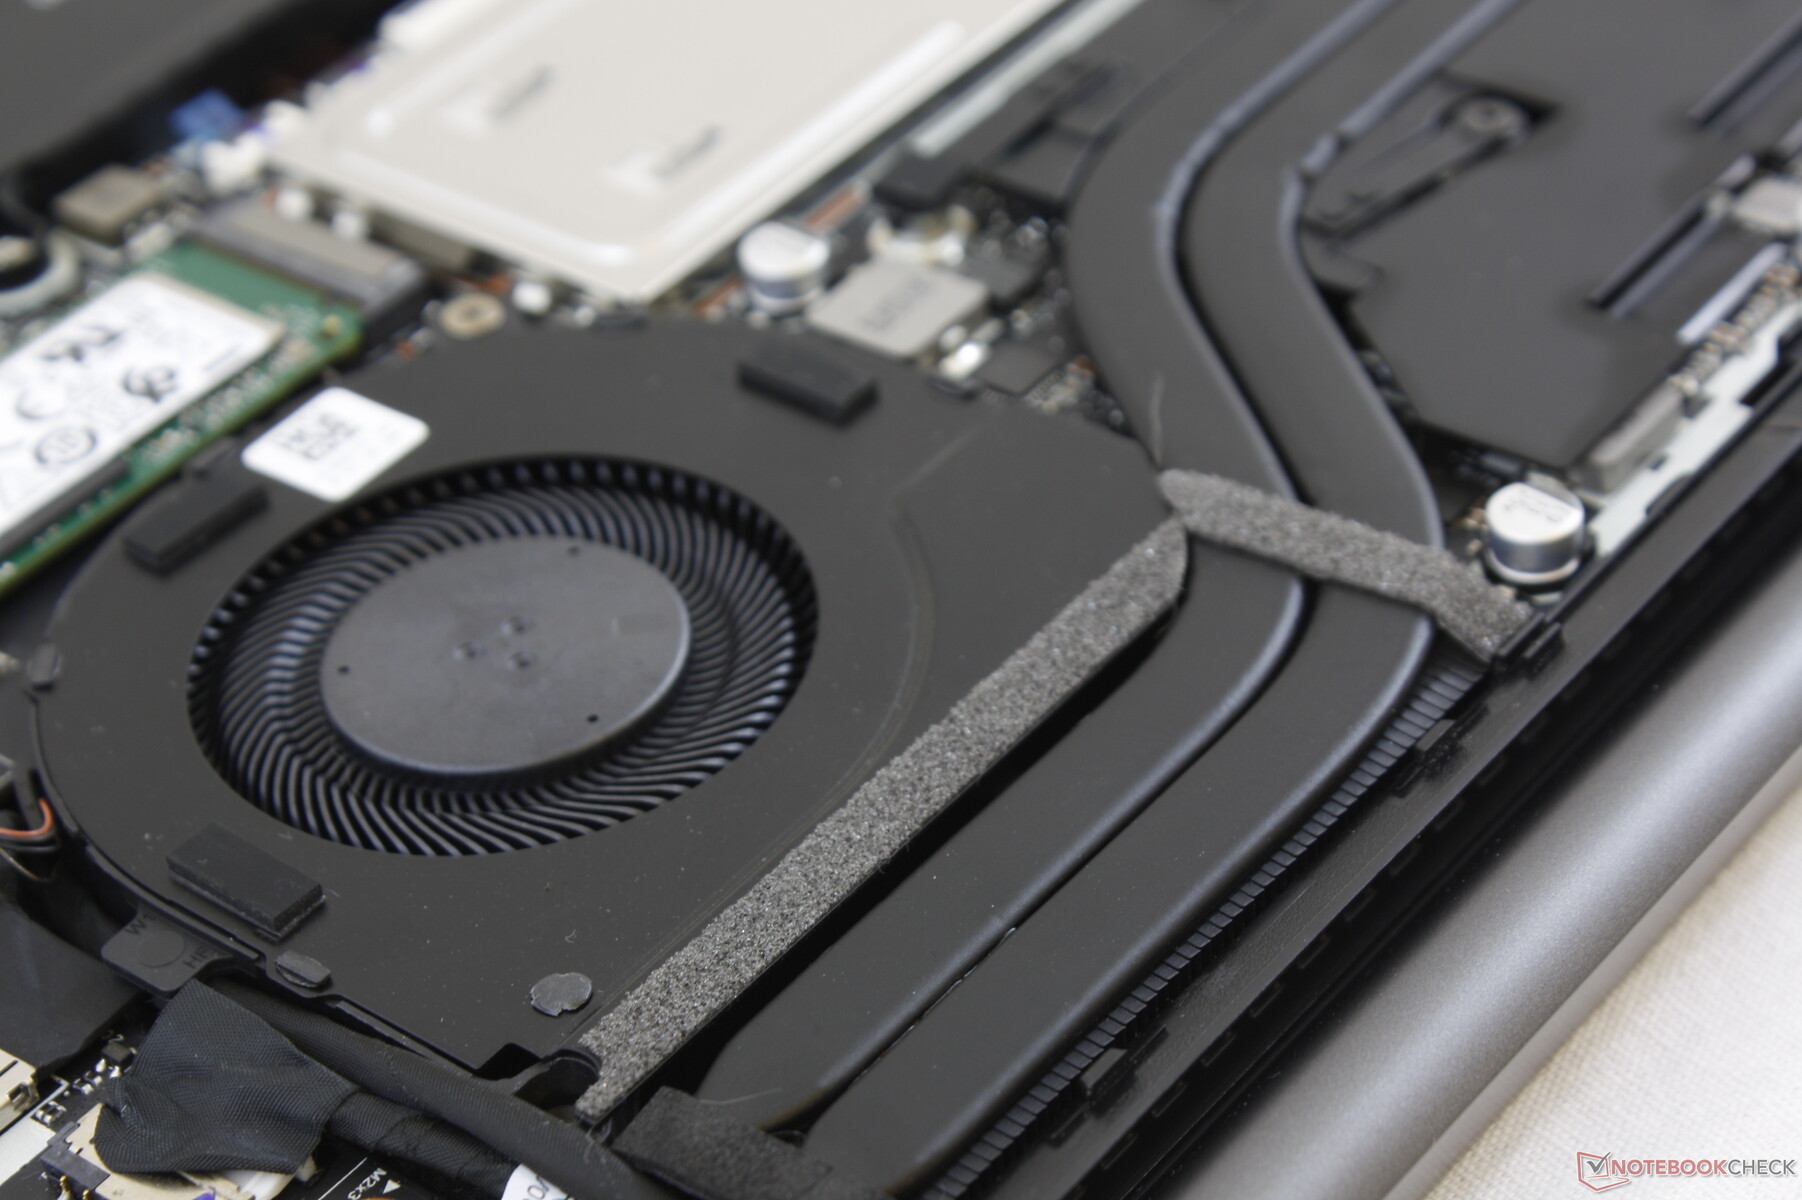
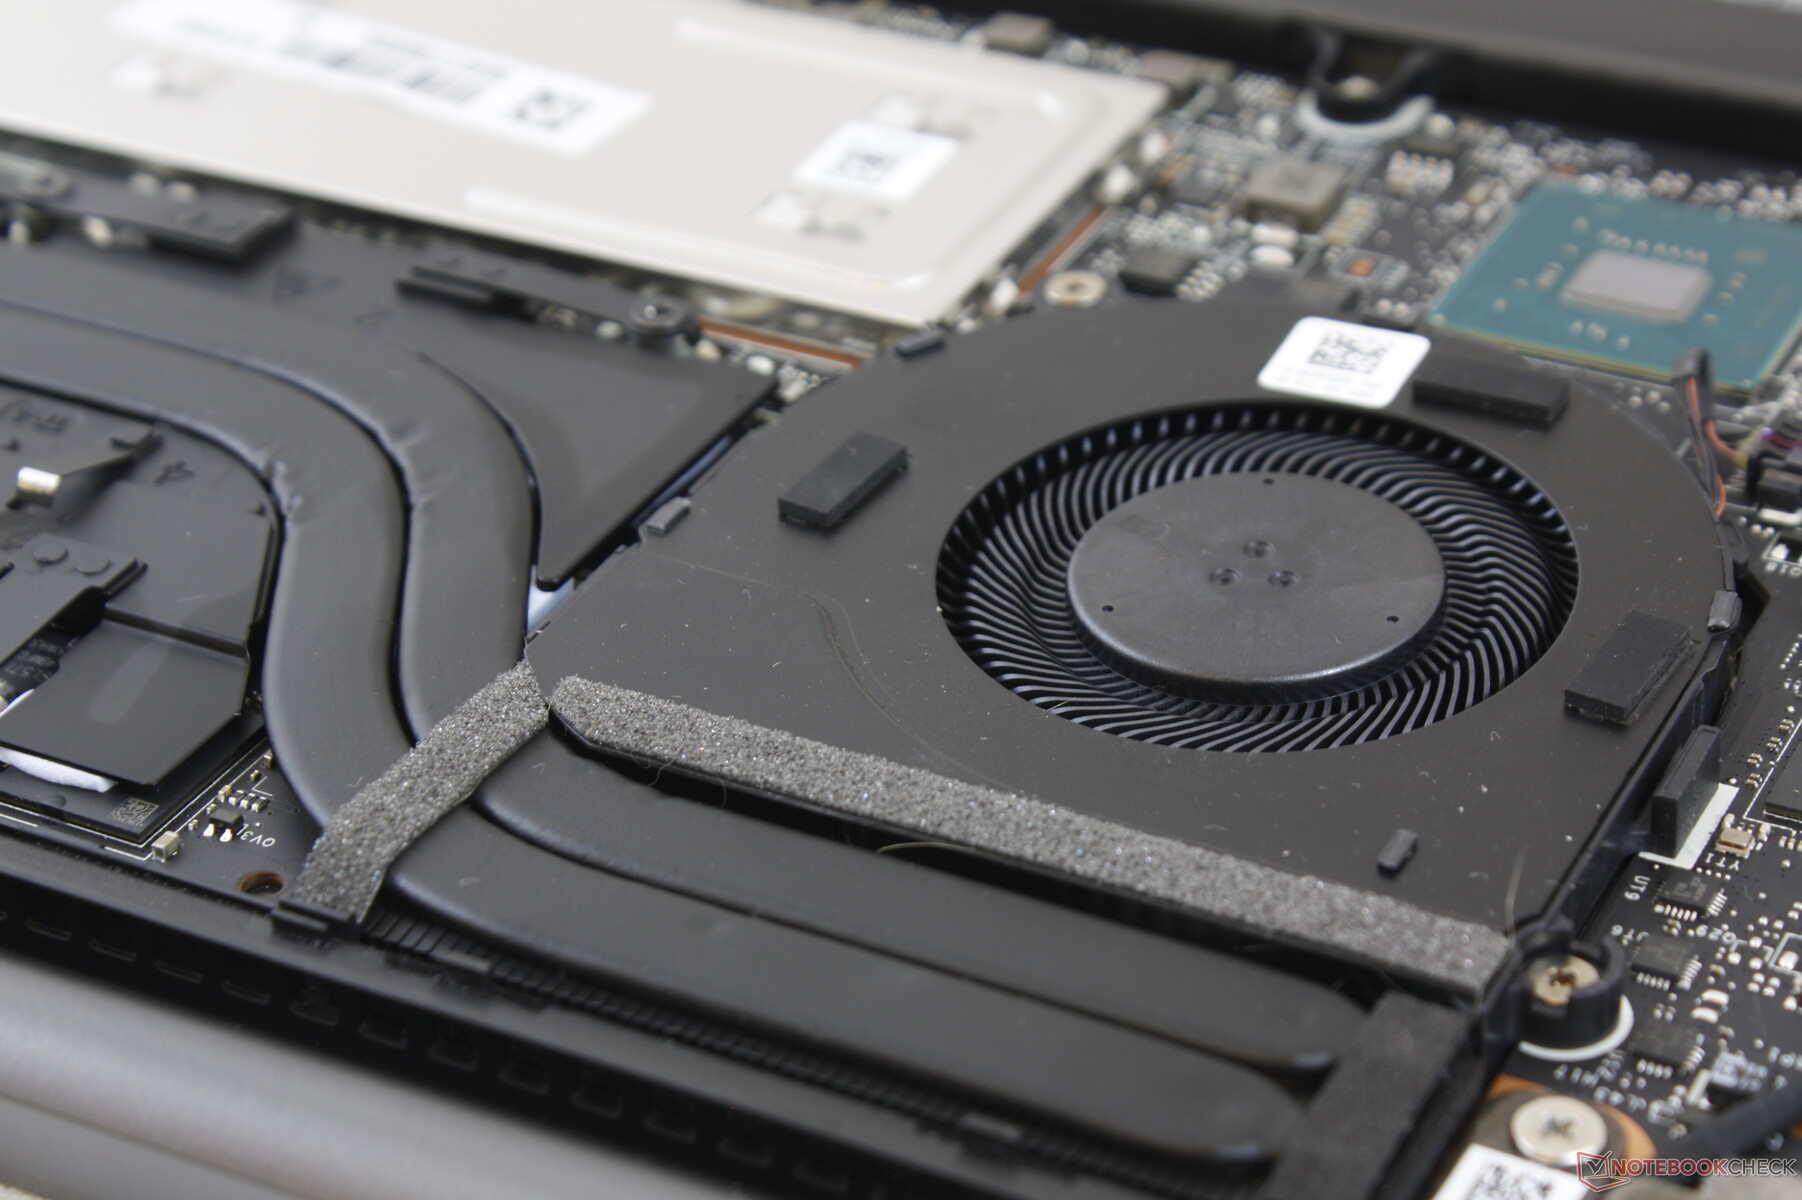
Soğutma çözümü, çift fan ve aralarında her iki işlemci arasında paylaşılan iki ısı borusundan oluşur. Güç Tasarrufu profilinde sistem boştayken veya video akışı yapılırken sessiz olsa da, fanlar uygulamaları başlatırken sık sık titreşme eğilimindedir. Sadece 90 saniye süren 3DMark 06'nın ilk kıyaslama sahnesini çalıştırmak, fanların maksimum 45 dB (A) gürültü seviyesinde çalışmasına neden olmak için zaten yeterlidir. Çalışırken gürültü yaklaşık 43.9 dB (A) seviyesinde sabit kalır Witcher 3, benzer oyun koşullarında sırasıyla XPS 15 ve Spectre x360 15'ten daha sessiz ve daha yüksek olacak. Test birimimizden çok hafif bobin suyunu veya elektronik gürültüyü fark edebiliriz.
| Lenovo IdeaPad S740-15IRH GeForce GTX 1650 Max-Q, i7-9750H, Samsung SSD PM981 MZVLB512HAJQ | Dell XPS 15 7590 9980HK GTX 1650 GeForce GTX 1650 Mobile, i9-9980HK, Toshiba XG6 KXG60ZNV1T02 | HP Spectre X360 15-5ZV31AV GeForce MX250, i7-10510U, Intel SSD 660p 2TB SSDPEKNW020T8 | Lenovo Yoga 730-15IKB GeForce GTX 1050 Mobile, i5-8550U, SK Hynix PC401 512GB M.2 (HFS512GD9TNG) | Asus ZenBook 15 UX534FT-DB77 GeForce GTX 1650 Max-Q, i7-8565U, Samsung SSD PM981 MZVLB1T0HALR | MSI Prestige 15 A10SC GeForce GTX 1650 Max-Q, i7-10710U, Samsung SSD PM981 MZVLB1T0HALR | |
|---|---|---|---|---|---|---|
| Noise | -2% | 4% | 1% | 6% | 3% | |
| kapalı / ortam * (dB) | 28.5 | 28.2 1% | 30.1 -6% | 30.5 -7% | 28.4 -0% | 29.3 -3% |
| Idle Minimum * (dB) | 28.5 | 28.2 1% | 30.1 -6% | 30.5 -7% | 28.4 -0% | 30.1 -6% |
| Idle Average * (dB) | 28.5 | 28.2 1% | 30.1 -6% | 30.5 -7% | 28.4 -0% | 30.2 -6% |
| Idle Maximum * (dB) | 28.5 | 30.4 -7% | 30.1 -6% | 30.5 -7% | 28.4 -0% | 30.2 -6% |
| Load Average * (dB) | 45 | 43.8 3% | 30.1 33% | 37.5 17% | 33.9 25% | 31.5 30% |
| Witcher 3 ultra * (dB) | 43.9 | 47.2 -8% | 39.7 10% | 39.8 9% | 37 16% | |
| Load Maximum * (dB) | 44.7 | 47.2 -6% | 42 6% | 37.5 16% | 40.2 10% | 47 -5% |
* ... daha küçük daha iyidir
Ses yüksekliği
| Boşta |
| 28.5 / 28.5 / 28.5 dB |
| Çalışırken |
| 45 / 44.7 dB |
 | ||
30 dB sessiz 40 dB(A) duyulabilirlik 50 dB(A) gürültülü |
||
min: | ||
Sıcaklık
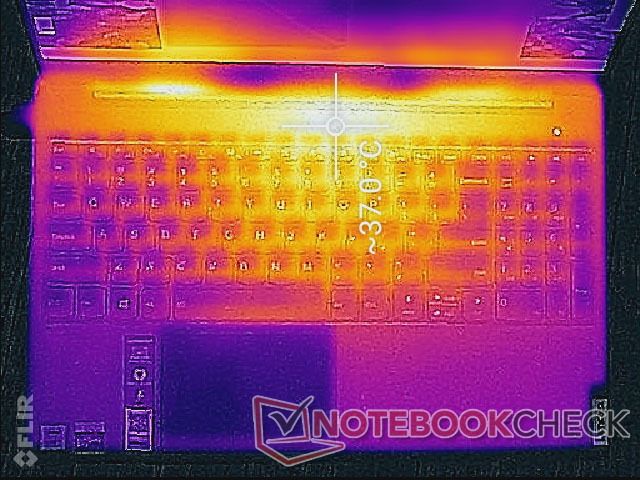
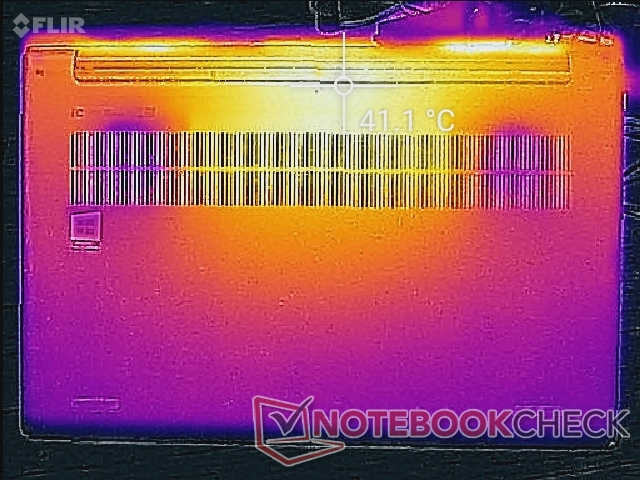
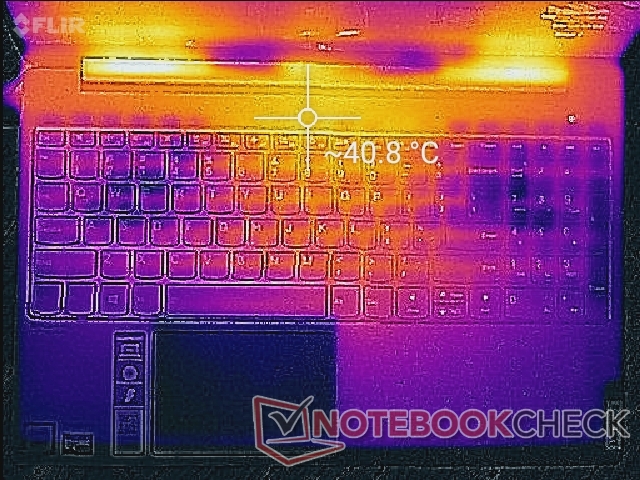
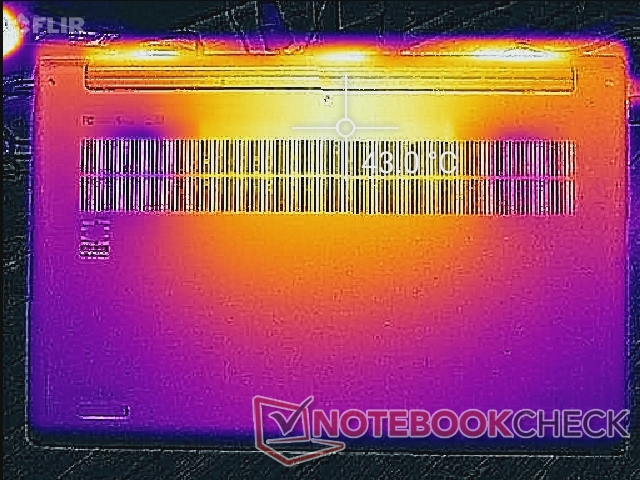
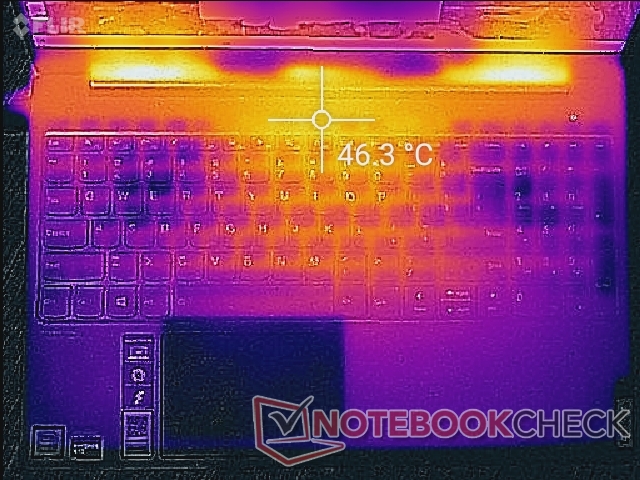
Masaüstünde rölantide çalışırken yüzey sıcaklıkları çok sıcaktır ve aşağıdaki sıcaklık haritalarında gösterildiği gibi 41 C'ye yaklaşan sıcak noktalar vardır. Buna karşılık, GTX 1050 Ti Max-Q grafikli Spectre x360 15, masaüstünde rölantide çalışırken sadece 29 C'de çıkıyor. Lenovo'nun yüksek yüzey sıcaklığı, aşağıdaki Güç Tüketimi bölümünde ayrıntılı olarak açıklandığı gibi alışılmadık derecede yüksek rölanti güç tüketimi ile ilişkilidir. Fanlar bu zorlu koşullar altında daha aktifken sistem rölantideyken sessizdir.
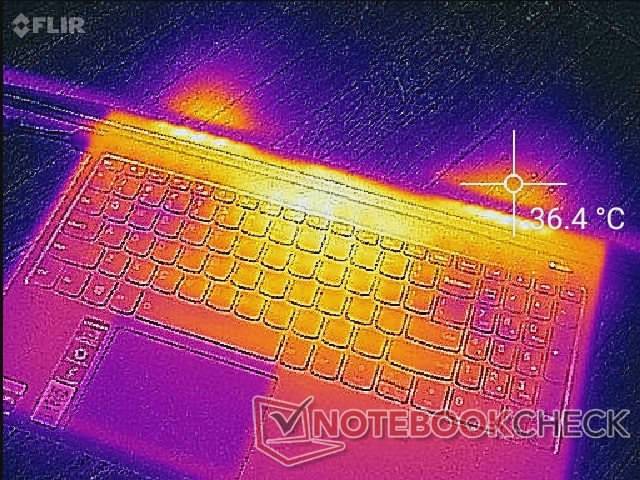
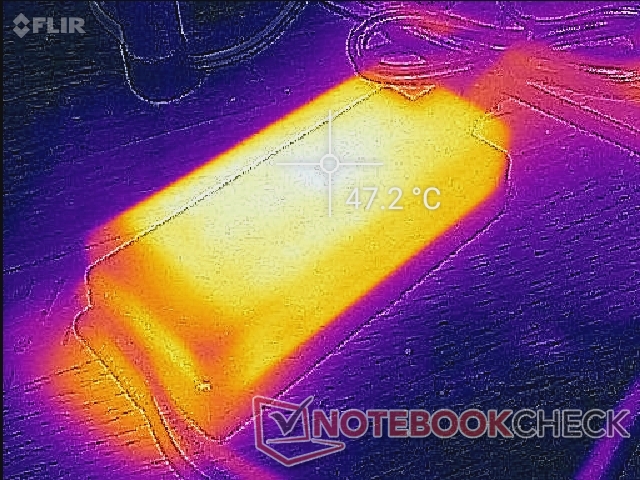
(-) Üst taraftaki maksimum sıcaklık, 36.8 °C / 98 F ortalamasına kıyasla 46.2 °C / 115 F'dir. , Multimedia sınıfı için 21 ile 71 °C arasında değişir.
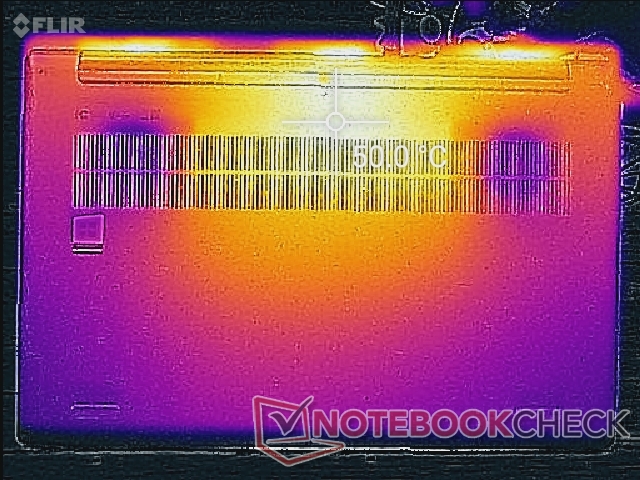
(-) Alt kısım, 39.2 °C / 103 F ortalamasına kıyasla maksimum 50 °C / 122 F'ye kadar ısınır
(+) Boşta kullanımda, üst tarafın ortalama sıcaklığı 31.2 °C / 88 F olup, cihazın 31.3 °C / 88 F.
(±) The Witcher 3 oynarken, üst tarafın ortalama sıcaklığı 32.8 °C / 91 F olup, cihazın 31.3 °C / 88 F.
(+) Avuç içi dayanakları ve dokunmatik yüzey, maksimum 30.2 °C / 86.4 F ile cilt sıcaklığından daha soğuktur ve bu nedenle dokunulduğunda soğuktur.
(±) Benzer cihazların avuç içi dayanağı alanının ortalama sıcaklığı 28.7 °C / 83.7 F (-1.5 °C / -2.7 F) idi.
Stres testi
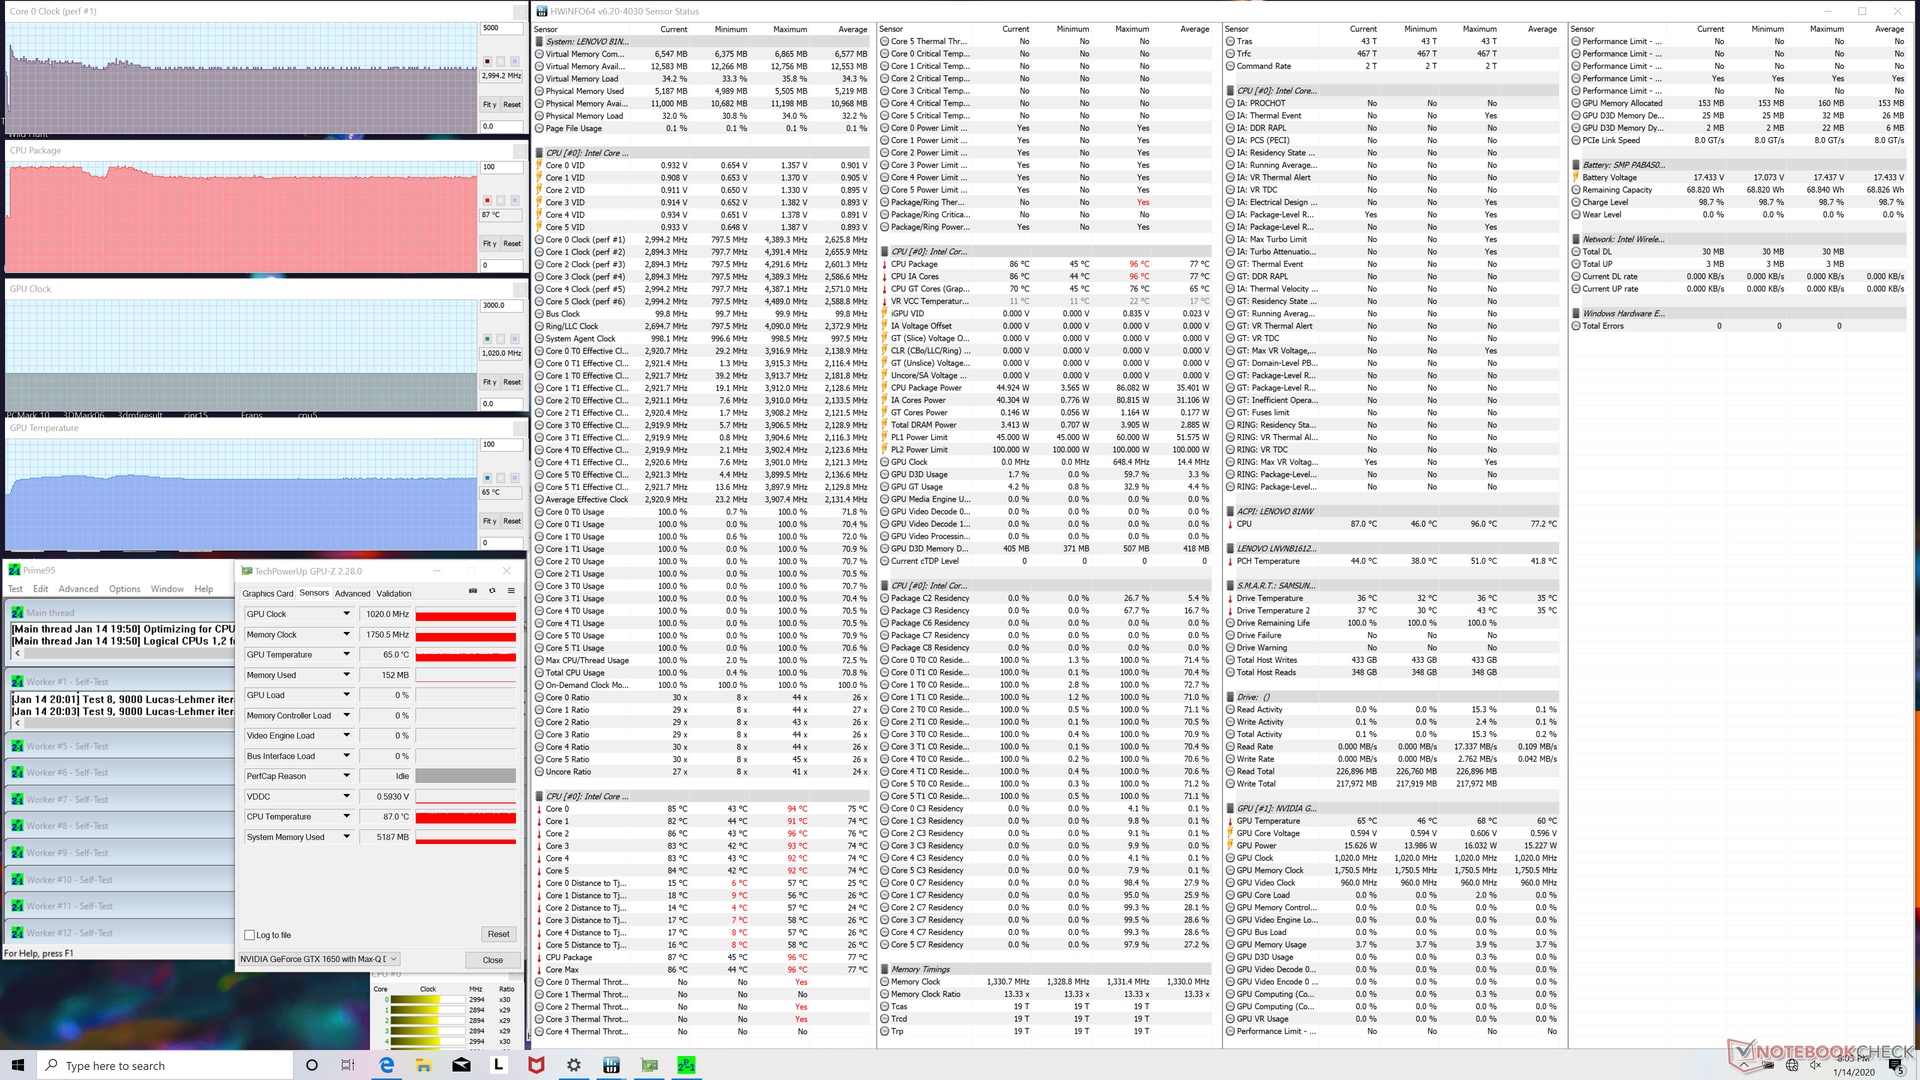
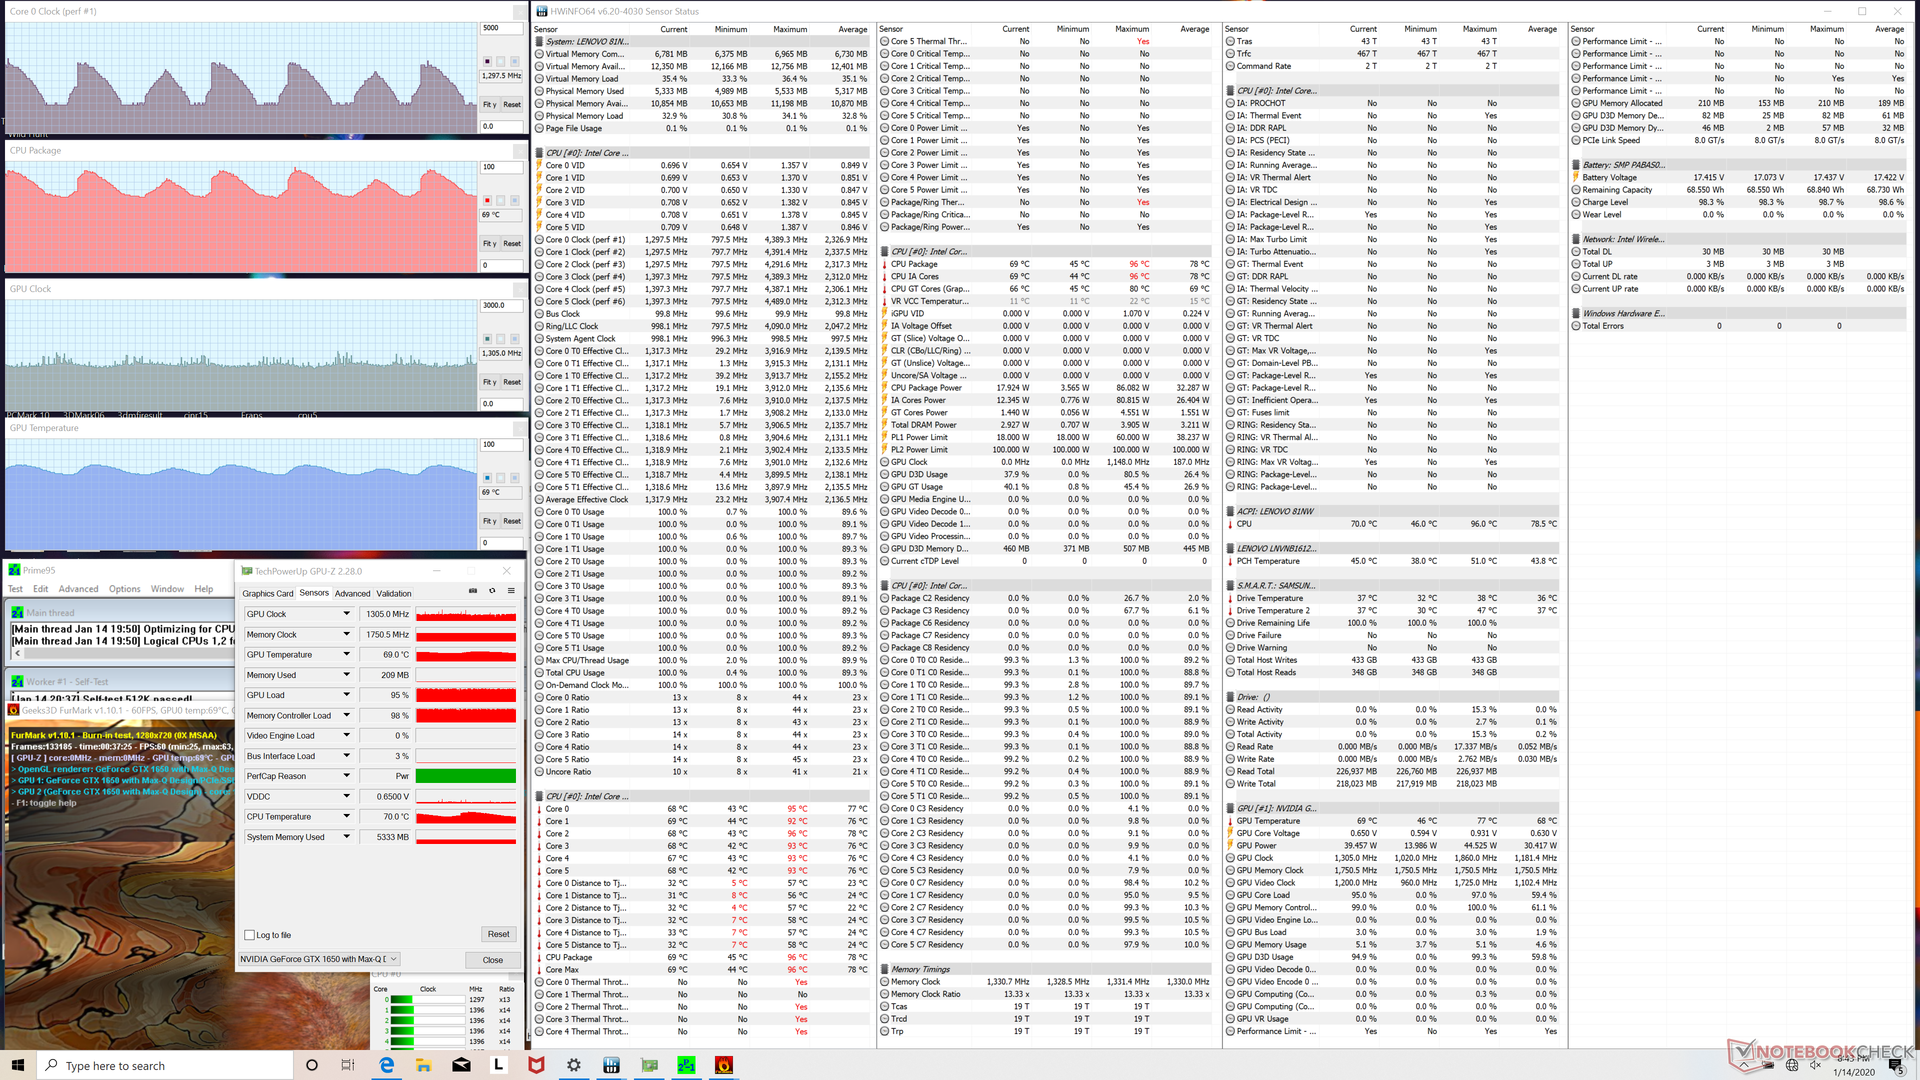
Herhangi bir olası azaltma veya kararlılık sorununu belirlemek için dizüstü bilgisayarı sentetik yüklerle vurgularız. Prime95 çalıştırıldığında, sonraki birkaç dakika için 3,2 ila 3,3 GHz'de dengelenmeden önce saat hızları ilk birkaç saniye için 4 GHz'e konuşacaktı. Daha sonra, 87 C'lik sabit bir çekirdek sıcaklığını korumak için saat hızları 2,9 ila 3 GHz aralığına daha da düşecektir. Hem Prime95 hem de FurMark'ı aynı anda çalıştırmak, hem CPU hem de GPU'nun gösterildiği gibi saat hızlarının ve sıcaklıkların süresiz olarak dönmesine neden olacaktır. Witcher 3'ü çalıştırırken CPU saat hızları 3 GHz ile 4.1 GHz arasında değişirken CPU ve GPU sıcaklıkları da değişecektir. Bununla birlikte, GPU saat hızı, çekirdek sıcaklıkları dalgalansa bile sabit kare hızları sağlamak için 1570 MHz'de sabit kalır. Pillerle çalışan bir 3DMark 11, şebekedayken 12713 ve 11991 noktalarına kıyasla sırasıyla Fizik ve Grafik puanlarını 9712 ve 10002 puan döndürür.
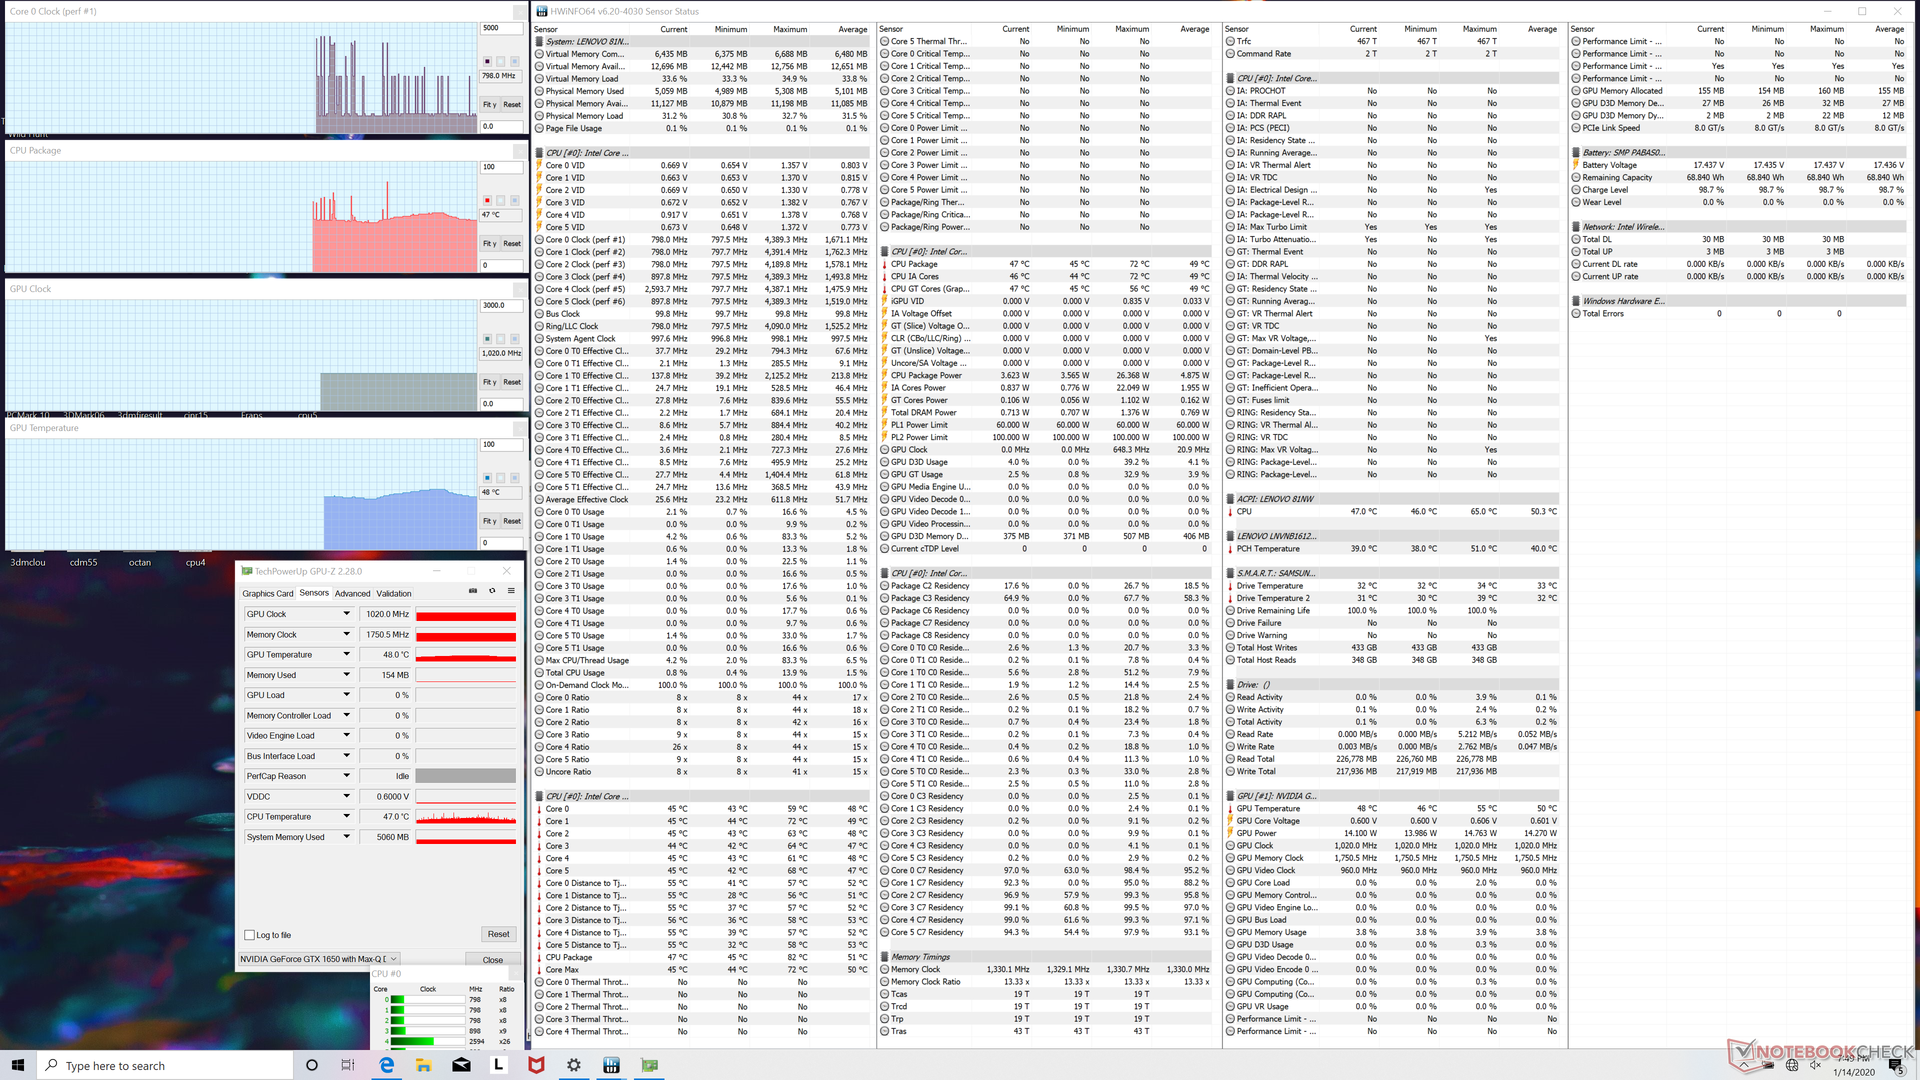
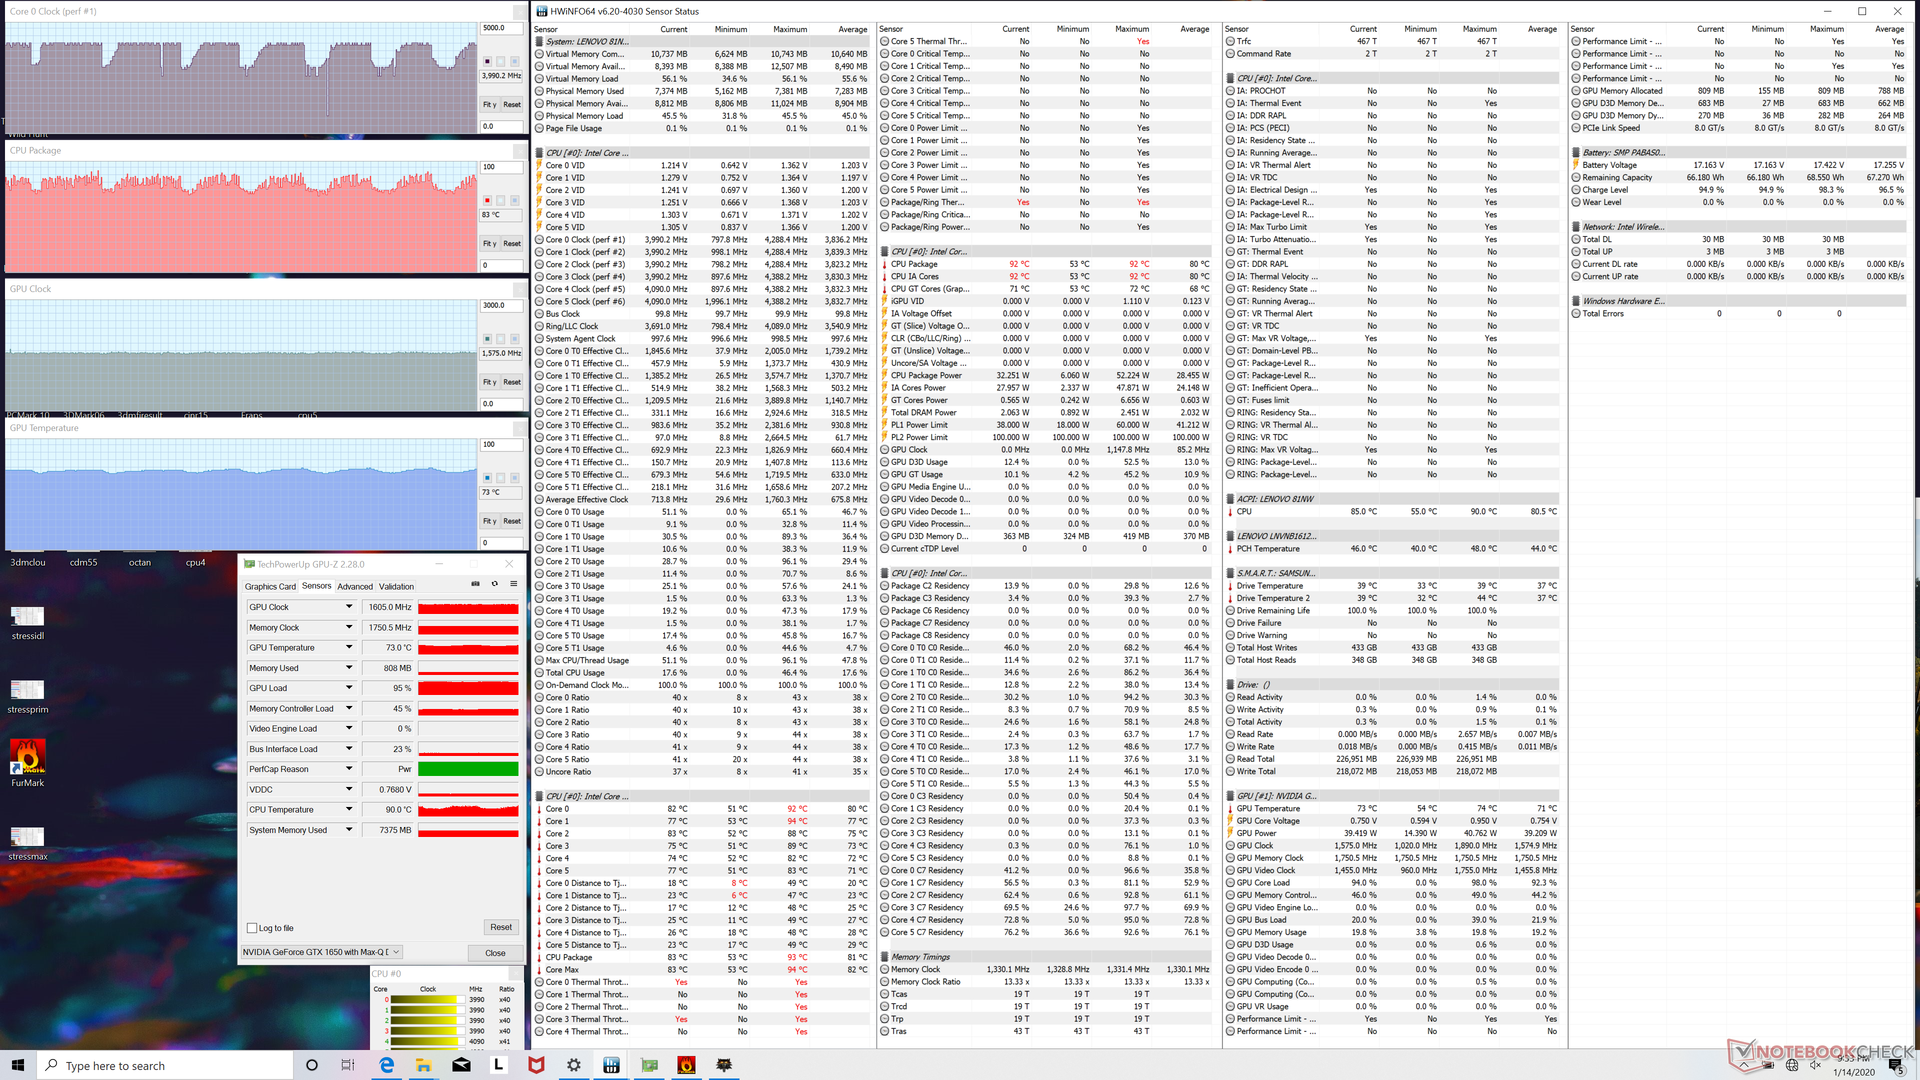
| CPU Clock (GHz) | GPU Clock (MHz) | Average CPU Temperature (°C) | Average GPU Temperature (°C) | |
| System Idle | -- | -- | 47 | 48 |
| Prime95 Stress | 2.9 - 3.0 | -- | 87 | 65 |
| Prime95 + FurMark Stress | 1.3 - 3.2 | 1155 - 1650 | 67 - 92 | 68 - 73 |
| Witcher 3 Stress | 3.0 - 4.1 | 1570 | 60 - 88 | 69 - 74 |
Hoparlörler
Stereo hoparlörlerden gelen ses, iyi bas üretimi olan bir dizüstü bilgisayar için nispeten dengelidir. HP Spectre, daha geniş pembe gürültü grafiğiyle örneklendiği gibi hem daha yüksek ses hem de daha dolgun bir ses deneyimi sunar. Maksimum ses seviyesi avuç içi dayanaklarında statik veya titreşim oluşturmaz.


Lenovo IdeaPad S740-15IRH ses analizi
(±) | hoparlör ses yüksekliği ortalama ama iyi (78.8 dB)
Bas 100 - 315Hz
(±) | azaltılmış bas - ortalama olarak medyandan 10.8% daha düşük
(-) | bas doğrusal değildir (15.2% delta ile önceki frekans)
Ortalar 400 - 2000 Hz
(±) | daha yüksek ortalar - ortalama olarak medyandan 5.1% daha yüksek
(±) | Ortaların doğrusallığı ortalamadır (7.2% delta - önceki frekans)
Yüksekler 2 - 16 kHz
(+) | dengeli yüksekler - medyandan yalnızca 2.1% uzakta
(±) | Yükseklerin doğrusallığı ortalamadır (11.3% delta - önceki frekans)
Toplam 100 - 16.000 Hz
(±) | Genel sesin doğrusallığı ortalamadır (18.5% ortancaya göre fark)
Aynı sınıfla karşılaştırıldığında
» Bu sınıftaki tüm test edilen cihazların %57%'si daha iyi, 7% benzer, 36% daha kötüydü
» En iyisinin deltası 5% idi, ortalama 17% idi, en kötüsü 45% idi
Test edilen tüm cihazlarla karşılaştırıldığında
» Test edilen tüm cihazların %42'si daha iyi, 8 benzer, % 51 daha kötüydü
» En iyisinin deltası 4% idi, ortalama 23% idi, en kötüsü 134% idi
Apple MacBook 12 (Early 2016) 1.1 GHz ses analizi
(+) | hoparlörler nispeten yüksek sesle çalabilir (83.6 dB)
Bas 100 - 315Hz
(±) | azaltılmış bas - ortalama olarak medyandan 11.3% daha düşük
(±) | Bas doğrusallığı ortalamadır (14.2% delta - önceki frekans)
Ortalar 400 - 2000 Hz
(+) | dengeli ortalar - medyandan yalnızca 2.4% uzakta
(+) | orta frekanslar doğrusaldır (5.5% deltadan önceki frekansa)
Yüksekler 2 - 16 kHz
(+) | dengeli yüksekler - medyandan yalnızca 2% uzakta
(+) | yüksekler doğrusaldır (4.5% deltadan önceki frekansa)
Toplam 100 - 16.000 Hz
(+) | genel ses doğrusaldır (10.2% ortancaya göre fark)
Aynı sınıfla karşılaştırıldığında
» Bu sınıftaki tüm test edilen cihazların %7%'si daha iyi, 2% benzer, 90% daha kötüydü
» En iyisinin deltası 5% idi, ortalama 18% idi, en kötüsü 53% idi
Test edilen tüm cihazlarla karşılaştırıldığında
» Test edilen tüm cihazların %5'si daha iyi, 1 benzer, % 94 daha kötüydü
» En iyisinin deltası 4% idi, ortalama 23% idi, en kötüsü 134% idi
Enerji yönetimi
Güç tüketimi
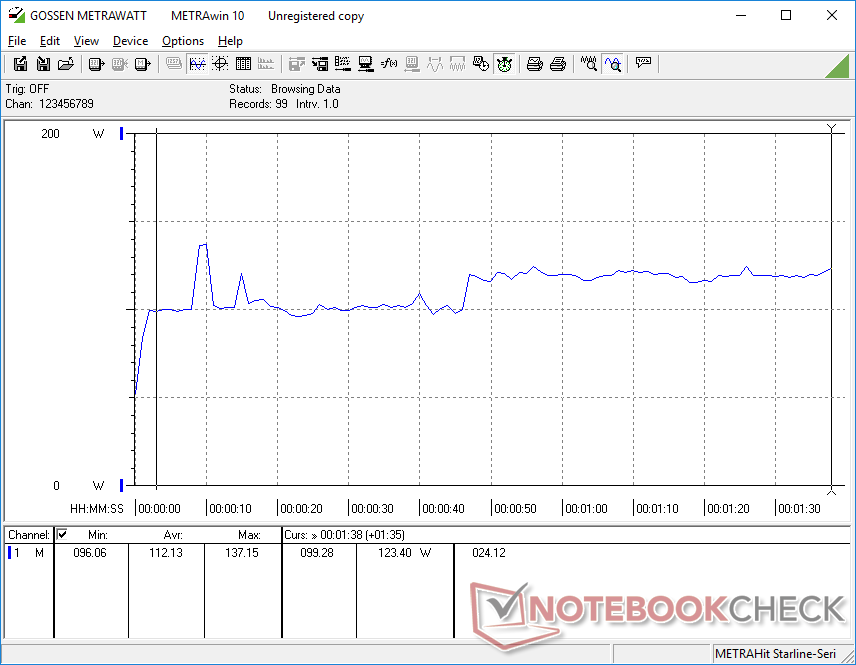
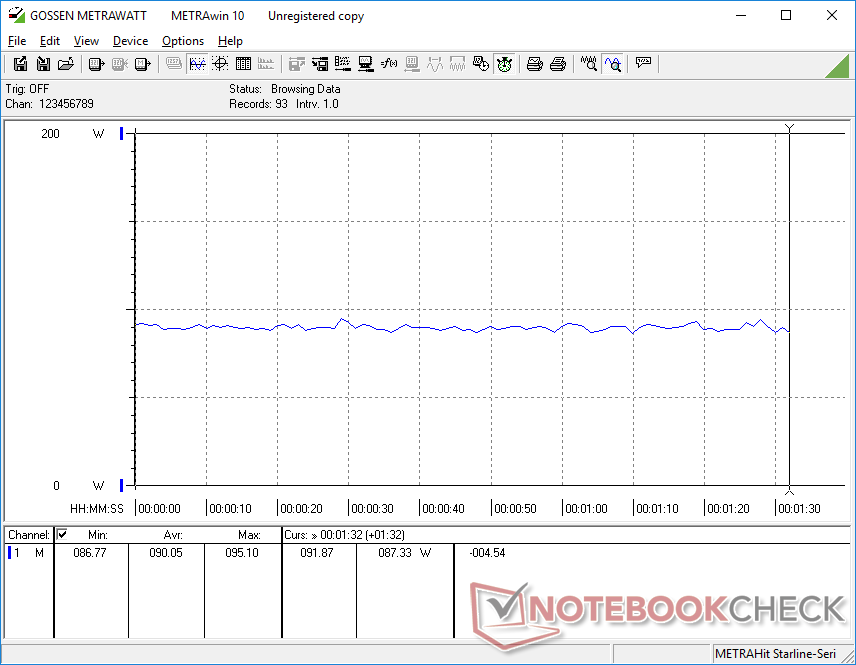
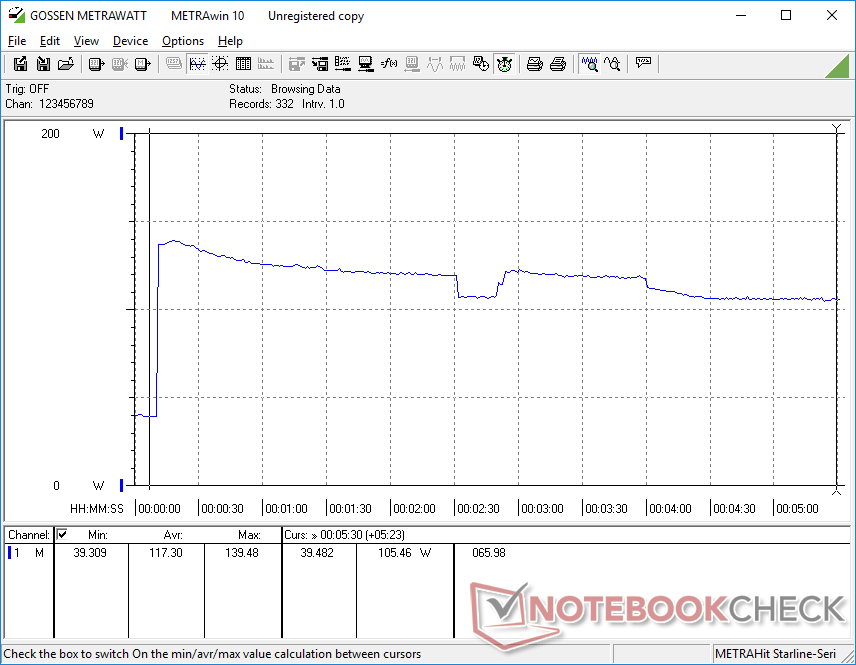
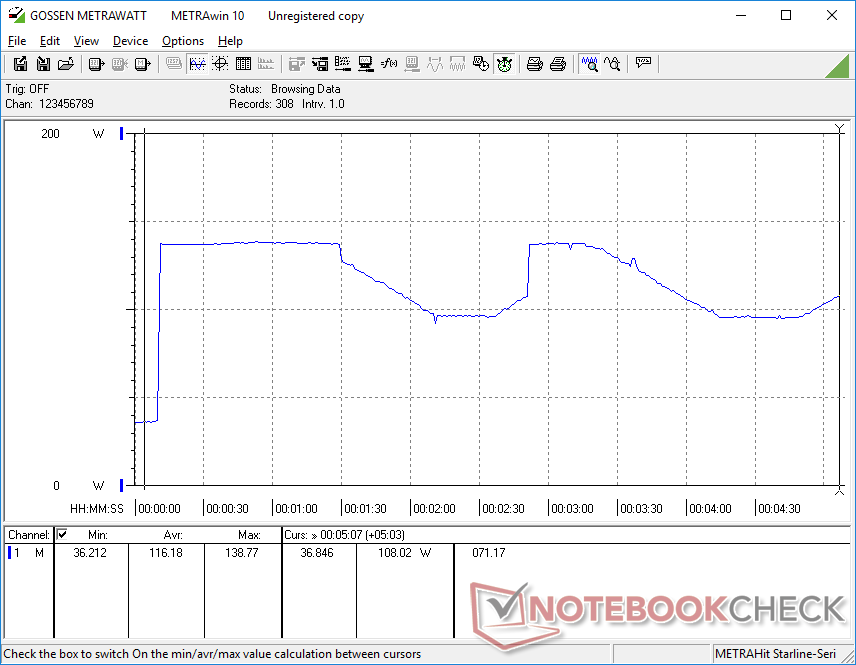
Düşük yükler sırasında güç tüketimi davranışı alışılmadık ve istenmeyen bir durumdur. Masaüstünde rölanti, diğer birçok multimedya dizüstü bilgisayarda yalnızca 5 W ila 24 W ile karşılaştırıldığında 28 W ve 32 W arasında bir yer tüketir. Ayrıca, kapak kapatıldığında ve Windows Connected Standby nedeniyle büyük olasılıkla "Uyku" moduna alındığında güç tüketimi 27 W'da çok yüksek kalır.Neyse ki, daha yüksek yükler altında güç tüketimi daha normal hale gelir. Örneğin Witcher 3'ü çalıştırmak, aynı CPU ve GPU ile donatılmış Yoga C940 15'e çok yakın olmak için yaklaşık 90 W tüketir. Belki de tesadüfen değil, GTX 1660 Ti GPU'lu Maingear Vector 15 oyun dizüstü bilgisayarı, yüzde 77 daha yüksek 3DMark karşılaştırma sonuçları için yaklaşık yüzde 77 daha fazla güç tüketiyor. Orta büyüklükte (~ 14.4) maksimum 139 W tüketim kaydedebiliyoruz x 6,3 x 3 cm) 135 W AC adaptör. Aşağıdaki Stres Testi gözlemlerimizi yansıtmak için aşağıdaki grafiklerde gösterildiği gibi yüksek işleme yükleri altındayken tüketim döngüleri.
| Kapalı / Bekleme modu | |
| Boşta | |
| Çalışırken |
|
Key:
min: | |
| Lenovo IdeaPad S740-15IRH i7-9750H, GeForce GTX 1650 Max-Q, Samsung SSD PM981 MZVLB512HAJQ, IPS, 3840x2160, 15.6" | Dell XPS 15 7590 9980HK GTX 1650 i9-9980HK, GeForce GTX 1650 Mobile, Toshiba XG6 KXG60ZNV1T02, OLED, 3840x2160, 15.6" | HP Spectre X360 15-5ZV31AV i7-10510U, GeForce MX250, Intel SSD 660p 2TB SSDPEKNW020T8, IPS, 3840x2160, 15.6" | Lenovo Yoga 730-15IKB i5-8550U, GeForce GTX 1050 Mobile, SK Hynix PC401 512GB M.2 (HFS512GD9TNG), IPS, 3840x2160, 15.6" | Asus ZenBook 15 UX534FT-DB77 i7-8565U, GeForce GTX 1650 Max-Q, Samsung SSD PM981 MZVLB1T0HALR, IPS, 1920x1080, 15.6" | MSI Prestige 15 A10SC i7-10710U, GeForce GTX 1650 Max-Q, Samsung SSD PM981 MZVLB1T0HALR, IPS, 3840x2160, 15.6" | |
|---|---|---|---|---|---|---|
| Power Consumption | 31% | 56% | 61% | 41% | 43% | |
| Idle Minimum * (Watt) | 28.6 | 6.2 78% | 5.2 82% | 4.8 83% | 5 83% | 6.1 79% |
| Idle Average * (Watt) | 26.5 | 9.6 64% | 8.5 68% | 10.1 62% | 13.2 50% | 13.2 50% |
| Idle Maximum * (Watt) | 32.1 | 21.2 34% | 8.7 73% | 10.7 67% | 24 25% | 19.2 40% |
| Load Average * (Watt) | 112.2 | 104.3 7% | 65.6 42% | 44 61% | 70 38% | 75 33% |
| Witcher 3 ultra * (Watt) | 90.1 | 91.7 -2% | 56.5 37% | 63.3 30% | 74 18% | |
| Load Maximum * (Watt) | 138.8 | 135.3 3% | 92.4 33% | 94.7 32% | 114 18% | 89.7 35% |
* ... daha küçük daha iyidir
Pil ömrü
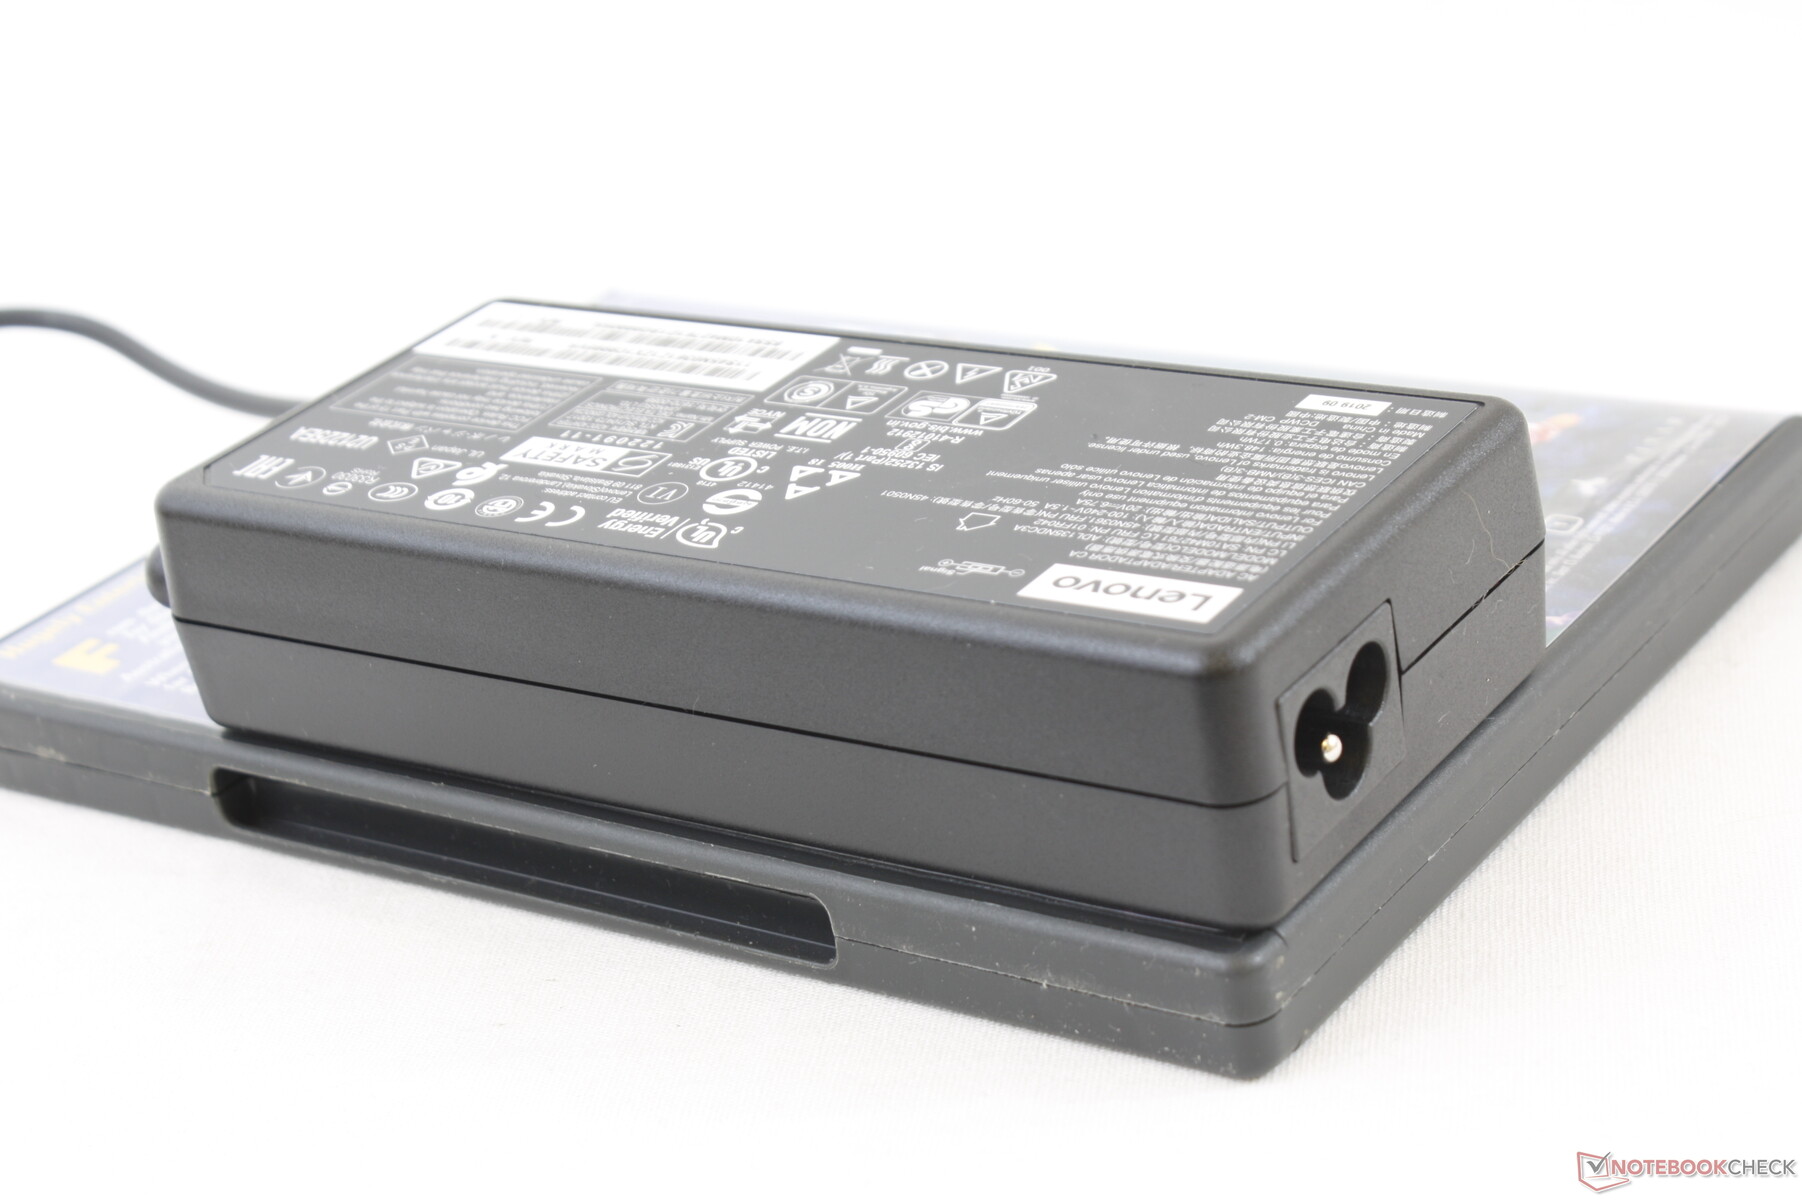
69 Wh pil, eski Yoga 730-15IKB'ninkinden daha büyük olmakla birlikte, hem Dell XPS 15 hem de Spectre x360 15'teki pillerden daha küçüktür. Pil ömrü, 9 saatten fazla gerçek dünya WLAN kullanımında mükemmeldir. Birlikte verilen AC adaptörüyle şarj etmek son derece yavaştır. Diğer dizüstü bilgisayarların çoğunun yalnızca 1,5 ila 2 saatine kıyasla, boştan tam kapasiteye şarj edilirse 4 ila 5 saat beklemeyi bekleyin. Ayrıca, sistem USB Type-C ile şarj edilemez.
| Lenovo IdeaPad S740-15IRH i7-9750H, GeForce GTX 1650 Max-Q, 69 Wh | Dell XPS 15 7590 9980HK GTX 1650 i9-9980HK, GeForce GTX 1650 Mobile, 97 Wh | HP Spectre X360 15-5ZV31AV i7-10510U, GeForce MX250, 84 Wh | Lenovo Yoga 730-15IKB i5-8550U, GeForce GTX 1050 Mobile, 51.5 Wh | Asus ZenBook 15 UX534FT-DB77 i7-8565U, GeForce GTX 1650 Max-Q, 71 Wh | MSI Prestige 15 A10SC i7-10710U, GeForce GTX 1650 Max-Q, 82 Wh | |
|---|---|---|---|---|---|---|
| Pil Çalışma Süresi | 127% | 139% | -8% | 127% | 79% | |
| Reader / Idle (h) | 12.4 | 15.2 23% | 22.6 82% | 11.6 -6% | 21.5 73% | 19.1 54% |
| WiFi v1.3 (h) | 9 | 7.8 -13% | 10.8 20% | 6.2 -31% | 8.4 -7% | 7.6 -16% |
| Load (h) | 0.7 | 3.3 371% | 2.9 314% | 0.8 14% | 2.9 314% | 2.1 200% |
Artılar
Eksiler
Karar
Lenovo IdeaPad S740, orta sınıf ve ileri teknoloji parçaların bir karışımıdır. Core i7 CPU, GeForce GTX GPU, parlak 4K UHD ekran, Samsung SSD, çift Thunderbolt 3 bağlantı noktası ve dar çerçeveler, Lenovo'nun taklit etmeye çalıştığı Dell XPS 15 ve HP Spectre x360 15 ile rekabet ediyor. Bu arada, sığ klavye, sınırlı bağlantı noktası seçenekleri ve nispeten esnek kasa, ucuz bir IdeaPad'i daha yansıtıyor. Lenovo, aynı Core i7-9750H CPU ve GTX 1650/1650 Max-Q GPU ile yapılandırıldıysa Dell ve HP'den biraz daha ucuzdur, ancak daha düşük bir yazma deneyimi ve daha zayıf bir tasarım elde edersiniz. diğer IdeaPad modelleri ise S740 hem görseller hem de performans açısından sınıfının en iyisi. Giriş seviyesi bir oyun makinesinin gücü, onlarla yaygın olarak ilişkili olan büyüklük veya şatafatlı görünüm olmadan var. Böylece, sistem oyun, ofis, seyahat ve fiyat arasında fiyat aralığındaki diğer birçok alternatiften daha iyi bir denge kurar. Dell XPS veya HP Spectre'den daha ucuzken, tipik IdeaPad'ınızdan daha pahalı. IdeaPad S740, görsel ve taşınabilirlik bölümlerinden çok fazla ödün vermeden üst düzey bir multimedya makinesinin performansını isteyenler içindir.
Lenovo IdeaPad S740-15IRH
- 01/25/2020 v7 (old)
Allen Ngo
Price comparison
