HP ProBook 450 G7 Core i7 Dizüstü Bilgisayar İncelemesi: Ryzen 7 ProBook 455 G7'den Daha İyi mi?
Geçen ayın başlarında, AMD destekli HP ProBook 455 G7'yi kontrol etmiştik ve ~ 1000 $ fiyat noktası göz önüne alındığında kullanışlı özelliklerle dolu olduğunu gördük. ProBook 455 G7'nin Intel sürümü olan HP ProBook 450 G7, işlemcilerdeki bariz değişiklik ve diğer küçük değişiklikler için aynı tasarruf sağlar. Potansiyel müşteriler kaçınılmaz olarak kendilerine şunu soracaklar: Hangisi daha iyi? ProBook 450 G7 test ünitemiz bugün Intel 10. nesil Comet Lake-U Core i7-10510U CPU ve GeForce MX250 GPU ile donatılmış CUKUSA'dan geliyor. ne kadar depolama alanı veya RAM yapılandırıldı. Bu, pil ömründen fan gürültüsüne ve performansa kadar değişen temel açılardan Intel ProBook 450 G7'yi AMD ProBook 455 G7 ile doğrudan karşılaştırmak için mükemmel bir fırsat sunuyor. Klavye ve diğer fiziksel özellikler hakkında ek ayrıntılar, iki sistem aynı kasa tasarımını paylaştığı için ProBook 455 G7 incelememizde bulunabilir.Daha fazla HP incelemesi: ProBook 450 G6Spectre x360 15Omen 15EliteBook 735 G6Pavilion Gaming 15
Derecelendirme | Tarih | Modeli | Ağırlık | Yükseklik | Boyut | Çözünürlük | Fiyat |
|---|---|---|---|---|---|---|---|
| 81.4 % v7 (old) | 08/2020 | HP ProBook 450 G7 8WC04UT i7-10510U, GeForce MX250 | 1.9 kg | 19 mm | 15.60" | 1920x1080 | |
| 82.6 % v7 (old) | 09/2020 | HP ProBook 455 G7-175W8EA R7 4700U, Vega 7 | 1.8 kg | 19 mm | 15.60" | 1920x1080 | |
| 80.1 % v7 (old) | 02/2020 | MSI Modern 15 A10RB i7-10510U, GeForce MX250 | 1.6 kg | 15.9 mm | 15.60" | 1920x1080 | |
| 79.6 % v6 (old) | Dell Latitude 15 3590 i5-8250U, UHD Graphics 620 | 2.1 kg | 22 mm | 15.60" | 1920x1080 | ||
| 83.2 % v7 (old) | 11/2019 | Lenovo ThinkPad L590-20Q70019GE i5-8265U, UHD Graphics 620 | 2 kg | 23 mm | 15.60" | 1920x1080 | |
| 82.9 % v7 (old) | Dynabook Tecra X50-F i7-8665U, UHD Graphics 620 | 1.4 kg | 17.6 mm | 15.60" | 1920x1080 |
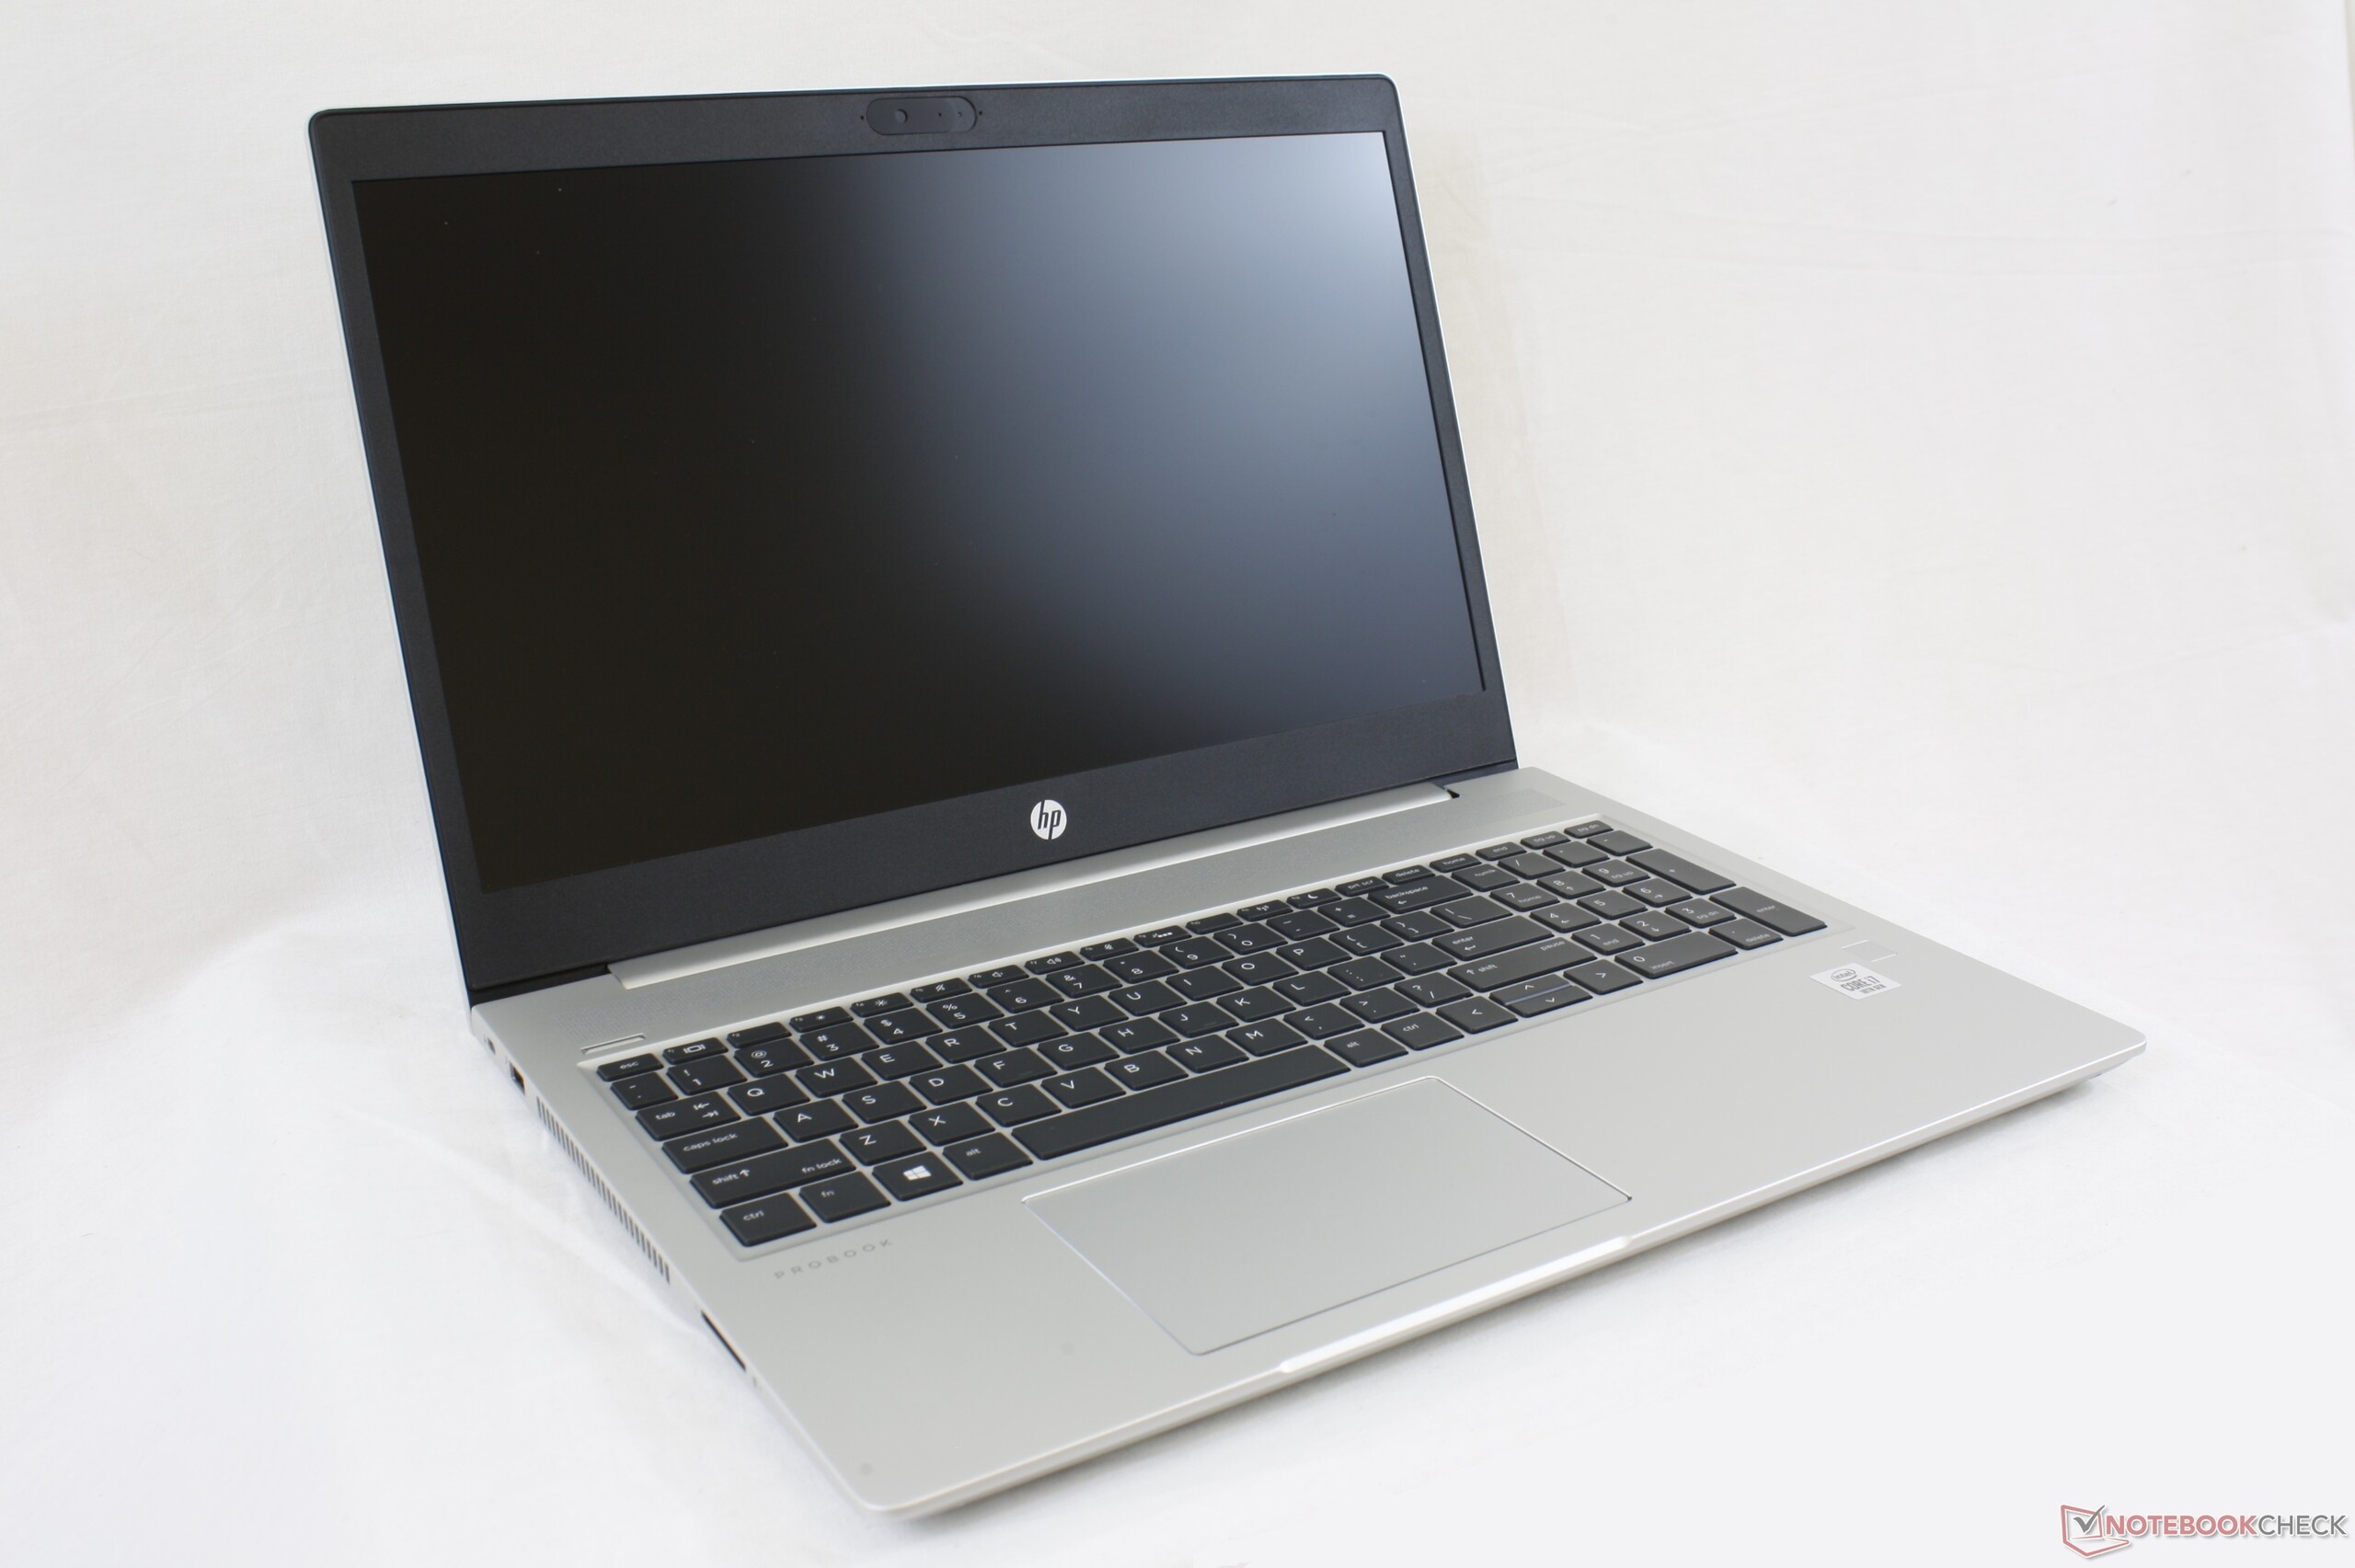
Durum
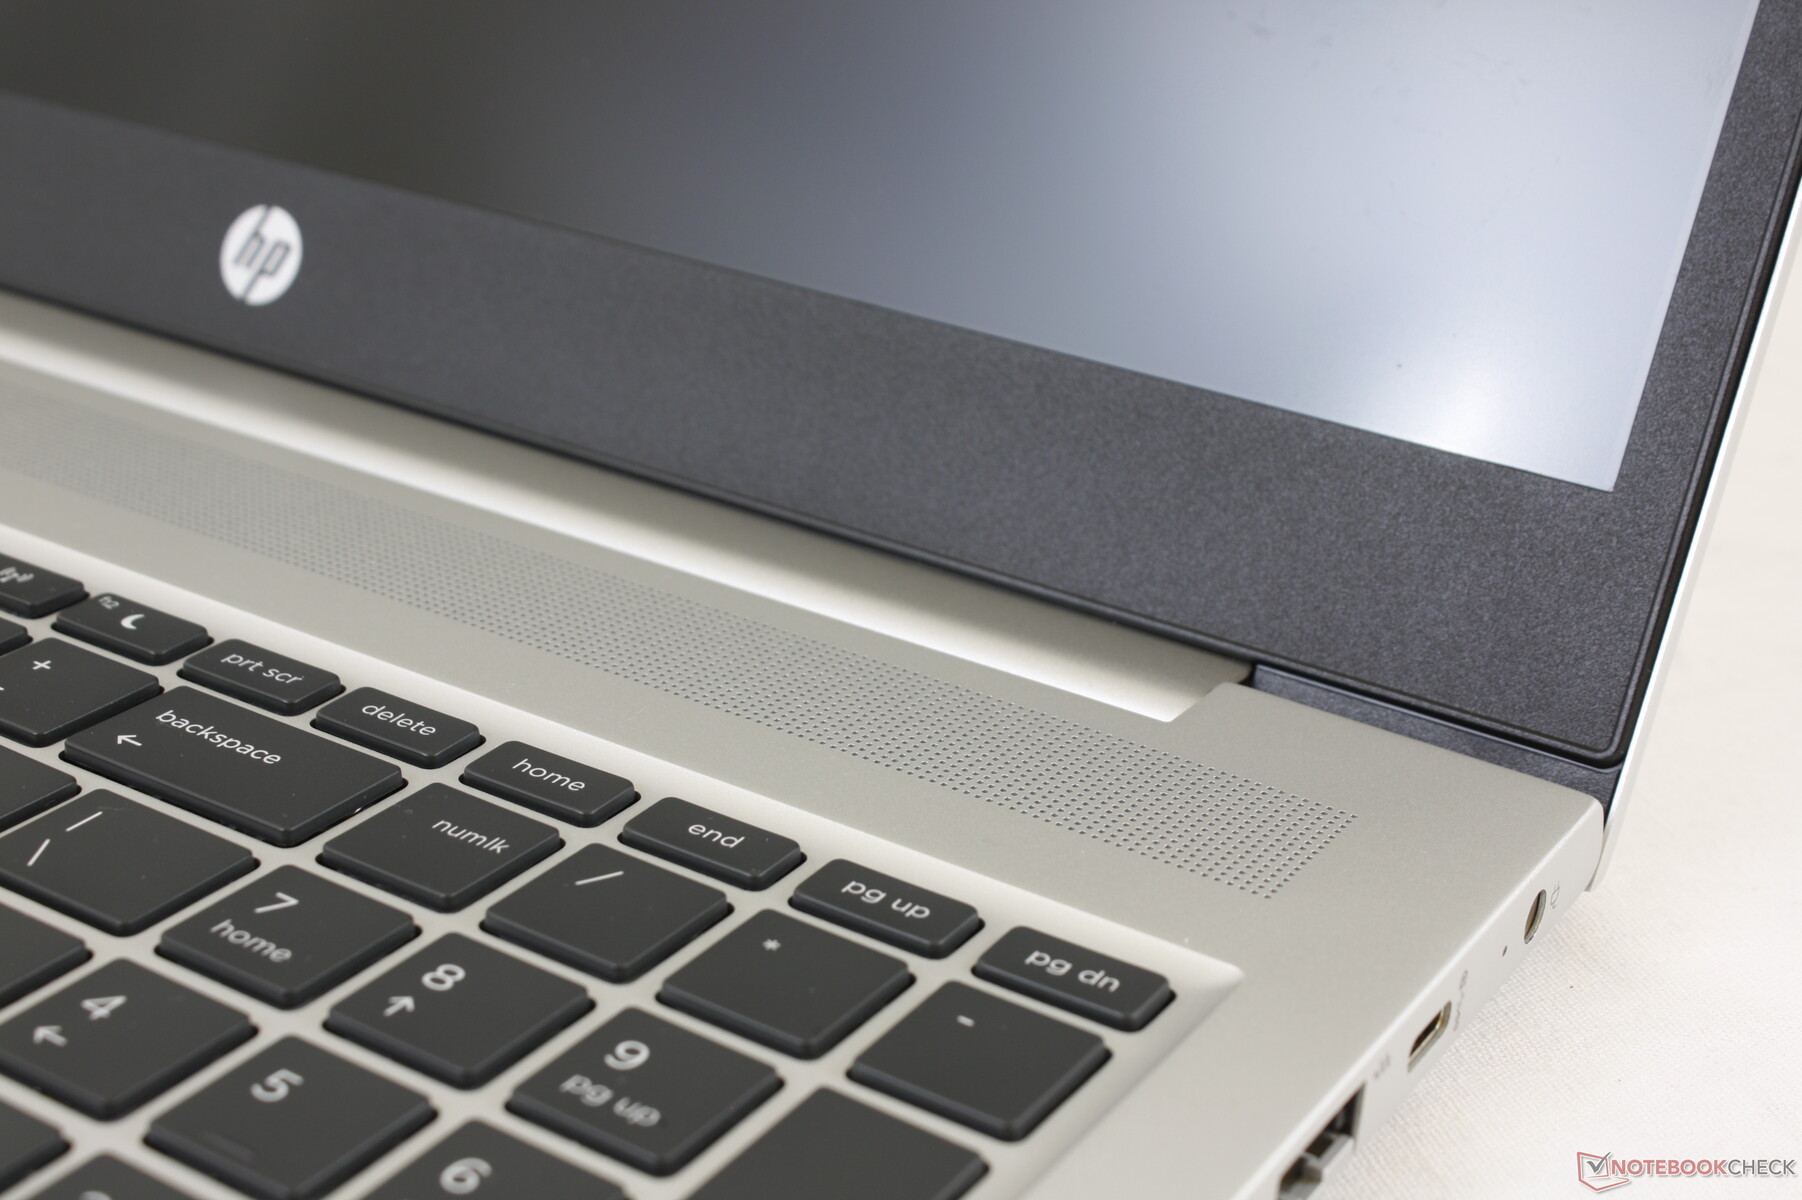
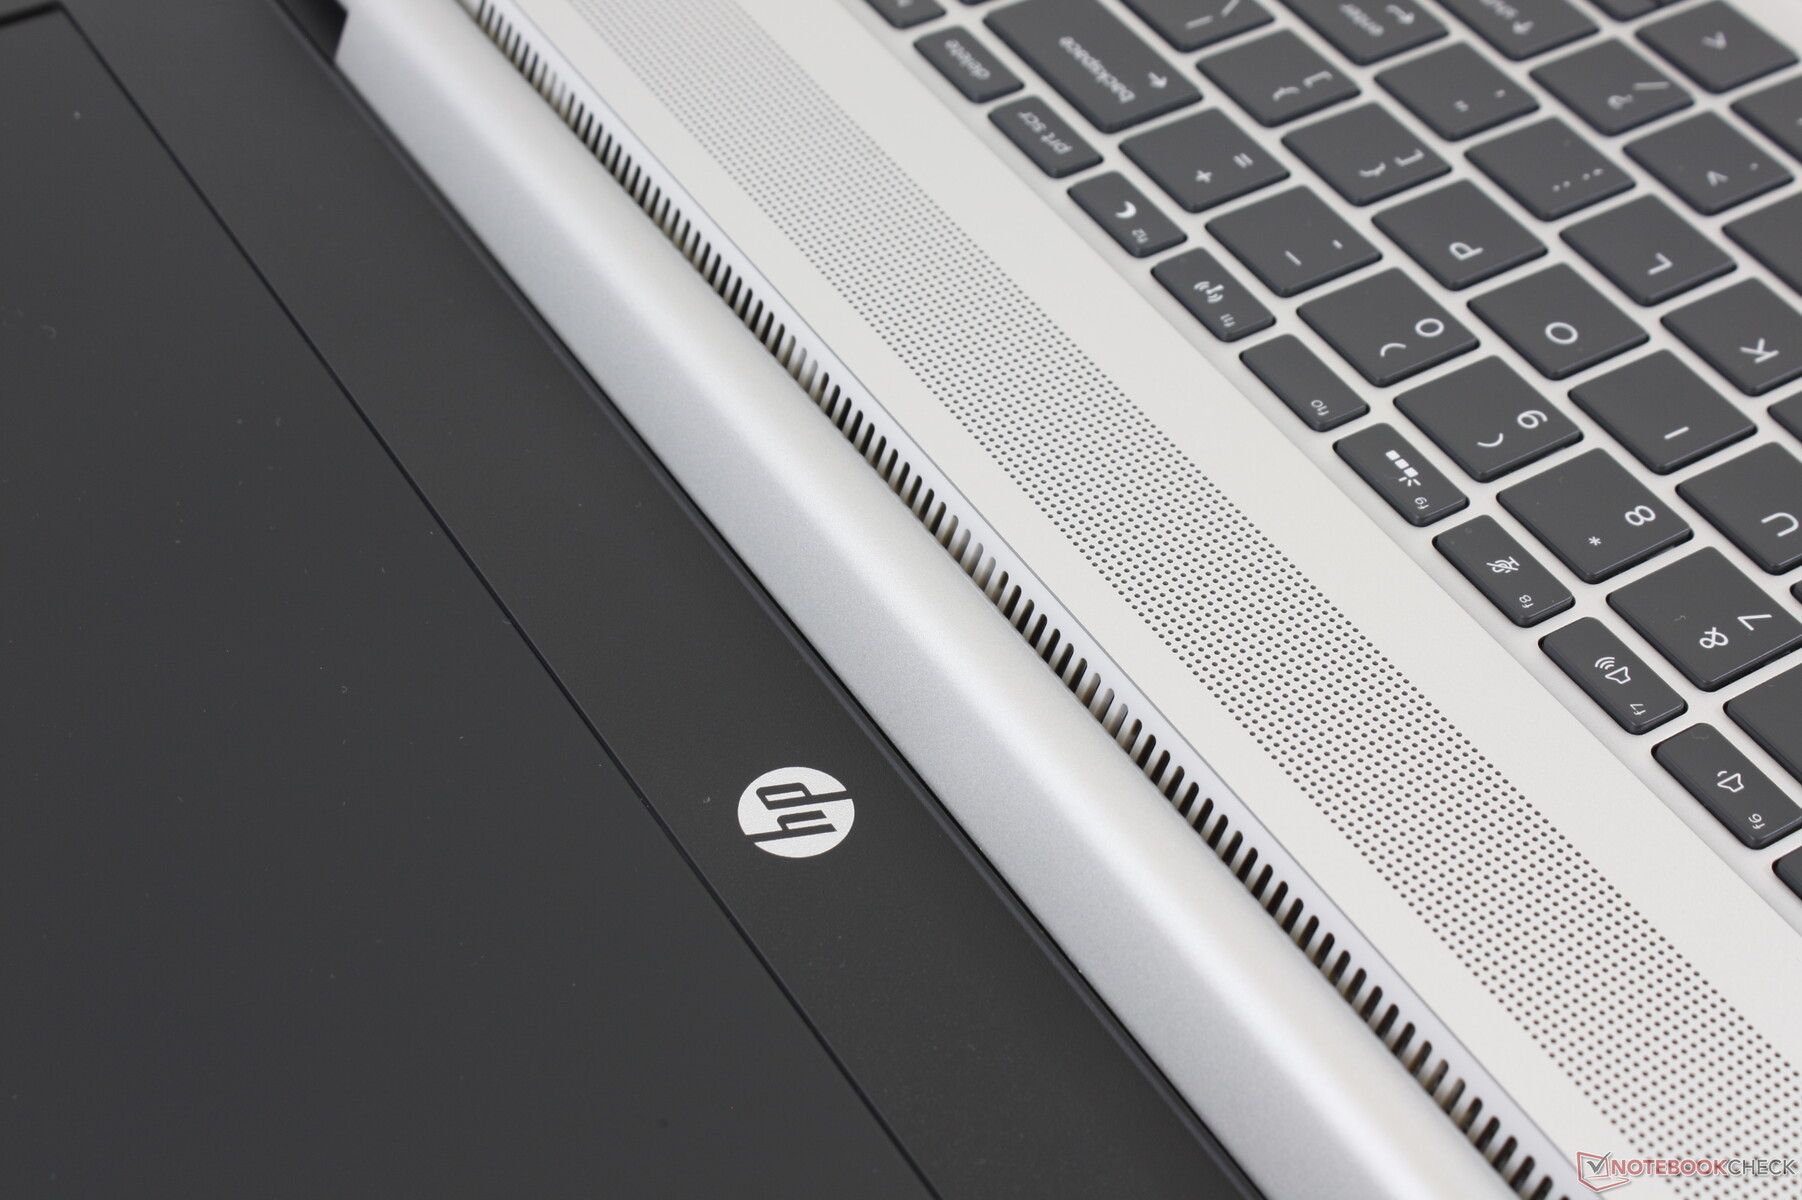
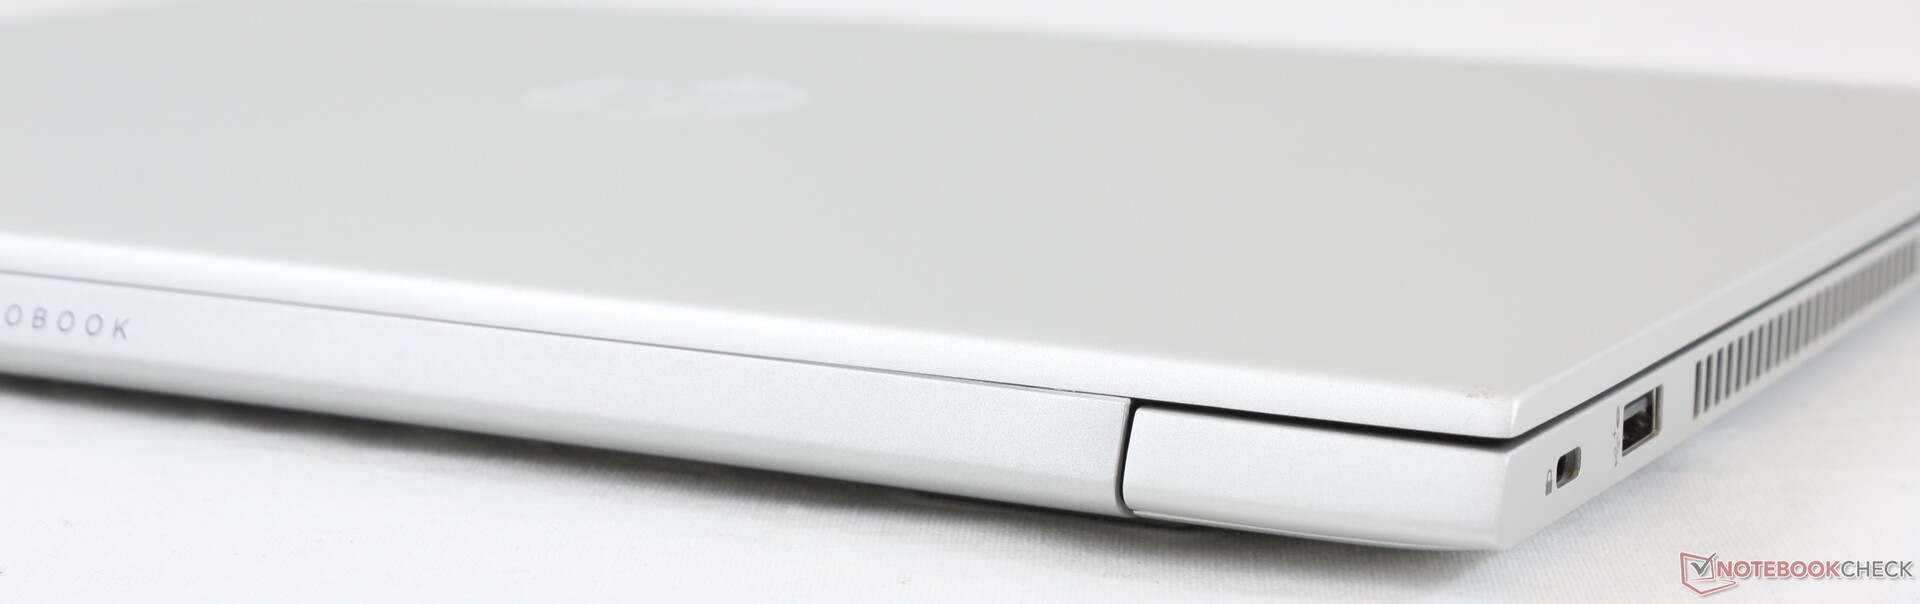
Kasa, ProBook 455 G7 ile görsel olarak aynı kalıyor ve hatta geçen yılki ProBook 450 G6, HP'nin aynı tasarıma bağlı kaldığı ikinci yıl olmasını sağlıyor. OEM'ler, nihayet yepyeni bir görünüm sunmadan önce genellikle aynı kasayı iki veya üç yıl kullanacaklar, bu da kullanıcıların tam bir yenileme görmeden önce en azından ProBook 450 G8 veya ProBook 450 G9'a kadar beklemesi gerekeceği anlamına geliyor.
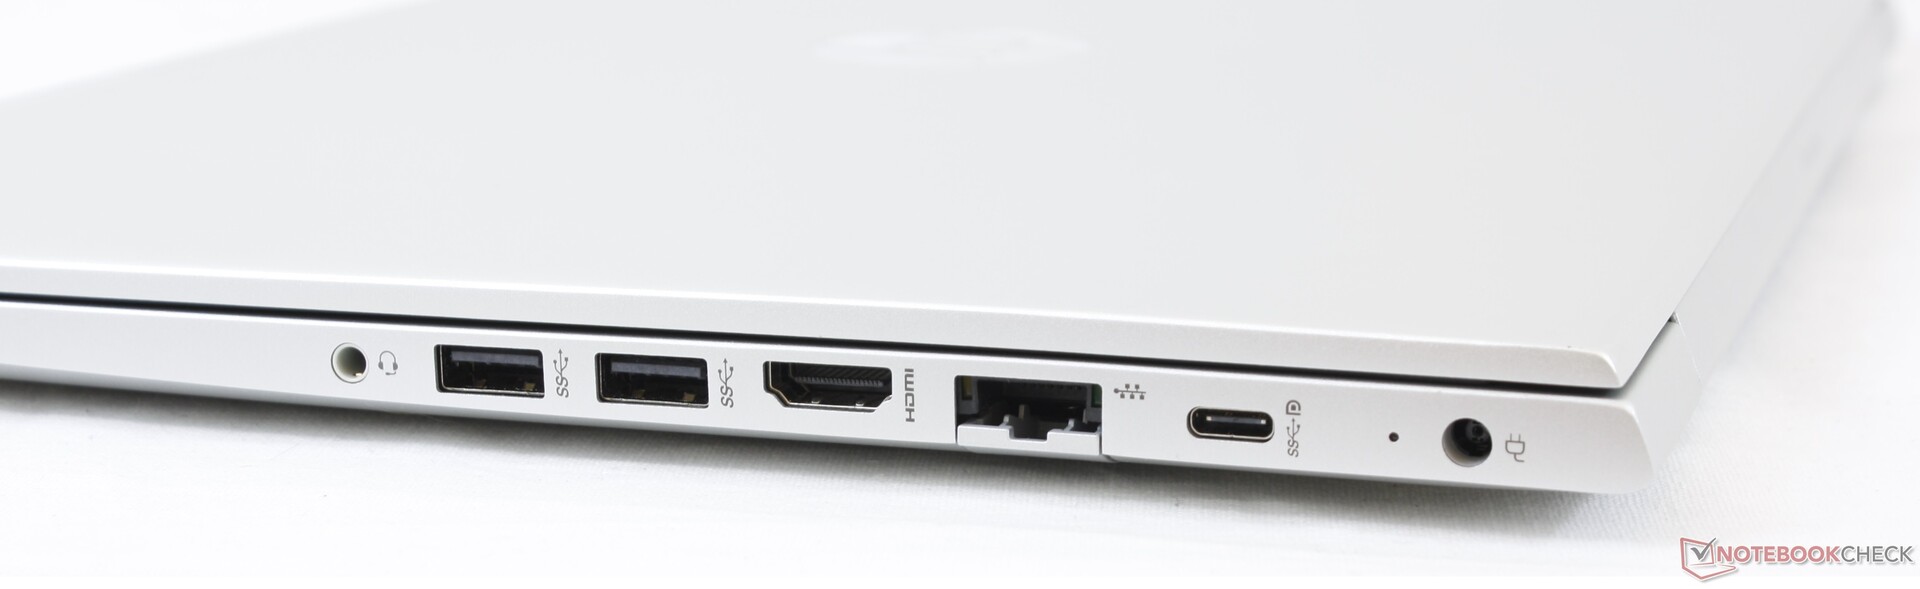
Bağlantı
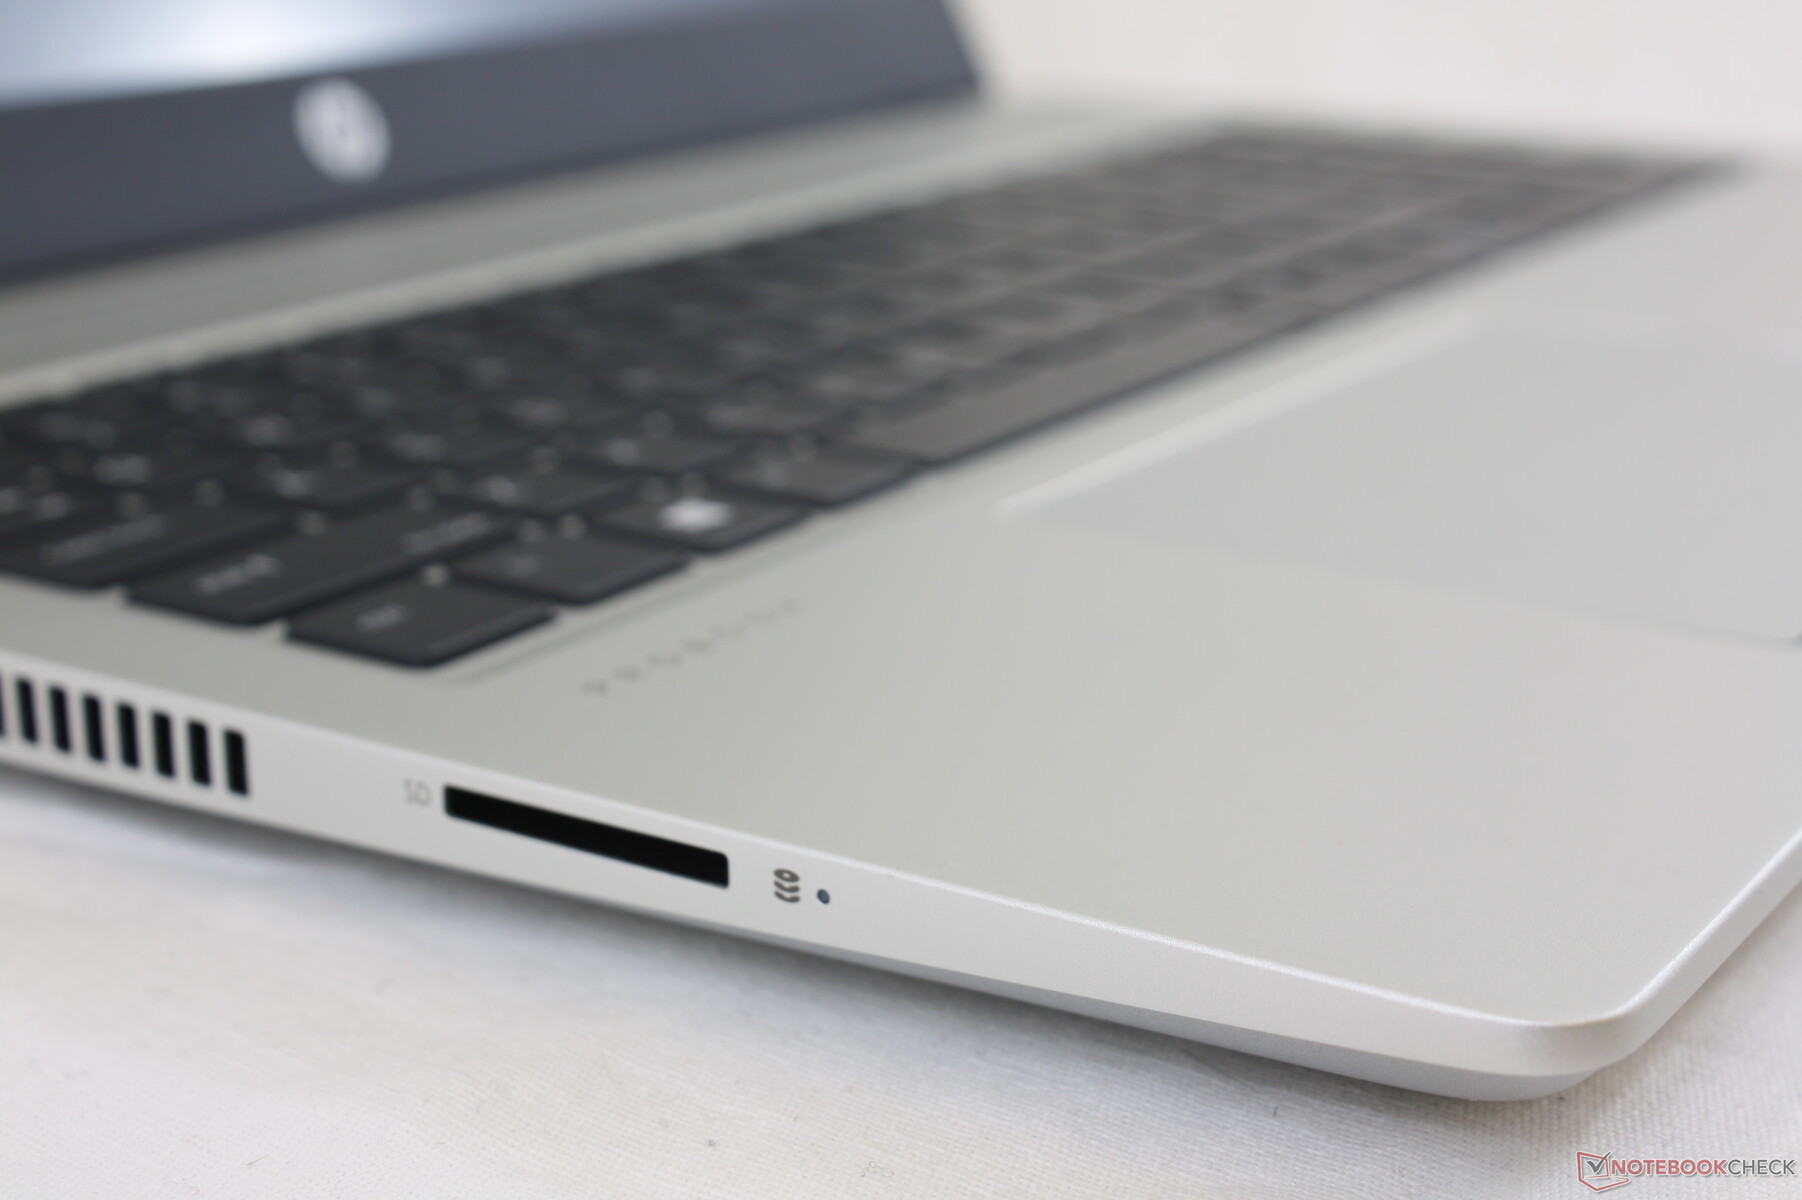
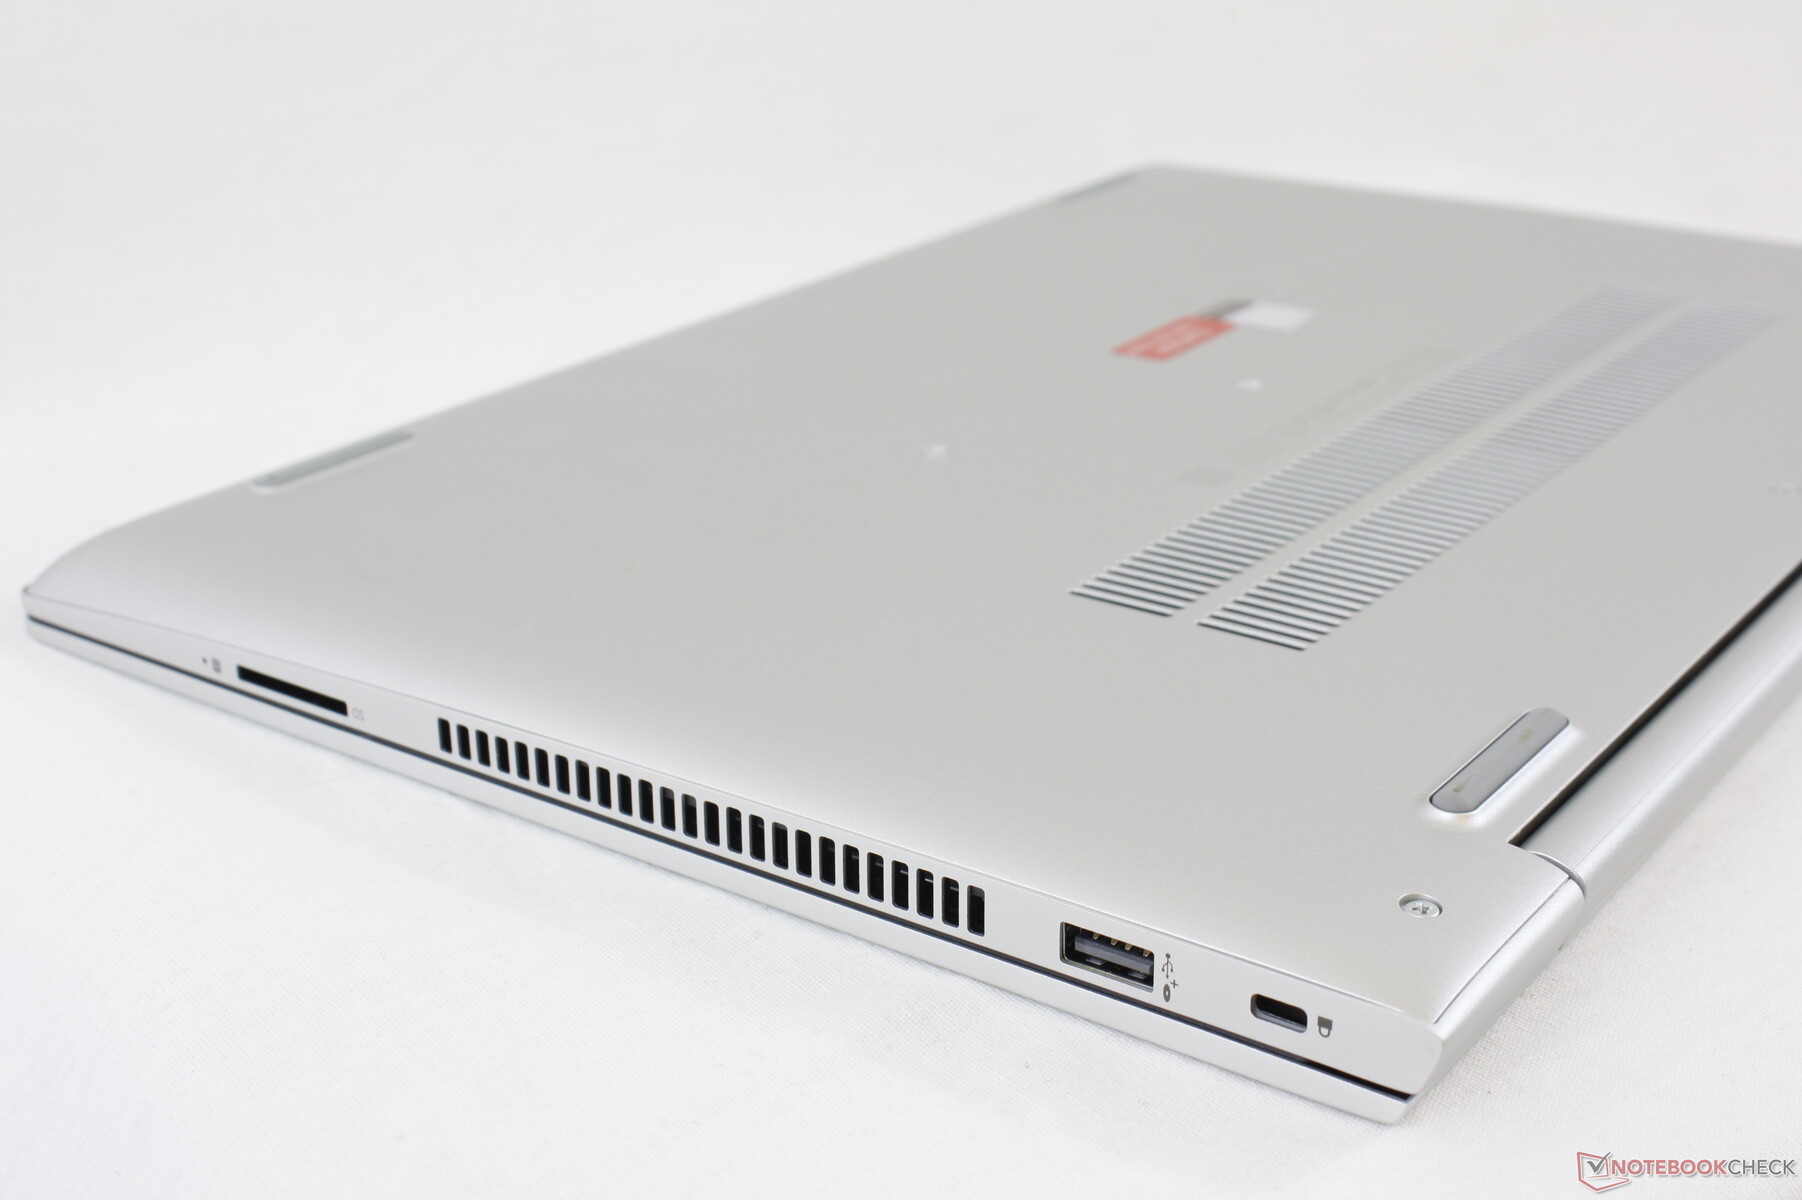
SD Kart Okuyucu
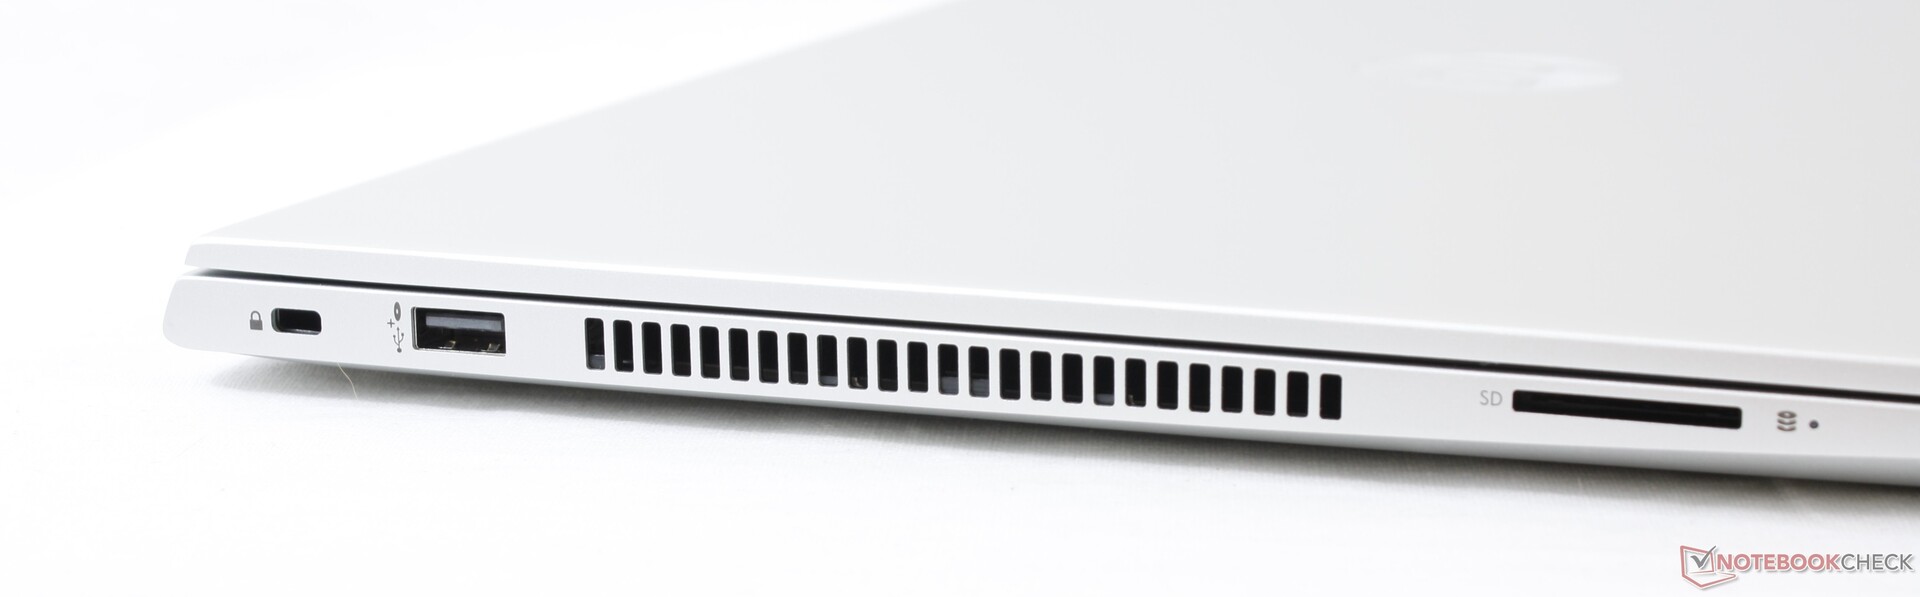
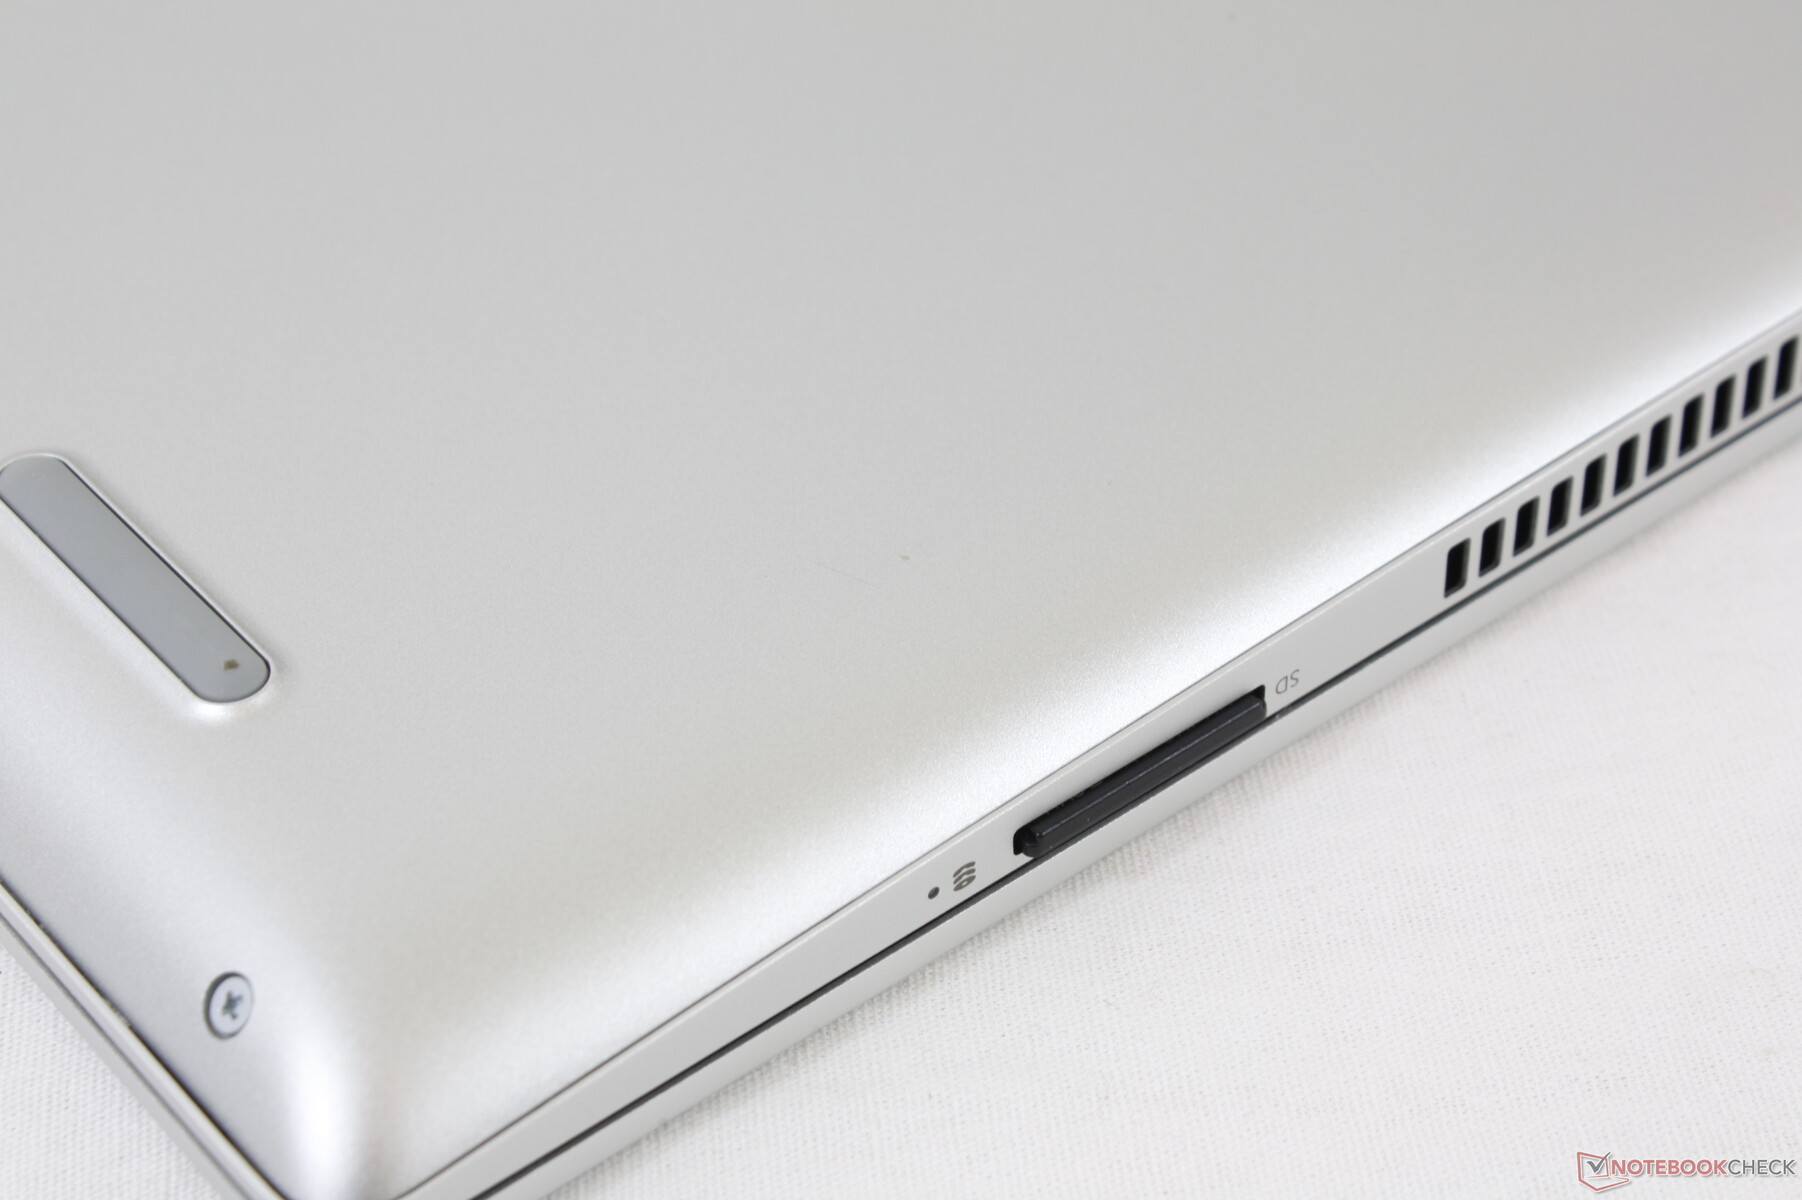
Yaylı SD kart okuyucusundan aktarım hızları ortalama 80 MB / s'dir. EliteBook 1050 G1 gibi daha pahalı HP EliteBook dizüstü bilgisayarlardaki kart okuyucular, aktarım oranlarının iki ila üç katı sunabilir.
| SD Card Reader | |
| average JPG Copy Test (av. of 3 runs) | |
| HP EliteBook 1050 G1-4QY20EA (Toshiba Exceria Pro SDXC 64 GB UHS-II) | |
| HP ProBook 455 G7-175W8EA (Toshiba Exceria Pro SDXC 64 GB UHS-II) | |
| HP ProBook 450 G7 8WC04UT (Toshiba Exceria Pro SDXC 64 GB UHS-II) | |
| Lenovo ThinkPad L590-20Q70019GE (Toshiba Exceria Pro M501 64 GB UHS-II) | |
| MSI Modern 15 A10RB (Toshiba Exceria Pro M501 UHS-II) | |
| Dell Latitude 15 3590 (Toshiba Exceria Pro SDXC 64 GB UHS-II) | |
| maximum AS SSD Seq Read Test (1GB) | |
| HP EliteBook 1050 G1-4QY20EA (Toshiba Exceria Pro SDXC 64 GB UHS-II) | |
| HP ProBook 455 G7-175W8EA (Toshiba Exceria Pro SDXC 64 GB UHS-II) | |
| Lenovo ThinkPad L590-20Q70019GE (Toshiba Exceria Pro M501 64 GB UHS-II) | |
| HP ProBook 450 G7 8WC04UT (Toshiba Exceria Pro SDXC 64 GB UHS-II) | |
| MSI Modern 15 A10RB (Toshiba Exceria Pro M501 UHS-II) | |
| Dell Latitude 15 3590 (Toshiba Exceria Pro SDXC 64 GB UHS-II) | |
İletişim
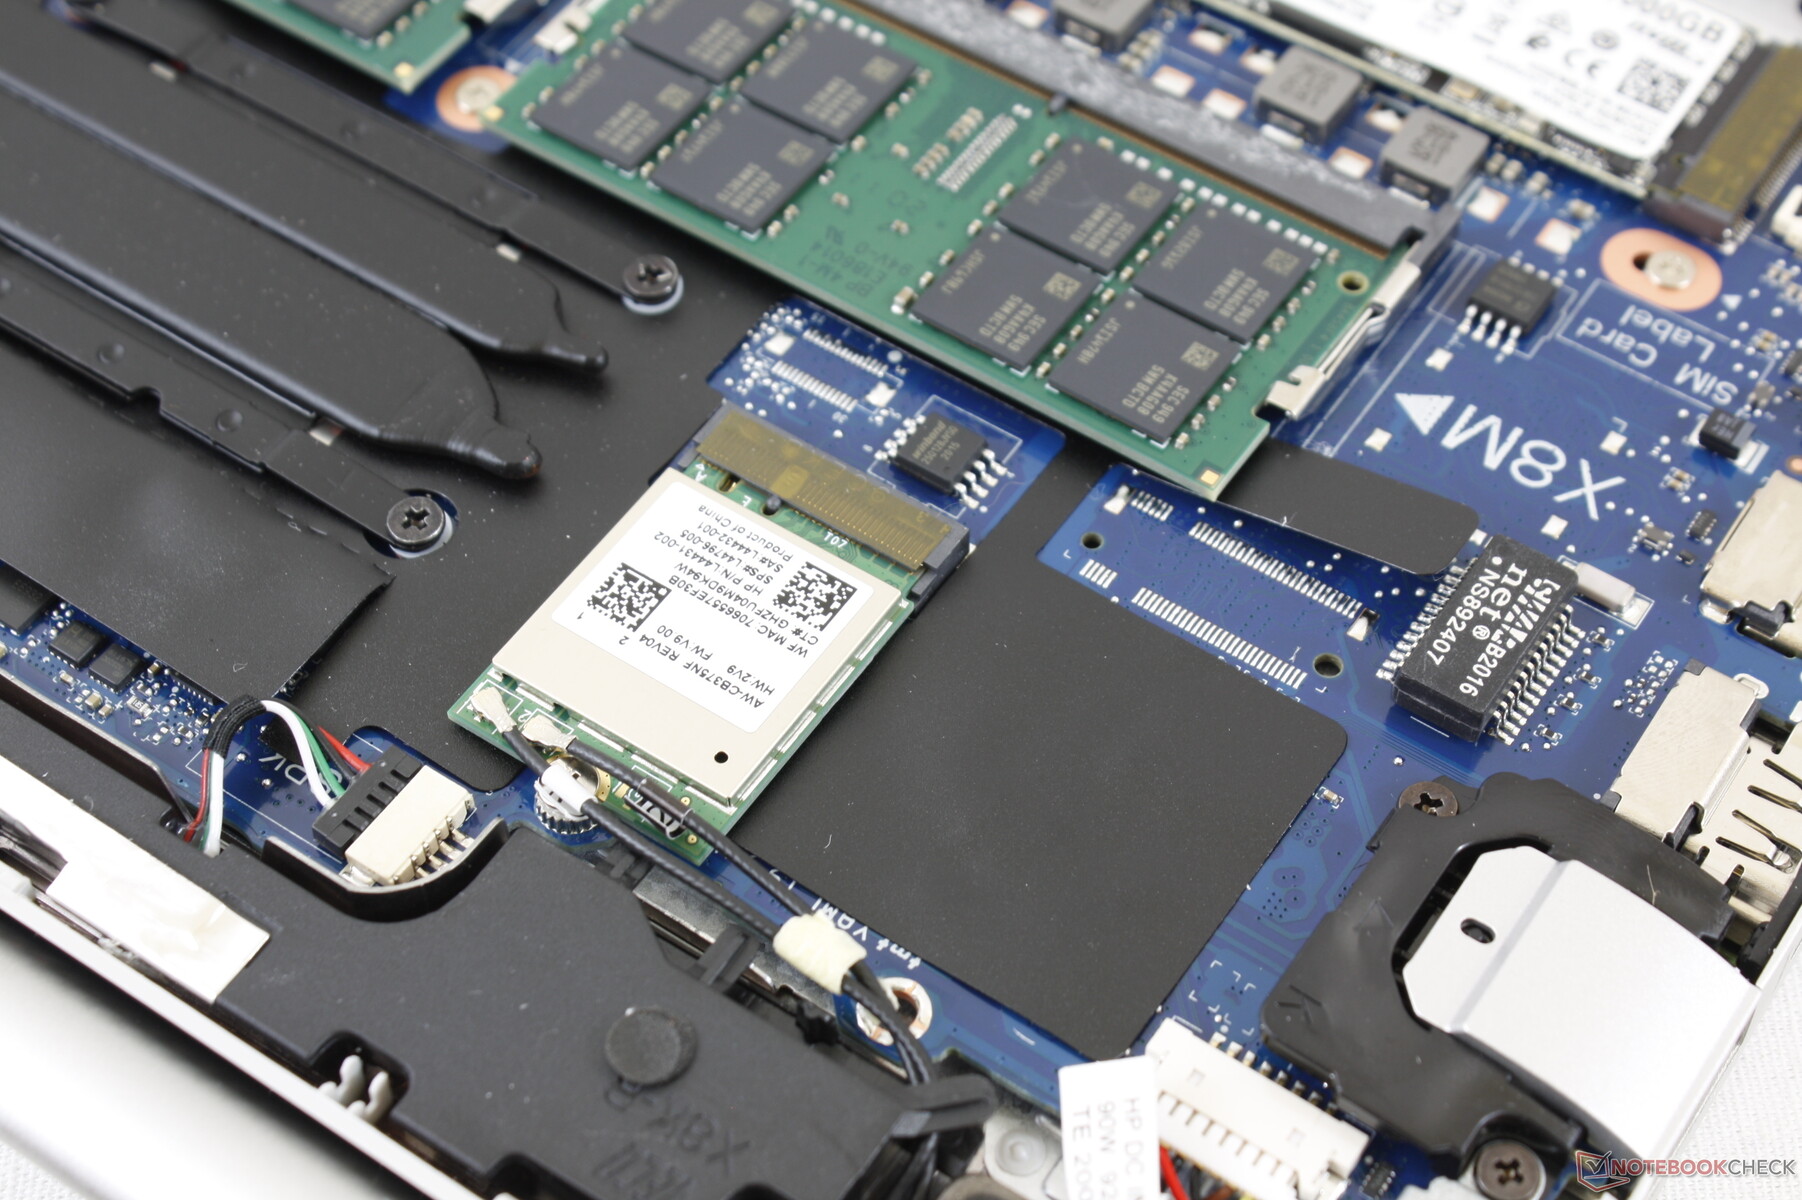
Ünitemiz, Wi-Fi 5 bağlantısı için Realtek 8822CE ile birlikte gelir ve Netgear RAX200 test yönlendiricimize bağlandığında hiçbir sorun yaşamadık. Intel AX200 / 201 seçenekleri mevcuttur.
| Networking | |
| iperf3 transmit AX12 | |
| Dell Latitude 7310 | |
| Dell XPS 15 9500 Core i7 4K UHD | |
| Lenovo ThinkPad T15 Gen1-20S7S02U00 | |
| HP ProBook 450 G7 8WC04UT | |
| iperf3 receive AX12 | |
| Lenovo ThinkPad T15 Gen1-20S7S02U00 | |
| Dell XPS 15 9500 Core i7 4K UHD | |
| Dell Latitude 7310 | |
| HP ProBook 450 G7 8WC04UT | |
Web kamerası
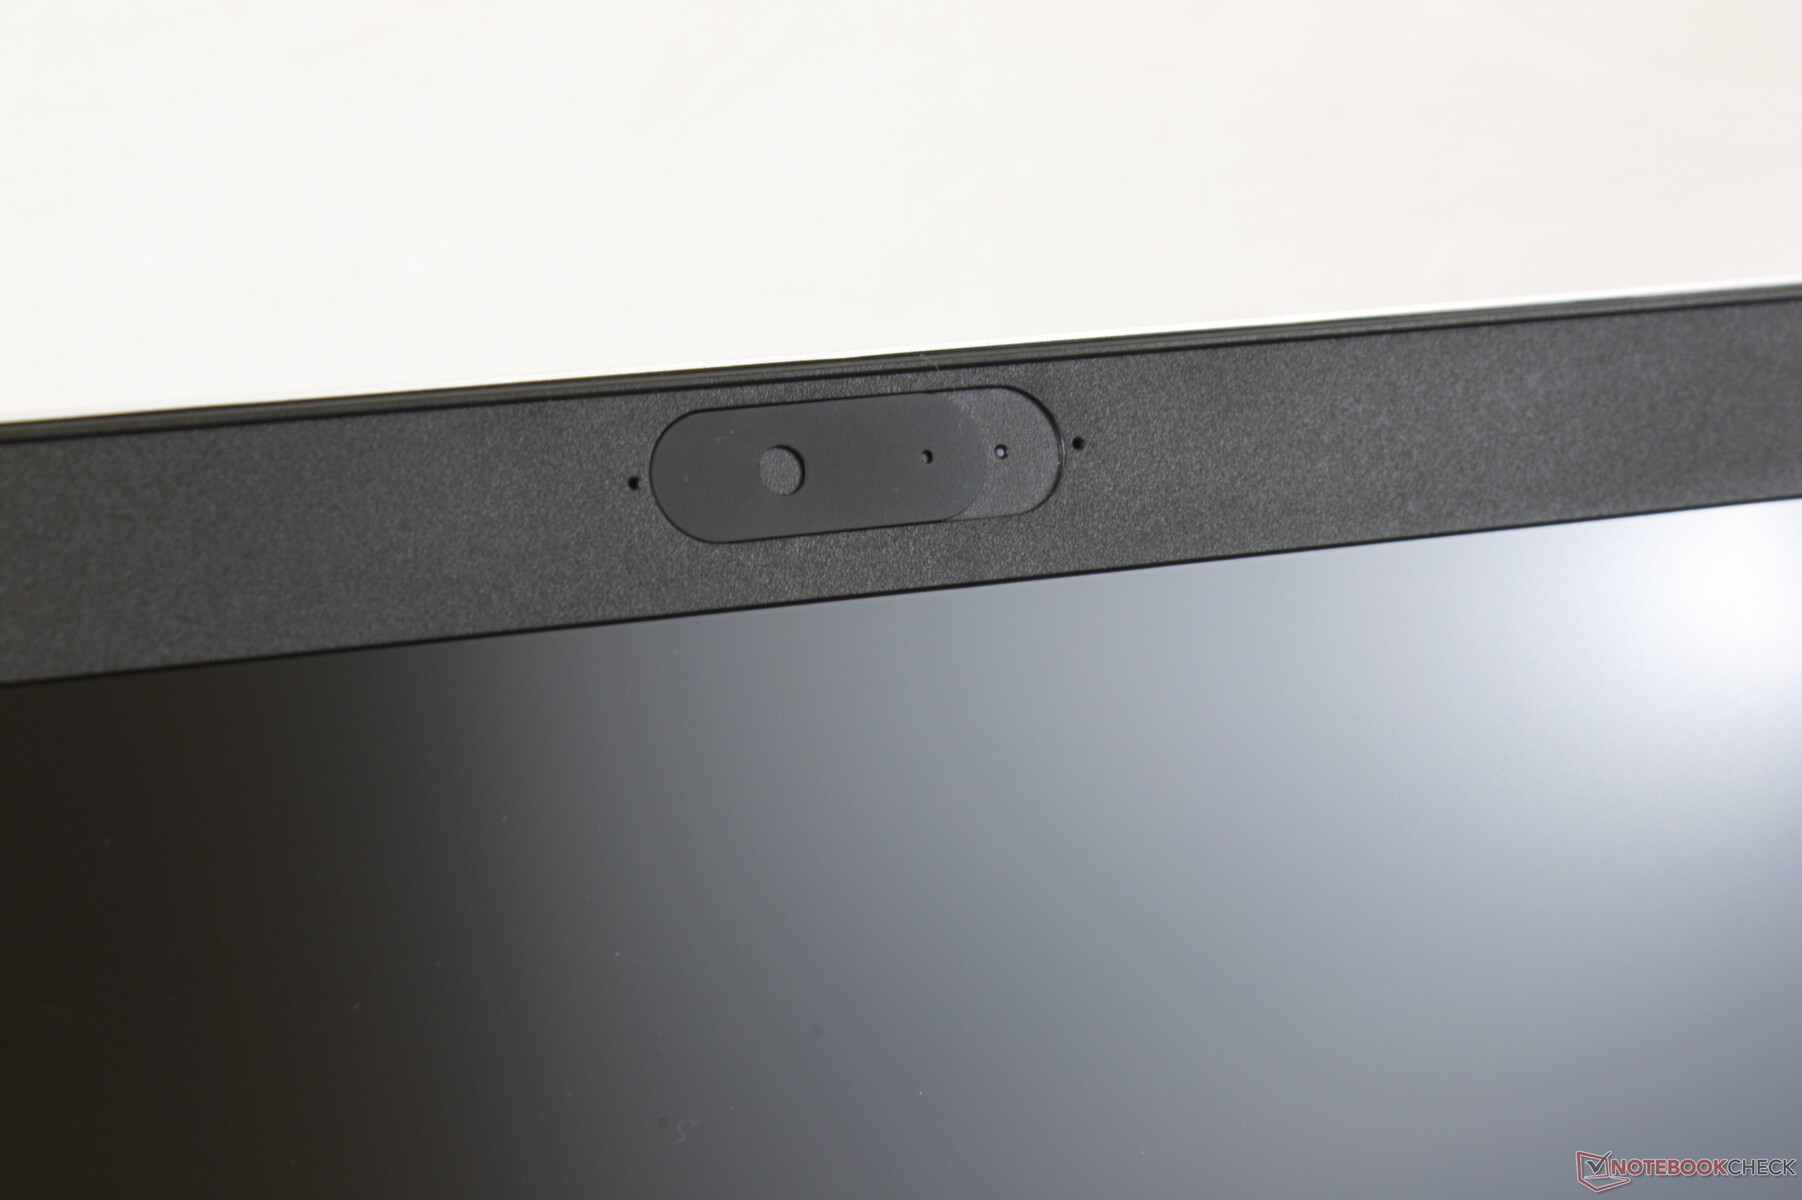
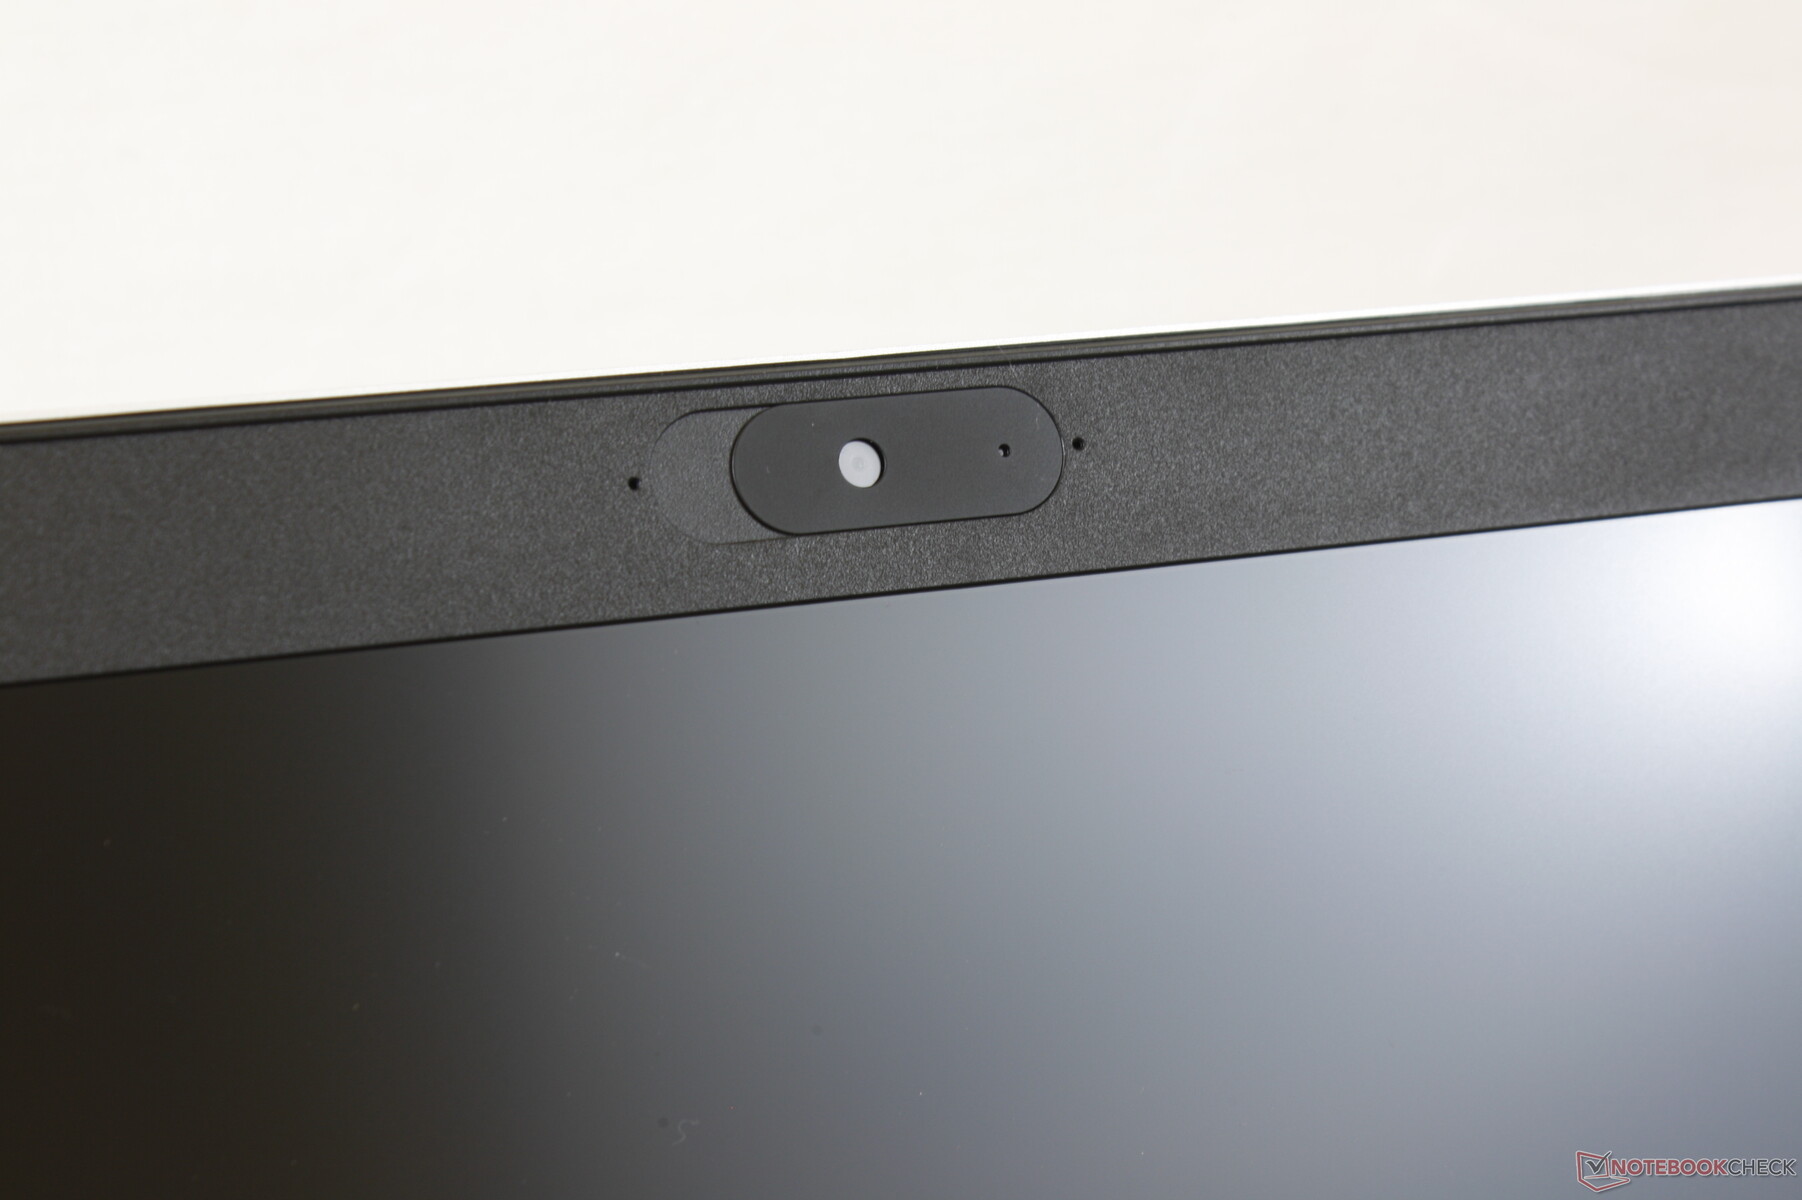


Güvenlik
Parmak izi okuyucu, vPro, Sure View ve IR kamera isteğe bağlıdır ve web kamerası gizlilik kapağı standart olarak gelir. HP'nin Sure Click, Sure Start, BIOSphere, Client Security ve Sure Sense gibi daha gelişmiş yazılım özelliklerinin yanı sıra daha pahalı EliteBook serilerinde olduğu gibi dahildir.
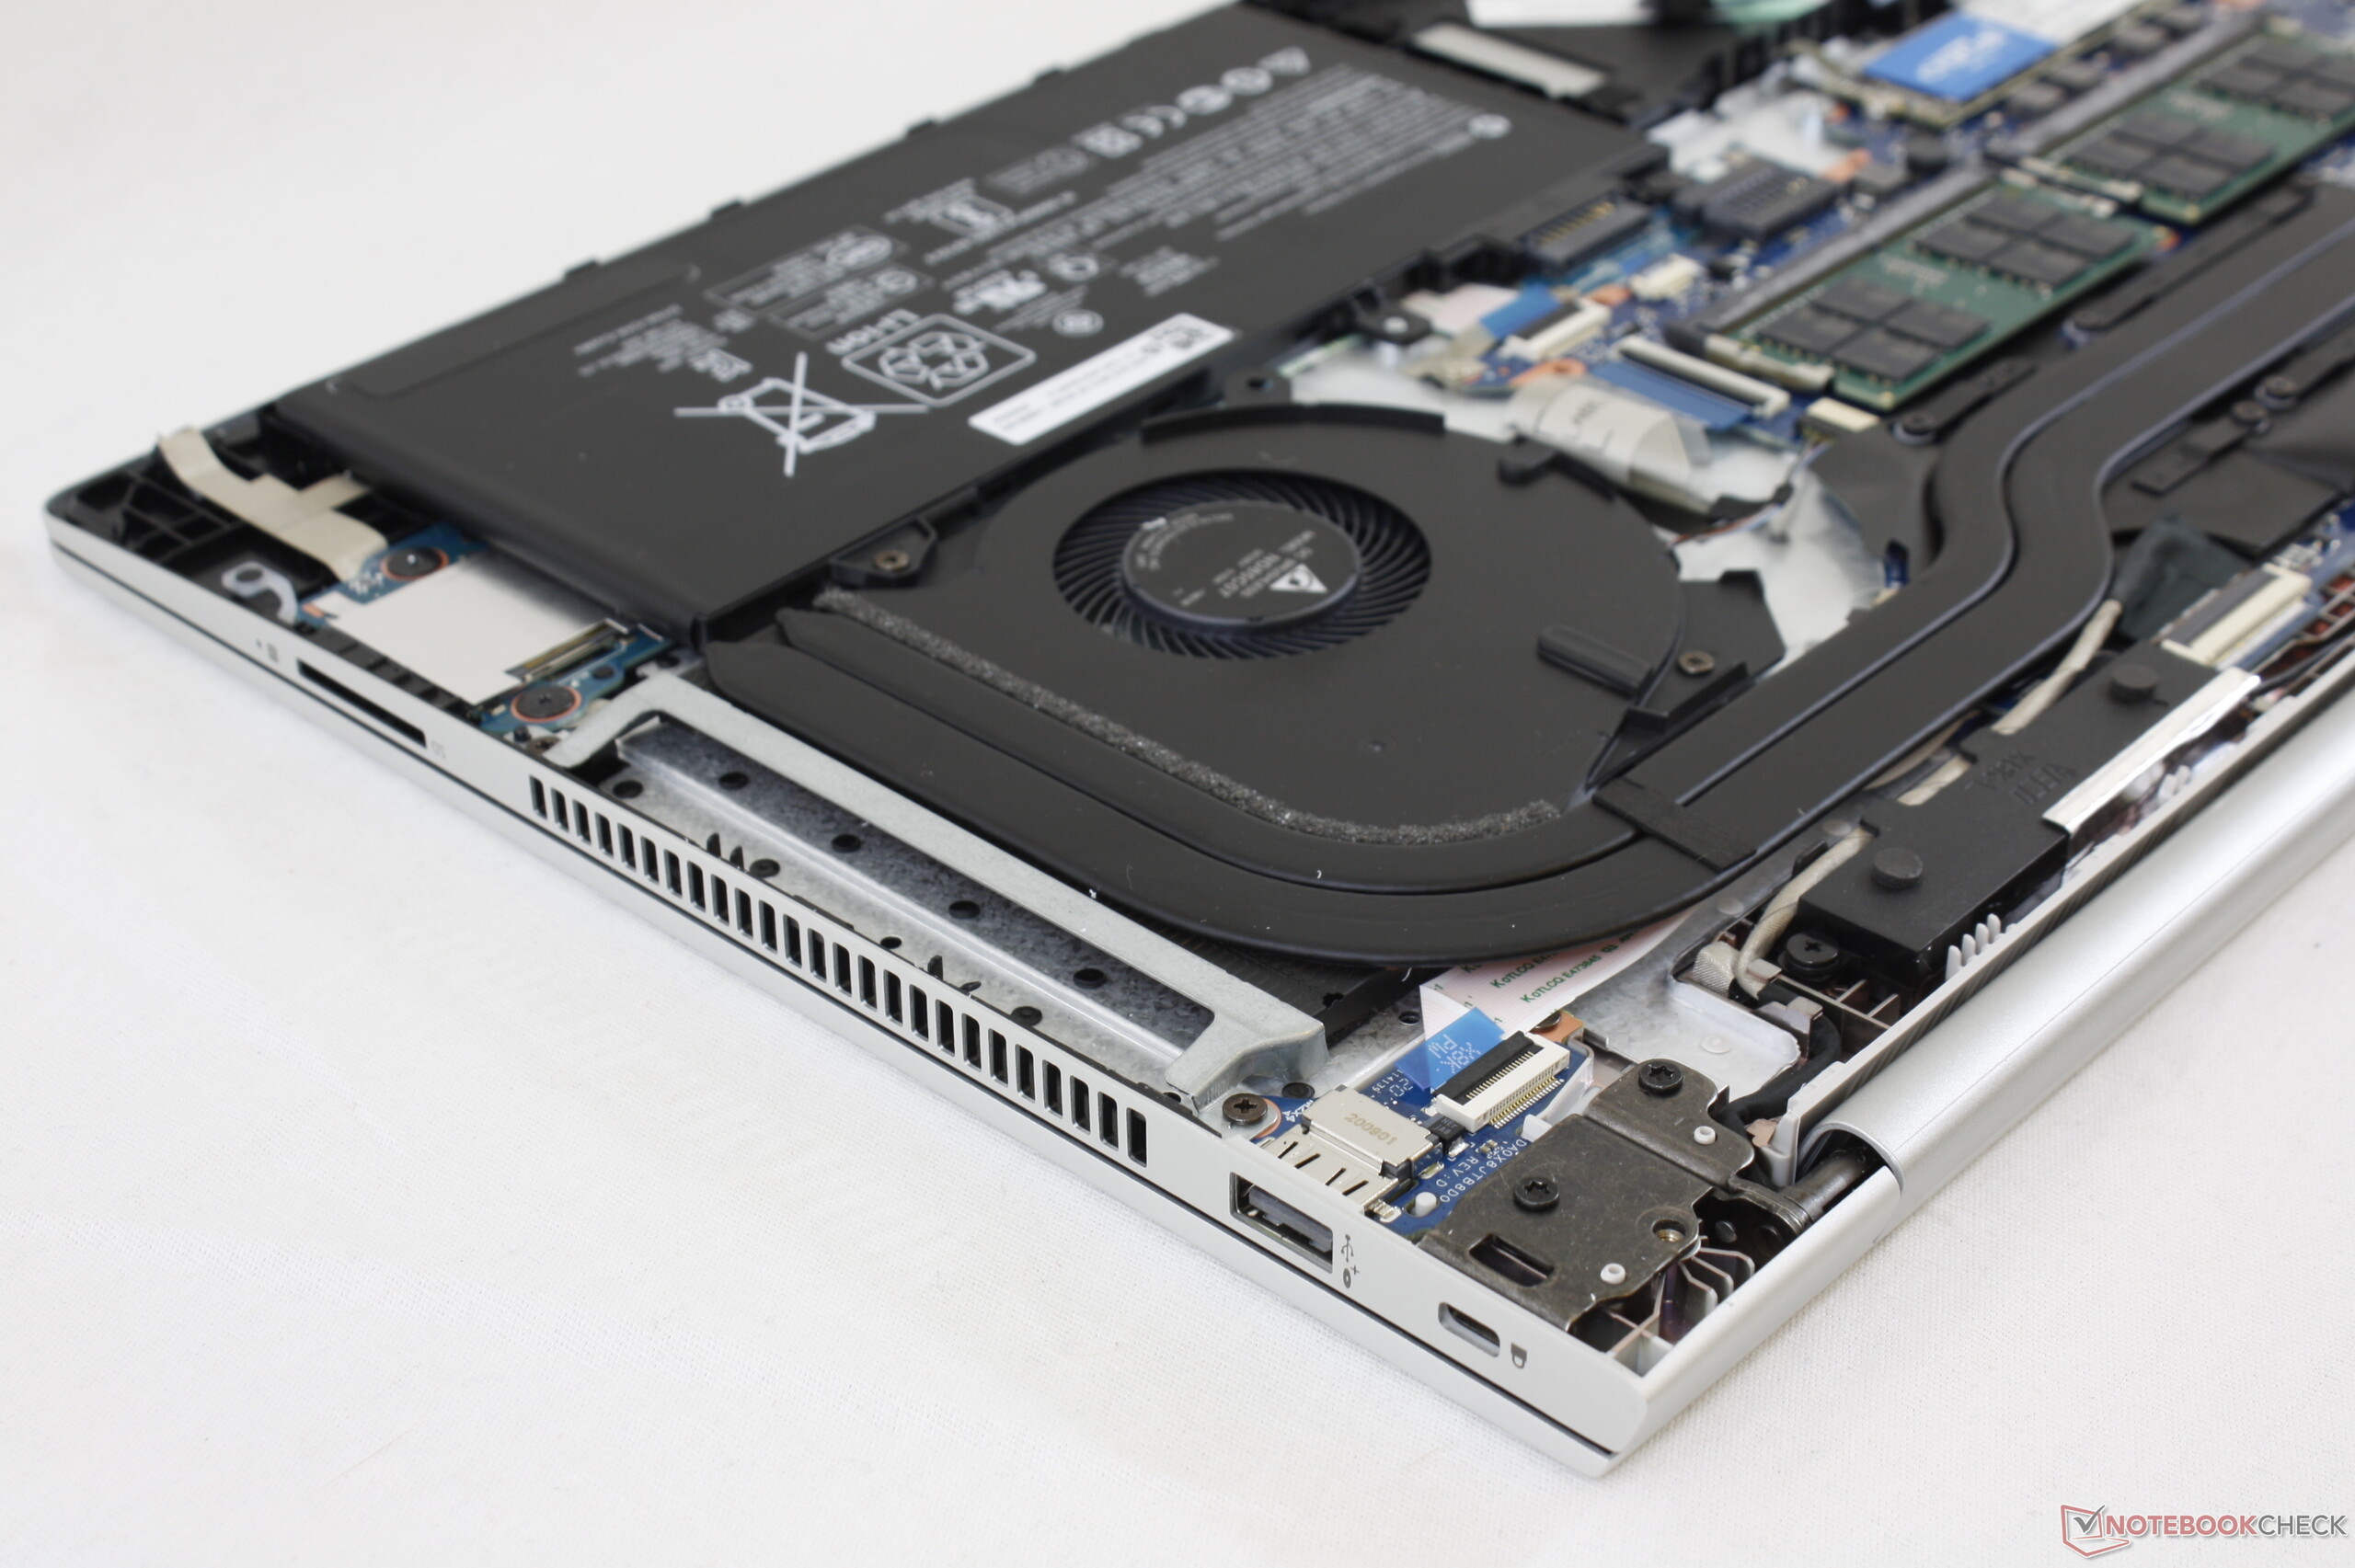
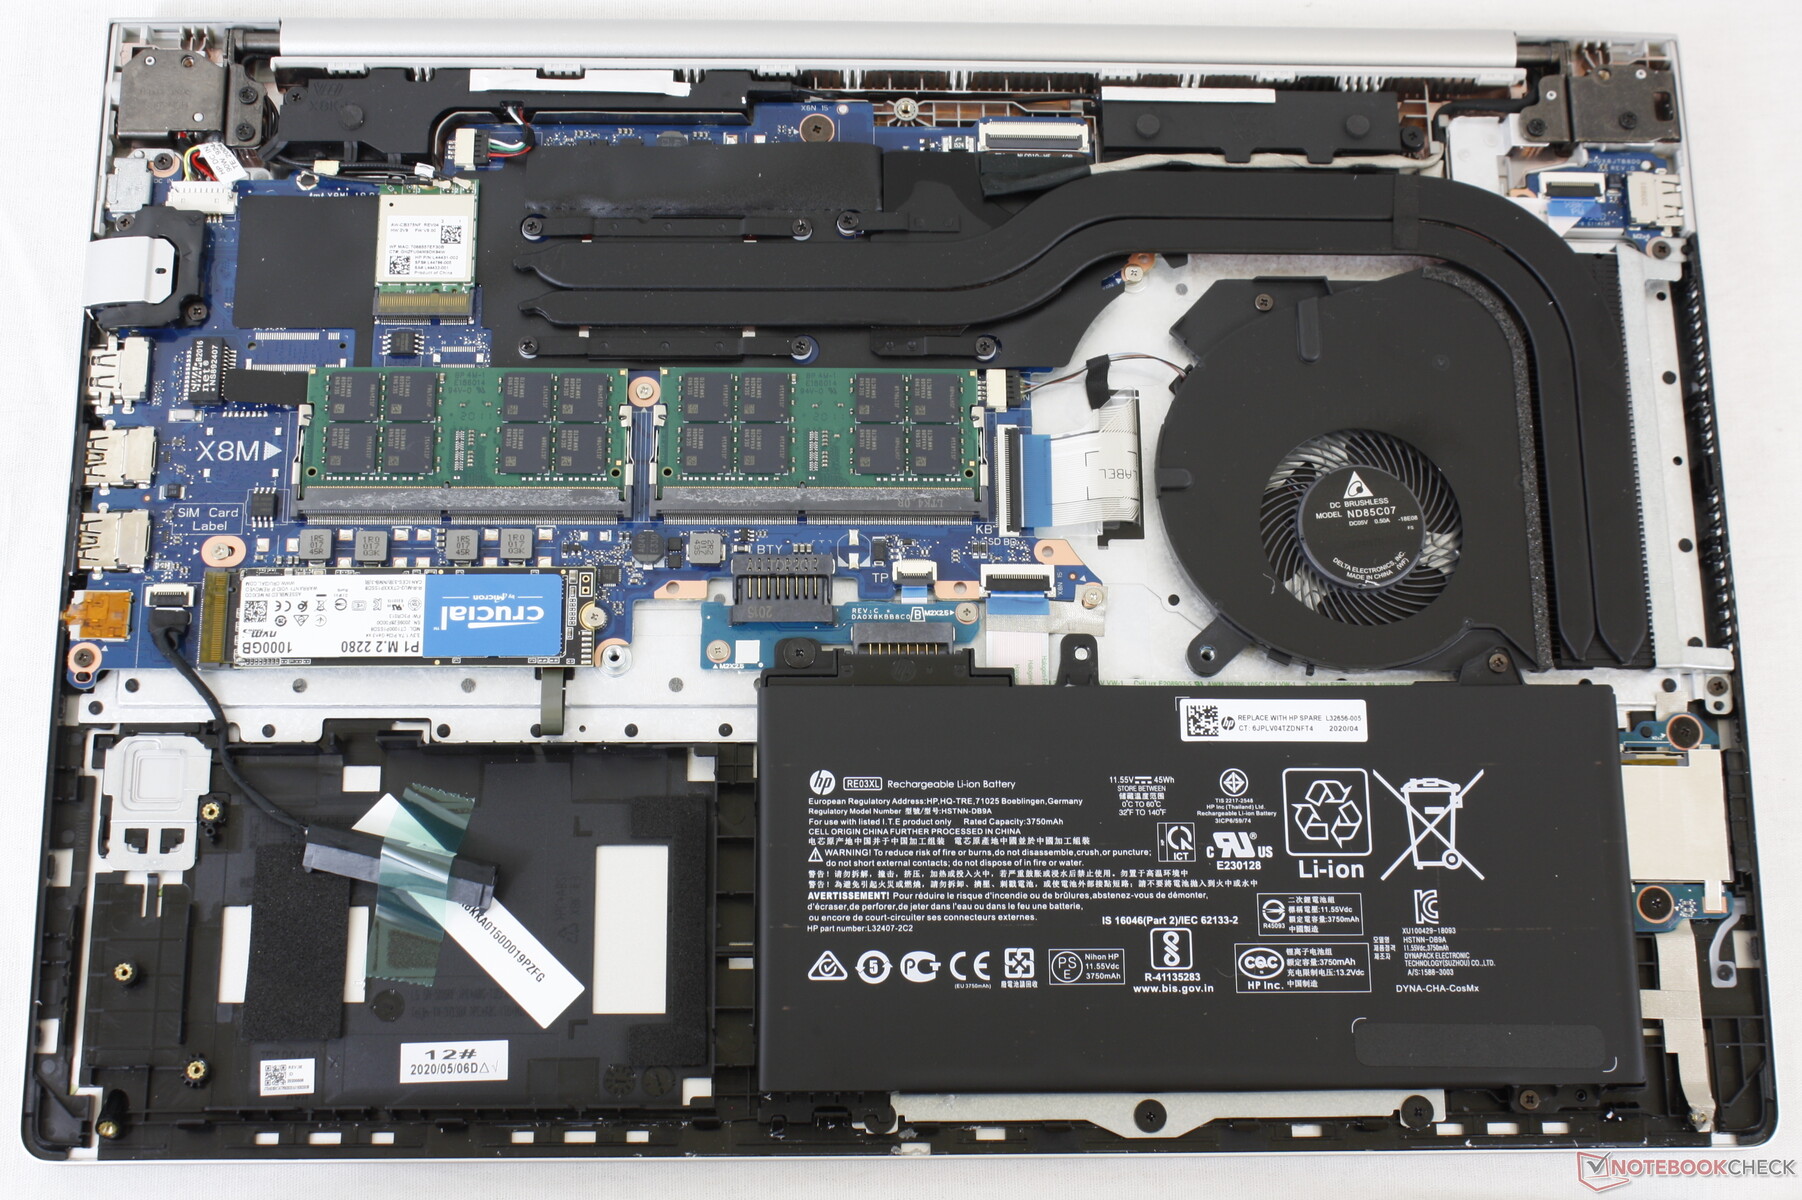
Bakım
Servis için Philips tornavida ve düz kenar gerekir. Plastik alt paneli çıkarmak biraz sabır ister çünkü kenarları ve köşeleri kasanın tabanına çok sıkı bir şekilde tutturulmuştur.
Aksesuarlar ve Garanti
Kutuda AC adaptörünün dışında ve evrak işlerinde hiçbir ekstra yoktur. Standart bir yıllık sınırlı garanti, üç yıla kadar uzatma seçenekleriyle birlikte HP.com veya CUKUSA.com'dan sipariş edilmesi halinde geçerlidir. CUKUSA, RAM veya depolama gibi ekledikleri tüm parçaları üç yıl süreyle kapsayacak.
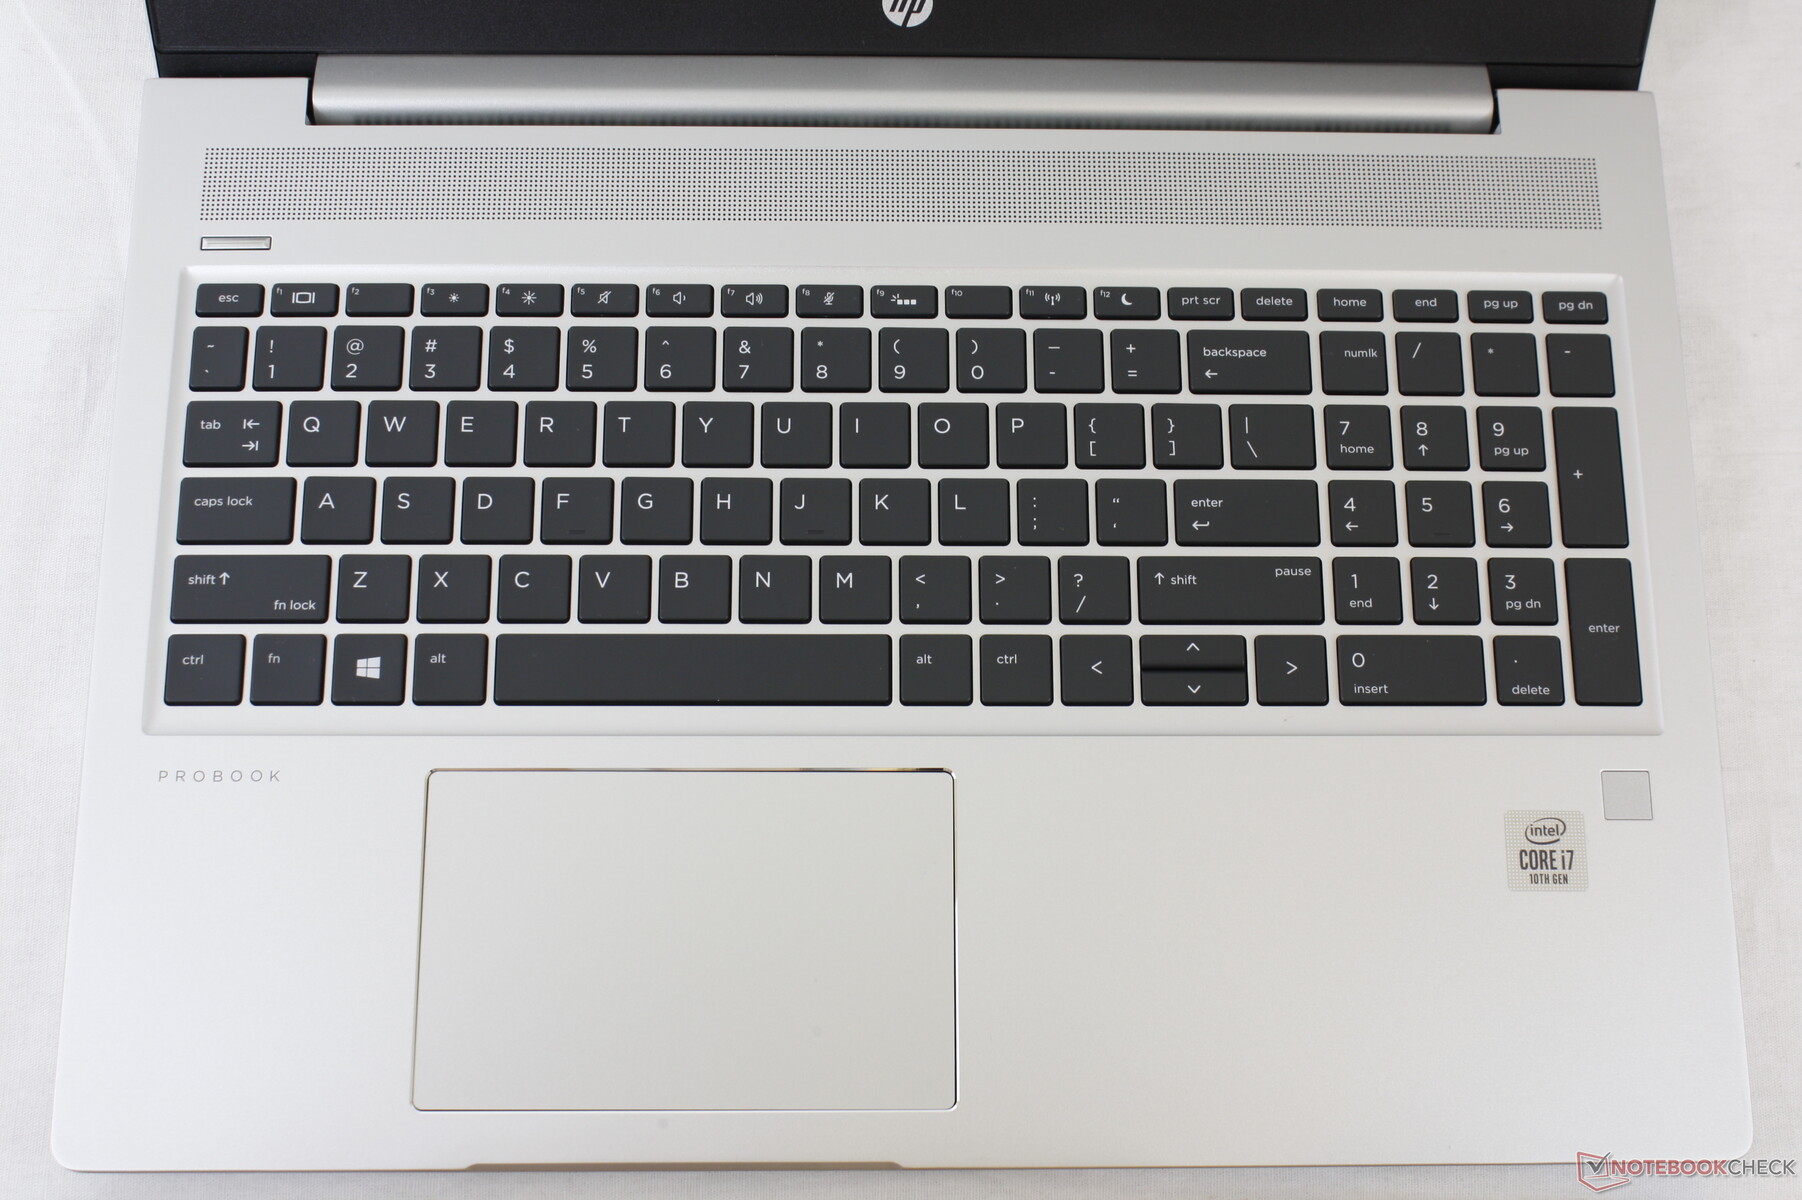
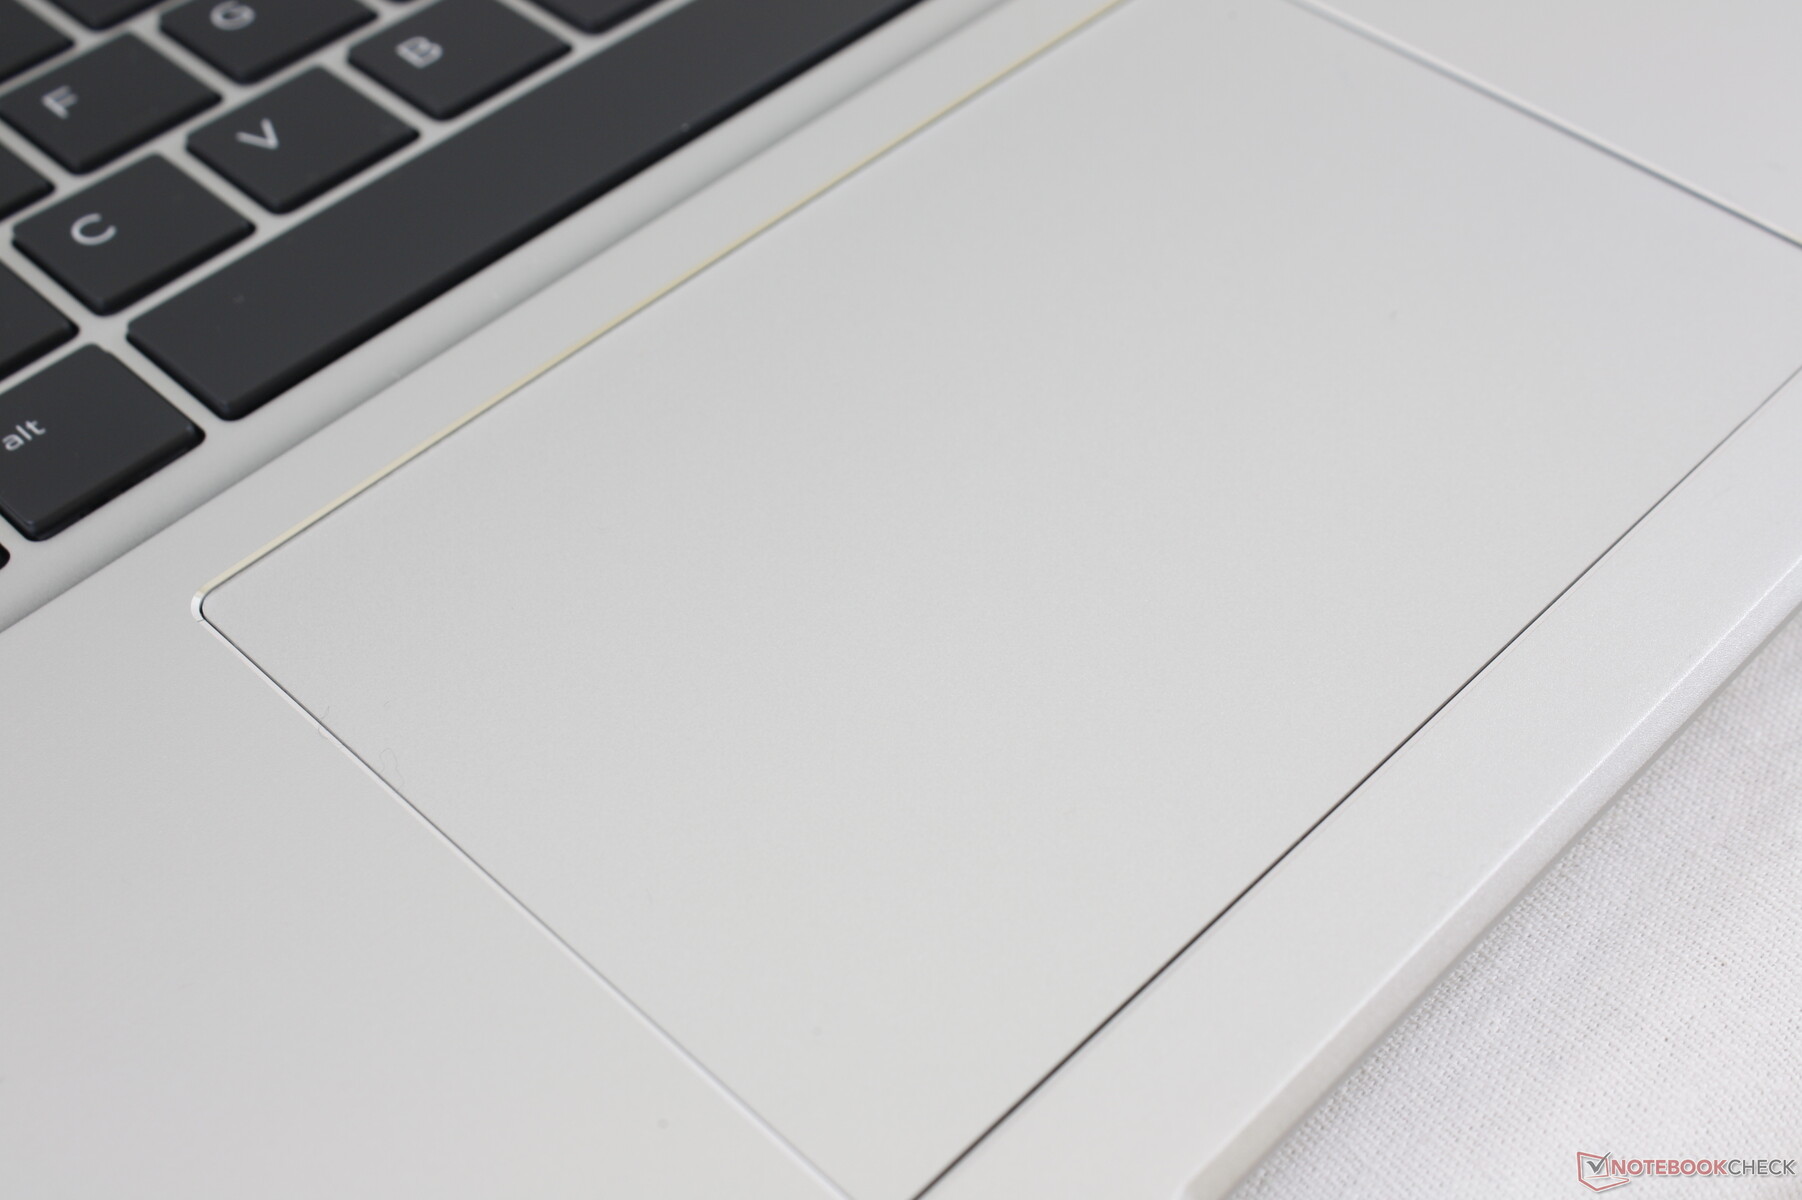
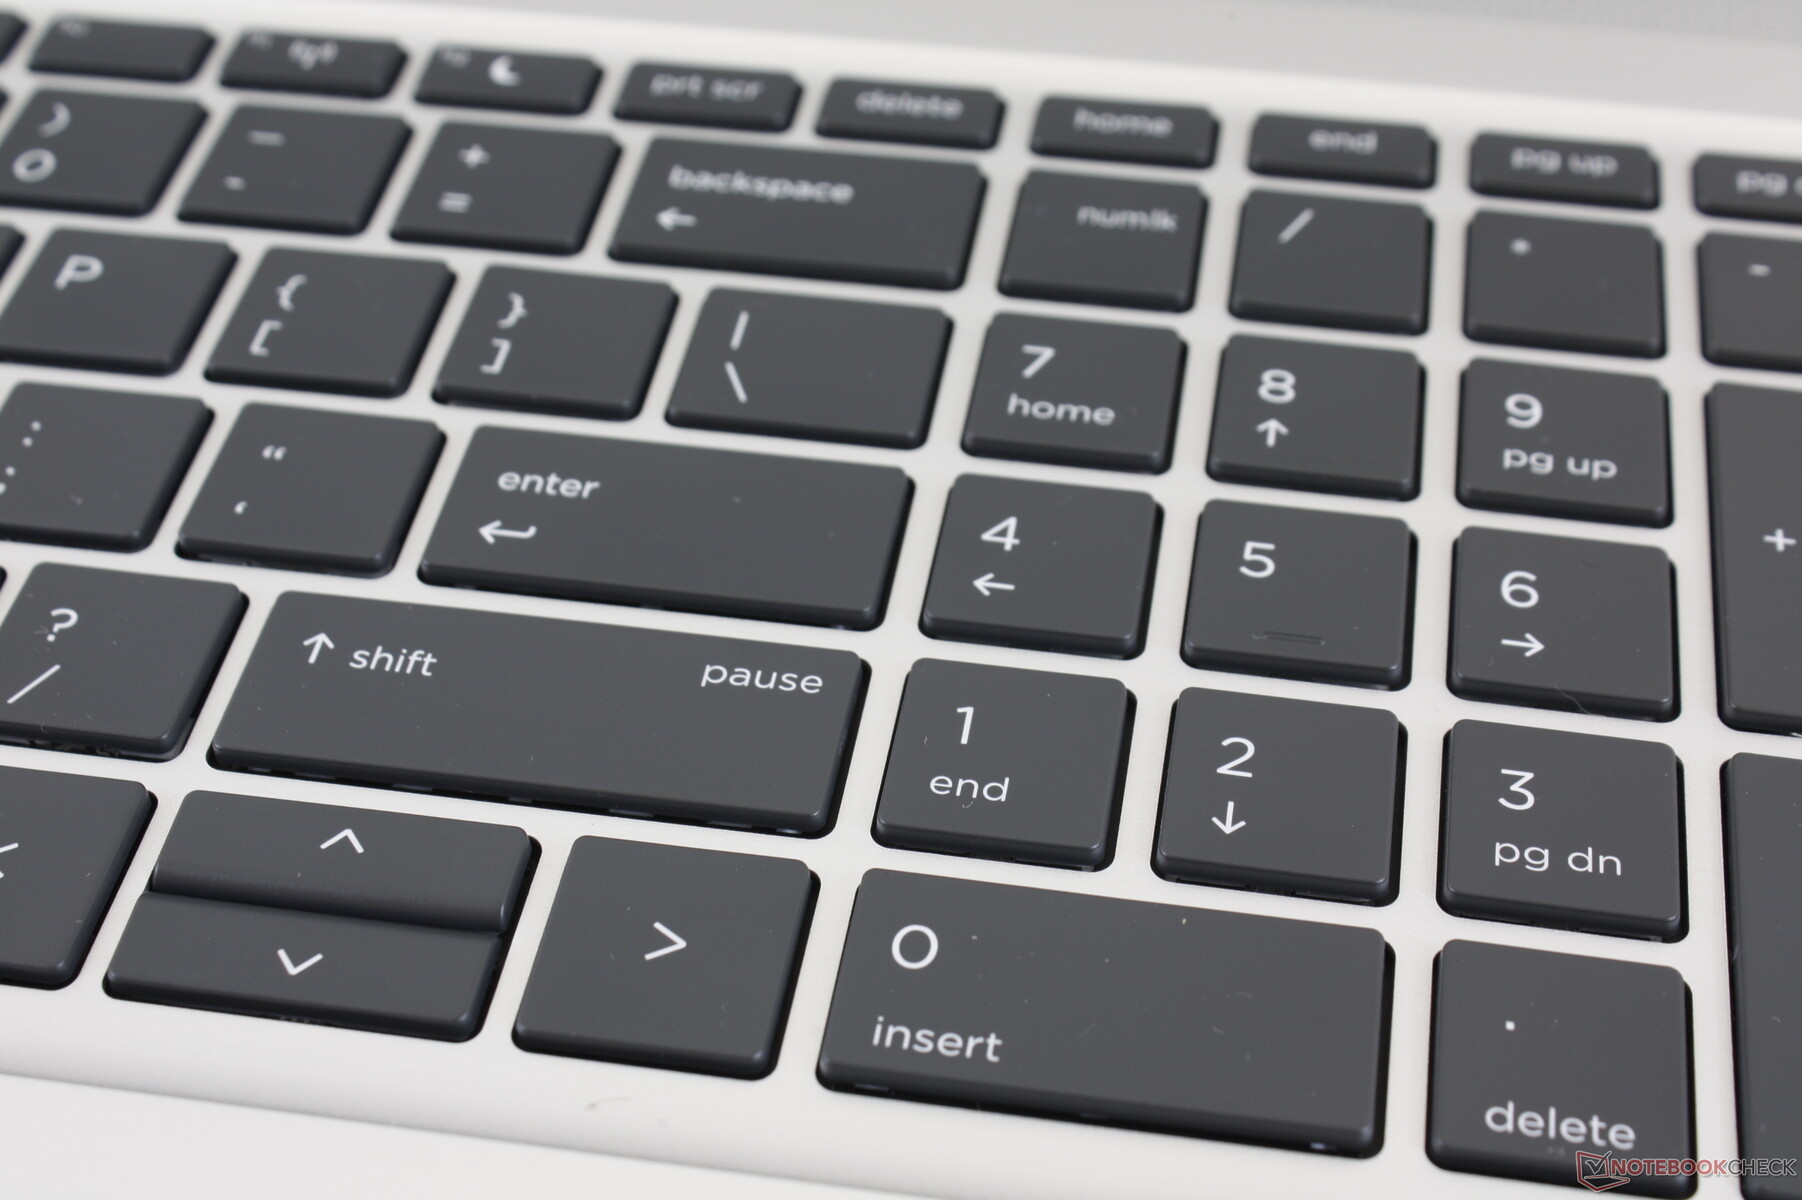
Giriş cihazları

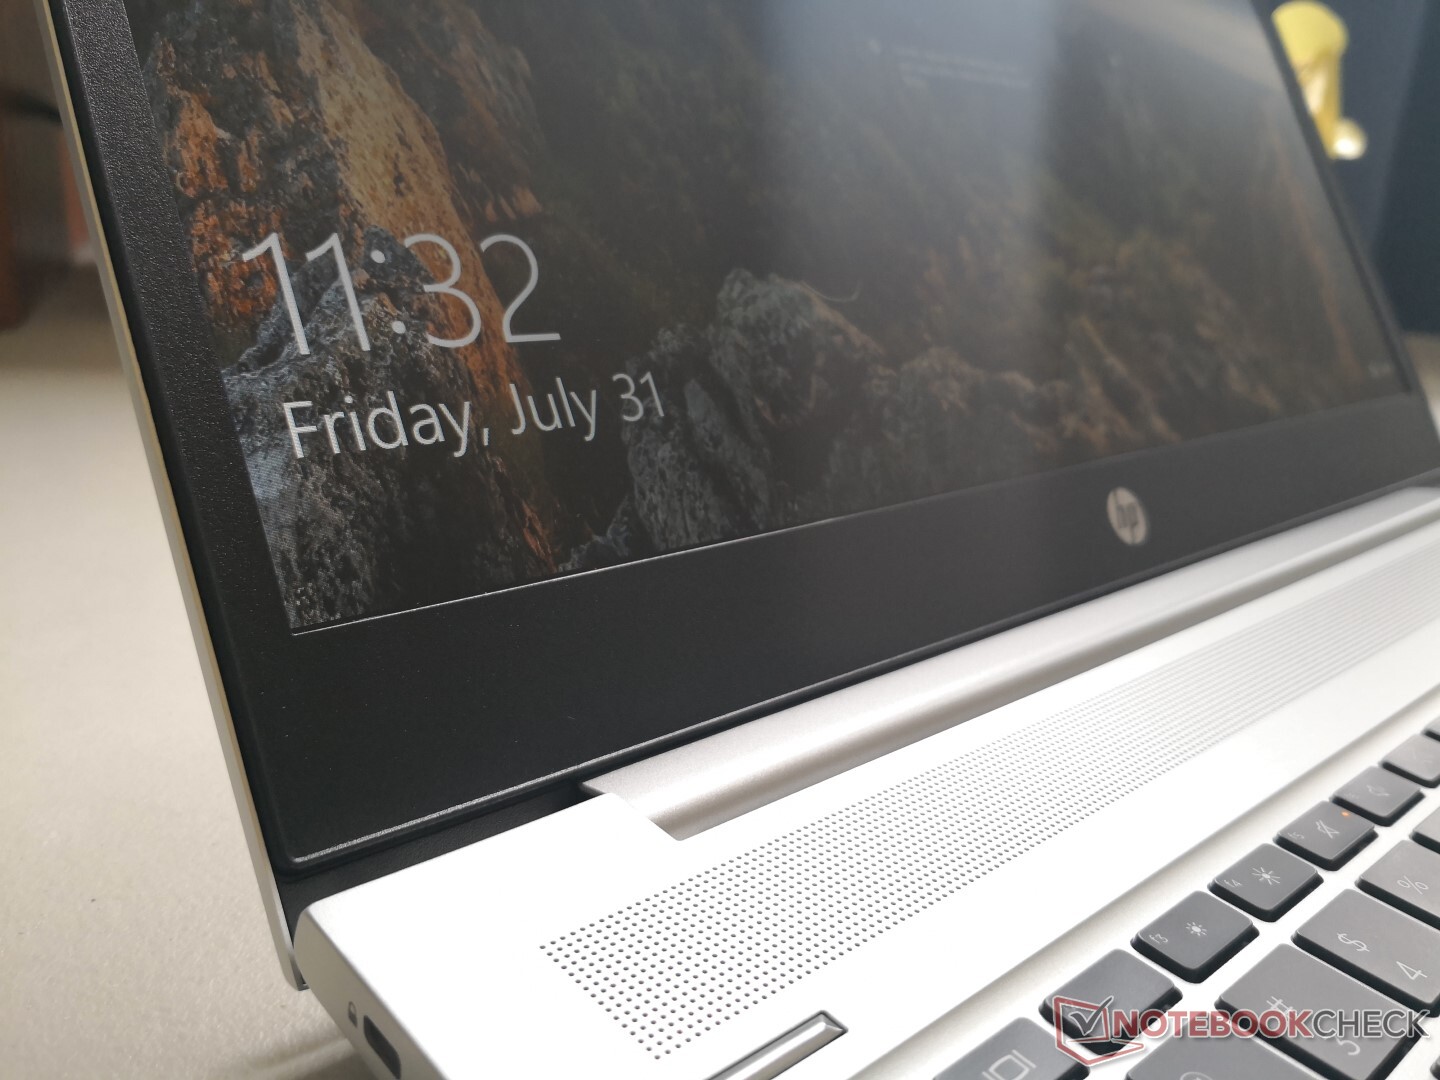
Görüntüle
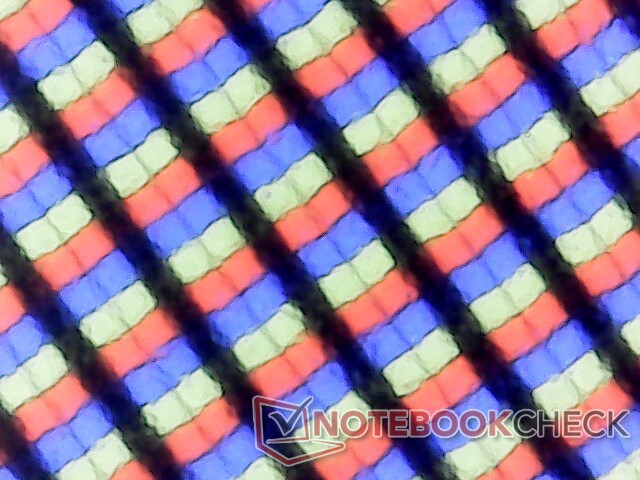
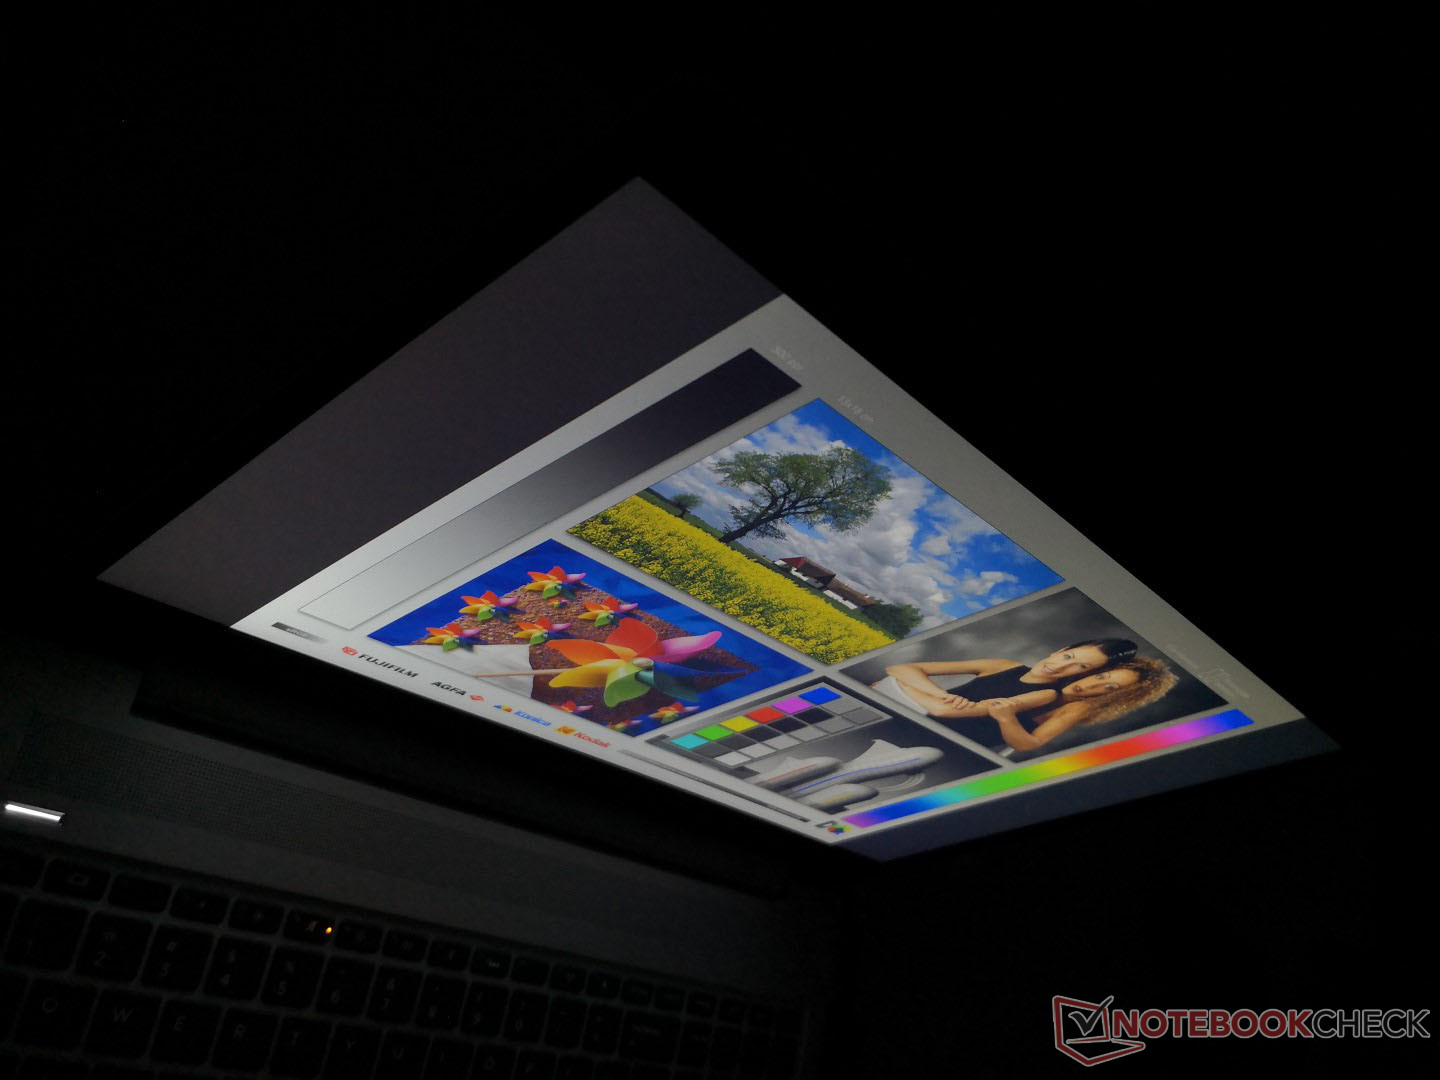
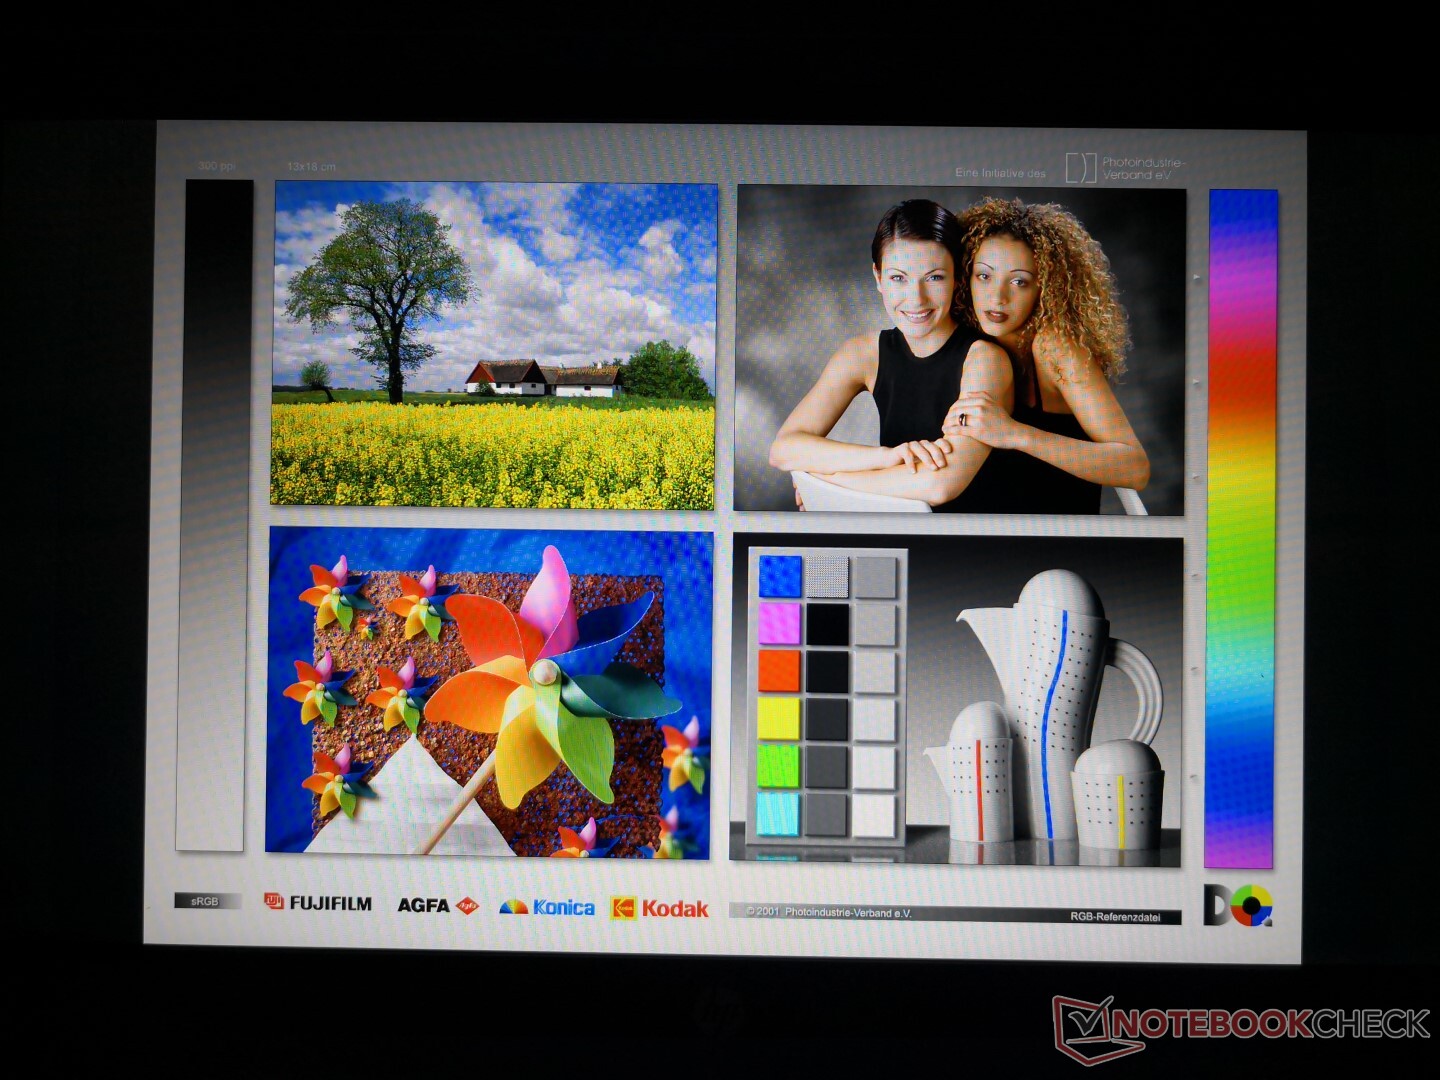
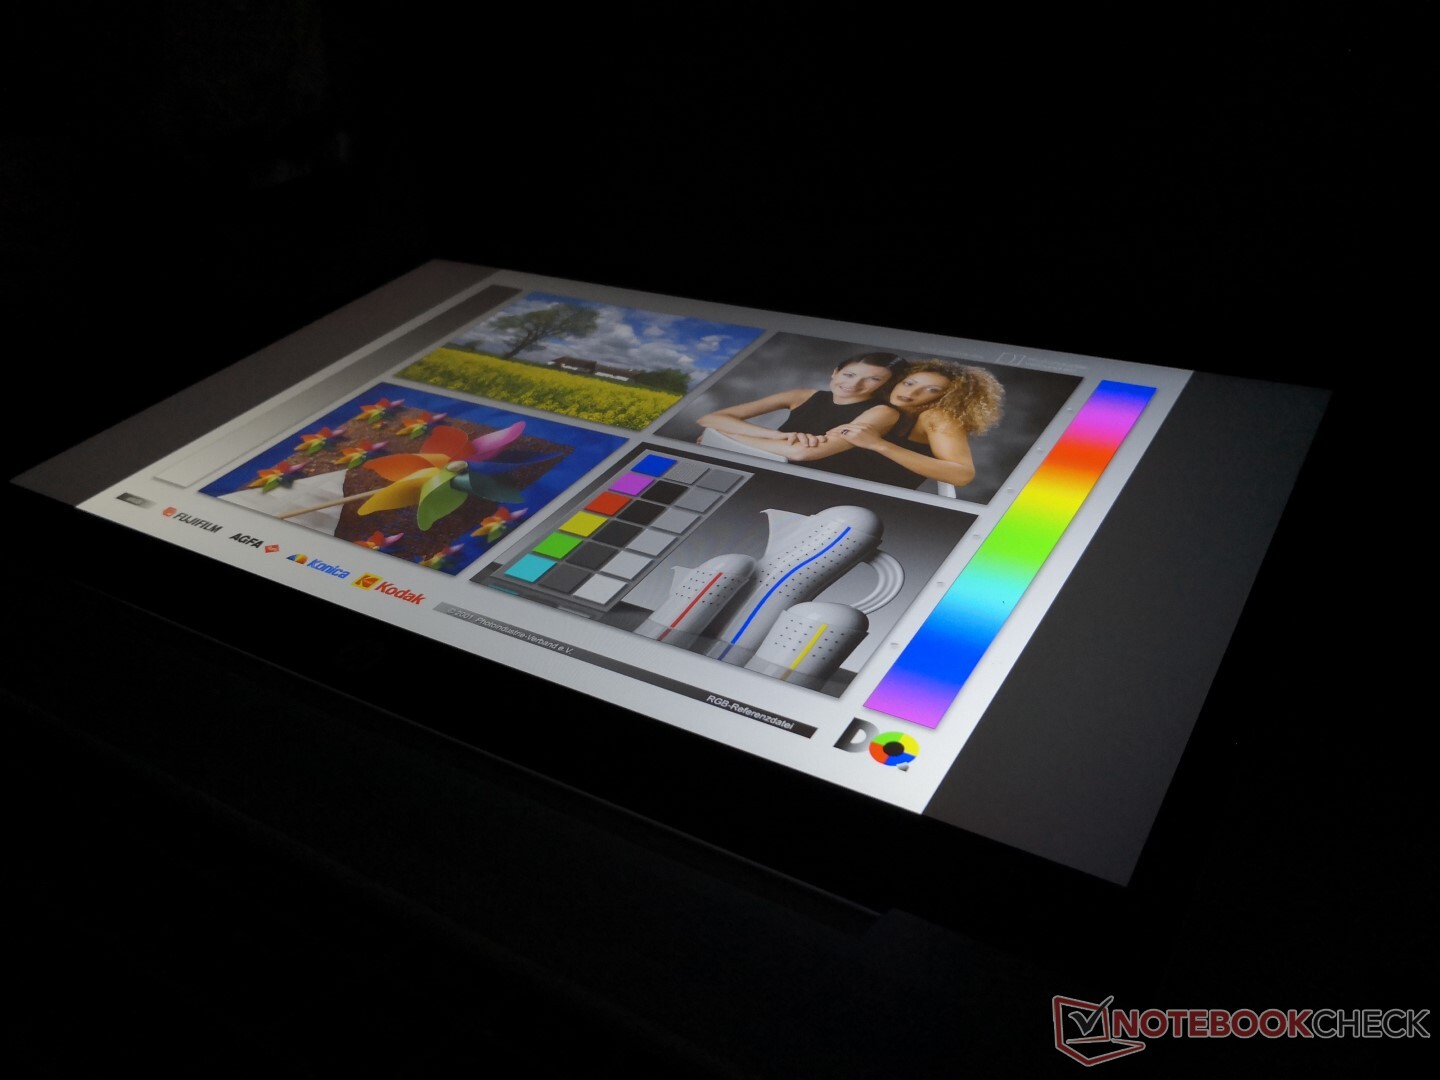
Intel ProBook'umuz, AMD modelimizdeki AU Optronics panelinin aksine bir LG Philips paneli ile birlikte gelir. Kontrast oranı LG Philips panelinde çok daha sığdır, ancak her iki panel de renk alanı, parlaklık ve yanıt süreleri açısından benzerdir. HP, görüş açılarını sınırlandırmak için daha küçük 768p'den Sure View gizliliğine sahip 1000-nit 1080p panele kadar farklı seçenekler sunar.
| |||||||||||||||||||||||||
Aydınlatma: 91 %
Batarya modunda parlaklık: 224.3 cd/m²
Kontrast: 619:1 (Siyah: 0.42 cd/m²)
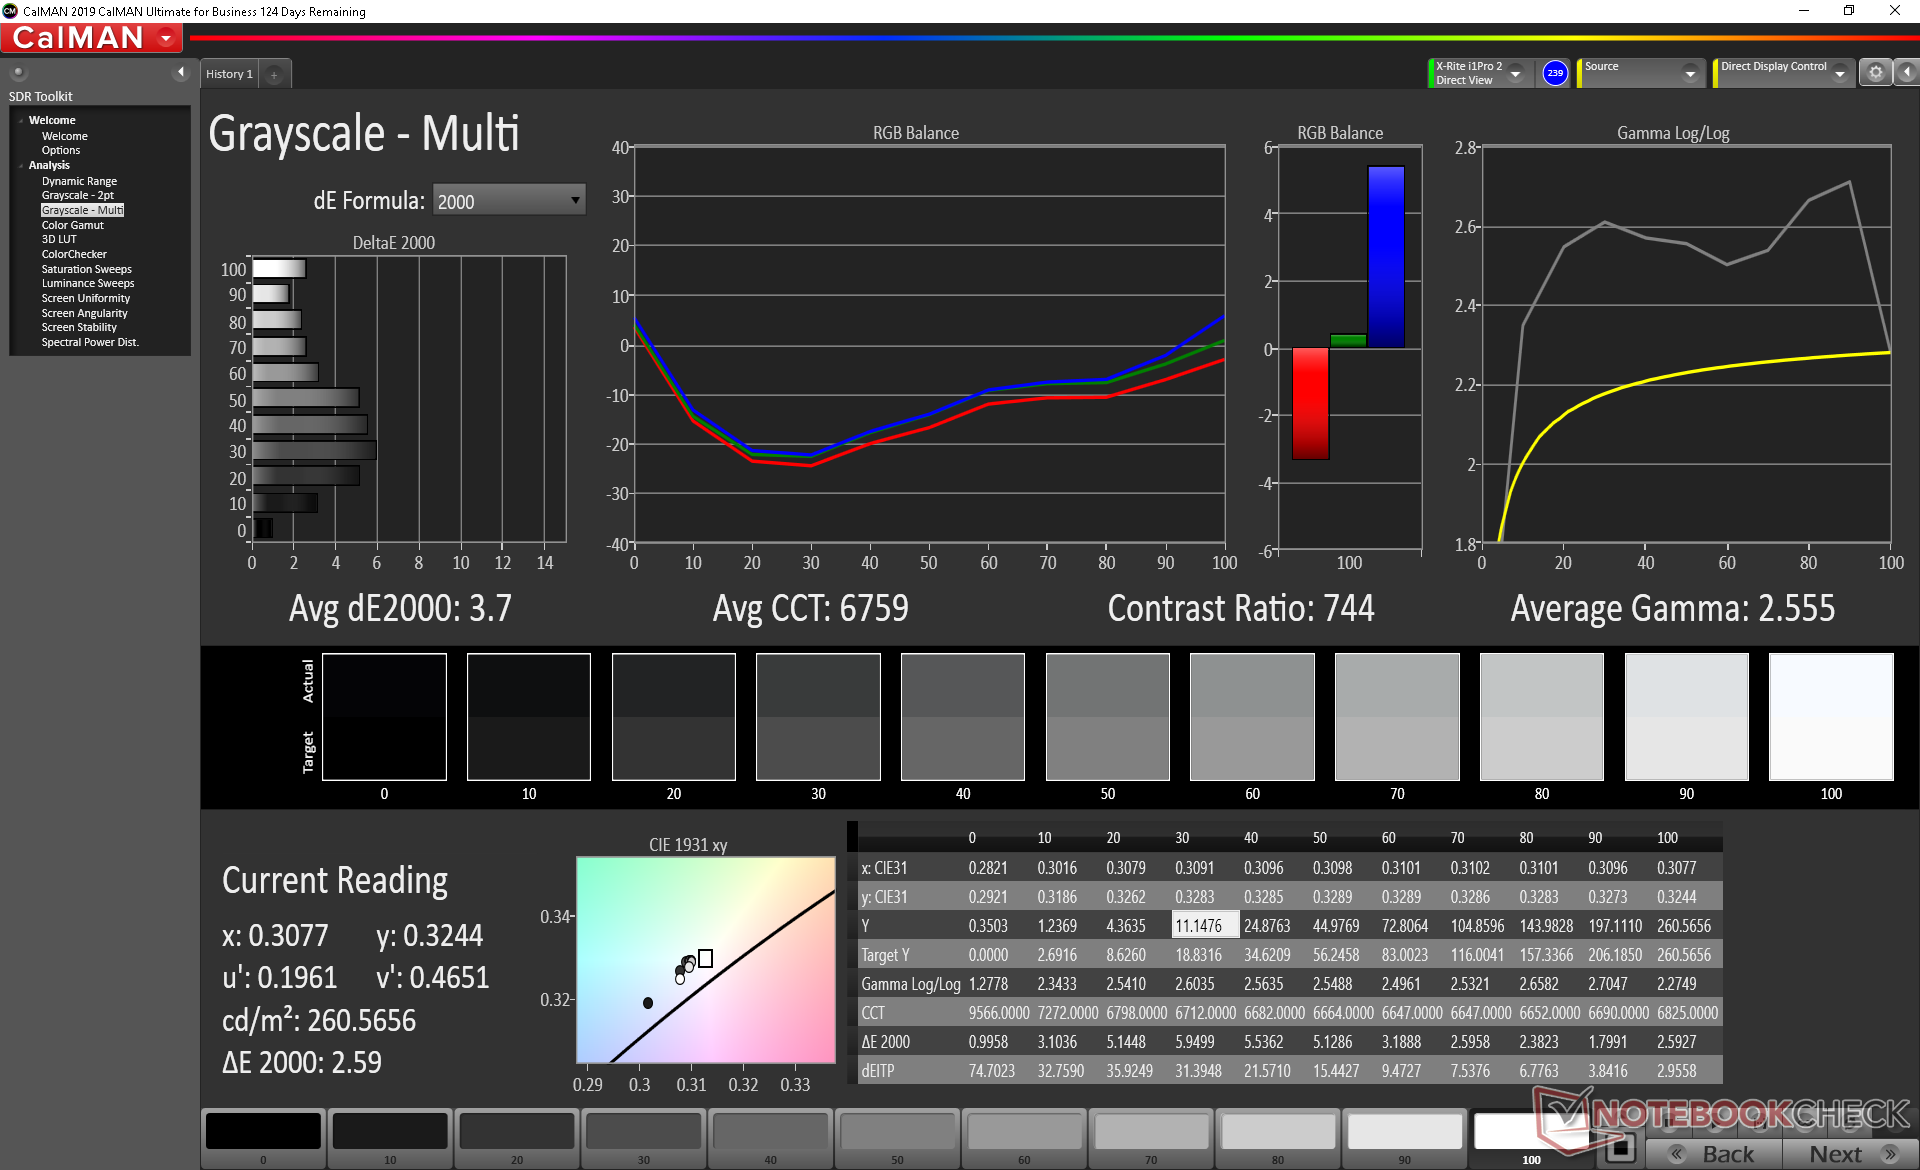
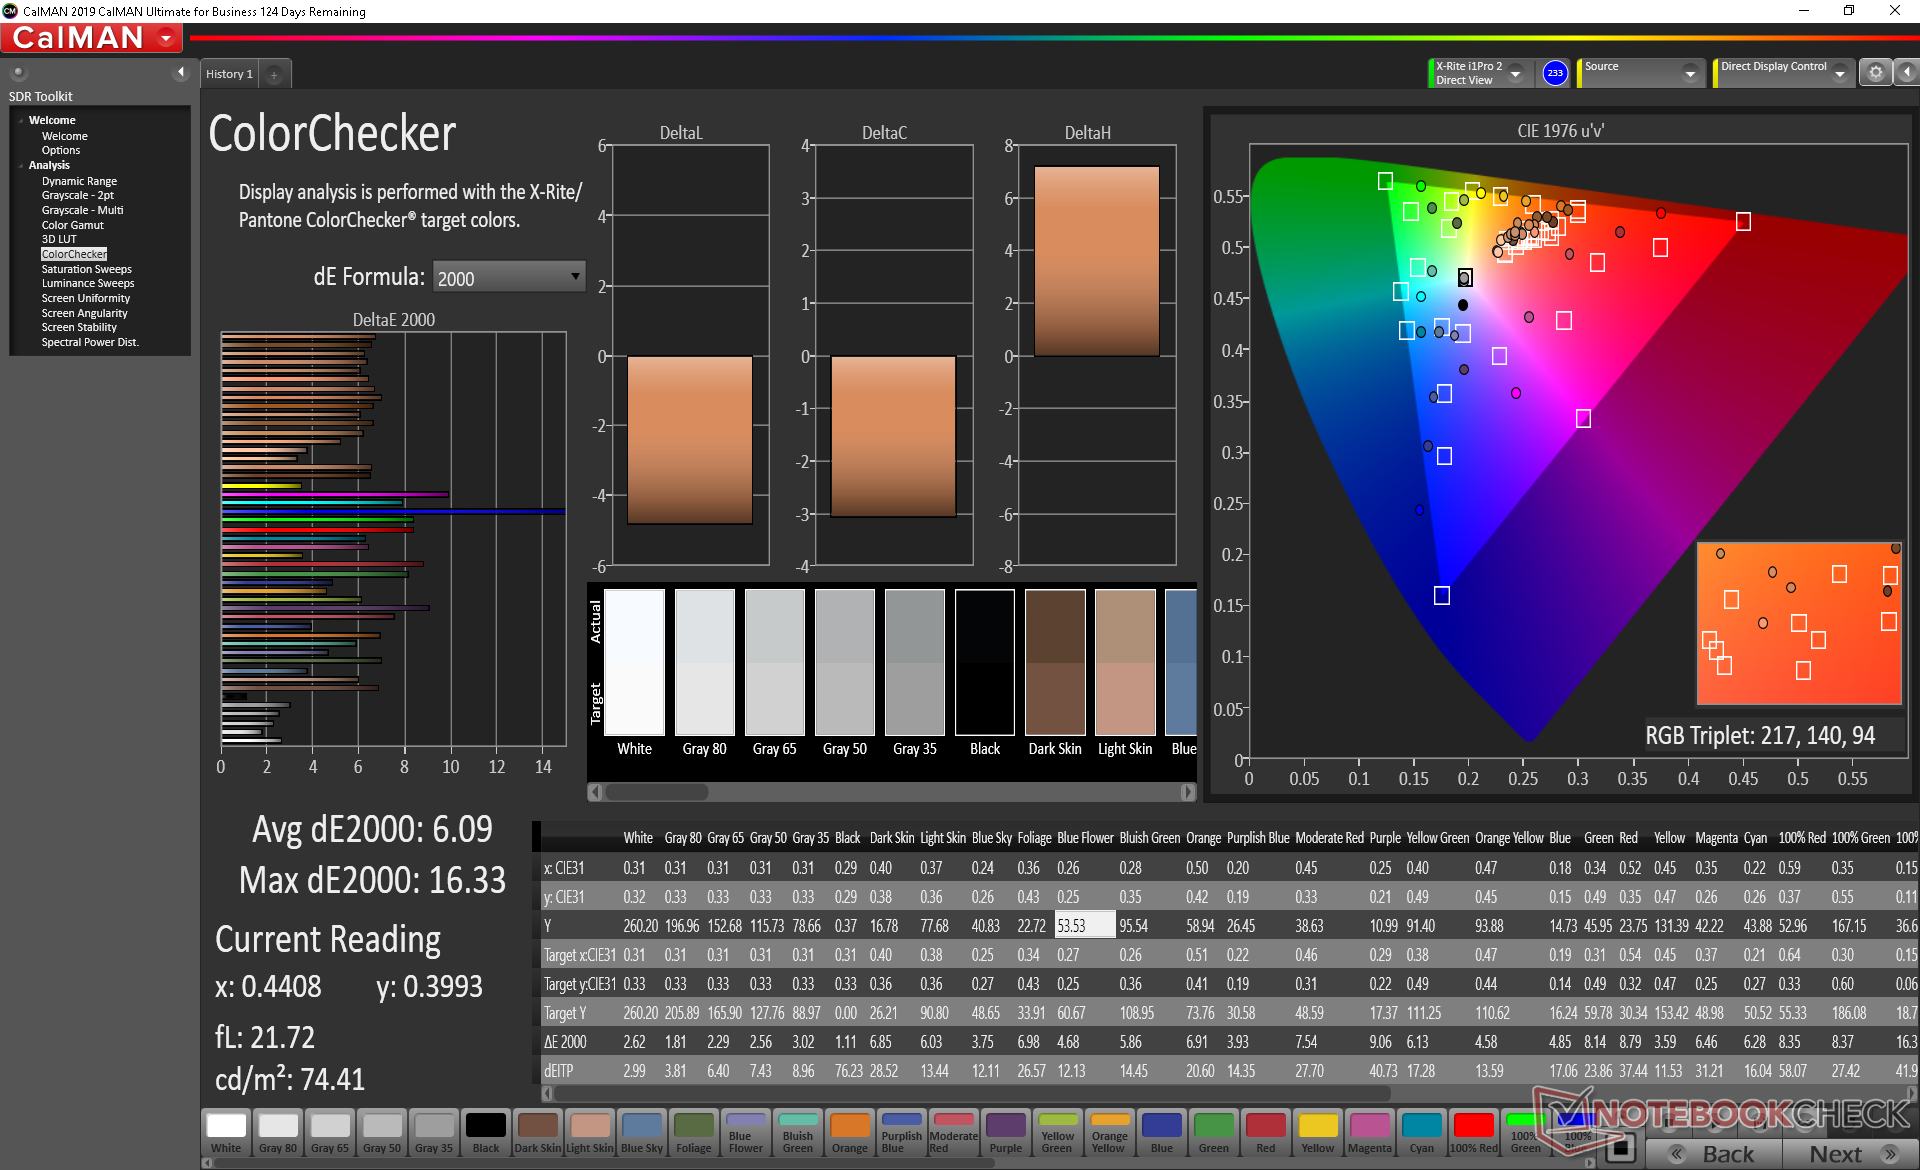
ΔE ColorChecker Calman: 6.09 | ∀{0.5-29.43 Ø4.72}
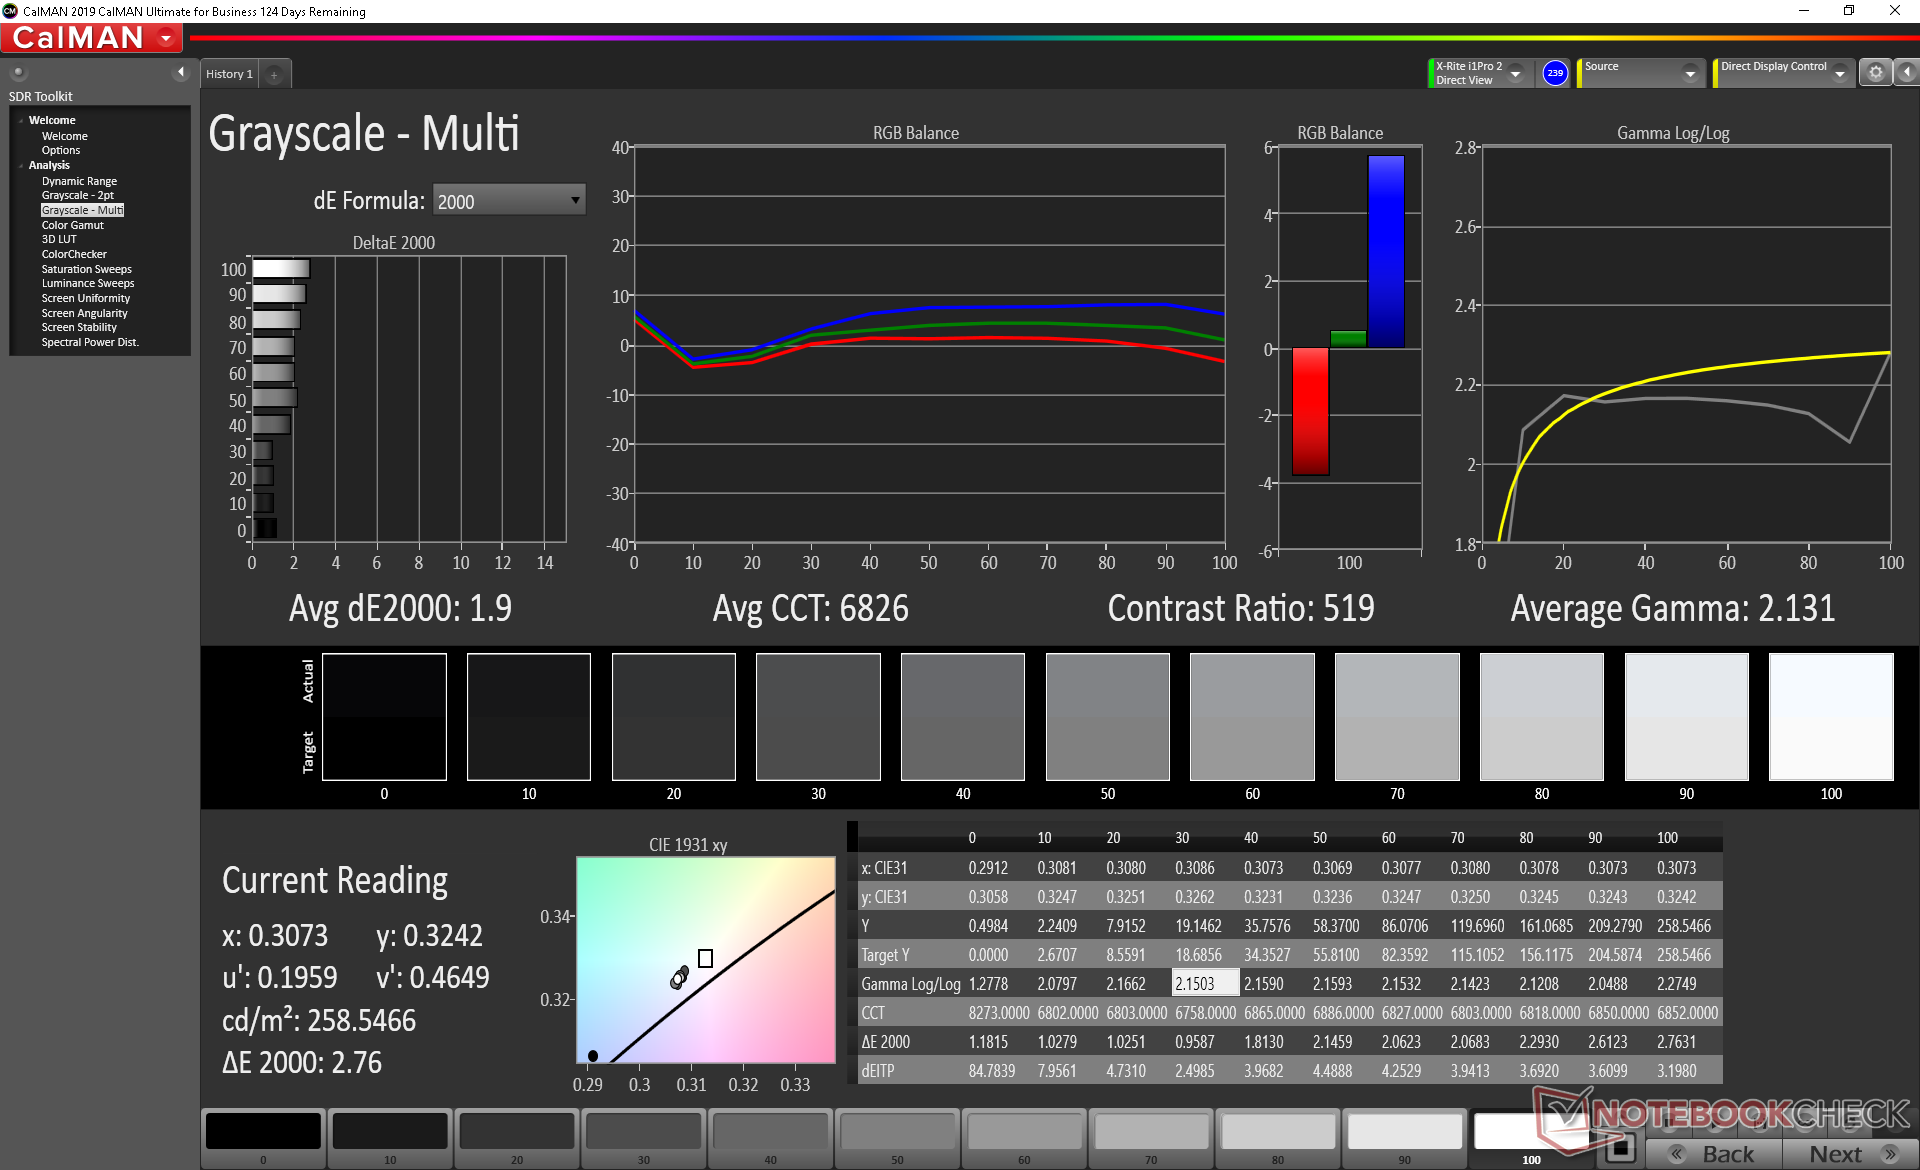
calibrated: 5.2
ΔE Greyscale Calman: 3.7 | ∀{0.09-98 Ø4.97}
56.2% sRGB (Argyll 1.6.3 3D)
35.7% AdobeRGB 1998 (Argyll 1.6.3 3D)
39.08% AdobeRGB 1998 (Argyll 3D)
56.5% sRGB (Argyll 3D)
37.9% Display P3 (Argyll 3D)
Gamma: 2.56
CCT: 6759 K
| HP ProBook 450 G7 8WC04UT LG Philips LGD062E, IPS, 15.6", 1920x1080 | HP ProBook 455 G7-175W8EA AUO, B156HW02, IPS, 15.6", 1920x1080 | MSI Modern 15 A10RB Chi Mei N156HCE-EN1, IPS, 15.6", 1920x1080 | Dell Latitude 15 3590 BOE0802 / NT15N41 / Dell: M9P74, TN LED, 15.6", 1920x1080 | Lenovo ThinkPad L590-20Q70019GE N156HCE-EAA, IPS, 15.6", 1920x1080 | Dynabook Tecra X50-F Toshiba TOS508F, IPS, 15.6", 1920x1080 | |
|---|---|---|---|---|---|---|
| Display | 0% | 69% | 5% | 14% | -3% | |
| Display P3 Coverage (%) | 37.9 | 37.92 0% | 66 74% | 39.67 5% | 43.3 14% | 36.68 -3% |
| sRGB Coverage (%) | 56.5 | 57.1 1% | 92.1 63% | 59.7 6% | 64.4 14% | 55 -3% |
| AdobeRGB 1998 Coverage (%) | 39.08 | 39.18 0% | 66.5 70% | 40.99 5% | 44.81 15% | 37.92 -3% |
| Response Times | -1% | -18% | 23% | -12% | 4% | |
| Response Time Grey 50% / Grey 80% * (ms) | 35.2 ? | 41 ? -16% | 43.2 ? -23% | 41 ? -16% | 42.8 ? -22% | 38 ? -8% |
| Response Time Black / White * (ms) | 30.4 ? | 26 ? 14% | 34.4 ? -13% | 12 ? 61% | 30.8 ? -1% | 25.6 ? 16% |
| PWM Frequency (Hz) | 26040 ? | 250 ? | 24510 ? | |||
| Screen | 20% | 41% | -28% | 11% | 3% | |
| Brightness middle (cd/m²) | 259.8 | 282 9% | 289.4 11% | 215 -17% | 247 -5% | 295.9 14% |
| Brightness (cd/m²) | 251 | 264 5% | 273 9% | 214 -15% | 228 -9% | 270 8% |
| Brightness Distribution (%) | 91 | 88 -3% | 82 -10% | 91 0% | 81 -11% | 86 -5% |
| Black Level * (cd/m²) | 0.42 | 0.19 55% | 0.27 36% | 0.385 8% | 0.18 57% | 0.3 29% |
| Contrast (:1) | 619 | 1484 140% | 1072 73% | 558 -10% | 1372 122% | 986 59% |
| Colorchecker dE 2000 * | 6.09 | 5.56 9% | 2.32 62% | 10.31 -69% | 5.9 3% | 6.55 -8% |
| Colorchecker dE 2000 max. * | 16.33 | 19.07 -17% | 5.76 65% | 20.44 -25% | 22.9 -40% | 21.52 -32% |
| Colorchecker dE 2000 calibrated * | 5.2 | 4.5 13% | 2.49 52% | 3.88 25% | 4.7 10% | 5.73 -10% |
| Greyscale dE 2000 * | 3.7 | 3.57 4% | 3 19% | 11.84 -220% | 5.1 -38% | 4.3 -16% |
| Gamma | 2.56 86% | 2.61 84% | 2.22 99% | 2.67 82% | 2.21 100% | 2.475 89% |
| CCT | 6759 96% | 6895 94% | 6867 95% | 13398 49% | 6398 102% | 7002 93% |
| Color Space (Percent of AdobeRGB 1998) (%) | 35.7 | 36 1% | 59.8 68% | 39 9% | 41.2 15% | 35 -2% |
| Color Space (Percent of sRGB) (%) | 56.2 | 57 1% | 92 64% | 61 9% | 64.1 14% | 54 -4% |
| Toplam Ortalama (Program / Ayarlar) | 6% /
14% | 31% /
39% | 0% /
-15% | 4% /
9% | 1% /
2% |
* ... daha küçük daha iyidir
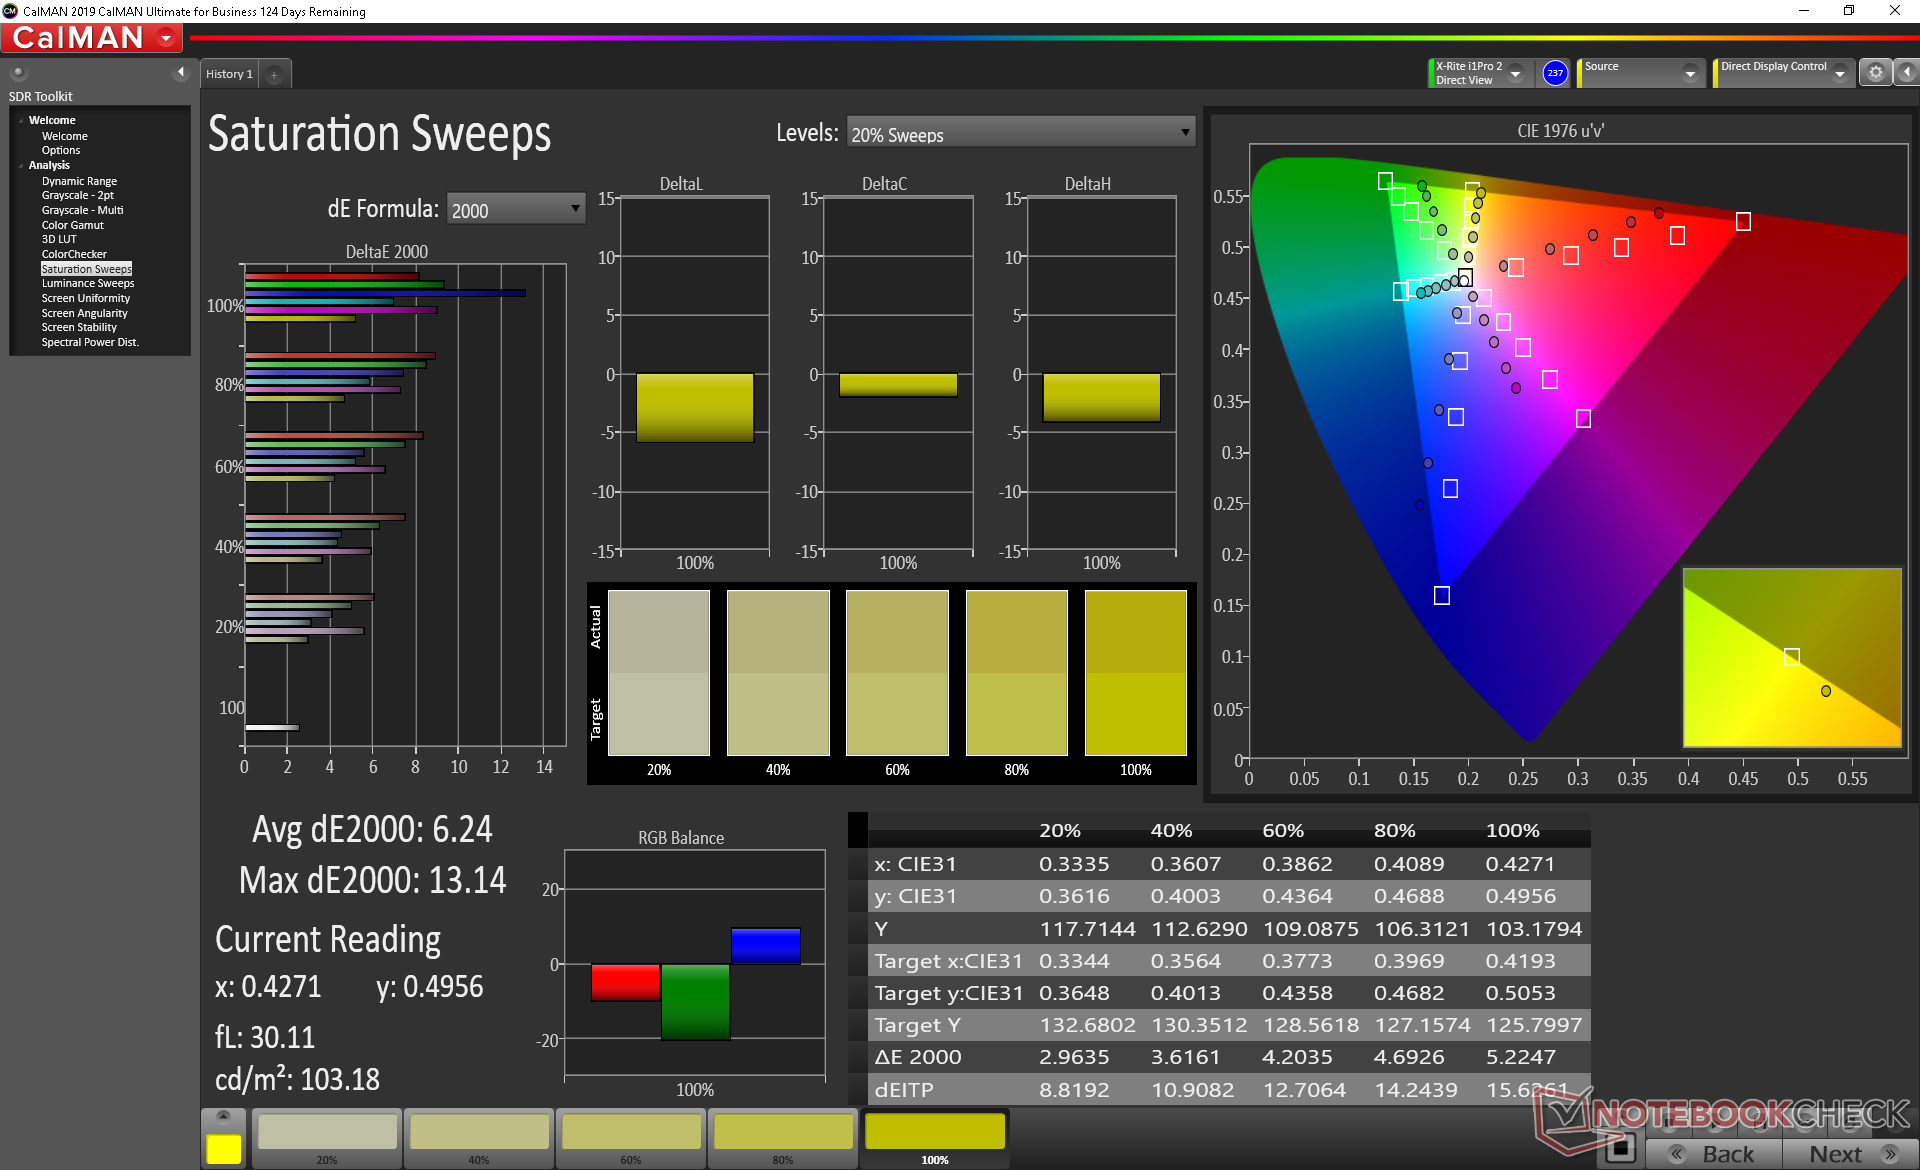
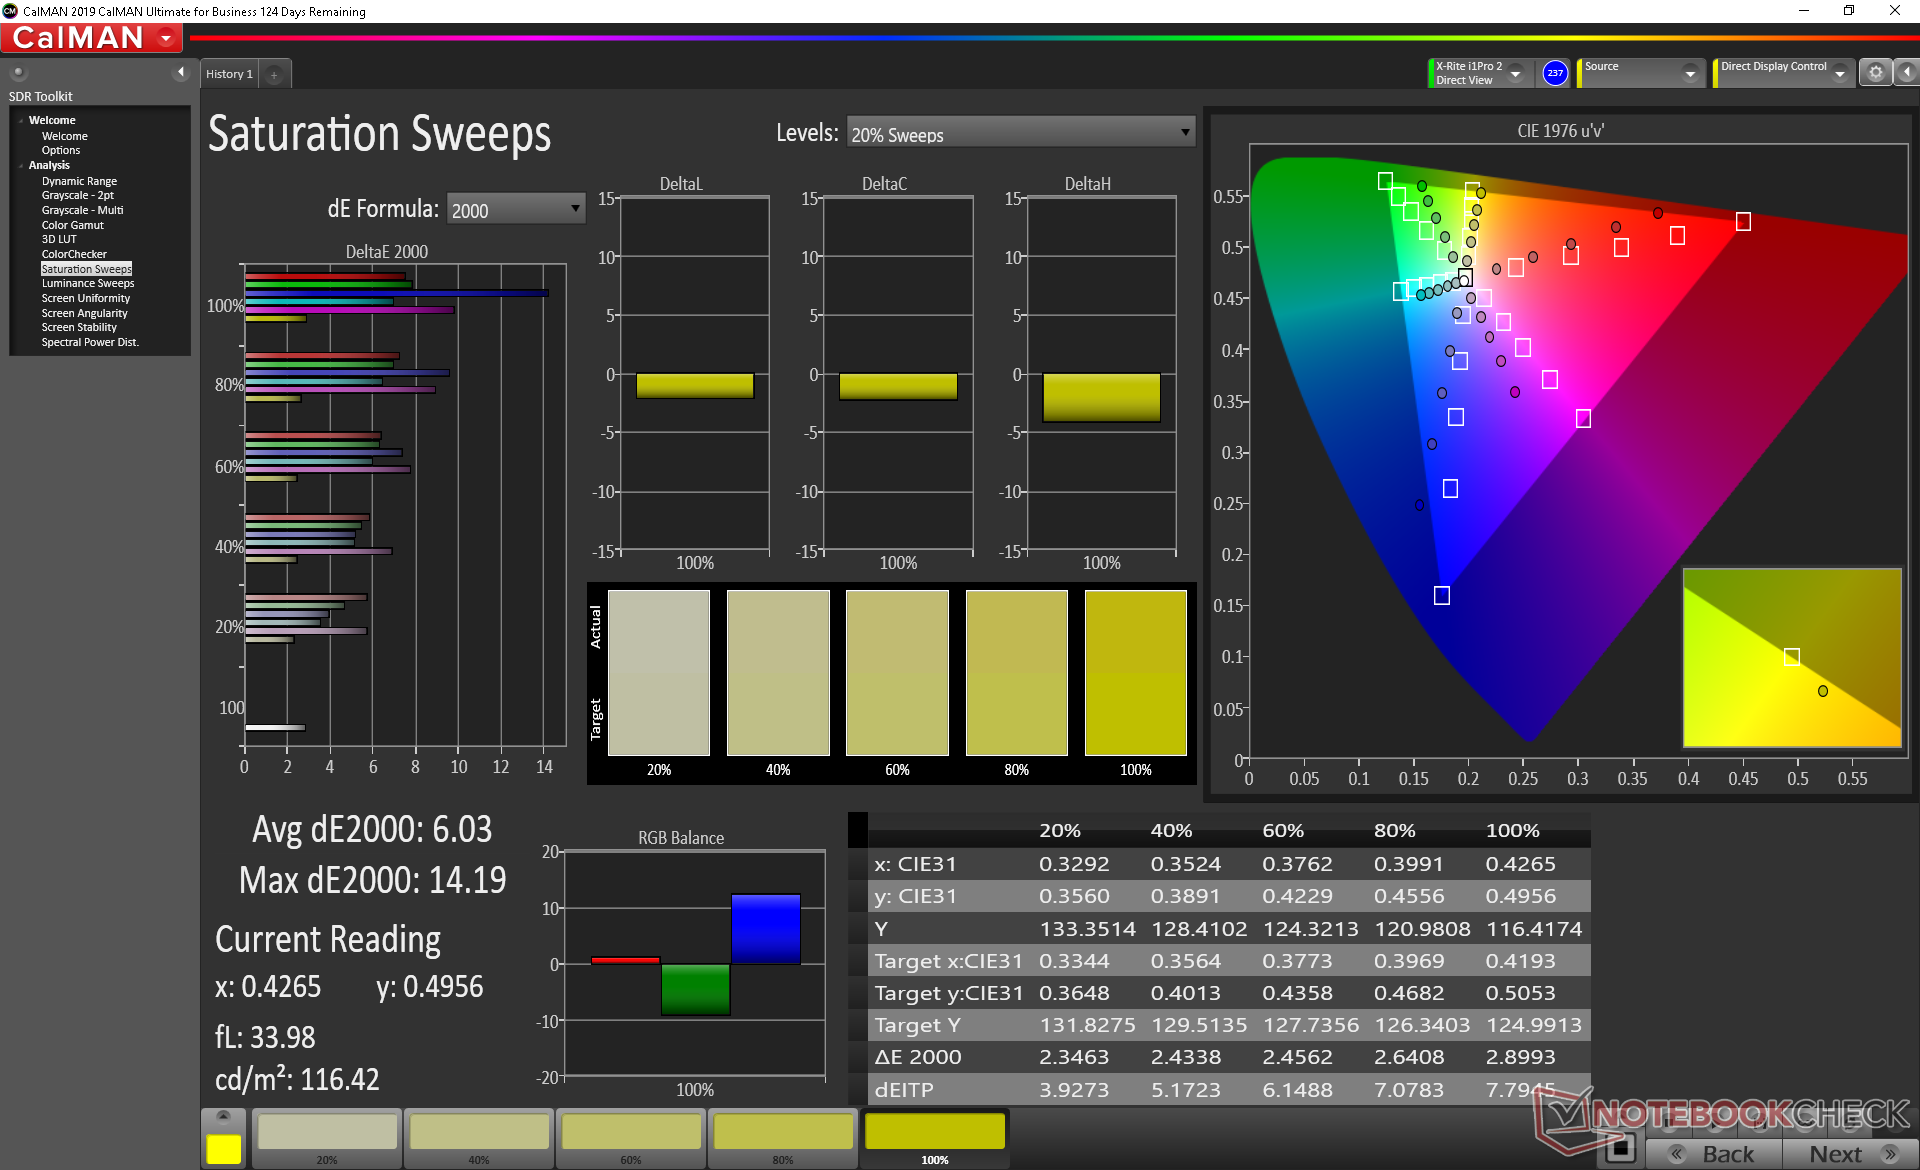
Renk alanı, bir bütçe panelini belirtmek için sırasıyla AdobeRGB ve sRGB'nin yalnızca yüzde 36'sı ve yüzde 56'sı ile dar. Bugünlerde orta düzey Ultrabook'ların çoğu, gözle görülür şekilde daha derin ve daha canlı renkler için sRGB'nin yüzde 90'ından fazlasını kapsıyor. İş yükleriniz doğru renkler gerektirmediği sürece bu bir sorun olmamalıdır.
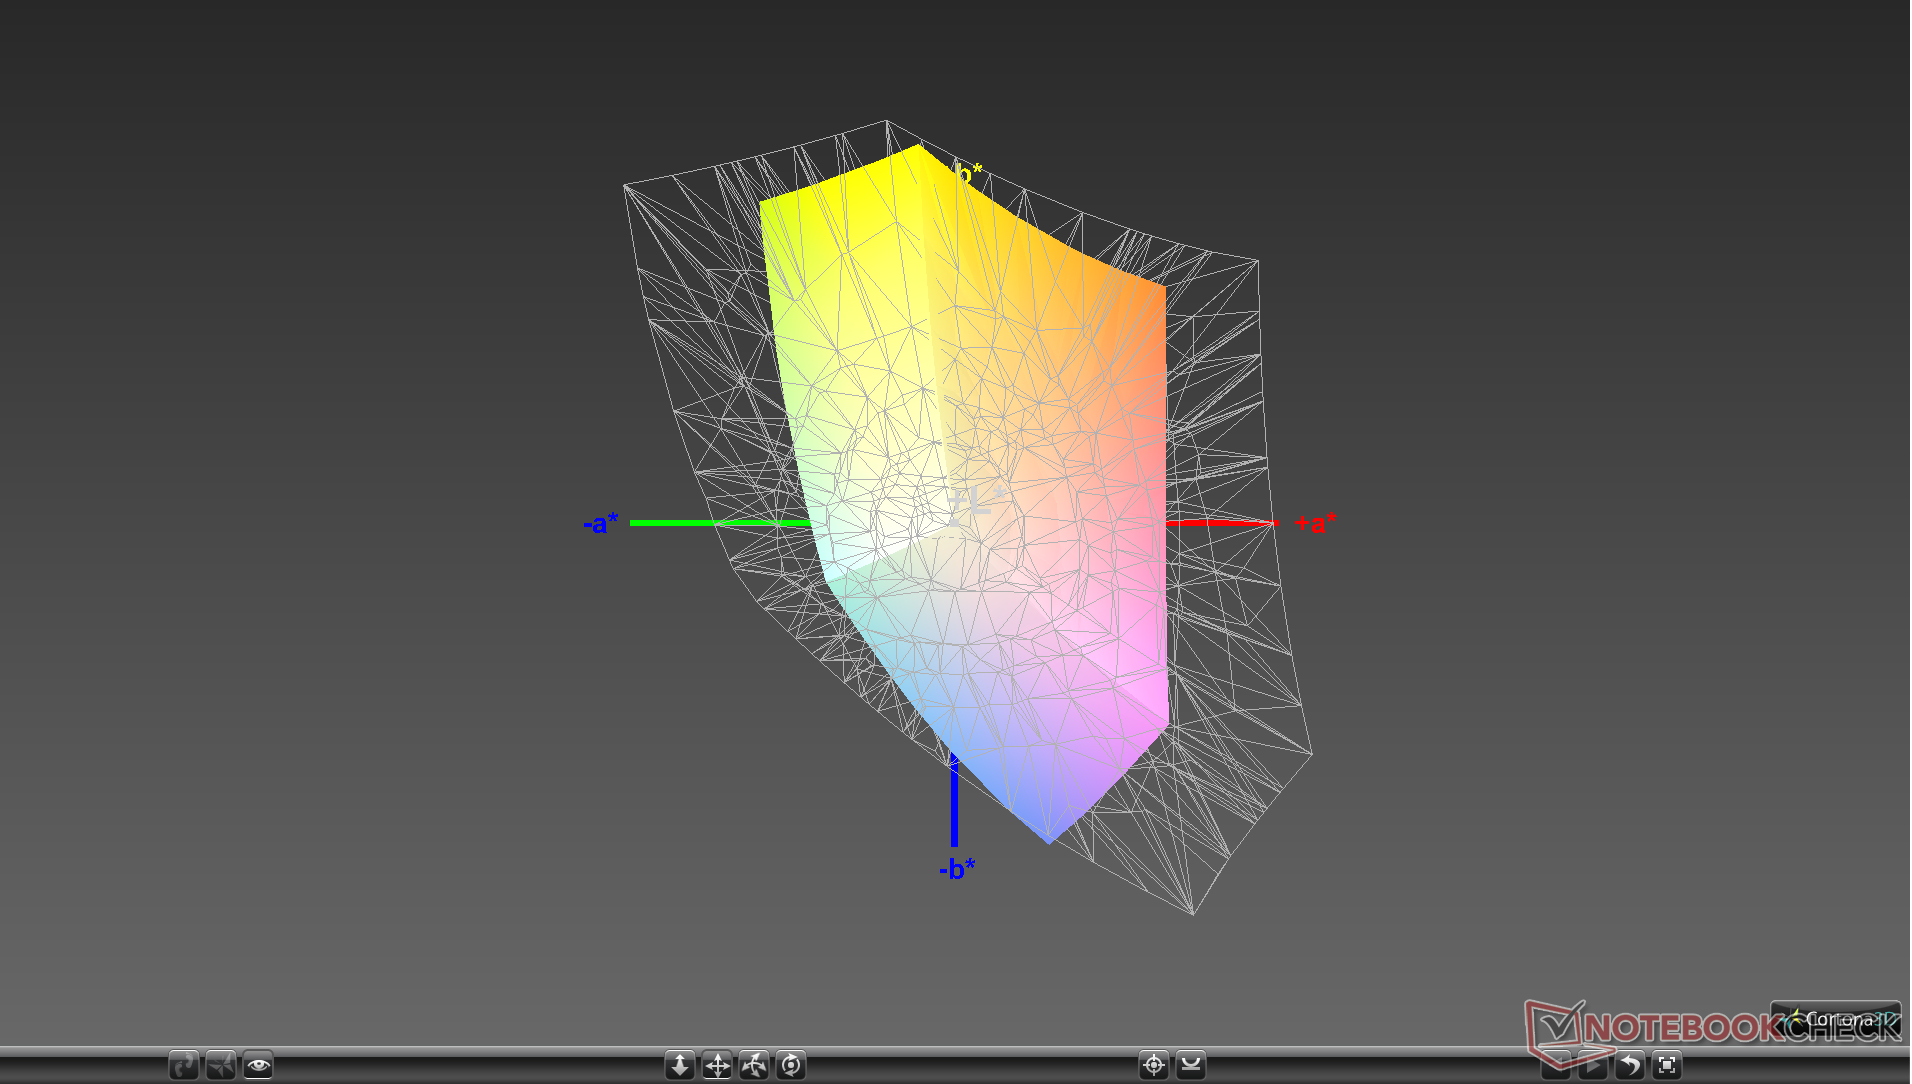
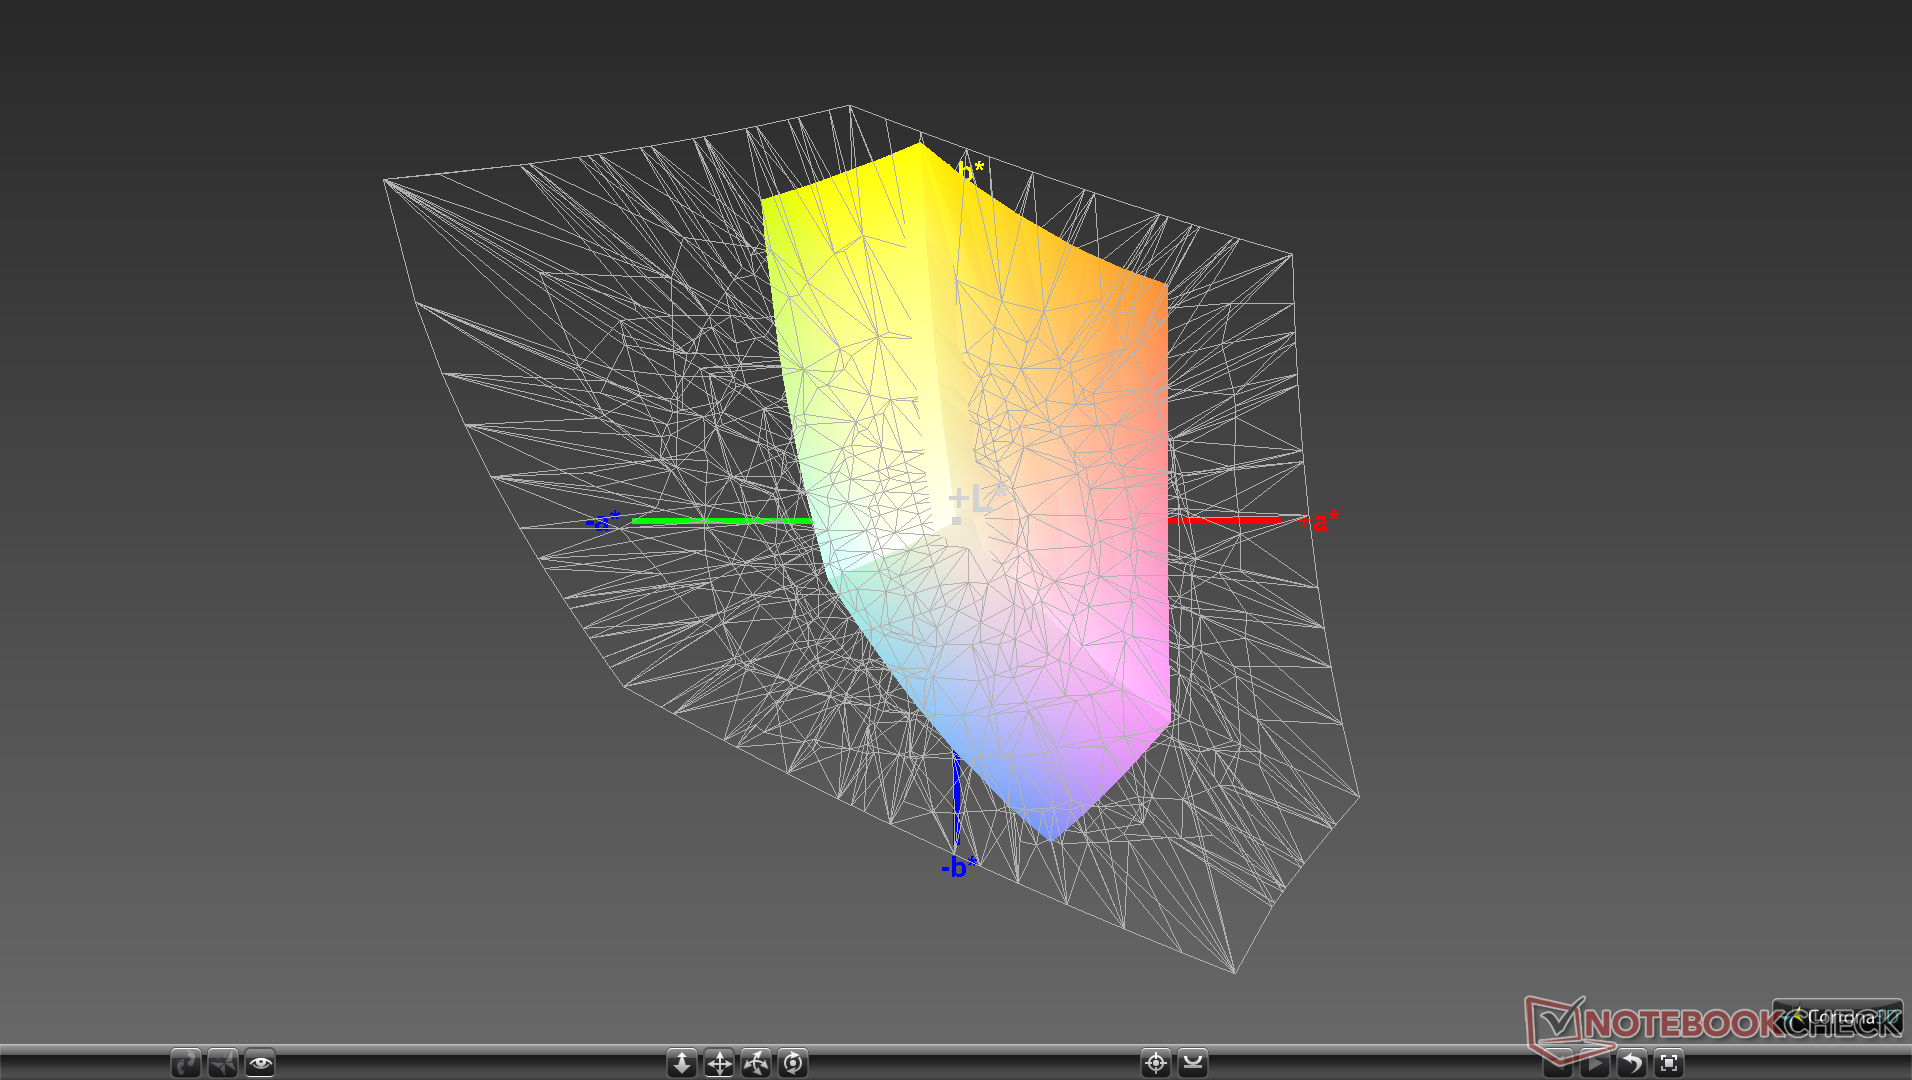
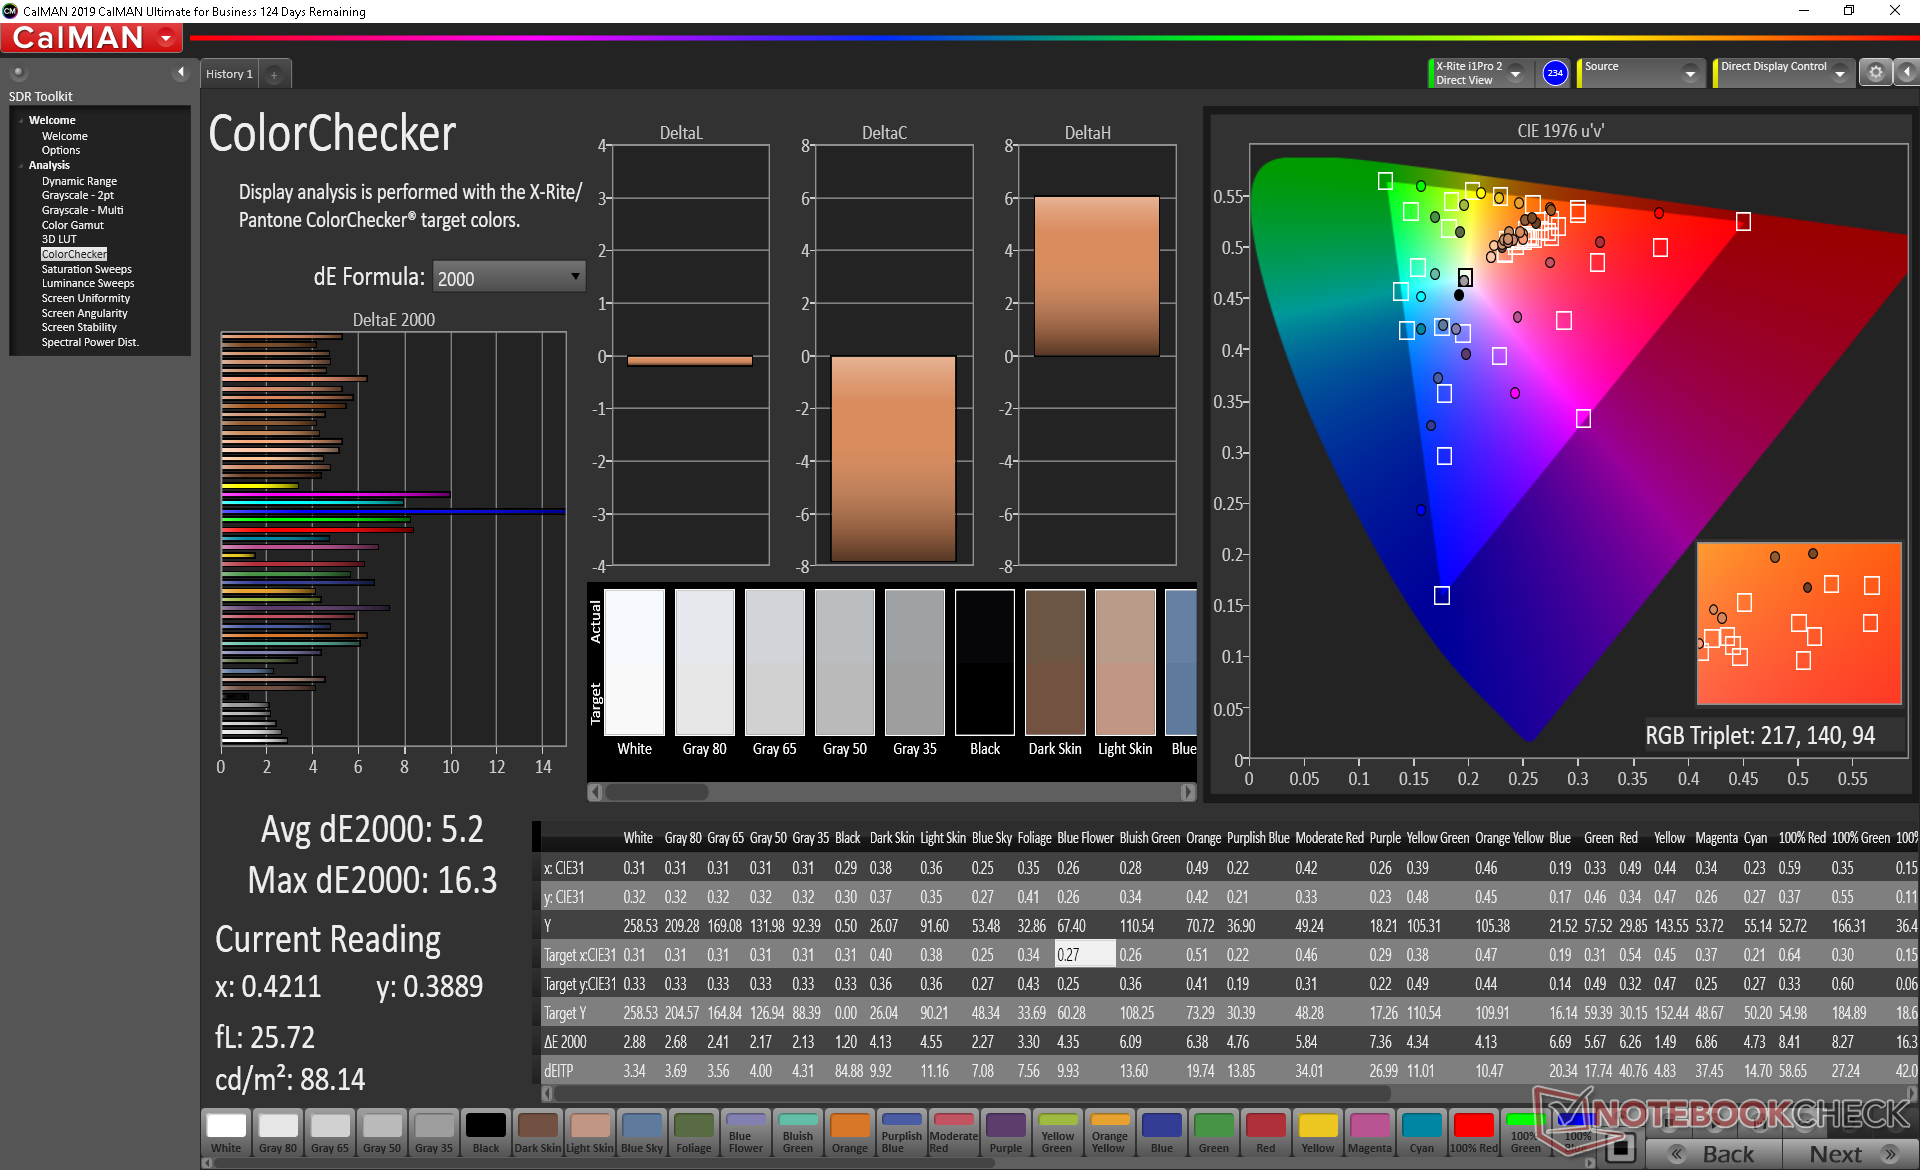
X-Rite kolorimetre ölçümleri, son kullanıcı kalibrasyonu ile neyse ki düzeltilebilen, kutudan çıkan zayıf RGB dengesini ortaya çıkarır. Yukarıda bahsedilen sınırlı renk alanı nedeniyle renkler, doygunluk seviyesi ne kadar yüksek olursa, giderek daha yanlış hale geliyor. Özellikle mavi, diğer renklerden daha az doğru temsil edilir.
Yanıt Sürelerini Görüntüle
| ↔ Tepki Süresi Siyahtan Beyaza | ||
|---|---|---|
| 30.4 ms ... yükseliş ↗ ve sonbahar↘ birleşimi | ↗ 19.6 ms yükseliş | 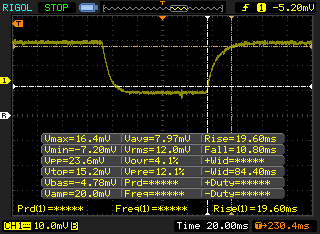 |
| ↘ 10.8 ms sonbahar | ||
| Ekran, testlerimizde yavaş yanıt oranları gösteriyor ve oyuncular için yetersiz olacaktır. Karşılaştırıldığında, test edilen tüm cihazlar 0.1 (minimum) ile 240 (maksimum) ms arasında değişir. » Tüm cihazların 82 %'si daha iyi. Bu, ölçülen yanıt süresinin test edilen tüm cihazların ortalamasından (19.8 ms) daha kötü olduğu anlamına gelir. | ||
| ↔ Tepki Süresi %50 Griden %80 Griye | ||
| 35.2 ms ... yükseliş ↗ ve sonbahar↘ birleşimi | ↗ 19.6 ms yükseliş | 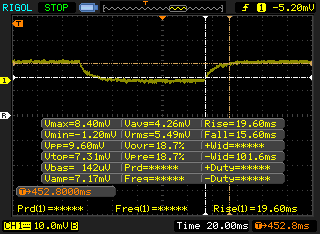 |
| ↘ 15.6 ms sonbahar | ||
| Ekran, testlerimizde yavaş yanıt oranları gösteriyor ve oyuncular için yetersiz olacaktır. Karşılaştırıldığında, test edilen tüm cihazlar 0.165 (minimum) ile 636 (maksimum) ms arasında değişir. » Tüm cihazların 49 %'si daha iyi. Bu, ölçülen yanıt süresinin test edilen tüm cihazların ortalamasından (31 ms) daha kötü olduğu anlamına gelir. | ||
Ekran Titremesi / PWM (Darbe Genişliği Modülasyonu)
| Ekran titriyor / PWM algılanmadı |  | ||
Karşılaştırıldığında: Test edilen tüm cihazların %52 %'si ekranı karartmak için PWM kullanmıyor. PWM tespit edilirse, ortalama 7747 (minimum: 5 - maksimum: 343500) Hz ölçüldü. | |||
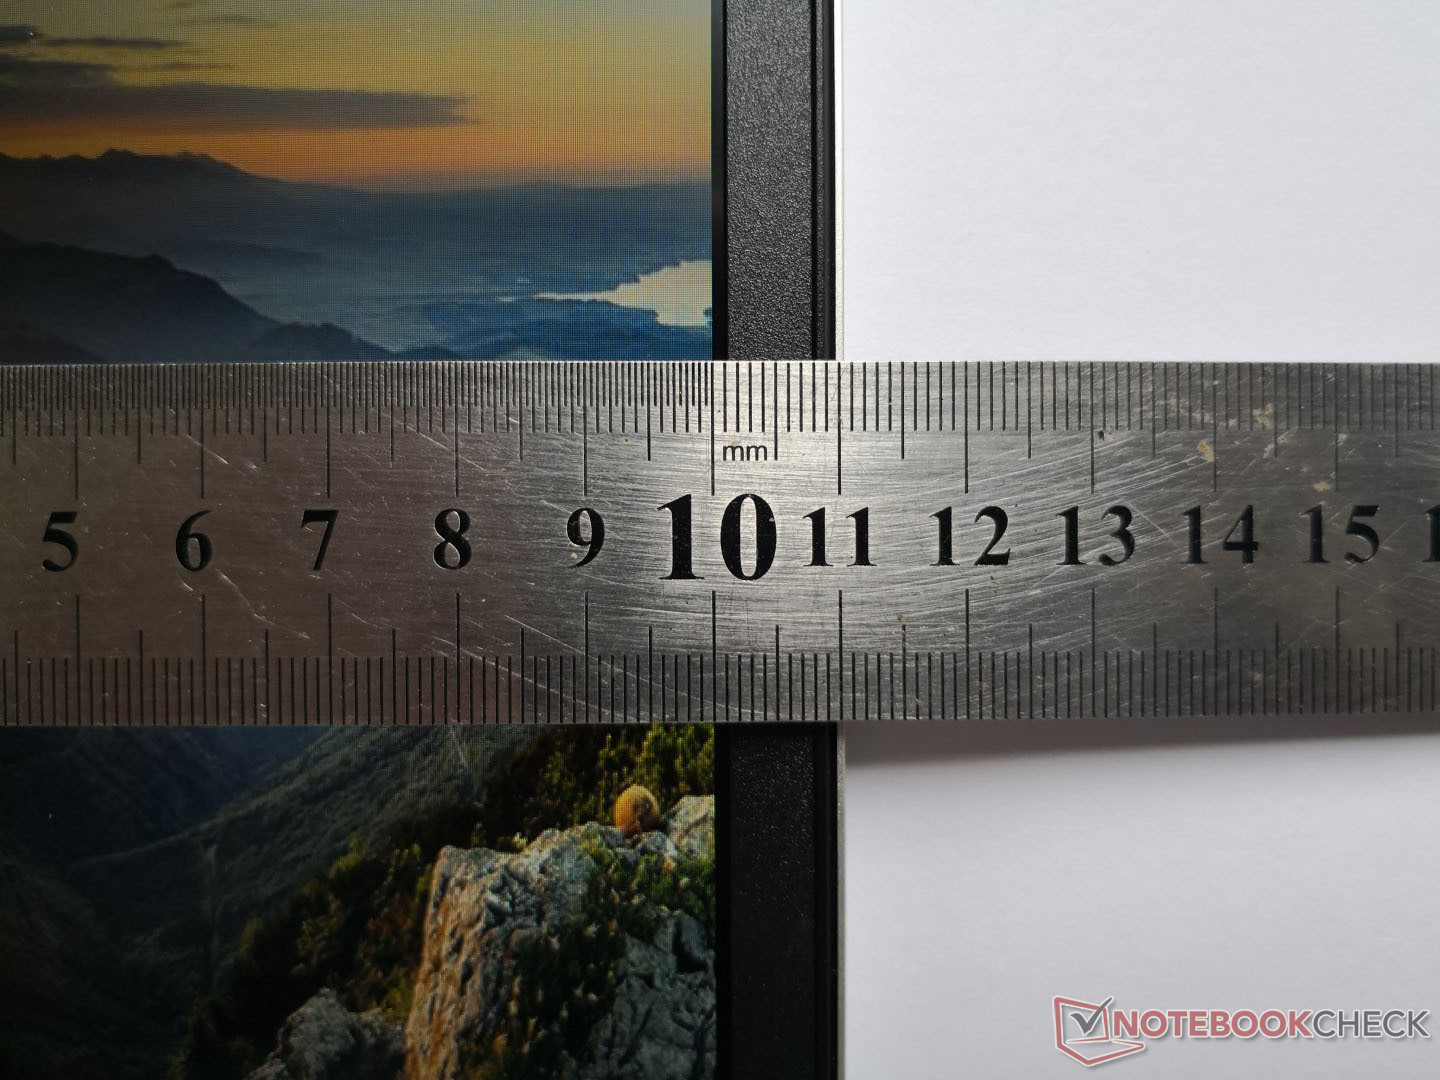
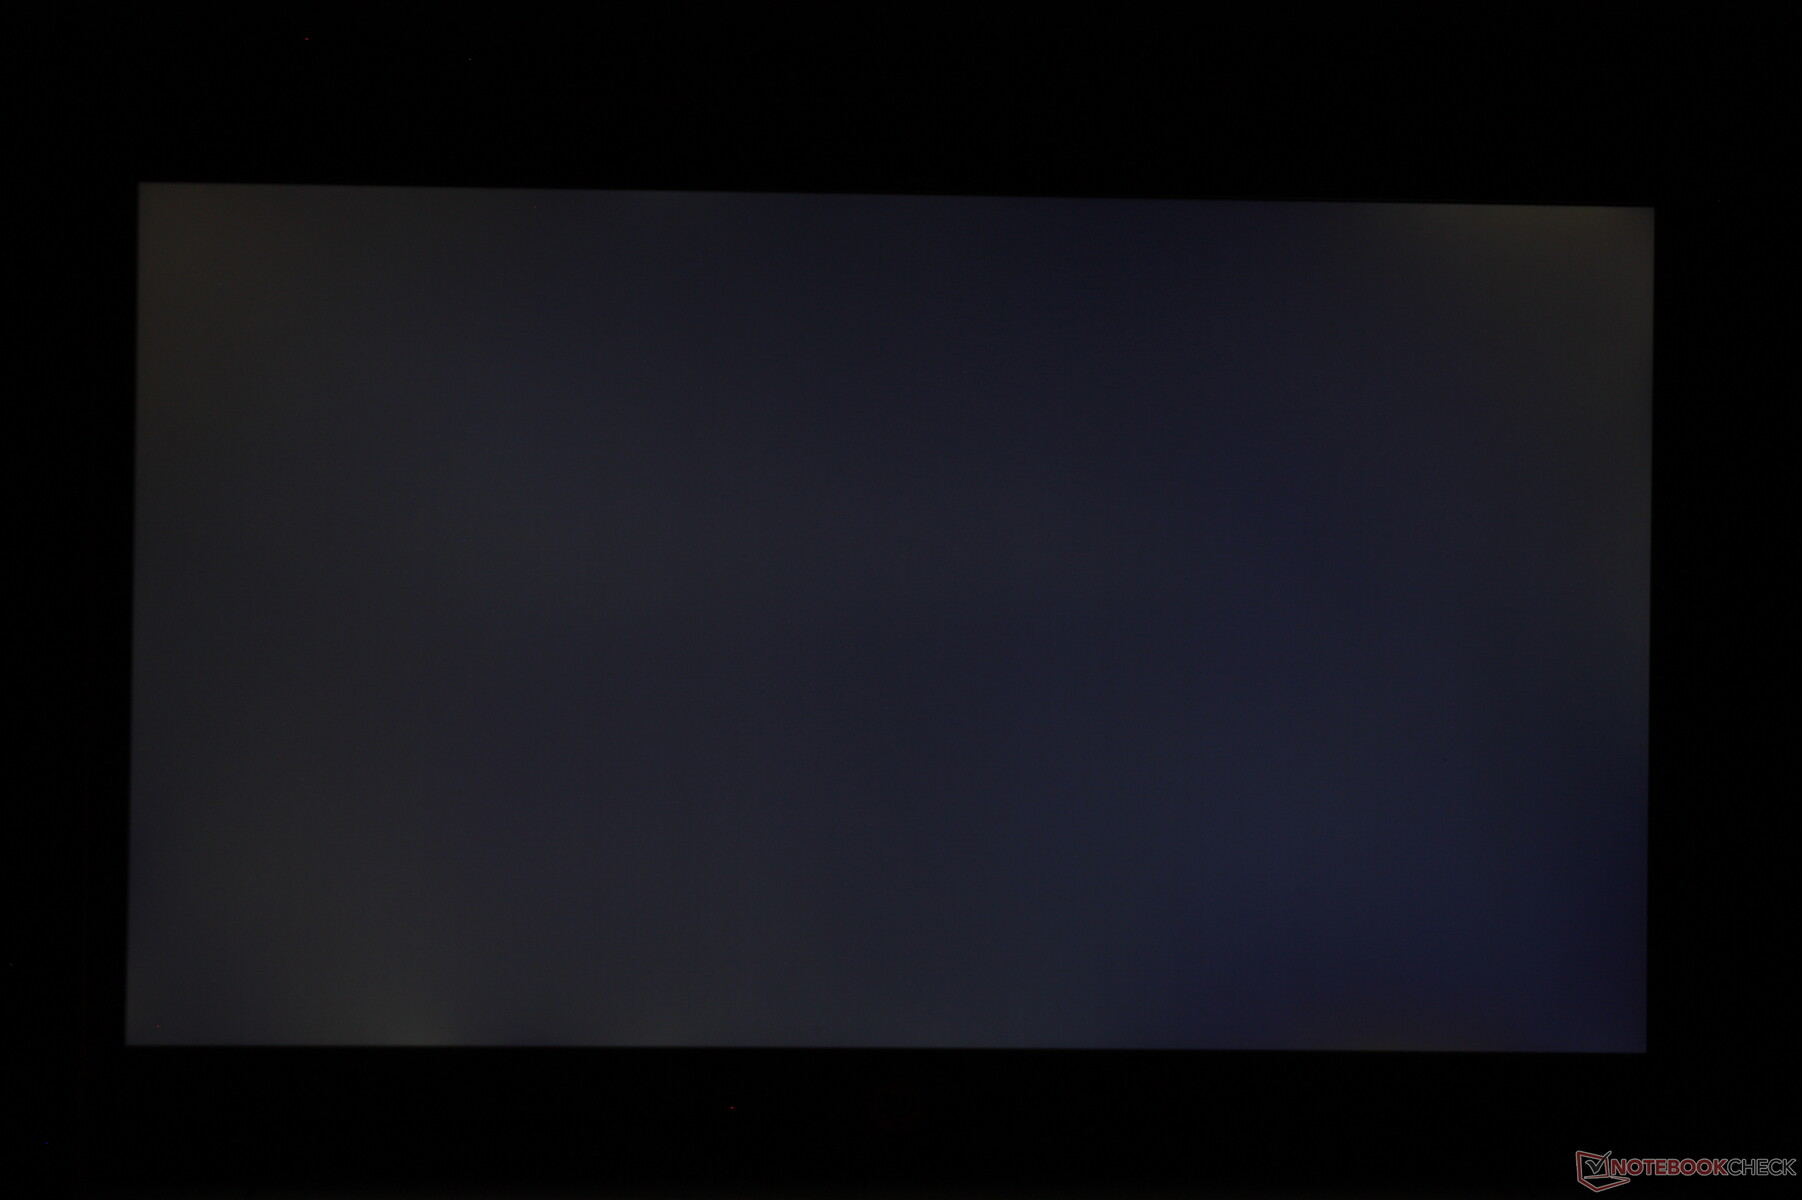
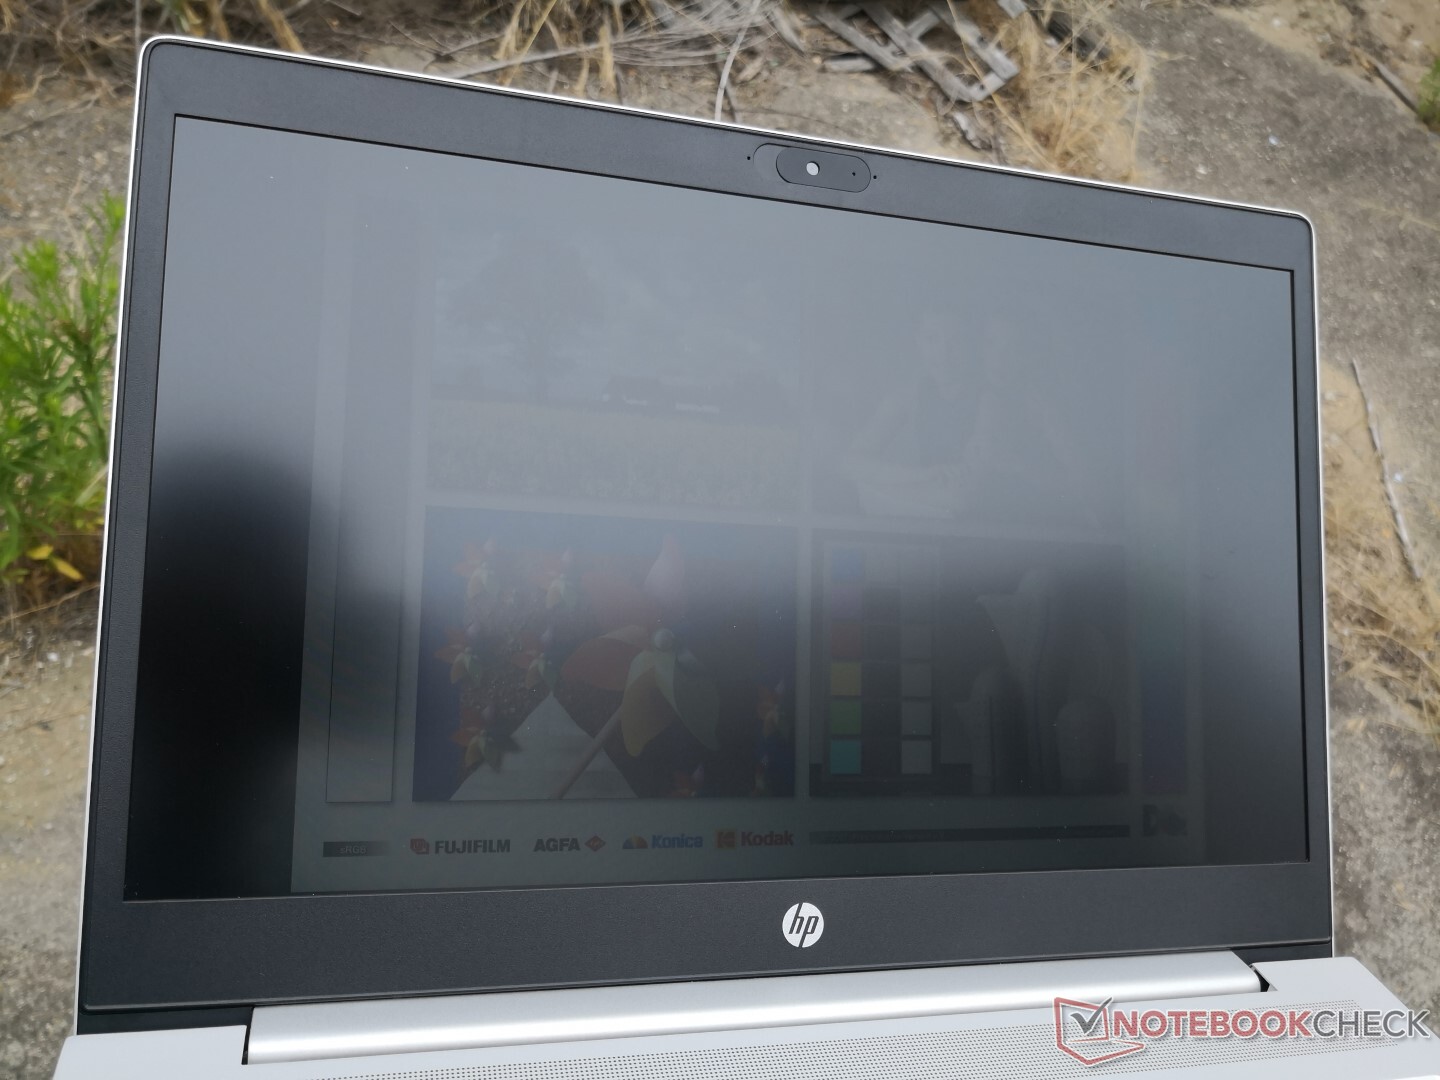
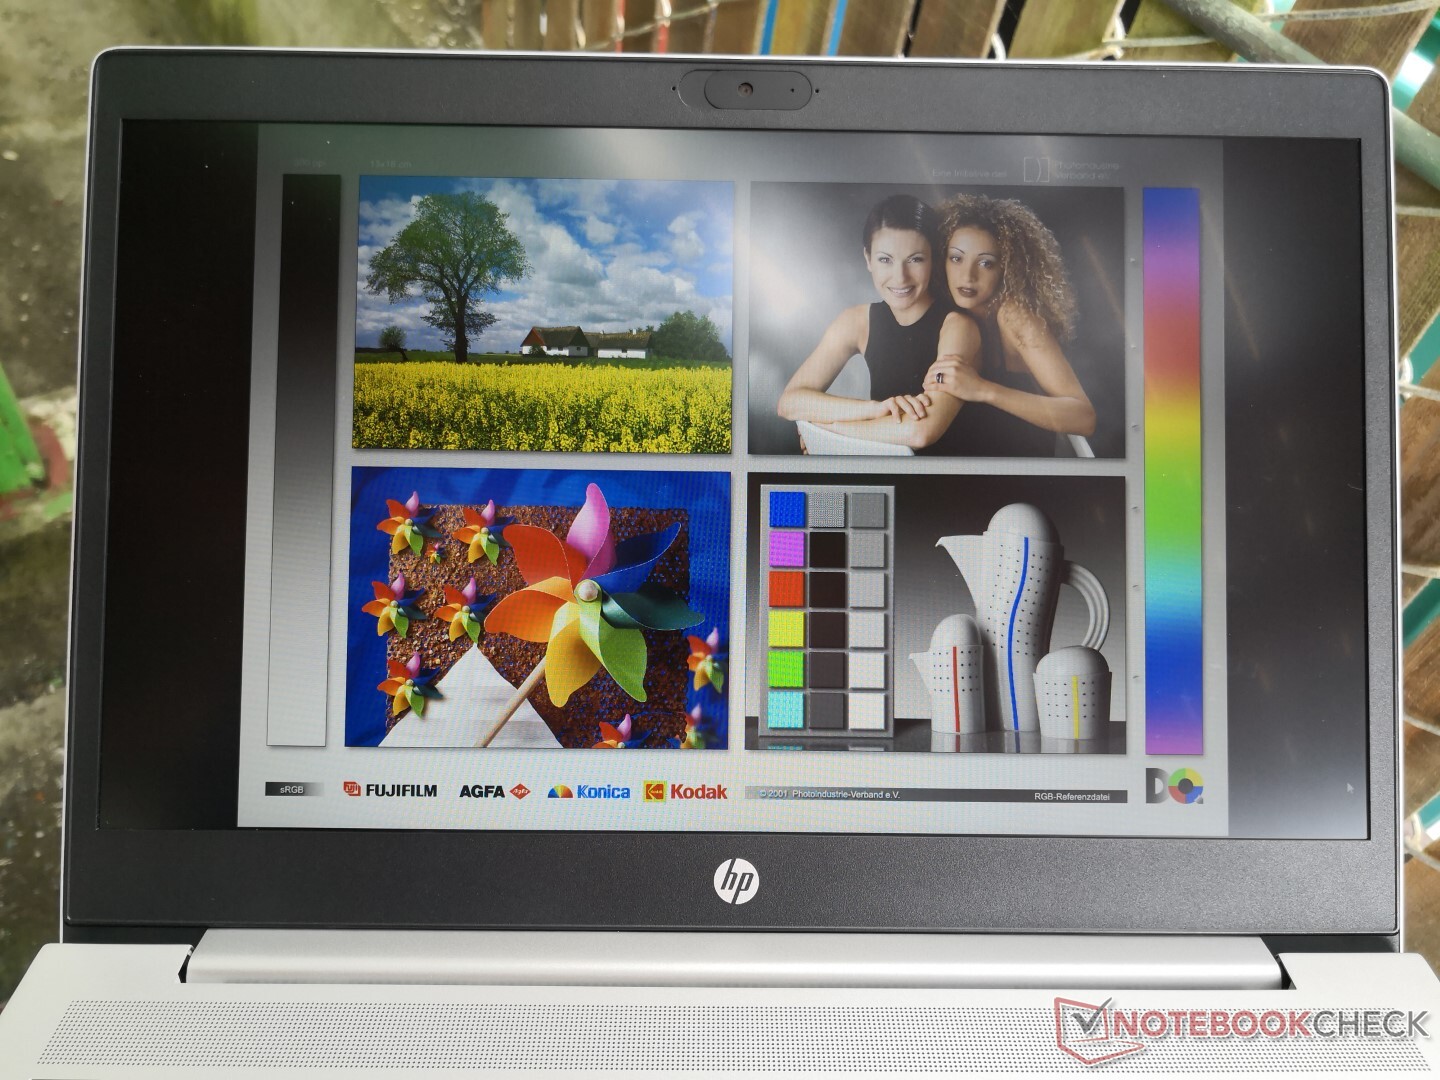
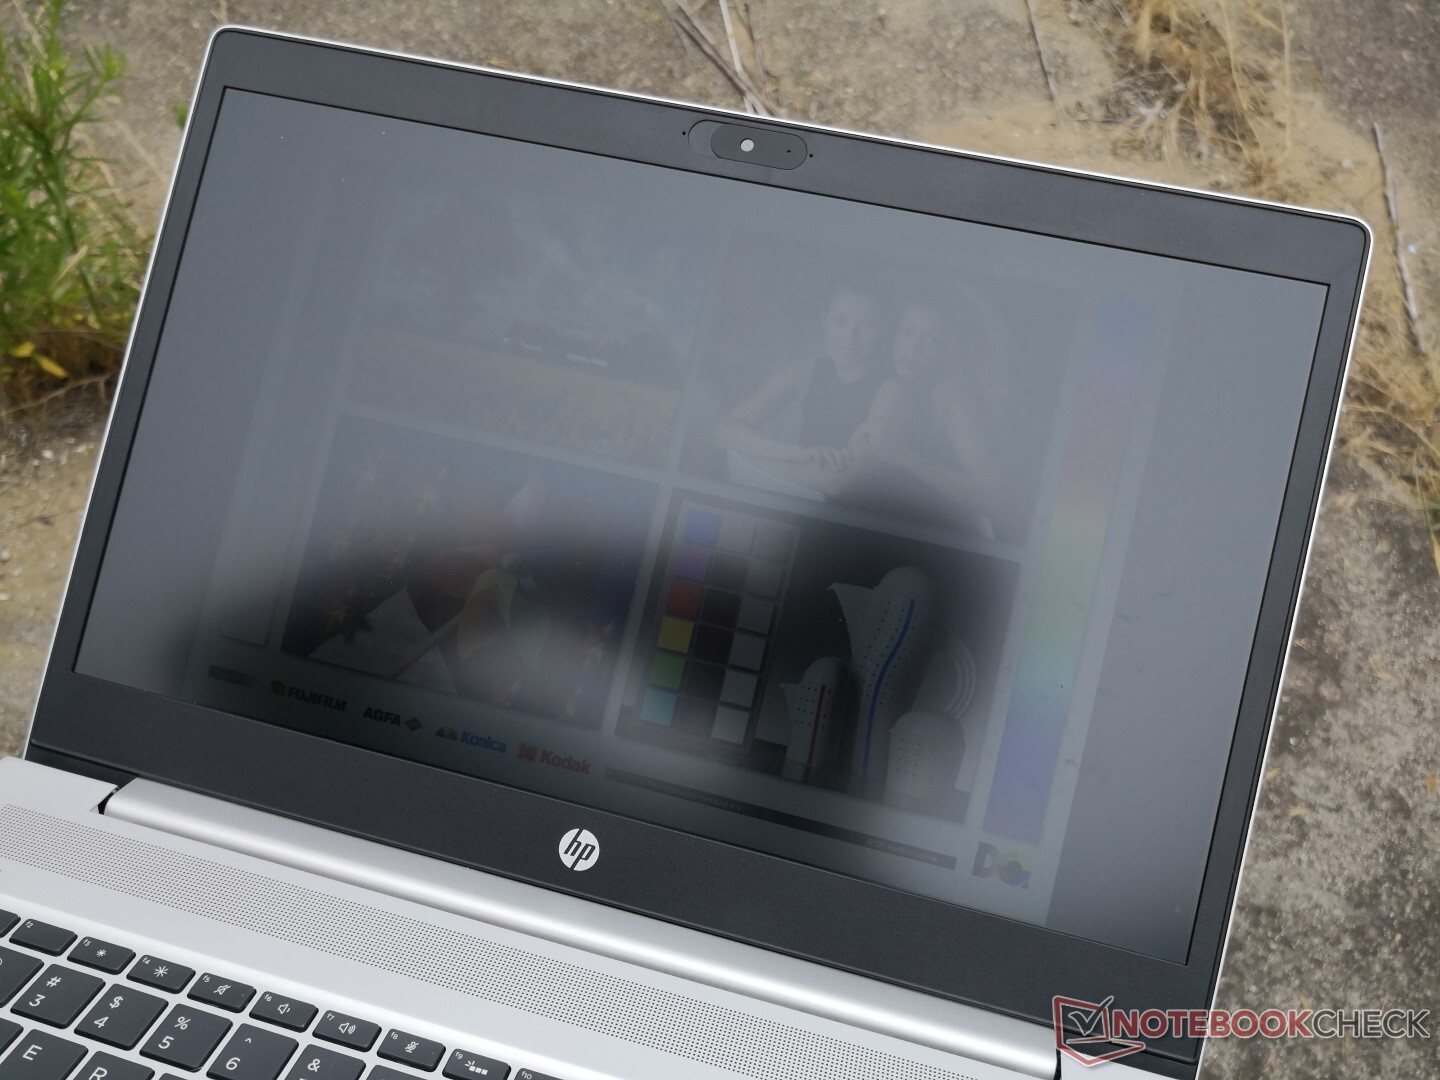
Arka ışığın düşük parlaklığı nedeniyle dış mekan görüşü zayıf. Aslında, Intel Command Center ayarları ne olursa olsun pil gücüyle çalışırken maksimum parlaklık 259,8 nit'ten 224,3 nit'e düşer. Bu dizüstü bilgisayarı açık havada sık sık kullanmayı planlıyorsanız 1000 nit panel seçeneğiyle yapılandırın.
Verim
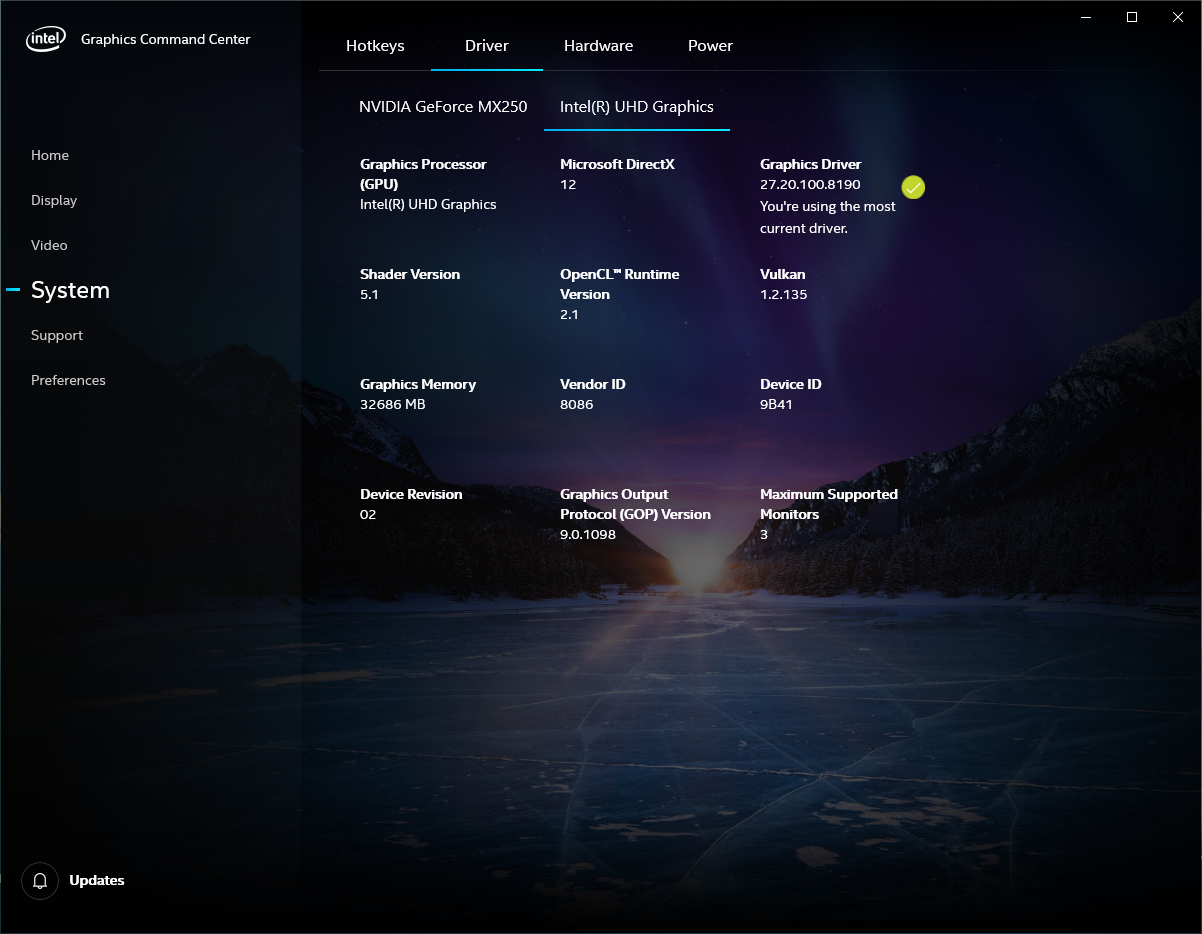
CPU seçenekleri, Core i3-10110U'dan vPro destekli Core i7-10610U'ya kadar uzanırken, GPU seçenekleri, entegre UHD Graphics 620'den GeForce MX130 veya MX250'ye kadar uzanır. Bunlar, Lenovo ThinkPad X1 Extreme gibi yüksek performanslı alternatiflerdeki Core-H veya GeForce GTX seçeneklerinin aksine çoğu Ultrabook'ta bulunan yaygın işlemcilerdir.Nvidia Optimus, bir GeForce GPU ile yapılandırılmışsa grafik anahtarlama için standart olarak gelir.
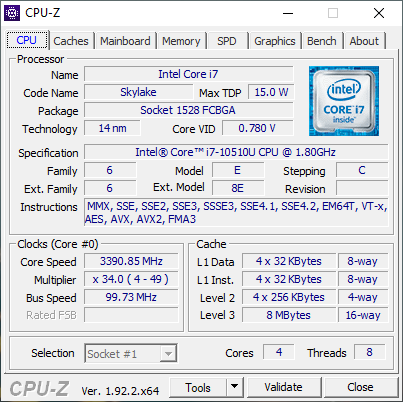
İşlemci
Veritabanımızdaki ortalama Core i7-10510U'dan yüzde 30 daha yavaş CPU performansı hayal kırıklığı yaratıyor. Daha da kötüsü, ProBook 455 G7'deki rakip Ryzen 7 4700U, her iki sistemdeki herhangi bir kısma ayarlandıktan sonra bile iki katın üzerinde ham işlemci performansı sunabiliyor. ProBook 450 G7'deki Core i7-10510U, bunun yerine daha ucuz bir Core i5 gibi çalışıyor. Bu testlerden önce test ünitemizi Yüksek Performans moduna ayarladığımızdan emin olduk, ancak sonuçlar iyileşmedi.
Cinebench R15: CPU Multi 64Bit | CPU Single 64Bit
Blender: v2.79 BMW27 CPU
7-Zip 18.03: 7z b 4 -mmt1 | 7z b 4
Geekbench 5.5: Single-Core | Multi-Core
HWBOT x265 Benchmark v2.2: 4k Preset
LibreOffice : 20 Documents To PDF
R Benchmark 2.5: Overall mean
| Cinebench R20 / CPU (Multi Core) | |
| HP ProBook 455 G7-175W8EA | |
| MSI Prestige 15 A10SC | |
| Microsoft Surface Laptop 3 15 i7-1065G7 | |
| Lenovo ThinkBook 15 | |
| Ortalama Intel Core i7-10510U (1015 - 1897, n=38) | |
| Lenovo ThinkPad L590-20Q70019GE | |
| Lenovo ThinkPad E590-20NB0012GE | |
| HP ProBook 450 G7 8WC04UT | |
| LG Gram 15Z90N | |
| Lenovo IdeaPad 3 14IIL05 | |
| HP 17-by2437ng | |
| Cinebench R20 / CPU (Single Core) | |
| HP ProBook 455 G7-175W8EA | |
| MSI Prestige 15 A10SC | |
| Microsoft Surface Laptop 3 15 i7-1065G7 | |
| Ortalama Intel Core i7-10510U (362 - 497, n=37) | |
| Lenovo ThinkPad E590-20NB0012GE | |
| Lenovo ThinkBook 15 | |
| Lenovo ThinkPad L590-20Q70019GE | |
| HP 17-by2437ng | |
| HP ProBook 450 G7 8WC04UT | |
| LG Gram 15Z90N | |
| Lenovo IdeaPad 3 14IIL05 | |
| Cinebench R15 / CPU Multi 64Bit | |
| MSI Prestige 15 A10SC | |
| HP ProBook 455 G7-175W8EA | |
| Microsoft Surface Laptop 3 15 i7-1065G7 | |
| Lenovo ThinkBook 15 | |
| Ortalama Intel Core i7-10510U (482 - 856, n=45) | |
| LG Gram 15Z90N | |
| Lenovo ThinkPad E590-20NB0012GE | |
| Lenovo ThinkPad L590-20Q70019GE | |
| HP ProBook 450 G7 8WC04UT | |
| Lenovo IdeaPad 3 14IIL05 | |
| HP 17-by2437ng | |
| Cinebench R15 / CPU Single 64Bit | |
| MSI Prestige 15 A10SC | |
| Microsoft Surface Laptop 3 15 i7-1065G7 | |
| Lenovo ThinkPad E590-20NB0012GE | |
| HP ProBook 455 G7-175W8EA | |
| Ortalama Intel Core i7-10510U (113 - 202, n=42) | |
| Lenovo ThinkBook 15 | |
| Lenovo ThinkPad L590-20Q70019GE | |
| HP 17-by2437ng | |
| Lenovo IdeaPad 3 14IIL05 | |
| LG Gram 15Z90N | |
| HP ProBook 450 G7 8WC04UT | |
| Blender / v2.79 BMW27 CPU | |
| HP 17-by2437ng | |
| Lenovo IdeaPad 3 14IIL05 | |
| LG Gram 15Z90N | |
| HP ProBook 450 G7 8WC04UT | |
| Lenovo ThinkPad L590-20Q70019GE | |
| Lenovo ThinkPad E590-20NB0012GE | |
| Ortalama Intel Core i7-10510U (628 - 1051, n=31) | |
| Lenovo ThinkBook 15 | |
| HP ProBook 455 G7-175W8EA | |
| 7-Zip 18.03 / 7z b 4 -mmt1 | |
| Lenovo ThinkPad E590-20NB0012GE | |
| Ortalama Intel Core i7-10510U (3747 - 4981, n=31) | |
| HP 17-by2437ng | |
| HP ProBook 455 G7-175W8EA | |
| Lenovo ThinkBook 15 | |
| LG Gram 15Z90N | |
| Lenovo IdeaPad 3 14IIL05 | |
| HP ProBook 450 G7 8WC04UT | |
| Lenovo ThinkPad L590-20Q70019GE | |
| 7-Zip 18.03 / 7z b 4 | |
| HP ProBook 455 G7-175W8EA | |
| Lenovo ThinkBook 15 | |
| Ortalama Intel Core i7-10510U (12196 - 21298, n=31) | |
| Lenovo ThinkPad E590-20NB0012GE | |
| Lenovo ThinkPad L590-20Q70019GE | |
| LG Gram 15Z90N | |
| HP ProBook 450 G7 8WC04UT | |
| Lenovo IdeaPad 3 14IIL05 | |
| HP 17-by2437ng | |
| Geekbench 5.5 / Single-Core | |
| HP ProBook 450 G7 8WC04UT | |
| Ortalama Intel Core i7-10510U (977 - 1287, n=31) | |
| LG Gram 15Z90N | |
| Lenovo IdeaPad 3 14IIL05 | |
| HP ProBook 455 G7-175W8EA | |
| HP 17-by2437ng | |
| Geekbench 5.5 / Multi-Core | |
| HP ProBook 455 G7-175W8EA | |
| Ortalama Intel Core i7-10510U (2474 - 4484, n=31) | |
| HP ProBook 450 G7 8WC04UT | |
| LG Gram 15Z90N | |
| Lenovo IdeaPad 3 14IIL05 | |
| HP 17-by2437ng | |
| HWBOT x265 Benchmark v2.2 / 4k Preset | |
| HP ProBook 455 G7-175W8EA | |
| Lenovo ThinkBook 15 | |
| Ortalama Intel Core i7-10510U (3.41 - 6.04, n=31) | |
| Lenovo ThinkPad E590-20NB0012GE | |
| Lenovo ThinkPad L590-20Q70019GE | |
| Lenovo IdeaPad 3 14IIL05 | |
| HP ProBook 450 G7 8WC04UT | |
| HP 17-by2437ng | |
| LibreOffice / 20 Documents To PDF | |
| HP ProBook 455 G7-175W8EA | |
| HP ProBook 450 G7 8WC04UT | |
| HP 17-by2437ng | |
| Ortalama Intel Core i7-10510U (50.7 - 77.8, n=27) | |
| Lenovo IdeaPad 3 14IIL05 | |
| LG Gram 15Z90N | |
| R Benchmark 2.5 / Overall mean | |
| LG Gram 15Z90N | |
| Lenovo IdeaPad 3 14IIL05 | |
| HP ProBook 450 G7 8WC04UT | |
| HP 17-by2437ng | |
| Ortalama Intel Core i7-10510U (0.637 - 0.81, n=28) | |
| HP ProBook 455 G7-175W8EA | |
* ... daha küçük daha iyidir
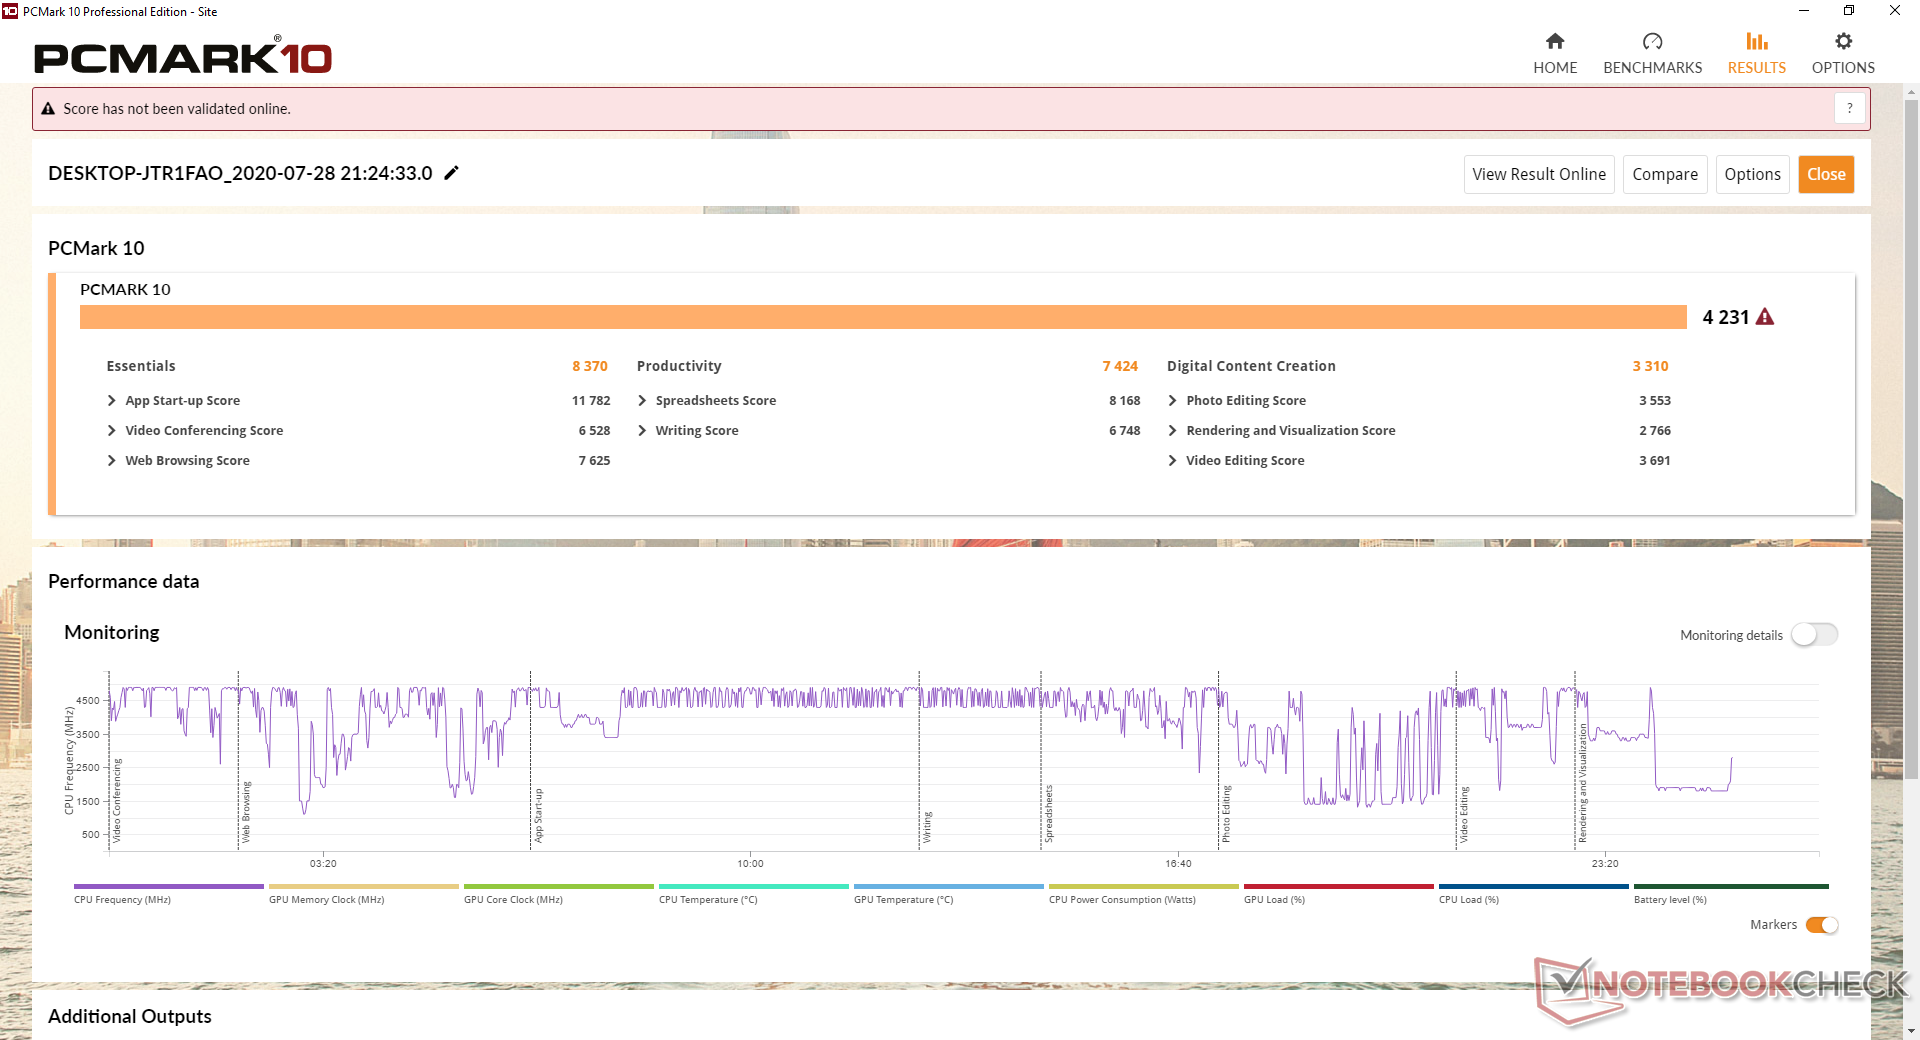
Sistem performansı
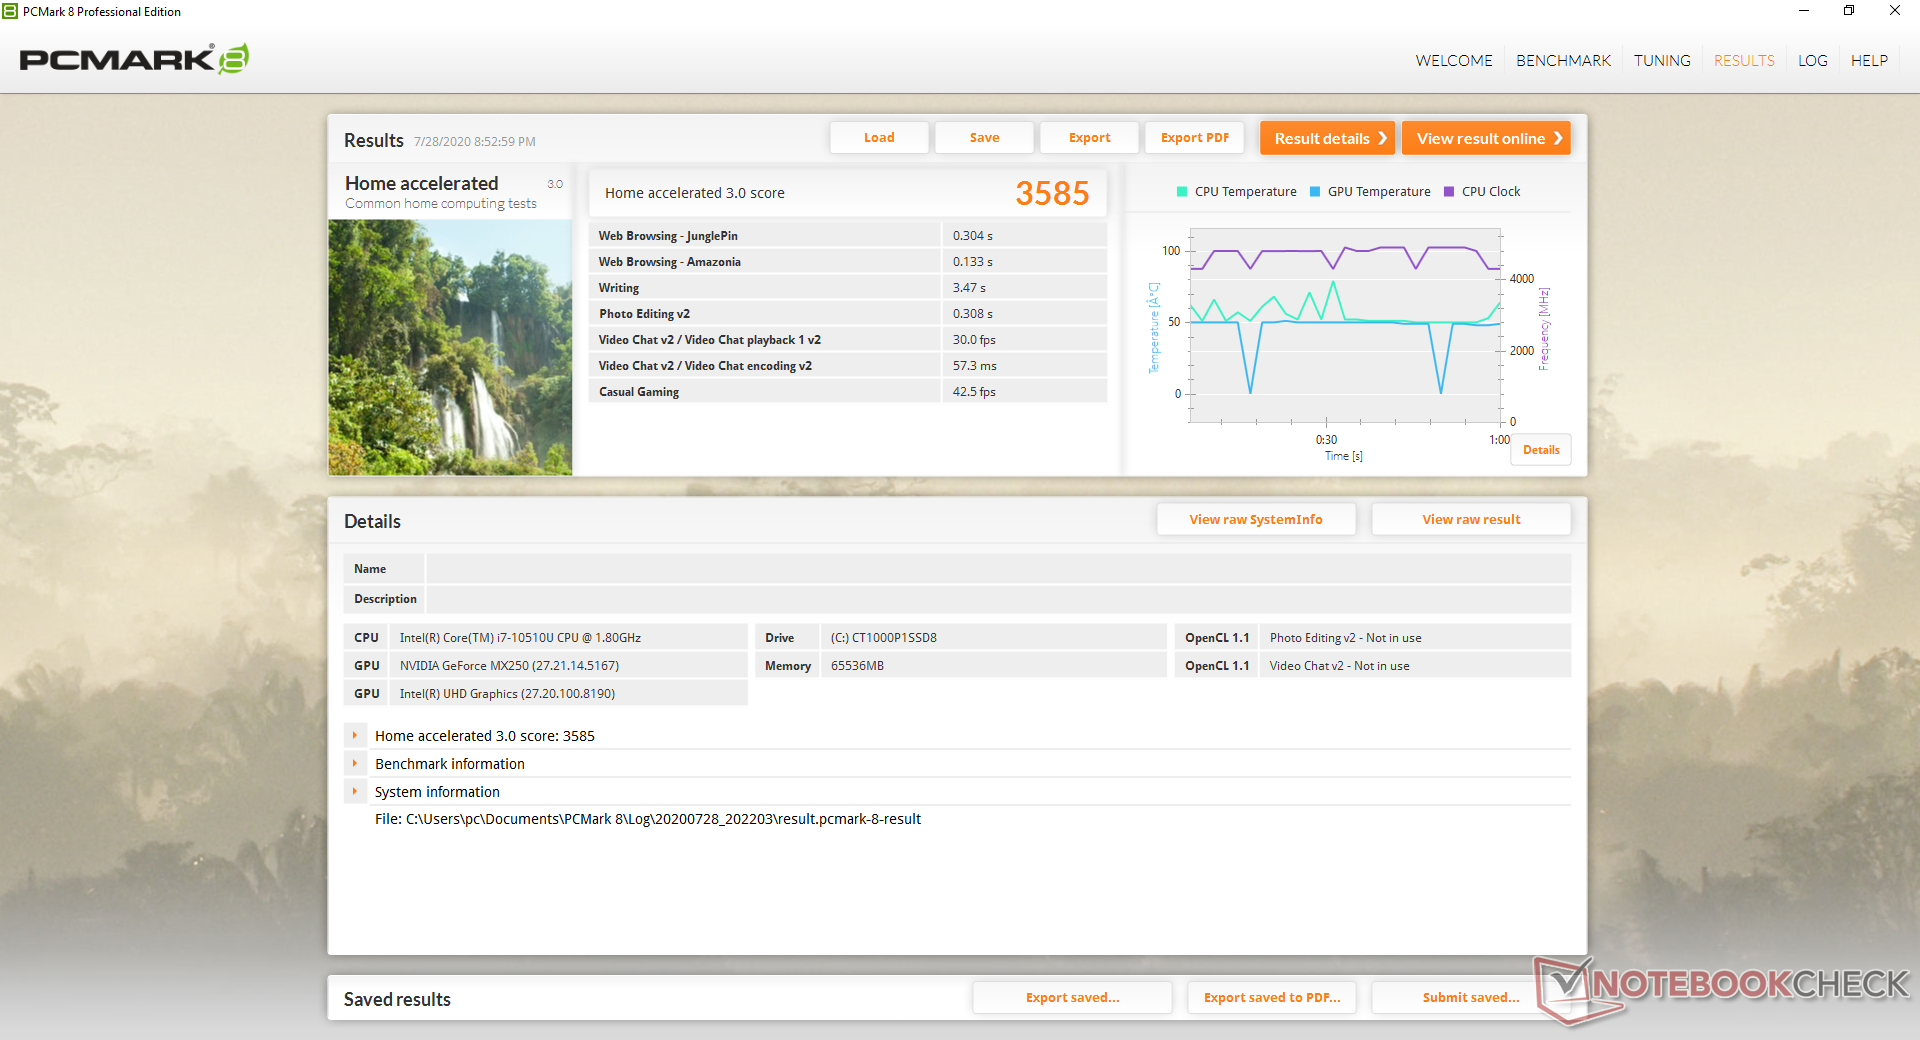
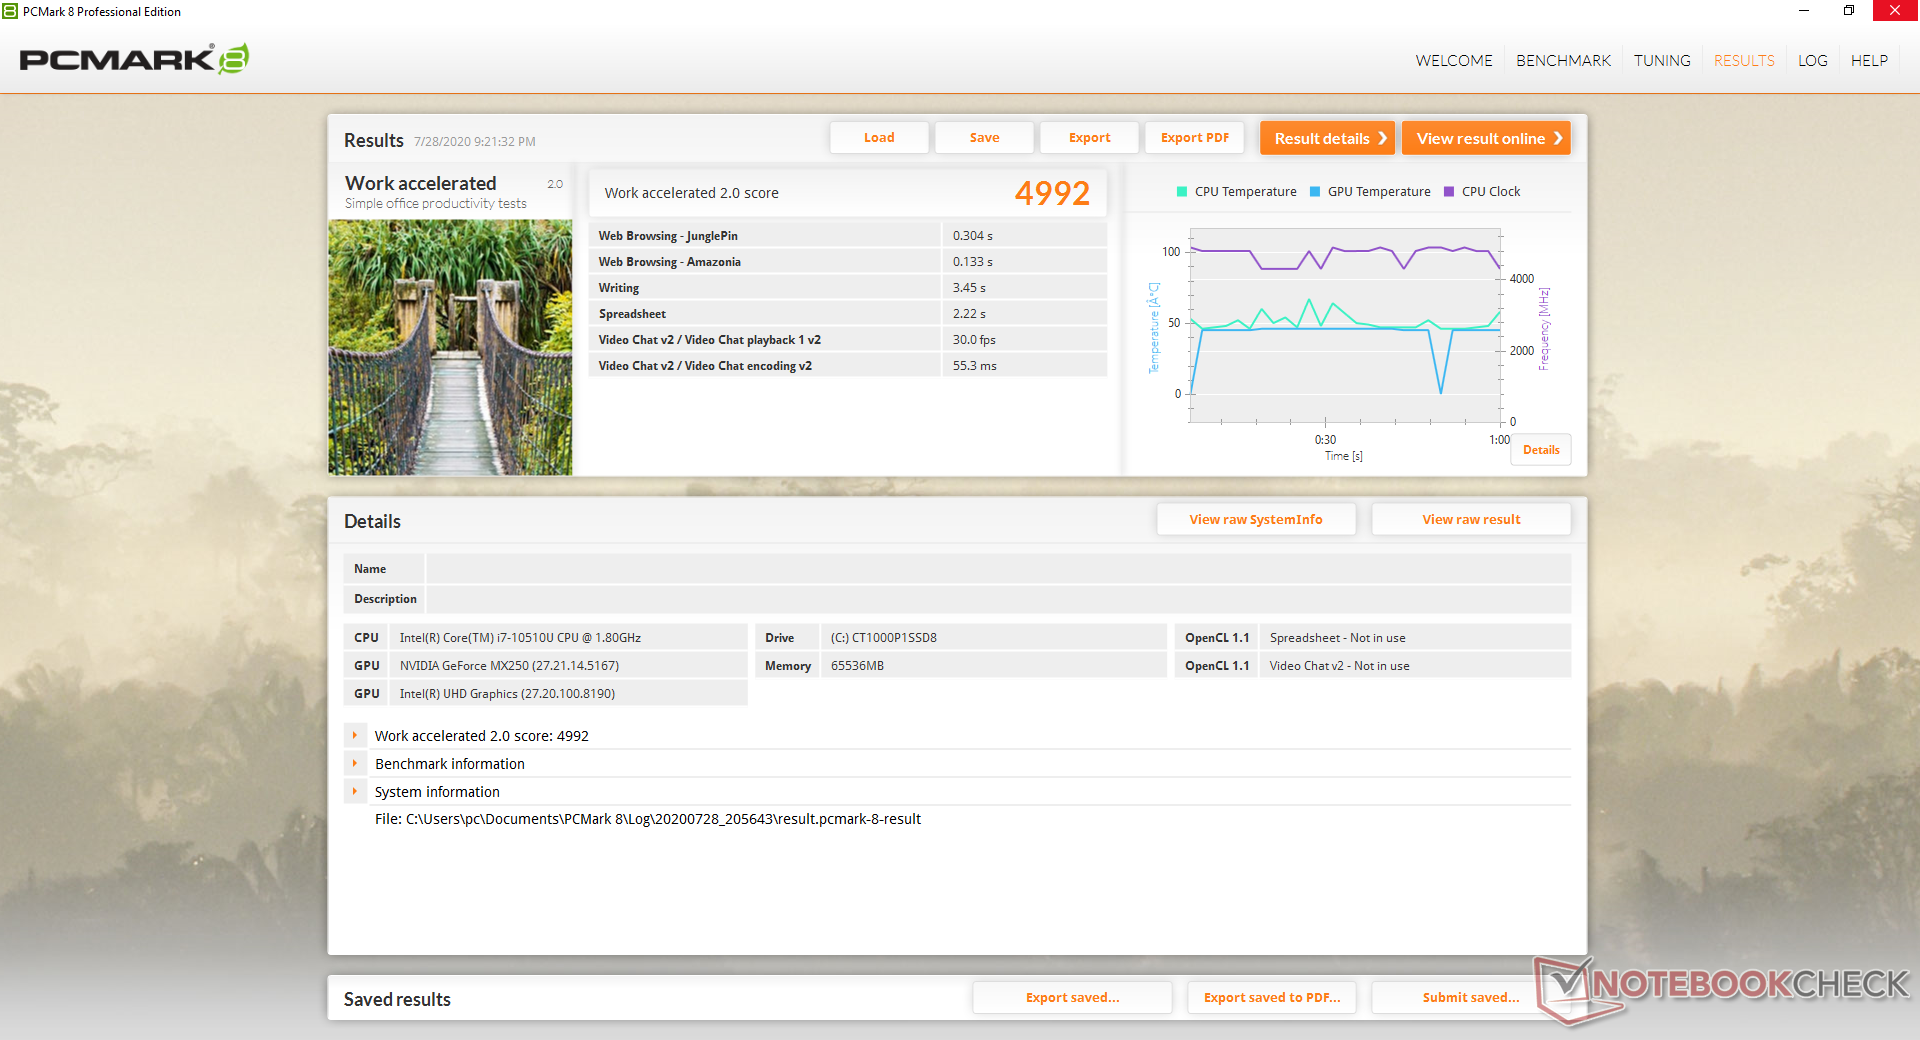
PCMark sonuçları, yukarıda belirtilen daha yavaş CPU performansına rağmen, aynı CPU ve GPU'ya sahip diğer dizüstü bilgisayarlara göre olmalarını beklediğimiz yerdir. ProBook 445 G7, Intel birimimizi Dijital İçerik Oluşturma konusunda geride bırakabilir çünkü PCMark, GeForce destekli ProBook'umuz gibi ayrı GPU'lara sahip sistemler söz konusu olduğunda her zaman güvenilmez olmuştur.
| PCMark 10 | |
| Score | |
| MSI Modern 15 A10RB | |
| HP ProBook 455 G7-175W8EA | |
| Ortalama Intel Core i7-10510U, NVIDIA GeForce MX250 (3861 - 5409, n=11) | |
| HP ProBook 450 G7 8WC04UT | |
| Dynabook Tecra X50-F | |
| Dell Latitude 15 3590 | |
| Lenovo ThinkPad L590-20Q70019GE | |
| Essentials | |
| MSI Modern 15 A10RB | |
| Ortalama Intel Core i7-10510U, NVIDIA GeForce MX250 (8021 - 9764, n=11) | |
| HP ProBook 450 G7 8WC04UT | |
| Dynabook Tecra X50-F | |
| HP ProBook 455 G7-175W8EA | |
| Dell Latitude 15 3590 | |
| Lenovo ThinkPad L590-20Q70019GE | |
| Productivity | |
| MSI Modern 15 A10RB | |
| HP ProBook 450 G7 8WC04UT | |
| Ortalama Intel Core i7-10510U, NVIDIA GeForce MX250 (6625 - 7972, n=11) | |
| HP ProBook 455 G7-175W8EA | |
| Dynabook Tecra X50-F | |
| Dell Latitude 15 3590 | |
| Lenovo ThinkPad L590-20Q70019GE | |
| Digital Content Creation | |
| MSI Modern 15 A10RB | |
| HP ProBook 455 G7-175W8EA | |
| HP ProBook 450 G7 8WC04UT | |
| Ortalama Intel Core i7-10510U, NVIDIA GeForce MX250 (2621 - 5547, n=11) | |
| Dynabook Tecra X50-F | |
| Dell Latitude 15 3590 | |
| Lenovo ThinkPad L590-20Q70019GE | |
| PCMark 8 | |
| Home Score Accelerated v2 | |
| HP ProBook 455 G7-175W8EA | |
| MSI Modern 15 A10RB | |
| Ortalama Intel Core i7-10510U, NVIDIA GeForce MX250 (3214 - 3958, n=8) | |
| HP ProBook 450 G7 8WC04UT | |
| Dell Latitude 15 3590 | |
| Lenovo ThinkPad L590-20Q70019GE | |
| Work Score Accelerated v2 | |
| MSI Modern 15 A10RB | |
| HP ProBook 455 G7-175W8EA | |
| Ortalama Intel Core i7-10510U, NVIDIA GeForce MX250 (4599 - 5443, n=8) | |
| HP ProBook 450 G7 8WC04UT | |
| Dell Latitude 15 3590 | |
| Lenovo ThinkPad L590-20Q70019GE | |
| PCMark 8 Home Score Accelerated v2 | 3585 puan | |
| PCMark 8 Work Score Accelerated v2 | 4992 puan | |
| PCMark 10 Score | 4231 puan | |
Yardım | ||
DPC Gecikmesi
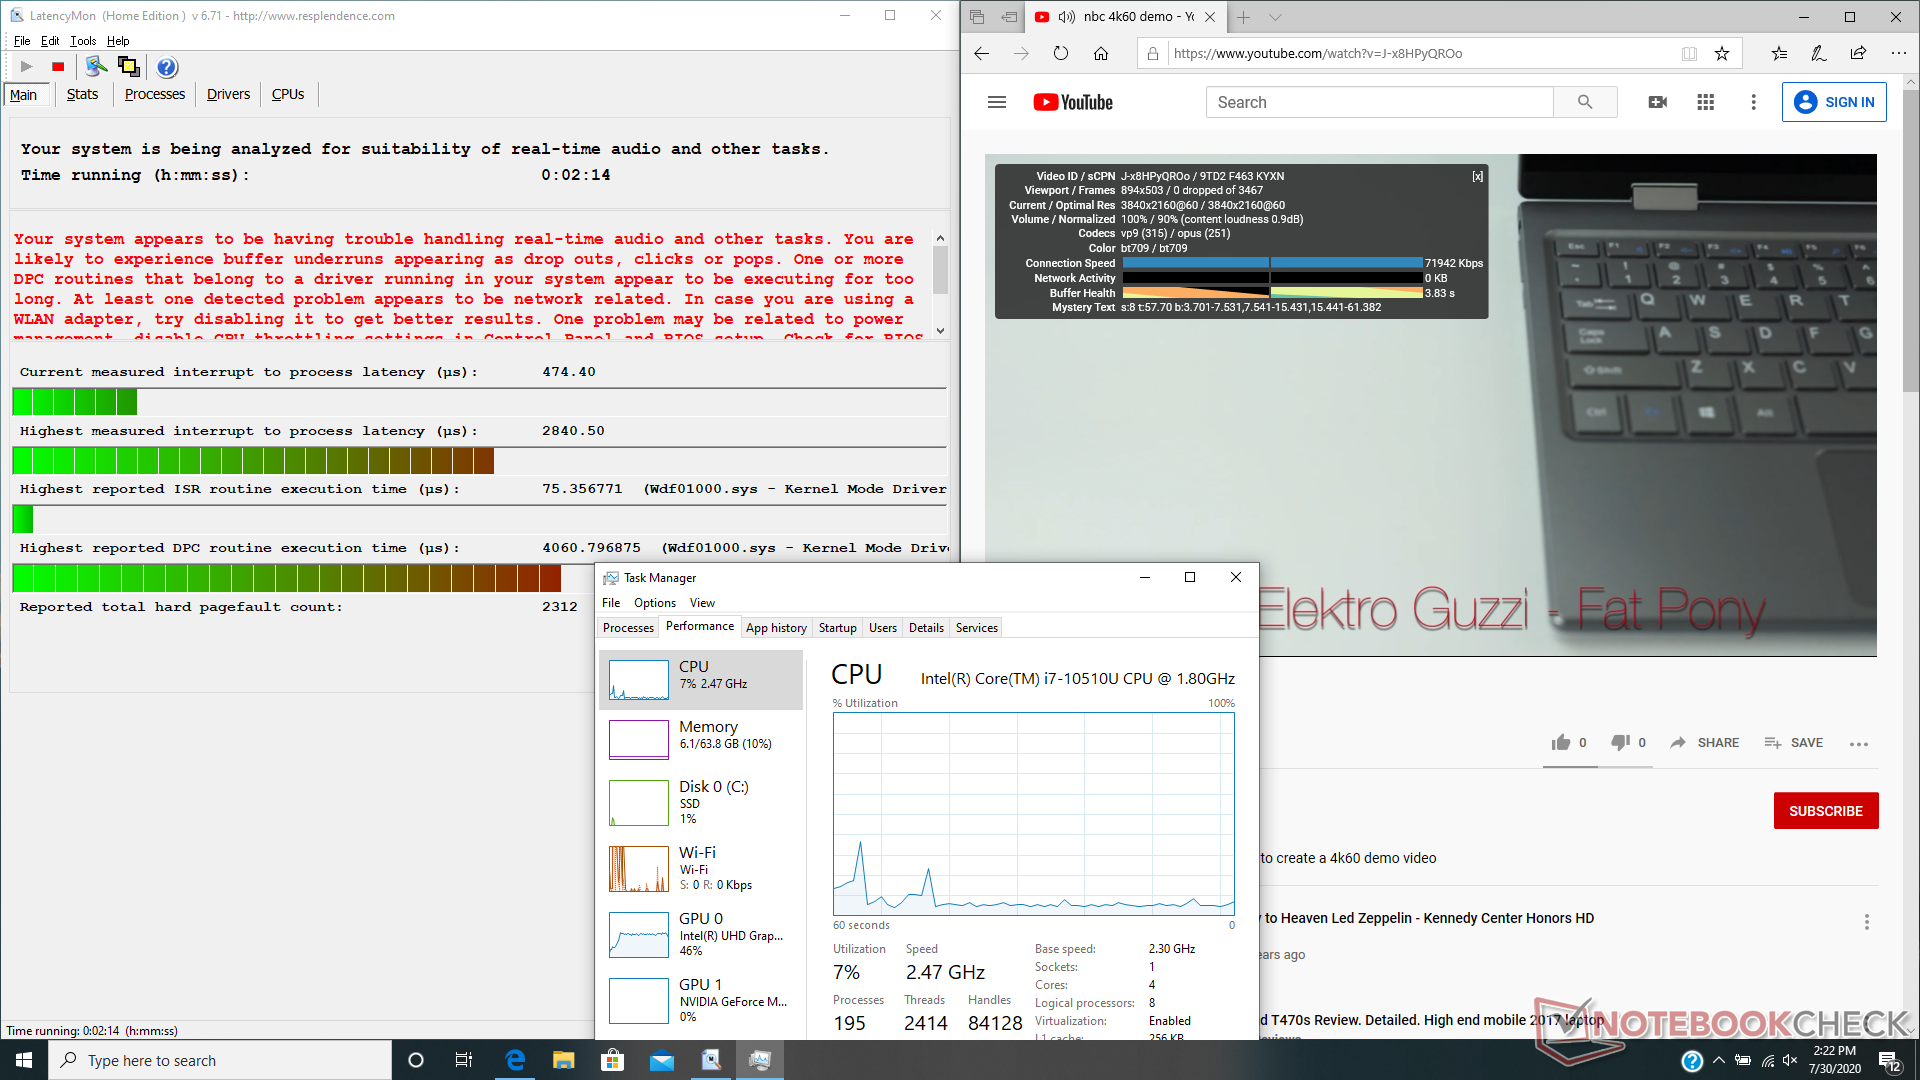
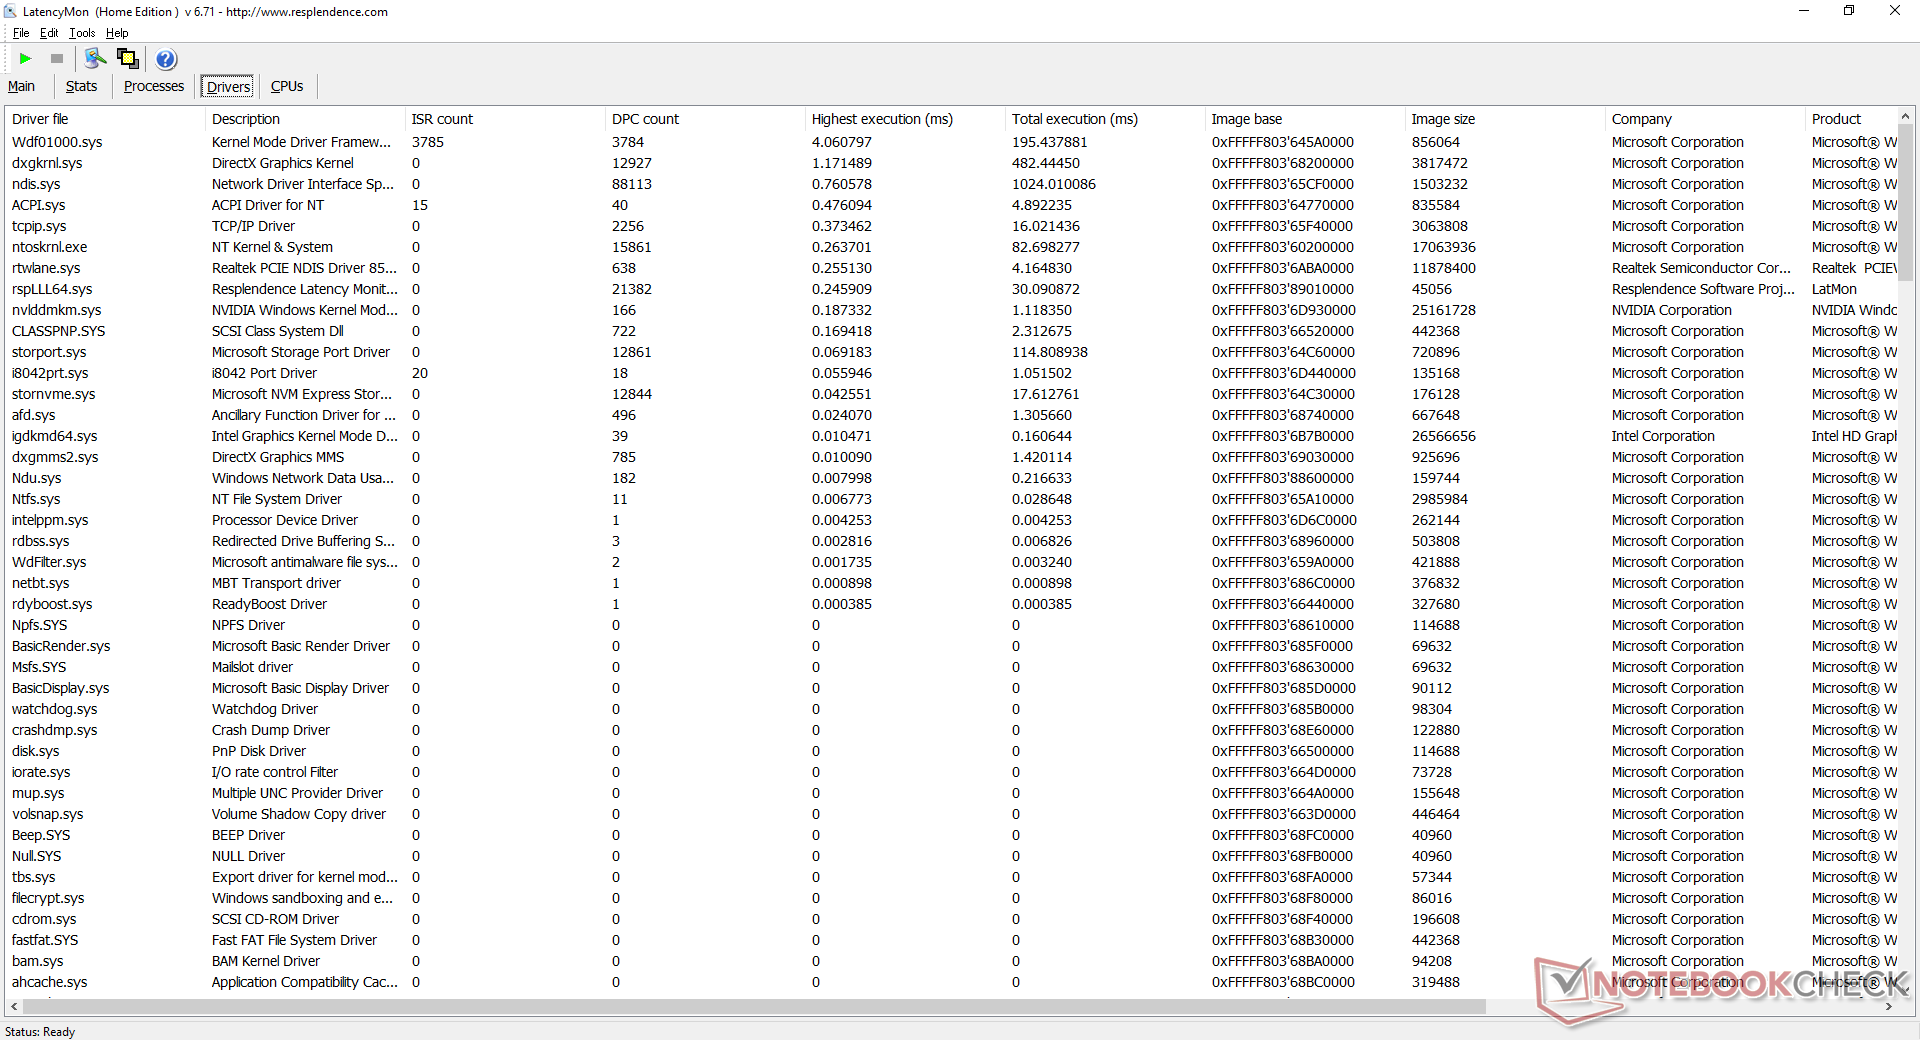
LatencyMon, Wdf01000.sys ile ilgili DPC gecikme sorunlarını gösterir. YouTube'da 4K UHD oynatma başka şekilde akıcıdır ve test sırasında kare atlamaz.
| DPC Latencies / LatencyMon - interrupt to process latency (max), Web, Youtube, Prime95 | |
| LG Gram 15Z90N | |
| HP Envy x360 15-dr1679cl | |
| HP ProBook 450 G7 8WC04UT | |
| HP 17-by2437ng | |
| Asus VivoBook 17 S712FA-DS76 | |
| HP ProBook 455 G7-175W8EA | |
| Lenovo IdeaPad 3 14IIL05 | |
* ... daha küçük daha iyidir
Depolama aygıtları
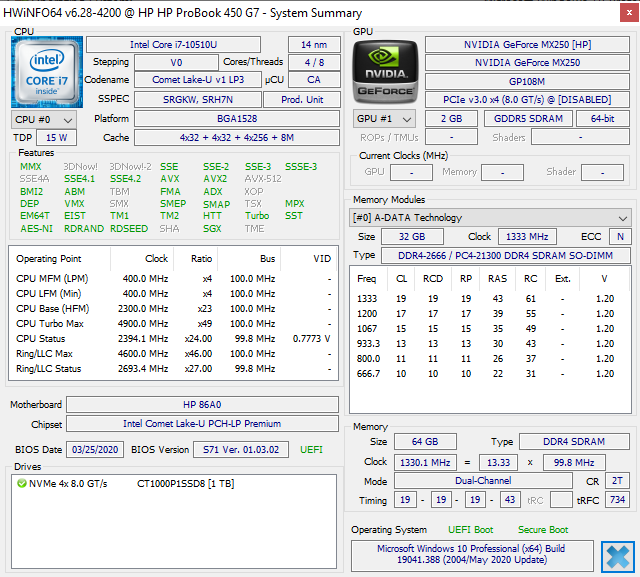
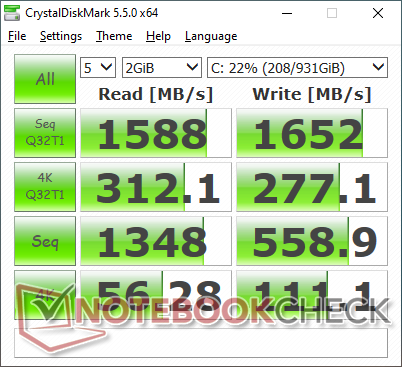
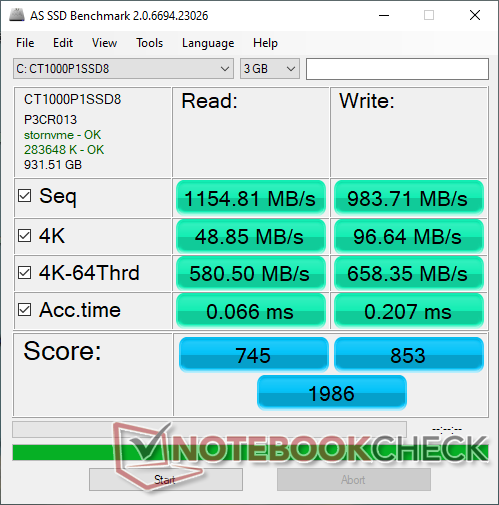
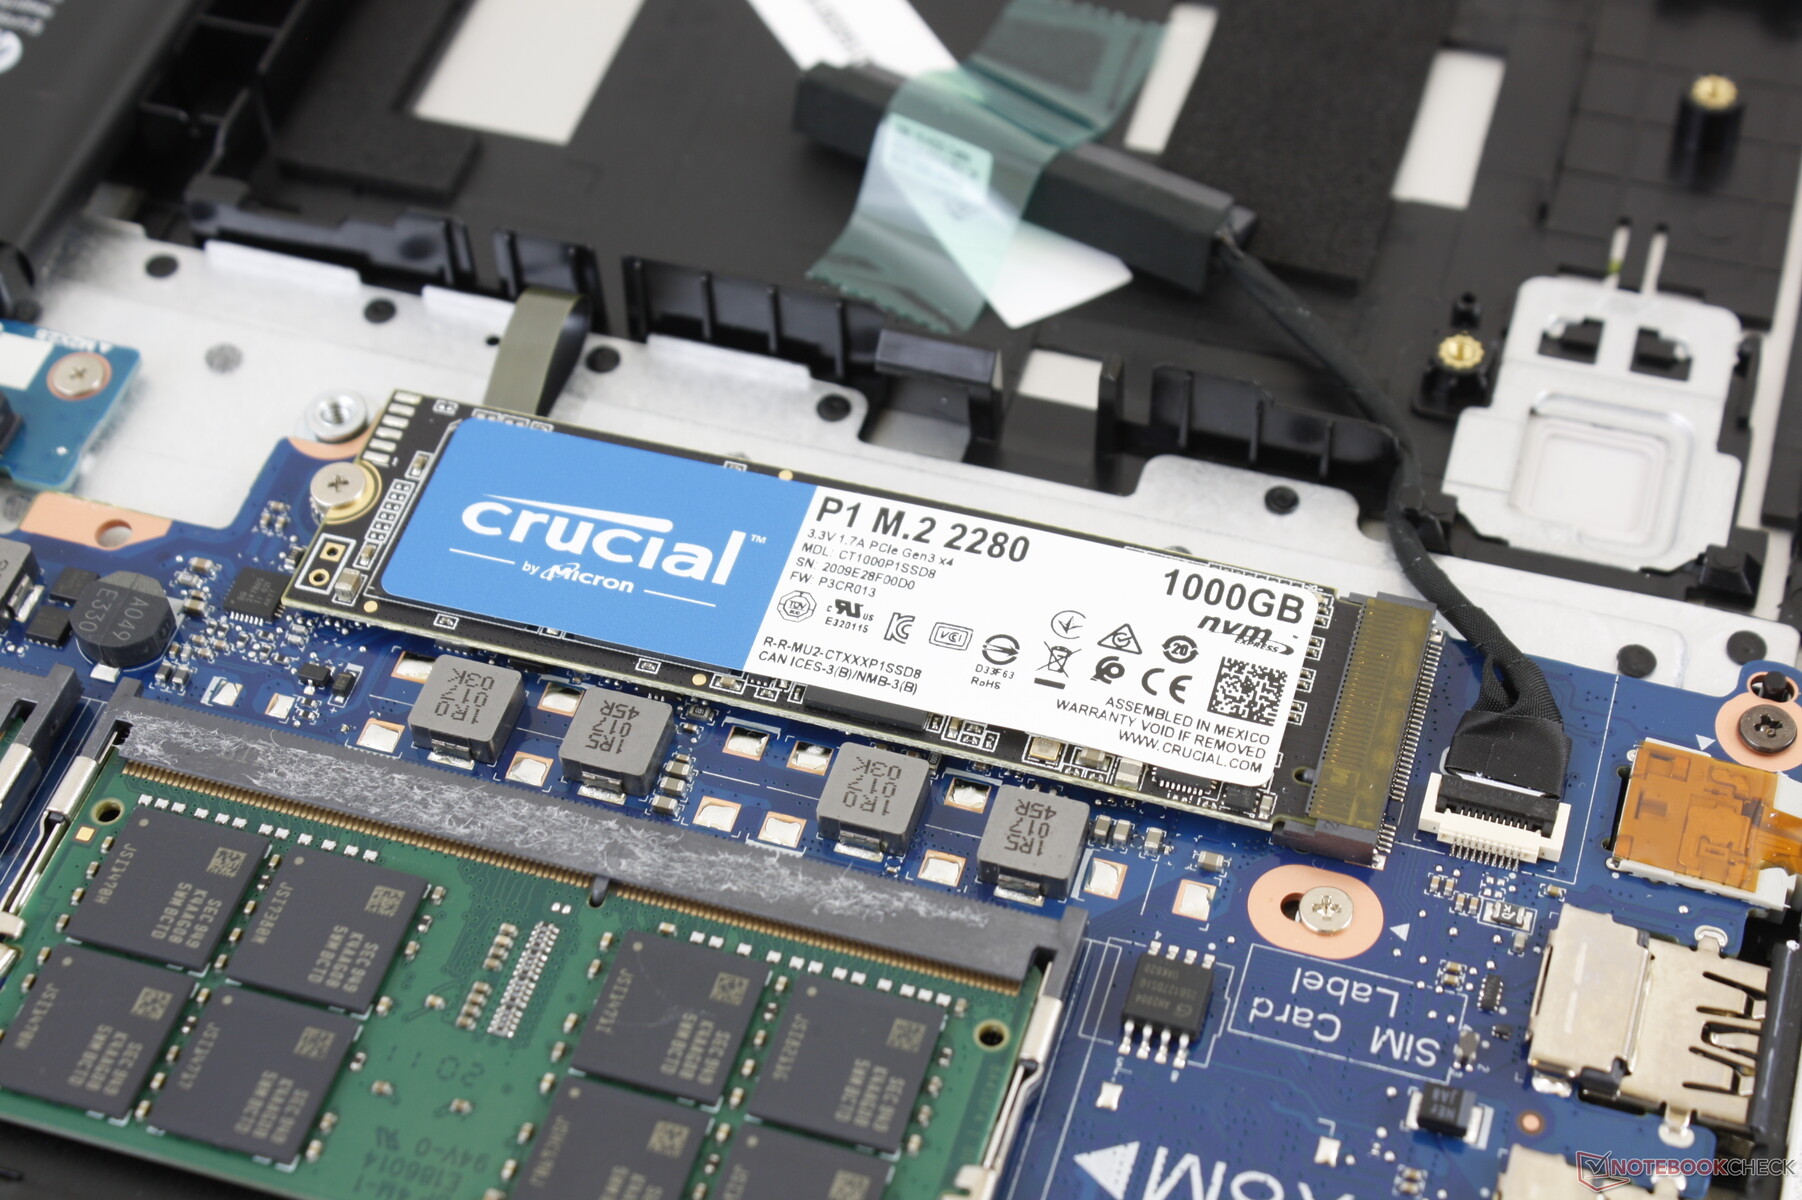
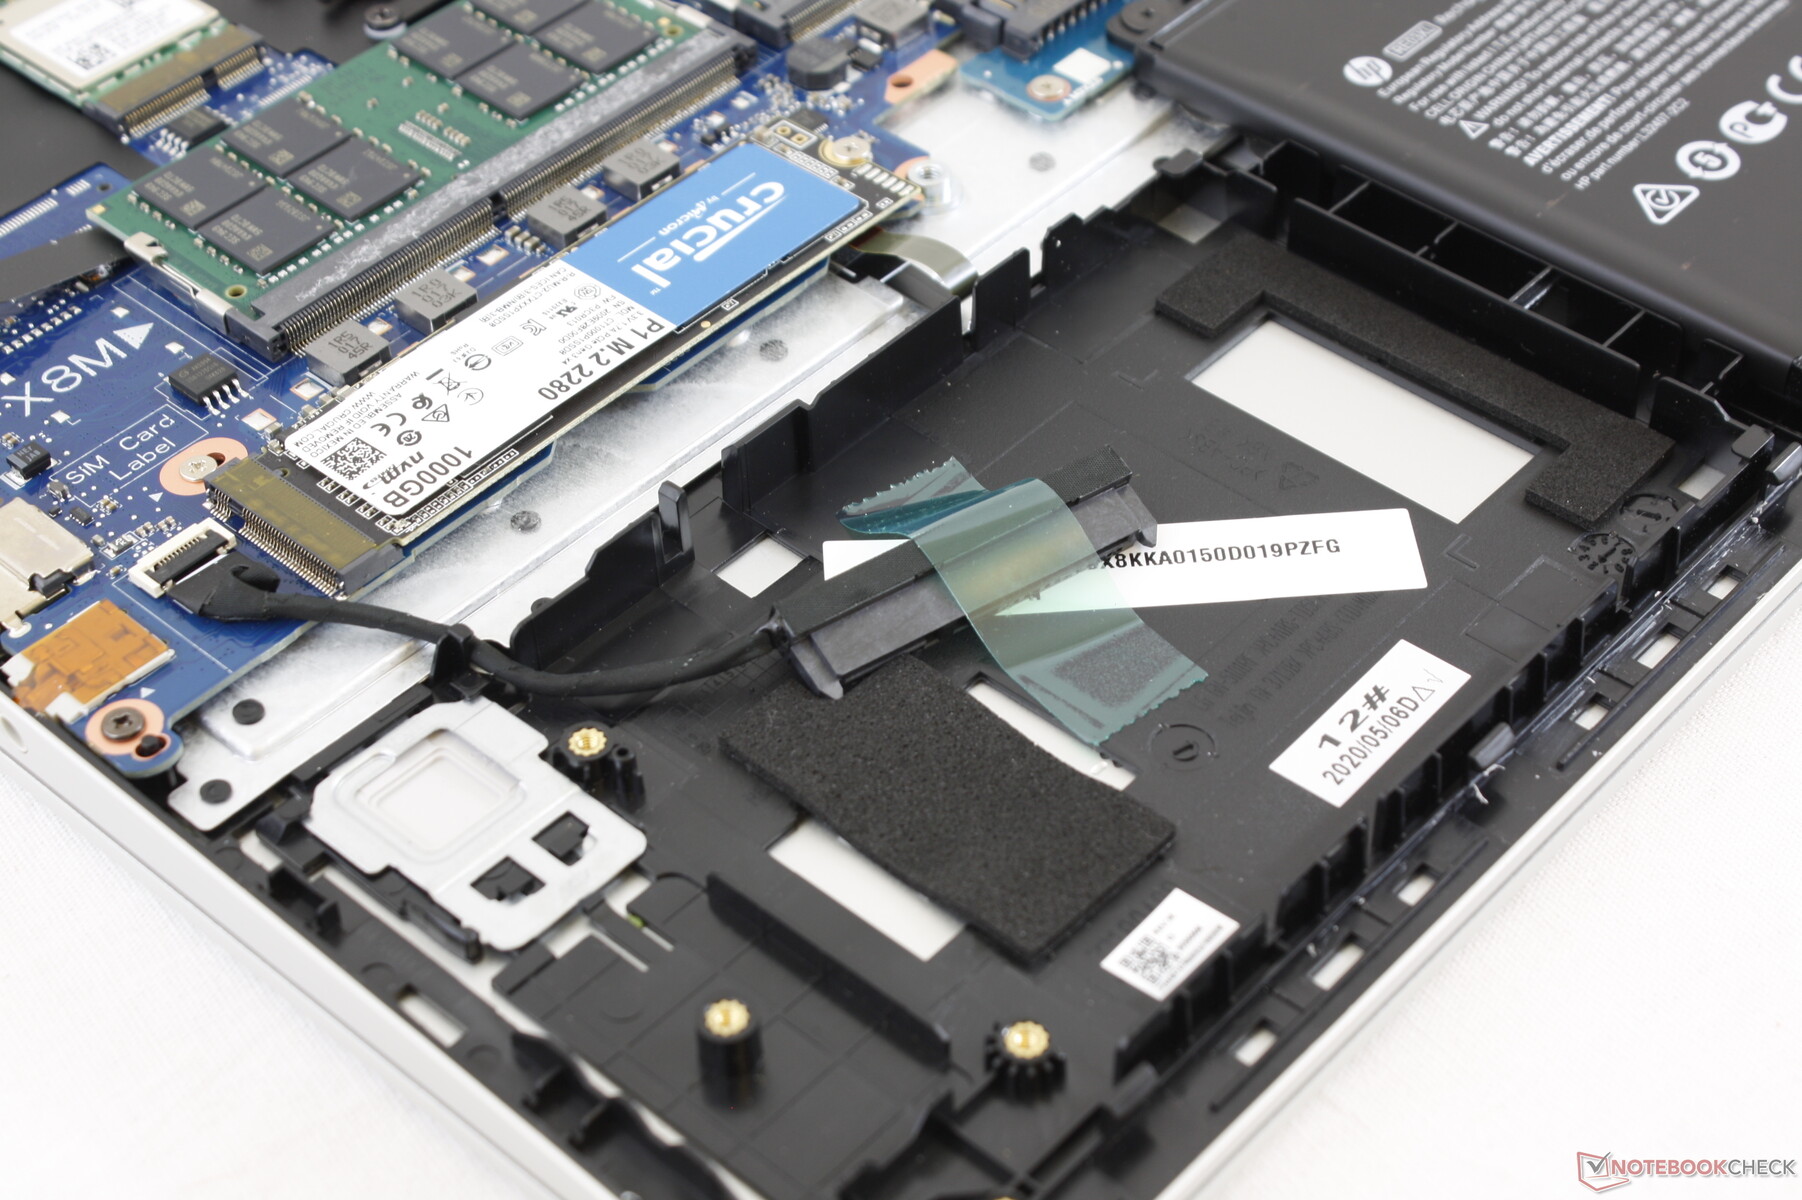
CUKUSA, dizüstü bilgisayarlarının çoğunu sırasıyla 2000 MB / sn ve 1700 MB / sn'ye varan teorik sıralı okuma ve yazma hızlarına sahip orta sınıf bir PCIe x4 NVMe sürücüsü olan 1 TB Crucial P1 CT1000P1SSD8 SSD ile donatmayı seviyor. Buna rağmen, aktarım hızları, optik koşullar altında bile ProBook'umuzda yaklaşık 1400 ila 1600 MB / sn'dir.
| HP ProBook 450 G7 8WC04UT Crucial P1 SSD CT1000P1SSD8 | HP ProBook 455 G7-175W8EA Samsung PM991 MZVLQ512HALU | MSI Modern 15 A10RB WDC PC SN730 SDBPNTY-512G | Dell Latitude 15 3590 Samsung SSD PM871b MZ7LN256HAJQ | Lenovo ThinkPad L590-20Q70019GE Toshiba XG6 KXG6AZNV512G | Dynabook Tecra X50-F Samsung SSD PM981 MZVLB512HAJQ | |
|---|---|---|---|---|---|---|
| AS SSD | 19% | 113% | -29% | 67% | 31% | |
| Seq Read (MB/s) | 1155 | 1929 67% | 2084 80% | 498.7 -57% | 1383 20% | 1461 26% |
| Seq Write (MB/s) | 984 | 1199 22% | 2442 148% | 361.7 -63% | 852 -13% | 1039 6% |
| 4K Read (MB/s) | 48.85 | 43.9 -10% | 47.52 -3% | 34.65 -29% | 45.72 -6% | 45.98 -6% |
| 4K Write (MB/s) | 96.6 | 116.2 20% | 135.8 41% | 79.8 -17% | 120.2 24% | 125.5 30% |
| 4K-64 Read (MB/s) | 581 | 897 54% | 1043 80% | 372.5 -36% | 1344 131% | 560 -4% |
| 4K-64 Write (MB/s) | 658 | 801 22% | 955 45% | 247.7 -62% | 926 41% | 1162 77% |
| Access Time Read * (ms) | 0.066 | 0.069 -5% | 0.062 6% | 0.06 9% | 0.063 5% | 0.045 32% |
| Access Time Write * (ms) | 0.207 | 0.033 84% | 0.076 63% | 0.042 80% | 0.036 83% | 0.032 85% |
| Score Read (Points) | 745 | 1134 52% | 1299 74% | 457 -39% | 1528 105% | 752 1% |
| Score Write (Points) | 853 | 1037 22% | 1335 57% | 364 -57% | 1132 33% | 1391 63% |
| Score Total (Points) | 1986 | 2723 37% | 3326 67% | 1060 -47% | 3420 72% | 2521 27% |
| Copy ISO MB/s (MB/s) | 2635 | 1409 -47% | 1926 -27% | 1147 -56% | ||
| Copy Program MB/s (MB/s) | 95.1 | 70.2 -26% | 714 651% | 419.8 341% | ||
| Copy Game MB/s (MB/s) | 361.9 | 254.9 -30% | 1425 294% | 928 156% | ||
| CrystalDiskMark 5.2 / 6 | 19% | 108% | -36% | 21% | 10% | |
| Write 4K (MB/s) | 111.1 | 141.9 28% | 208.4 88% | 79.5 -28% | 115.3 4% | 100.1 -10% |
| Read 4K (MB/s) | 56.3 | 37.25 -34% | 51 -9% | 32.72 -42% | 43.34 -23% | 42.4 -25% |
| Write Seq (MB/s) | 559 | 998 79% | 2687 381% | 472.5 -15% | 1014 81% | |
| Read Seq (MB/s) | 1348 | 1233 -9% | 2168 61% | 504 -63% | 1481 10% | |
| Write 4K Q32T1 (MB/s) | 277.1 | 338.4 22% | 489.2 77% | 322.6 16% | 495.4 79% | 245.9 -11% |
| Read 4K Q32T1 (MB/s) | 312.1 | 431.1 38% | 600 92% | 249.9 -20% | 332.6 7% | 230.3 -26% |
| Write Seq Q32T1 (MB/s) | 1652 | 1367 -17% | 2699 63% | 531 -68% | 1654 0% | 1910 16% |
| Read Seq Q32T1 (MB/s) | 1588 | 2355 48% | 3374 112% | 544 -66% | 1746 10% | 3454 118% |
| Write 4K Q8T8 (MB/s) | 877 | 1033 | ||||
| Read 4K Q8T8 (MB/s) | 518 | 892 | ||||
| Toplam Ortalama (Program / Ayarlar) | 19% /
19% | 111% /
111% | -33% /
-32% | 44% /
50% | 21% /
23% |
* ... daha küçük daha iyidir

Disk Throttling: DiskSpd Read Loop, Queue Depth 8
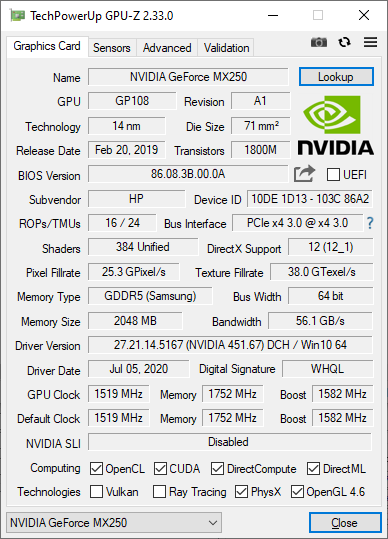
GPU Performansı
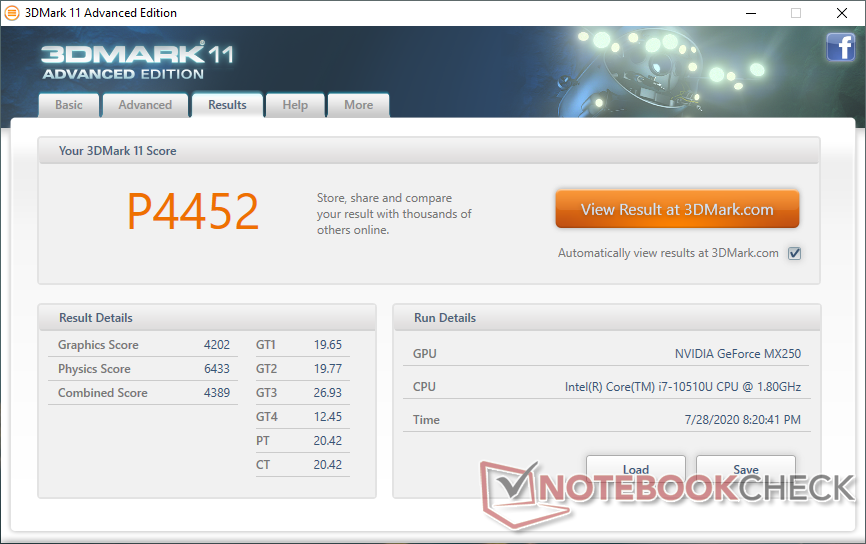
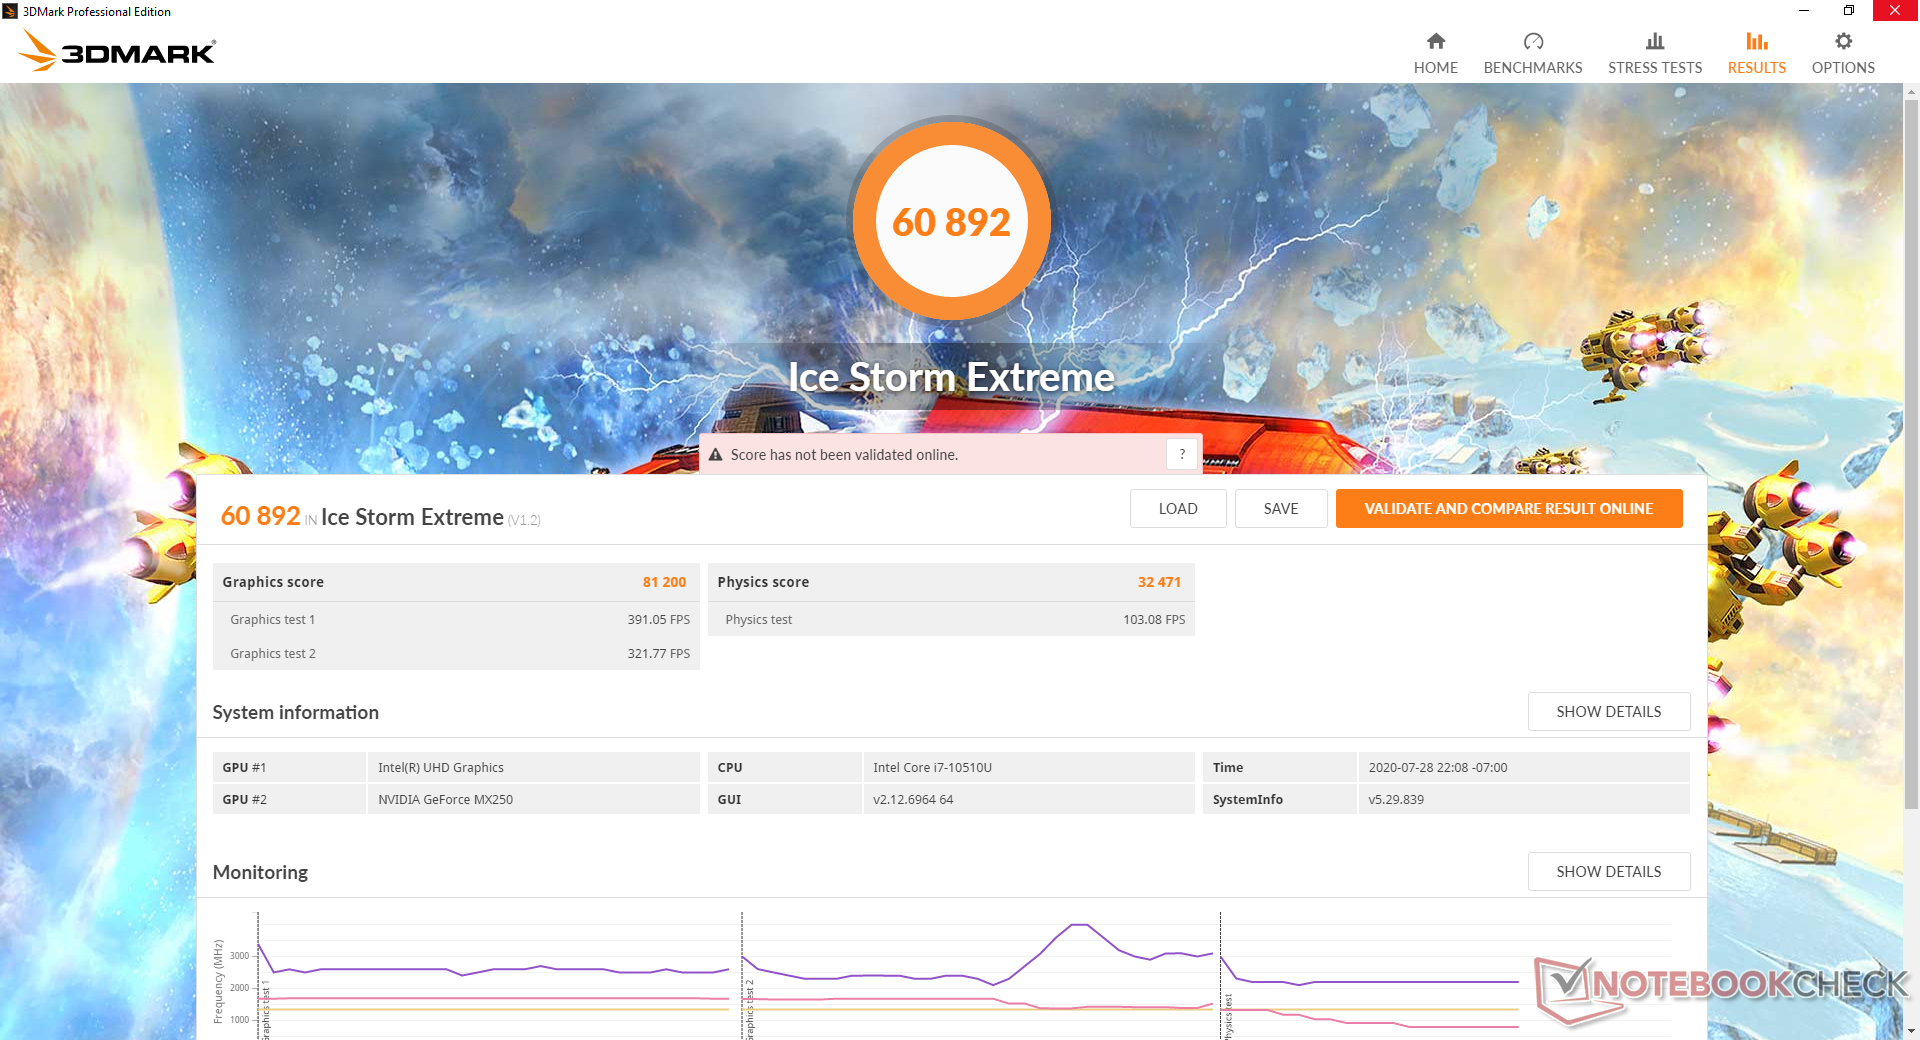
Ayrık Nvidia GPU, veritabanımızdaki ortalama GeForce MX250'ye göre olmasını beklediğimiz yerde performans gösteriyor. Performans, ProBook 445 G7'deki entegre Radeon RX Vega 7'den yaklaşık yüzde 40 ila 50, eskiyen tümleşik UHD Graphics 620'den en az iki ila üç kat daha hızlıdır. Ancak, ProBook 445 G7'mizin tek cihazda çalıştığını belirtmek gerekir. -kanallı RAM yalnızca, çift kanallı RAM ile yapılandırılmışsa, RX Vega 7'nin GeForce MX250'ye çok daha yakın performans gösterebileceği anlamına gelir.
| 3DMark 11 | |
| 1280x720 Performance GPU | |
| Lenovo ThinkPad E590-20NB0012GE | |
| MSI Modern 15 A10RB | |
| Lenovo ThinkPad T15 Gen1-20S7S02U00 | |
| Microsoft Surface Laptop 3 15 i7-1065G7 | |
| Ortalama NVIDIA GeForce MX250 (3585 - 4942, n=29) | |
| HP ProBook 450 G7 8WC04UT | |
| HP ProBook 455 G7-175W8EA | |
| LG Gram 15Z90N | |
| Lenovo IdeaPad 3 14IIL05 | |
| Asus VivoBook 17 S712FA-DS76 | |
| Lenovo ThinkBook 15 | |
| HP Envy x360 15-dr1679cl | |
| Lenovo ThinkPad L590-20Q70019GE | |
| Dell Latitude 15 3590 | |
| HP 17-by2437ng | |
| 1280x720 Performance Combined | |
| Lenovo ThinkPad E590-20NB0012GE | |
| MSI Modern 15 A10RB | |
| Lenovo ThinkPad T15 Gen1-20S7S02U00 | |
| HP ProBook 450 G7 8WC04UT | |
| Ortalama NVIDIA GeForce MX250 (3532 - 4638, n=29) | |
| Microsoft Surface Laptop 3 15 i7-1065G7 | |
| HP ProBook 455 G7-175W8EA | |
| Lenovo IdeaPad 3 14IIL05 | |
| Lenovo ThinkBook 15 | |
| Asus VivoBook 17 S712FA-DS76 | |
| HP Envy x360 15-dr1679cl | |
| Lenovo ThinkPad L590-20Q70019GE | |
| LG Gram 15Z90N | |
| HP 17-by2437ng | |
| Dell Latitude 15 3590 | |
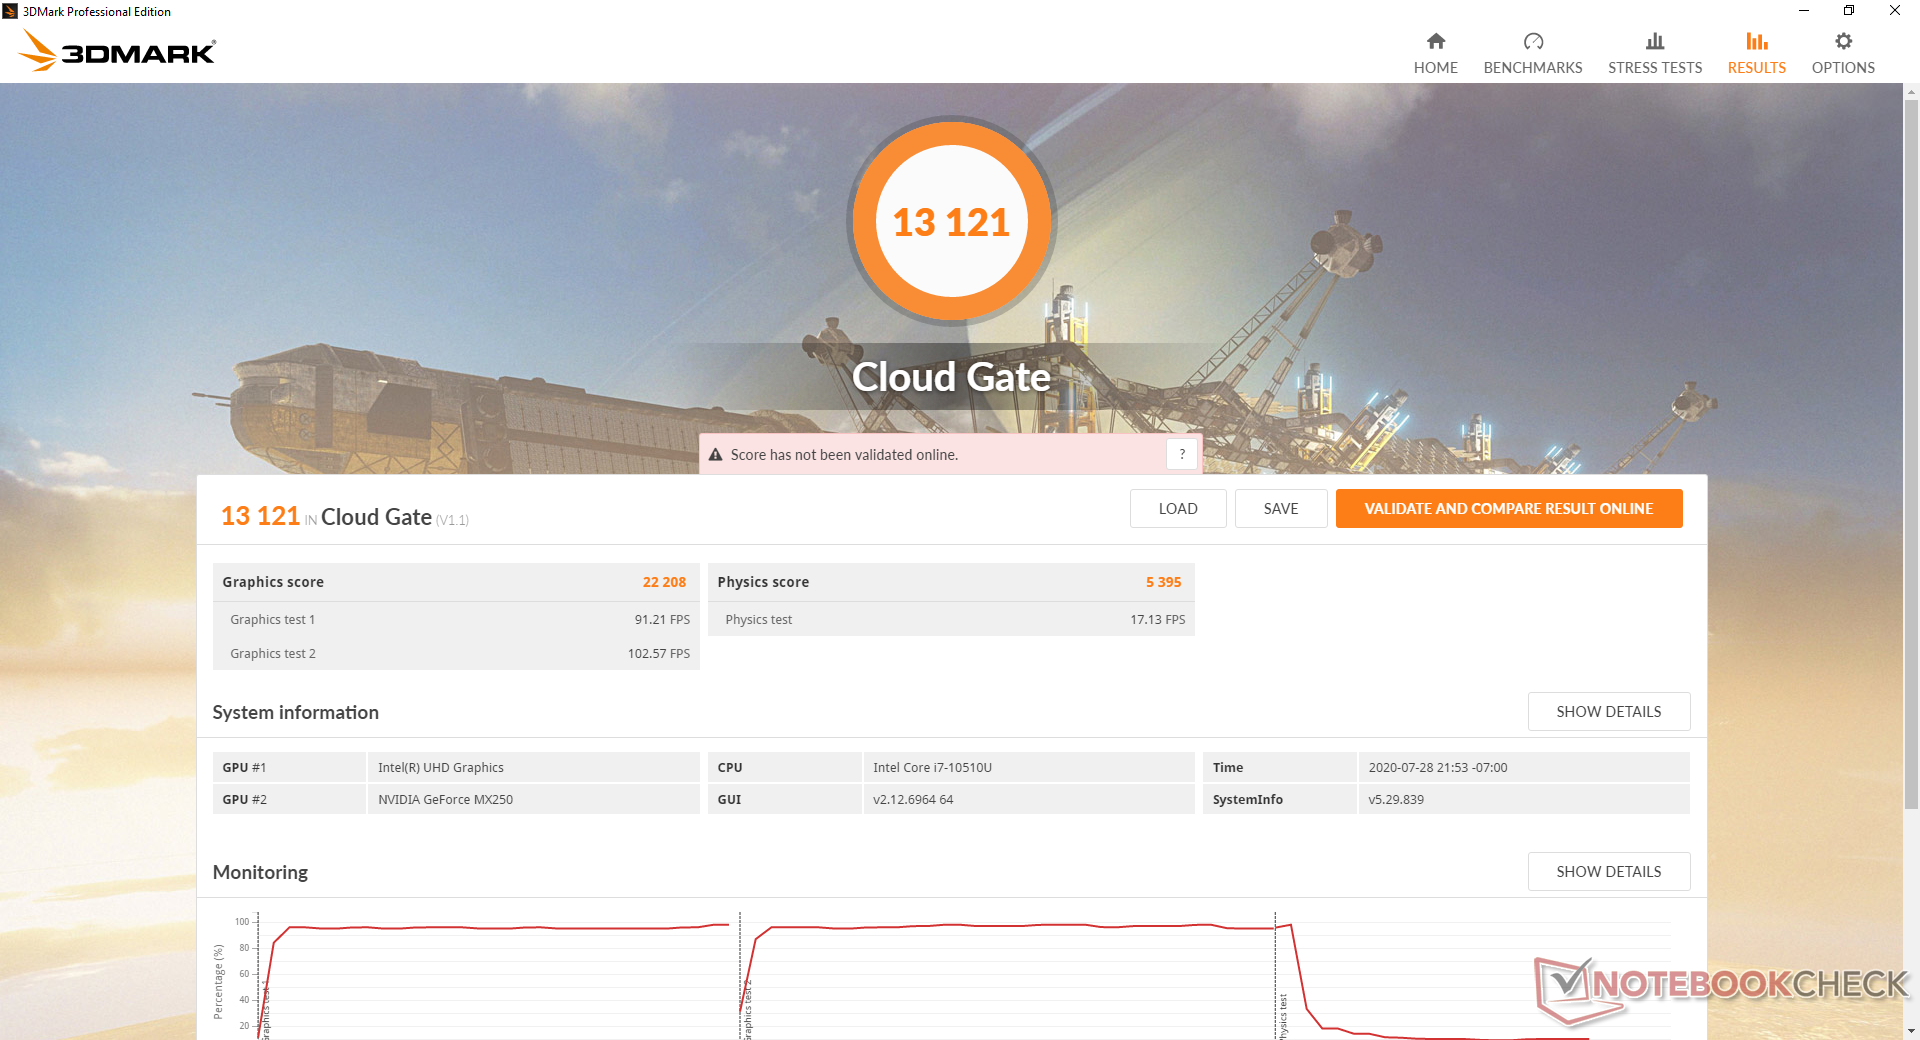
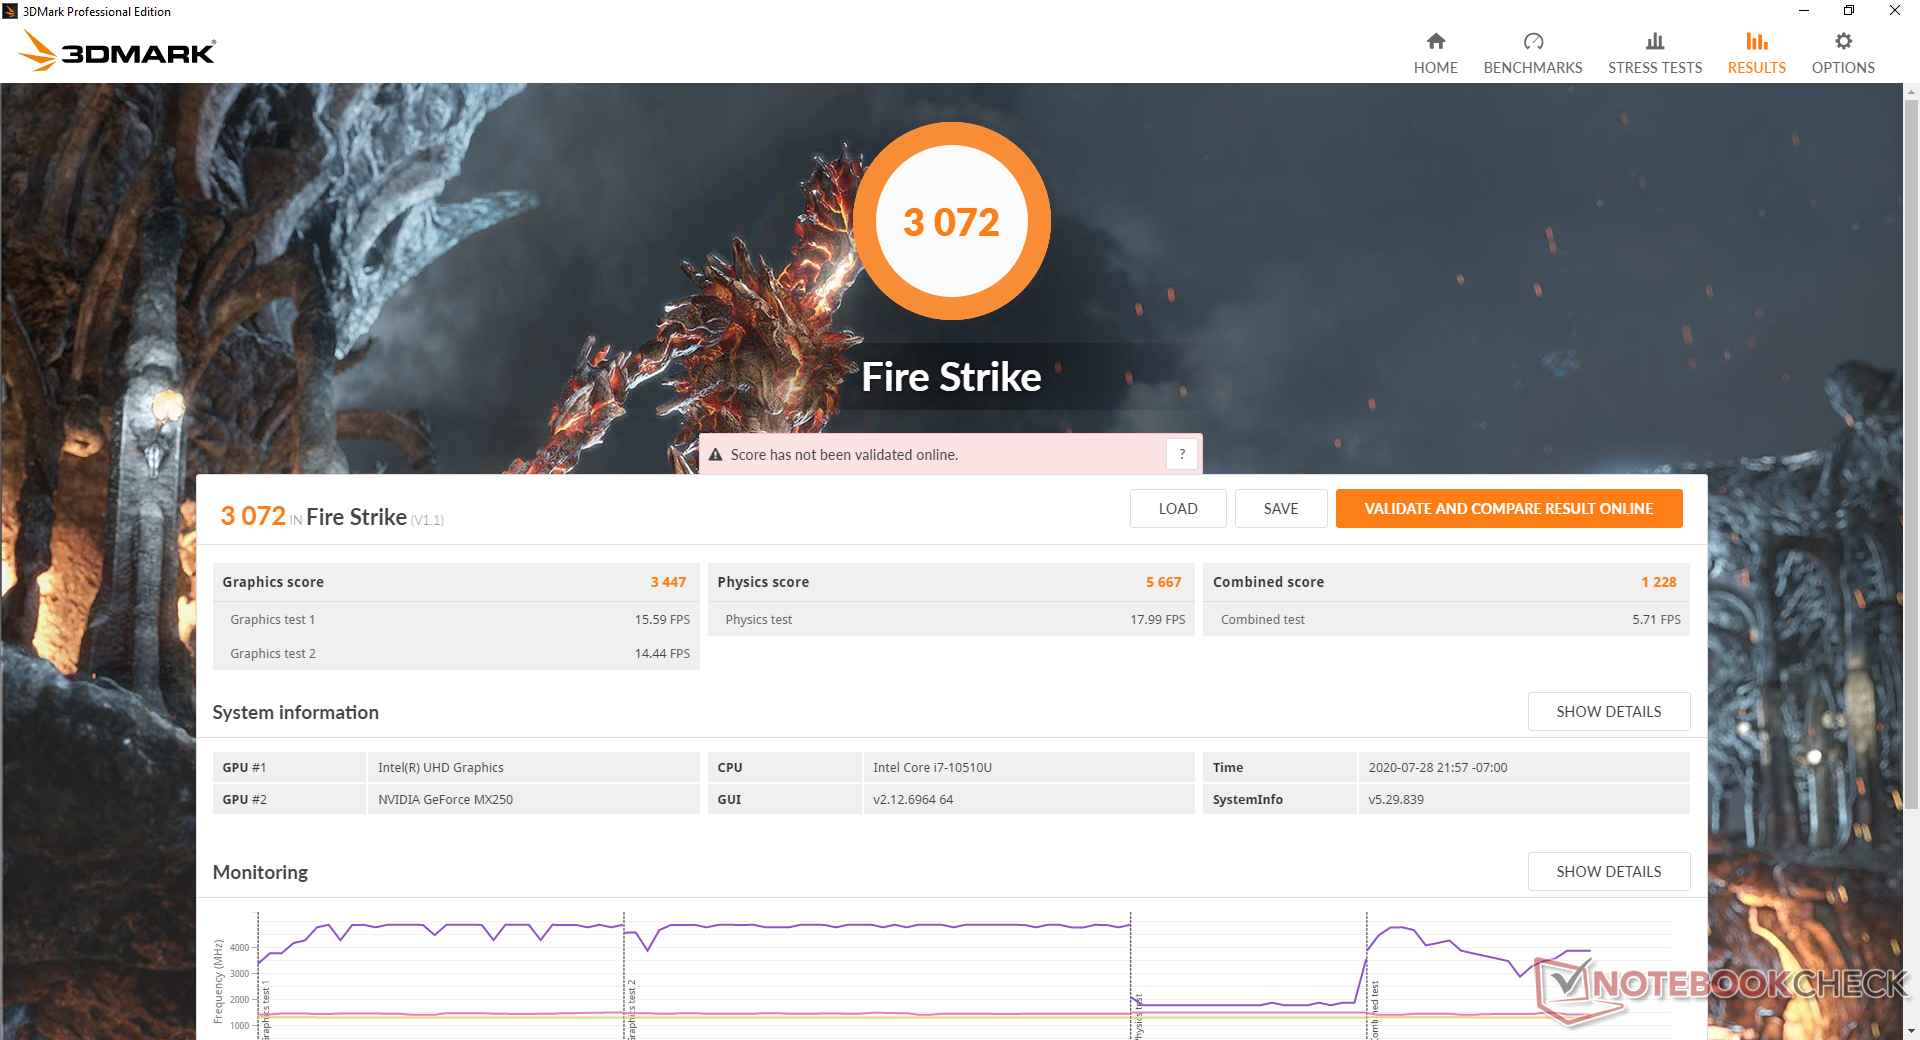
| 3DMark 11 Performance | 4452 puan | |
| 3DMark Cloud Gate Standard Score | 13121 puan | |
| 3DMark Fire Strike Score | 3072 puan | |
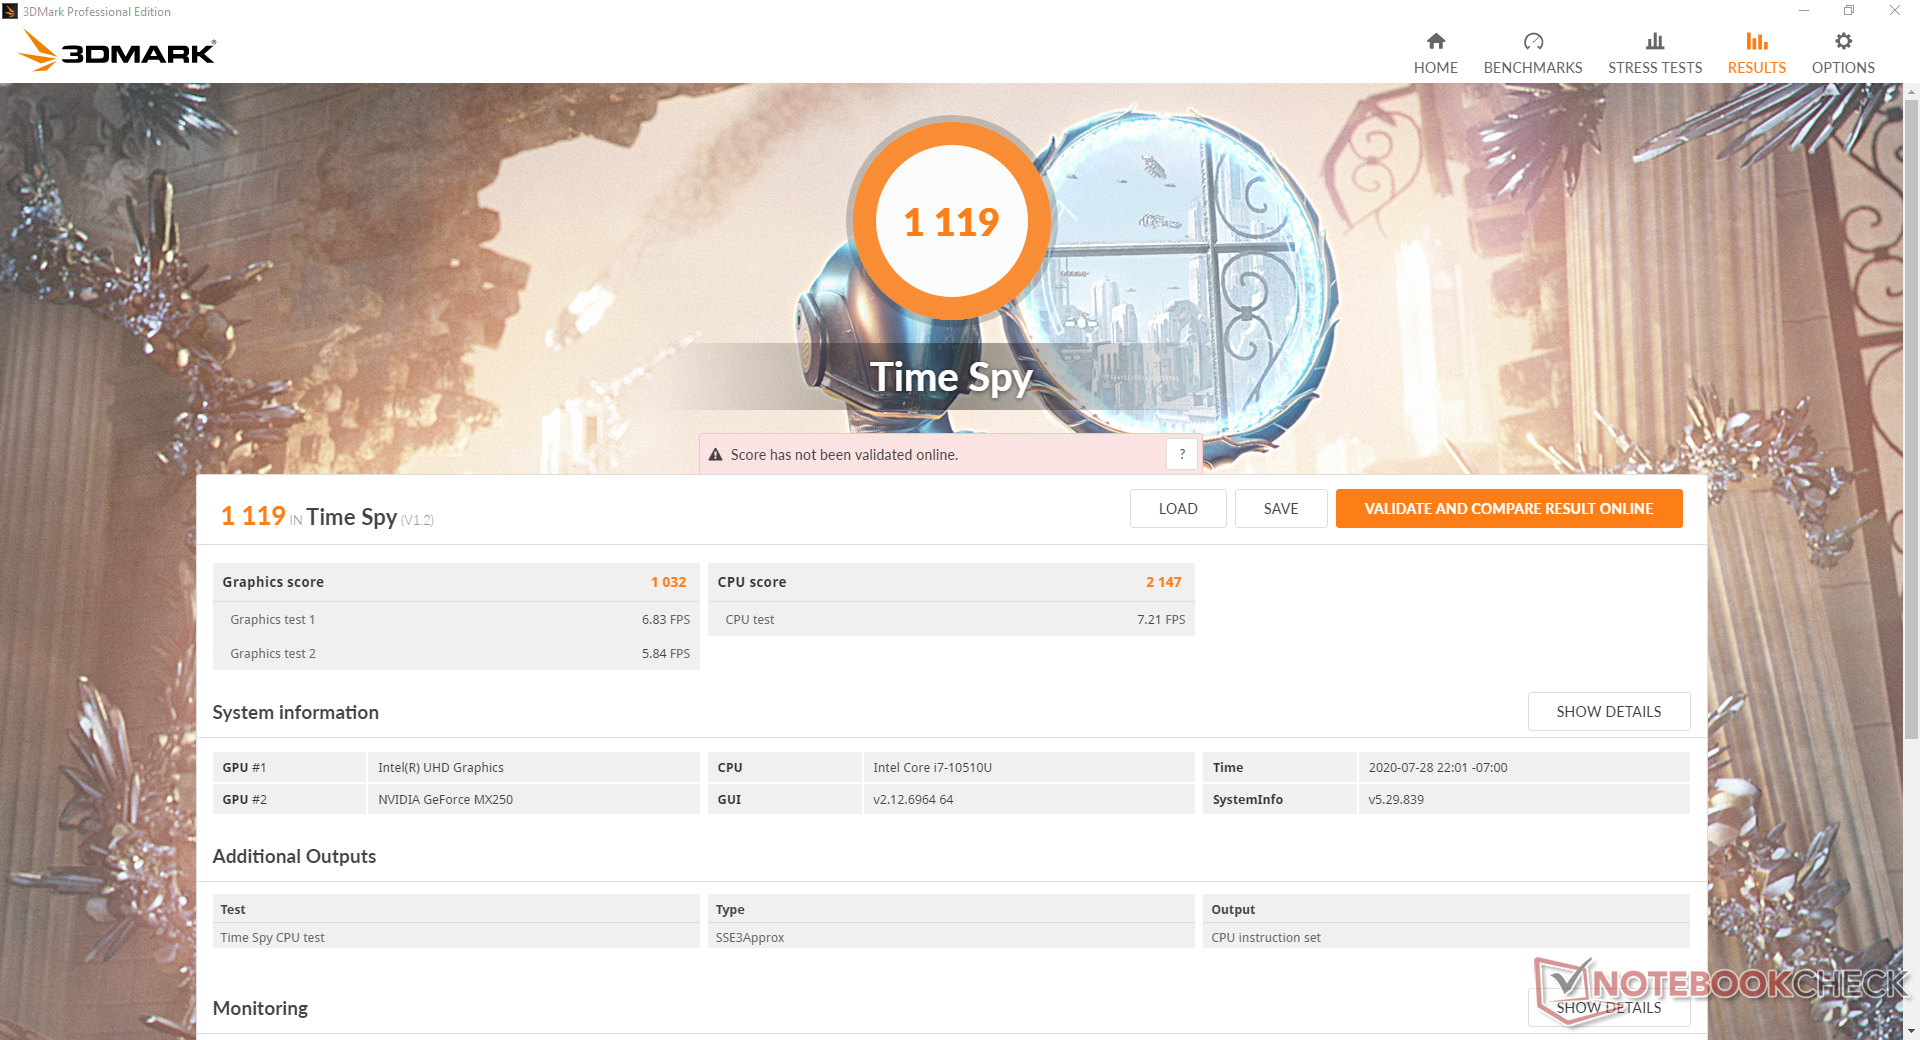
| 3DMark Time Spy Score | 1119 puan | |
Yardım | ||
| düşük | orta | yüksek | ultra | |
|---|---|---|---|---|
| The Witcher 3 (2015) | 66.7 | 34.7 | 21 | 11.2 |
| Dota 2 Reborn (2015) | 110 | 96.2 | 68 | 60.7 |
| X-Plane 11.11 (2018) | 44.3 | 38.7 | 35.5 |
Emisyonlar
Sistem Gürültüsü
Tamamen sessiz bir deneyim için, tarama veya kelime işleme gibi çoğu düşük yük sırasında dahili fan boşta kalacaktır. En kötü ihtimalle, fan hala yönetilebilir seviyeler olan 31 dB (A) veya 34 dB (A) 'ya kadar sıçrayabilir. Herhangi bir darbe davranışı minimumda tutulur. Oyun oynama gibi daha yüksek yüklerde çalışırken, fan gürültüsü önemli ölçüde toplanır ve tamamen gerildiğinde 37,5 dB (A) ile 47 dB (A) arasında değişebilir. Bu, ProBook'u diğer iş dizüstü bilgisayarlarının çoğundan daha yüksek yapar ve bu, daha güçlü bir ayrık GeForce MX GPU'ya sahip olmak için ödenmesi gereken bedeldir.


| HP ProBook 450 G7 8WC04UT GeForce MX250, i7-10510U, Crucial P1 SSD CT1000P1SSD8 | HP ProBook 455 G7-175W8EA Vega 7, R7 4700U, Samsung PM991 MZVLQ512HALU | MSI Modern 15 A10RB GeForce MX250, i7-10510U, WDC PC SN730 SDBPNTY-512G | Dell Latitude 15 3590 UHD Graphics 620, i5-8250U, Samsung SSD PM871b MZ7LN256HAJQ | Lenovo ThinkPad L590-20Q70019GE UHD Graphics 620, i5-8265U, Toshiba XG6 KXG6AZNV512G | Dynabook Tecra X50-F UHD Graphics 620, i7-8665U, Samsung SSD PM981 MZVLB512HAJQ | |
|---|---|---|---|---|---|---|
| Noise | -6% | -11% | -11% | 1% | -5% | |
| kapalı / ortam * (dB) | 26.2 | 30.7 -17% | 28.3 -8% | 30.6 -17% | 29 -11% | 30.2 -15% |
| Idle Minimum * (dB) | 26.2 | 30.7 -17% | 32 -22% | 30.6 -17% | 29 -11% | 30.2 -15% |
| Idle Average * (dB) | 26.2 | 30.7 -17% | 32 -22% | 31.9 -22% | 29 -11% | 30.2 -15% |
| Idle Maximum * (dB) | 26.2 | 30.7 -17% | 32 -22% | 31.9 -22% | 29 -11% | 30.2 -15% |
| Load Average * (dB) | 38.1 | 33.9 11% | 34.5 9% | 39 -2% | 29 24% | 33.4 12% |
| Witcher 3 ultra * (dB) | 37.5 | 39.5 -5% | ||||
| Load Maximum * (dB) | 47 | 36.8 22% | 50.9 -8% | 39.1 17% | 33.8 28% | 39 17% |
* ... daha küçük daha iyidir
Ses yüksekliği
| Boşta |
| 26.2 / 26.2 / 26.2 dB |
| Çalışırken |
| 38.1 / 47 dB |
 | ||
30 dB sessiz 40 dB(A) duyulabilirlik 50 dB(A) gürültülü |
||
min: | ||
Sıcaklık
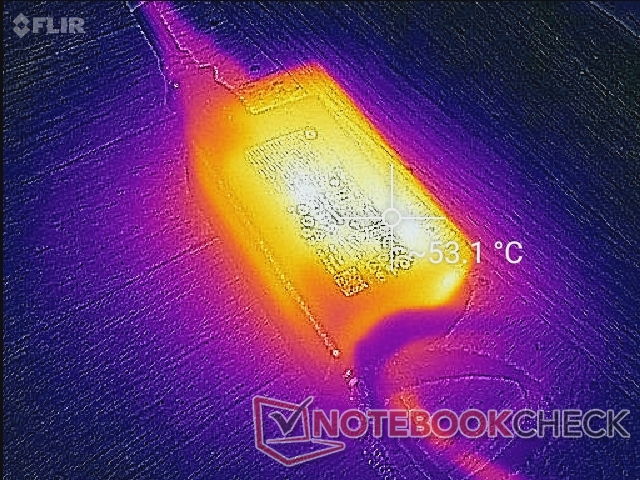
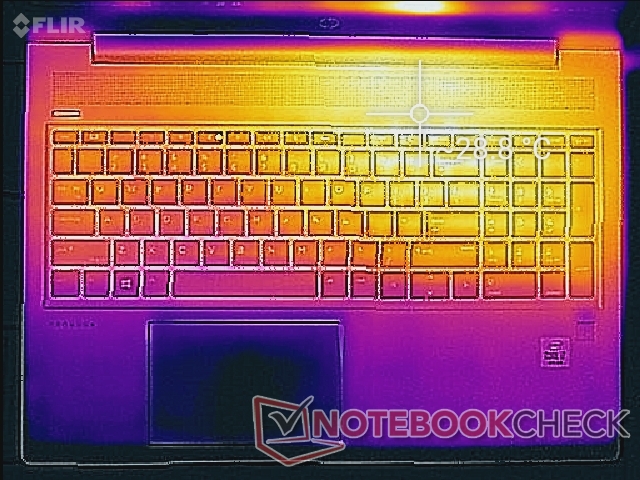
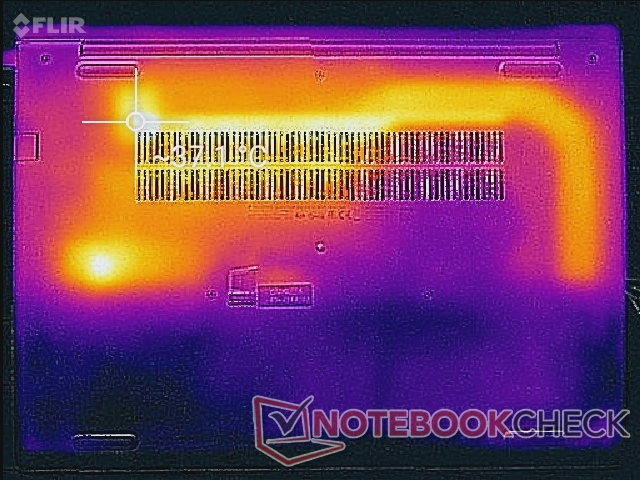
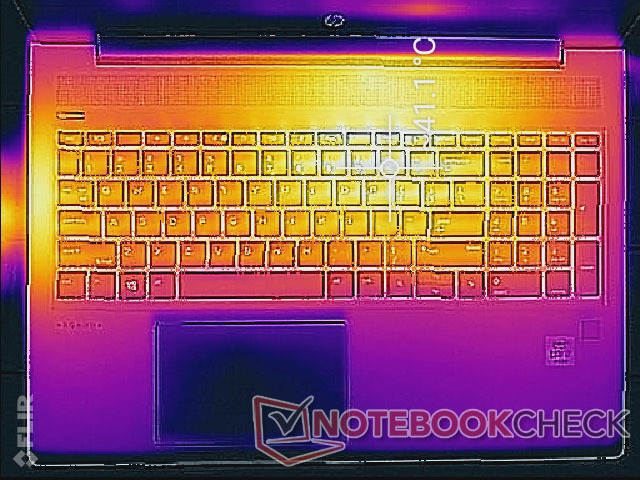
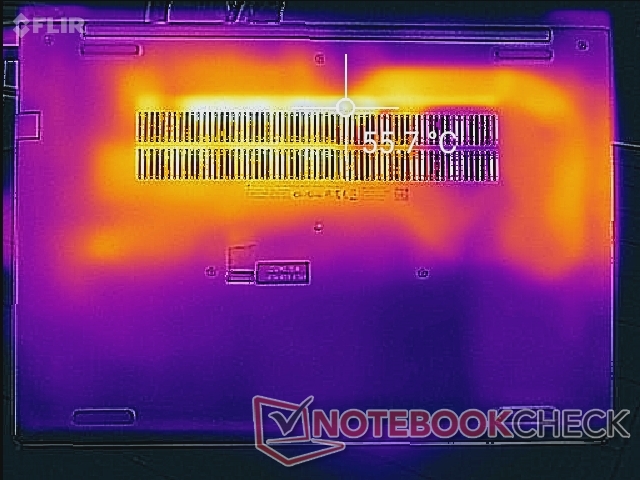
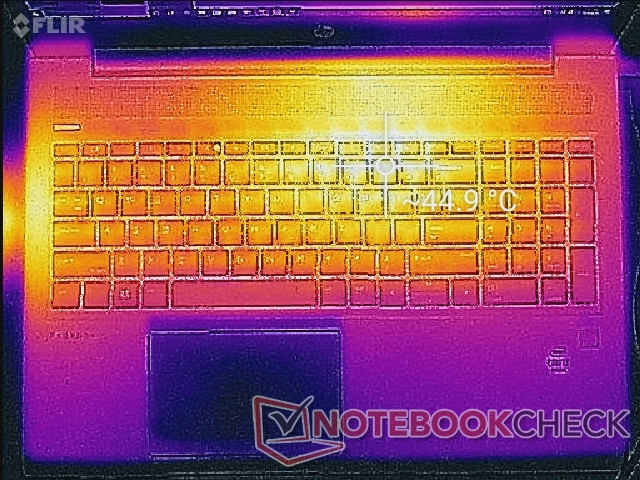
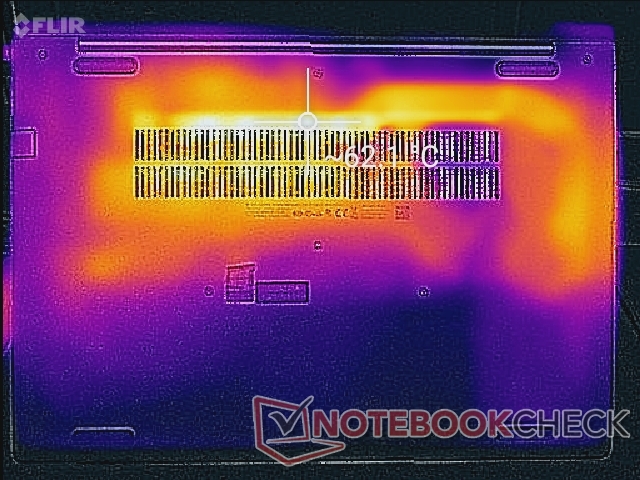
Sıcak noktalar, aşağıdaki sıcaklık haritalarımızda gösterildiği gibi işlemciye en yakın sistemin arkasına doğru ve uzatılmış bakır ısı borusudur. Bu nedenle, rahat yazma için avuç içi dayanağı ve klavye tuşlarının çoğu nispeten soğuk kalır. Sıcak noktalar, Dell Latitude 3590'da yalnızca 41 C'ye kıyasla, üst ve alt taraflarda sırasıyla 44 C ve 62 C'ye kadar çok ısınabilir.
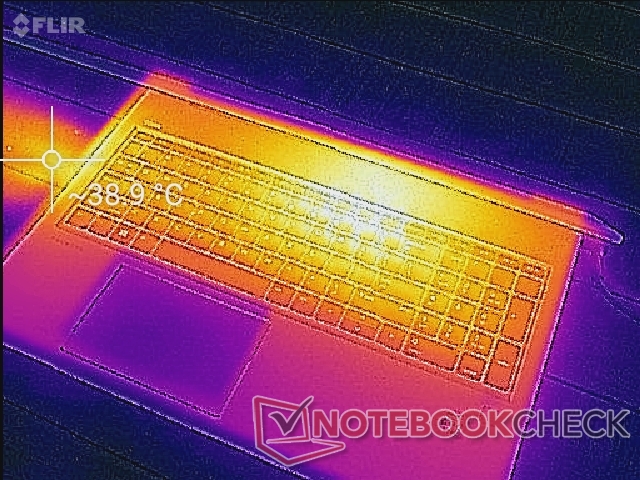
(±) Üst taraftaki maksimum sıcaklık, 34.3 °C / 94 F ortalamasına kıyasla 40 °C / 104 F'dir. , Office sınıfı için 21.2 ile 62.5 °C arasında değişir.
(-) Alt kısım, 36.8 °C / 98 F ortalamasına kıyasla maksimum 56.6 °C / 134 F'ye kadar ısınır
(+) Boşta kullanımda, üst tarafın ortalama sıcaklığı 26 °C / 79 F olup, cihazın 29.5 °C / 85 F.
(±) The Witcher 3 oynarken, üst tarafın ortalama sıcaklığı 35.2 °C / 95 F olup, cihazın 29.5 °C / 85 F.
(+) Avuç içi dayanakları ve dokunmatik yüzey, maksimum 29.8 °C / 85.6 F ile cilt sıcaklığından daha soğuktur ve bu nedenle dokunulduğunda soğuktur.
(-) Benzer cihazların avuç içi dayanağı alanının ortalama sıcaklığı 27.5 °C / 81.5 F (-2.3 °C / -4.1 F) idi.
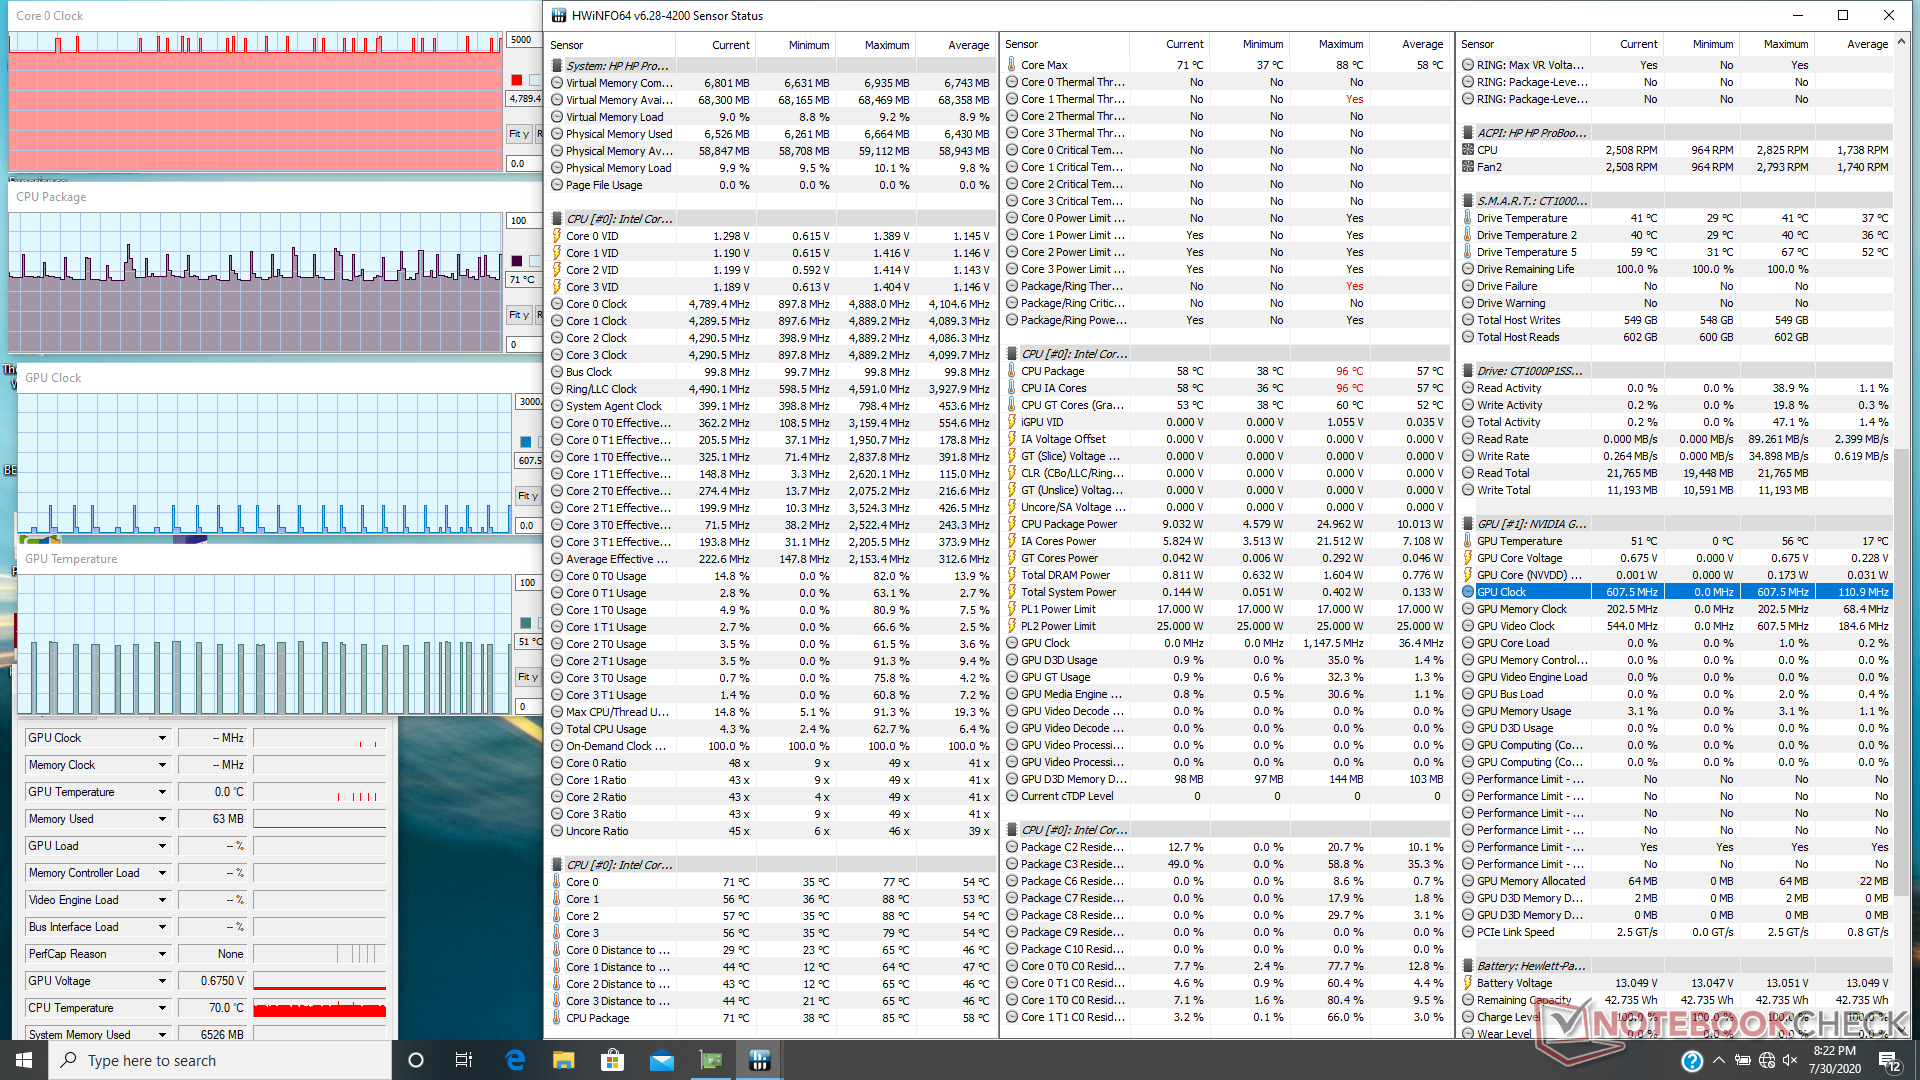
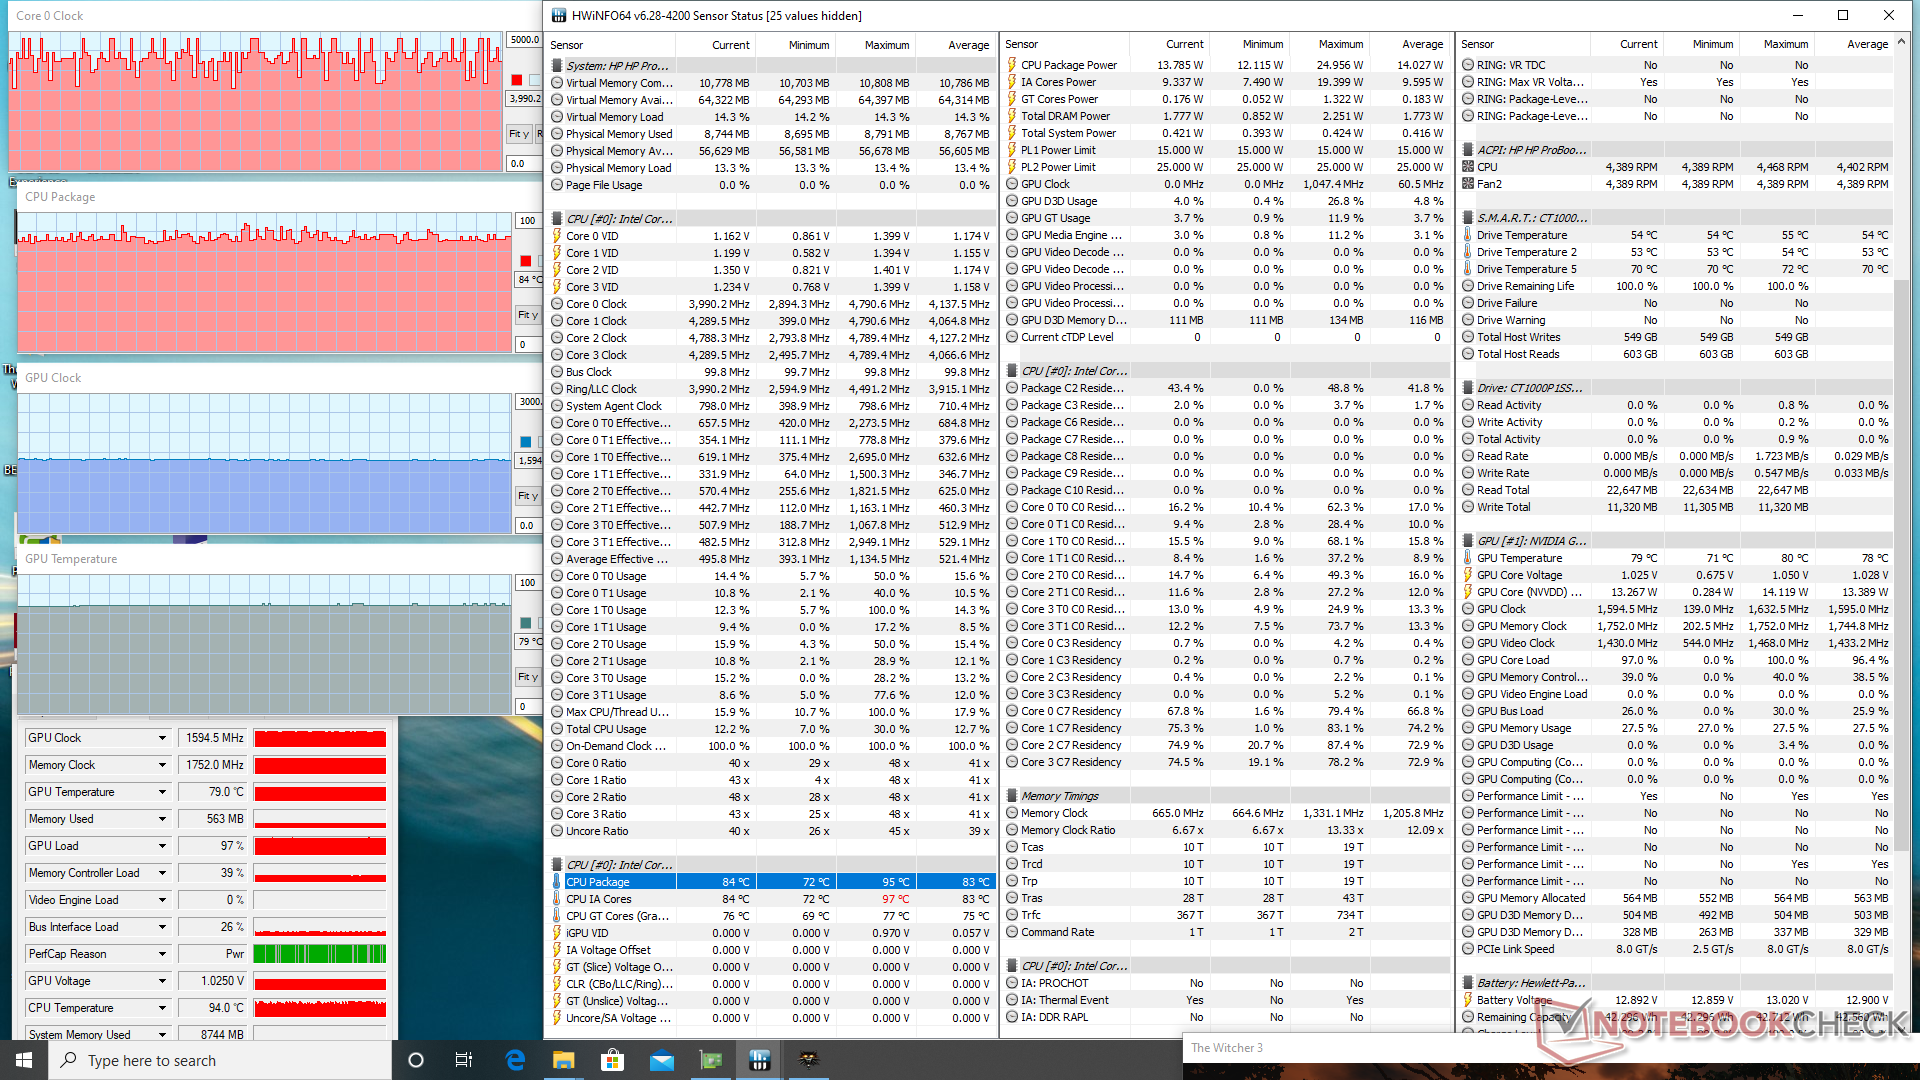
Stres testi
Prime95'i çalıştırırken, CPU düşmeden ve 2,2 GHz ve 63 C'de sabitlenmeden önce yaklaşık 20 saniye boyunca 3,1 GHz'e yükselir. Bu sabit saat hızları, aynı CPU'ya sahip diğer dizüstü bilgisayarlarla karşılaştırıldığında nispeten düşüktür ve beklenenden daha düşüktür. CineBench puanları yukarıda. Örneğin Core i7-10510U'lu Lenovo ThinkPad T490, benzer koşullar altında 2,9 ila 3,0 GHz'de stabilize olur. Oyun oynamak gibi yüksek yükler, CPU ve GPU'nun Ryzen ile çalışan ProBook 455 G7'deki ~ 67 C'ye kıyasla sırasıyla 84 C ve 79 C'de stabilize olmasına neden olur. Pille çalışmak performansı düşürmez. Batarya gücüyle yapılan bir Yangın Saldırısı, ana şebekedeyken 5667 ve 3447 puanla karşılaştırıldığında, sırasıyla 5647 ve 3750 puanlık Fizik ve Grafik puanları döndürür.
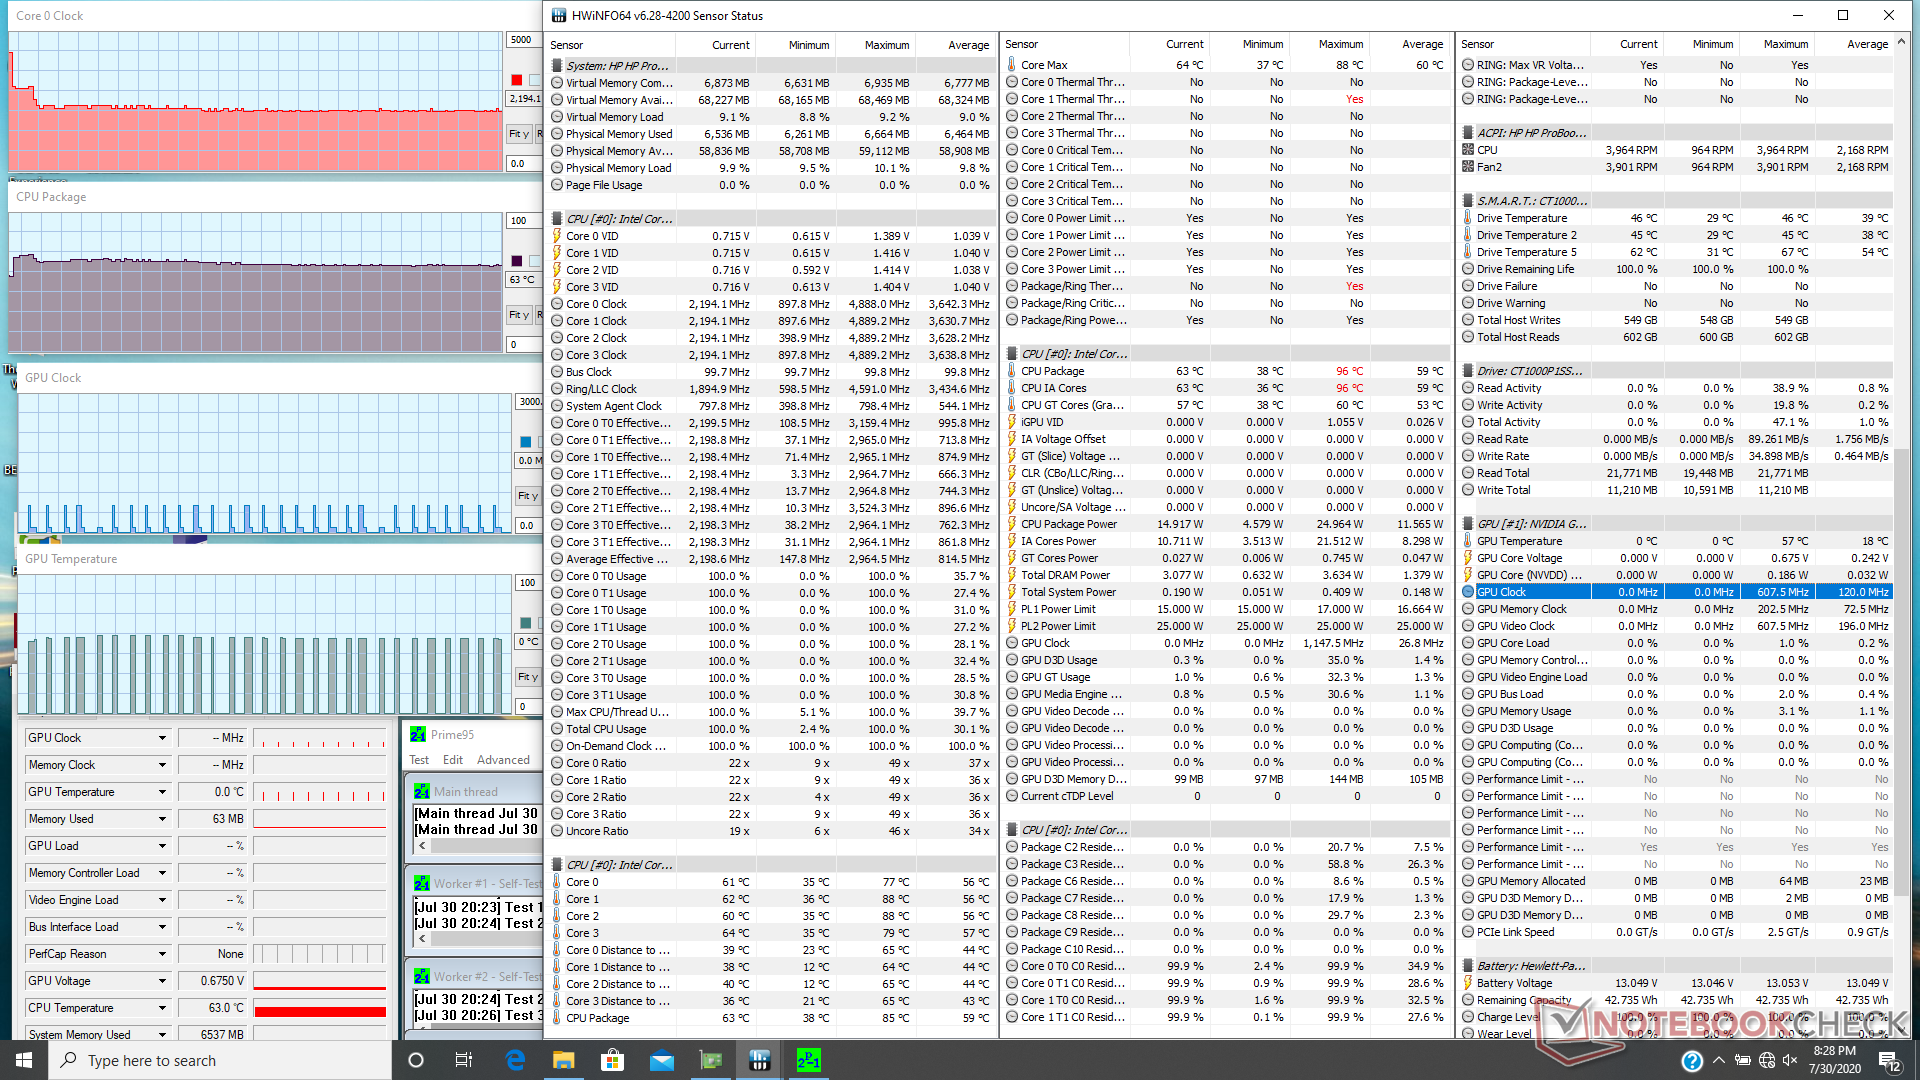
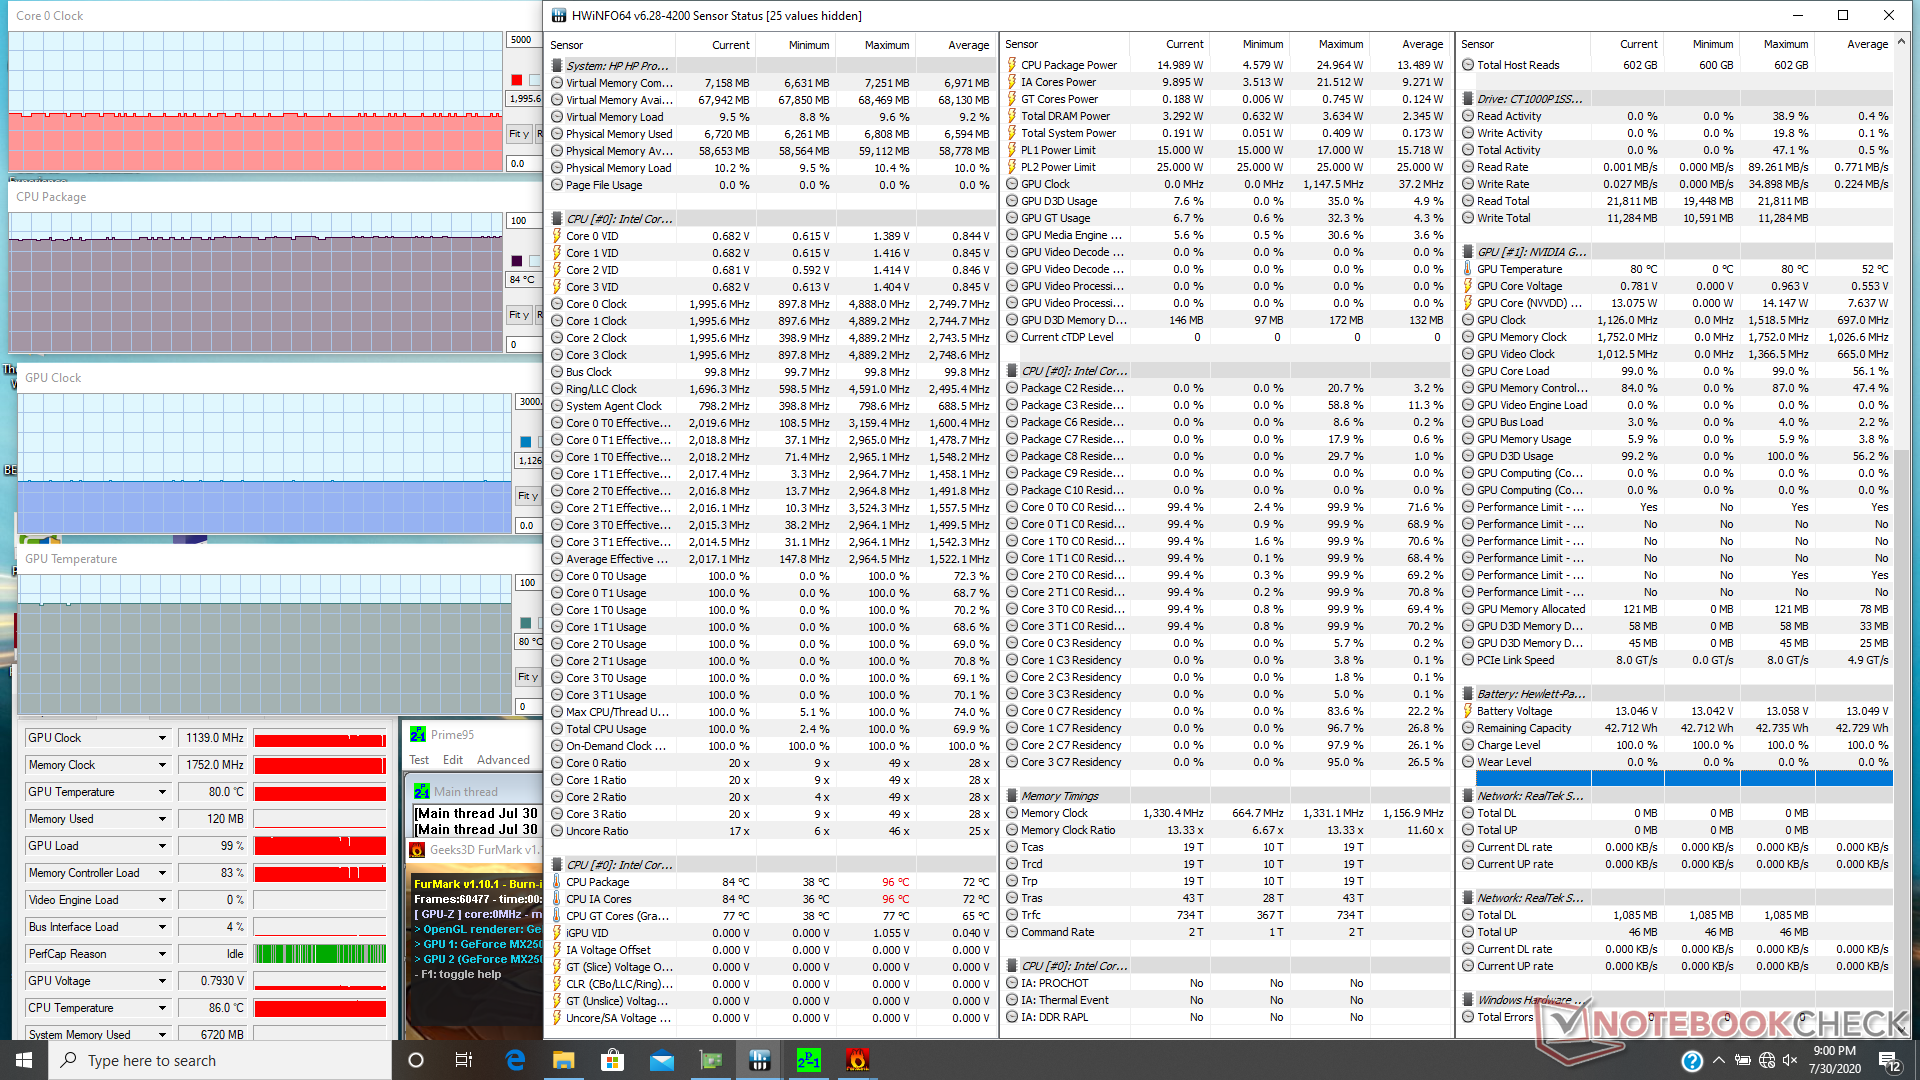
| CPU Clock (GHz) | GPU Clock (MHz) | Average CPU Temperature (°C) | Average GPU Temperature (°C) | |
| System Idle | -- | -- | 57 | 51 |
| Prime95 Stress | 2.2 | -- | 63 | 57 |
| Prime95 + FurMark Stress | 2.0 - 2.1 | 1139 | 84 | 80 |
| Witcher 3 Stress | ~4.0 | 1595 | 84 | 79 |
Hoparlörler


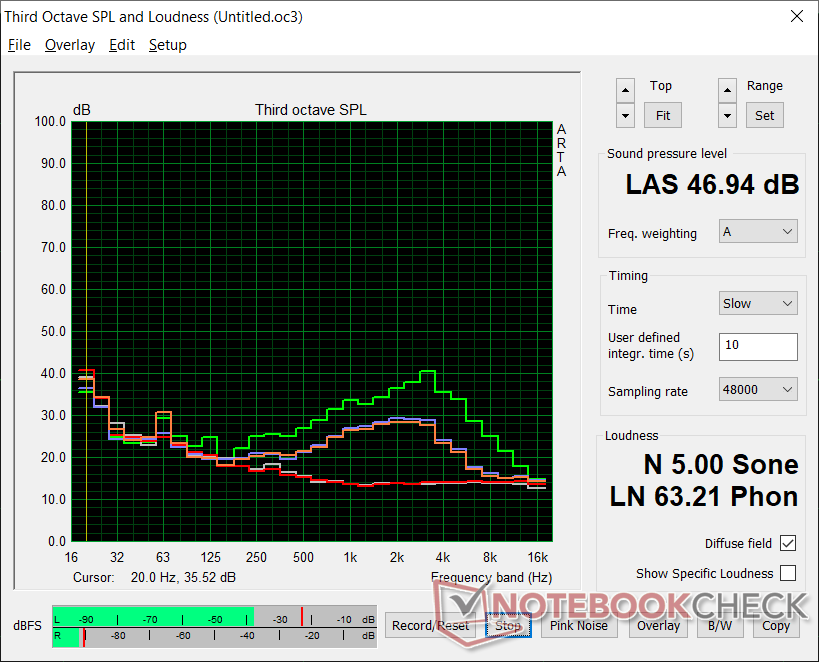
HP ProBook 450 G7 8WC04UT ses analizi
(±) | hoparlör ses yüksekliği ortalama ama iyi (81.8 dB)
Bas 100 - 315Hz
(-) | neredeyse hiç bas yok - ortalama olarak medyandan 18.4% daha düşük
(±) | Bas doğrusallığı ortalamadır (12.2% delta - önceki frekans)
Ortalar 400 - 2000 Hz
(+) | dengeli ortalar - medyandan yalnızca 2.9% uzakta
(+) | orta frekanslar doğrusaldır (5.4% deltadan önceki frekansa)
Yüksekler 2 - 16 kHz
(+) | dengeli yüksekler - medyandan yalnızca 2.8% uzakta
(+) | yüksekler doğrusaldır (5.4% deltadan önceki frekansa)
Toplam 100 - 16.000 Hz
(+) | genel ses doğrusaldır (14.5% ortancaya göre fark)
Aynı sınıfla karşılaştırıldığında
» Bu sınıftaki tüm test edilen cihazların %12%'si daha iyi, 4% benzer, 85% daha kötüydü
» En iyisinin deltası 7% idi, ortalama 21% idi, en kötüsü 53% idi
Test edilen tüm cihazlarla karşılaştırıldığında
» Test edilen tüm cihazların %18'si daha iyi, 4 benzer, % 77 daha kötüydü
» En iyisinin deltası 4% idi, ortalama 23% idi, en kötüsü 134% idi
Apple MacBook 12 (Early 2016) 1.1 GHz ses analizi
(+) | hoparlörler nispeten yüksek sesle çalabilir (83.6 dB)
Bas 100 - 315Hz
(±) | azaltılmış bas - ortalama olarak medyandan 11.3% daha düşük
(±) | Bas doğrusallığı ortalamadır (14.2% delta - önceki frekans)
Ortalar 400 - 2000 Hz
(+) | dengeli ortalar - medyandan yalnızca 2.4% uzakta
(+) | orta frekanslar doğrusaldır (5.5% deltadan önceki frekansa)
Yüksekler 2 - 16 kHz
(+) | dengeli yüksekler - medyandan yalnızca 2% uzakta
(+) | yüksekler doğrusaldır (4.5% deltadan önceki frekansa)
Toplam 100 - 16.000 Hz
(+) | genel ses doğrusaldır (10.2% ortancaya göre fark)
Aynı sınıfla karşılaştırıldığında
» Bu sınıftaki tüm test edilen cihazların %7%'si daha iyi, 2% benzer, 90% daha kötüydü
» En iyisinin deltası 5% idi, ortalama 18% idi, en kötüsü 53% idi
Test edilen tüm cihazlarla karşılaştırıldığında
» Test edilen tüm cihazların %5'si daha iyi, 1 benzer, % 94 daha kötüydü
» En iyisinin deltası 4% idi, ortalama 23% idi, en kötüsü 134% idi
Enerji yönetimi
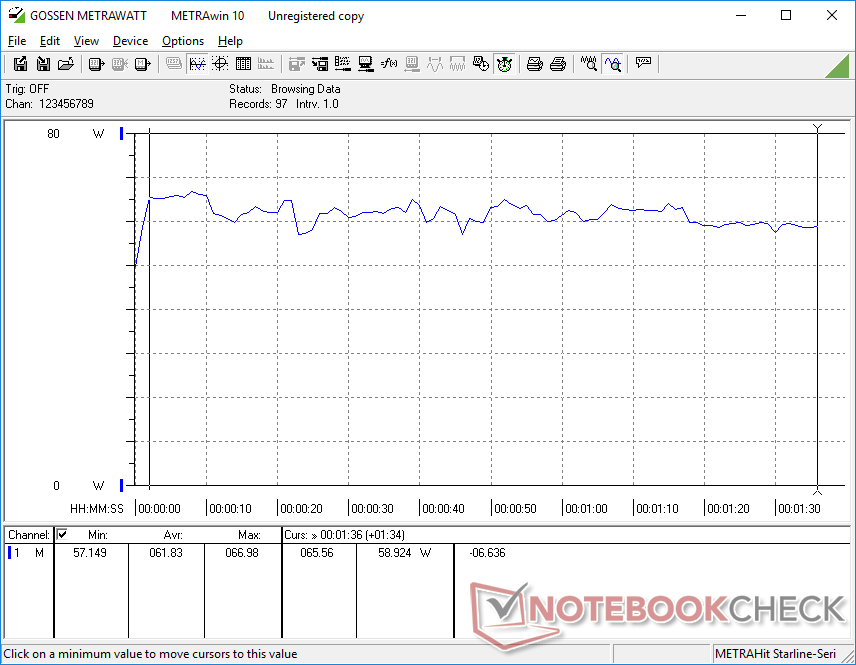
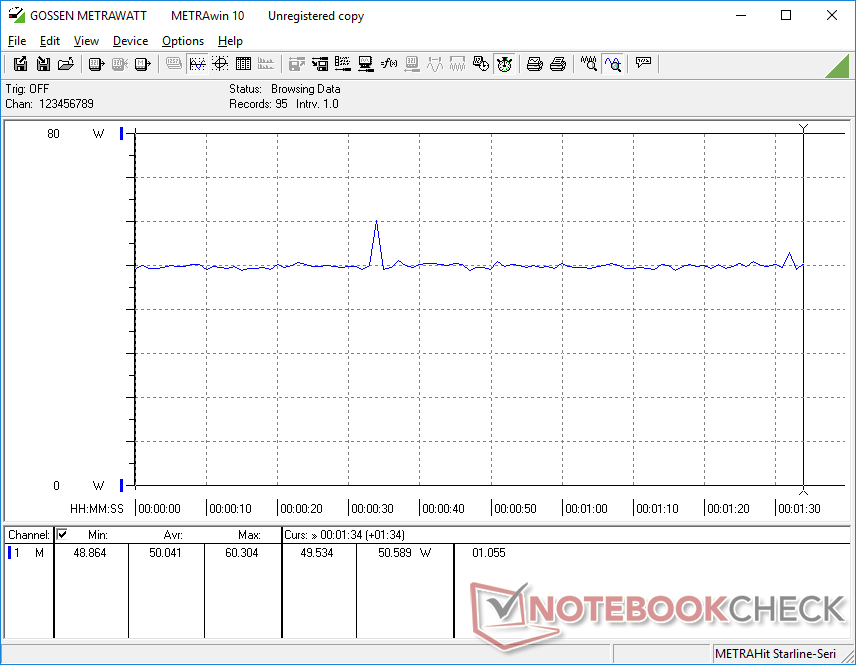
Güç tüketimi
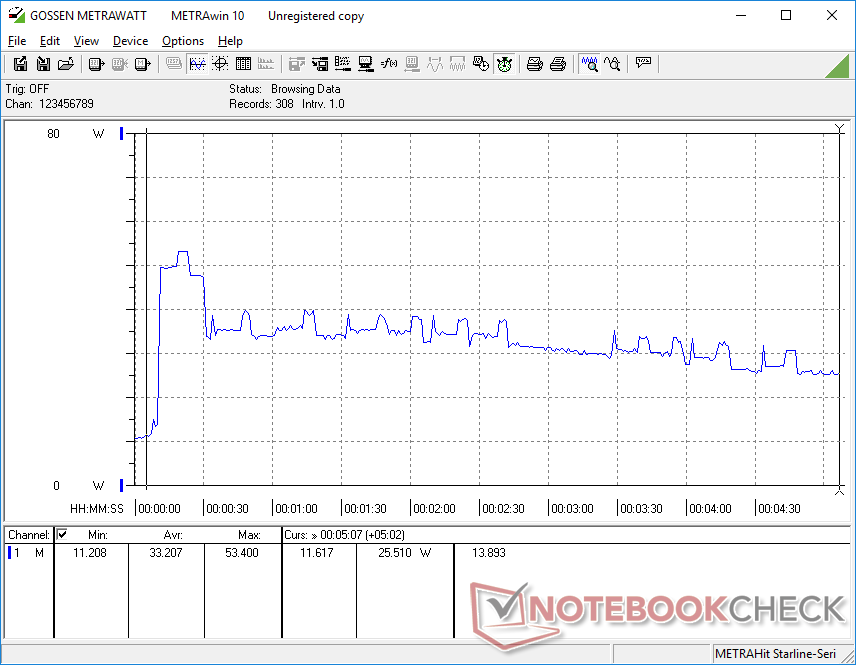
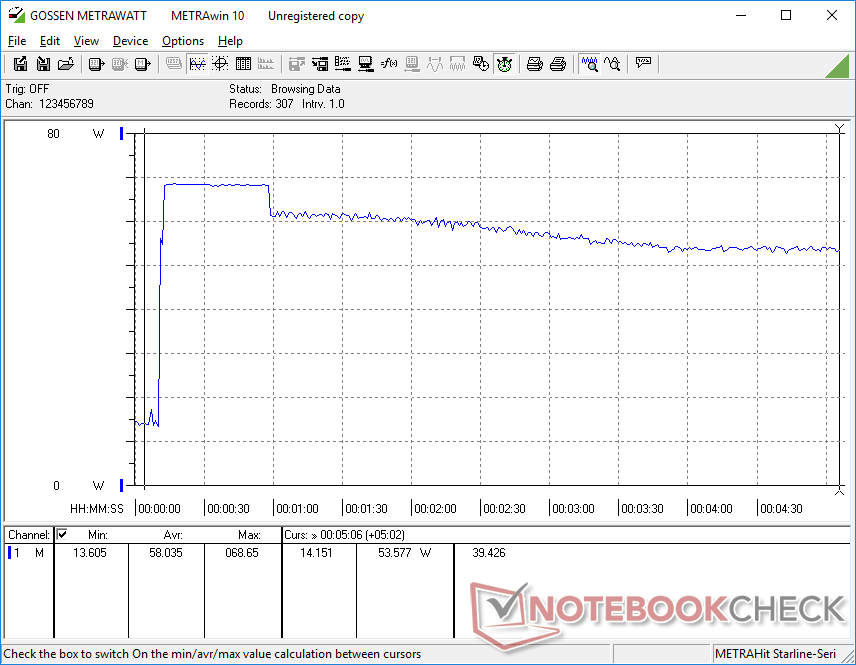
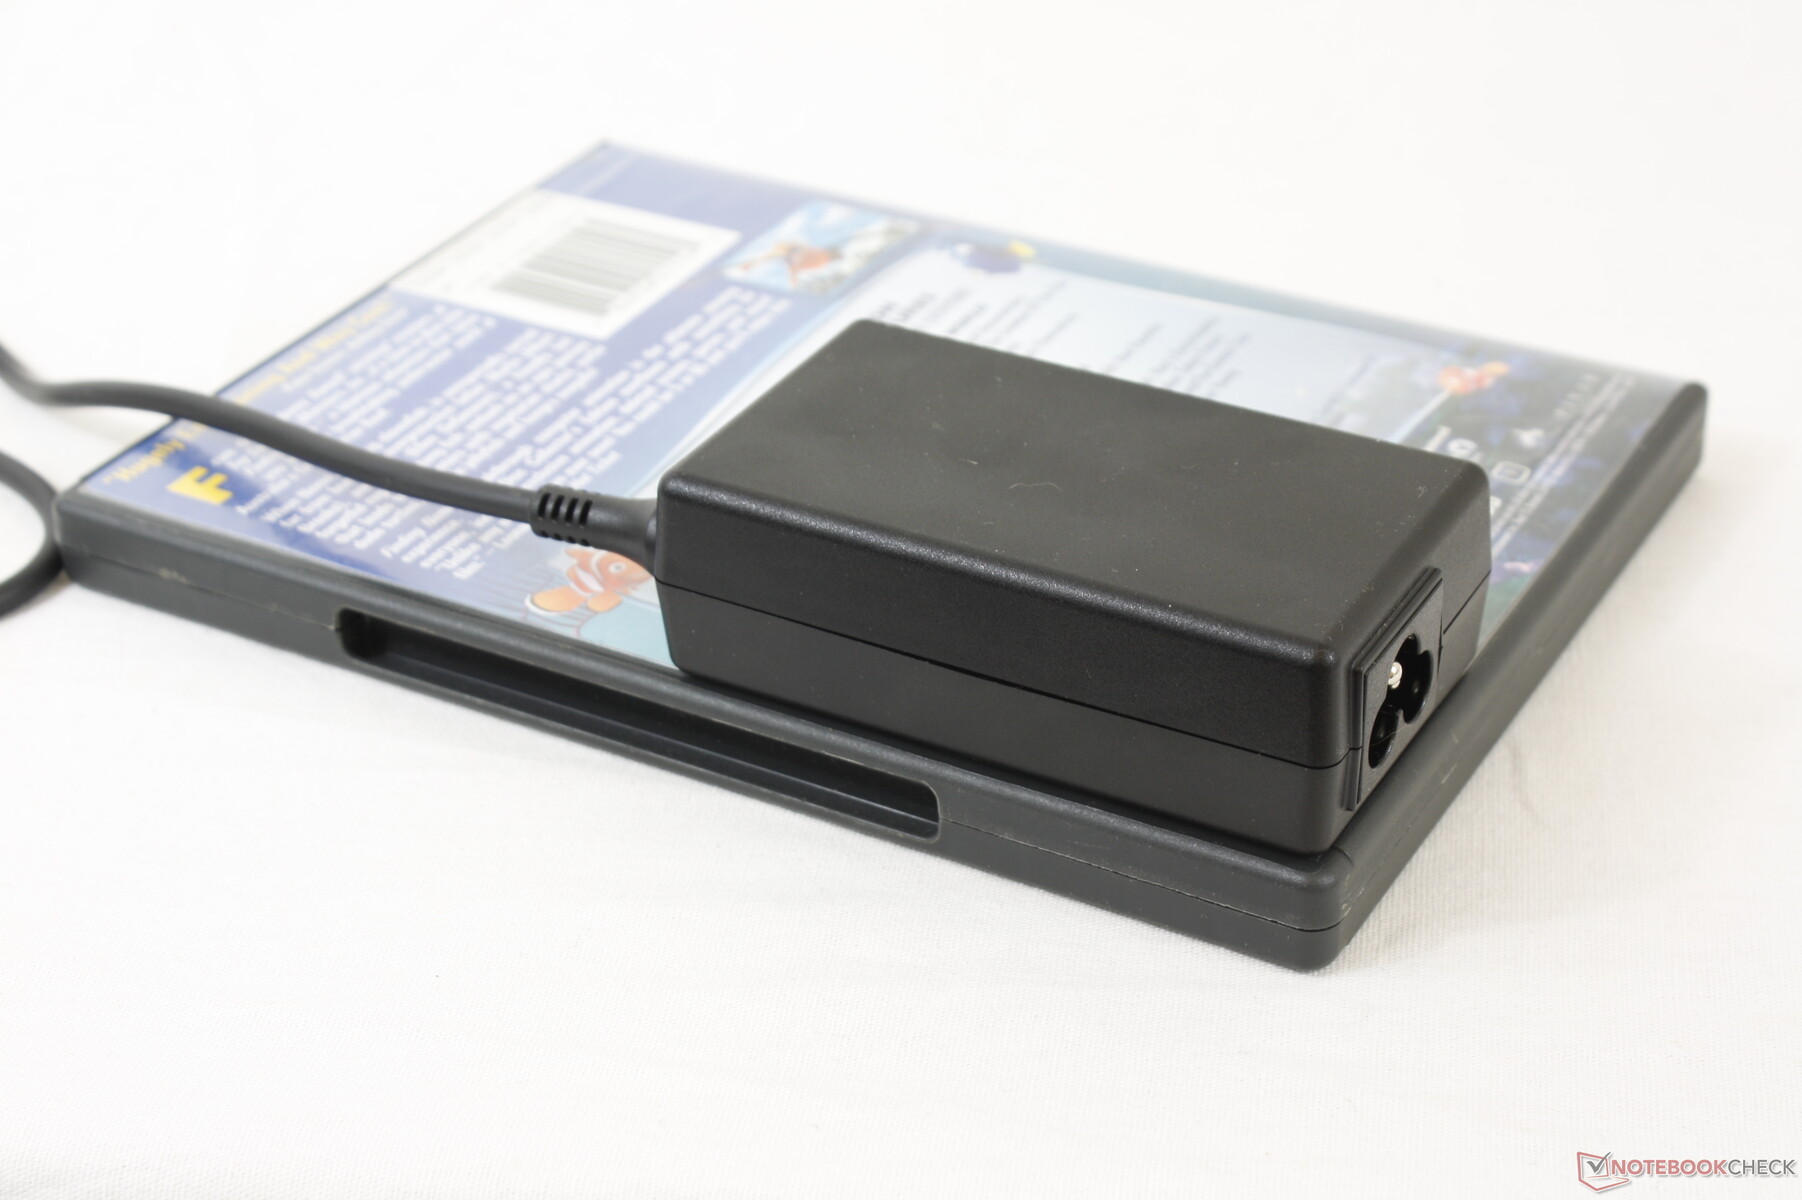
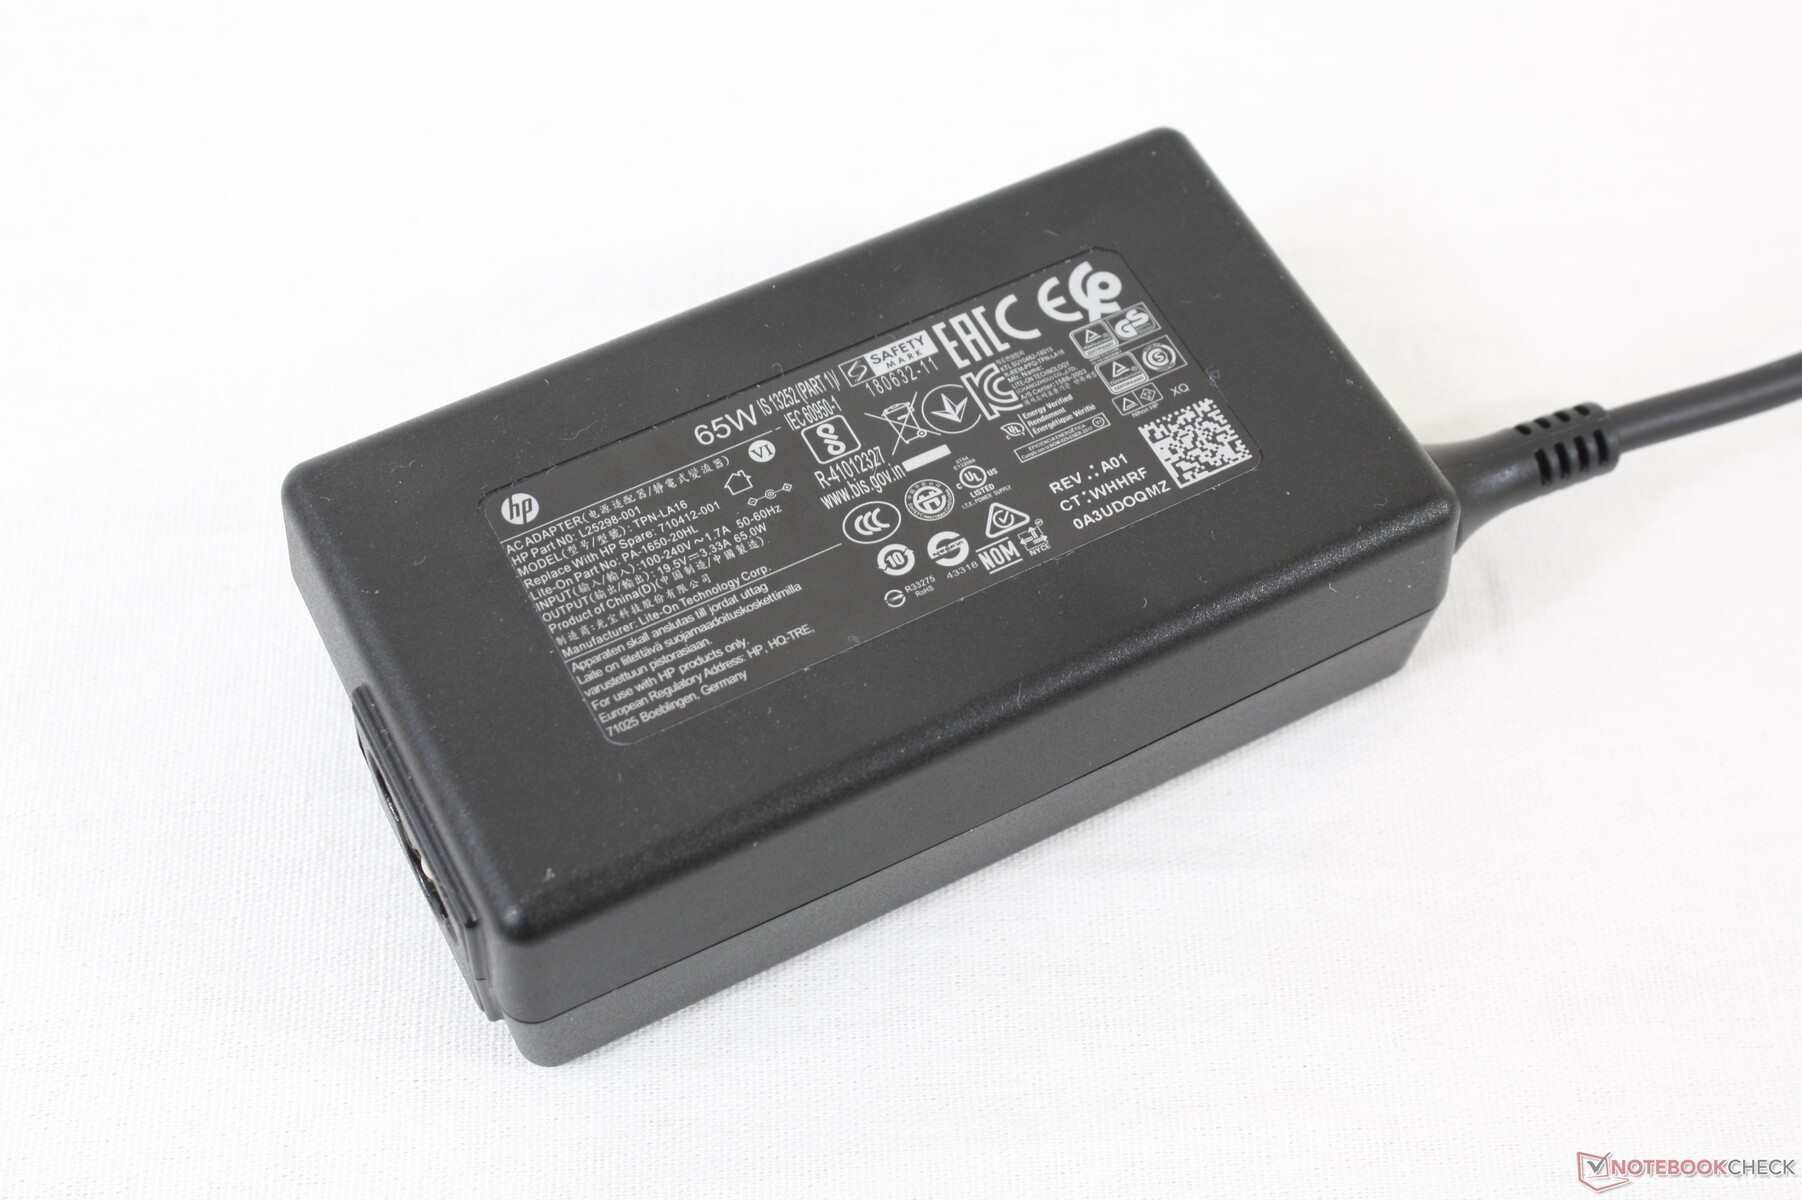
ProBook 450 G7, ayrık GeForce MX250 sayesinde yüksek yükler altındayken ProBook 455 G7'den yaklaşık yüzde 50 ila 90 daha fazla güç tüketir. Dolayısıyla, Intel-GeForce yapılandırmamız Ryzen 7'den daha hızlı grafik performansı sunarken, bu daha yüksek güç tüketimi pahasına geliyor. Aksi takdirde, her iki dizüstü bilgisayar da masaüstünde boştayken veya düşük işlem yükleriyle çalışırken hemen hemen aynıdır. Prime95'i çalıştırırken küçük (~ 9 x 5 x 2.8 cm) 65 W AC adaptörden maksimum 69 W tüketim kaydedebiliyoruz. FurMark aynı anda. Yüksek oran, aşağıdaki grafiklerimizde gösterildiği gibi yalnızca geçicidir.
| Kapalı / Bekleme modu | |
| Boşta | |
| Çalışırken |
|
Key:
min: | |
| HP ProBook 450 G7 8WC04UT i7-10510U, GeForce MX250, Crucial P1 SSD CT1000P1SSD8, IPS, 1920x1080, 15.6" | HP ProBook 455 G7-175W8EA R7 4700U, Vega 7, Samsung PM991 MZVLQ512HALU, IPS, 1920x1080, 15.6" | MSI Modern 15 A10RB i7-10510U, GeForce MX250, WDC PC SN730 SDBPNTY-512G, IPS, 1920x1080, 15.6" | Dell Latitude 15 3590 i5-8250U, UHD Graphics 620, Samsung SSD PM871b MZ7LN256HAJQ, TN LED, 1920x1080, 15.6" | Lenovo ThinkPad L590-20Q70019GE i5-8265U, UHD Graphics 620, Toshiba XG6 KXG6AZNV512G, IPS, 1920x1080, 15.6" | Dynabook Tecra X50-F i7-8665U, UHD Graphics 620, Samsung SSD PM981 MZVLB512HAJQ, IPS, 1920x1080, 15.6" | |
|---|---|---|---|---|---|---|
| Power Consumption | 25% | -32% | 29% | 27% | 28% | |
| Idle Minimum * (Watt) | 4.8 | 3.8 21% | 6.6 -38% | 4.3 10% | 3.96 17% | 3.9 19% |
| Idle Average * (Watt) | 9.5 | 7.7 19% | 9.9 -4% | 7.2 24% | 6.9 27% | 7 26% |
| Idle Maximum * (Watt) | 10.7 | 10.5 2% | 14.7 -37% | 9.8 8% | 9.8 8% | 7.3 32% |
| Load Average * (Watt) | 61.8 | 32 48% | 82.9 -34% | 38 39% | 31.4 49% | 32.7 47% |
| Witcher 3 ultra * (Watt) | 50 | 59.4 -19% | ||||
| Load Maximum * (Watt) | 69 | 45.4 34% | 109.3 -58% | 24 65% | 45.4 34% | 57.8 16% |
* ... daha küçük daha iyidir
Pil ömrü
Çalışma süreleri, Ryzen destekli ProBook 455 G7'de yaklaşık 7 saatlik gerçek dünya WLAN kullanımında kaydettiğimizle hemen hemen aynı. Boştan tam kapasiteye şarj etmek yaklaşık 1,5 saat sürer. Sistem aynı zamanda USB-C ile de şarj edilebilir.
| HP ProBook 450 G7 8WC04UT i7-10510U, GeForce MX250, 45 Wh | HP ProBook 455 G7-175W8EA R7 4700U, Vega 7, 45 Wh | MSI Modern 15 A10RB i7-10510U, GeForce MX250, 52 Wh | Dell Latitude 15 3590 i5-8250U, UHD Graphics 620, 56 Wh | Lenovo ThinkPad L590-20Q70019GE i5-8265U, UHD Graphics 620, 45 Wh | Dynabook Tecra X50-F i7-8665U, UHD Graphics 620, 48 Wh | |
|---|---|---|---|---|---|---|
| Pil Çalışma Süresi | -6% | -7% | 24% | 19% | -37% | |
| Reader / Idle (h) | 14.8 | 12.6 -15% | 15.4 4% | 20.2 36% | 17.4 18% | 5.8 -61% |
| WiFi v1.3 (h) | 7.2 | 7.6 6% | 6.5 -10% | 9.1 26% | 7.2 0% | 4.6 -36% |
| Load (h) | 2 | 1.8 -10% | 1.7 -15% | 2.2 10% | 2.8 40% | 1.7 -15% |
Artılar
Eksiler
Karar

Core i7 CPU ile yapılandırıldığında, GeForce GPU, 1080p ekran, 8 GB RAM ve 500 GB HDD ile yapılandırıldığında ProBook 450 G7, HP.com'da yaklaşık 1200 USD fiyatla satılıyor. ProBook 455 G7'yi aynı özelliklere sahip ancak bunun yerine Ryzen 7 CPU ile yapılandırırken, sistem yalnızca yaklaşık 800 ABD Doları karşılığında perakende satış yapacaktı. Bu fiyatlar gelecekte çok iyi değişebilir, ancak mesaj net: Ryzen destekli ProBook 455 G7, özellikle dolar başına performans açısından daha iyi bir sistem haline getirmek için hem daha hızlı hem de daha ucuz bir seçenek.Intel destekli ProBook 450 G7 hala satın almaya değer mi? Nvidia GeForce seçenekleri yalnızca, ihtiyacı olanlar için entegre AMD çözümünden daha hızlı grafik performansı sunan Intel SKU'larda mevcuttur. CUKUSA'daki gibi ProBook 450 G7'deki olası anlaşmalar da sistemi dikkate almaya değer kılabilir. Aksi takdirde Intel, AMD'ye ve yükselen Ryzen alternatiflerine karşı uzun bir yokuş yukarı savaşır.HP ProBook 450 G7, özel bir GeForce MX GPU dahil, ekonomik bir iş dizüstü bilgisayarı için birçok özelliği bir araya getirir. İkincisi, iş yükleriniz için önemsizse, ProBook 455 G7 hemen hemen her yönden üstün seçenek olacaktır.
HP ProBook 450 G7 8WC04UT
- 08/02/2020 v7 (old)
Allen Ngo
Price comparison

