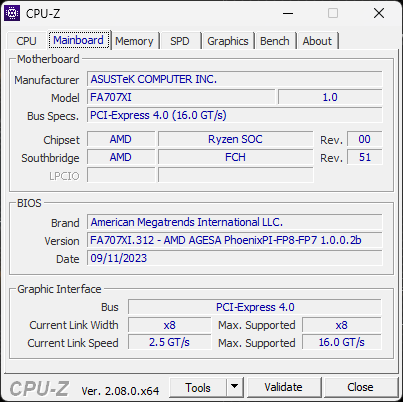
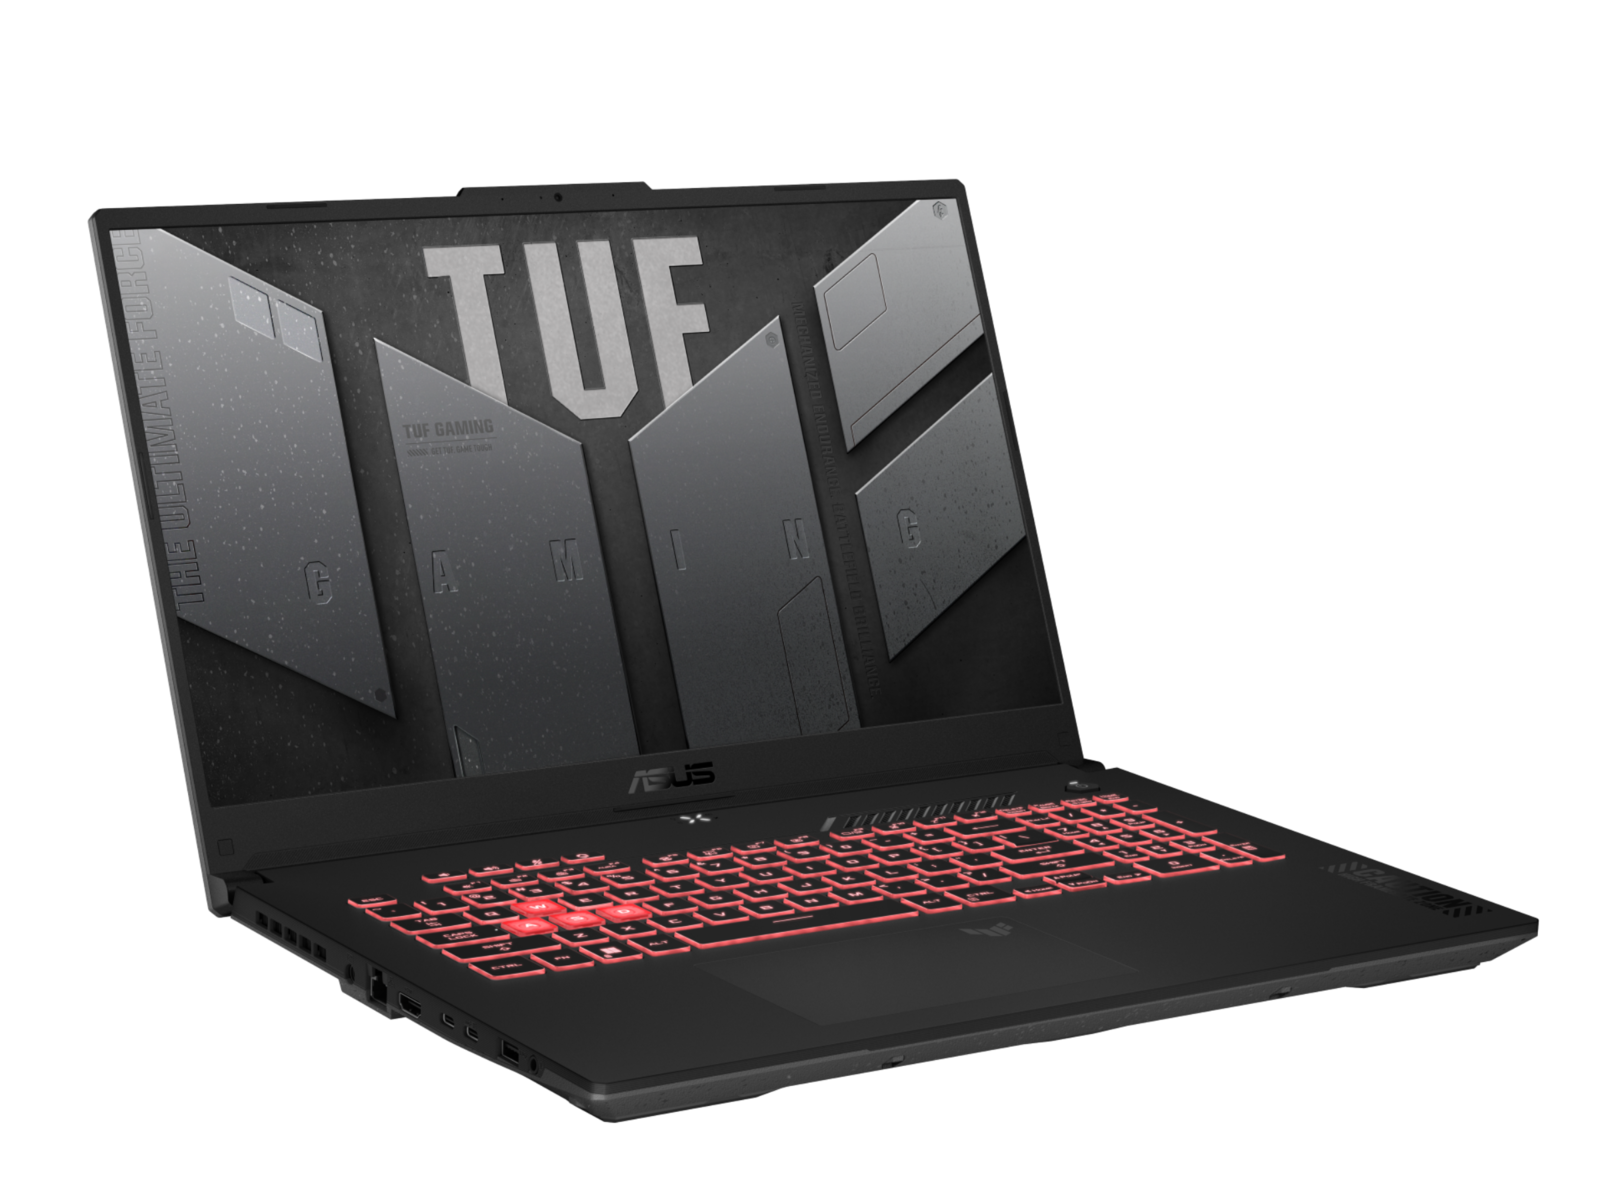
Asus TUF Gaming A17 FA707XI dizüstü bilgisayar incelemesi: 1400 dolara 140 W GeForce RTX 4070

Asus TUF Gaming A17 FA707, Intel tabanlı TUF Gaming F17 FX707'nin AMD versiyonudur. TUF serisi, daha pahalı ve üst düzey ROG serisine karşıt olarak orta seviye oyun dizüstü bilgisayarlarından oluşmaktadır.
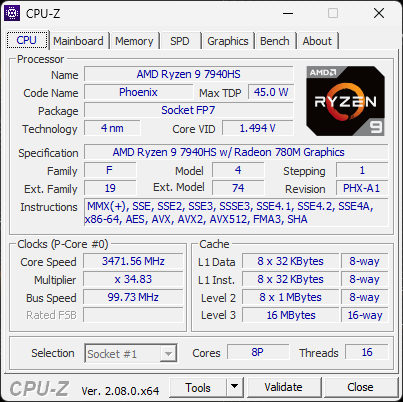
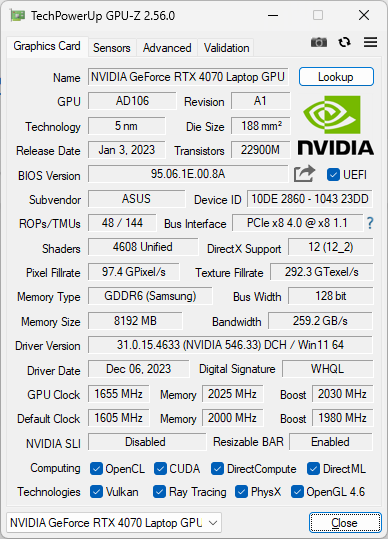
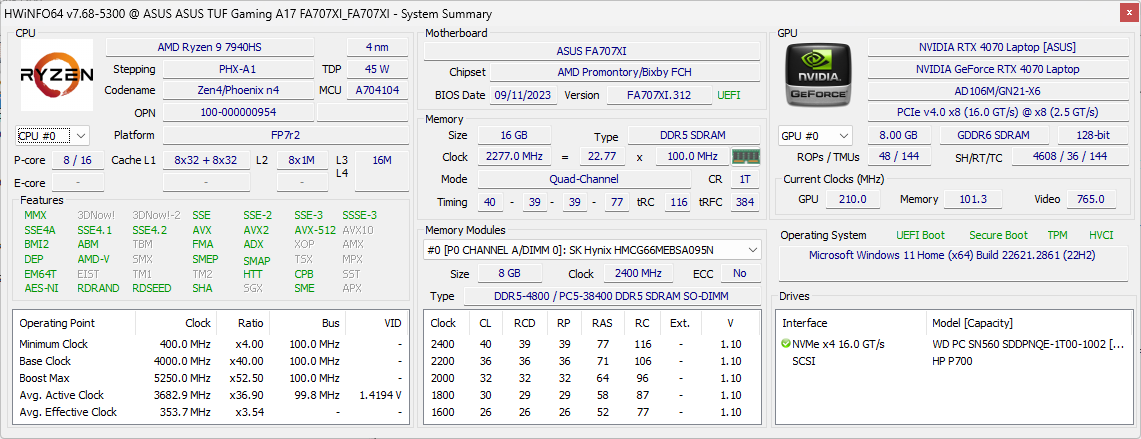
Konfigürasyonumuz Zen 4 Ryzen 9 7940HS CPU, 140 W GeForce RTX 4070 GPU ve 1080p 144 Hz IPS ekran ile yaklaşık 1400 USD perakende satış fiyatına sahip en yeni SKU'dur. Bu modelin diğer SKU'ları daha yavaş Ryzen 7 7735HS, GeForce RTX 4050 veya 4060 veya daha hızlı 240 Hz veya 360 Hz yenileme hızlarına sahip daha yüksek çözünürlüklü 1440p ekranla birlikte gönderilir.
TUF Gaming A17'nin alternatifleri arasında aşağıdaki gibi diğer orta seviye oyun dizüstü bilgisayarları bulunmaktadır MSI Pulse 17, HP Pavilion Gaming 17, Lenovo Legion 5 serisiveya Acer Nitro 17 serisi.
Daha fazla Asus incelemesi:
Karşılaştırmalı olarak olası rakipler
Derecelendirme | Tarih | Modeli | Ağırlık | Yükseklik | Boyut | Çözünürlük | Fiyat |
|---|---|---|---|---|---|---|---|
| 85.6 % v7 (old) | 01/2024 | Asus TUF Gaming A17 FA707XI-NS94 R9 7940HS, GeForce RTX 4070 Laptop GPU | 2.5 kg | 25.4 mm | 17.30" | 1920x1080 | |
| 84.1 % v7 (old) | Asus TUF Gaming F17 FX707Z-HX011W i7-12700H, GeForce RTX 3060 Laptop GPU | 2.5 kg | 25 mm | 17.30" | 1920x1080 | ||
| 86.3 % v7 (old) | 04/2023 | MSI Pulse 17 B13VGK i7-13700H, GeForce RTX 4070 Laptop GPU | 2.7 kg | 27.2 mm | 17.30" | 1920x1080 | |
| 82.1 % v7 (old) | 06/2023 | MSI Katana 17 B13VFK i7-13620H, GeForce RTX 4060 Laptop GPU | 2.8 kg | 25.2 mm | 17.30" | 1920x1080 | |
| 90.1 % v7 (old) | 02/2023 | Razer Blade 17 (i7-12800H, RTX 3070 Ti) i7-12800H, GeForce RTX 3070 Ti Laptop GPU | 2.8 kg | 19.9 mm | 17.30" | 2560x1440 | |
| 82.7 % v7 (old) | 10/2022 | HP Pavilion Gaming 17-cd2146ng i5-11300H, GeForce RTX 3050 Ti Laptop GPU | 2.8 kg | 25 mm | 17.30" | 1920x1080 |
Dava
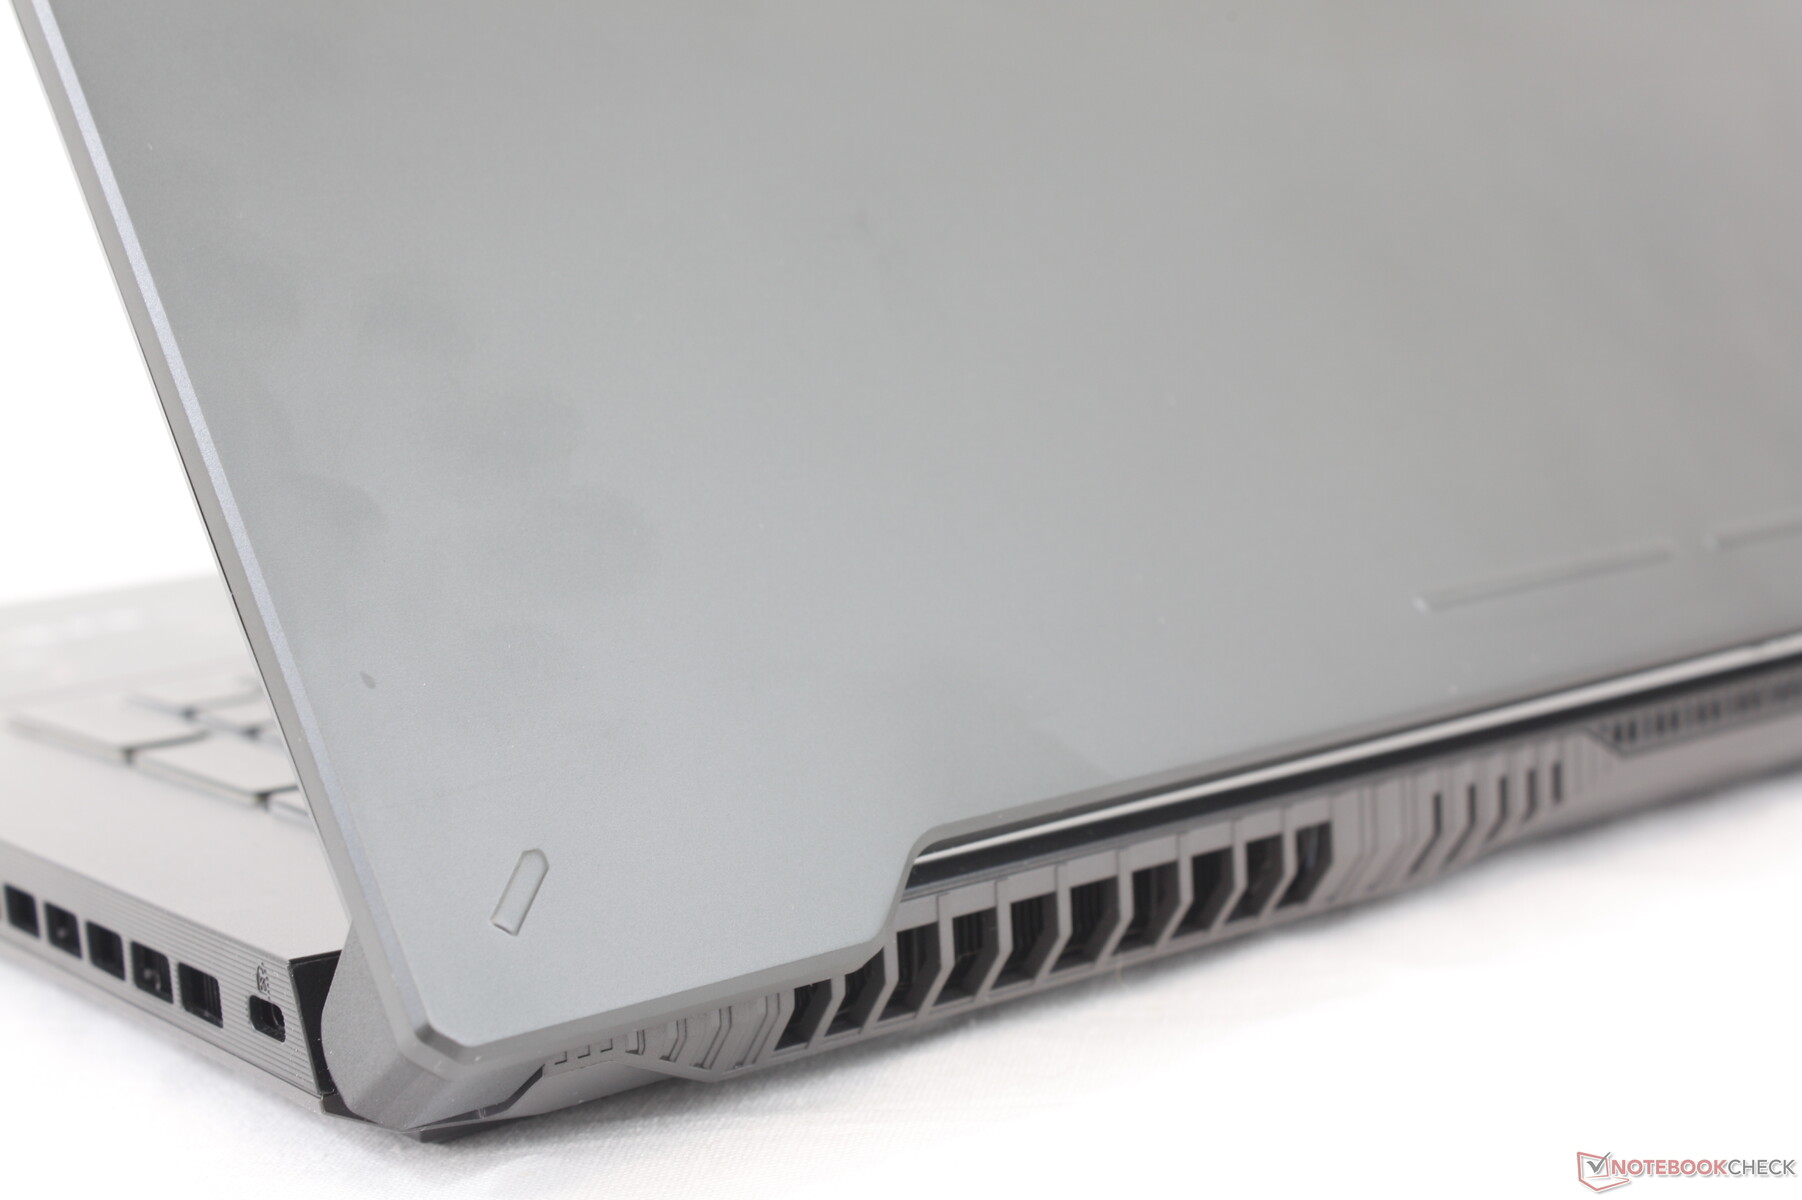
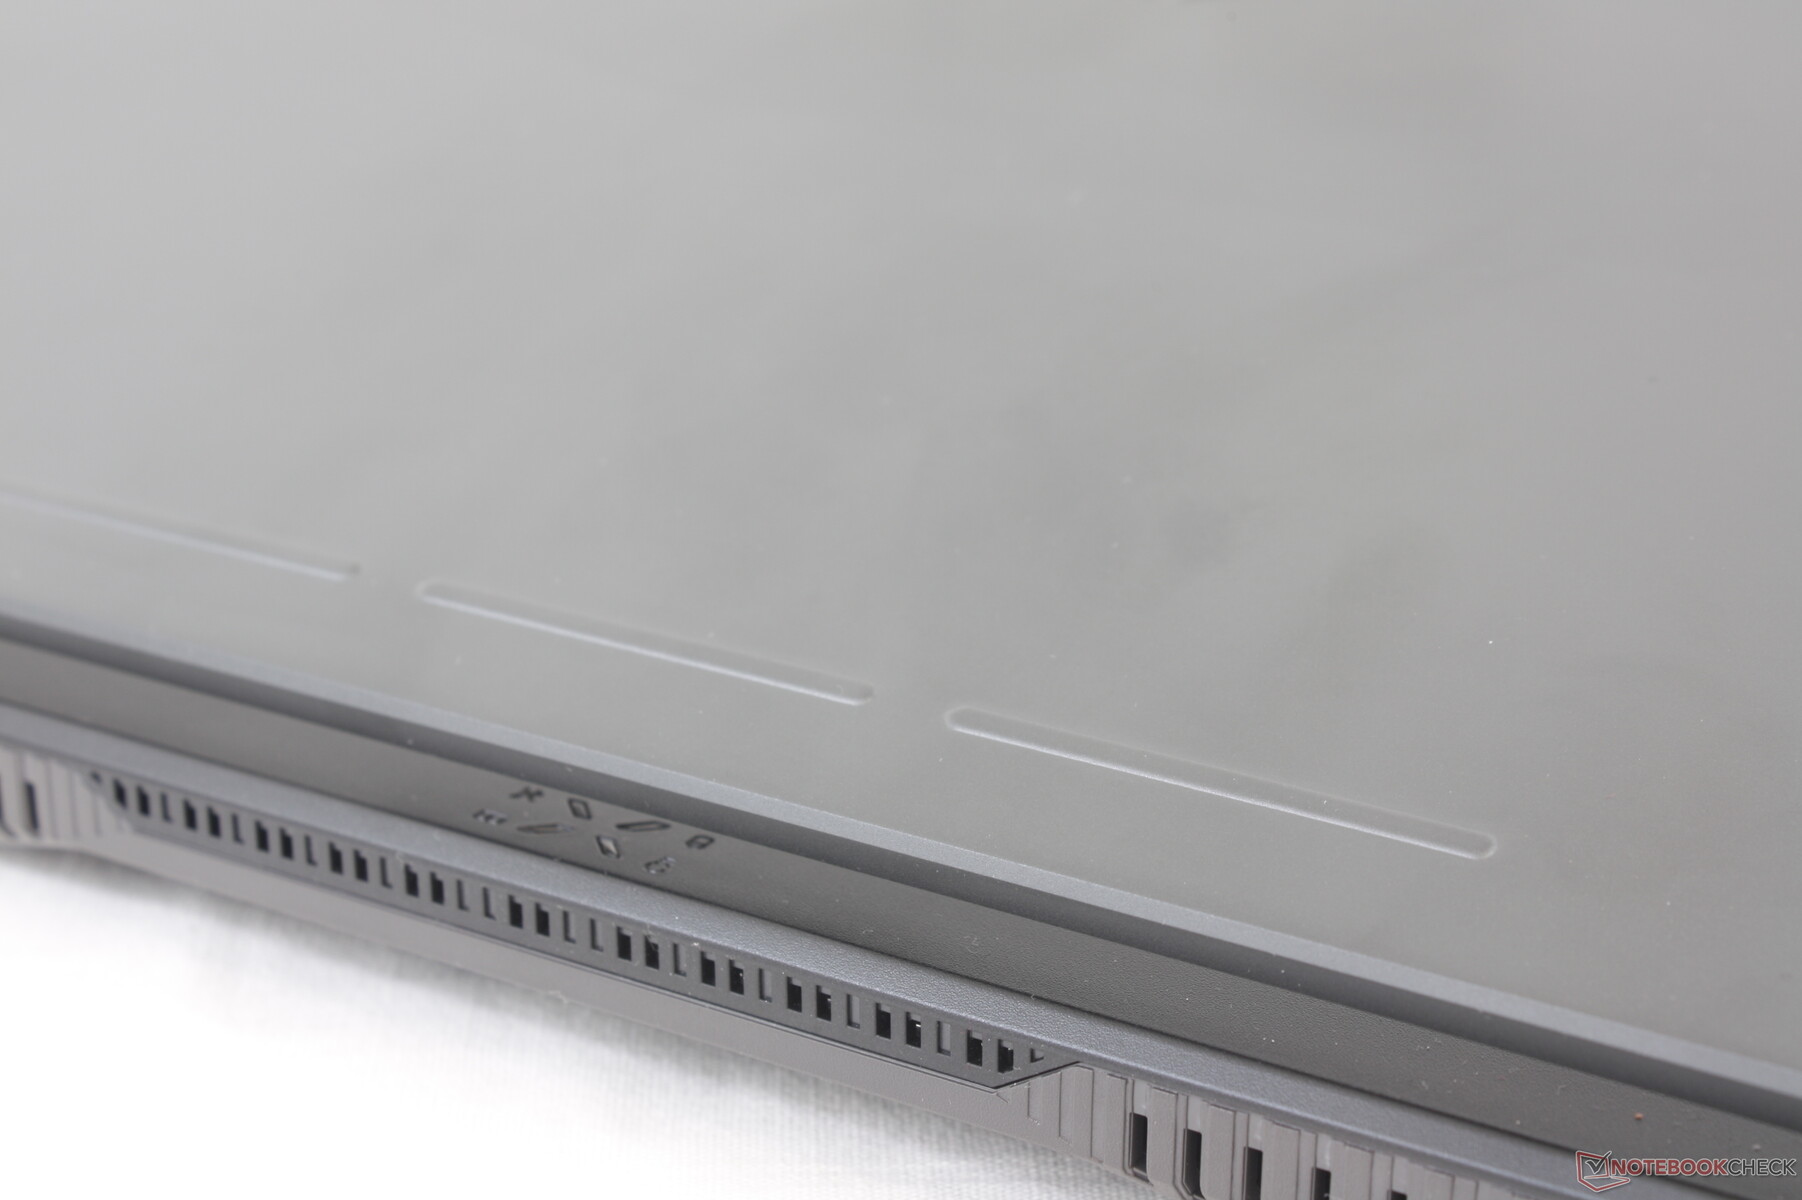
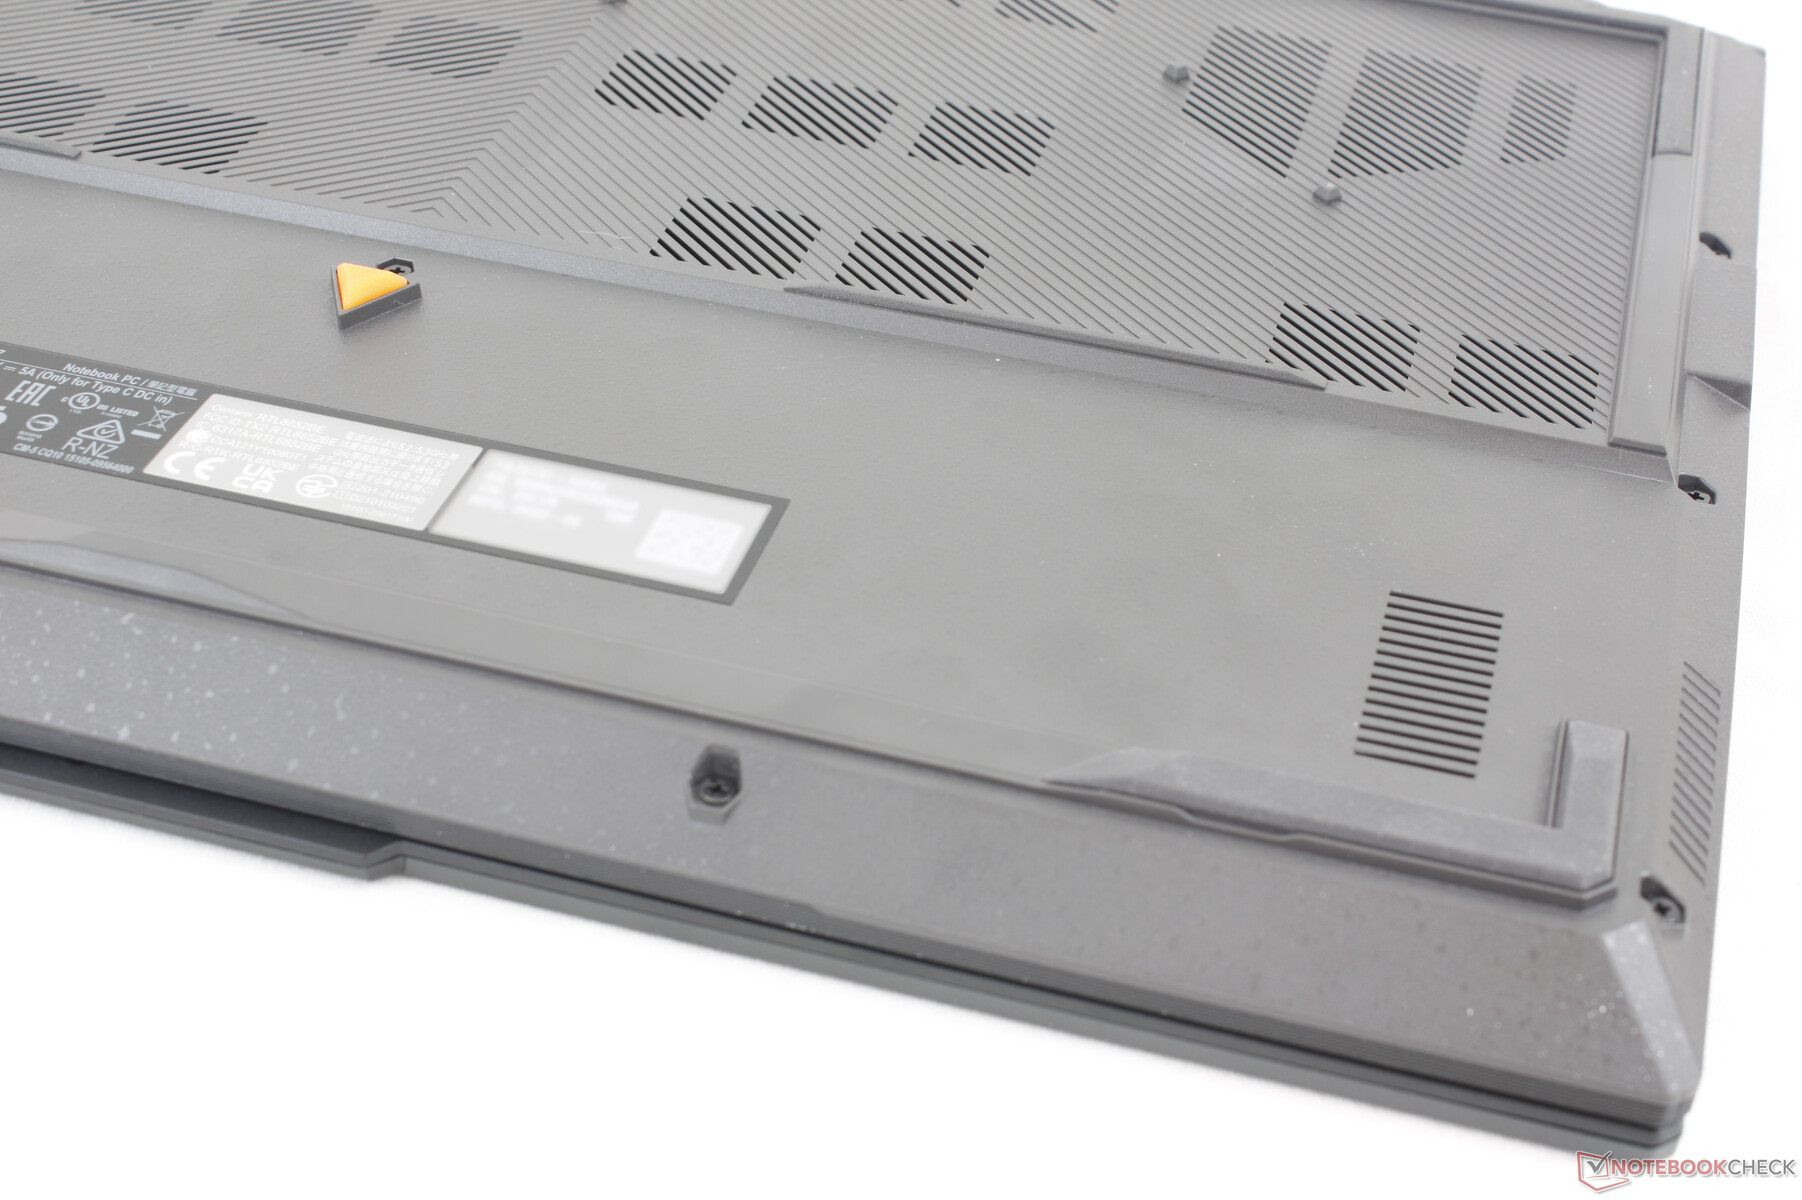
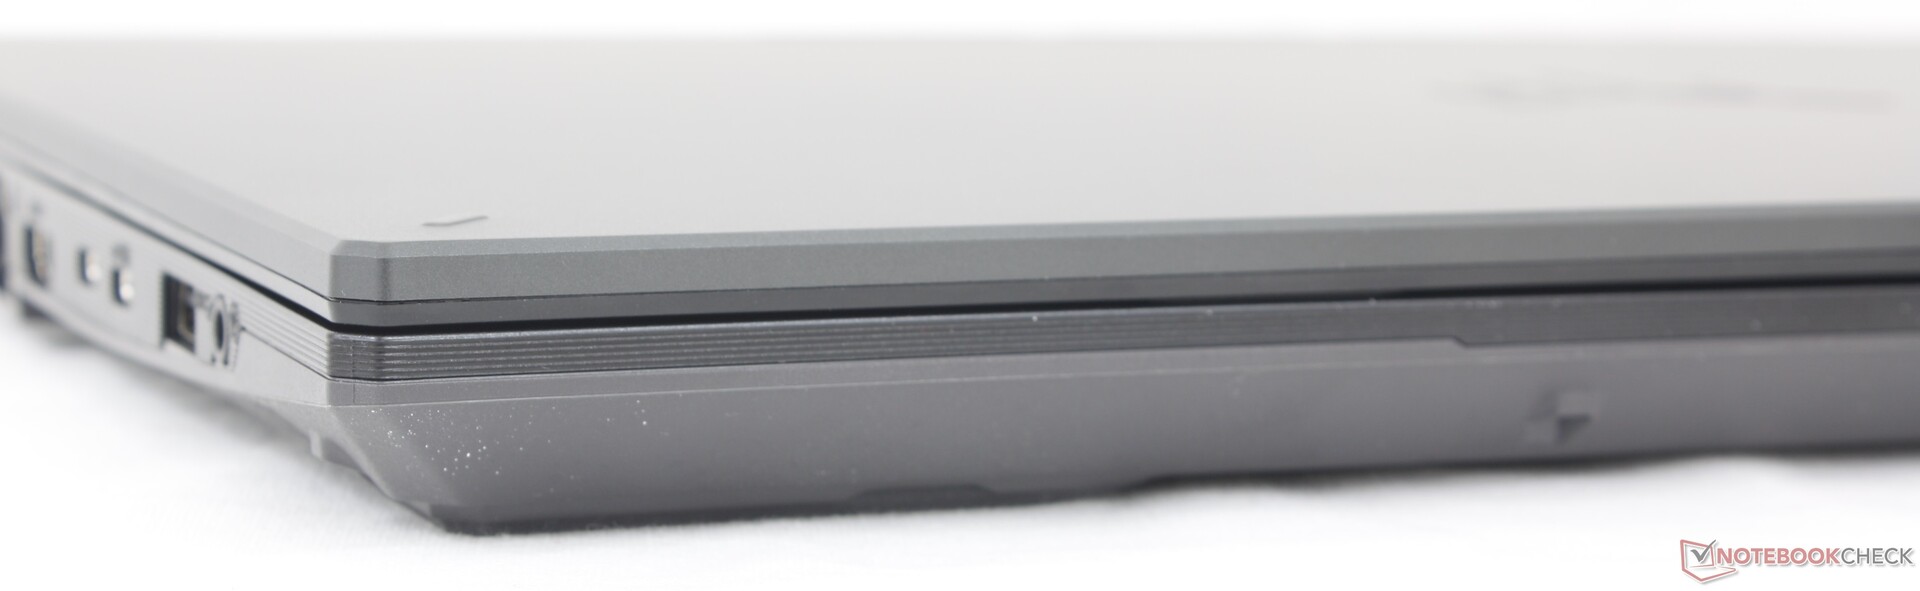
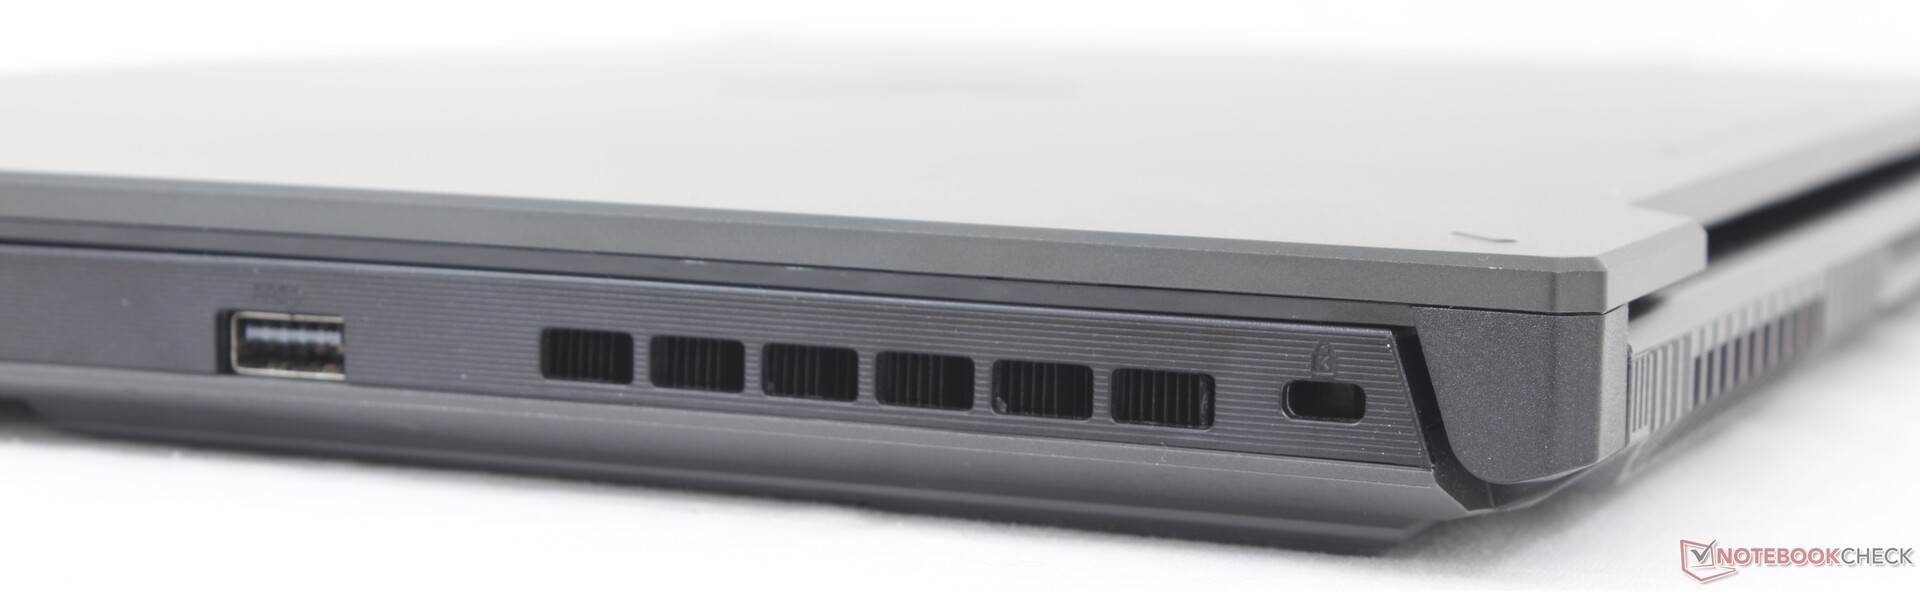
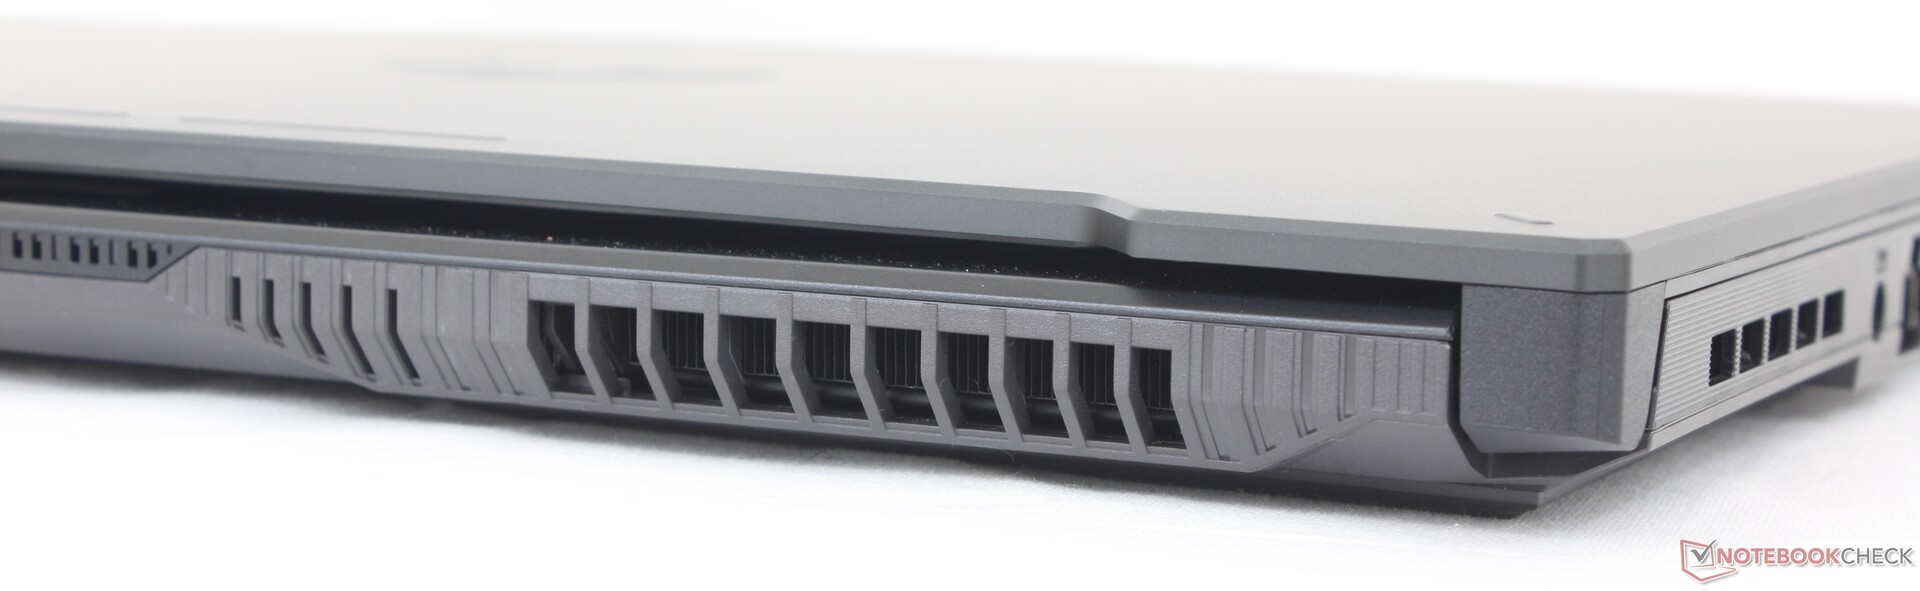
Şasi, büyük ölçüde, aşağıdaki modellerle aynıdır TUF Gaming F17 FX707 portların konumlandırılması ve sırasıyla dış kapak ve taban için metal ve plastik malzemeler dahil. Bununla birlikte, dış kapakta TUF Gaming A17'yi TUF Gaming F17'den görsel olarak ayırt etmeye yardımcı olacak küçük yüzeysel farklılıklar var. Örneğin F17'deki köşe daireleri artık diyagonal çizgiler. Ayrıca kapağın alt kenarı boyunca ek işaretler bulunurken, bunlar F17'de tamamen yok. Ters çevrildiğinde, kasanın altındaki kauçuk üçgen artık kırmızı yerine turuncu renktedir.
F17'nin yapı kalitesine ilişkin izlenimlerimiz Intel tabanlı F17 aMD tabanlı A17 için buraya başvurun.
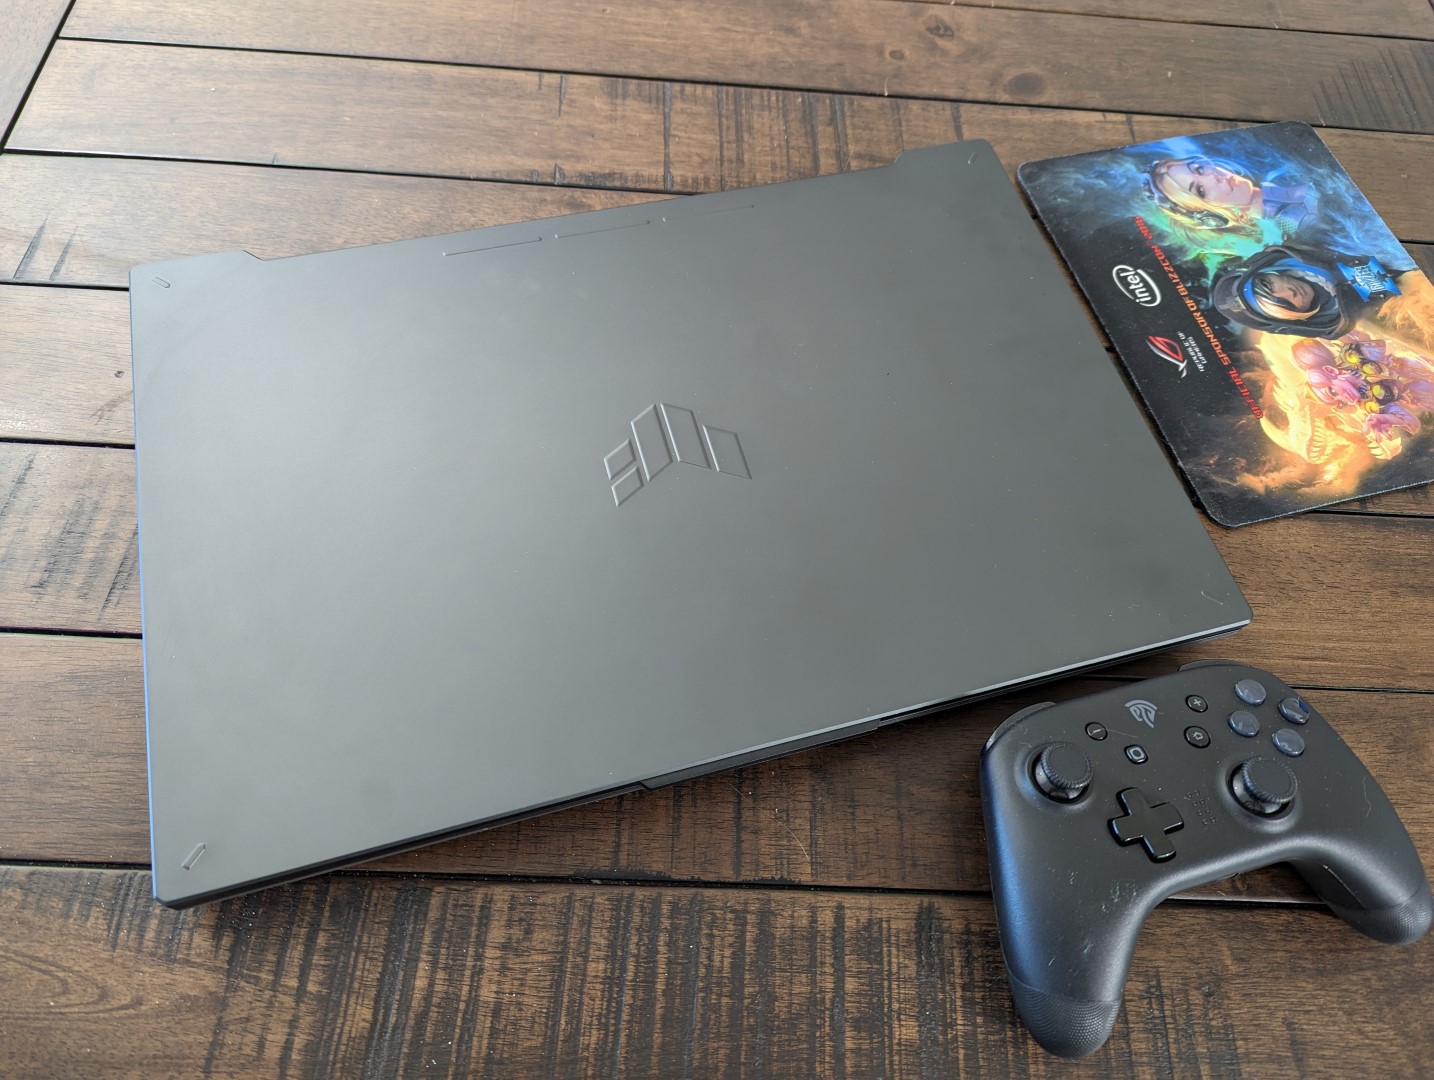
Heyecan verici olmayan görsel tasarımına rağmen TUF Gaming A17, diğer birçok orta seviye 17,3 inç oyun dizüstü bilgisayarından daha ince ve daha hafiftir HP Pavilion Gaming 17acer Nitro 17 veya MSI Pulse 17 modeline bağlı olarak her biri 200 ila 500 gram arasındadır. Bu farklar seyahat ederken fark edilebilecek kadar büyüktür ve bu nedenle Asus'un nispeten küçük boyutu belirgin bir avantaj olabilir.
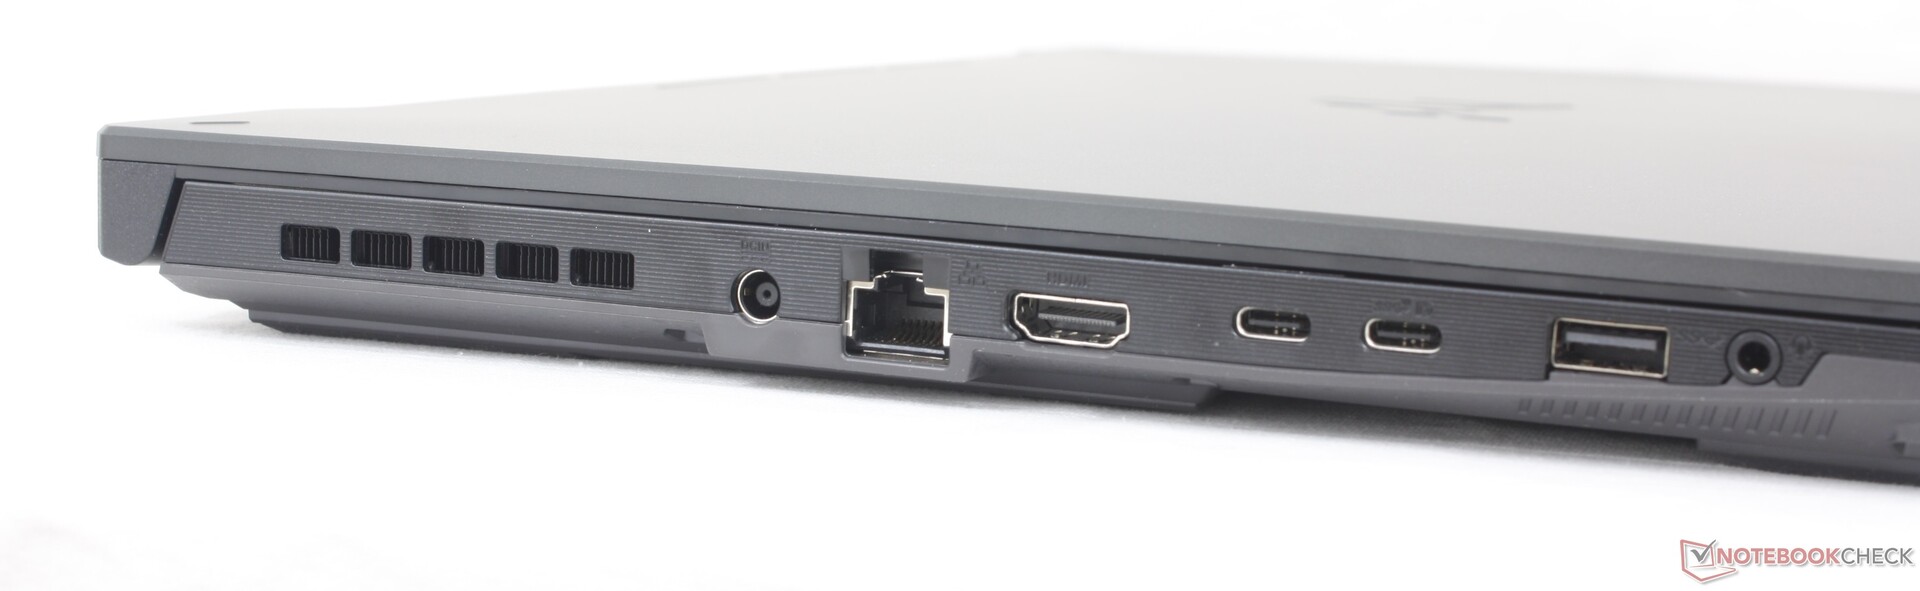
Bağlanabilirlik
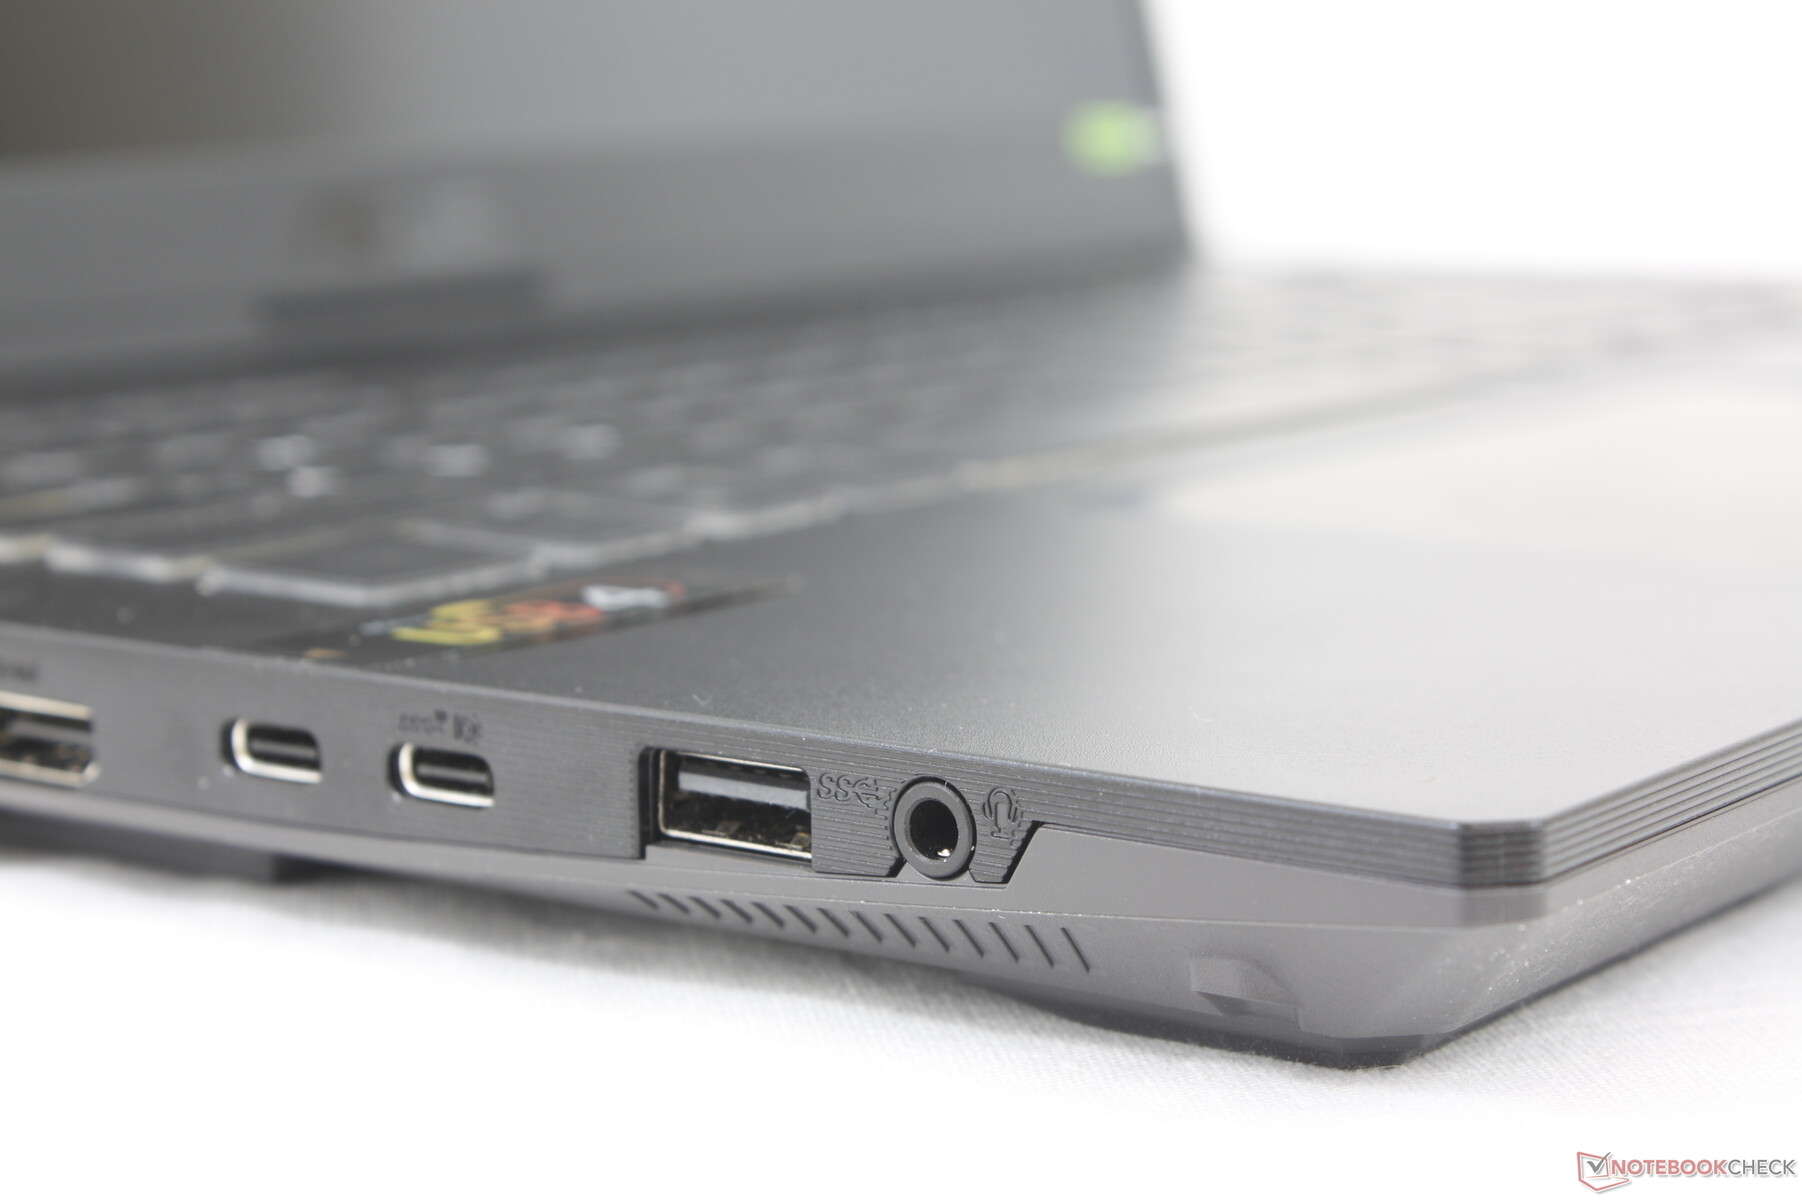
Modelimiz F17 FX707'de bulunan tüm bağlantı noktalarını koruyor ancak küçük bir istisna var: Thunderbolt 4 bağlantı noktası USB-C 4 ile değiştirildi. Çoğu Thunderbolt cihazı yine de USB4 ile uyumludur ve bu nedenle bu küçük fark kullanıcıların büyük çoğunluğunu etkilememelidir.
Sistemde iki USB-C bağlantı noktası olmasına rağmen, yalnızca ön kenara en yakın olanın USB-C AC adaptörleriyle uyumlu olduğunu unutmayın. Örneğin, 135 W USB-C Lenovo adaptörümüz Asus'u bir USB-C portu üzerinden şarj edebilirken diğerini şarj edemedi. Harici USB-C monitörleri desteklemek için sistemin dGPU modunda olması da gerekiyor.
İlginç bir şekilde, Asus her iki portun da uyumlu olması gerektiğini iddia etse de harici monitörümüz iki USB-C portundan yalnızca biriyle çalışıyordu.
İletişim
Wi-Fi 6 ve Bluetooth 5.3 bağlantısı için Realtek RTL8852BE standart olarak geliyor. Maliyetten tasarruf etmek için Wi-Fi 6E veya Intel AX serisi ile konfigürasyon bulunmamaktadır. Yine de Wi-Fi 6 ağımızla eşleştirildiğinde, beklenenden daha yavaş olmasına rağmen hiçbir bağlantı sorunu yaşamadık.
| Networking | |
| iperf3 transmit AX12 | |
| Asus TUF Gaming F17 FX707Z-HX011W | |
| iperf3 receive AX12 | |
| Asus TUF Gaming F17 FX707Z-HX011W | |
| iperf3 transmit AXE11000 | |
| MSI Katana 17 B13VFK | |
| MSI Pulse 17 B13VGK | |
| Asus TUF Gaming A17 FA707XI-NS94 | |
| iperf3 receive AXE11000 | |
| MSI Katana 17 B13VFK | |
| MSI Pulse 17 B13VGK | |
| HP Pavilion Gaming 17-cd2146ng | |
| Asus TUF Gaming A17 FA707XI-NS94 | |
| iperf3 transmit AXE11000 6GHz | |
| Razer Blade 17 (i7-12800H, RTX 3070 Ti) | |
| iperf3 receive AXE11000 6GHz | |
| Razer Blade 17 (i7-12800H, RTX 3070 Ti) | |
Web kamerası
Model, 1 MP veya 720p web kamerası içerirken, diğer oyun dizüstü bilgisayarlarının çoğu zaten 2 MP veya 1080p'ye geçmiştir. Hiç yoktan iyi olsa da, TUF Gaming A17'nin Zoom görüşmeleri için tasarlanmadığı açık.


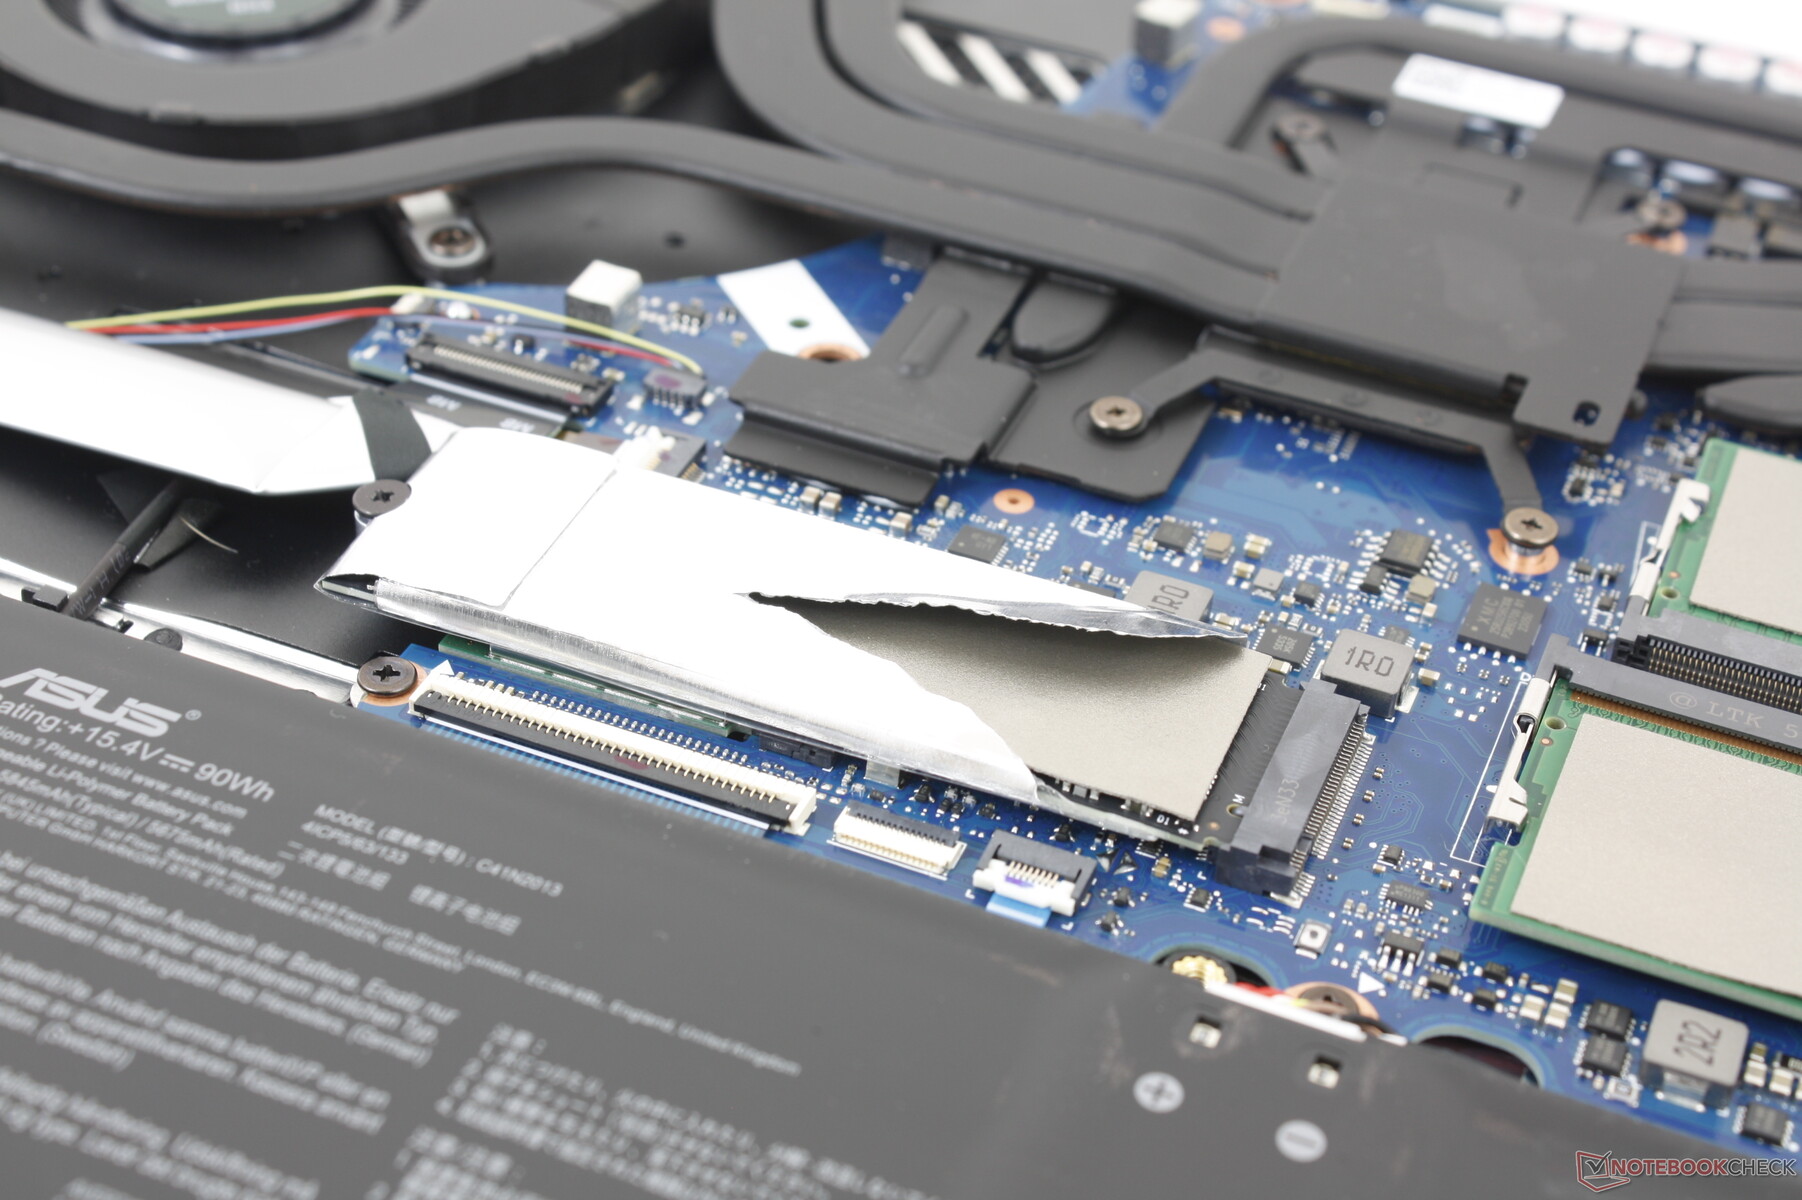
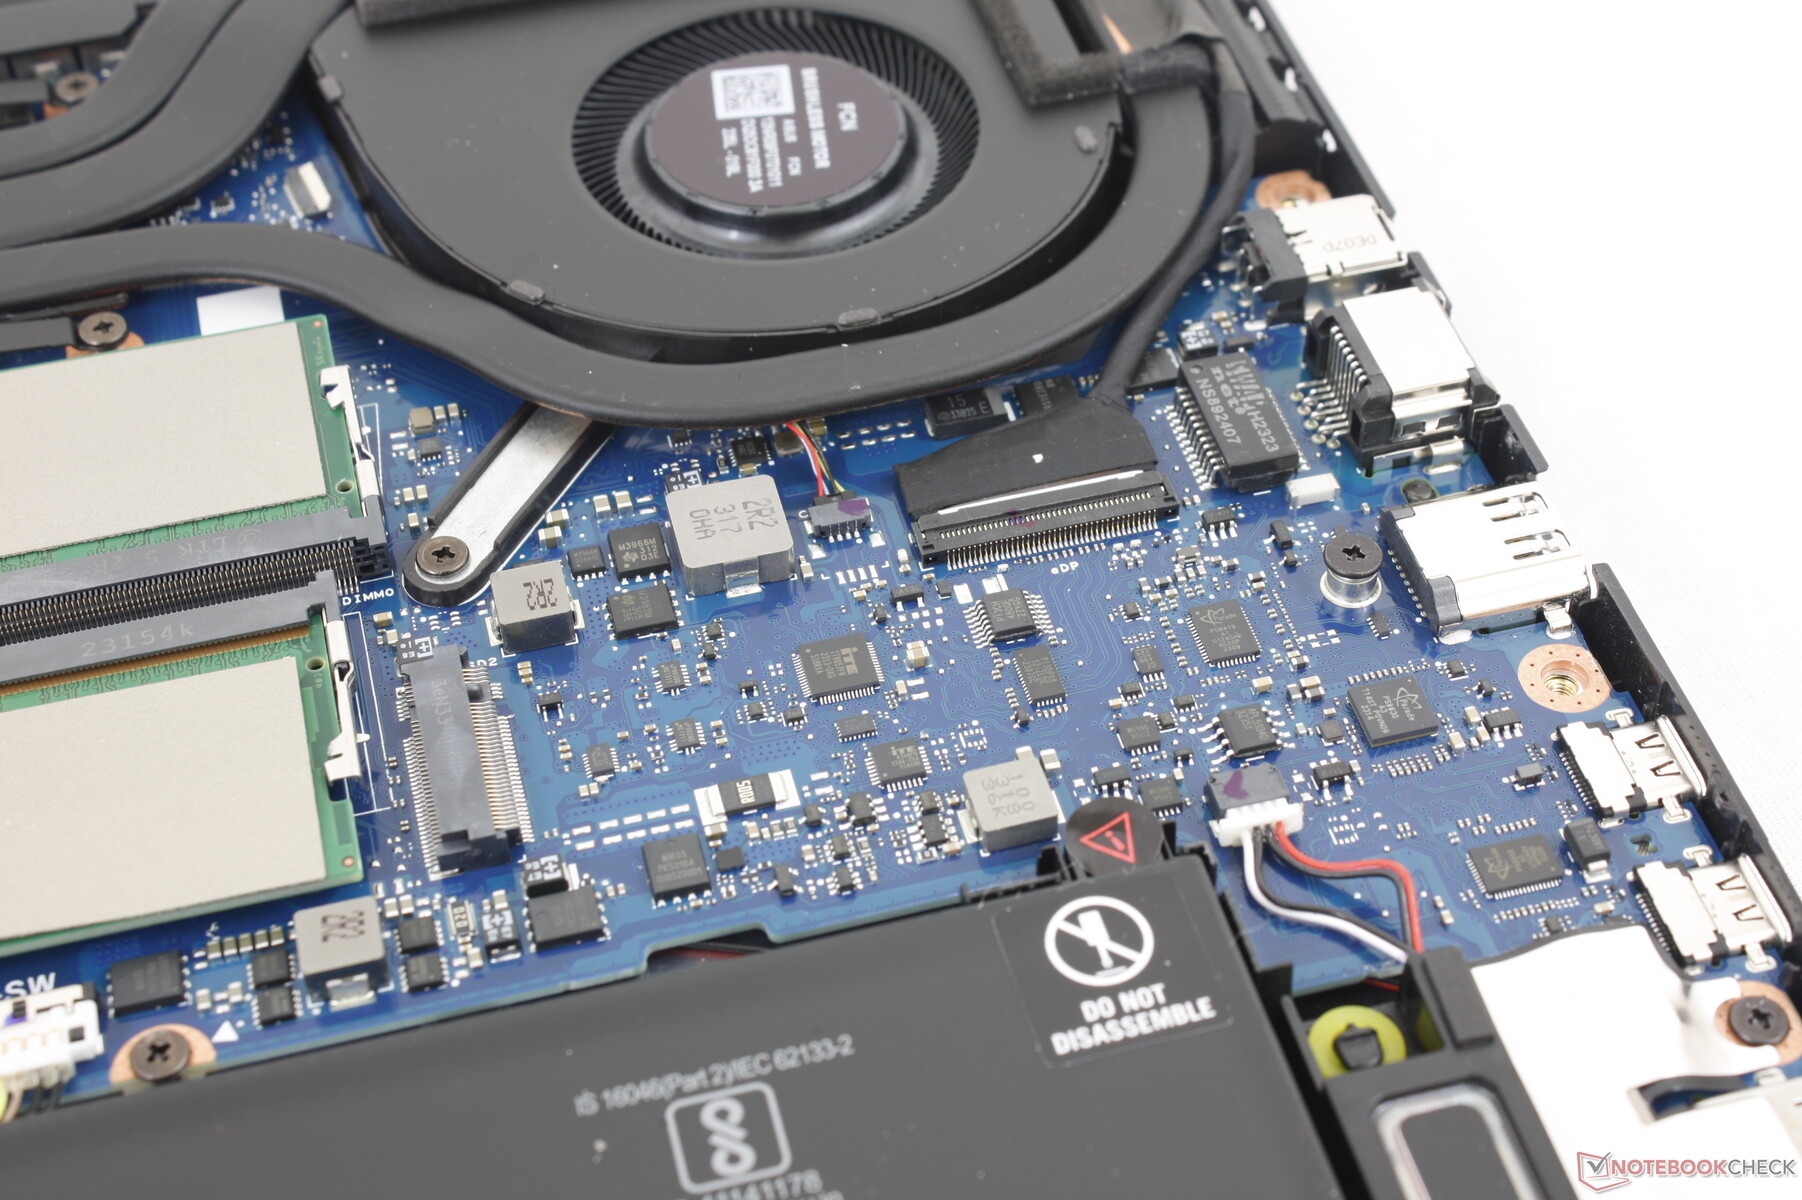
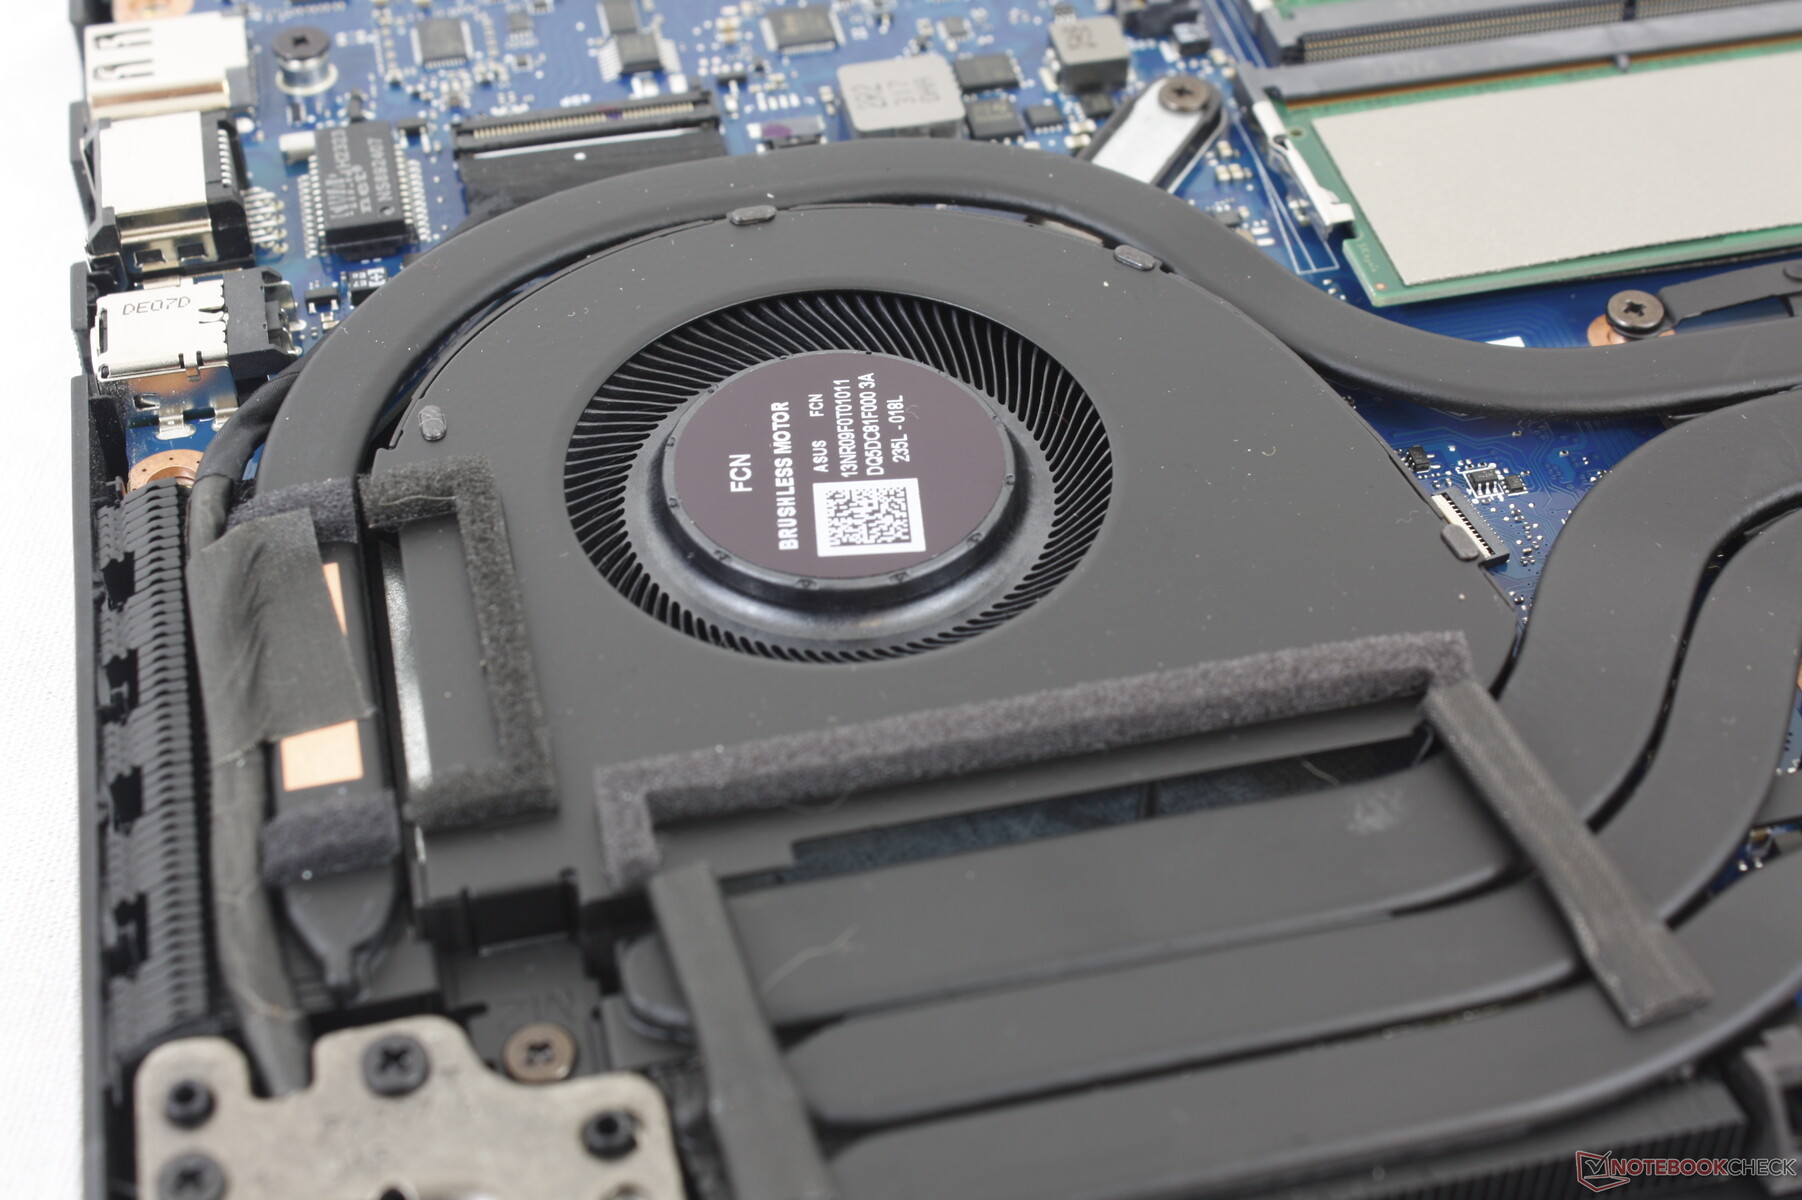
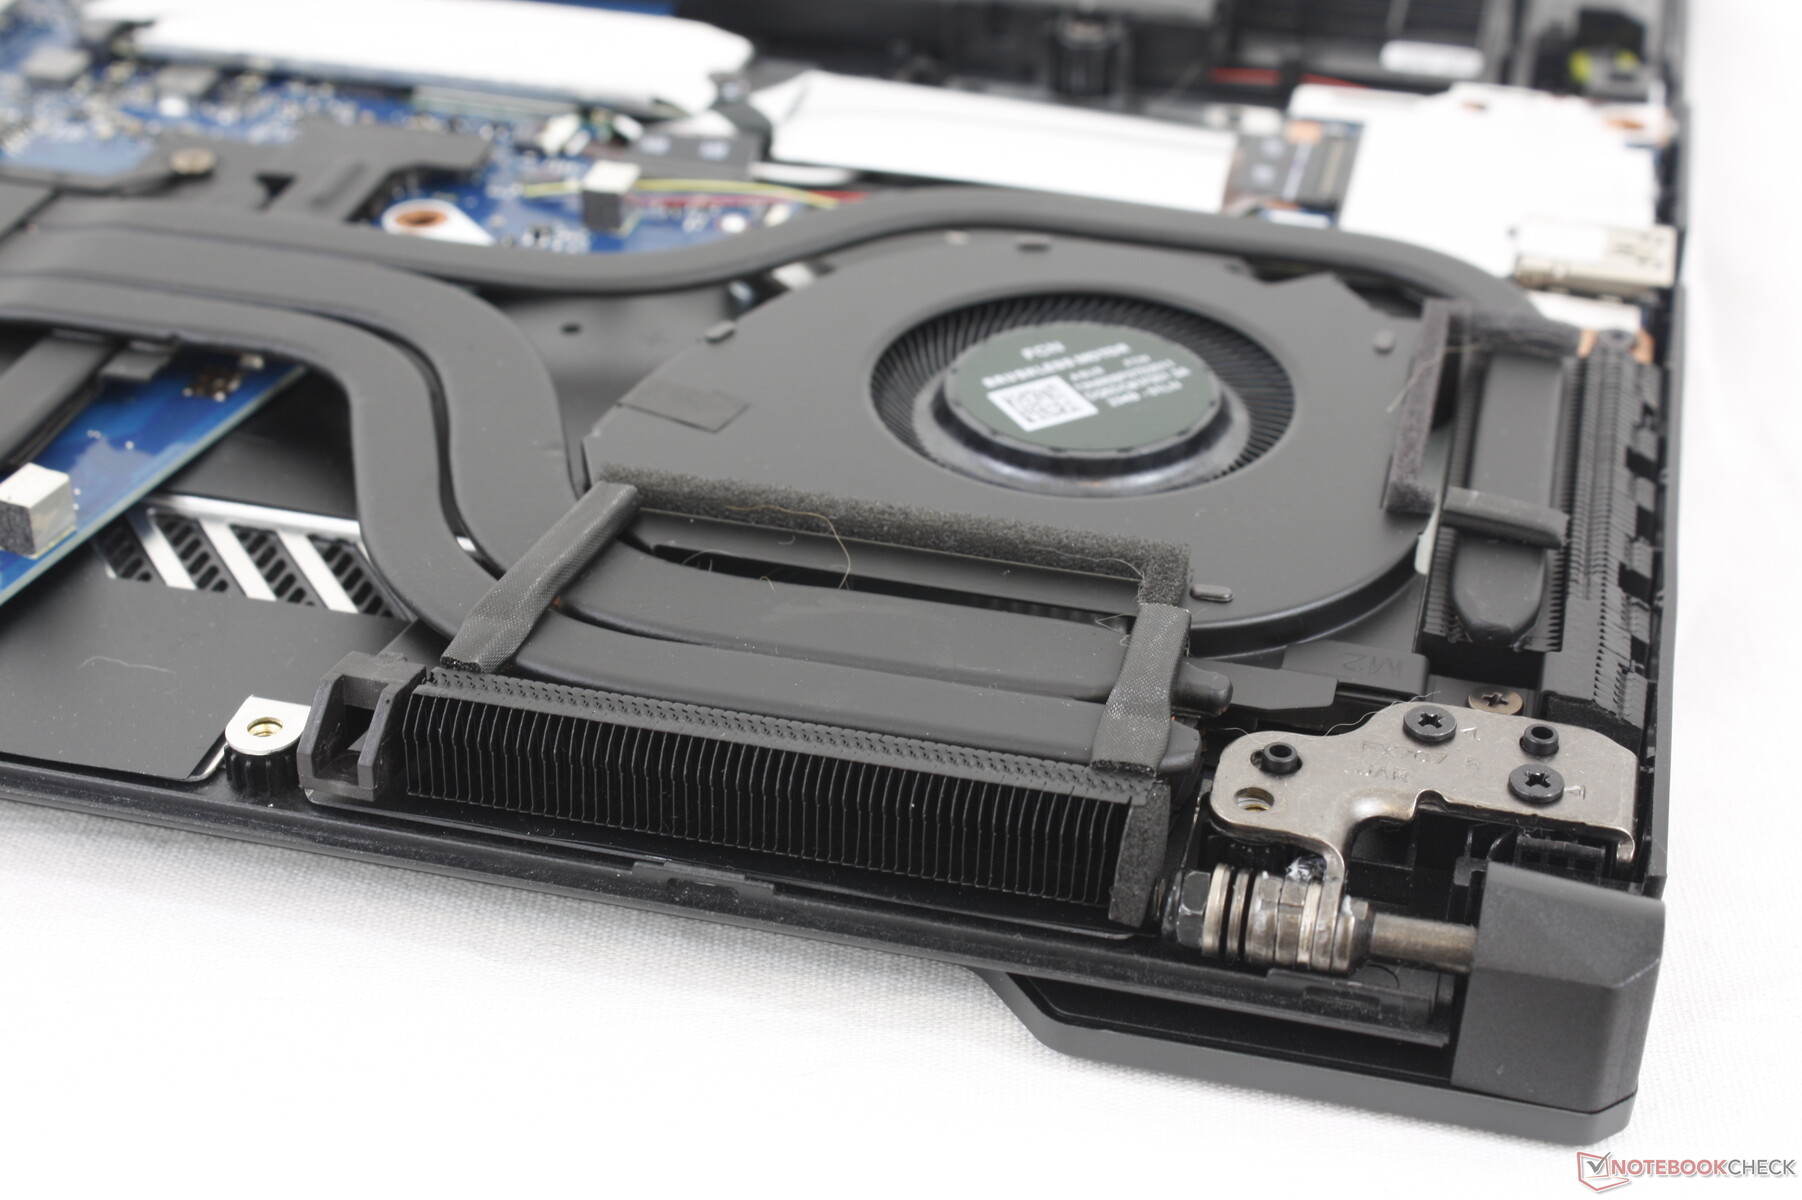
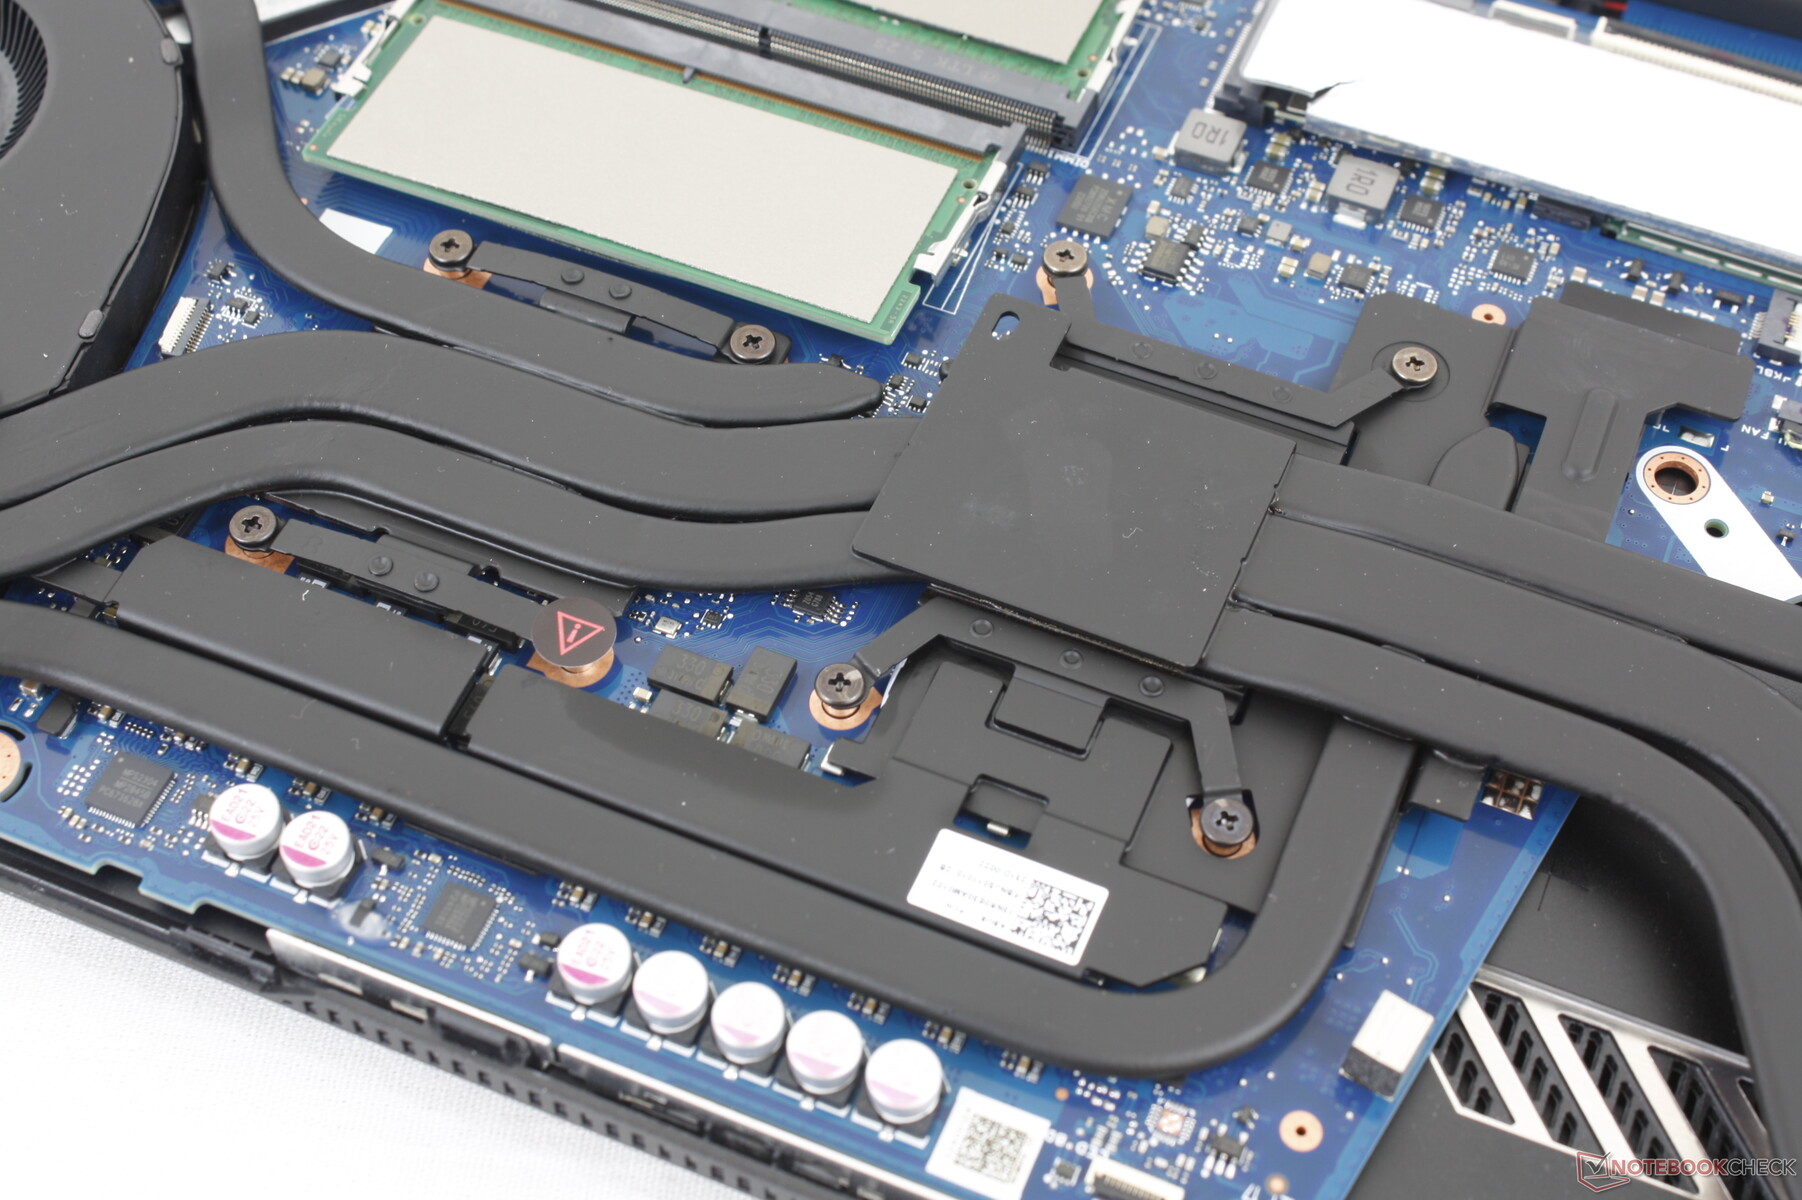
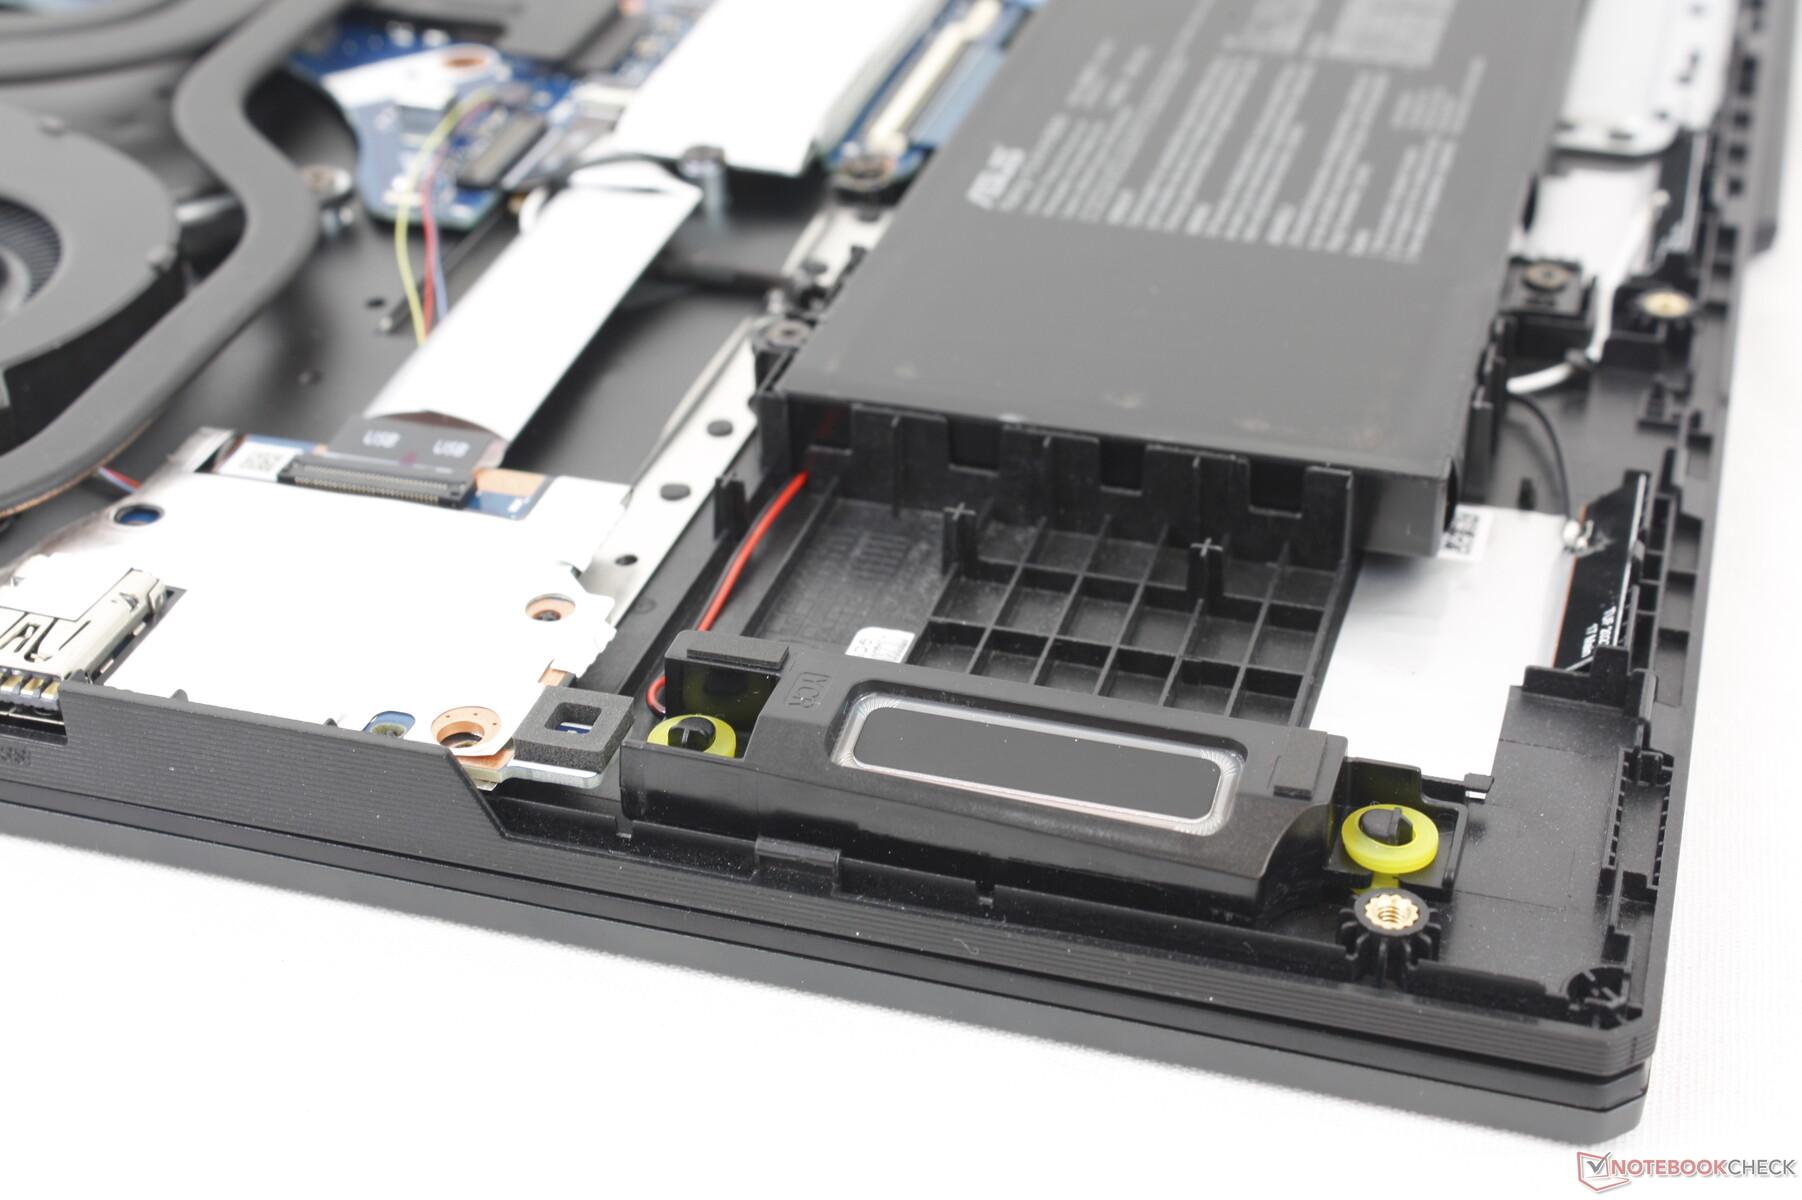
Bakım
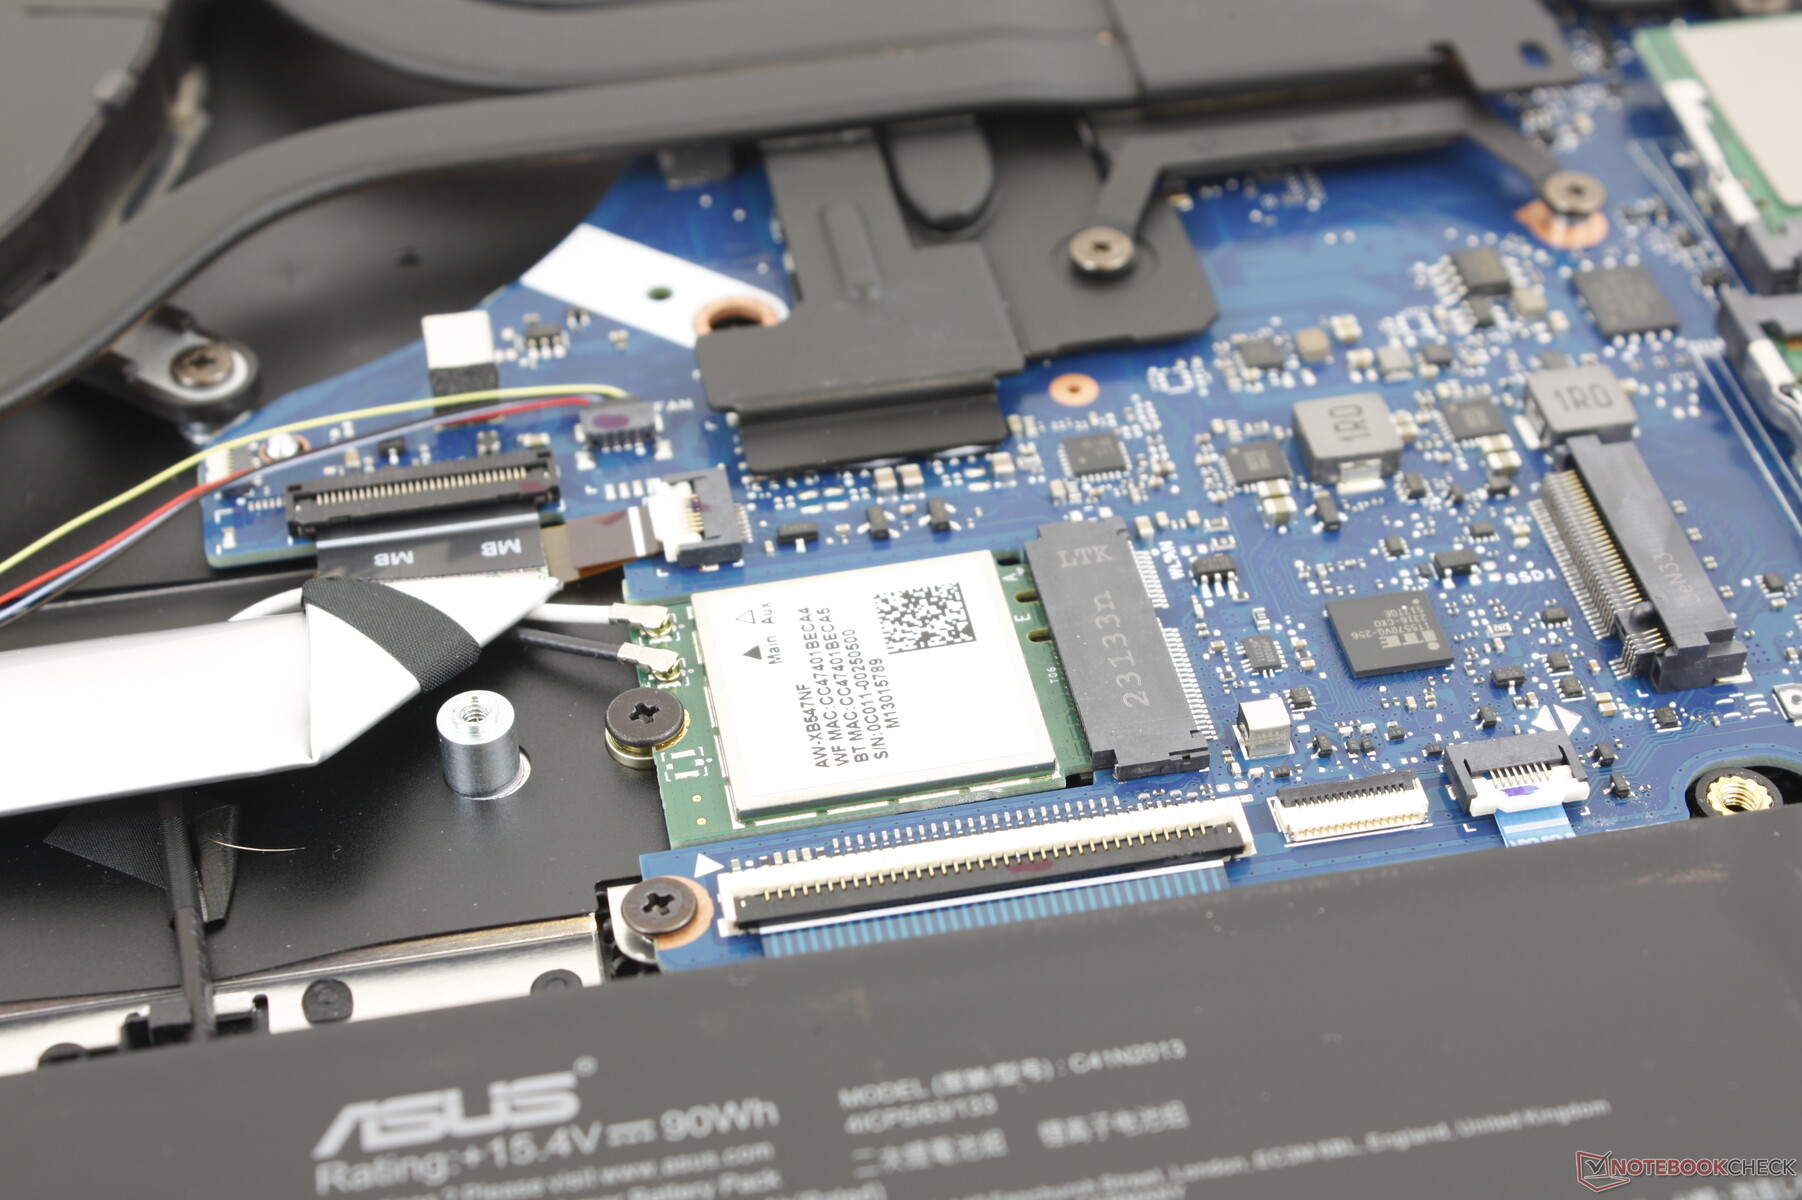
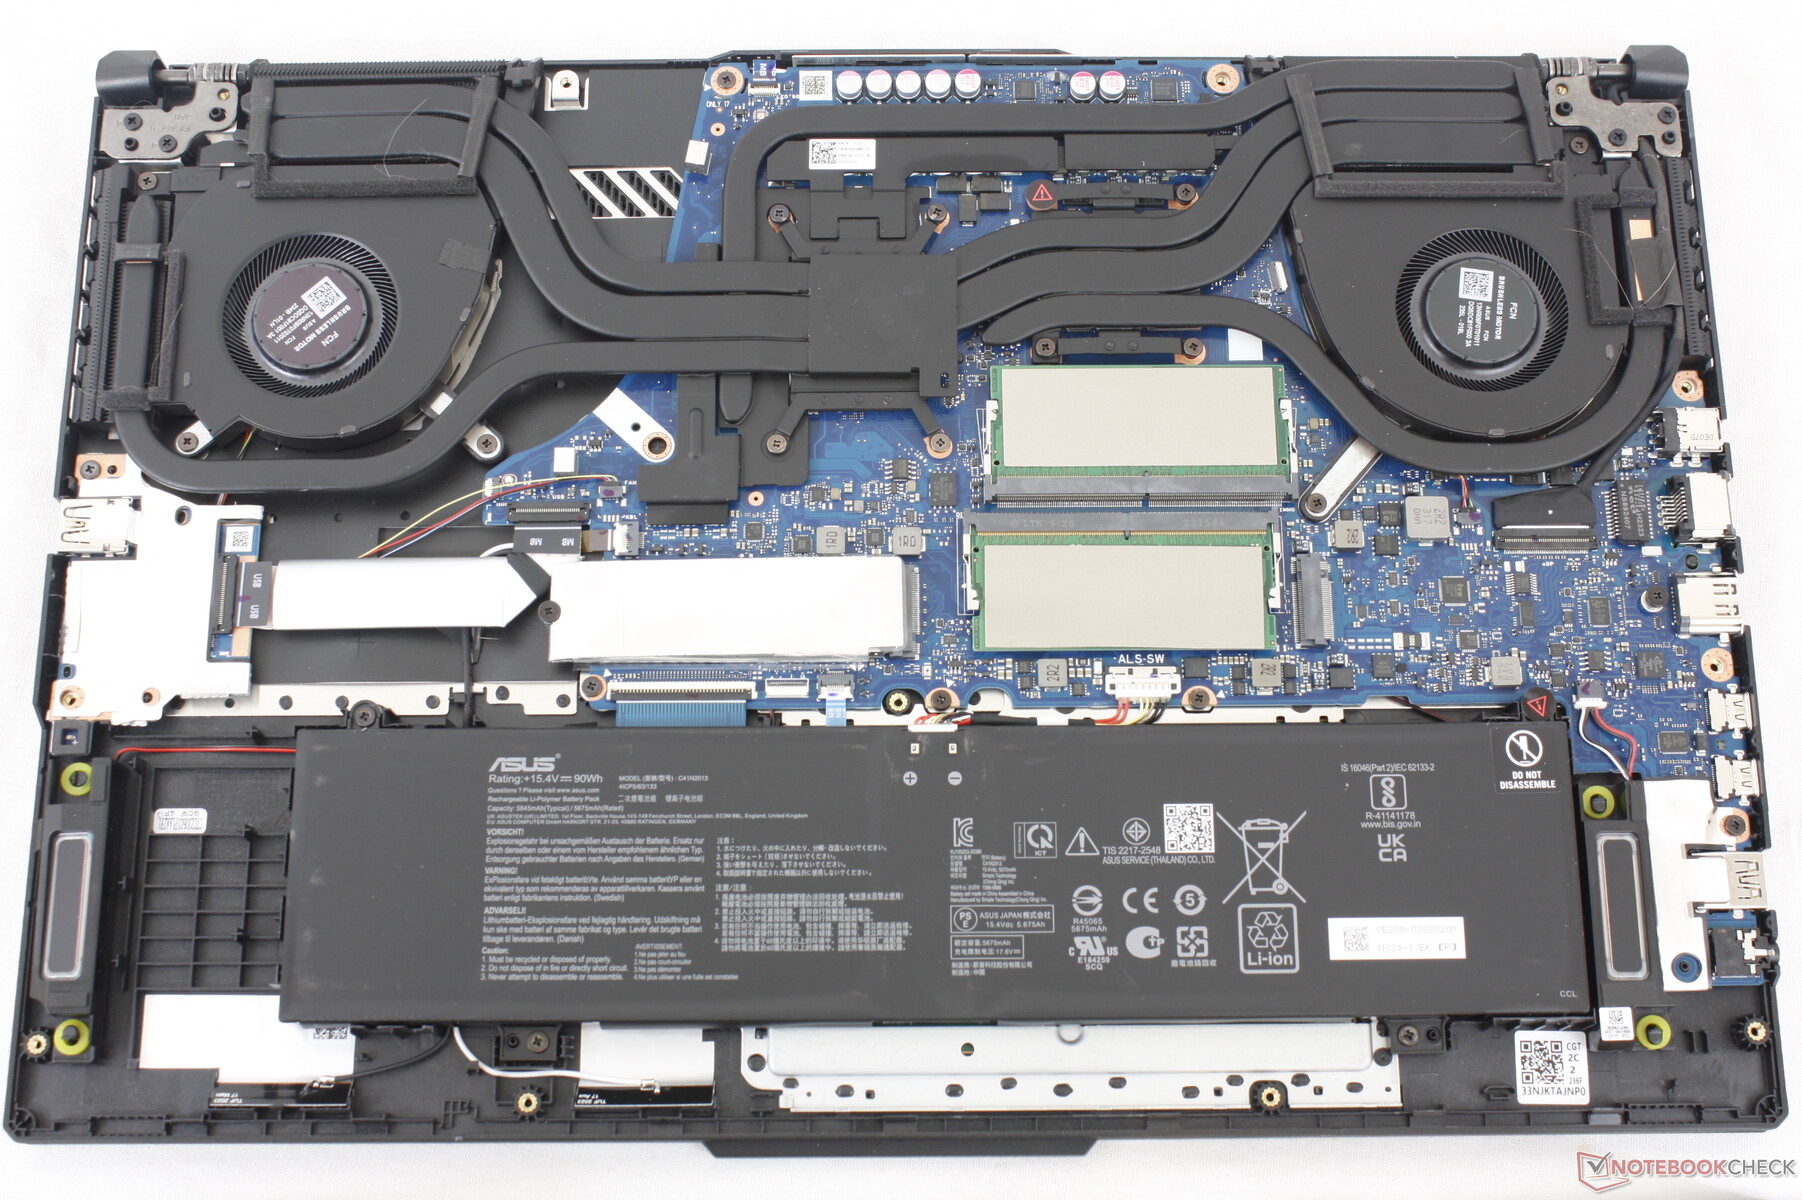
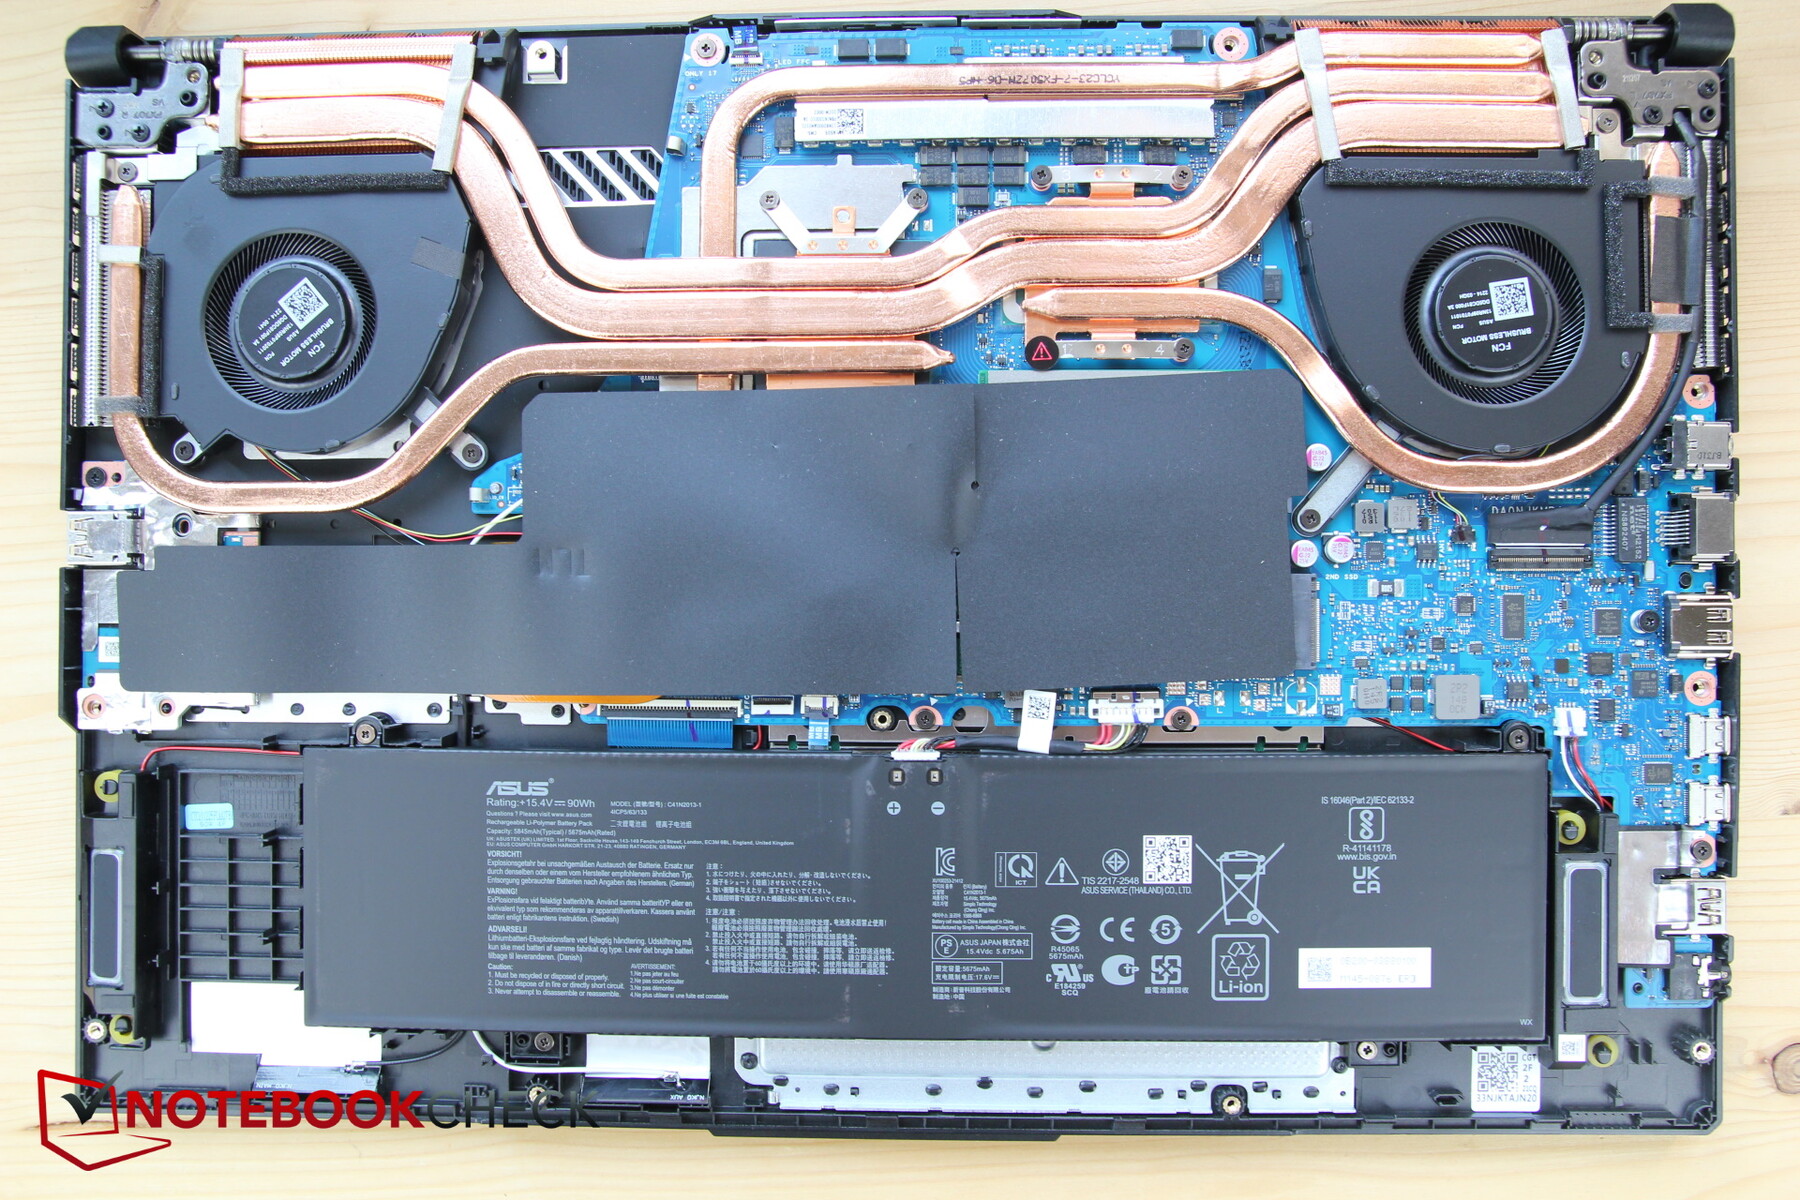
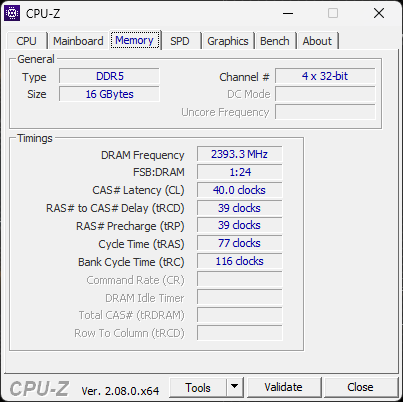
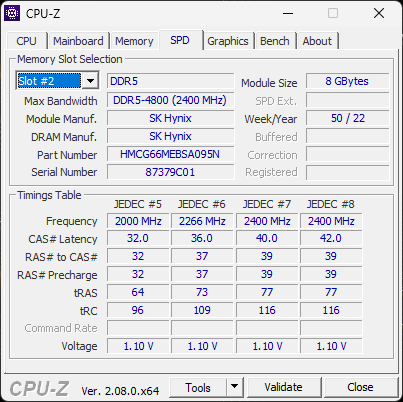
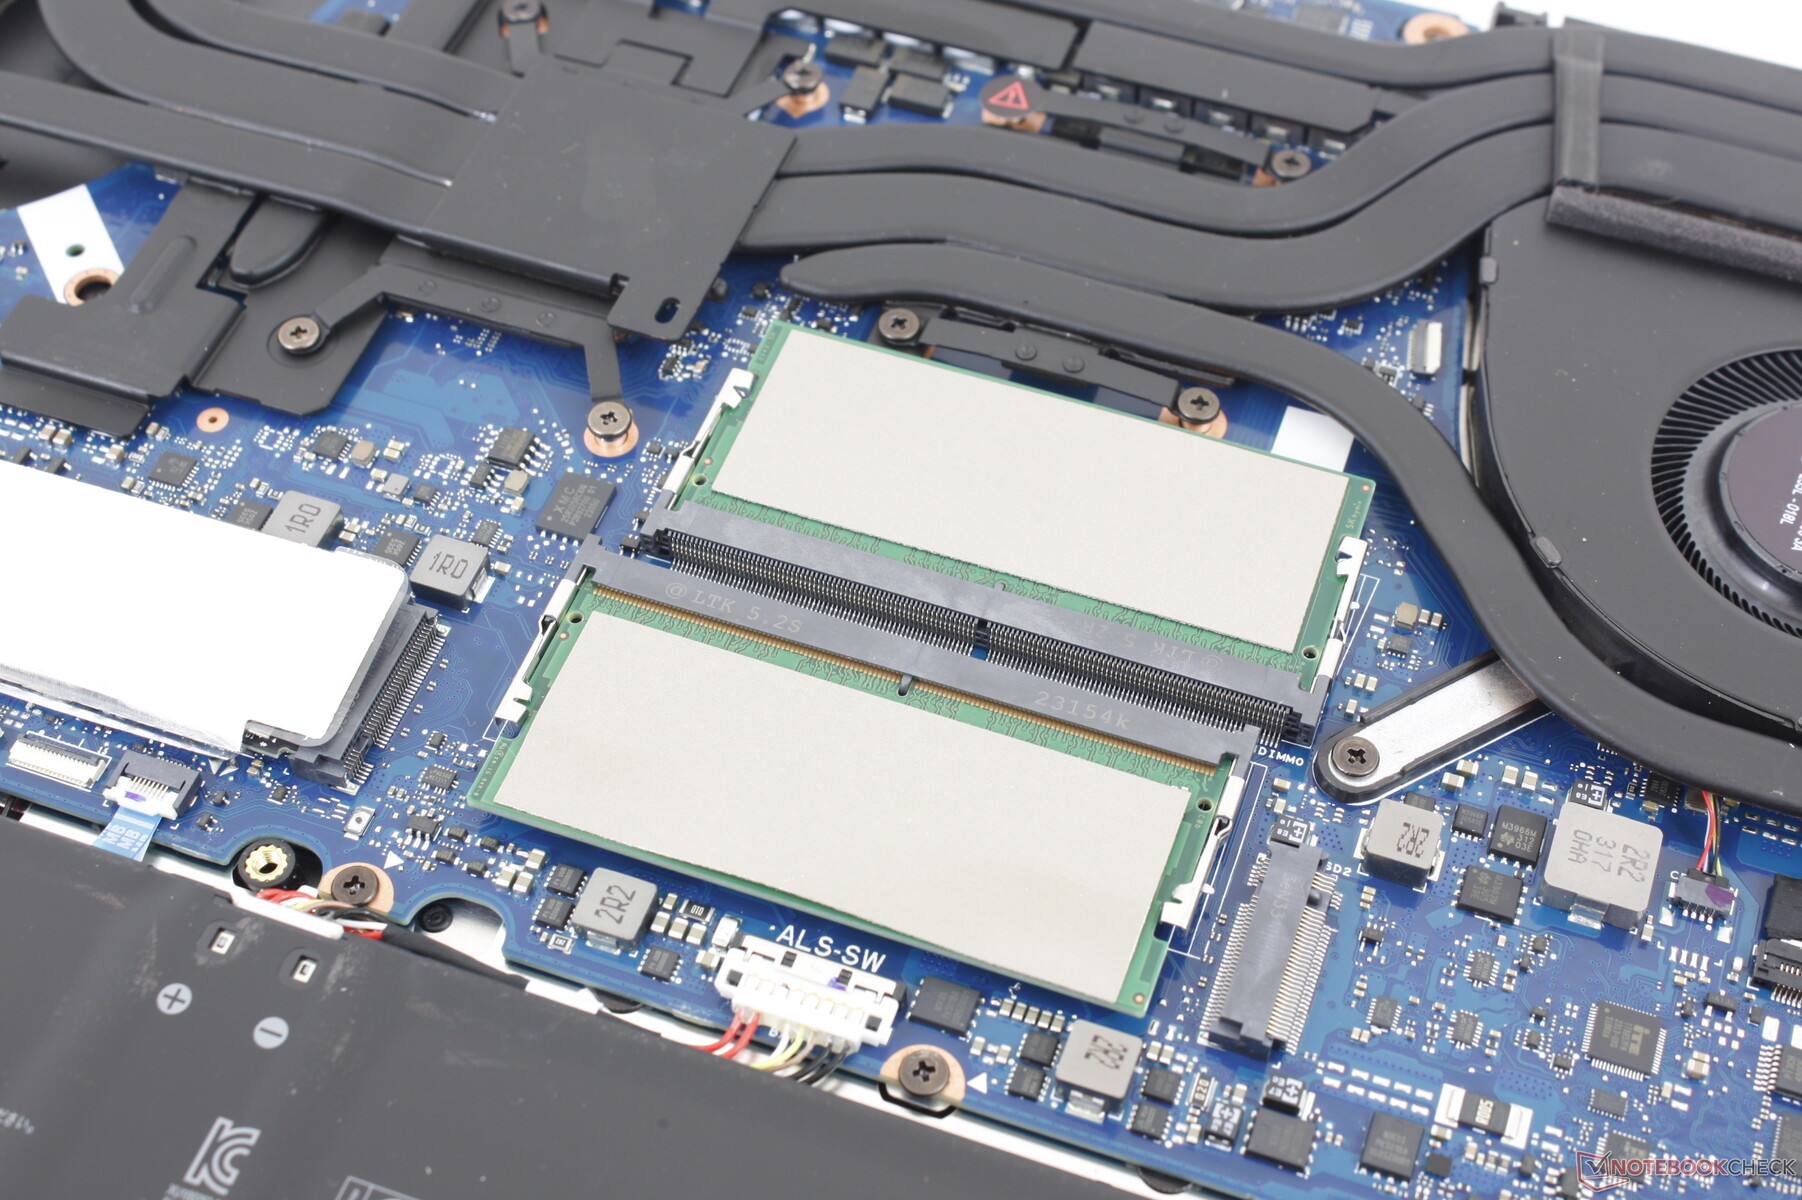
Alt panel, 12 Phillips vidasını çıkardıktan sonra nispeten kolay bir şekilde açılır. Intel ve AMD versiyonları arasında önemli bir iç fark yoktur ve bu nedenle kullanıcılar yine de iki M.2 SSD yuvası ve iki SODIMM yuvasına sahip olurlar. RAM 4800 MHz ile sınırlıdır.
Aksesuarlar ve Garanti
Kutuda AC adaptörü ve evraklar dışında ekstra bir şey yoktur. ABD'de satın alındıysa normal bir yıllık sınırlı garanti geçerlidir.
Giriş Aygıtları
Klavye
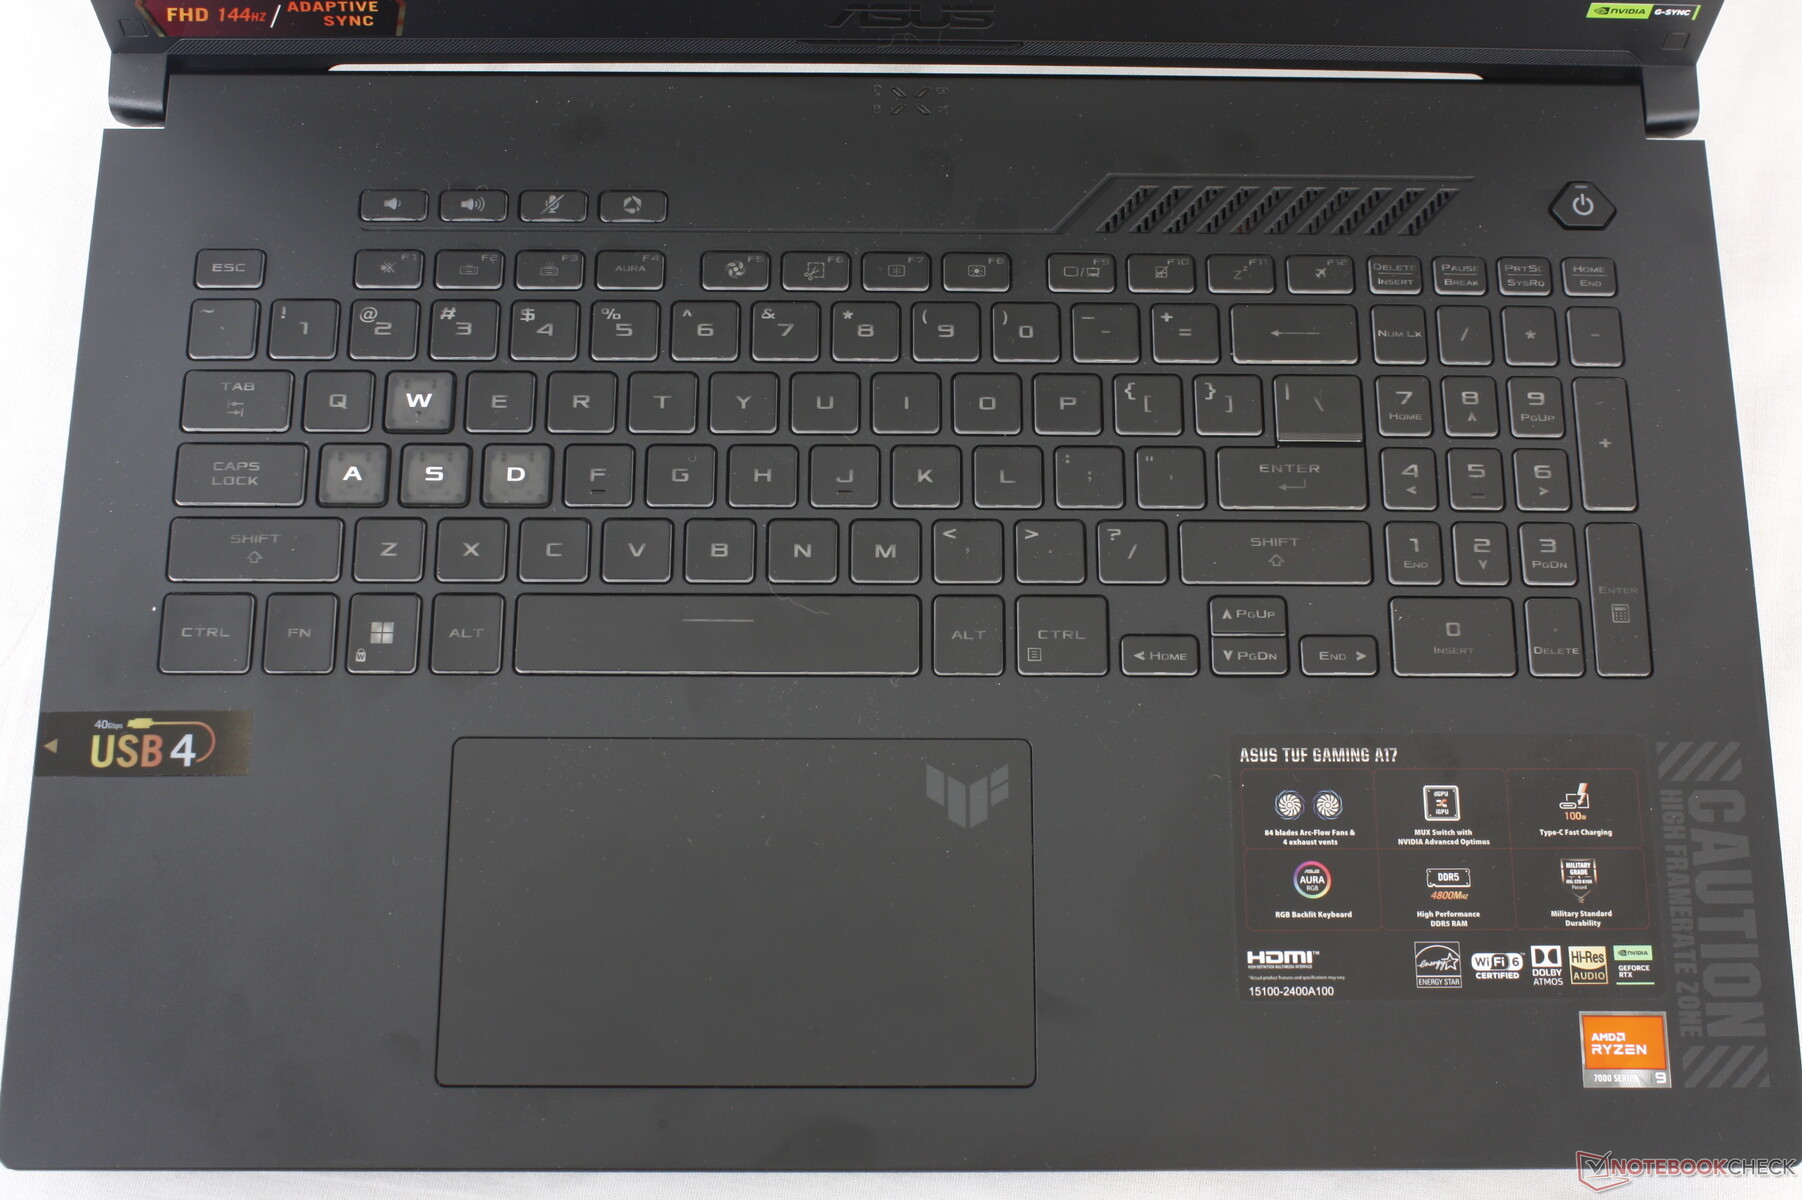
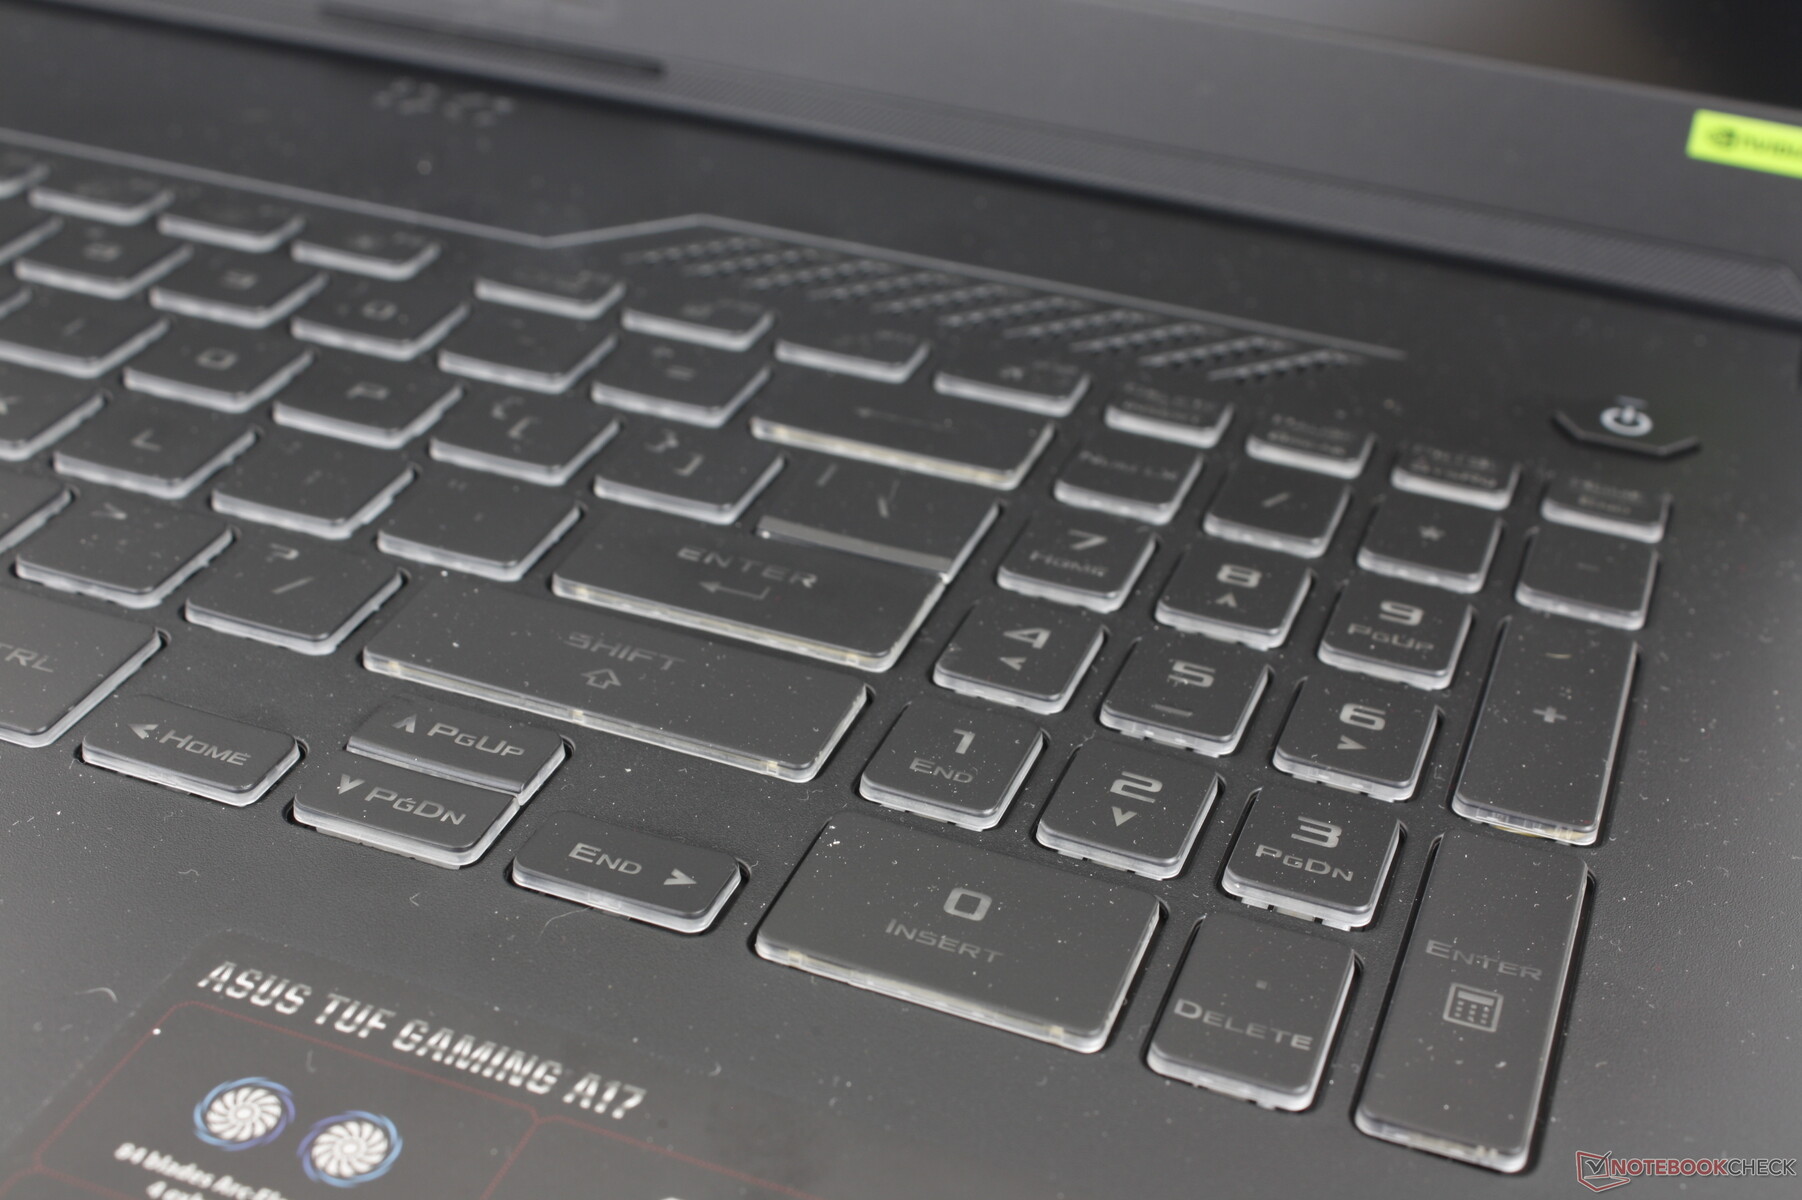
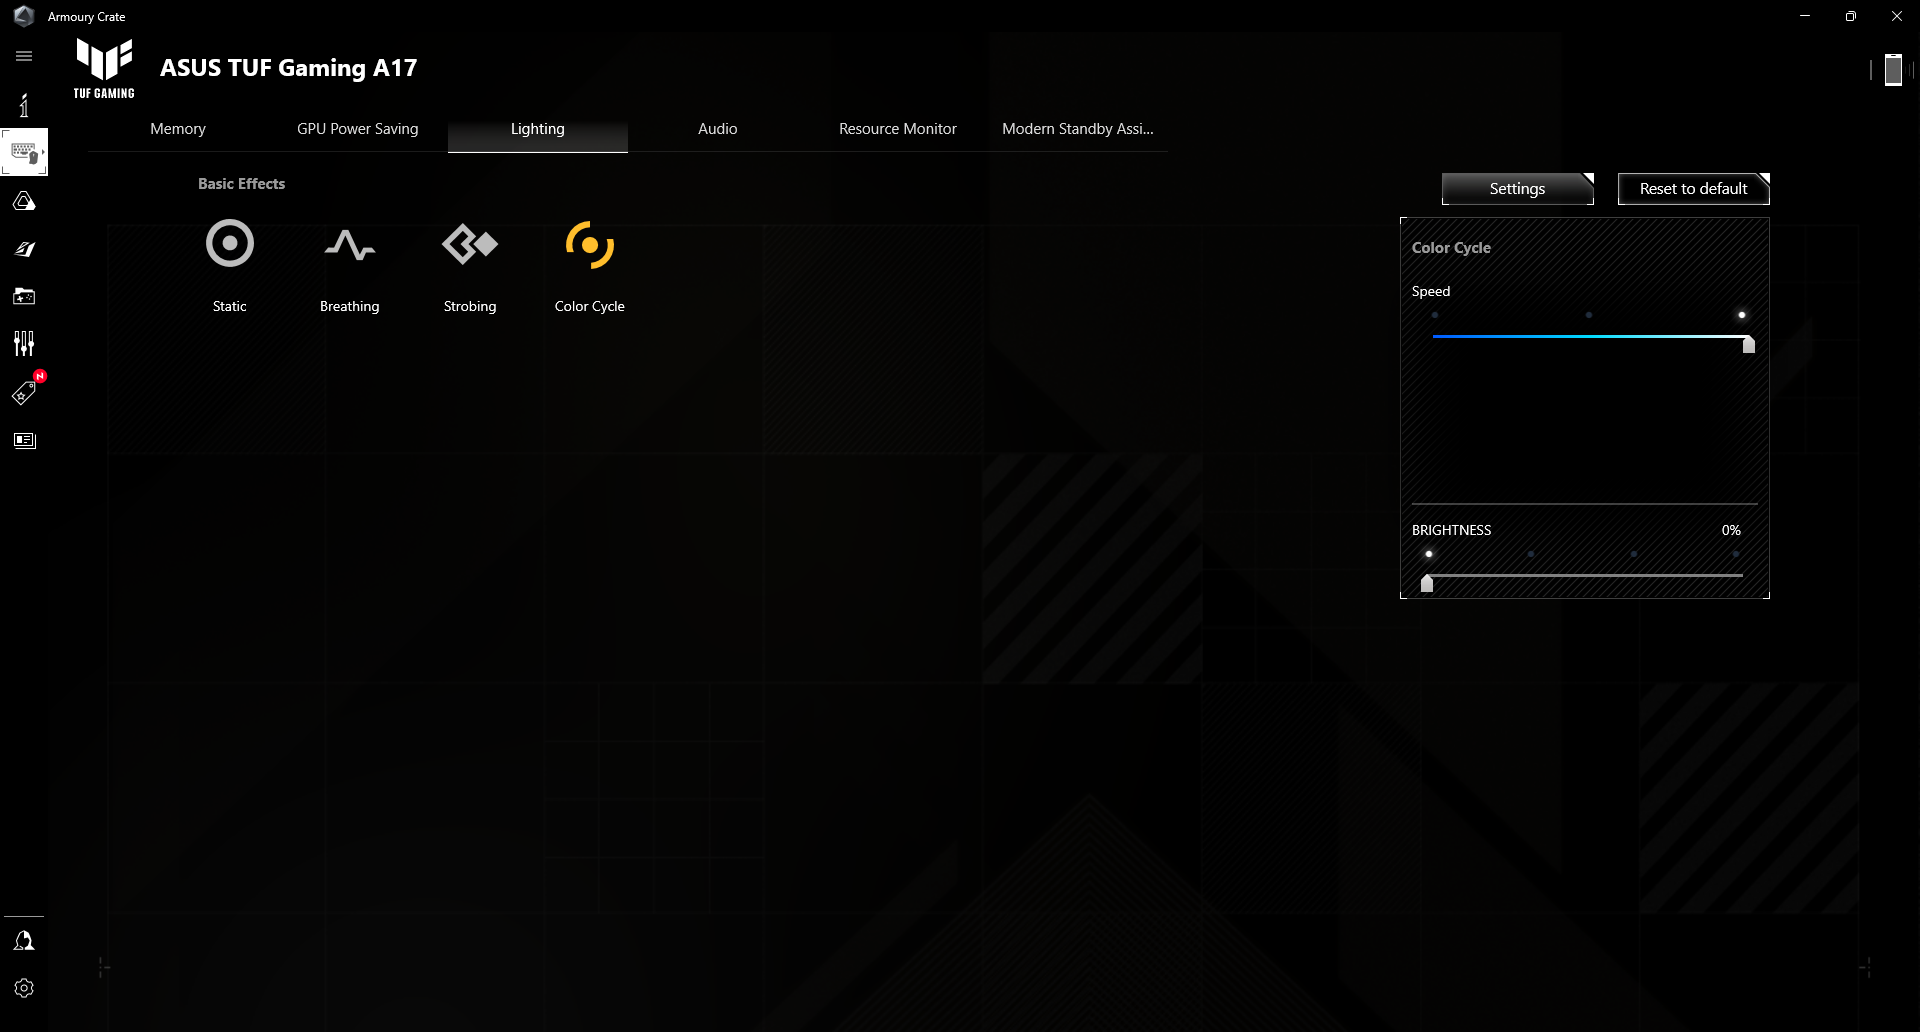
Üç bölgeli RGB klavye, çoğu Ultrabook'taki tuşlardan biraz daha derin olmak için 1,7 mm'lik tuş hareketi sağlar. Sıkışık ok tuşlarını ve numpad'i affedebildiğiniz sürece, bir oyun dizüstü bilgisayarı için yazma deneyimi hoştur.
Koyu gri yazı tipi siyah tuş kapaklarıyla kötü bir kontrast oluşturduğundan tuş görünürlüğü çok iyi değil. Asus'un diğer tüm semboller çok daha koyu iken yalnızca WASD harflerini beyaz renkte vurgulaması tuhaf bir karar. Bu durum, kullanıcıyı parlak koşullarda veya pil ömrü söz konusu olduğunda bile daha kolay okunabilirlik için klavye arka ışığını etkinleştirmeye zorluyor.
Dokunmatik yüzey
13 x 7,7 cm boyutlarındaki tıklama yüzeyi TUF Gaming F17 ile aynı. Bununla birlikte, Intel versiyonumuzda sağ alt köşeye yakın bir "ölü nokta" varken, burada clickpad'imizde herhangi bir sorun göremiyoruz. Basıldığında geri bildirim biraz yumuşak olmasa da iyi.

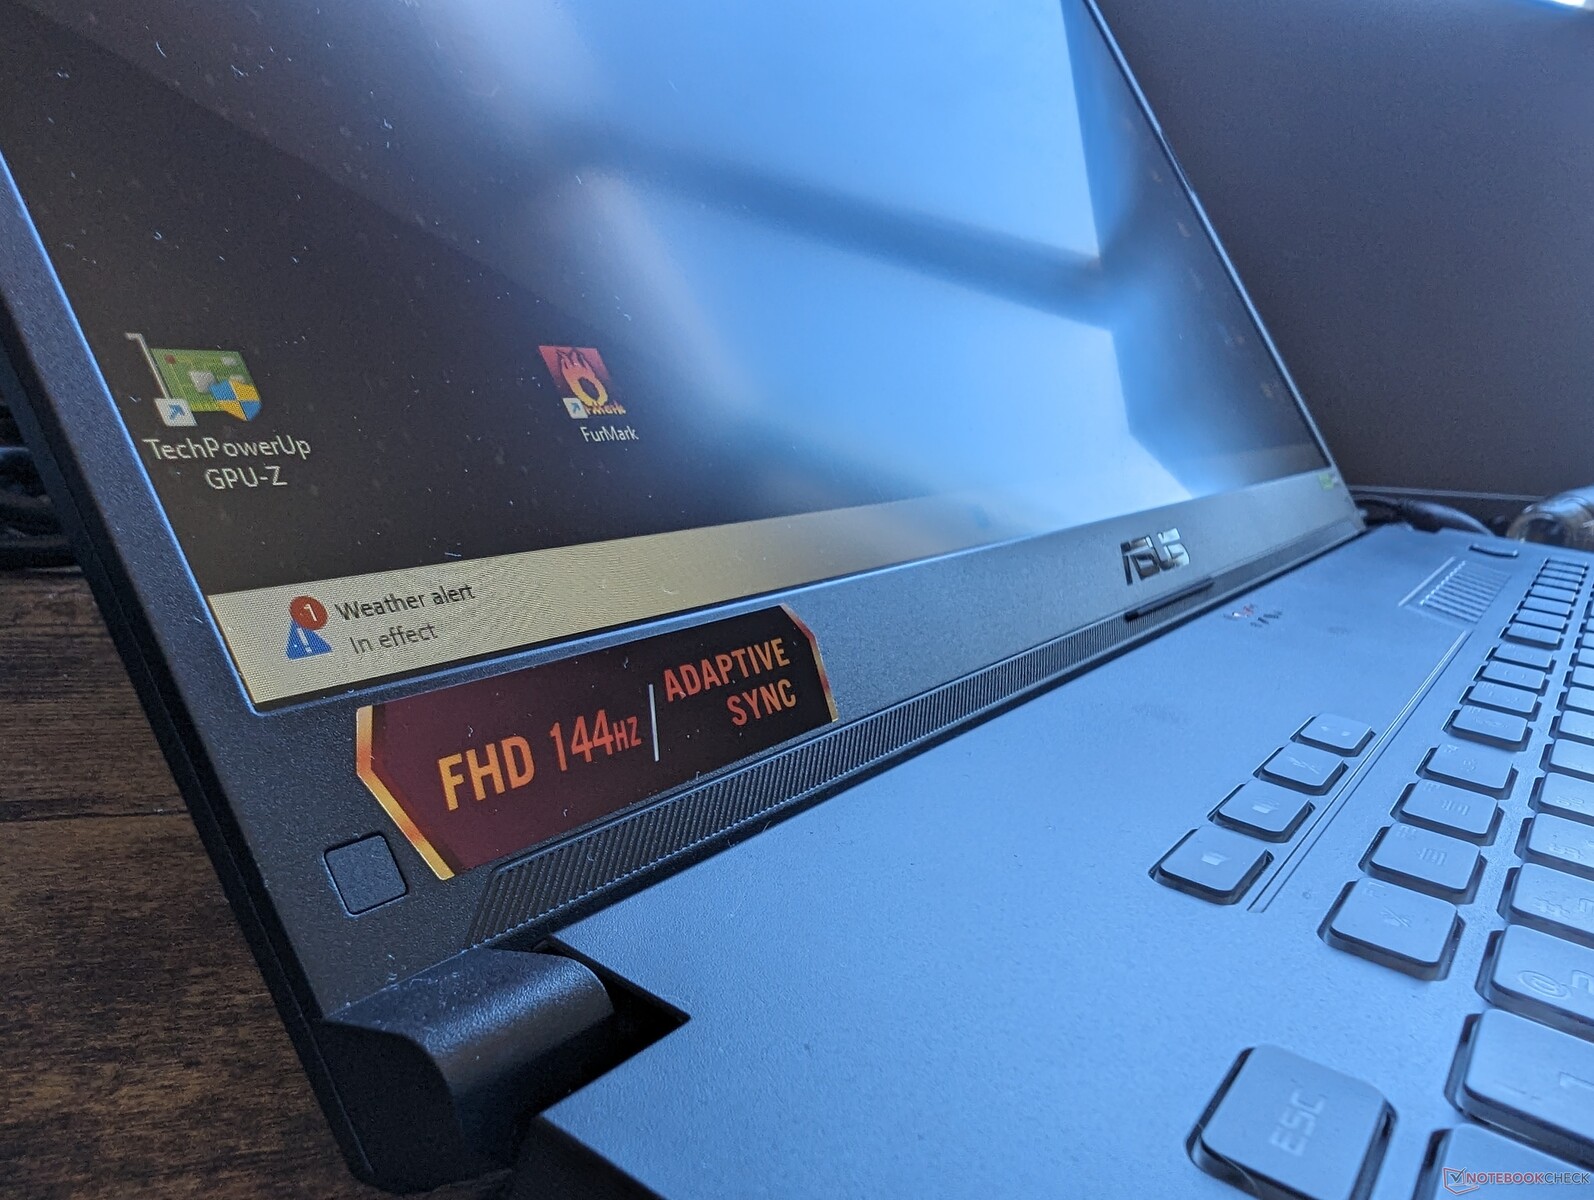
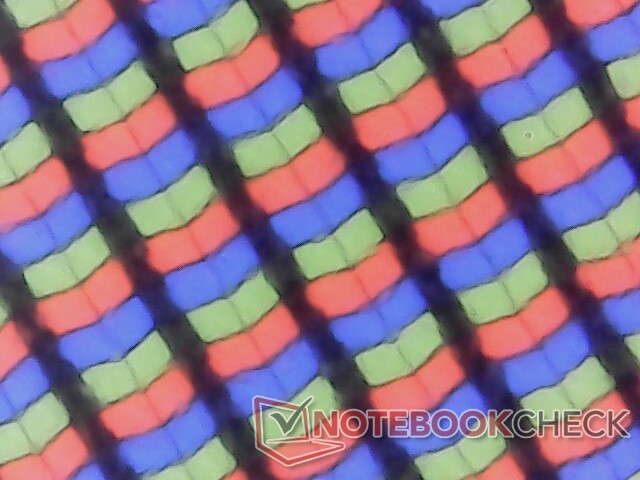
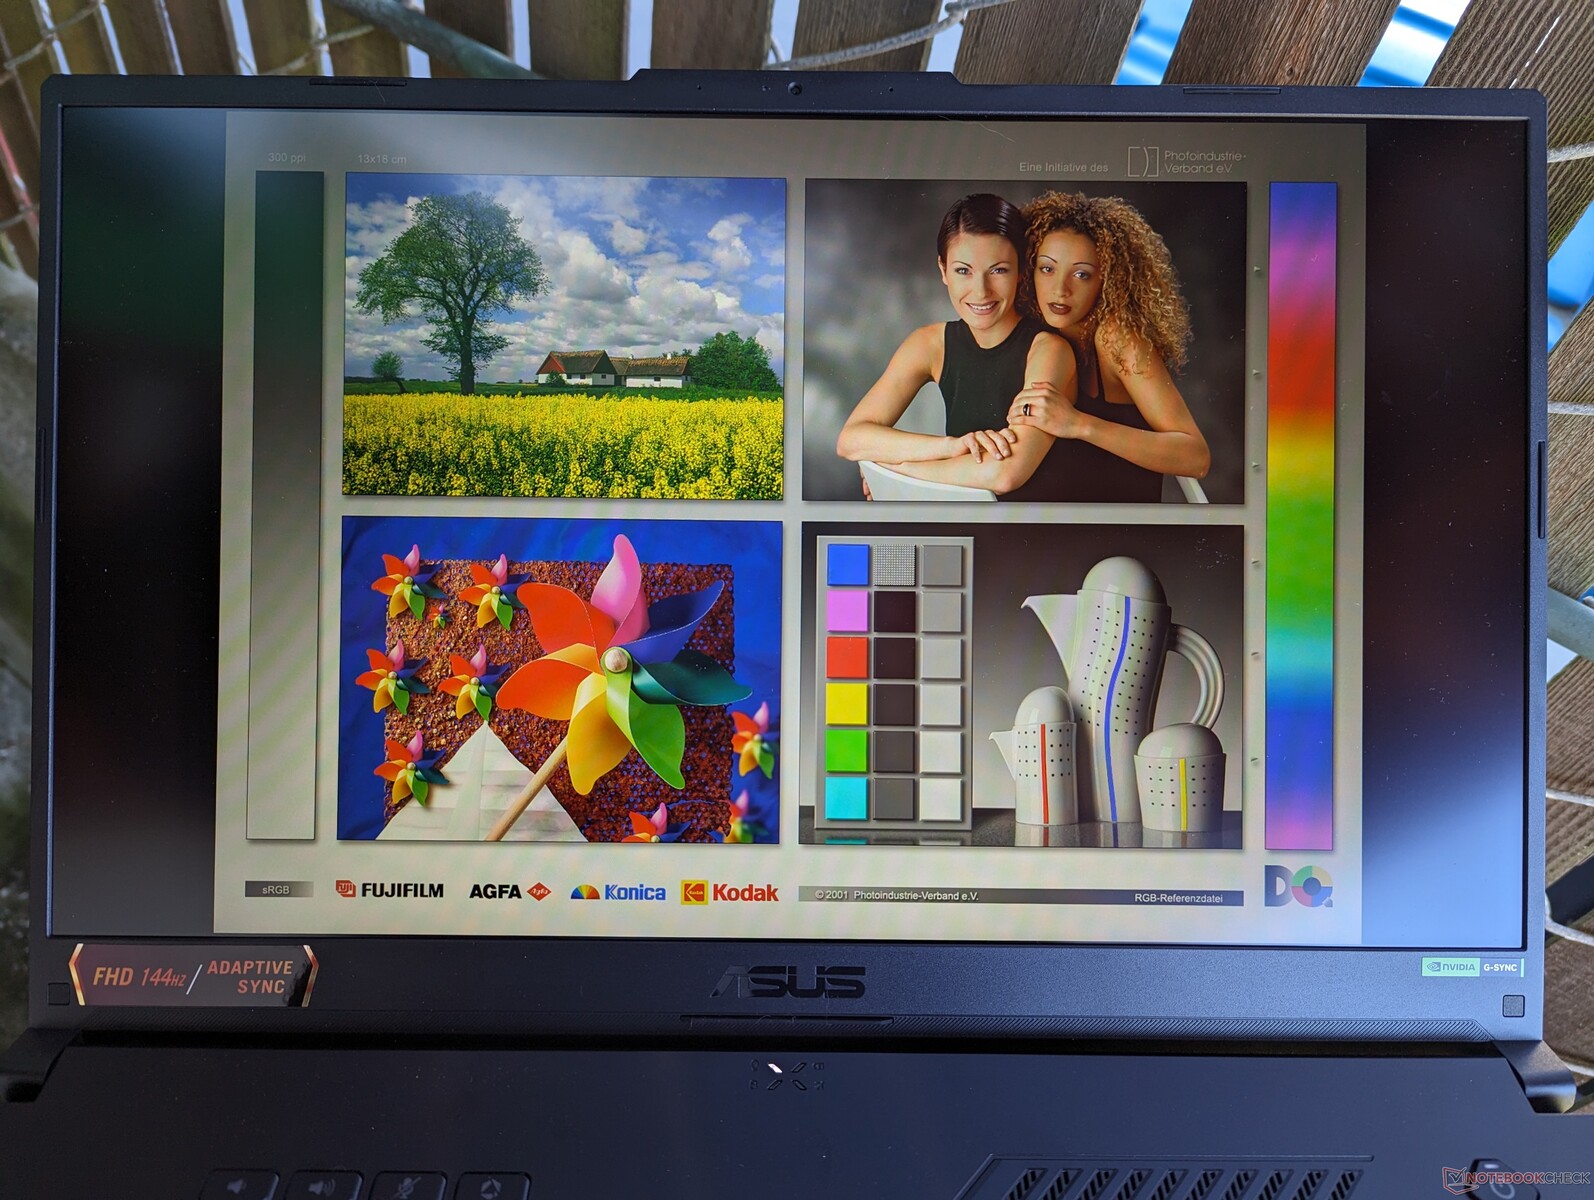
Ekran
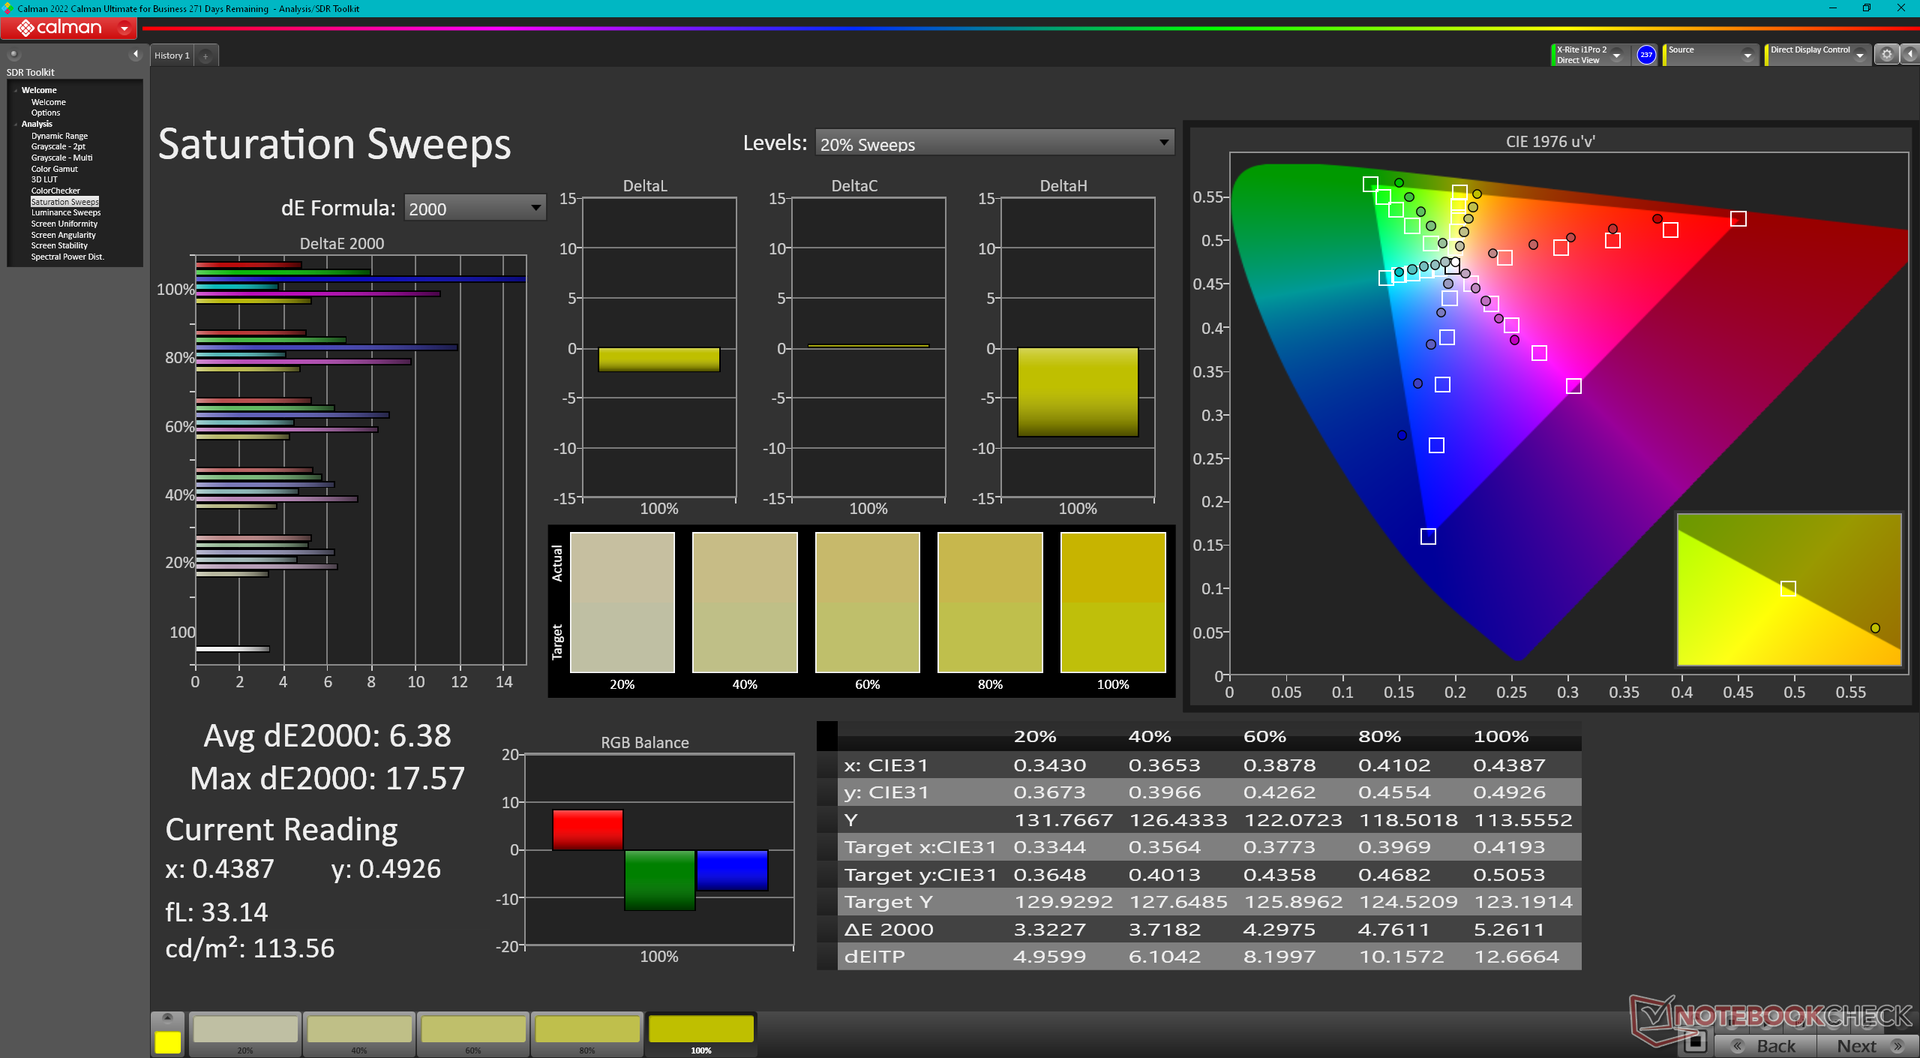
1080p AU Optronics B173HAN04.9 IPS panelimiz, aşağıdakiler de dahil olmak üzere diğer birçok oyun dizüstü bilgisayarında bulunan giriş seviyesi bir ekrandır MSI Pulse 17 veya Katana 17. Genellikle zayıf ~%60 sRGB renk üretimi ve yavaş siyah-beyaz tepki süreleri ile ayırt edilen en ucuz ve en düşük uç seçenektir. Neyse ki Asus, FA707 serisi için seçim yapabileceğiniz toplam üç ekran sunuyor:
- 1920 x 1080, IPS, ~%60 sRGB, 144 Hz
- 2560 x 1440, IPS, %100 DCI-P3, 240 Hz
- 2560 x 1440, IPS, %100 sRGB, 360 Hz
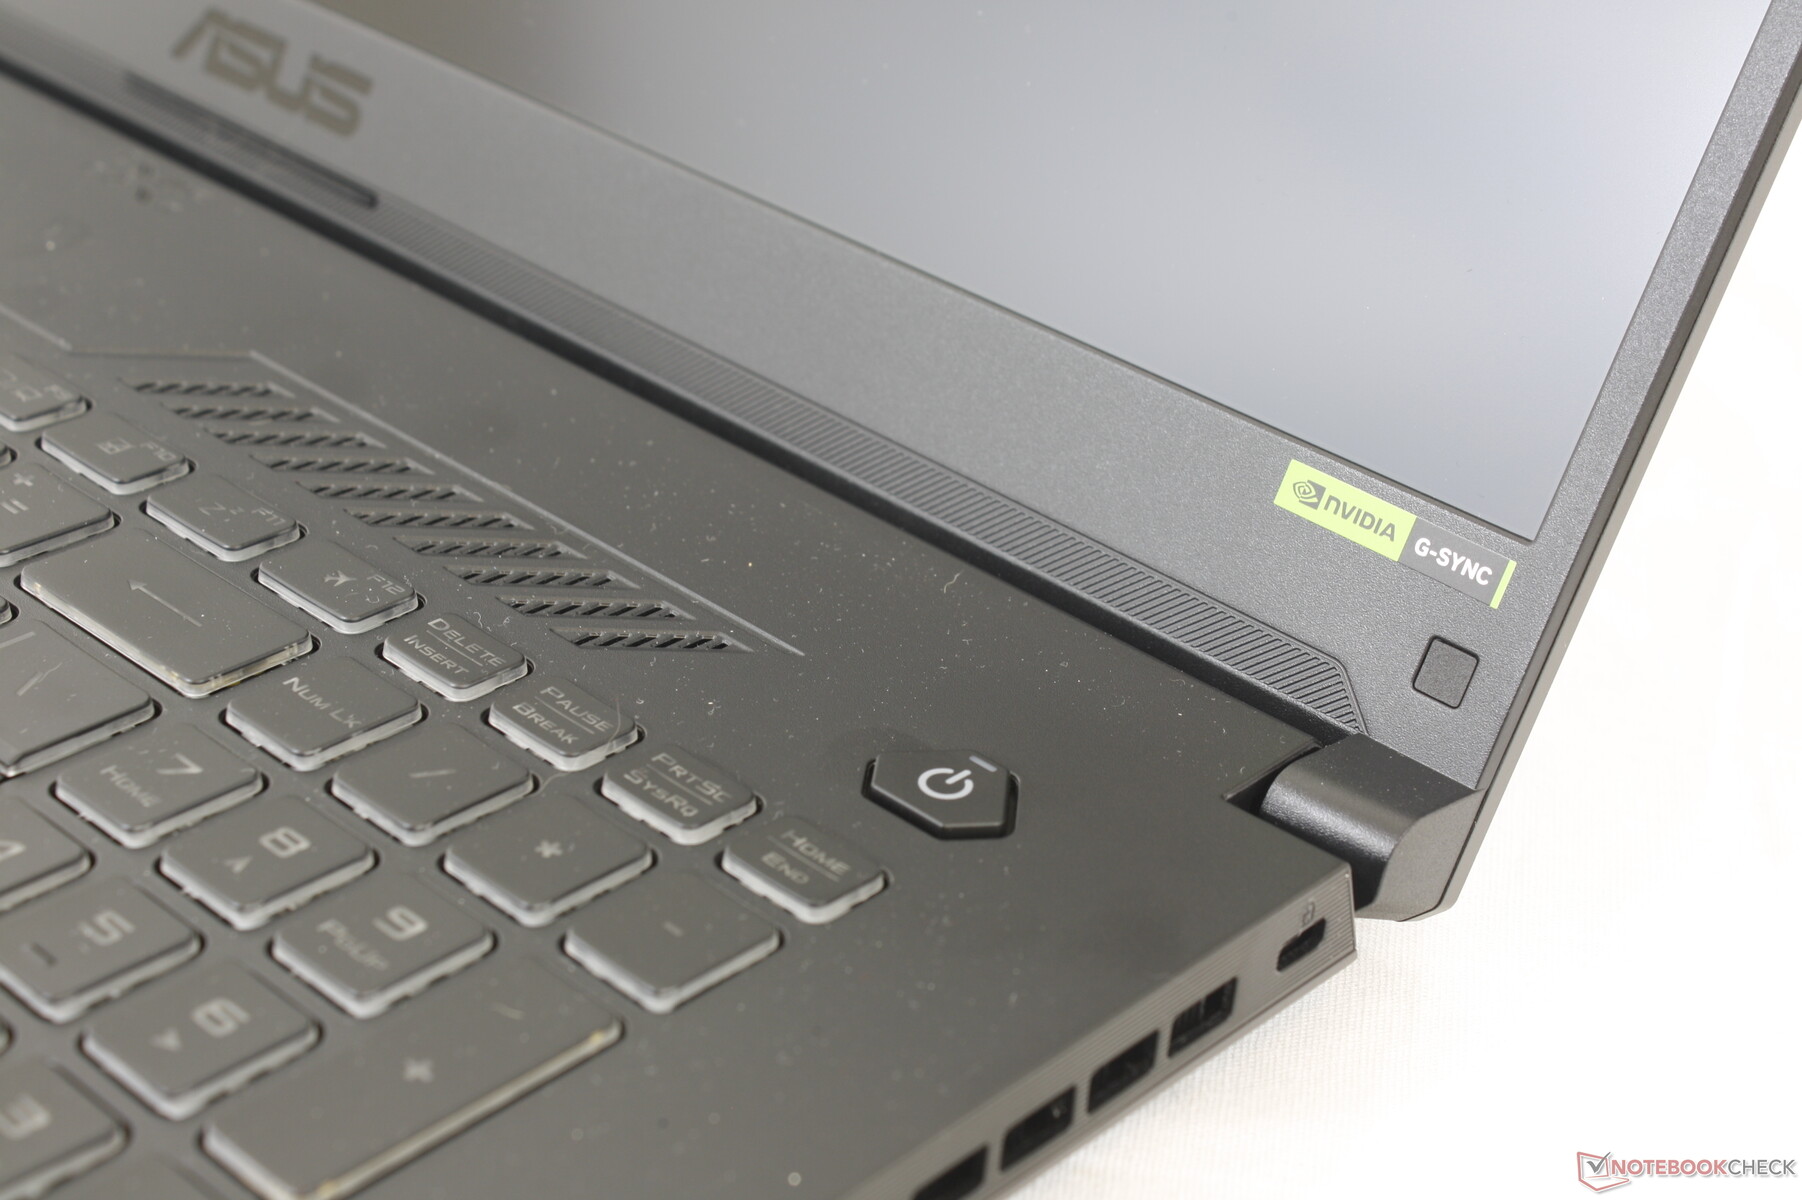
OLED veya mini-LED seçenekleri olmasa da, her biri temel 1080p panelden önemli ölçüde daha iyi renkler sunarken hem uyarlanabilir senkronizasyonu hem de Gelişmiş Optimus'u koruduğu için iki 1440p panelden herhangi birini şiddetle tavsiye ediyoruz.
| |||||||||||||||||||||||||
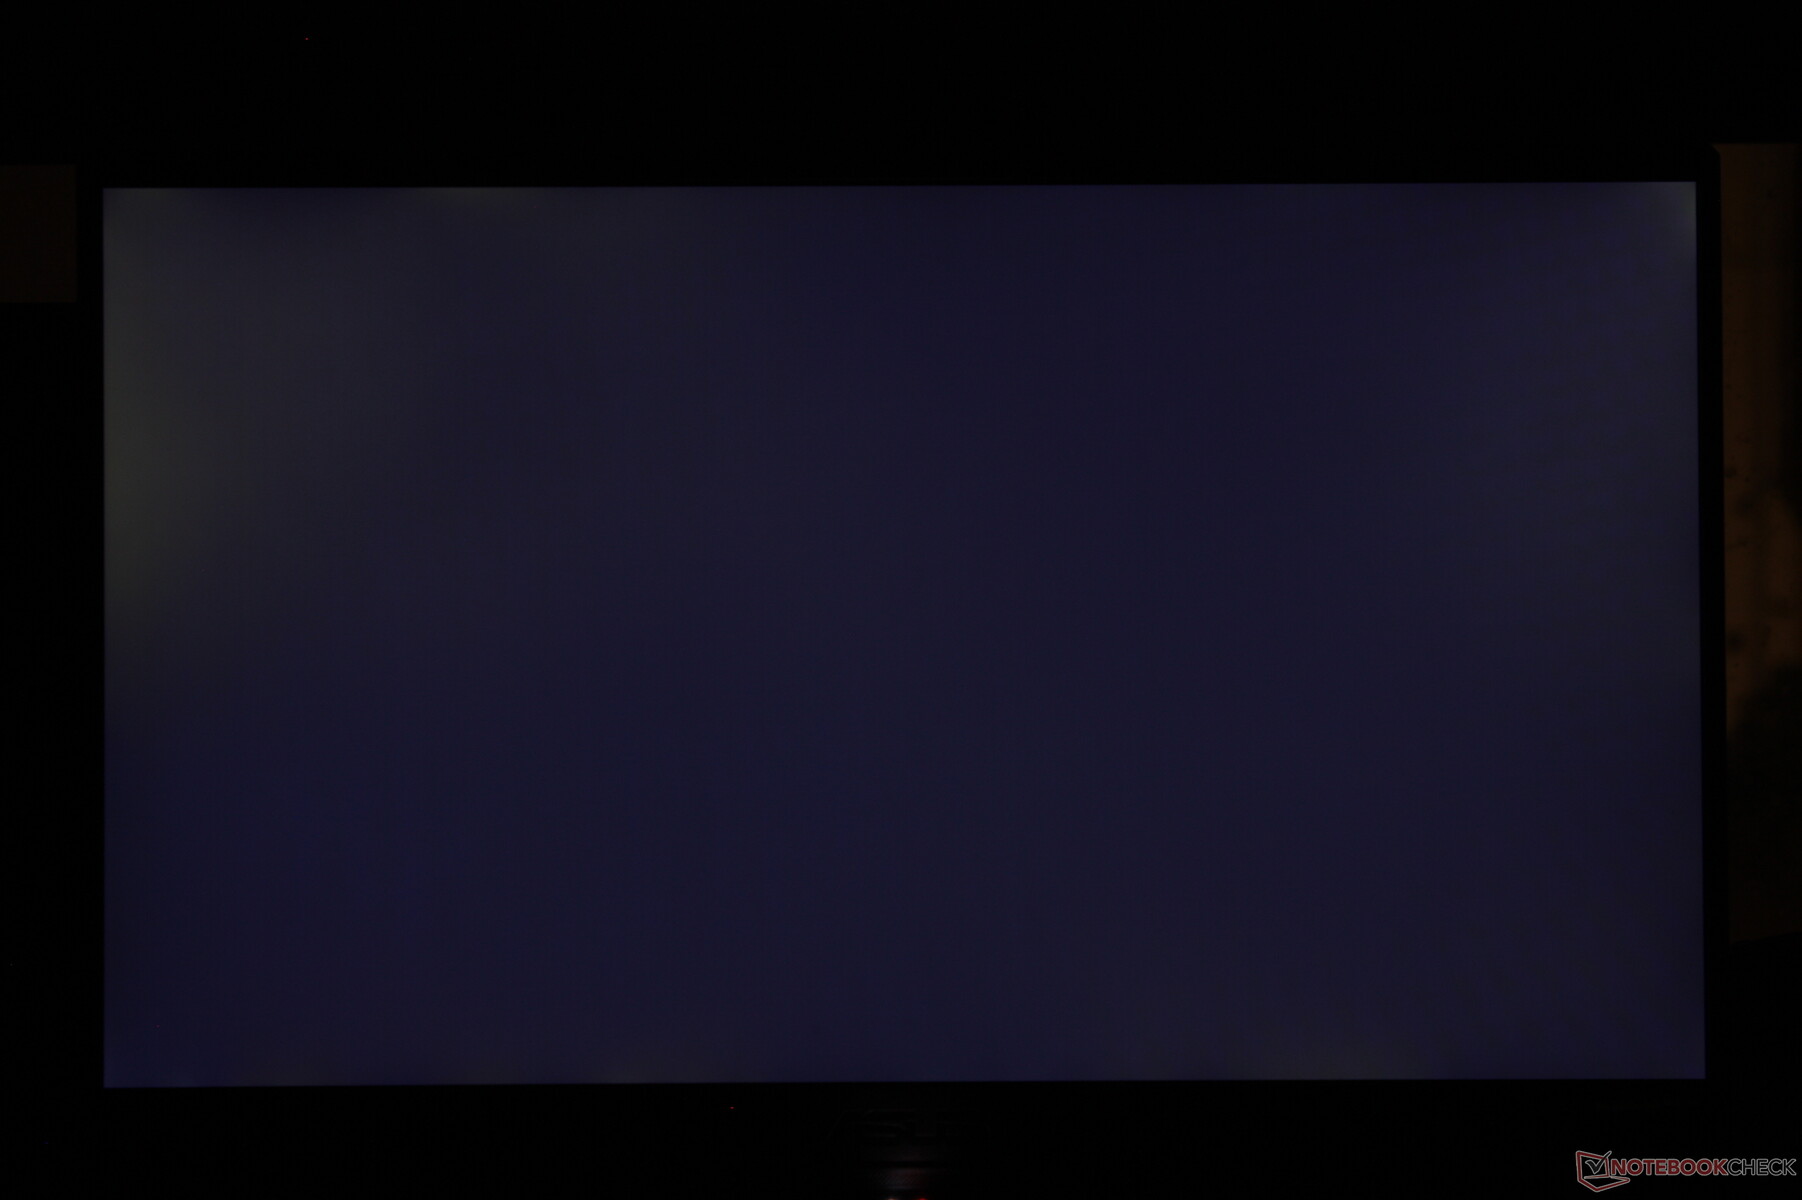
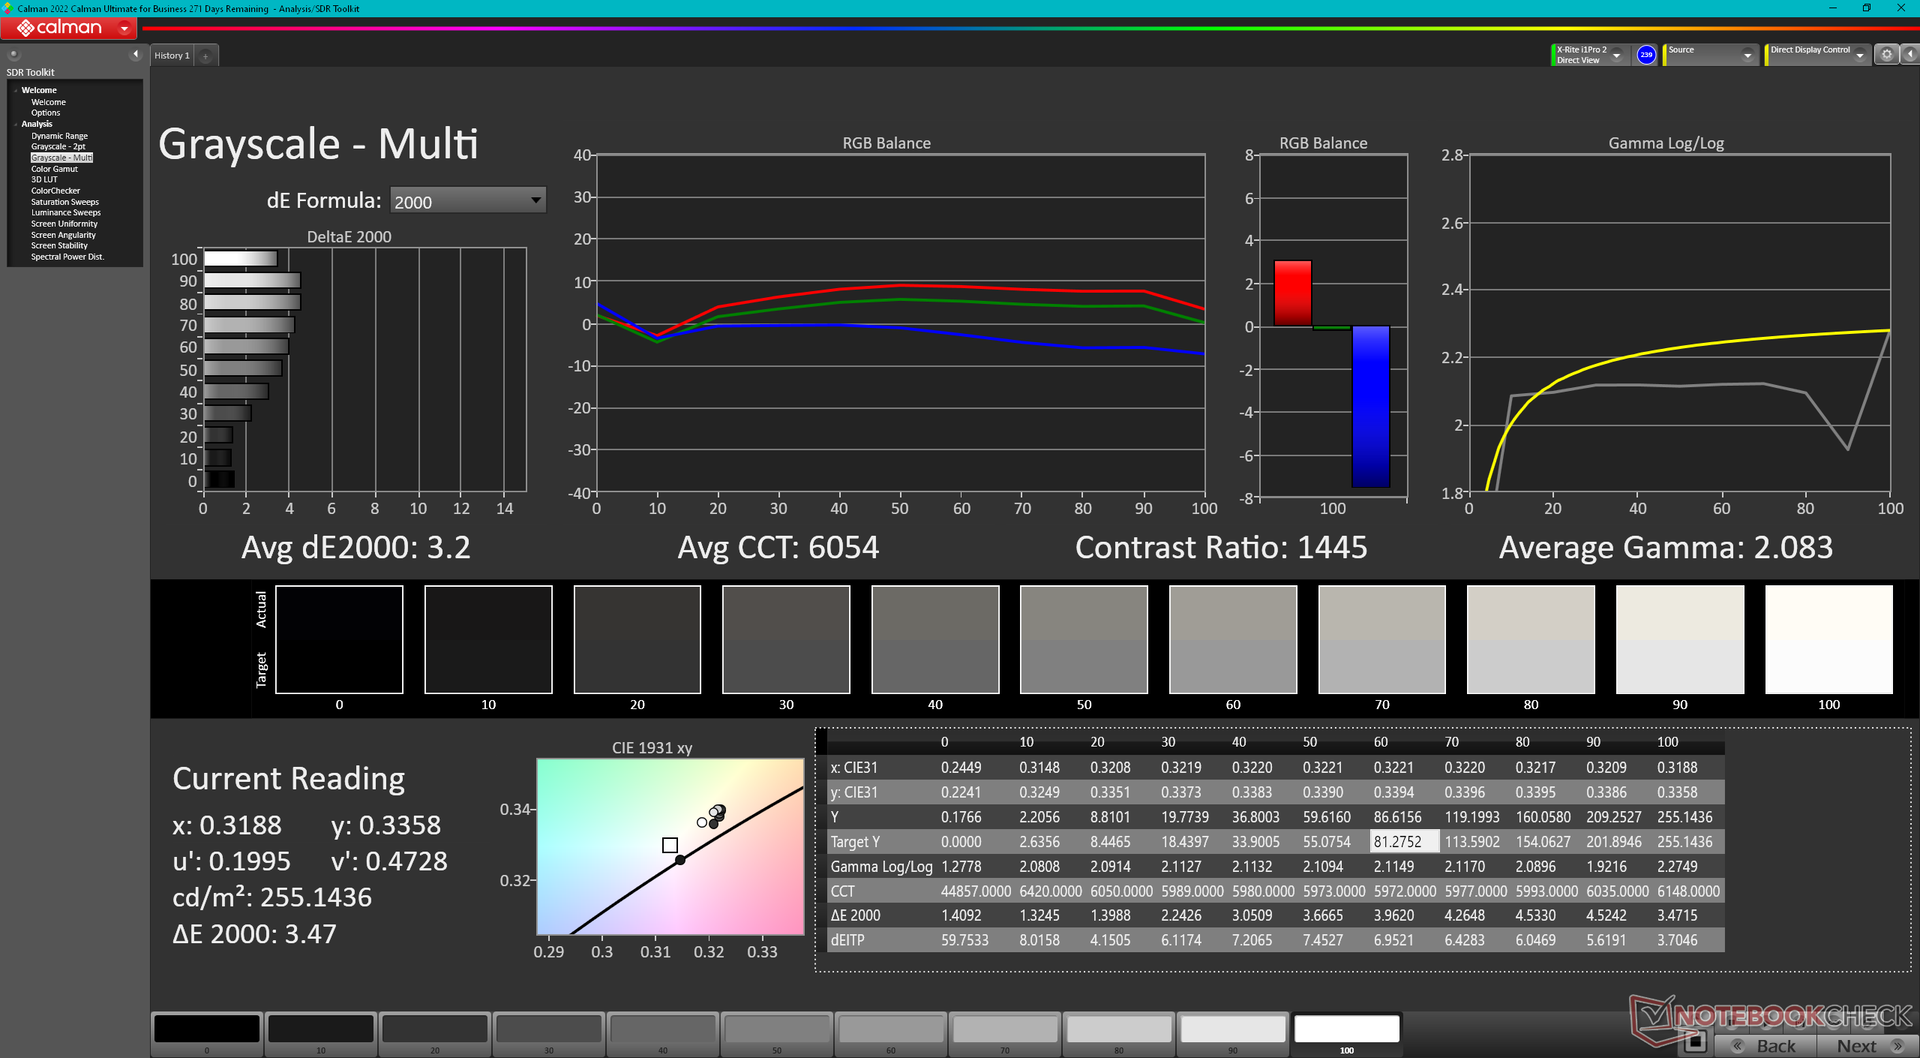
Aydınlatma: 91 %
Batarya modunda parlaklık: 255.9 cd/m²
Kontrast: 1219:1 (Siyah: 0.21 cd/m²)
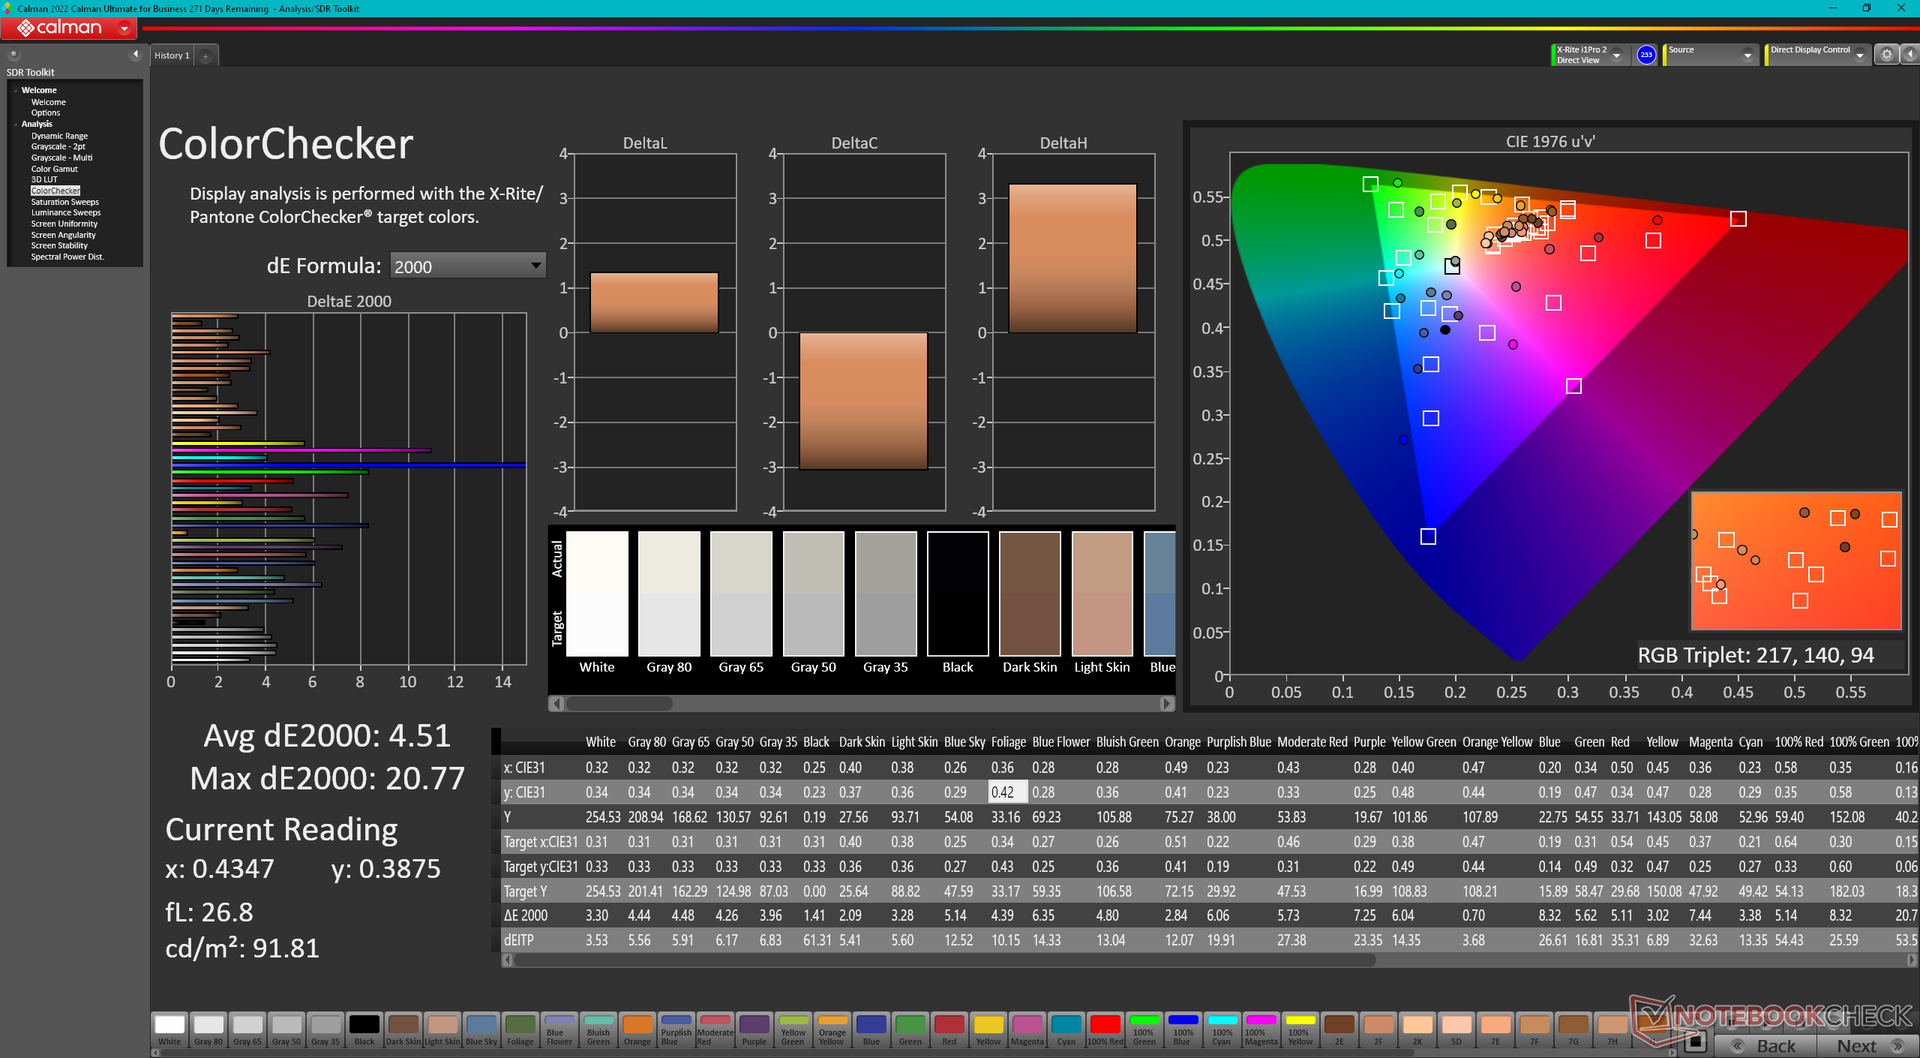
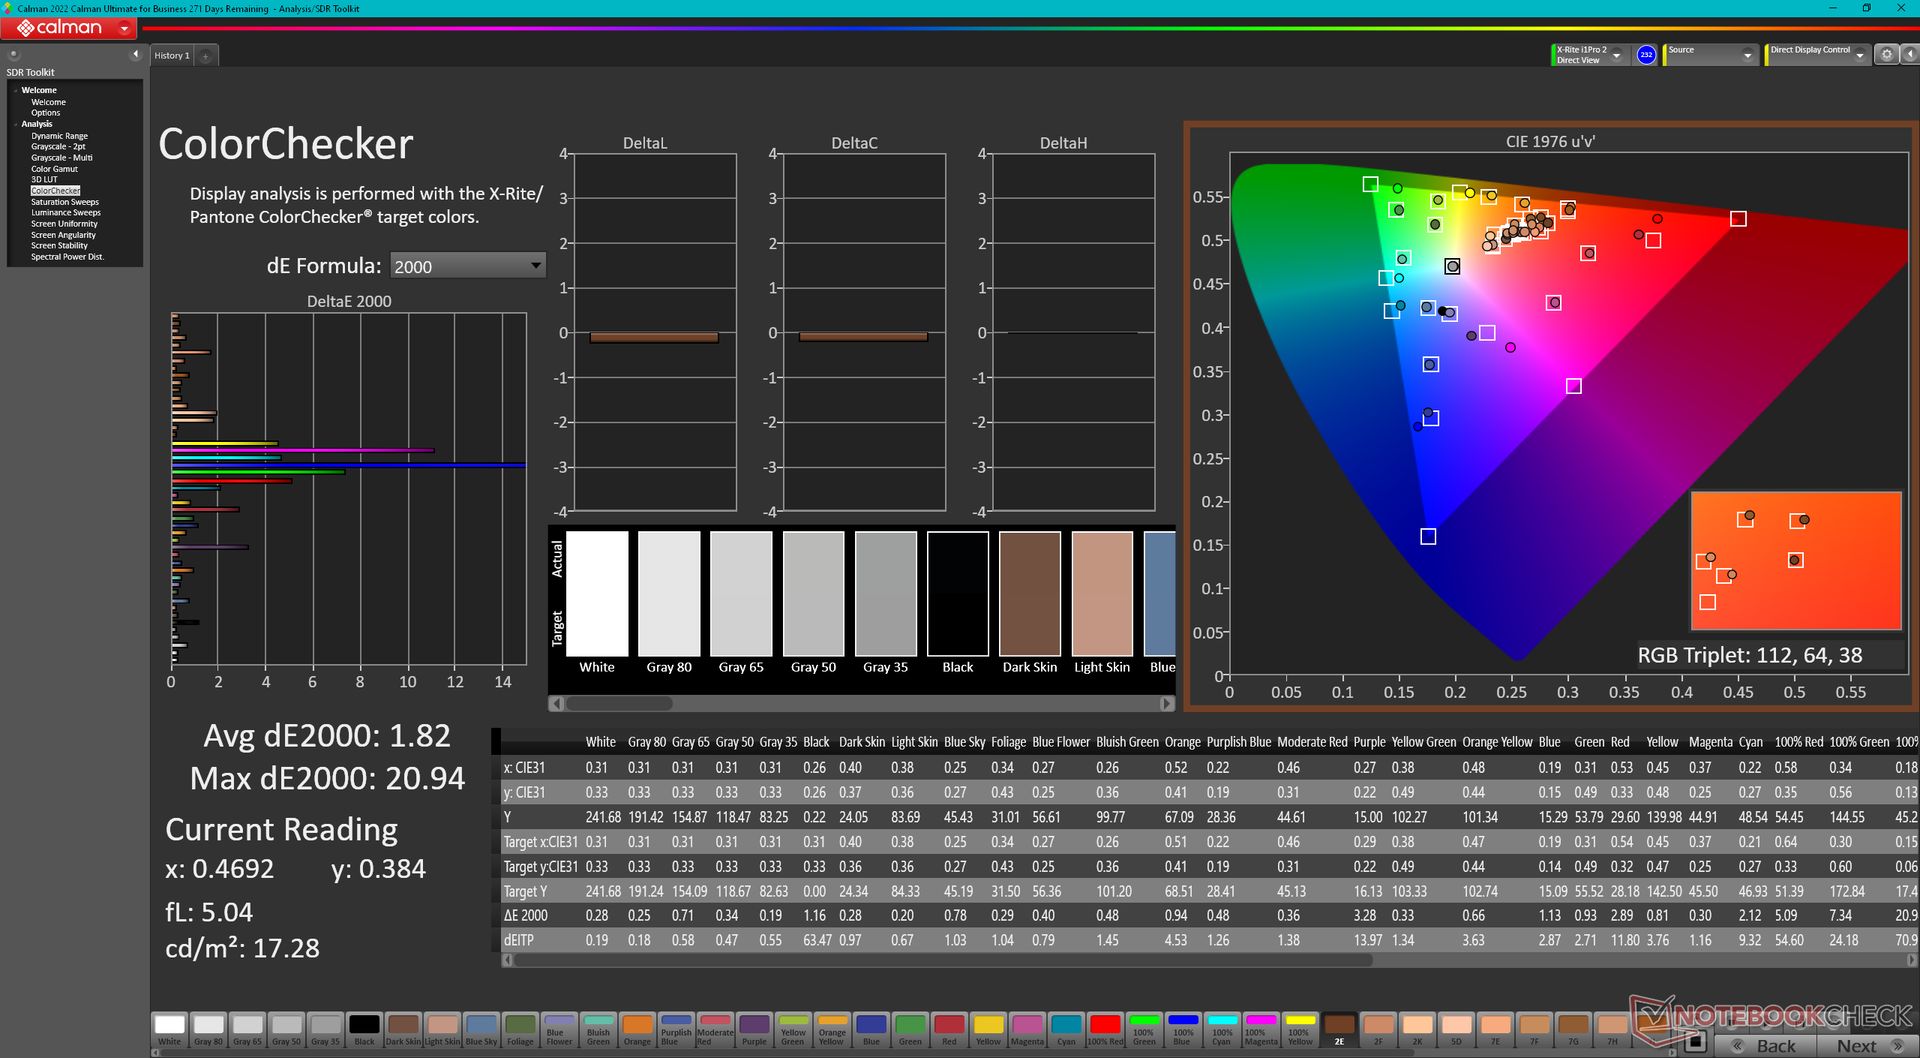
ΔE ColorChecker Calman: 4.51 | ∀{0.5-29.43 Ø4.71}
calibrated: 1.82
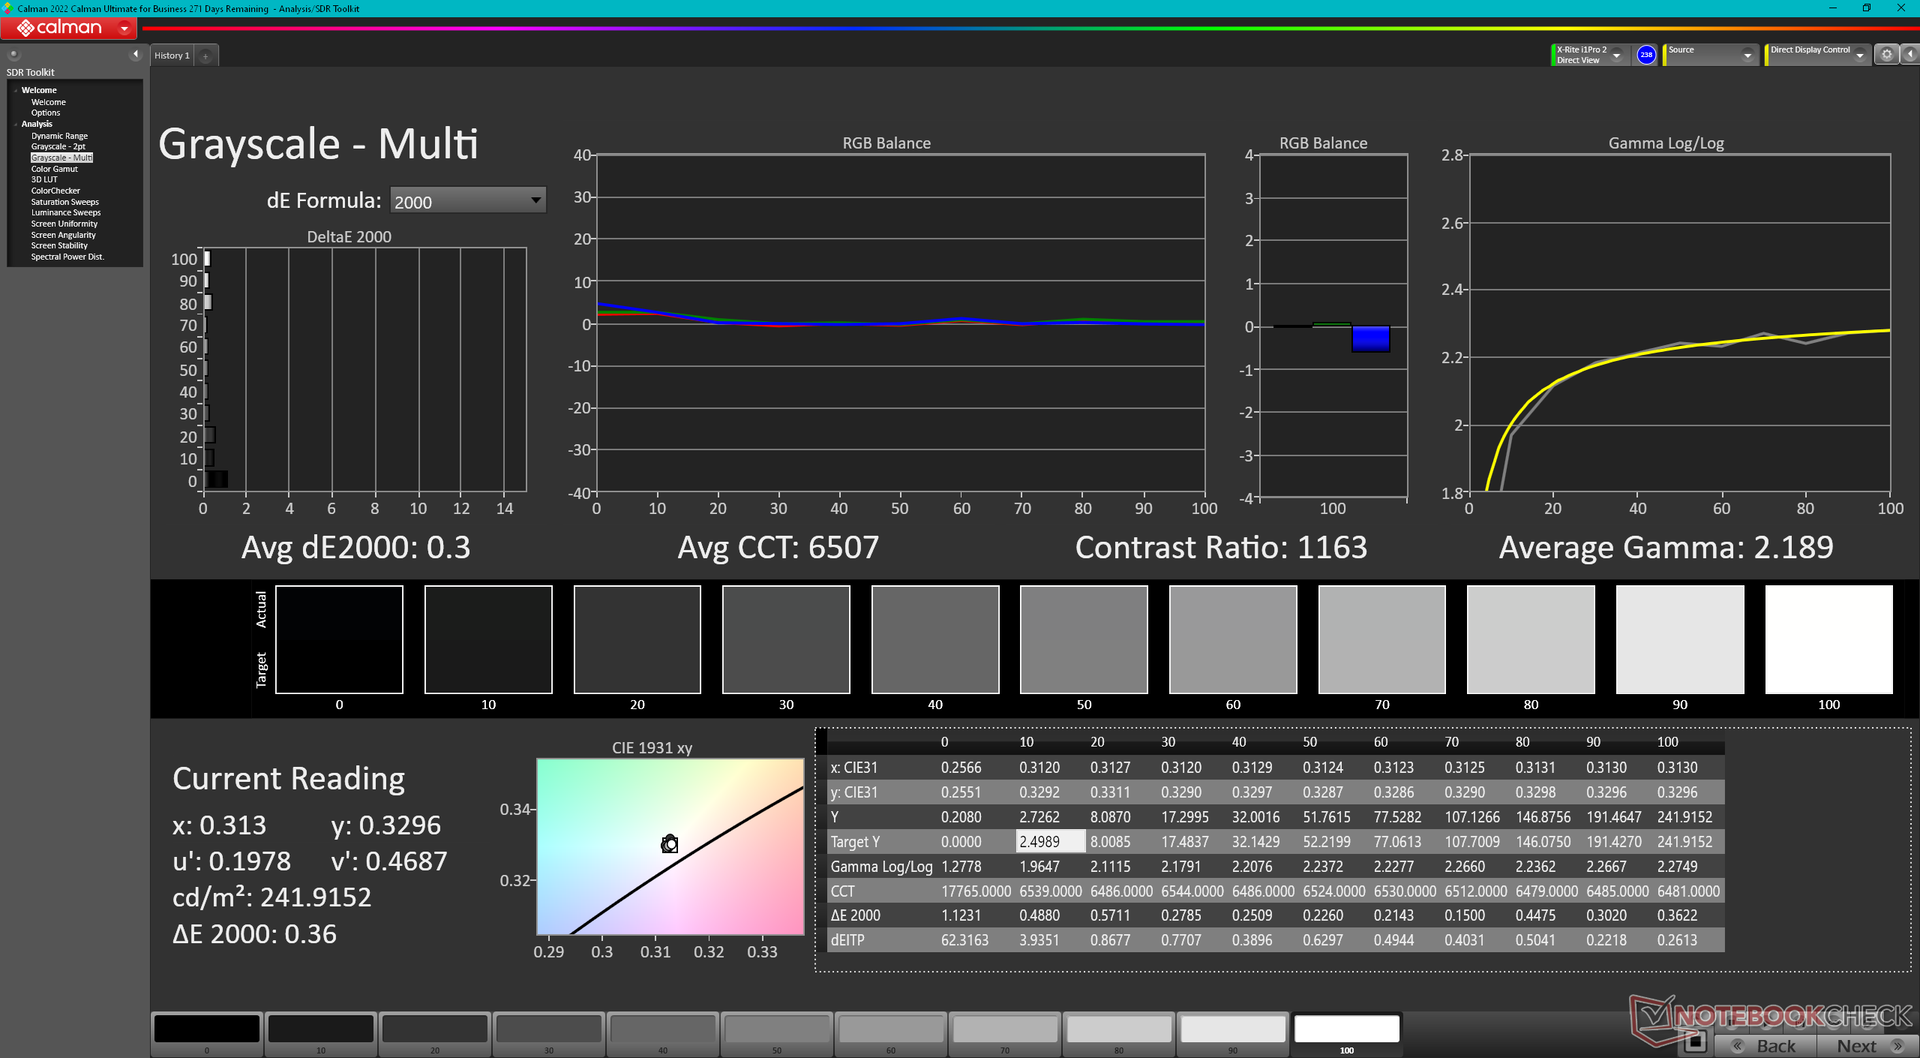
ΔE Greyscale Calman: 3.2 | ∀{0.09-98 Ø4.96}
41% AdobeRGB 1998 (Argyll 3D)
59.1% sRGB (Argyll 3D)
39.7% Display P3 (Argyll 3D)
Gamma: 2.08
CCT: 6054 K
| Asus TUF Gaming A17 FA707XI-NS94 AU Optronics B173HAN04.9, IPS, 1920x1080, 17.3" | Asus TUF Gaming F17 FX707Z-HX011W AU Optronics B173HAN04.9 (AUO4B9D), IPS, 1920x1080, 17.3" | MSI Pulse 17 B13VGK AU Optronics B173HAN04.9, IPS, 1920x1080, 17.3" | MSI Katana 17 B13VFK B173HAN04.9, IPS LED, 1920x1080, 17.3" | Razer Blade 17 (i7-12800H, RTX 3070 Ti) BOE CQ NE173QHM-NZ1 (BOE09F9), IPS, 2560x1440, 17.3" | HP Pavilion Gaming 17-cd2146ng LGD0611, IPS, 1920x1080, 17.3" | |
|---|---|---|---|---|---|---|
| Display | 1% | -3% | 3% | 108% | 63% | |
| Display P3 Coverage (%) | 39.7 | 40.2 1% | 38.4 -3% | 40.8 3% | 97.9 147% | 64.8 63% |
| sRGB Coverage (%) | 59.1 | 59.7 1% | 57.5 -3% | 61 3% | 99.9 69% | 96.8 64% |
| AdobeRGB 1998 Coverage (%) | 41 | 41.5 1% | 39.7 -3% | 42.2 3% | 85.5 109% | 66.5 62% |
| Response Times | -6% | 16% | 9% | 60% | 68% | |
| Response Time Grey 50% / Grey 80% * (ms) | 39 ? | 39.2 ? -1% | 31.2 ? 20% | 33 ? 15% | 15.2 ? 61% | 12.7 ? 67% |
| Response Time Black / White * (ms) | 26.9 ? | 29.6 ? -10% | 23.6 ? 12% | 26 ? 3% | 11.2 ? 58% | 8.7 ? 68% |
| PWM Frequency (Hz) | ||||||
| Screen | -10% | 0% | -9% | -18% | 16% | |
| Brightness middle (cd/m²) | 255.9 | 287 12% | 254 -1% | 267 4% | 341 33% | 328 28% |
| Brightness (cd/m²) | 248 | 268 8% | 250 1% | 256 3% | 308 24% | 317 28% |
| Brightness Distribution (%) | 91 | 89 -2% | 91 0% | 93 2% | 82 -10% | 94 3% |
| Black Level * (cd/m²) | 0.21 | 0.17 19% | 0.14 33% | 0.21 -0% | 0.45 -114% | 0.23 -10% |
| Contrast (:1) | 1219 | 1688 38% | 1814 49% | 1271 4% | 758 -38% | 1426 17% |
| Colorchecker dE 2000 * | 4.51 | 5.1 -13% | 4.52 -0% | 4.7 -4% | 4.16 8% | 3.83 15% |
| Colorchecker dE 2000 max. * | 20.77 | 8.72 58% | 21.22 -2% | 20.4 2% | 8.14 61% | 8.51 59% |
| Colorchecker dE 2000 calibrated * | 1.82 | 5.1 -180% | 4.52 -148% | 4.5 -147% | 3 -65% | 0.83 54% |
| Greyscale dE 2000 * | 3.2 | 4.24 -33% | 1 69% | 1.5 53% | 5.09 -59% | 4.9 -53% |
| Gamma | 2.08 106% | 2.44 90% | 2.44 90% | 2.12 104% | 2.48 89% | 2.177 101% |
| CCT | 6054 107% | 6008 108% | 6502 100% | 6552 99% | 6884 94% | 7881 82% |
| Toplam Ortalama (Program / Ayarlar) | -5% /
-7% | 4% /
2% | 1% /
-4% | 50% /
20% | 49% /
33% |
* ... daha küçük daha iyidir
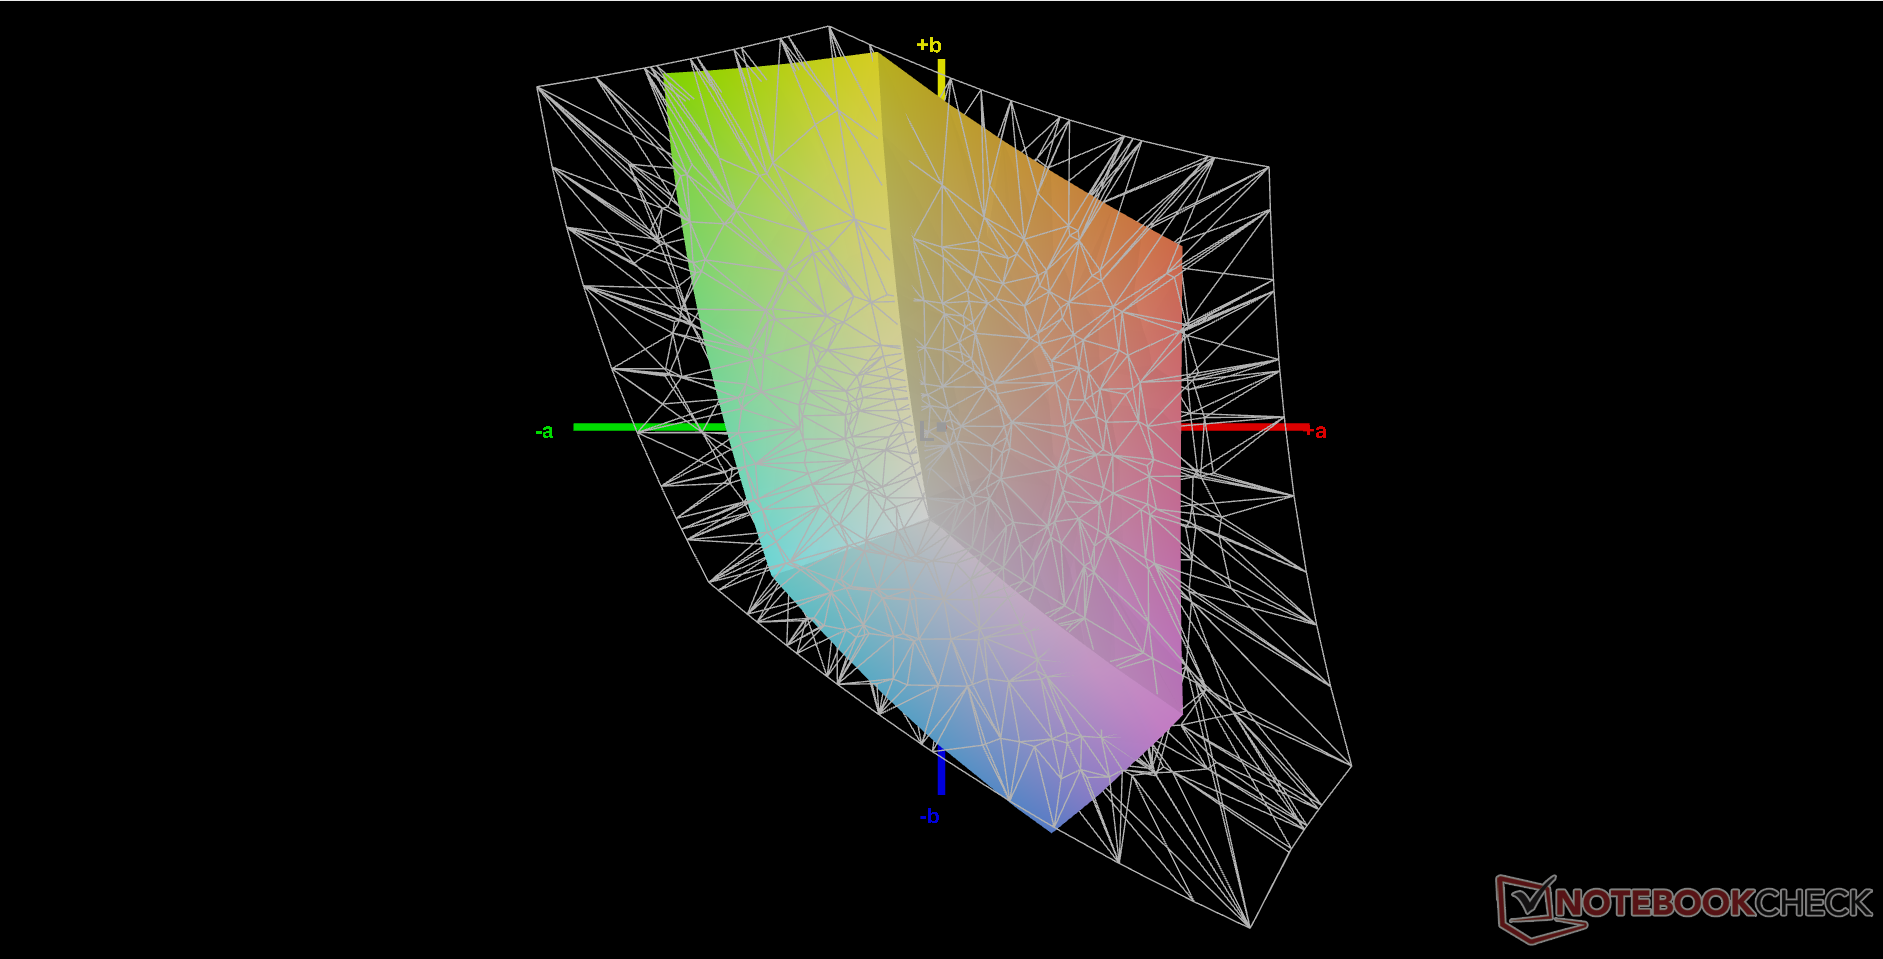
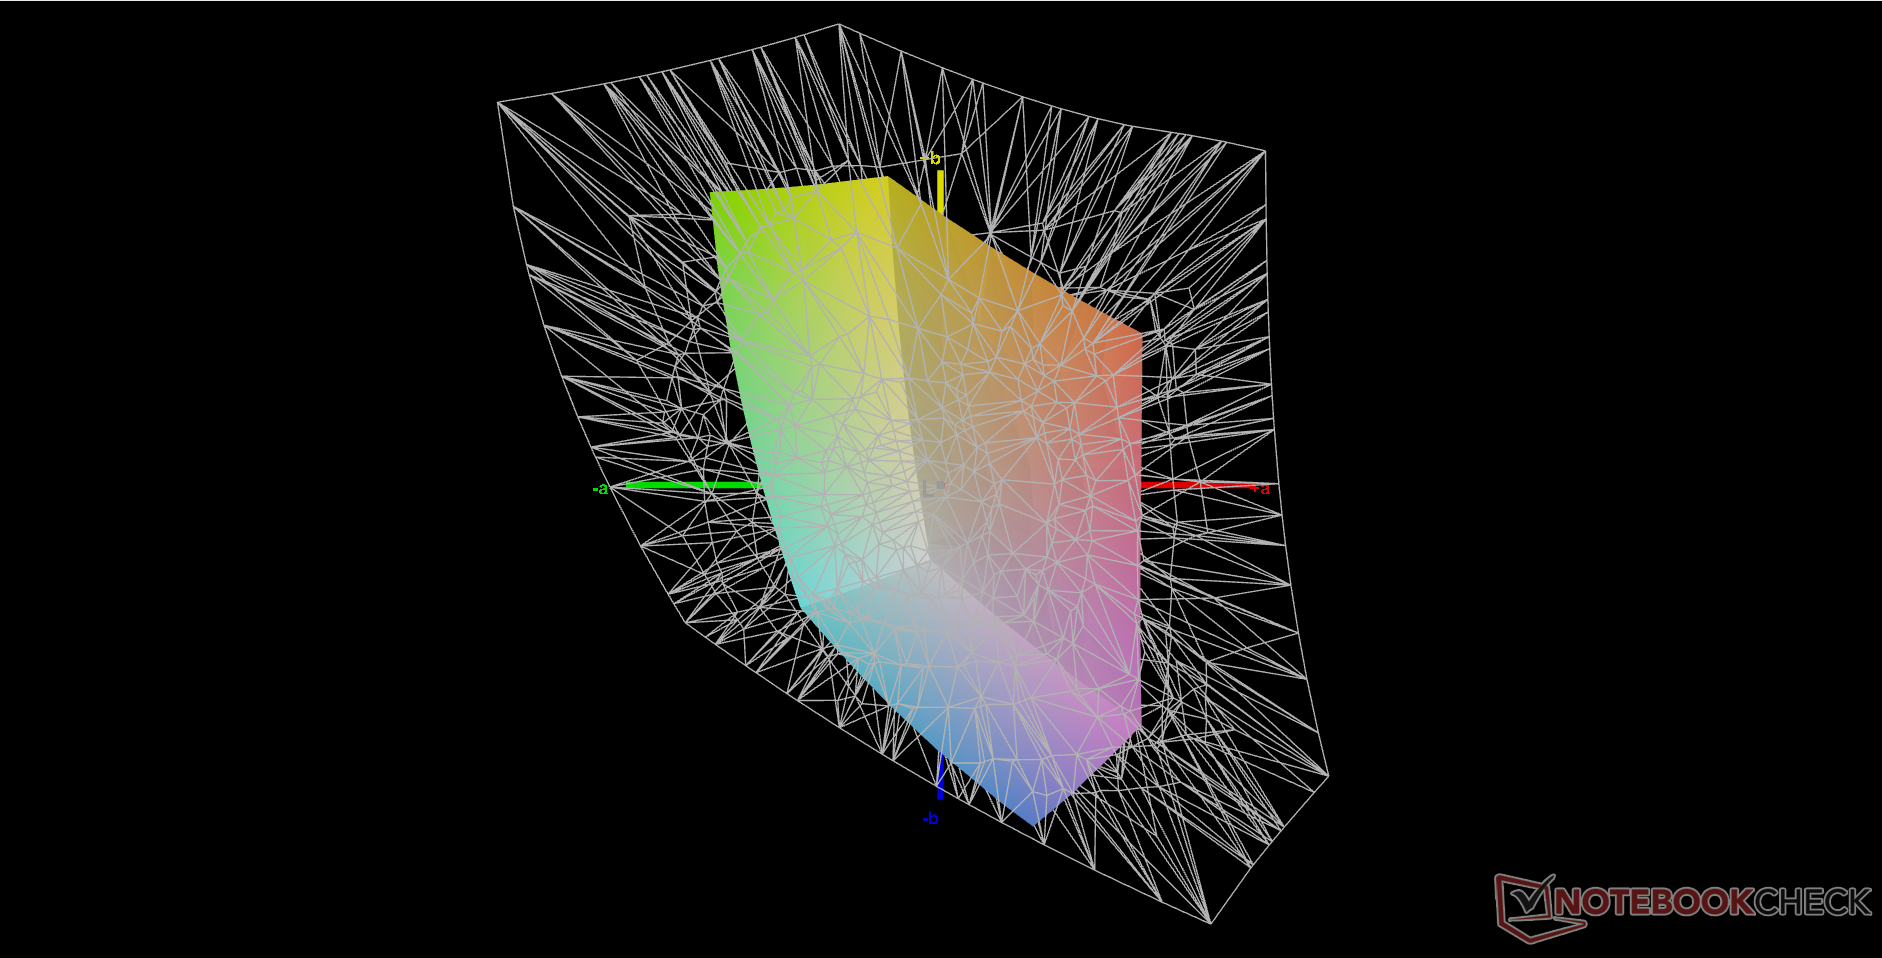
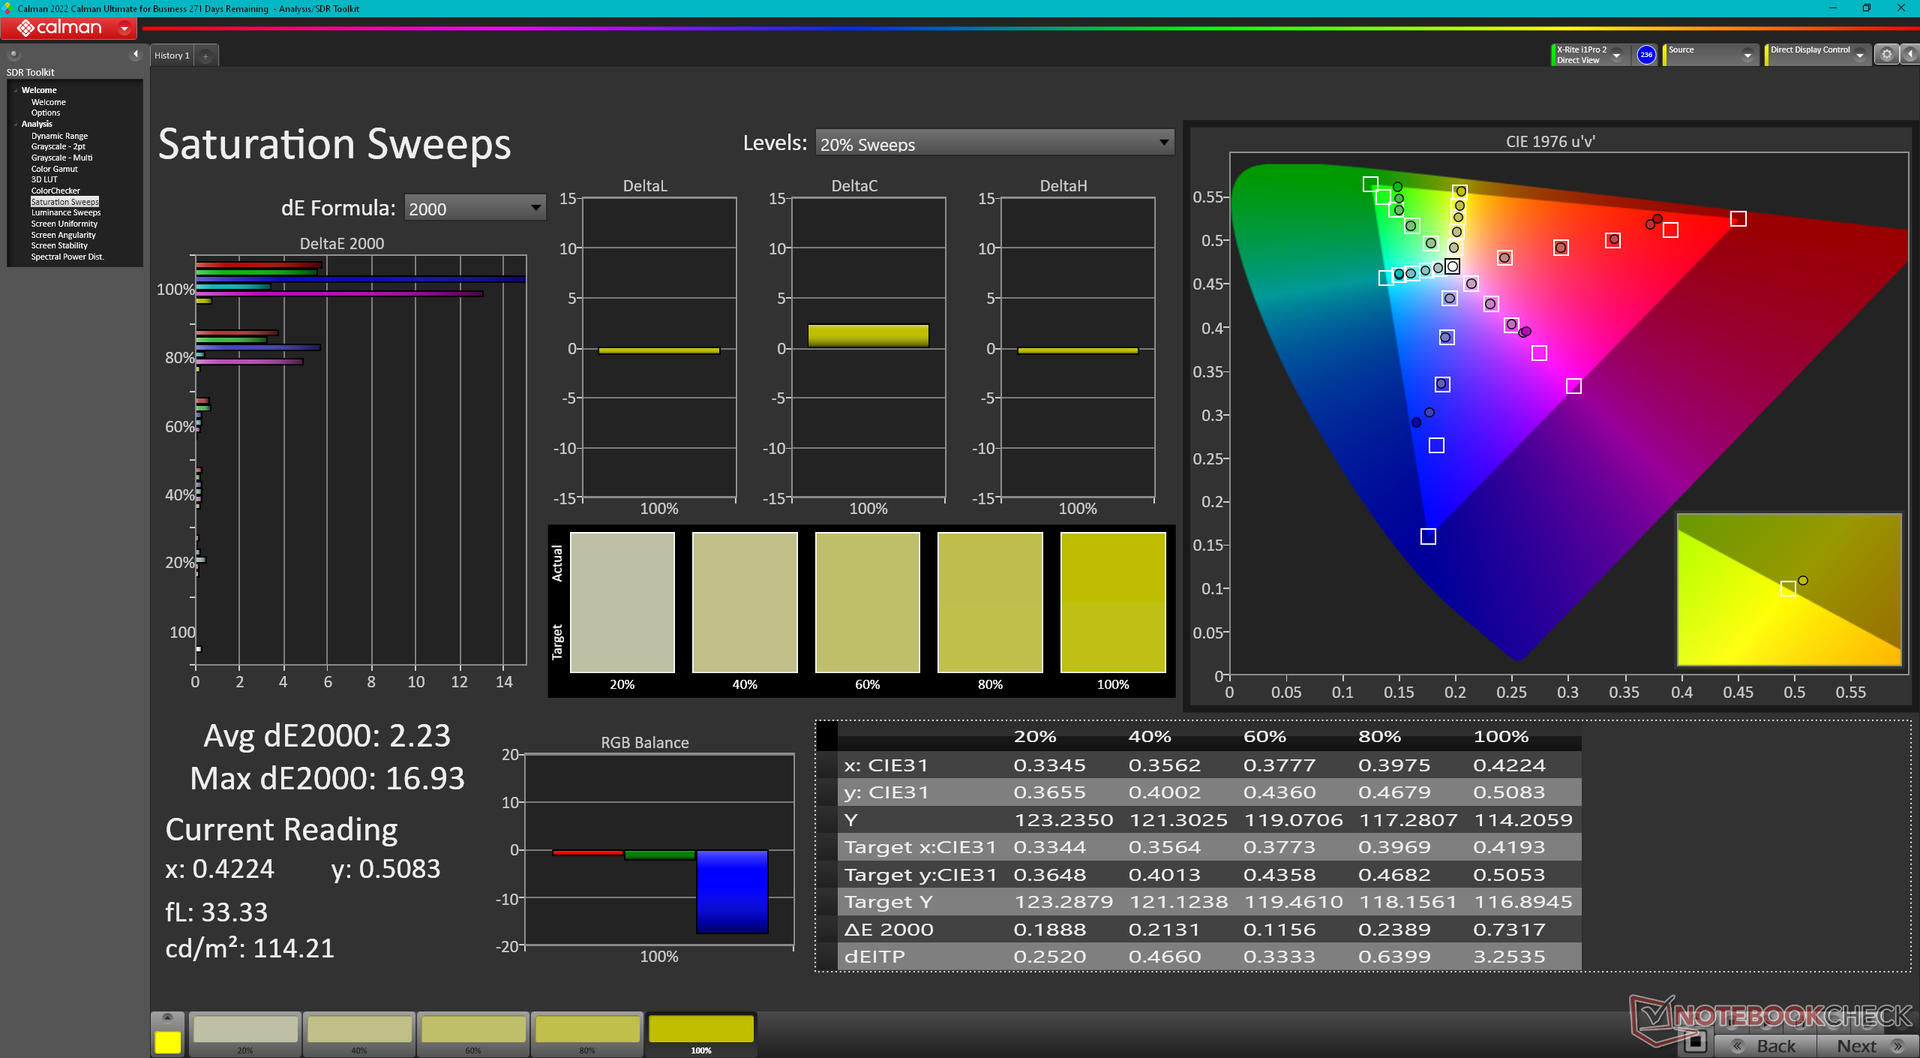
Ekran, sırasıyla 3,2 ve 4,51 olan ortalama gri tonlama ve renk deltaE değerleriyle kalibre edilmiş olarak gelmiyor. Ekranın bir X-Rite renk ölçer ile kalibre edilmesi bu ortalamaları sadece 0,3 ve 1,82'ye düşürecektir. Bununla birlikte, yukarıda bahsedilen sınırlı renk alanı nedeniyle renkler daha yüksek doygunluk seviyelerinde giderek daha hatalı hale gelmektedir. Örneğin mavi, kalibrasyondan sonra bile 20,94 gibi çok yüksek bir deltaE değerinden muzdariptir.
Kalibre edilmiş ICM profilimiz yukarıda ücretsiz olarak indirilebilir.
Yanıt Sürelerini Görüntüle
| ↔ Tepki Süresi Siyahtan Beyaza | ||
|---|---|---|
| 26.9 ms ... yükseliş ↗ ve sonbahar↘ birleşimi | ↗ 13.8 ms yükseliş | 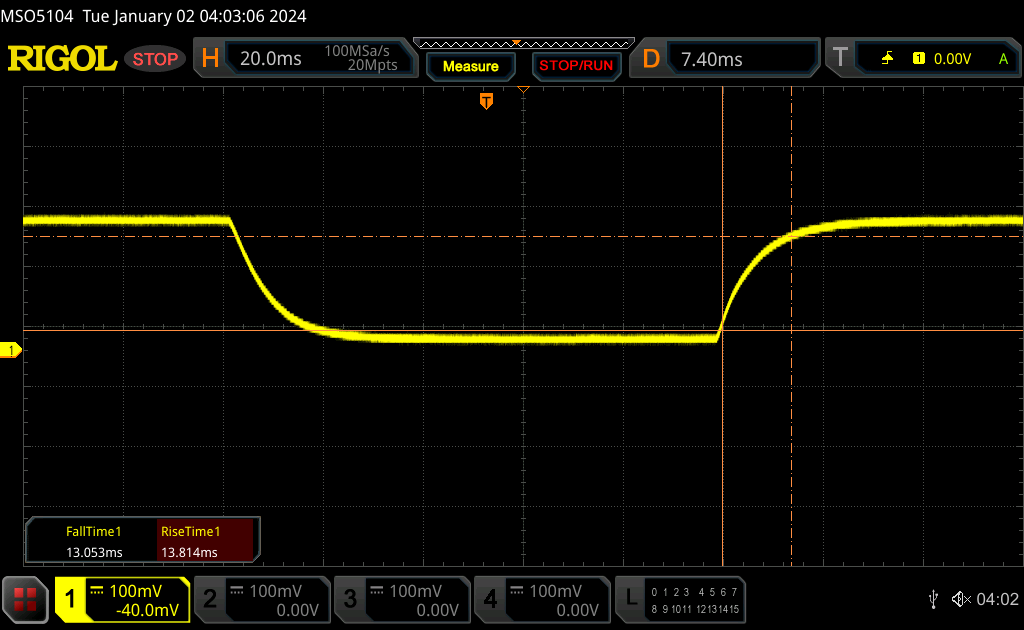 |
| ↘ 13.1 ms sonbahar | ||
| Ekran, testlerimizde nispeten yavaş yanıt oranları gösteriyor ve oyuncular için çok yavaş olabilir. Karşılaştırıldığında, test edilen tüm cihazlar 0.1 (minimum) ile 240 (maksimum) ms arasında değişir. » Tüm cihazların 67 %'si daha iyi. Bu, ölçülen yanıt süresinin test edilen tüm cihazların ortalamasından (19.8 ms) daha kötü olduğu anlamına gelir. | ||
| ↔ Tepki Süresi %50 Griden %80 Griye | ||
| 39 ms ... yükseliş ↗ ve sonbahar↘ birleşimi | ↗ 18 ms yükseliş | 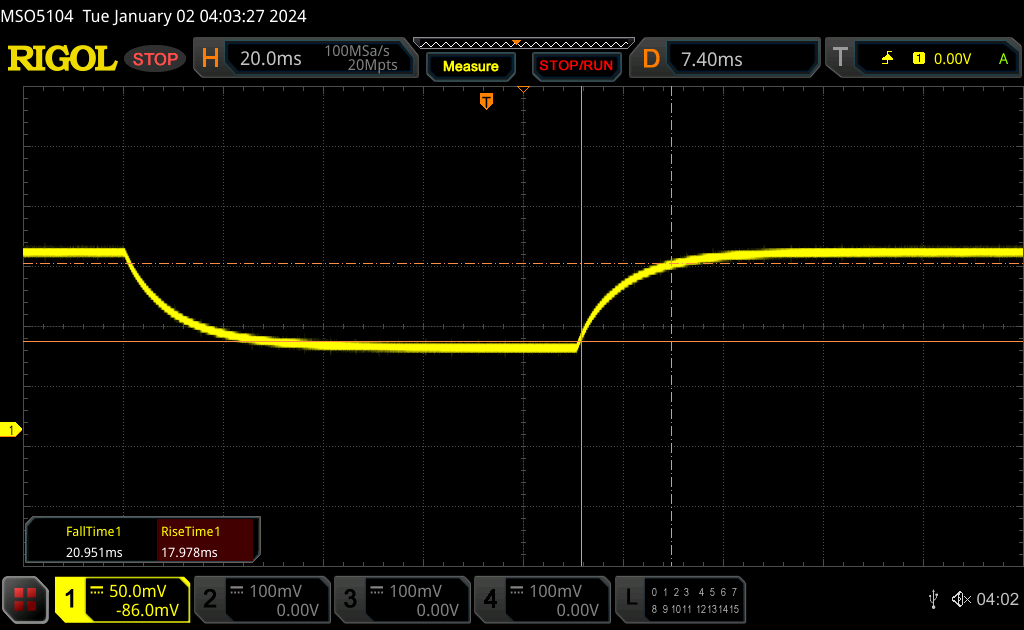 |
| ↘ 21 ms sonbahar | ||
| Ekran, testlerimizde yavaş yanıt oranları gösteriyor ve oyuncular için yetersiz olacaktır. Karşılaştırıldığında, test edilen tüm cihazlar 0.165 (minimum) ile 636 (maksimum) ms arasında değişir. » Tüm cihazların 59 %'si daha iyi. Bu, ölçülen yanıt süresinin test edilen tüm cihazların ortalamasından (31 ms) daha kötü olduğu anlamına gelir. | ||
Ekran Titremesi / PWM (Darbe Genişliği Modülasyonu)
| Ekran titriyor / PWM algılanmadı | 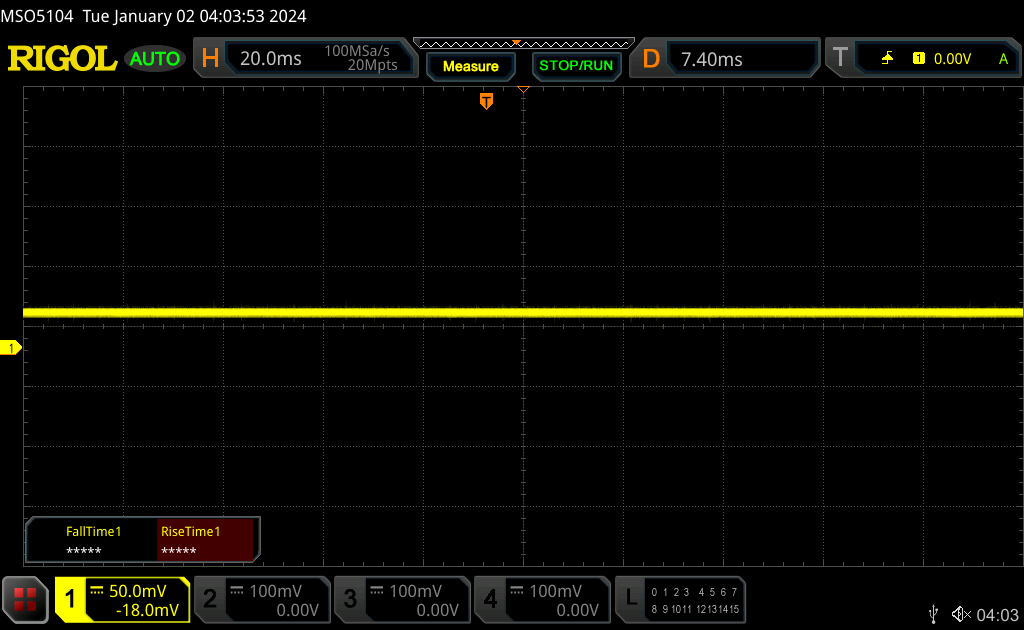 | ||
Karşılaştırıldığında: Test edilen tüm cihazların %52 %'si ekranı karartmak için PWM kullanmıyor. PWM tespit edilirse, ortalama 7757 (minimum: 5 - maksimum: 343500) Hz ölçüldü. | |||
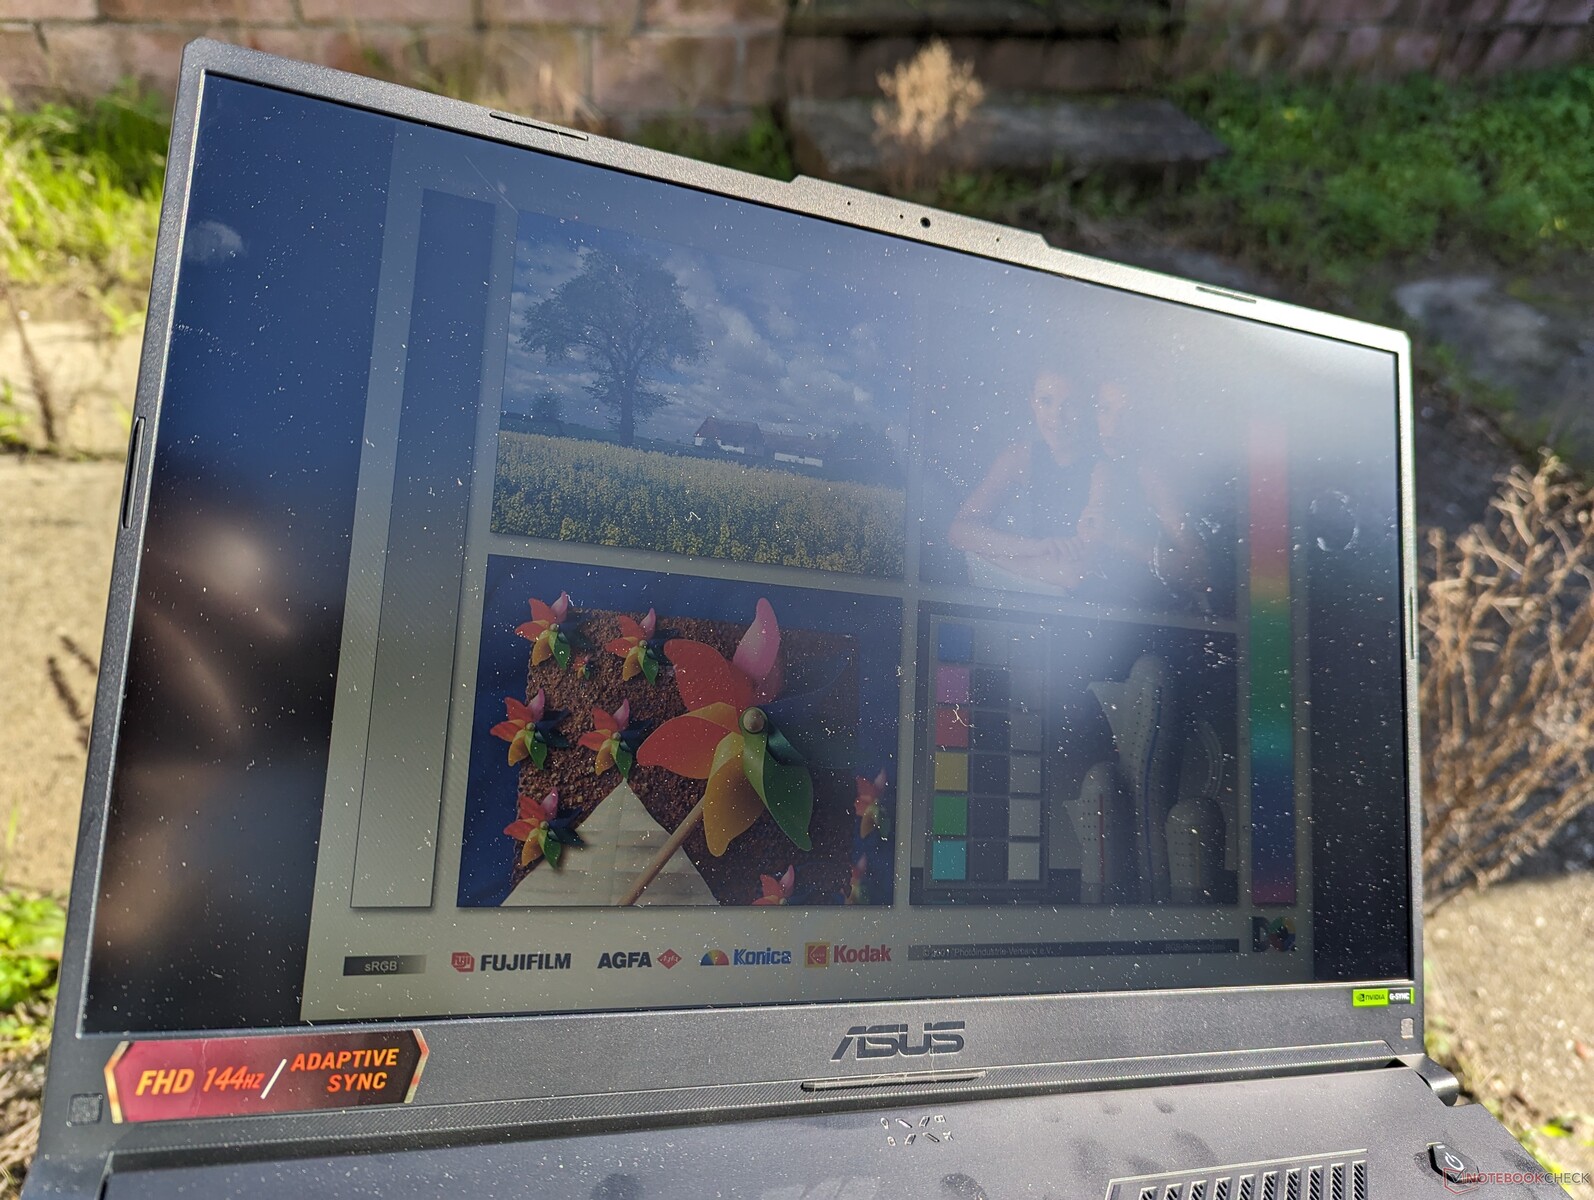
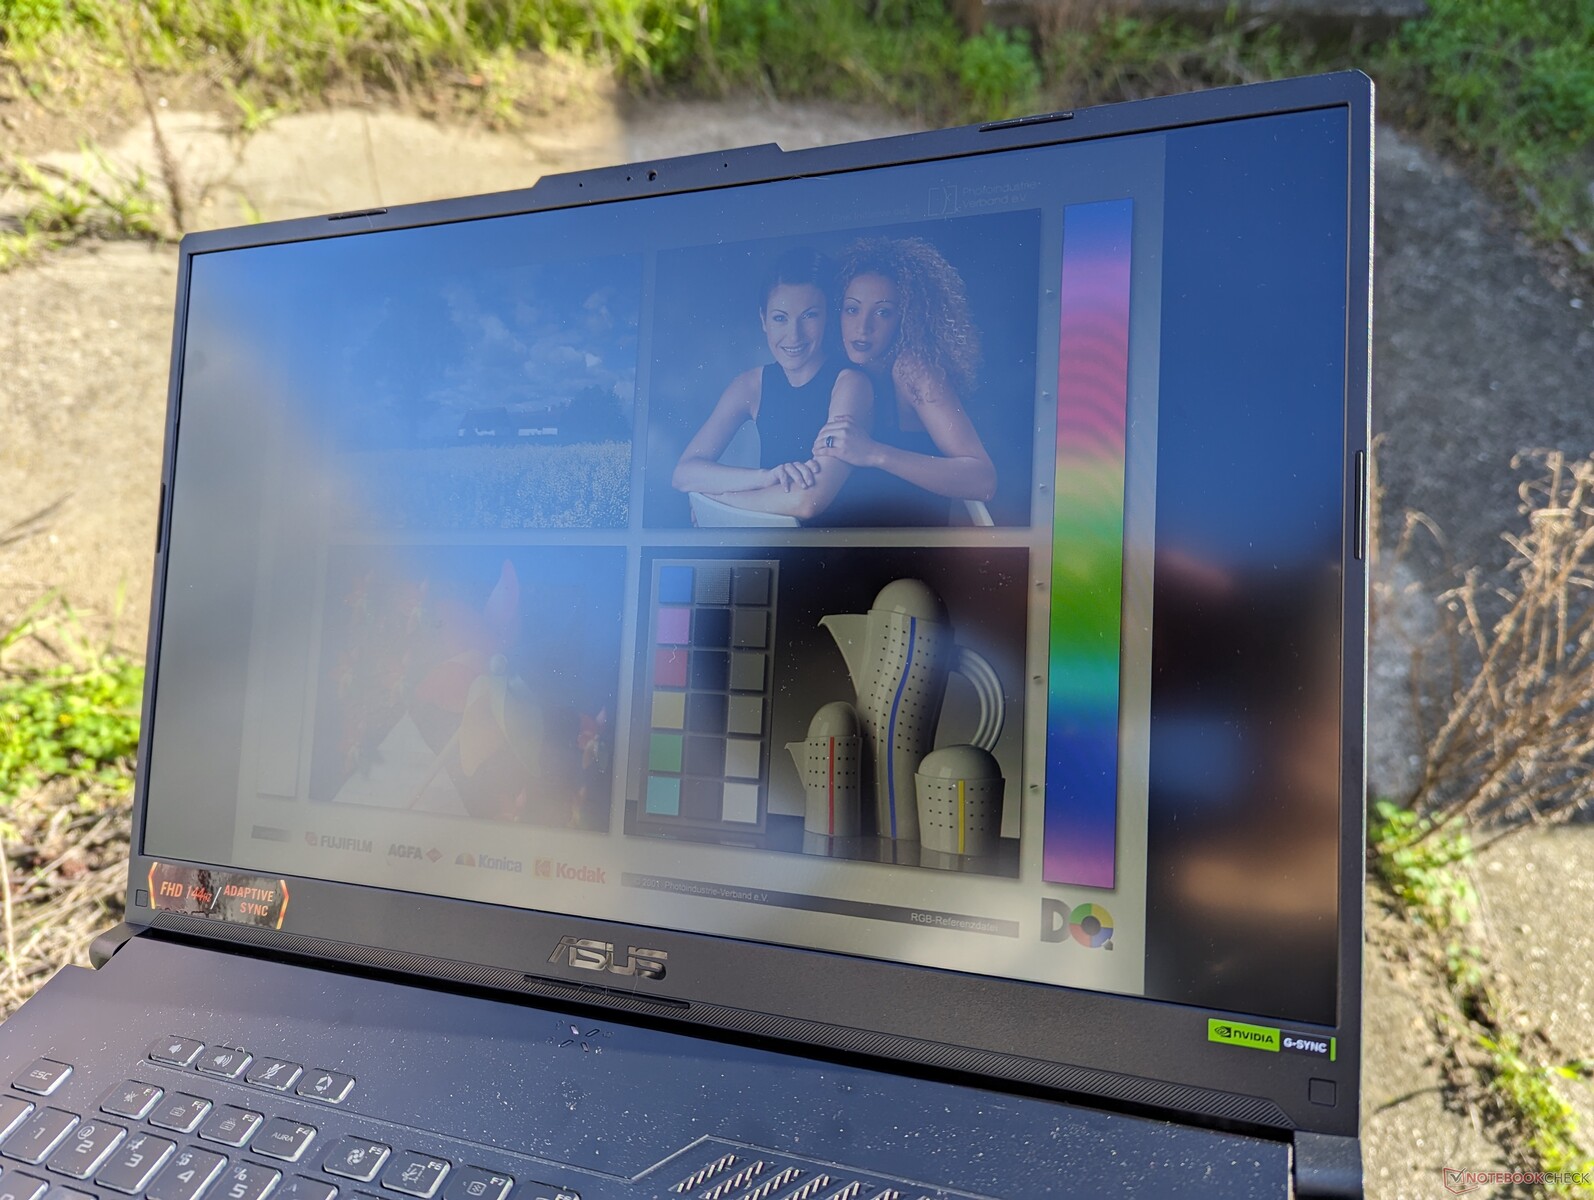
Parlamayı azaltan mat panele rağmen dış mekan görünürlüğü nispeten zayıftır. Maksimum parlaklık, dizüstü bilgisayarlardaki neredeyse iki katına kıyasla yalnızca 250 ila 300 nit civarındadır MacBook Pro 16 veya rakip Lenovo Legion Slim 7 16.
Performans
Test Koşulları
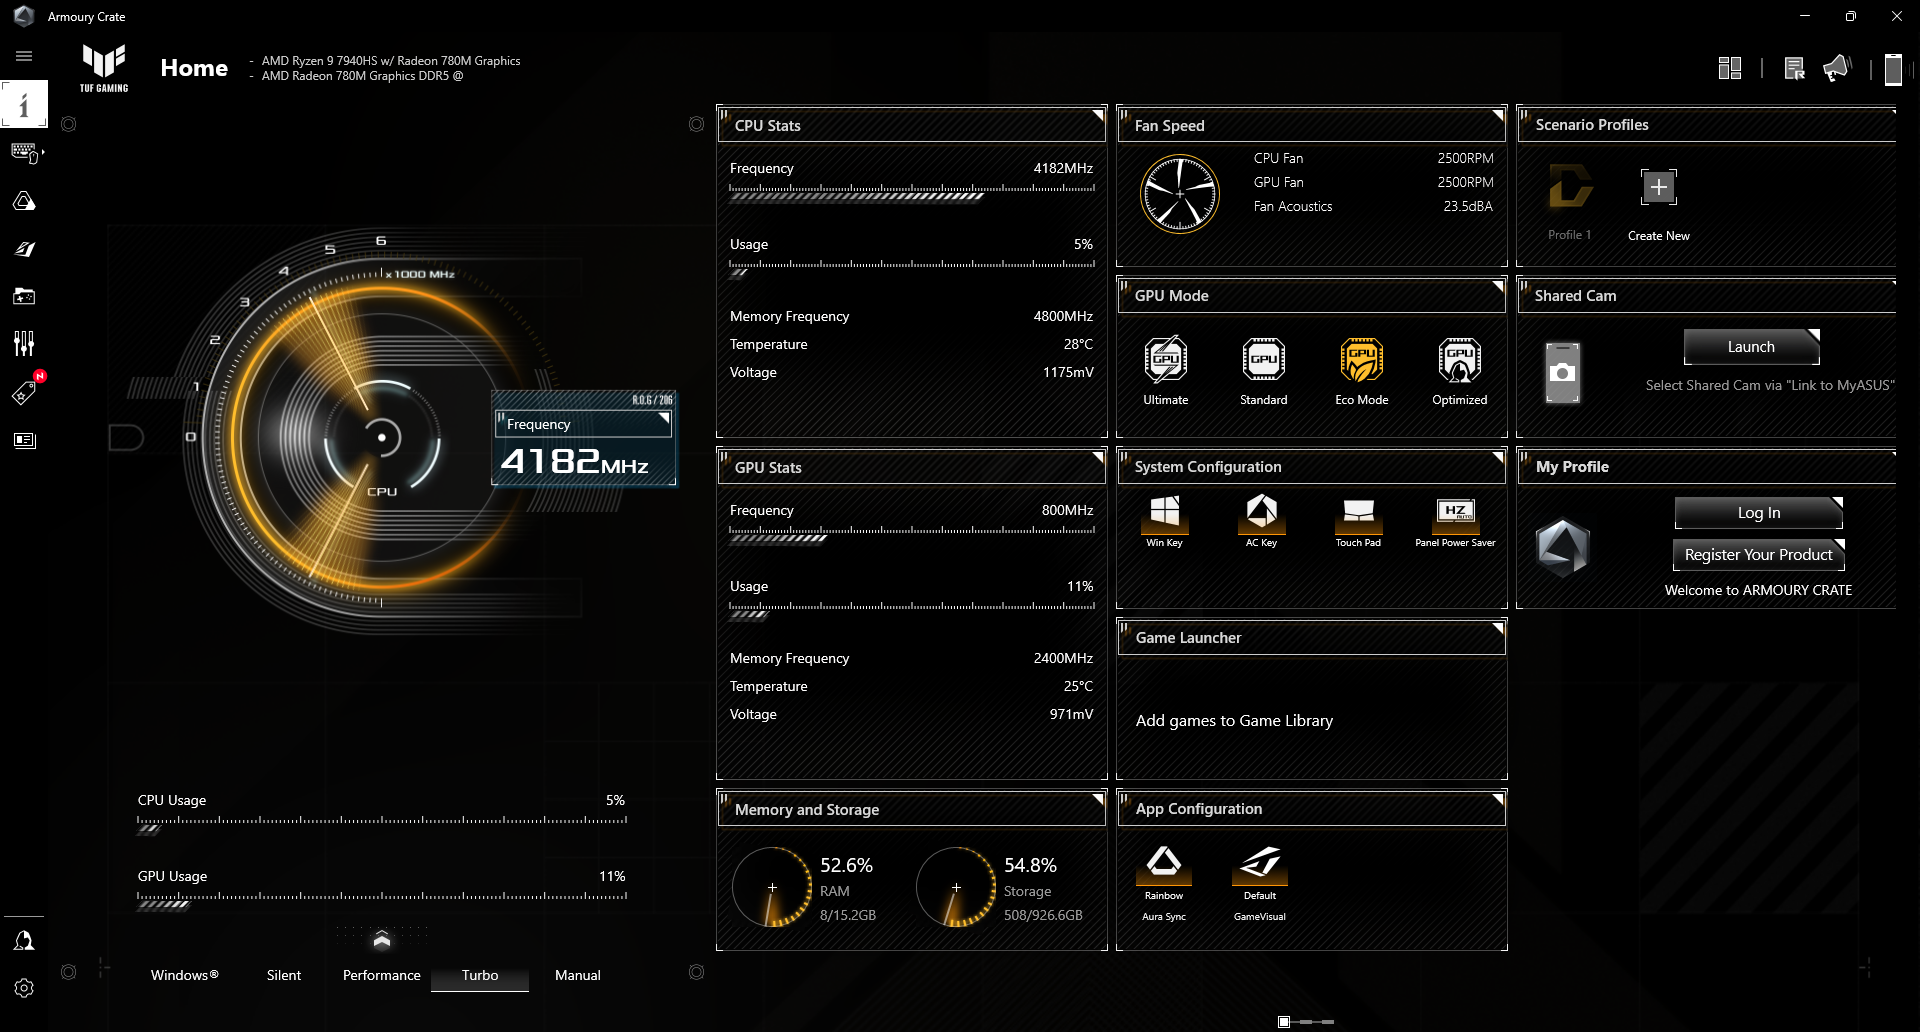
Aşağıdaki kıyaslamaları çalıştırmadan önce Asus Armoury Crate'i Turbo moduna ve Ultimate GPU moduna ayarladık. Armoury Crate güç profillerinin değiştirilmesi Windows güç profillerini de otomatik olarak değiştirir. Performans modunun mevcut en hızlı güç profili olmadığını unutmayın; bu unvan onun yerine Turbo moduna gider.
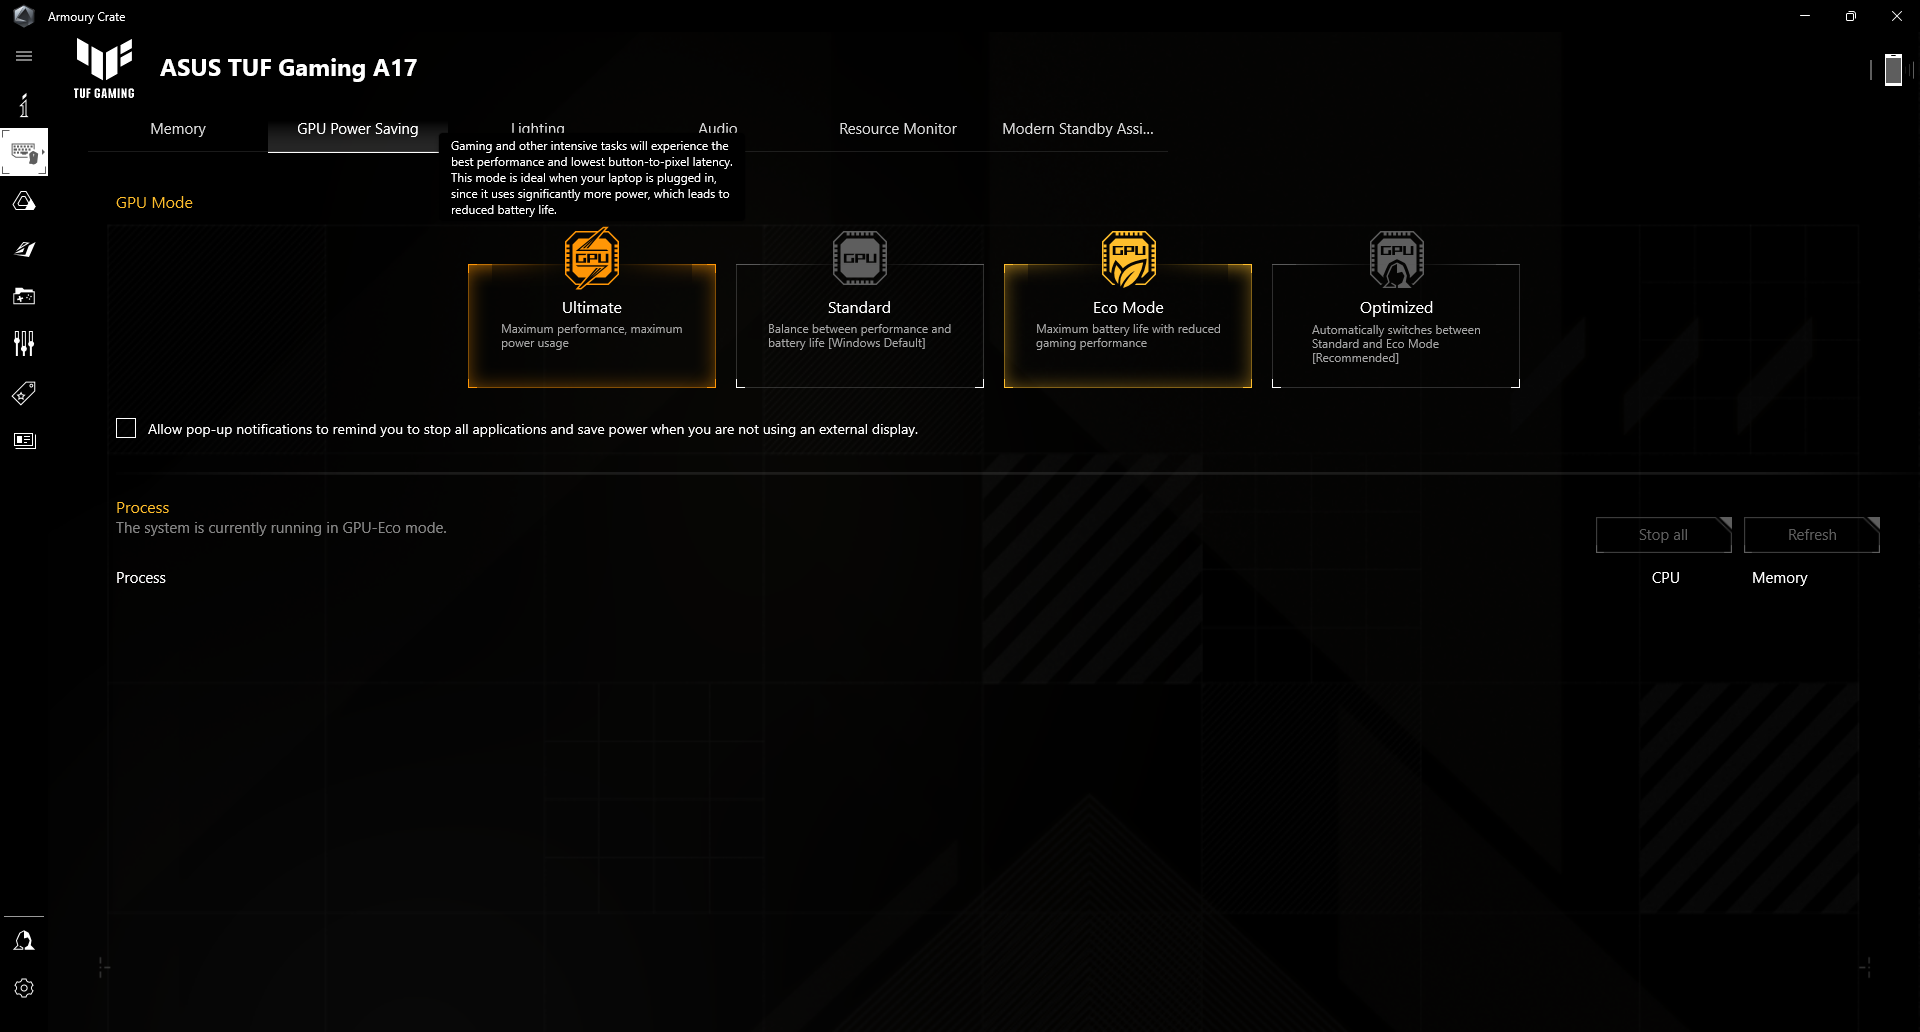
Bu arada, dört GPU modu MUX ve Advanced Optimus'a aşağıdaki gibi bağlanmıştır:
- Üst düzey mod: Ayrık GPU tüm görevler için etkindir. Yumuşak bir yeniden başlatma gereklidir. Bu aynı zamanda dahili monitörde G-Sync'i etkinleştirmek için de gereklidir.
- Standart mod: Microsoft MSHybrid olarak da bilinir. Zorlu uygulamalar için dGPU ve diğer görevler için iGPU arasında otomatik geçiş.
- Eko modu: Ayrık GPU devre dışı bırakılır ve tüm uygulamalar iGPU üzerinde çalışır.
- Optimize edilmiş mod: AC gücündeyken zorlu uygulamalar için dGPU ve diğer görevler için iGPU arasında otomatik geçiş. Pil gücündeyse dGPU otomatik olarak devre dışı bırakılır.
İşlemci
Bu Ryzen 9 7940HS doğrudan ortak şirket ile rekabet eder Core i7-13700H. Ham performans, hem tek hem de çok iş parçacıklı yüklerde Intel muadilinin sadece birkaç yüzde puanı içinde. Intel'in aksine büyük bir yavaşlama sorunu da gözlemlemiyoruz TUF Gaming F17 FX707Z eski 12. nesil Core i7-12700H ile.
Aşağıya doğru Ryzen 7 7735HS ryzen 9 7940HS'nin işlemci performansını yaklaşık yüzde 15 ila 20 oranında etkileyecektir. Ryzen 7 seçeneği, özellikle GPU'nun neredeyse her zaman darboğaz olduğu orta seviye seviyemizde oyun oynamak için hala oldukça hızlıdır, ancak yüksek yenileme hızı panelinden her kareyi sıkmak isteyen oyuncular Ryzen 9'u düşünmelidir.
Cinebench R15 Multi Loop
Cinebench R23: Multi Core | Single Core
Cinebench R20: CPU (Multi Core) | CPU (Single Core)
Cinebench R15: CPU Multi 64Bit | CPU Single 64Bit
Blender: v2.79 BMW27 CPU
7-Zip 18.03: 7z b 4 | 7z b 4 -mmt1
Geekbench 5.5: Multi-Core | Single-Core
HWBOT x265 Benchmark v2.2: 4k Preset
LibreOffice : 20 Documents To PDF
R Benchmark 2.5: Overall mean
| CPU Performance rating | |
| MSI Raider GE78 HX 13VI | |
| Asus ROG Strix G17 G713PI | |
| Eurocom Raptor X17 | |
| MSI Stealth 17 Studio A13VH-014 | |
| Asus TUF Gaming A17 FA707XI-NS94 | |
| Ortalama AMD Ryzen 9 7940HS | |
| MSI Pulse 17 B13VGK | |
| Razer Blade 17 (i7-12800H, RTX 3070 Ti) | |
| MSI Katana 17 B13VFK | |
| Asus TUF Gaming F17 FX707Z-HX011W | |
| Acer Nitro 17 AN17-41-R9LN | |
| Asus ROG Strix G17 G713QE-RB74 -2! | |
| HP Pavilion Gaming 17-cd2146ng | |
| Cinebench R23 / Multi Core | |
| Asus ROG Strix G17 G713PI | |
| MSI Raider GE78 HX 13VI | |
| Eurocom Raptor X17 | |
| MSI Stealth 17 Studio A13VH-014 | |
| MSI Pulse 17 B13VGK | |
| Asus TUF Gaming A17 FA707XI-NS94 | |
| Ortalama AMD Ryzen 9 7940HS (15556 - 18131, n=12) | |
| MSI Katana 17 B13VFK | |
| Razer Blade 17 (i7-12800H, RTX 3070 Ti) | |
| Acer Nitro 17 AN17-41-R9LN | |
| Asus TUF Gaming F17 FX707Z-HX011W | |
| Asus ROG Strix G17 G713QE-RB74 | |
| HP Pavilion Gaming 17-cd2146ng | |
| Cinebench R23 / Single Core | |
| MSI Raider GE78 HX 13VI | |
| Eurocom Raptor X17 | |
| Asus ROG Strix G17 G713PI | |
| Asus TUF Gaming A17 FA707XI-NS94 | |
| Razer Blade 17 (i7-12800H, RTX 3070 Ti) | |
| MSI Katana 17 B13VFK | |
| Asus TUF Gaming F17 FX707Z-HX011W | |
| Ortalama AMD Ryzen 9 7940HS (1733 - 1832, n=12) | |
| MSI Stealth 17 Studio A13VH-014 | |
| MSI Pulse 17 B13VGK | |
| Acer Nitro 17 AN17-41-R9LN | |
| Asus ROG Strix G17 G713QE-RB74 | |
| HP Pavilion Gaming 17-cd2146ng | |
| Cinebench R20 / CPU (Multi Core) | |
| MSI Raider GE78 HX 13VI | |
| Eurocom Raptor X17 | |
| Asus ROG Strix G17 G713PI | |
| MSI Stealth 17 Studio A13VH-014 | |
| MSI Pulse 17 B13VGK | |
| Asus TUF Gaming A17 FA707XI-NS94 | |
| Ortalama AMD Ryzen 9 7940HS (6277 - 7111, n=12) | |
| MSI Katana 17 B13VFK | |
| Acer Nitro 17 AN17-41-R9LN | |
| Razer Blade 17 (i7-12800H, RTX 3070 Ti) | |
| Asus ROG Strix G17 G713QE-RB74 | |
| Asus TUF Gaming F17 FX707Z-HX011W | |
| HP Pavilion Gaming 17-cd2146ng | |
| Cinebench R20 / CPU (Single Core) | |
| MSI Raider GE78 HX 13VI | |
| Eurocom Raptor X17 | |
| Asus TUF Gaming A17 FA707XI-NS94 | |
| Asus ROG Strix G17 G713PI | |
| Razer Blade 17 (i7-12800H, RTX 3070 Ti) | |
| Ortalama AMD Ryzen 9 7940HS (679 - 714, n=12) | |
| MSI Katana 17 B13VFK | |
| Asus TUF Gaming F17 FX707Z-HX011W | |
| MSI Pulse 17 B13VGK | |
| MSI Stealth 17 Studio A13VH-014 | |
| Acer Nitro 17 AN17-41-R9LN | |
| Asus ROG Strix G17 G713QE-RB74 | |
| HP Pavilion Gaming 17-cd2146ng | |
| Cinebench R15 / CPU Multi 64Bit | |
| Asus ROG Strix G17 G713PI | |
| MSI Raider GE78 HX 13VI | |
| Eurocom Raptor X17 | |
| MSI Stealth 17 Studio A13VH-014 | |
| MSI Pulse 17 B13VGK | |
| Asus TUF Gaming F17 FX707Z-HX011W | |
| Asus TUF Gaming A17 FA707XI-NS94 | |
| Razer Blade 17 (i7-12800H, RTX 3070 Ti) | |
| Ortalama AMD Ryzen 9 7940HS (2470 - 2848, n=12) | |
| MSI Katana 17 B13VFK | |
| Acer Nitro 17 AN17-41-R9LN | |
| Asus ROG Strix G17 G713QE-RB74 | |
| HP Pavilion Gaming 17-cd2146ng | |
| Cinebench R15 / CPU Single 64Bit | |
| MSI Raider GE78 HX 13VI | |
| Asus ROG Strix G17 G713PI | |
| Eurocom Raptor X17 | |
| Asus TUF Gaming A17 FA707XI-NS94 | |
| MSI Stealth 17 Studio A13VH-014 | |
| Ortalama AMD Ryzen 9 7940HS (258 - 288, n=12) | |
| Razer Blade 17 (i7-12800H, RTX 3070 Ti) | |
| MSI Katana 17 B13VFK | |
| Asus TUF Gaming F17 FX707Z-HX011W | |
| Acer Nitro 17 AN17-41-R9LN | |
| MSI Pulse 17 B13VGK | |
| Asus ROG Strix G17 G713QE-RB74 | |
| HP Pavilion Gaming 17-cd2146ng | |
| Blender / v2.79 BMW27 CPU | |
| HP Pavilion Gaming 17-cd2146ng | |
| Asus TUF Gaming F17 FX707Z-HX011W | |
| Asus ROG Strix G17 G713QE-RB74 | |
| Acer Nitro 17 AN17-41-R9LN | |
| Razer Blade 17 (i7-12800H, RTX 3070 Ti) | |
| MSI Katana 17 B13VFK | |
| Ortalama AMD Ryzen 9 7940HS (182 - 202, n=11) | |
| Asus TUF Gaming A17 FA707XI-NS94 | |
| MSI Pulse 17 B13VGK | |
| MSI Stealth 17 Studio A13VH-014 | |
| Eurocom Raptor X17 | |
| MSI Raider GE78 HX 13VI | |
| Asus ROG Strix G17 G713PI | |
| 7-Zip 18.03 / 7z b 4 | |
| Asus ROG Strix G17 G713PI | |
| MSI Raider GE78 HX 13VI | |
| Eurocom Raptor X17 | |
| MSI Stealth 17 Studio A13VH-014 | |
| MSI Pulse 17 B13VGK | |
| Asus TUF Gaming A17 FA707XI-NS94 | |
| Ortalama AMD Ryzen 9 7940HS (63459 - 73434, n=12) | |
| MSI Katana 17 B13VFK | |
| Razer Blade 17 (i7-12800H, RTX 3070 Ti) | |
| Acer Nitro 17 AN17-41-R9LN | |
| Asus TUF Gaming F17 FX707Z-HX011W | |
| Asus ROG Strix G17 G713QE-RB74 | |
| HP Pavilion Gaming 17-cd2146ng | |
| 7-Zip 18.03 / 7z b 4 -mmt1 | |
| Asus ROG Strix G17 G713PI | |
| MSI Raider GE78 HX 13VI | |
| Asus TUF Gaming A17 FA707XI-NS94 | |
| Ortalama AMD Ryzen 9 7940HS (6310 - 6776, n=12) | |
| Eurocom Raptor X17 | |
| MSI Stealth 17 Studio A13VH-014 | |
| Acer Nitro 17 AN17-41-R9LN | |
| Razer Blade 17 (i7-12800H, RTX 3070 Ti) | |
| MSI Katana 17 B13VFK | |
| Asus TUF Gaming F17 FX707Z-HX011W | |
| Asus ROG Strix G17 G713QE-RB74 | |
| MSI Pulse 17 B13VGK | |
| HP Pavilion Gaming 17-cd2146ng | |
| Geekbench 5.5 / Multi-Core | |
| MSI Raider GE78 HX 13VI | |
| Eurocom Raptor X17 | |
| Asus ROG Strix G17 G713PI | |
| MSI Stealth 17 Studio A13VH-014 | |
| MSI Pulse 17 B13VGK | |
| Asus TUF Gaming F17 FX707Z-HX011W | |
| Razer Blade 17 (i7-12800H, RTX 3070 Ti) | |
| Ortalama AMD Ryzen 9 7940HS (10089 - 12500, n=13) | |
| Asus TUF Gaming A17 FA707XI-NS94 | |
| MSI Katana 17 B13VFK | |
| Acer Nitro 17 AN17-41-R9LN | |
| HP Pavilion Gaming 17-cd2146ng | |
| Geekbench 5.5 / Single-Core | |
| Asus ROG Strix G17 G713PI | |
| MSI Stealth 17 Studio A13VH-014 | |
| Asus TUF Gaming A17 FA707XI-NS94 | |
| MSI Raider GE78 HX 13VI | |
| Ortalama AMD Ryzen 9 7940HS (1823 - 2032, n=13) | |
| Eurocom Raptor X17 | |
| MSI Katana 17 B13VFK | |
| Razer Blade 17 (i7-12800H, RTX 3070 Ti) | |
| Asus TUF Gaming F17 FX707Z-HX011W | |
| MSI Pulse 17 B13VGK | |
| Acer Nitro 17 AN17-41-R9LN | |
| HP Pavilion Gaming 17-cd2146ng | |
| HWBOT x265 Benchmark v2.2 / 4k Preset | |
| Asus ROG Strix G17 G713PI | |
| MSI Raider GE78 HX 13VI | |
| Eurocom Raptor X17 | |
| MSI Stealth 17 Studio A13VH-014 | |
| Asus TUF Gaming A17 FA707XI-NS94 | |
| MSI Pulse 17 B13VGK | |
| Ortalama AMD Ryzen 9 7940HS (18.5 - 22.6, n=11) | |
| MSI Katana 17 B13VFK | |
| Acer Nitro 17 AN17-41-R9LN | |
| Razer Blade 17 (i7-12800H, RTX 3070 Ti) | |
| Asus ROG Strix G17 G713QE-RB74 | |
| Asus TUF Gaming F17 FX707Z-HX011W | |
| HP Pavilion Gaming 17-cd2146ng | |
| LibreOffice / 20 Documents To PDF | |
| Asus TUF Gaming F17 FX707Z-HX011W | |
| Acer Nitro 17 AN17-41-R9LN | |
| MSI Pulse 17 B13VGK | |
| HP Pavilion Gaming 17-cd2146ng | |
| MSI Katana 17 B13VFK | |
| Asus ROG Strix G17 G713QE-RB74 | |
| MSI Stealth 17 Studio A13VH-014 | |
| Asus TUF Gaming A17 FA707XI-NS94 | |
| Ortalama AMD Ryzen 9 7940HS (36.9 - 54.8, n=12) | |
| Asus ROG Strix G17 G713PI | |
| MSI Raider GE78 HX 13VI | |
| Razer Blade 17 (i7-12800H, RTX 3070 Ti) | |
| Eurocom Raptor X17 | |
| R Benchmark 2.5 / Overall mean | |
| HP Pavilion Gaming 17-cd2146ng | |
| Asus ROG Strix G17 G713QE-RB74 | |
| Acer Nitro 17 AN17-41-R9LN | |
| MSI Pulse 17 B13VGK | |
| Asus TUF Gaming F17 FX707Z-HX011W | |
| Razer Blade 17 (i7-12800H, RTX 3070 Ti) | |
| MSI Katana 17 B13VFK | |
| Ortalama AMD Ryzen 9 7940HS (0.4159 - 0.4467, n=12) | |
| MSI Stealth 17 Studio A13VH-014 | |
| Asus TUF Gaming A17 FA707XI-NS94 | |
| Asus ROG Strix G17 G713PI | |
| Eurocom Raptor X17 | |
| MSI Raider GE78 HX 13VI | |
Cinebench R23: Multi Core | Single Core
Cinebench R20: CPU (Multi Core) | CPU (Single Core)
Cinebench R15: CPU Multi 64Bit | CPU Single 64Bit
Blender: v2.79 BMW27 CPU
7-Zip 18.03: 7z b 4 | 7z b 4 -mmt1
Geekbench 5.5: Multi-Core | Single-Core
HWBOT x265 Benchmark v2.2: 4k Preset
LibreOffice : 20 Documents To PDF
R Benchmark 2.5: Overall mean
* ... daha küçük daha iyidir
AIDA64: FP32 Ray-Trace | FPU Julia | CPU SHA3 | CPU Queen | FPU SinJulia | FPU Mandel | CPU AES | CPU ZLib | FP64 Ray-Trace | CPU PhotoWorxx
| Performance rating | |
| Asus TUF Gaming A17 FA707XI-NS94 | |
| Ortalama AMD Ryzen 9 7940HS | |
| MSI Pulse 17 B13VGK | |
| MSI Katana 17 B13VFK | |
| Razer Blade 17 (i7-12800H, RTX 3070 Ti) | |
| Asus TUF Gaming F17 FX707Z-HX011W | |
| HP Pavilion Gaming 17-cd2146ng | |
| AIDA64 / FP32 Ray-Trace | |
| Asus TUF Gaming A17 FA707XI-NS94 | |
| Ortalama AMD Ryzen 9 7940HS (25226 - 29109, n=10) | |
| MSI Pulse 17 B13VGK | |
| MSI Katana 17 B13VFK | |
| Razer Blade 17 (i7-12800H, RTX 3070 Ti) | |
| HP Pavilion Gaming 17-cd2146ng | |
| Asus TUF Gaming F17 FX707Z-HX011W | |
| AIDA64 / FPU Julia | |
| Asus TUF Gaming A17 FA707XI-NS94 | |
| Ortalama AMD Ryzen 9 7940HS (106512 - 123214, n=10) | |
| MSI Pulse 17 B13VGK | |
| MSI Katana 17 B13VFK | |
| Razer Blade 17 (i7-12800H, RTX 3070 Ti) | |
| Asus TUF Gaming F17 FX707Z-HX011W | |
| HP Pavilion Gaming 17-cd2146ng | |
| AIDA64 / CPU SHA3 | |
| Asus TUF Gaming A17 FA707XI-NS94 | |
| Ortalama AMD Ryzen 9 7940HS (4566 - 5119, n=10) | |
| MSI Pulse 17 B13VGK | |
| MSI Katana 17 B13VFK | |
| Razer Blade 17 (i7-12800H, RTX 3070 Ti) | |
| Asus TUF Gaming F17 FX707Z-HX011W | |
| HP Pavilion Gaming 17-cd2146ng | |
| AIDA64 / CPU Queen | |
| Asus TUF Gaming A17 FA707XI-NS94 | |
| Ortalama AMD Ryzen 9 7940HS (118174 - 124783, n=10) | |
| Asus TUF Gaming F17 FX707Z-HX011W | |
| MSI Pulse 17 B13VGK | |
| Razer Blade 17 (i7-12800H, RTX 3070 Ti) | |
| MSI Katana 17 B13VFK | |
| HP Pavilion Gaming 17-cd2146ng | |
| AIDA64 / FPU SinJulia | |
| Asus TUF Gaming A17 FA707XI-NS94 | |
| Ortalama AMD Ryzen 9 7940HS (14663 - 15551, n=10) | |
| MSI Pulse 17 B13VGK | |
| Razer Blade 17 (i7-12800H, RTX 3070 Ti) | |
| MSI Katana 17 B13VFK | |
| Asus TUF Gaming F17 FX707Z-HX011W | |
| HP Pavilion Gaming 17-cd2146ng | |
| AIDA64 / FPU Mandel | |
| Asus TUF Gaming A17 FA707XI-NS94 | |
| Ortalama AMD Ryzen 9 7940HS (56839 - 66238, n=10) | |
| MSI Pulse 17 B13VGK | |
| MSI Katana 17 B13VFK | |
| Razer Blade 17 (i7-12800H, RTX 3070 Ti) | |
| Asus TUF Gaming F17 FX707Z-HX011W | |
| HP Pavilion Gaming 17-cd2146ng | |
| AIDA64 / CPU AES | |
| Ortalama AMD Ryzen 9 7940HS (86309 - 171350, n=10) | |
| Asus TUF Gaming A17 FA707XI-NS94 | |
| MSI Pulse 17 B13VGK | |
| MSI Katana 17 B13VFK | |
| Razer Blade 17 (i7-12800H, RTX 3070 Ti) | |
| Asus TUF Gaming F17 FX707Z-HX011W | |
| HP Pavilion Gaming 17-cd2146ng | |
| AIDA64 / CPU ZLib | |
| MSI Pulse 17 B13VGK | |
| Asus TUF Gaming A17 FA707XI-NS94 | |
| Ortalama AMD Ryzen 9 7940HS (866 - 1152, n=10) | |
| Razer Blade 17 (i7-12800H, RTX 3070 Ti) | |
| MSI Katana 17 B13VFK | |
| Asus TUF Gaming F17 FX707Z-HX011W | |
| HP Pavilion Gaming 17-cd2146ng | |
| AIDA64 / FP64 Ray-Trace | |
| Asus TUF Gaming A17 FA707XI-NS94 | |
| Ortalama AMD Ryzen 9 7940HS (13175 - 15675, n=10) | |
| MSI Pulse 17 B13VGK | |
| MSI Katana 17 B13VFK | |
| Razer Blade 17 (i7-12800H, RTX 3070 Ti) | |
| Asus TUF Gaming F17 FX707Z-HX011W | |
| HP Pavilion Gaming 17-cd2146ng | |
| AIDA64 / CPU PhotoWorxx | |
| MSI Pulse 17 B13VGK | |
| Ortalama AMD Ryzen 9 7940HS (22477 - 41567, n=10) | |
| MSI Katana 17 B13VFK | |
| Asus TUF Gaming A17 FA707XI-NS94 | |
| Asus TUF Gaming F17 FX707Z-HX011W | |
| Razer Blade 17 (i7-12800H, RTX 3070 Ti) | |
| HP Pavilion Gaming 17-cd2146ng | |
Sistem Performansı
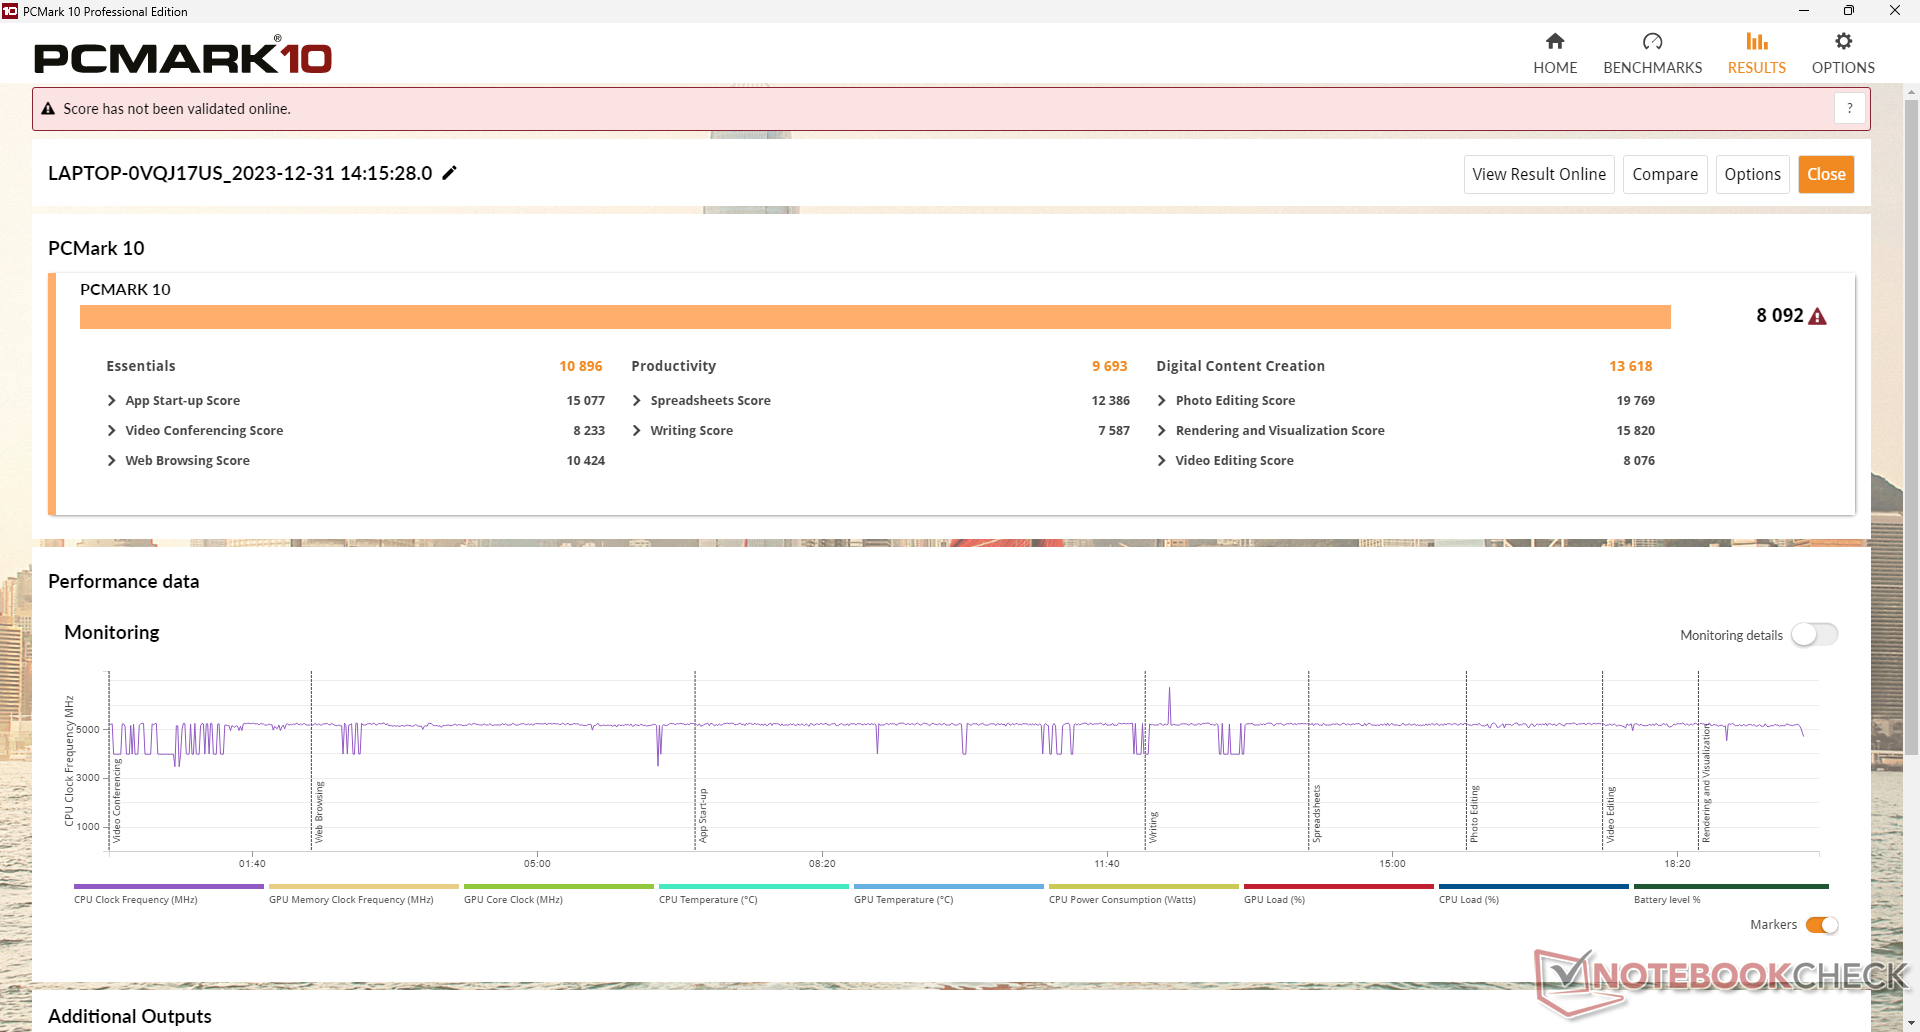
PCMark skorları, hızlı Zen 4 Ryzen 7 CPU ve GeForce RTX 4070 GPU sayesinde 13. nesil Core i7 destekli oyun dizüstü bilgisayarları arasında en yüksek skorlardan bazılarıdır. Test sırasında herhangi bir çökme yaşamadık, ancak ekran bazen muhtemelen otomatik GPU geçişi nedeniyle uykudan uyanma sorunları yaşadı.
CrossMark: Overall | Productivity | Creativity | Responsiveness
WebXPRT 3: Overall
WebXPRT 4: Overall
Mozilla Kraken 1.1: Total
| PCMark 10 / Score | |
| Ortalama AMD Ryzen 9 7940HS, NVIDIA GeForce RTX 4070 Laptop GPU (8092 - 8205, n=2) | |
| Asus TUF Gaming A17 FA707XI-NS94 | |
| MSI Pulse 17 B13VGK | |
| Razer Blade 17 (i7-12800H, RTX 3070 Ti) | |
| MSI Katana 17 B13VFK | |
| Asus TUF Gaming F17 FX707Z-HX011W | |
| HP Pavilion Gaming 17-cd2146ng | |
| PCMark 10 / Essentials | |
| Ortalama AMD Ryzen 9 7940HS, NVIDIA GeForce RTX 4070 Laptop GPU (10896 - 10952, n=2) | |
| Asus TUF Gaming A17 FA707XI-NS94 | |
| MSI Katana 17 B13VFK | |
| MSI Pulse 17 B13VGK | |
| Razer Blade 17 (i7-12800H, RTX 3070 Ti) | |
| Asus TUF Gaming F17 FX707Z-HX011W | |
| HP Pavilion Gaming 17-cd2146ng | |
| PCMark 10 / Productivity | |
| MSI Pulse 17 B13VGK | |
| Ortalama AMD Ryzen 9 7940HS, NVIDIA GeForce RTX 4070 Laptop GPU (9693 - 10805, n=2) | |
| Asus TUF Gaming A17 FA707XI-NS94 | |
| MSI Katana 17 B13VFK | |
| Razer Blade 17 (i7-12800H, RTX 3070 Ti) | |
| HP Pavilion Gaming 17-cd2146ng | |
| Asus TUF Gaming F17 FX707Z-HX011W | |
| PCMark 10 / Digital Content Creation | |
| Asus TUF Gaming A17 FA707XI-NS94 | |
| Ortalama AMD Ryzen 9 7940HS, NVIDIA GeForce RTX 4070 Laptop GPU (12666 - 13618, n=2) | |
| MSI Pulse 17 B13VGK | |
| Razer Blade 17 (i7-12800H, RTX 3070 Ti) | |
| Asus TUF Gaming F17 FX707Z-HX011W | |
| MSI Katana 17 B13VFK | |
| HP Pavilion Gaming 17-cd2146ng | |
| CrossMark / Overall | |
| MSI Pulse 17 B13VGK | |
| MSI Katana 17 B13VFK | |
| Ortalama AMD Ryzen 9 7940HS, NVIDIA GeForce RTX 4070 Laptop GPU (1797 - 1812, n=2) | |
| Asus TUF Gaming A17 FA707XI-NS94 | |
| Razer Blade 17 (i7-12800H, RTX 3070 Ti) | |
| Asus TUF Gaming F17 FX707Z-HX011W | |
| CrossMark / Productivity | |
| MSI Pulse 17 B13VGK | |
| MSI Katana 17 B13VFK | |
| Ortalama AMD Ryzen 9 7940HS, NVIDIA GeForce RTX 4070 Laptop GPU (1740 - 1762, n=2) | |
| Asus TUF Gaming A17 FA707XI-NS94 | |
| Razer Blade 17 (i7-12800H, RTX 3070 Ti) | |
| Asus TUF Gaming F17 FX707Z-HX011W | |
| CrossMark / Creativity | |
| MSI Pulse 17 B13VGK | |
| MSI Katana 17 B13VFK | |
| Asus TUF Gaming A17 FA707XI-NS94 | |
| Ortalama AMD Ryzen 9 7940HS, NVIDIA GeForce RTX 4070 Laptop GPU (1952 - 1979, n=2) | |
| Asus TUF Gaming F17 FX707Z-HX011W | |
| Razer Blade 17 (i7-12800H, RTX 3070 Ti) | |
| CrossMark / Responsiveness | |
| MSI Pulse 17 B13VGK | |
| MSI Katana 17 B13VFK | |
| Razer Blade 17 (i7-12800H, RTX 3070 Ti) | |
| Ortalama AMD Ryzen 9 7940HS, NVIDIA GeForce RTX 4070 Laptop GPU (1478 - 1575, n=2) | |
| Asus TUF Gaming A17 FA707XI-NS94 | |
| Asus TUF Gaming F17 FX707Z-HX011W | |
| WebXPRT 3 / Overall | |
| Asus TUF Gaming A17 FA707XI-NS94 | |
| Ortalama AMD Ryzen 9 7940HS, NVIDIA GeForce RTX 4070 Laptop GPU (317 - 319, n=2) | |
| MSI Katana 17 B13VFK | |
| MSI Pulse 17 B13VGK | |
| HP Pavilion Gaming 17-cd2146ng | |
| WebXPRT 4 / Overall | |
| Asus TUF Gaming A17 FA707XI-NS94 | |
| MSI Katana 17 B13VFK | |
| Ortalama AMD Ryzen 9 7940HS, NVIDIA GeForce RTX 4070 Laptop GPU (260 - 271, n=2) | |
| MSI Pulse 17 B13VGK | |
| Mozilla Kraken 1.1 / Total | |
| HP Pavilion Gaming 17-cd2146ng | |
| MSI Pulse 17 B13VGK | |
| MSI Katana 17 B13VFK | |
| Ortalama AMD Ryzen 9 7940HS, NVIDIA GeForce RTX 4070 Laptop GPU (481 - 499, n=2) | |
| Asus TUF Gaming A17 FA707XI-NS94 | |
* ... daha küçük daha iyidir
| PCMark 10 Score | 8092 puan | |
Yardım | ||
| AIDA64 / Memory Copy | |
| Ortalama AMD Ryzen 9 7940HS (35327 - 78739, n=10) | |
| MSI Pulse 17 B13VGK | |
| Asus TUF Gaming A17 FA707XI-NS94 | |
| MSI Katana 17 B13VFK | |
| Asus TUF Gaming F17 FX707Z-HX011W | |
| Razer Blade 17 (i7-12800H, RTX 3070 Ti) | |
| HP Pavilion Gaming 17-cd2146ng | |
| AIDA64 / Memory Read | |
| MSI Pulse 17 B13VGK | |
| Asus TUF Gaming F17 FX707Z-HX011W | |
| MSI Katana 17 B13VFK | |
| Asus TUF Gaming A17 FA707XI-NS94 | |
| Ortalama AMD Ryzen 9 7940HS (30769 - 61836, n=10) | |
| Razer Blade 17 (i7-12800H, RTX 3070 Ti) | |
| HP Pavilion Gaming 17-cd2146ng | |
| AIDA64 / Memory Write | |
| Ortalama AMD Ryzen 9 7940HS (42217 - 91567, n=10) | |
| Asus TUF Gaming A17 FA707XI-NS94 | |
| MSI Pulse 17 B13VGK | |
| Asus TUF Gaming F17 FX707Z-HX011W | |
| Razer Blade 17 (i7-12800H, RTX 3070 Ti) | |
| MSI Katana 17 B13VFK | |
| HP Pavilion Gaming 17-cd2146ng | |
| AIDA64 / Memory Latency | |
| MSI Katana 17 B13VFK | |
| MSI Pulse 17 B13VGK | |
| Ortalama AMD Ryzen 9 7940HS (87.6 - 111.1, n=10) | |
| Asus TUF Gaming A17 FA707XI-NS94 | |
| HP Pavilion Gaming 17-cd2146ng | |
| Asus TUF Gaming F17 FX707Z-HX011W | |
| Razer Blade 17 (i7-12800H, RTX 3070 Ti) | |
* ... daha küçük daha iyidir
DPC Gecikme Süresi
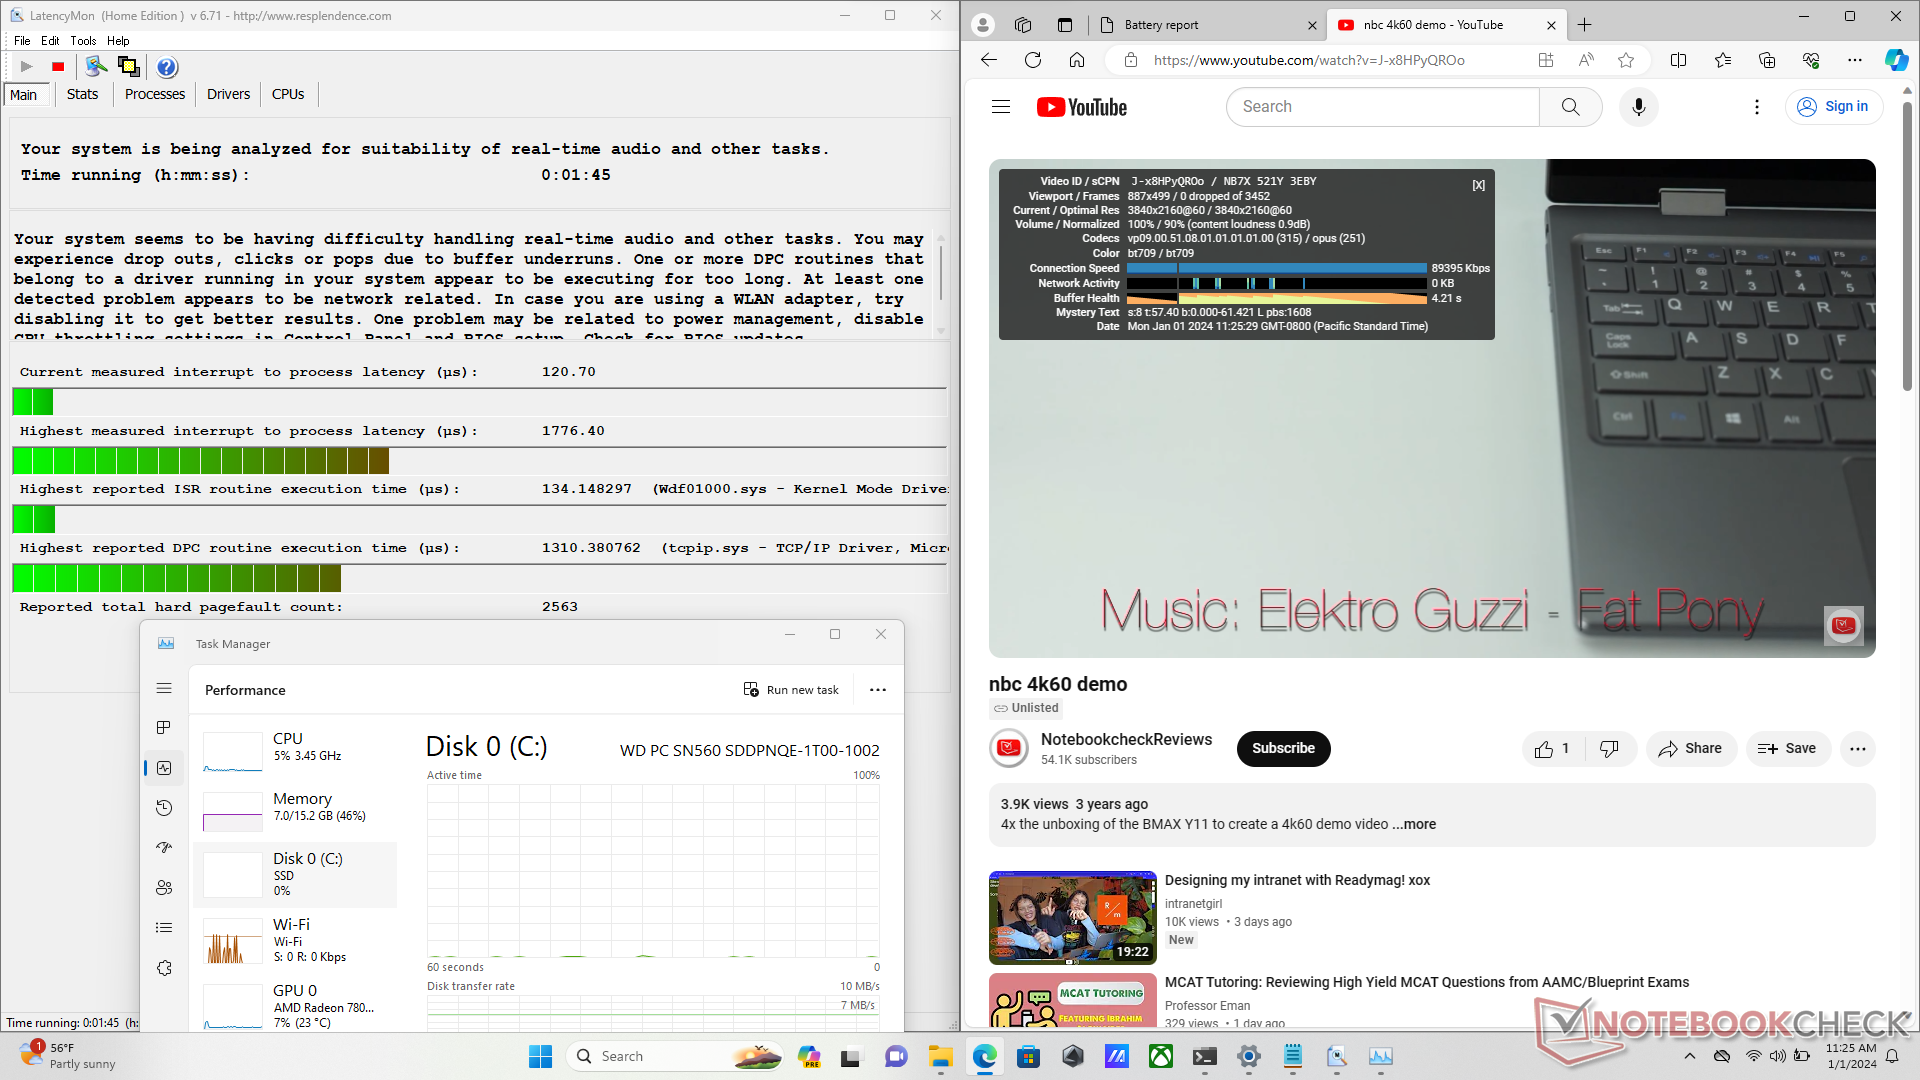
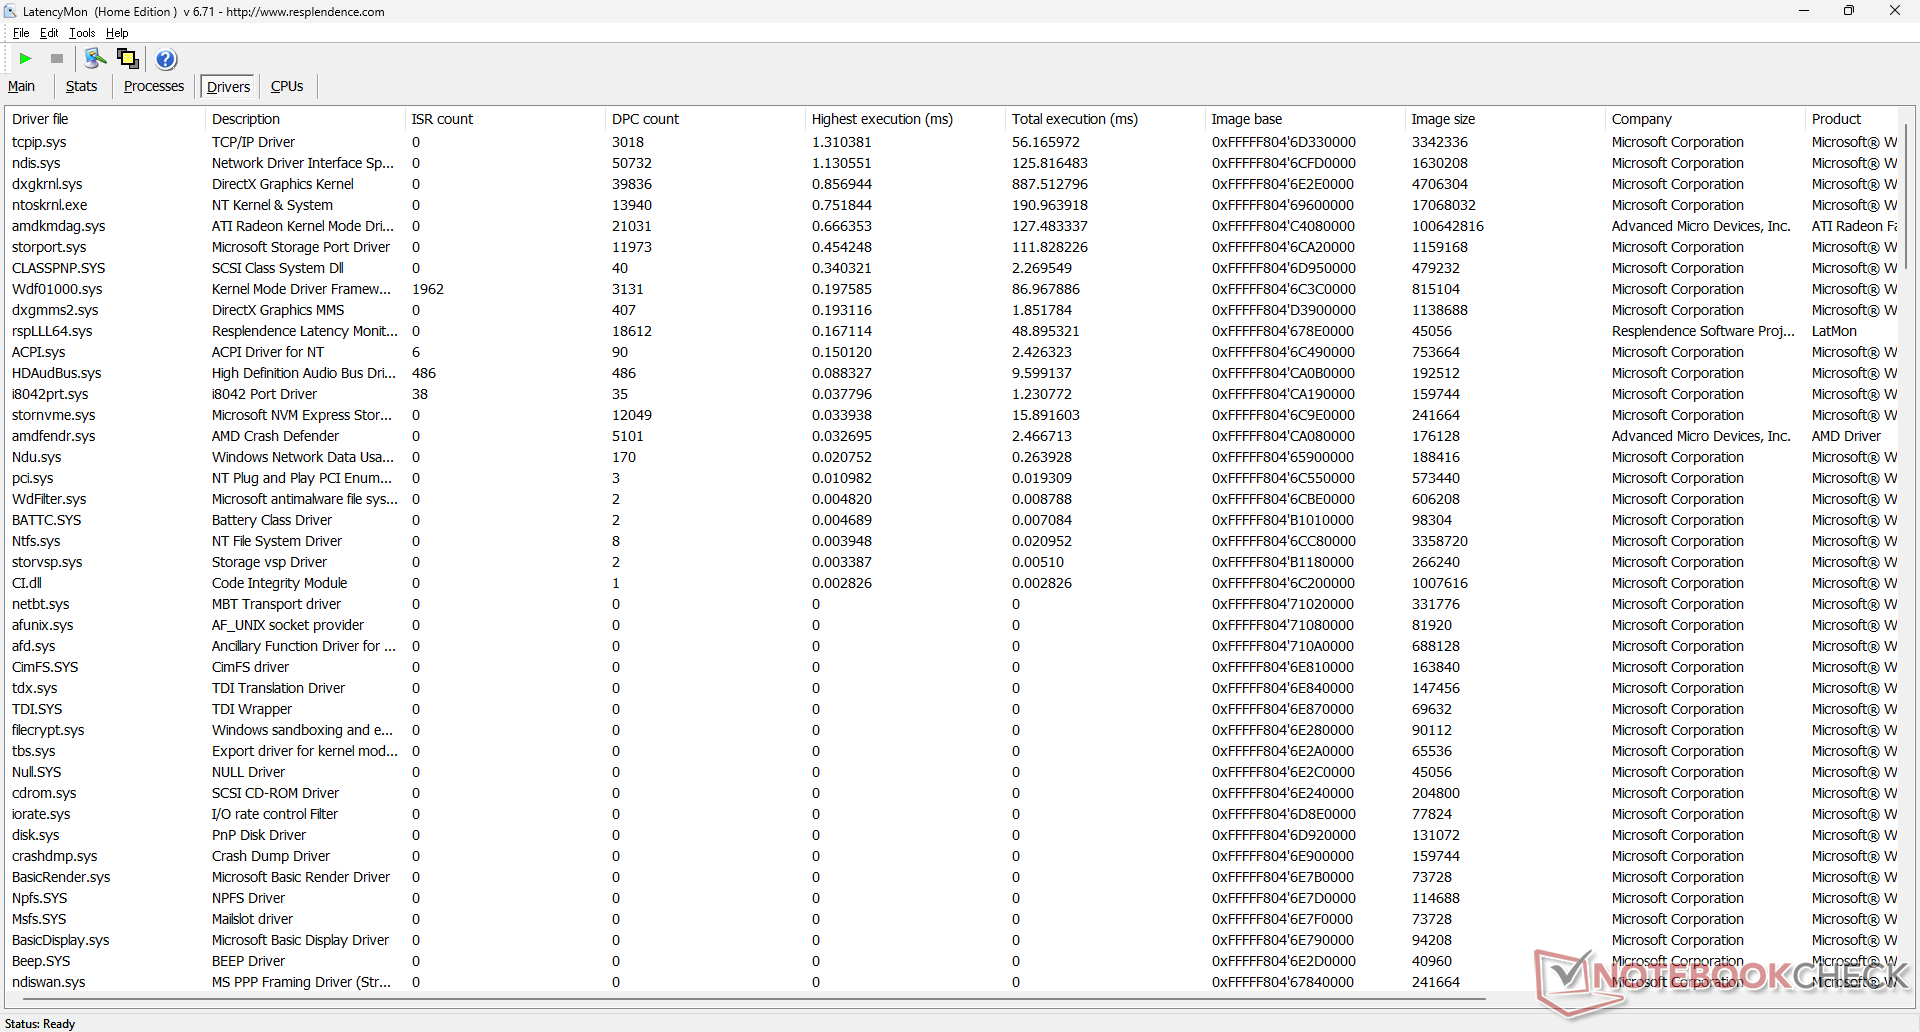
LatencyMon, ana sayfamızın birden fazla tarayıcı sekmesini açarken DPC sorunlarını ortaya çıkarıyor. 60 FPS'de 4K video oynatma, kaydedilen hiçbir kare düşmesi olmadan mükemmeldir.
| DPC Latencies / LatencyMon - interrupt to process latency (max), Web, Youtube, Prime95 | |
| MSI Katana 17 B13VFK | |
| Asus TUF Gaming F17 FX707Z-HX011W | |
| Asus TUF Gaming A17 FA707XI-NS94 | |
| HP Pavilion Gaming 17-cd2146ng | |
| MSI Pulse 17 B13VGK | |
| Razer Blade 17 (i7-12800H, RTX 3070 Ti) | |
* ... daha küçük daha iyidir
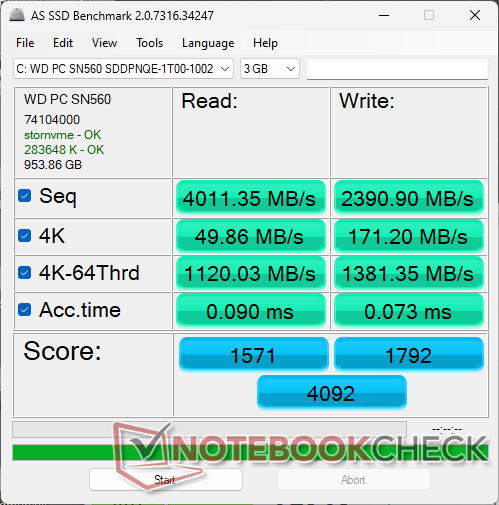
Depolama Cihazları
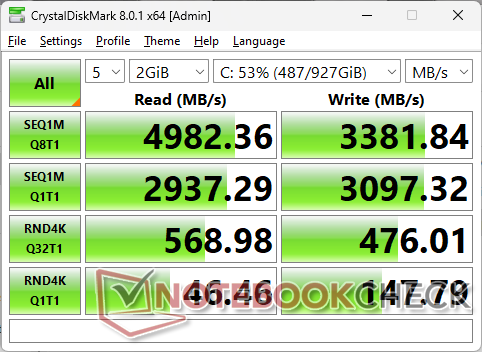
Test ünitemiz aşağıdakilerle birlikte gönderilir WD SN560 bu SSD, üst seviye WDC SN850X serisinin aksine orta seviye bir PCIe4 x4 NVMe SSD'dir. Aktarım hızları, yukarıda bahsedilen SN850X'teki 7000+ MB/sn yerine yaklaşık 5000 MB/sn'ye kadar düşmektedir. Ancak orta seviye bir oyun dizüstü bilgisayarı için WD SN560 fazlasıyla yeterli. Aşağıdaki DiskSpd stres testi sonuçlarımızda gösterildiği gibi sürücümüzde hiçbir performans düşüklüğü sorunu kaydedemedik.

| Drive Performance rating - Percent | |
| Razer Blade 17 (i7-12800H, RTX 3070 Ti) | |
| MSI Katana 17 B13VFK | |
| MSI Pulse 17 B13VGK | |
| HP Pavilion Gaming 17-cd2146ng | |
| Asus TUF Gaming F17 FX707Z-HX011W | |
| Asus TUF Gaming A17 FA707XI-NS94 | |
* ... daha küçük daha iyidir
Disk Throttling: DiskSpd Read Loop, Queue Depth 8
GPU Performansı
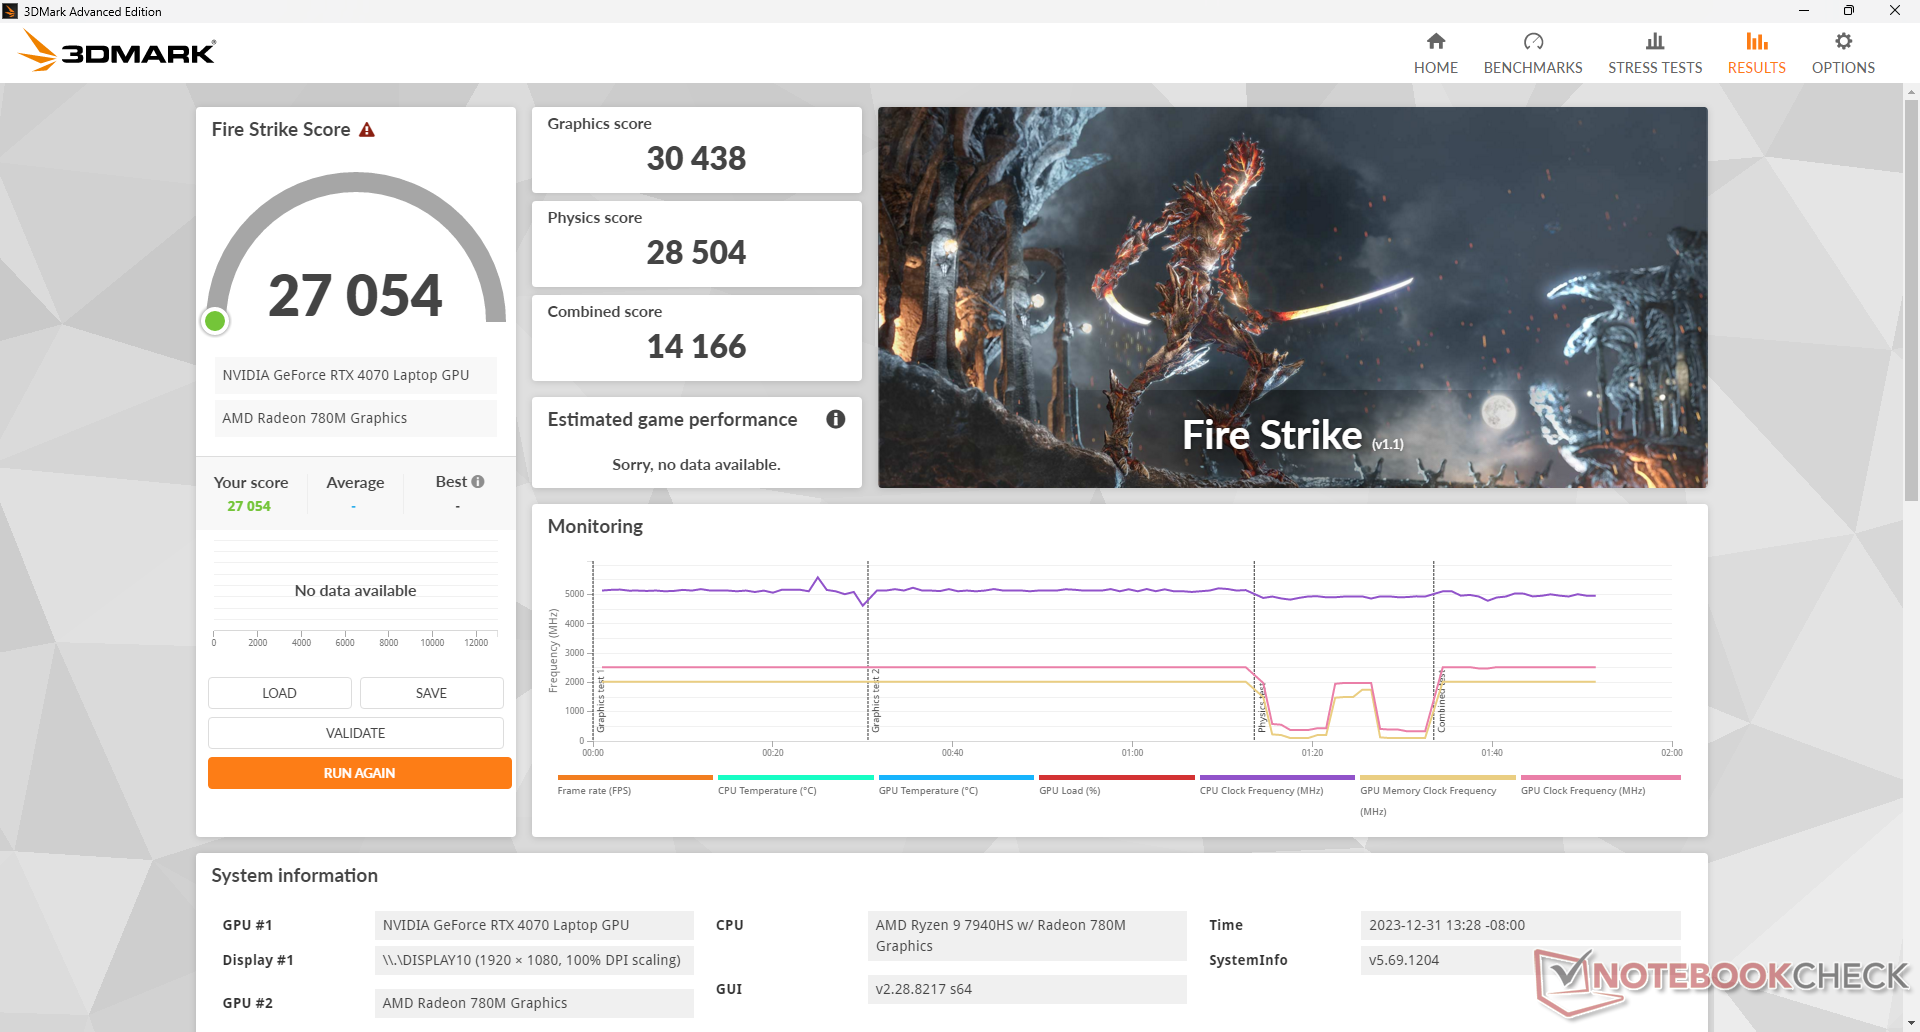
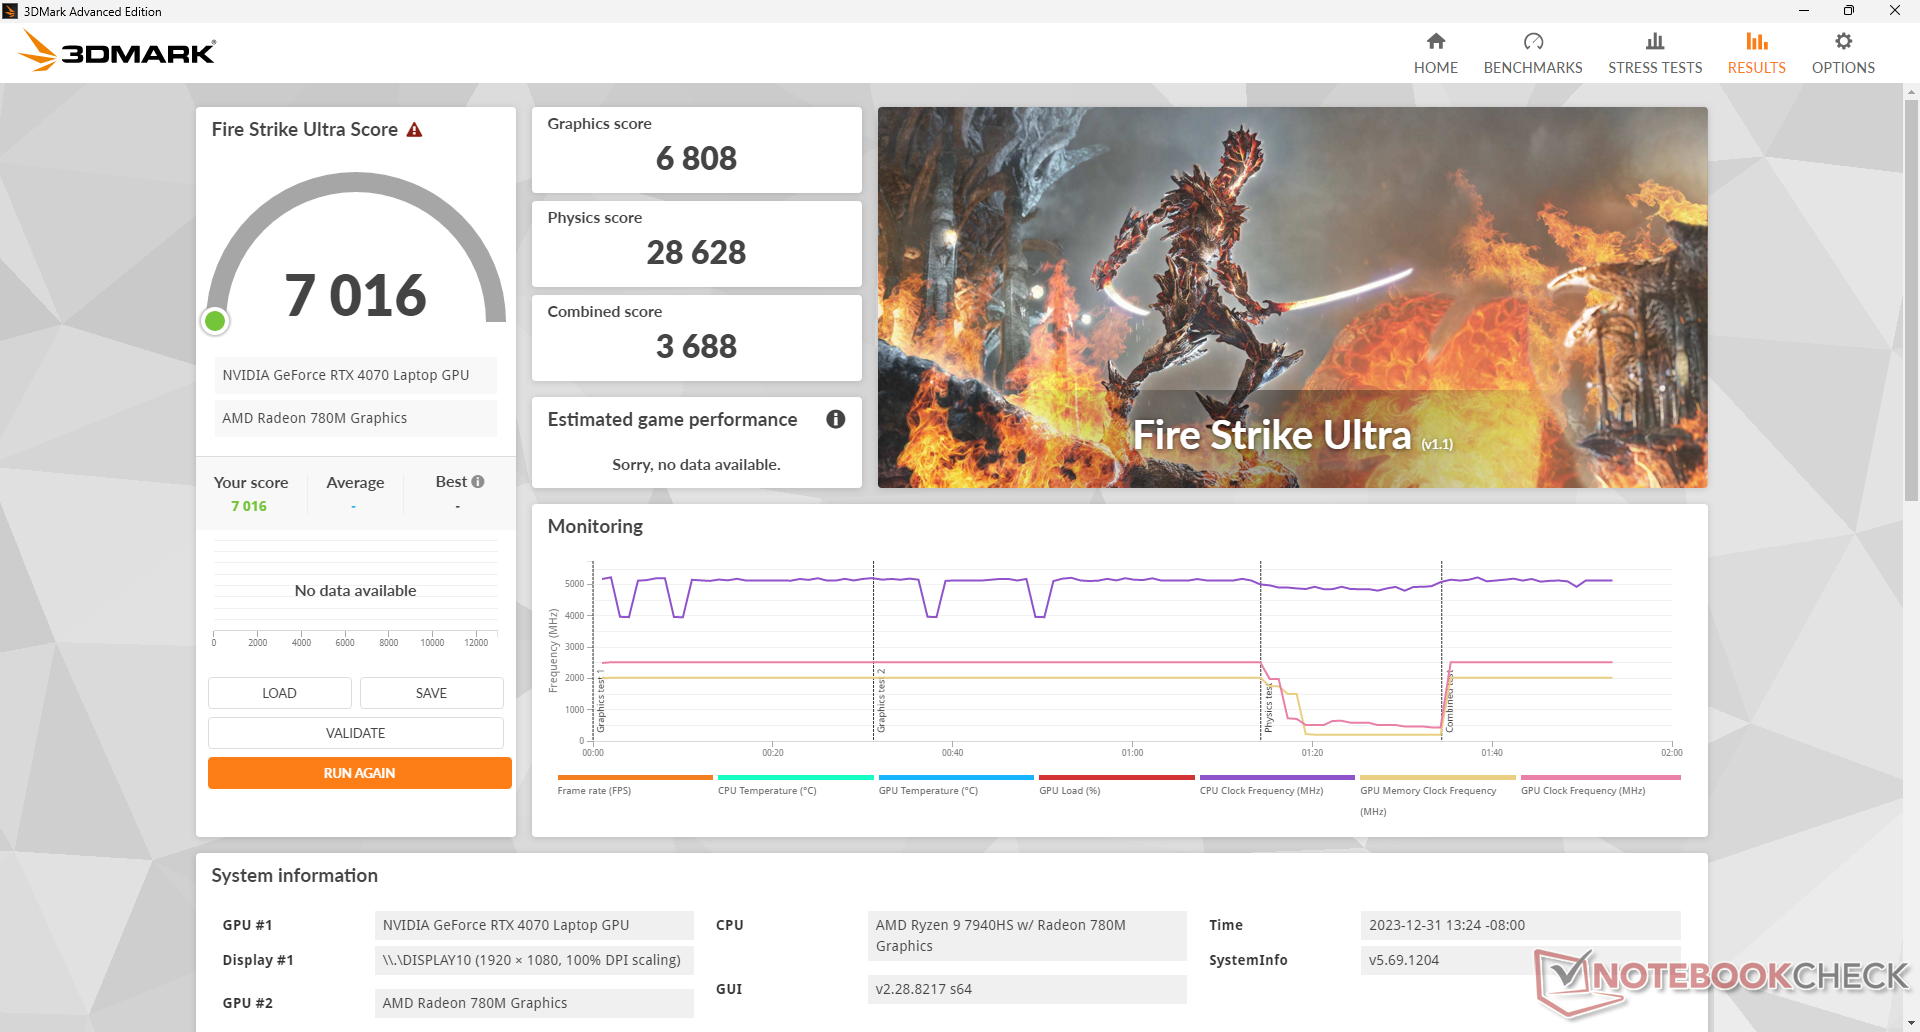
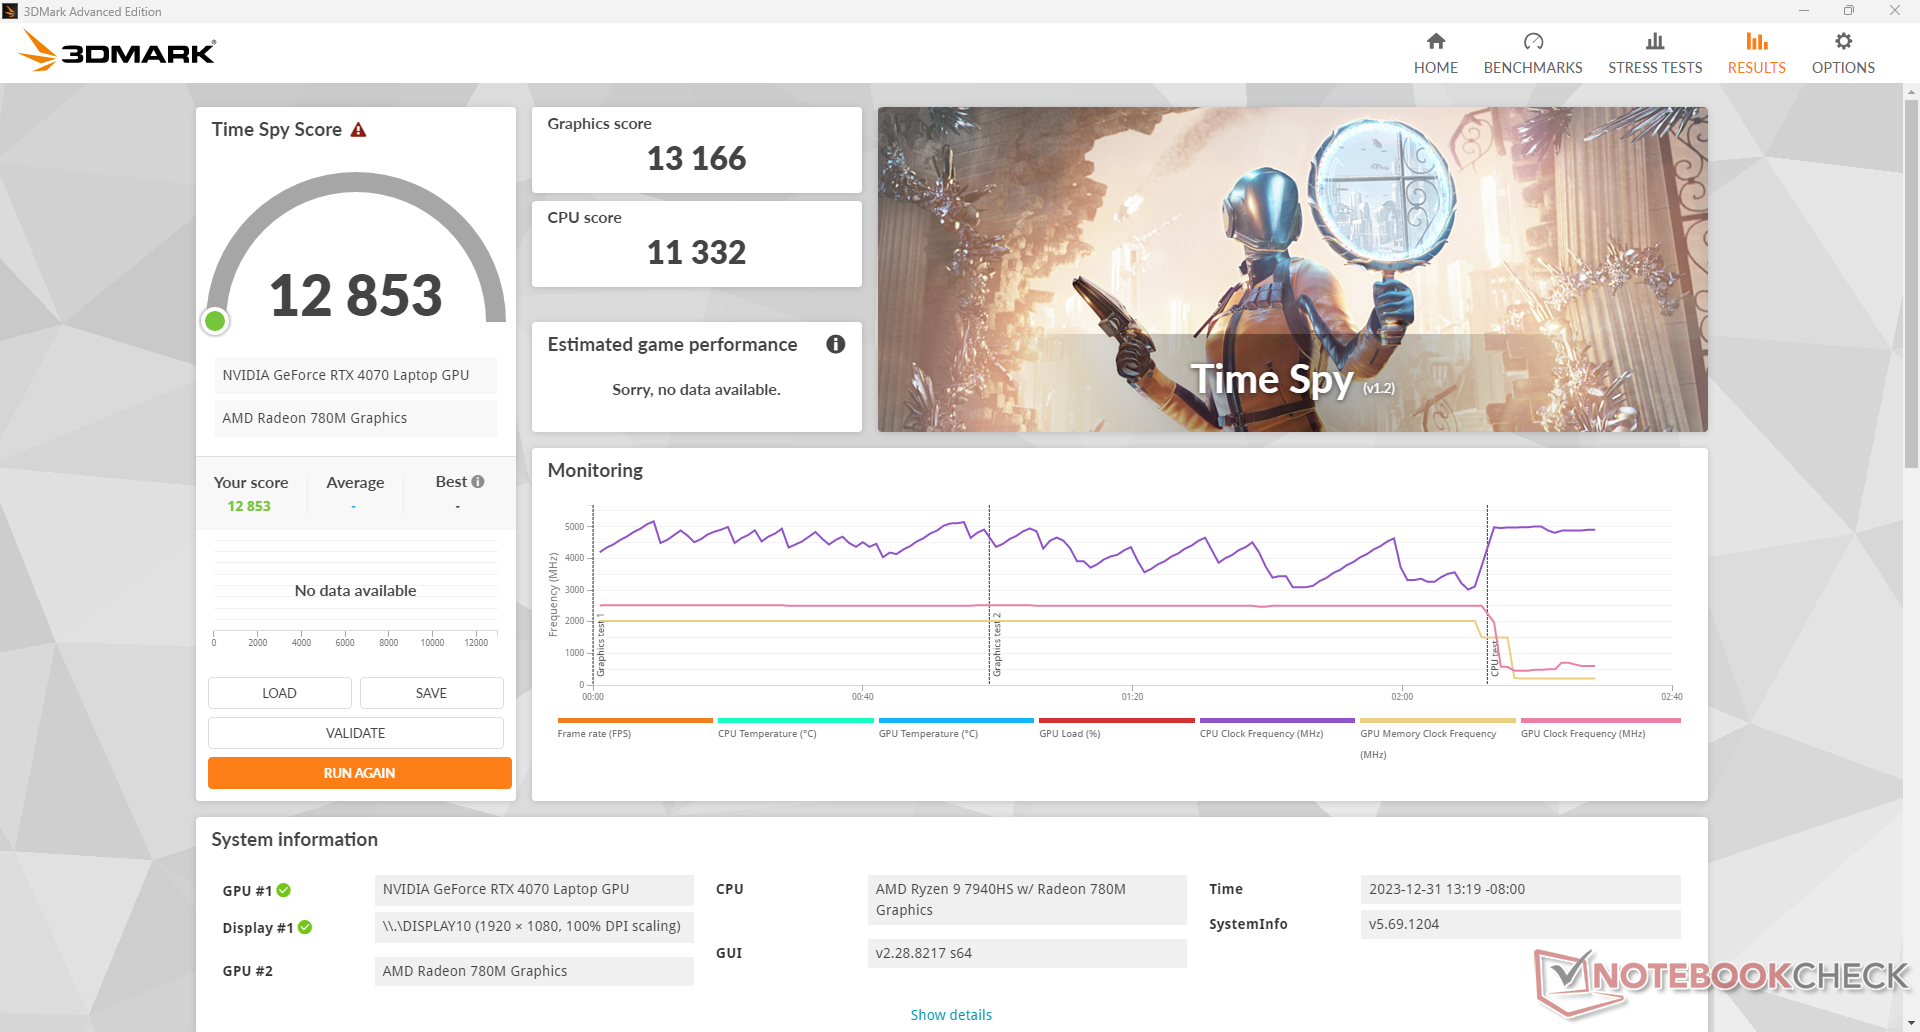
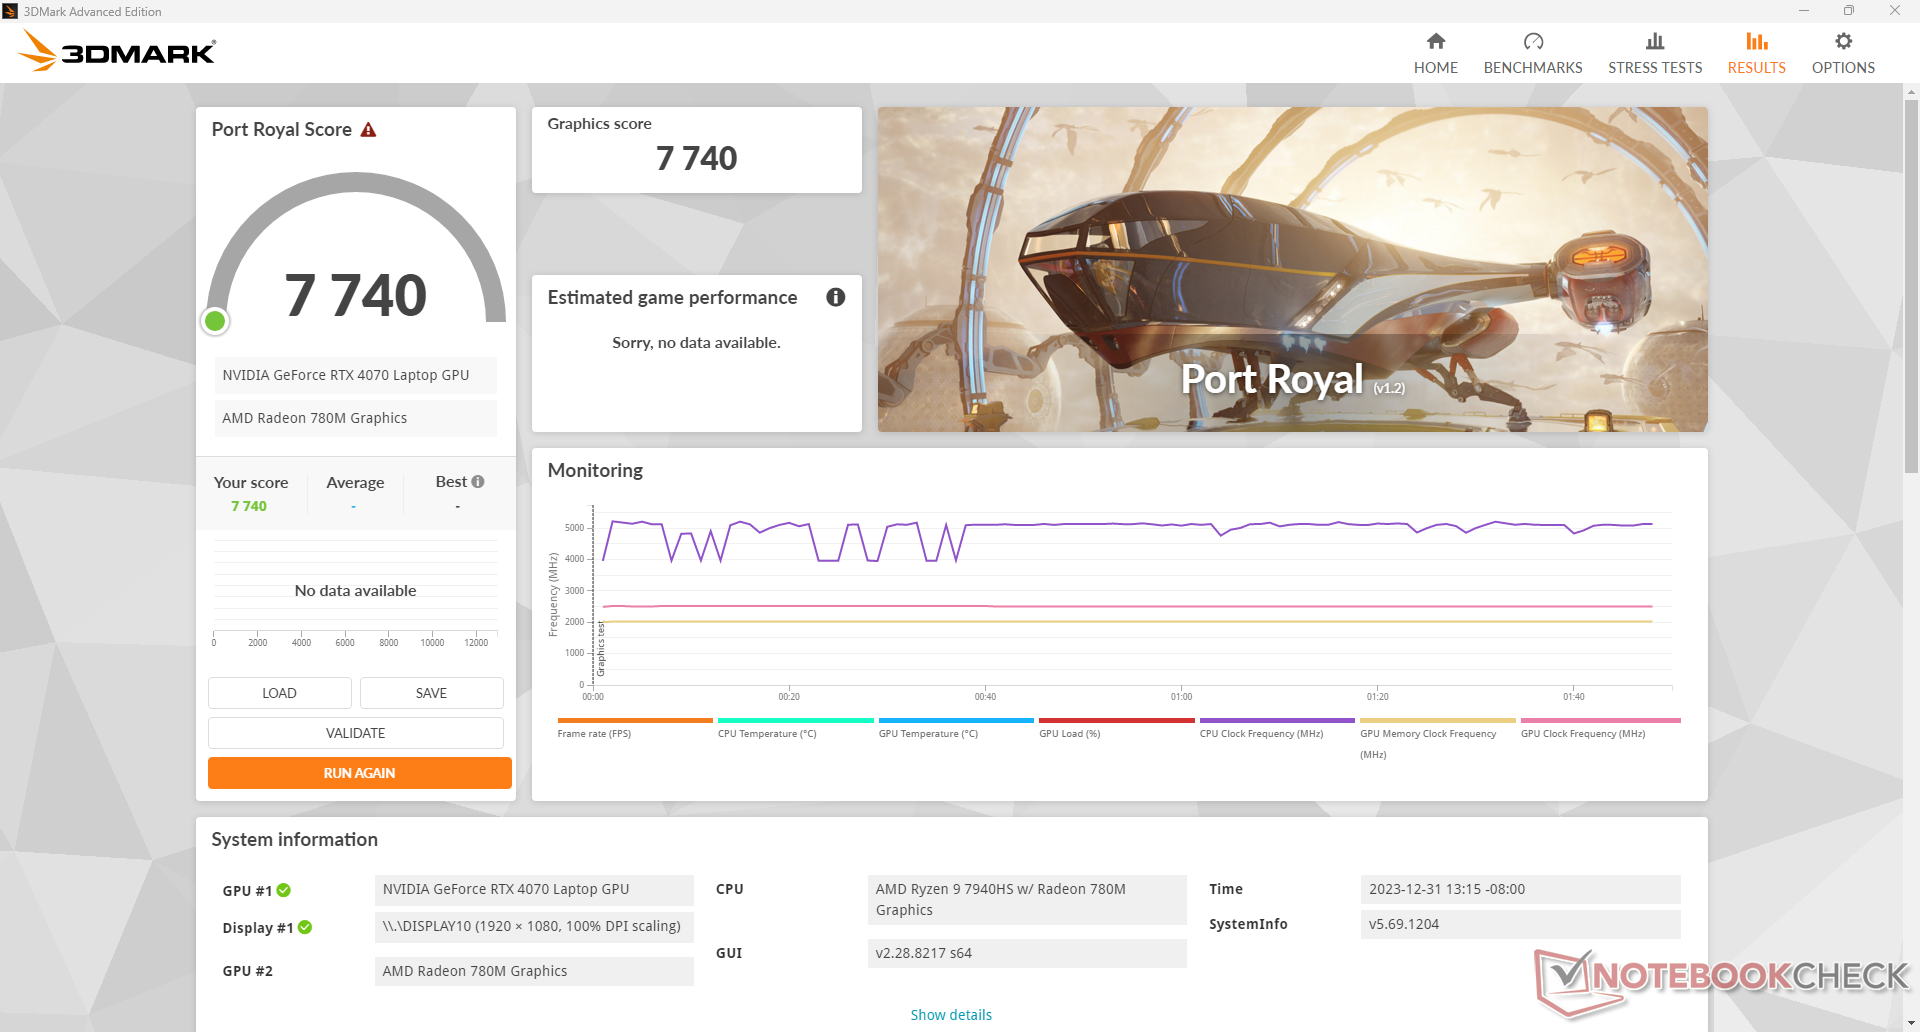
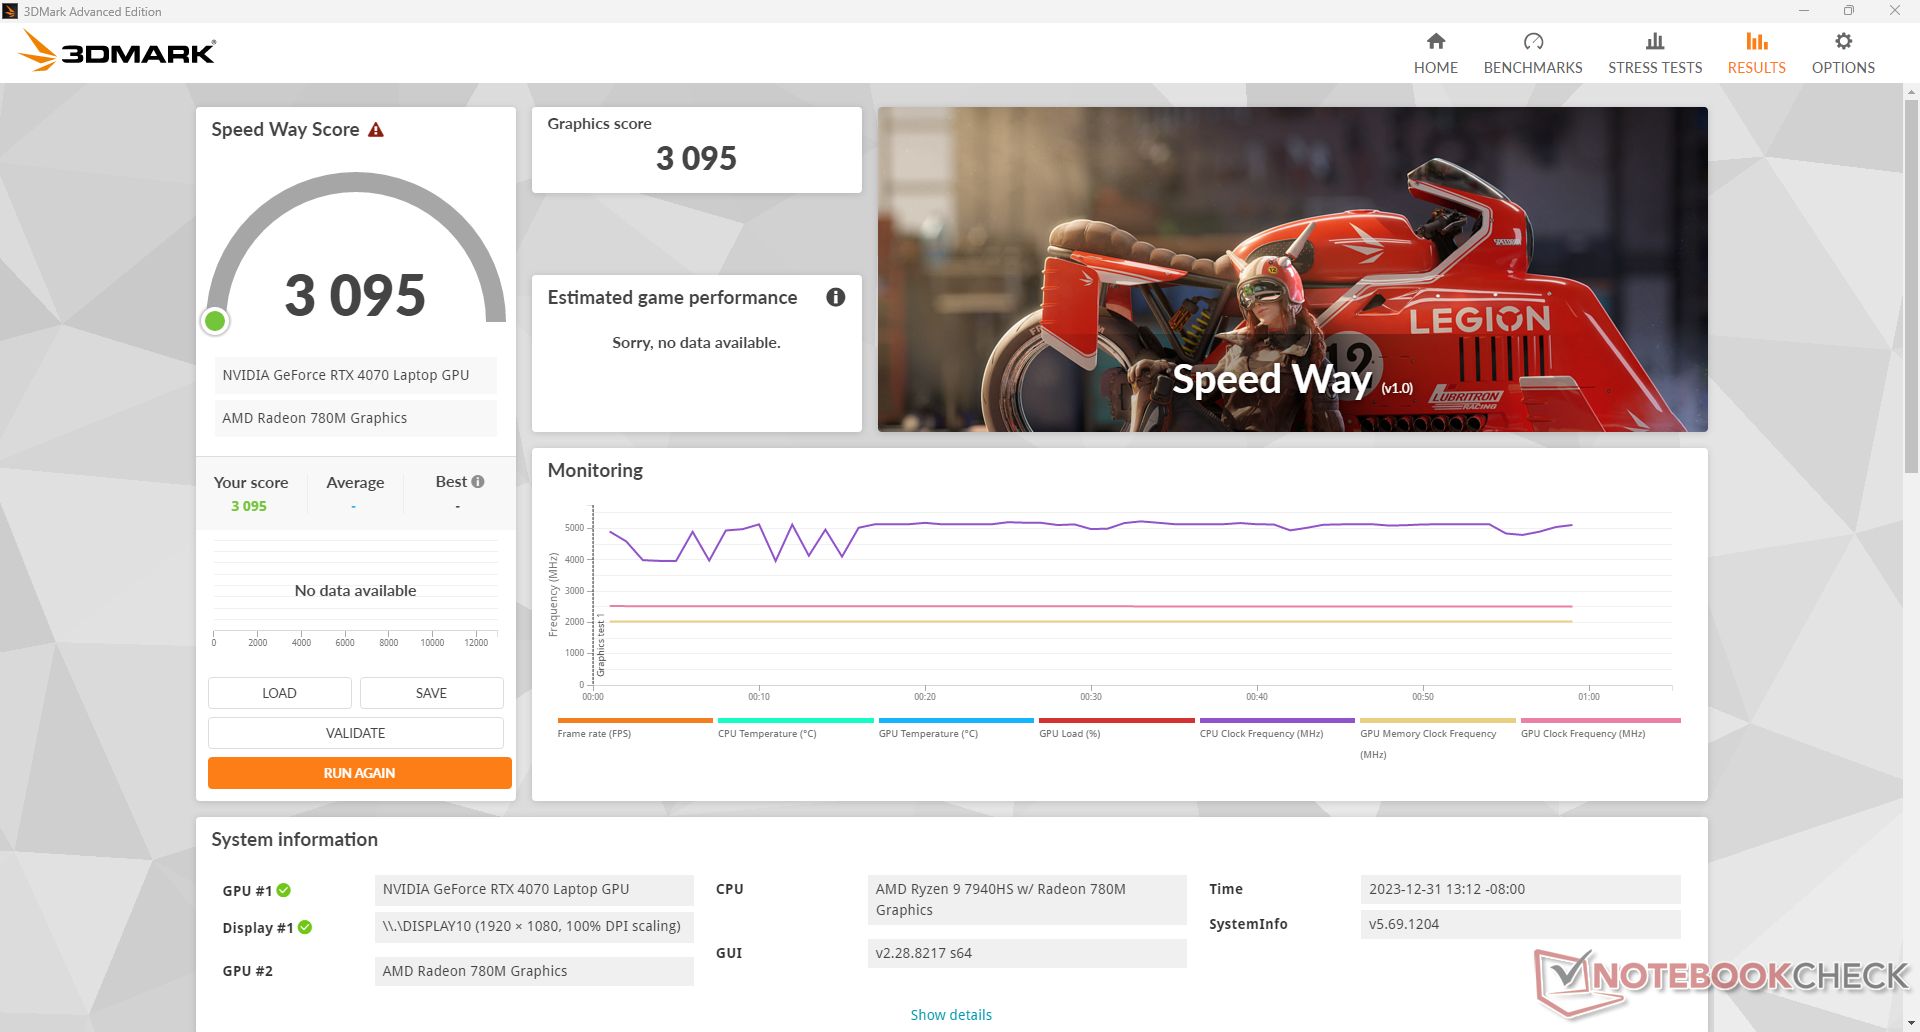
Genel grafik performansı GeForce RTX 4070'in masaüstü versiyonundan yaklaşık yüzde 25 ila 30 daha yavaştır. Daha eski bir RTX 3060 dizüstü bilgisayardan yükseltme yapan kullanıcılar, DLSS özellikli özellikleri hesaba katmadan önce performansta yüzde 50'ye varan kayda değer artışlar göreceklerdir. Nispeten yüksek 140 W TGP hedefi, TUF Gaming A17'nin veritabanımızdaki aynı RTX 4070 GPU'ya sahip ortalama bir dizüstü bilgisayardan yaklaşık yüzde 5 ila 15 oranında daha iyi performans göstermesini sağlar.
Daha düşük
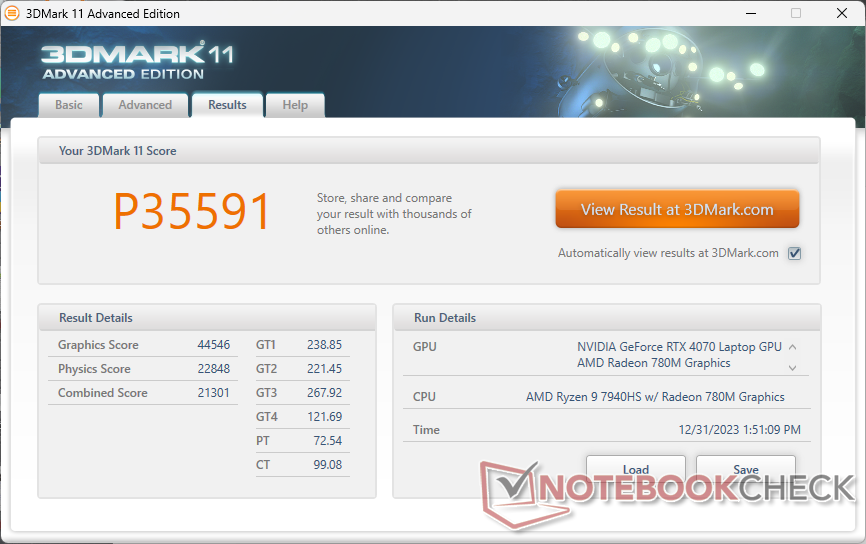
RTX 4060 veya RTX 4050 yapılandırması performansı sırasıyla yaklaşık yüzde 20 ve yüzde 35 oranında etkileyecektir. RTX 4050, RTX 4060 ve RTX 4070 seçenekleri arasında geçiş yaparken performans deltası aşağı yukarı düz bir çizgidir. Daha hızlı RTX 4080 veya 4090 yalnızca Asus'un üst düzey ROG modellerinde mevcuttur.| Güç Profili | Grafik Puanı | Fizik Puanı | Birleşik Puan |
| Turbo Modu | 30438 | 28504 | 14166 |
| Performans Modu | 29222 (-4%) | 28345 (-1%) | 13129 (-7%) |
| Dengeli Mod | 29472 (-3%) | 27605 (-3%) | 12947 (-9%) |
| Akü Gücü | 23884 (-22%) | 26213 (-8%) | 11027 (-22%) |
Daha yavaş Performans veya Dengeli güç profillerinde çalıştırmak, yukarıdaki Fire Strike sonuç tablomuzda gösterildiği gibi sistem performansını çok az etkilemektedir. En önemli etki, beklendiği gibi pil gücüyle çalışmaktan kaynaklanmaktadır.
| 3DMark Performance rating - Percent | |
| MSI Raider GE78 HX 13VI -1! | |
| Alienware m18 R1 AMD -1! | |
| Alienware m16 R1 AMD | |
| KFA2 GeForce RTX 4070 EX Gamer | |
| Asus TUF Gaming A17 FA707XI-NS94 | |
| Lenovo Legion 7 16ARHA7 -1! | |
| Ortalama NVIDIA GeForce RTX 4070 Laptop GPU | |
| Razer Blade 17 (i7-12800H, RTX 3070 Ti) -1! | |
| MSI Katana 17 B13VFK -1! | |
| Asus TUF Gaming F17 FX707Z-HX011W -1! | |
| Medion Erazer Scout E20 | |
| Asus ROG Strix G17 G713QE-RB74 -1! | |
| Lenovo ThinkPad Z16 Gen 2 -1! | |
| 3DMark 11 - 1280x720 Performance GPU | |
| MSI Raider GE78 HX 13VI | |
| KFA2 GeForce RTX 4070 EX Gamer | |
| Alienware m18 R1 AMD | |
| Alienware m16 R1 AMD | |
| Asus TUF Gaming A17 FA707XI-NS94 | |
| Lenovo Legion 7 16ARHA7 | |
| Ortalama NVIDIA GeForce RTX 4070 Laptop GPU (24229 - 46434, n=67) | |
| Razer Blade 17 (i7-12800H, RTX 3070 Ti) | |
| MSI Katana 17 B13VFK | |
| Asus TUF Gaming F17 FX707Z-HX011W | |
| Medion Erazer Scout E20 | |
| Asus ROG Strix G17 G713QE-RB74 | |
| Lenovo ThinkPad Z16 Gen 2 | |
| 3DMark 11 Performance | 35591 puan | |
| 3DMark Fire Strike Score | 27054 puan | |
| 3DMark Time Spy Score | 12853 puan | |
Yardım | ||
* ... daha küçük daha iyidir
| Performance rating - Percent | |
| MSI Raider GE78 HX 13VI | |
| Alienware m16 R1 AMD -1! | |
| Alienware m18 R1 AMD | |
| MSI Katana 17 B13VFK | |
| Razer Blade 17 (i7-12800H, RTX 3070 Ti) | |
| Asus TUF Gaming A17 FA707XI-NS94 -1! | |
| Asus TUF Gaming F17 FX707Z-HX011W | |
| Lenovo Legion 7 16ARHA7 | |
| Asus ROG Strix G17 G713QE-RB74 | |
| Lenovo ThinkPad Z16 Gen 2 -1! | |
| The Witcher 3 - 1920x1080 Ultra Graphics & Postprocessing (HBAO+) | |
| MSI Raider GE78 HX 13VI | |
| Alienware m16 R1 AMD | |
| Alienware m18 R1 AMD | |
| Asus TUF Gaming A17 FA707XI-NS94 | |
| Lenovo Legion 7 16ARHA7 | |
| Razer Blade 17 (i7-12800H, RTX 3070 Ti) | |
| MSI Katana 17 B13VFK | |
| Asus TUF Gaming F17 FX707Z-HX011W | |
| Asus ROG Strix G17 G713QE-RB74 | |
| Lenovo ThinkPad Z16 Gen 2 | |
| GTA V - 1920x1080 Highest AA:4xMSAA + FX AF:16x | |
| MSI Raider GE78 HX 13VI | |
| MSI Katana 17 B13VFK | |
| Alienware m18 R1 AMD | |
| Razer Blade 17 (i7-12800H, RTX 3070 Ti) | |
| Asus TUF Gaming F17 FX707Z-HX011W | |
| Lenovo Legion 7 16ARHA7 | |
| Asus ROG Strix G17 G713QE-RB74 | |
| Final Fantasy XV Benchmark - 1920x1080 High Quality | |
| MSI Raider GE78 HX 13VI | |
| Alienware m16 R1 AMD | |
| Alienware m18 R1 AMD | |
| Asus TUF Gaming A17 FA707XI-NS94 | |
| Lenovo Legion 7 16ARHA7 | |
| Razer Blade 17 (i7-12800H, RTX 3070 Ti) | |
| MSI Katana 17 B13VFK | |
| Asus TUF Gaming F17 FX707Z-HX011W | |
| Asus ROG Strix G17 G713QE-RB74 | |
| Lenovo ThinkPad Z16 Gen 2 | |
| Strange Brigade - 1920x1080 ultra AA:ultra AF:16 | |
| MSI Raider GE78 HX 13VI | |
| Alienware m16 R1 AMD | |
| Alienware m18 R1 AMD | |
| Lenovo Legion 7 16ARHA7 | |
| Asus TUF Gaming A17 FA707XI-NS94 | |
| Razer Blade 17 (i7-12800H, RTX 3070 Ti) | |
| MSI Katana 17 B13VFK | |
| Asus TUF Gaming F17 FX707Z-HX011W | |
| Asus ROG Strix G17 G713QE-RB74 | |
| Lenovo ThinkPad Z16 Gen 2 | |
| Dota 2 Reborn - 1920x1080 ultra (3/3) best looking | |
| MSI Raider GE78 HX 13VI | |
| Alienware m16 R1 AMD | |
| MSI Katana 17 B13VFK | |
| Alienware m18 R1 AMD | |
| Razer Blade 17 (i7-12800H, RTX 3070 Ti) | |
| Asus TUF Gaming F17 FX707Z-HX011W | |
| Asus TUF Gaming A17 FA707XI-NS94 | |
| Asus ROG Strix G17 G713QE-RB74 | |
| Lenovo ThinkPad Z16 Gen 2 | |
| Lenovo Legion 7 16ARHA7 | |
| X-Plane 11.11 - 1920x1080 high (fps_test=3) | |
| MSI Raider GE78 HX 13VI | |
| MSI Katana 17 B13VFK | |
| Alienware m16 R1 AMD | |
| Razer Blade 17 (i7-12800H, RTX 3070 Ti) | |
| Asus TUF Gaming F17 FX707Z-HX011W | |
| Alienware m18 R1 AMD | |
| Asus TUF Gaming A17 FA707XI-NS94 | |
| Asus ROG Strix G17 G713QE-RB74 | |
| Lenovo Legion 7 16ARHA7 | |
| Lenovo ThinkPad Z16 Gen 2 | |
| Tiny Tina's Wonderlands | |
| 1920x1080 Badass Preset (DX12) | |
| Alienware m16 R1 AMD | |
| Alienware m18 R1 AMD | |
| Asus TUF Gaming A17 FA707XI-NS94 | |
| Ortalama NVIDIA GeForce RTX 4070 Laptop GPU (58.6 - 115.9, n=18) | |
| MSI Katana 17 B13VFK | |
| Lenovo ThinkPad Z16 Gen 2 | |
| 2560x1440 Badass Preset (DX12) | |
| Alienware m16 R1 AMD | |
| Alienware m18 R1 AMD | |
| Asus TUF Gaming A17 FA707XI-NS94 | |
| Ortalama NVIDIA GeForce RTX 4070 Laptop GPU (49.8 - 79.5, n=17) | |
| Lenovo ThinkPad Z16 Gen 2 | |
| 3840x2160 Badass Preset (DX12) | |
| Alienware m16 R1 AMD | |
| Alienware m18 R1 AMD | |
| Asus TUF Gaming A17 FA707XI-NS94 | |
| Ortalama NVIDIA GeForce RTX 4070 Laptop GPU (28.3 - 39.7, n=13) | |
| Baldur's Gate 3 | |
| 1920x1080 Ultra Preset AA:T | |
| Alienware m18 R1 AMD | |
| Asus TUF Gaming A17 FA707XI-NS94 | |
| Ortalama NVIDIA GeForce RTX 4070 Laptop GPU (66.7 - 128.5, n=30) | |
| Lenovo ThinkPad Z16 Gen 2 | |
| 2560x1440 Ultra Preset AA:T | |
| Alienware m18 R1 AMD | |
| Asus TUF Gaming A17 FA707XI-NS94 | |
| Ortalama NVIDIA GeForce RTX 4070 Laptop GPU (54.4 - 89.6, n=25) | |
| Lenovo ThinkPad Z16 Gen 2 | |
| 3840x2160 Ultra Preset AA:T | |
| Alienware m18 R1 AMD | |
| Asus TUF Gaming A17 FA707XI-NS94 | |
| Ortalama NVIDIA GeForce RTX 4070 Laptop GPU (33.4 - 45.2, n=12) | |
| Cyberpunk 2077 | |
| 1920x1080 High Preset (FSR off) | |
| Alienware m18 R1 AMD | |
| Asus TUF Gaming A17 FA707XI-NS94 | |
| Ortalama NVIDIA GeForce RTX 4070 Laptop GPU (74.7 - 103.6, n=32) | |
| Lenovo ThinkPad Z16 Gen 2 | |
| 1920x1080 Ultra Preset (FSR off) | |
| Alienware m18 R1 AMD | |
| MSI Raider GE78 HX 13VI | |
| Asus TUF Gaming A17 FA707XI-NS94 | |
| Ortalama NVIDIA GeForce RTX 4070 Laptop GPU (30.7 - 90.7, n=40) | |
| Lenovo ThinkPad Z16 Gen 2 | |
| 2560x1440 Ultra Preset (FSR off) | |
| MSI Raider GE78 HX 13VI | |
| Alienware m18 R1 AMD | |
| Asus TUF Gaming A17 FA707XI-NS94 | |
| Ortalama NVIDIA GeForce RTX 4070 Laptop GPU (24.8 - 57.1, n=37) | |
| Lenovo ThinkPad Z16 Gen 2 | |
| 3840x2160 Ultra Preset (FSR off) | |
| MSI Raider GE78 HX 13VI | |
| Alienware m18 R1 AMD | |
| Asus TUF Gaming A17 FA707XI-NS94 | |
| Ortalama NVIDIA GeForce RTX 4070 Laptop GPU (20.2 - 24, n=13) | |
| 1920x1080 Ray Tracing Ultra Preset (DLSS off) | |
| MSI Raider GE78 HX 13VI | |
| Asus TUF Gaming A17 FA707XI-NS94 | |
| Alienware m18 R1 AMD | |
| Ortalama NVIDIA GeForce RTX 4070 Laptop GPU (19.1 - 46.8, n=23) | |
| Lenovo ThinkPad Z16 Gen 2 | |
| The Witcher 3 | |
| 1920x1080 Ultra Graphics & Postprocessing (HBAO+) | |
| MSI Raider GE78 HX 13VI | |
| Alienware m16 R1 AMD | |
| Alienware m18 R1 AMD | |
| Asus TUF Gaming A17 FA707XI-NS94 | |
| Lenovo Legion 7 16ARHA7 | |
| Ortalama NVIDIA GeForce RTX 4070 Laptop GPU (69.8 - 133.7, n=57) | |
| Razer Blade 17 (i7-12800H, RTX 3070 Ti) | |
| MSI Katana 17 B13VFK | |
| Asus TUF Gaming F17 FX707Z-HX011W | |
| Asus ROG Strix G17 G713QE-RB74 | |
| Lenovo ThinkPad Z16 Gen 2 | |
| 3840x2160 High Graphics & Postprocessing (Nvidia HairWorks Off) | |
| MSI Raider GE78 HX 13VI | |
| Alienware m16 R1 AMD | |
| Alienware m18 R1 AMD | |
| Asus TUF Gaming A17 FA707XI-NS94 | |
| Ortalama NVIDIA GeForce RTX 4070 Laptop GPU (26.5 - 83.5, n=16) | |
| MSI Katana 17 B13VFK | |
| Strange Brigade | |
| 1920x1080 ultra AA:ultra AF:16 | |
| MSI Raider GE78 HX 13VI | |
| Alienware m16 R1 AMD | |
| Alienware m18 R1 AMD | |
| Lenovo Legion 7 16ARHA7 | |
| Asus TUF Gaming A17 FA707XI-NS94 | |
| Ortalama NVIDIA GeForce RTX 4070 Laptop GPU (76.3 - 234, n=63) | |
| Razer Blade 17 (i7-12800H, RTX 3070 Ti) | |
| MSI Katana 17 B13VFK | |
| Asus TUF Gaming F17 FX707Z-HX011W | |
| Asus ROG Strix G17 G713QE-RB74 | |
| Lenovo ThinkPad Z16 Gen 2 | |
| 2560x1440 ultra AA:ultra AF:16 | |
| MSI Raider GE78 HX 13VI | |
| Alienware m18 R1 AMD | |
| Alienware m16 R1 AMD | |
| Lenovo Legion 7 16ARHA7 | |
| Asus TUF Gaming A17 FA707XI-NS94 | |
| Ortalama NVIDIA GeForce RTX 4070 Laptop GPU (52.8 - 150.9, n=55) | |
| MSI Katana 17 B13VFK | |
| 3840x2160 ultra AA:ultra AF:16 | |
| MSI Raider GE78 HX 13VI | |
| Alienware m18 R1 AMD | |
| Alienware m16 R1 AMD | |
| Asus TUF Gaming A17 FA707XI-NS94 | |
| Ortalama NVIDIA GeForce RTX 4070 Laptop GPU (42.7 - 77.9, n=18) | |
| MSI Katana 17 B13VFK | |
| Final Fantasy XV Benchmark | |
| 1920x1080 High Quality | |
| MSI Raider GE78 HX 13VI | |
| Alienware m16 R1 AMD | |
| Alienware m18 R1 AMD | |
| Asus TUF Gaming A17 FA707XI-NS94 | |
| Lenovo Legion 7 16ARHA7 | |
| Ortalama NVIDIA GeForce RTX 4070 Laptop GPU (41 - 131.9, n=65) | |
| Razer Blade 17 (i7-12800H, RTX 3070 Ti) | |
| MSI Katana 17 B13VFK | |
| Asus TUF Gaming F17 FX707Z-HX011W | |
| Asus ROG Strix G17 G713QE-RB74 | |
| Lenovo ThinkPad Z16 Gen 2 | |
| 2560x1440 High Quality | |
| MSI Raider GE78 HX 13VI | |
| Alienware m16 R1 AMD | |
| Alienware m18 R1 AMD | |
| Asus TUF Gaming A17 FA707XI-NS94 | |
| Lenovo Legion 7 16ARHA7 | |
| Ortalama NVIDIA GeForce RTX 4070 Laptop GPU (32.5 - 119.9, n=57) | |
| Razer Blade 17 (i7-12800H, RTX 3070 Ti) | |
| MSI Katana 17 B13VFK | |
| Lenovo ThinkPad Z16 Gen 2 | |
| 3840x2160 High Quality | |
| MSI Raider GE78 HX 13VI | |
| Alienware m16 R1 AMD | |
| Alienware m18 R1 AMD | |
| Asus TUF Gaming A17 FA707XI-NS94 | |
| Ortalama NVIDIA GeForce RTX 4070 Laptop GPU (26.6 - 52.8, n=23) | |
| MSI Katana 17 B13VFK | |
| X-Plane 11.11 | |
| 1920x1080 high (fps_test=3) | |
| MSI Raider GE78 HX 13VI | |
| MSI Katana 17 B13VFK | |
| Alienware m16 R1 AMD | |
| Ortalama NVIDIA GeForce RTX 4070 Laptop GPU (52.1 - 147.9, n=69) | |
| Razer Blade 17 (i7-12800H, RTX 3070 Ti) | |
| Asus TUF Gaming F17 FX707Z-HX011W | |
| Alienware m18 R1 AMD | |
| Asus TUF Gaming A17 FA707XI-NS94 | |
| Asus ROG Strix G17 G713QE-RB74 | |
| Lenovo Legion 7 16ARHA7 | |
| Lenovo ThinkPad Z16 Gen 2 | |
| 3840x2160 high (fps_test=3) | |
| MSI Raider GE78 HX 13VI | |
| MSI Katana 17 B13VFK | |
| Alienware m16 R1 AMD | |
| Ortalama NVIDIA GeForce RTX 4070 Laptop GPU (63.4 - 125.8, n=26) | |
| Asus TUF Gaming A17 FA707XI-NS94 | |
| Alienware m18 R1 AMD | |
| Dota 2 Reborn | |
| 1920x1080 ultra (3/3) best looking | |
| MSI Raider GE78 HX 13VI | |
| Alienware m16 R1 AMD | |
| MSI Katana 17 B13VFK | |
| Ortalama NVIDIA GeForce RTX 4070 Laptop GPU (89.7 - 191.2, n=67) | |
| Alienware m18 R1 AMD | |
| Razer Blade 17 (i7-12800H, RTX 3070 Ti) | |
| Asus TUF Gaming F17 FX707Z-HX011W | |
| Asus TUF Gaming A17 FA707XI-NS94 | |
| Asus ROG Strix G17 G713QE-RB74 | |
| Lenovo ThinkPad Z16 Gen 2 | |
| Lenovo Legion 7 16ARHA7 | |
| 3840x2160 ultra (3/3) best looking | |
| MSI Raider GE78 HX 13VI | |
| Alienware m16 R1 AMD | |
| Ortalama NVIDIA GeForce RTX 4070 Laptop GPU (88.4 - 153.3, n=26) | |
| MSI Katana 17 B13VFK | |
| Alienware m18 R1 AMD | |
| Asus TUF Gaming A17 FA707XI-NS94 | |
Witcher 3 FPS Chart
| düşük | orta | yüksek | ultra | QHD | 4K | |
|---|---|---|---|---|---|---|
| The Witcher 3 (2015) | 120.7 | 75.2 | ||||
| Dota 2 Reborn (2015) | 161.6 | 146.4 | 138.1 | 130 | 112.2 | |
| Final Fantasy XV Benchmark (2018) | 121.9 | 88.9 | 49.4 | |||
| X-Plane 11.11 (2018) | 114.7 | 101.7 | 80.7 | 68.6 | ||
| Far Cry 5 (2018) | 121 | 114 | 62 | |||
| Strange Brigade (2018) | 214 | 139.3 | 72.6 | |||
| Tiny Tina's Wonderlands (2022) | 109.4 | 75.6 | 35.5 | |||
| F1 22 (2022) | 210 | 83.8 | 54.7 | 26.5 | ||
| Baldur's Gate 3 (2023) | 114.7 | 81.1 | 41.1 | |||
| Cyberpunk 2077 (2023) | 135.8 | 118.1 | 99.4 | 86.3 | 51.8 | 22.3 |
Emisyonlar
Sistem Gürültüsü
Fan gürültüsü genel olarak Intel modelinde kaydettiğimizden daha yüksek olmakla kalmıyor, aynı zamanda Turbo moduna ayarlandığında çok daha yüksek. Çalışıyor Witcher 3 performans modunda fan gürültüsü sadece 41 dB(A) olurken Turbo modunda 57 dB(A) olur. Turbo modu Performans modundan sadece biraz daha hızlı olduğundan, kullanıcılar çok daha sessiz fanlar için Turbo modu yerine Performans modunda oyun oynamayı düşünebilirler. Aksi takdirde, oyun dizüstü bilgisayarları 50 dB(A) veya daha yüksek sese ulaştığında genellikle kulaklık öneriyoruz.
Ses yüksekliği
| Boşta |
| 28.5 / 29.8 / 29.8 dB |
| Çalışırken |
| 34.8 / 57.3 dB |
 | ||
30 dB sessiz 40 dB(A) duyulabilirlik 50 dB(A) gürültülü |
||
min: | ||
| Asus TUF Gaming A17 FA707XI-NS94 GeForce RTX 4070 Laptop GPU, R9 7940HS, WD PC SN560 SDDPNQE-1T00 | Asus TUF Gaming F17 FX707Z-HX011W GeForce RTX 3060 Laptop GPU, i7-12700H, SK Hynix HFM001TD3JX013N | MSI Pulse 17 B13VGK GeForce RTX 4070 Laptop GPU, i7-13700H, Micron 2400 MTFDKBA1T0QFM | MSI Katana 17 B13VFK GeForce RTX 4060 Laptop GPU, i7-13620H, Micron 2400 MTFDKBA1T0QFM | Razer Blade 17 (i7-12800H, RTX 3070 Ti) GeForce RTX 3070 Ti Laptop GPU, i7-12800H, Samsung PM9A1 MZVL21T0HCLR | HP Pavilion Gaming 17-cd2146ng GeForce RTX 3050 Ti Laptop GPU, i5-11300H, SK Hynix BC711 512GB HFM512GD3GX013N | |
|---|---|---|---|---|---|---|
| Noise | 12% | 16% | -4% | 15% | 7% | |
| kapalı / ortam * (dB) | 27.9 | 24 14% | 24 14% | 24.5 12% | 23 18% | 25 10% |
| Idle Minimum * (dB) | 28.5 | 24 16% | 24 16% | 24.5 14% | 23 19% | 27 5% |
| Idle Average * (dB) | 29.8 | 24 19% | 24 19% | 24.5 18% | 23 23% | 28 6% |
| Idle Maximum * (dB) | 29.8 | 24 19% | 24 19% | 40 -34% | 23 23% | 30 -1% |
| Load Average * (dB) | 34.8 | 42.6 -22% | 32.49 7% | 48.3 -39% | 36.92 -6% | 39 -12% |
| Witcher 3 ultra * (dB) | 57.1 | 46.84 18% | 46.51 19% | 56 2% | 50 12% | 44 23% |
| Load Maximum * (dB) | 57.3 | 46.84 18% | 46.51 19% | 59.1 -3% | 50 13% | 46 20% |
* ... daha küçük daha iyidir
Sıcaklık
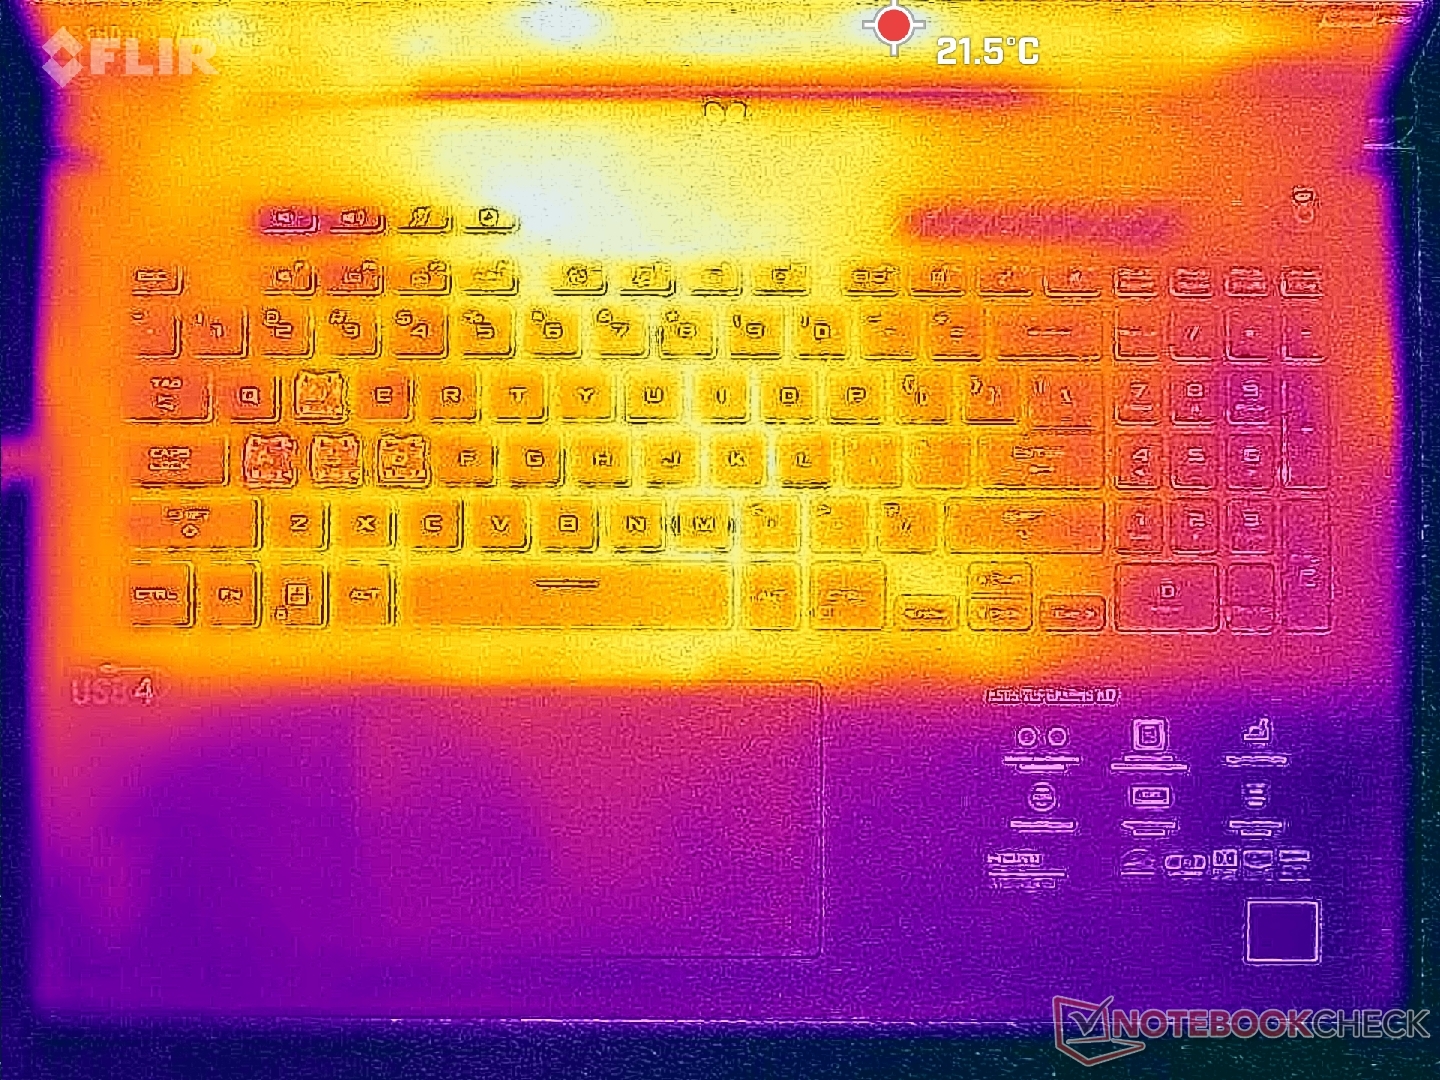
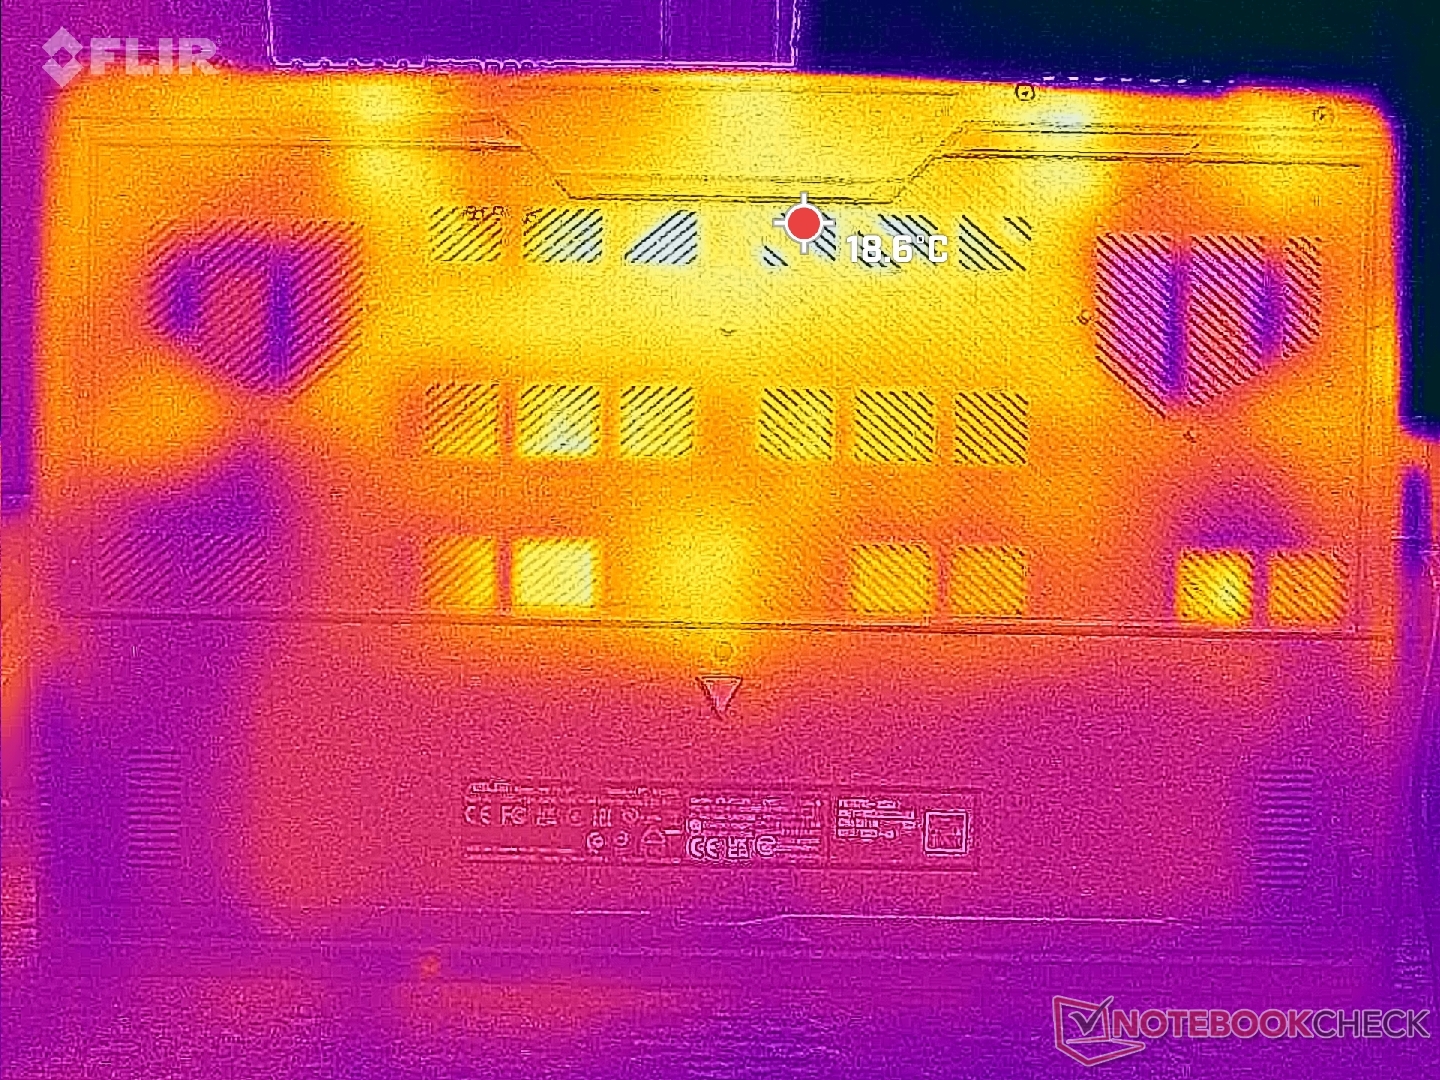
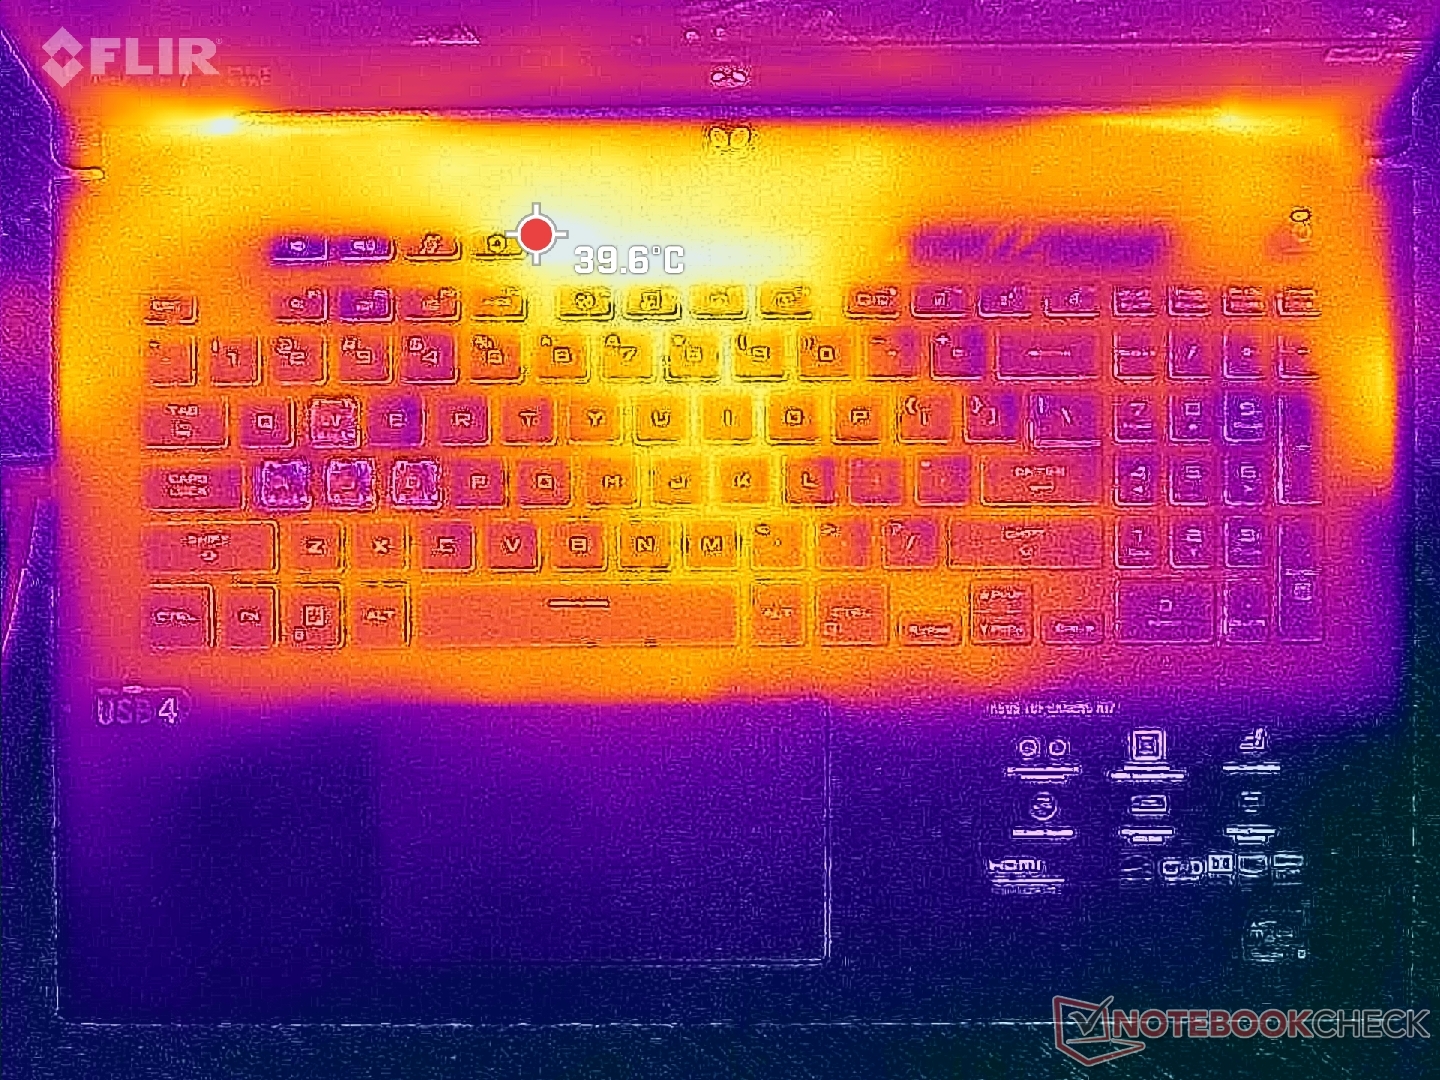
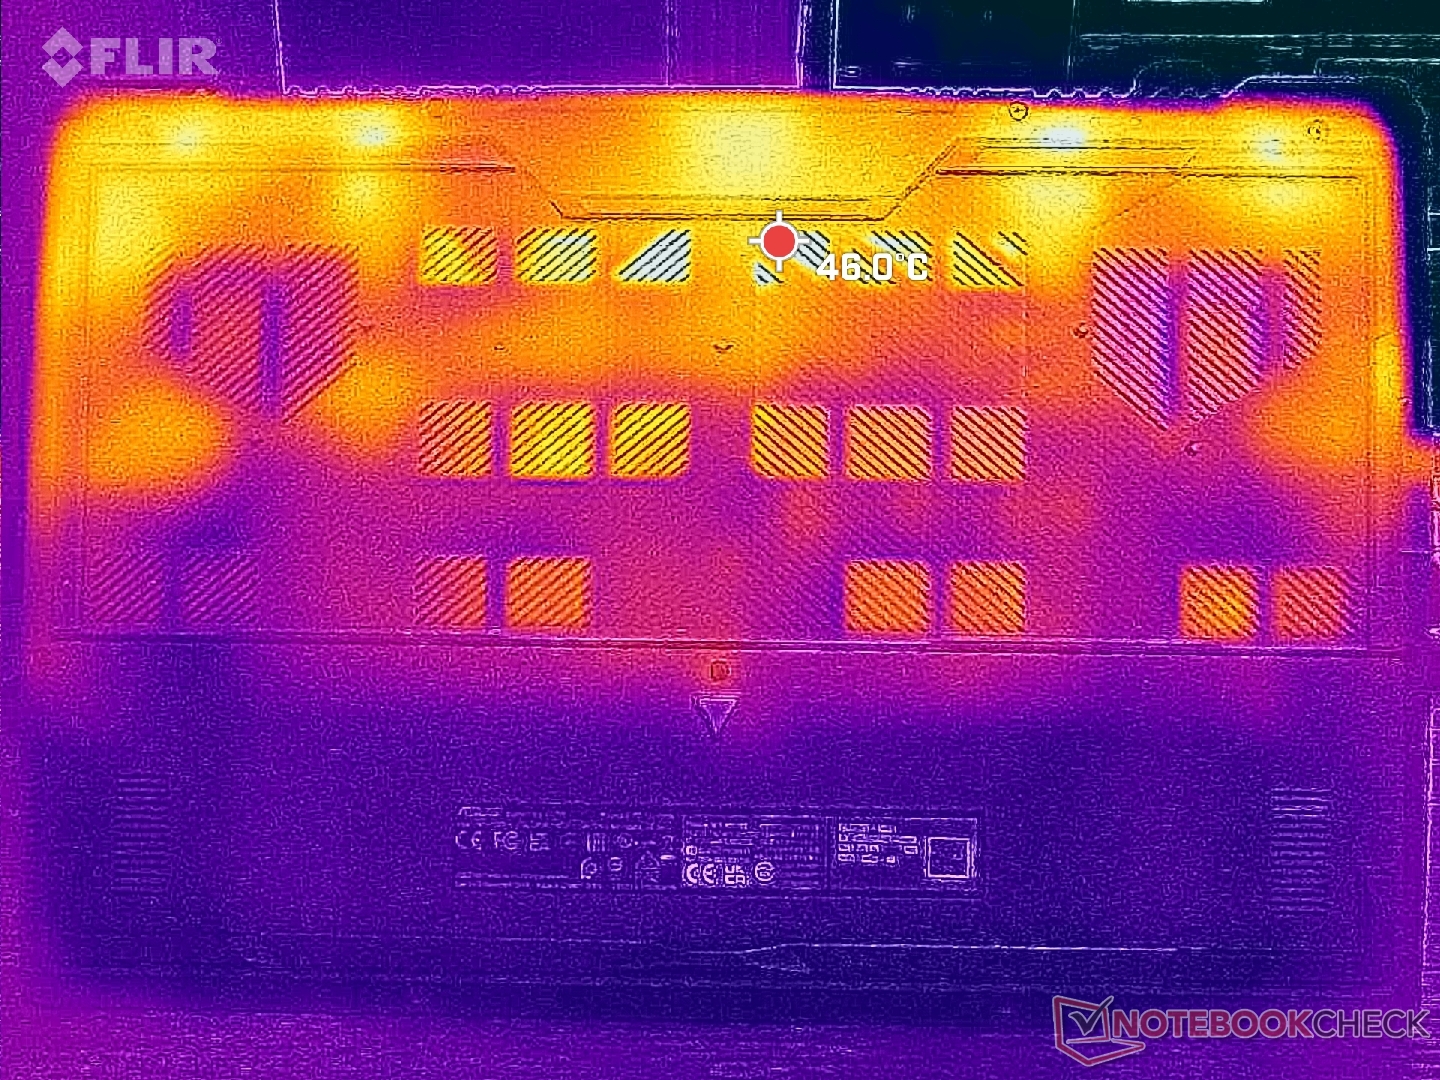
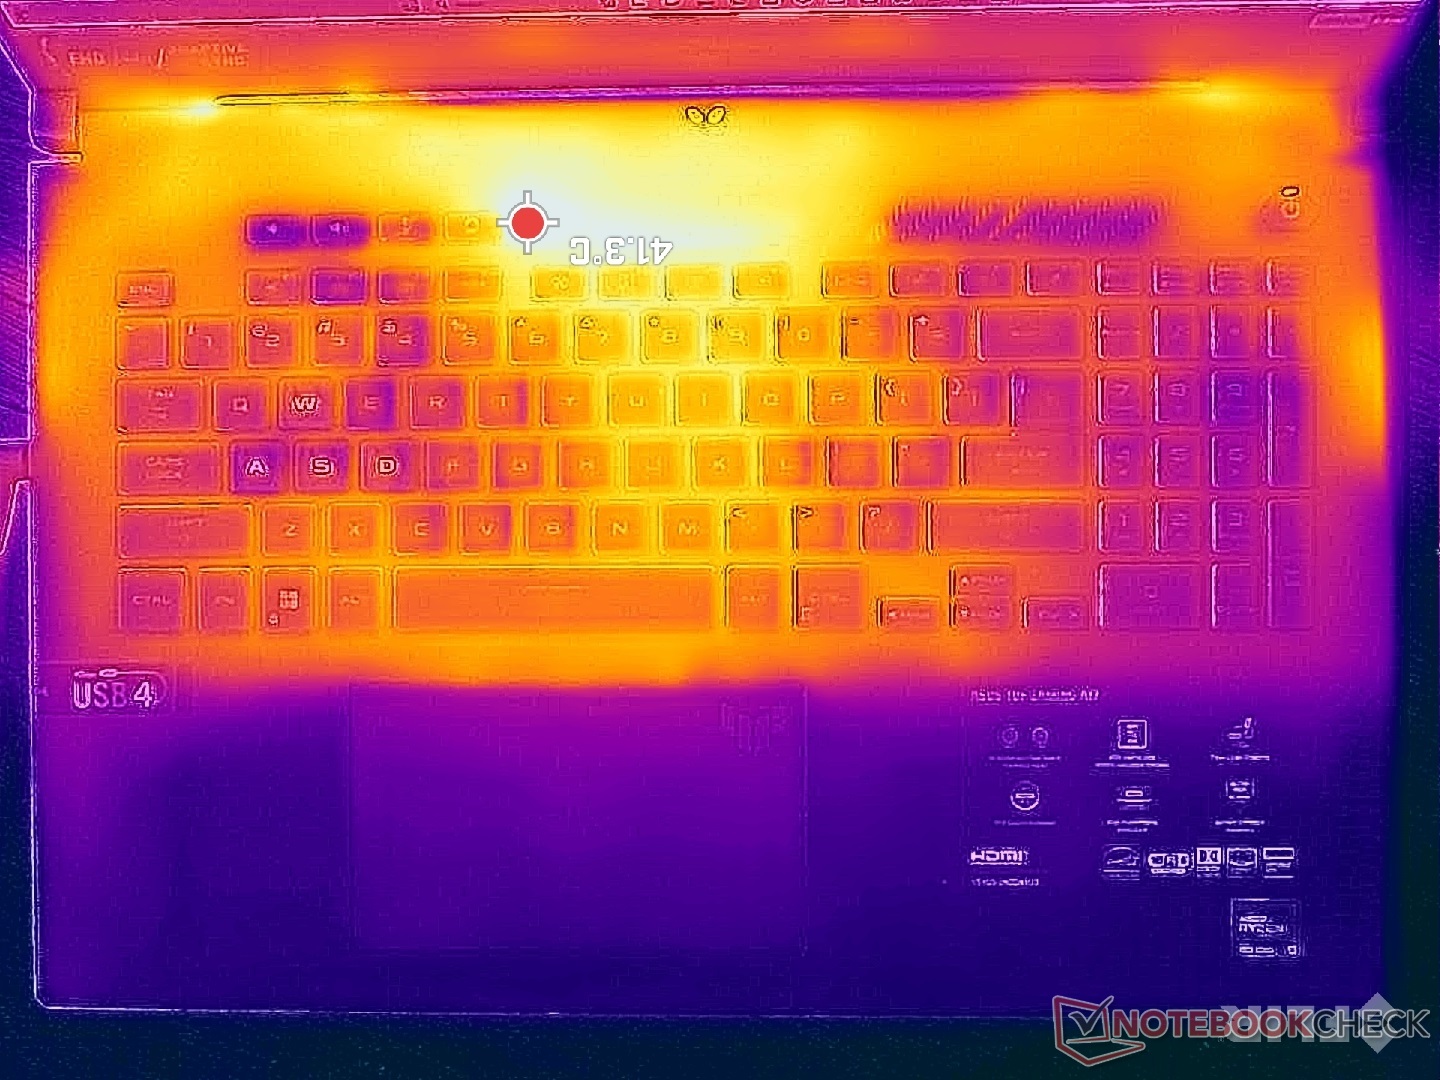
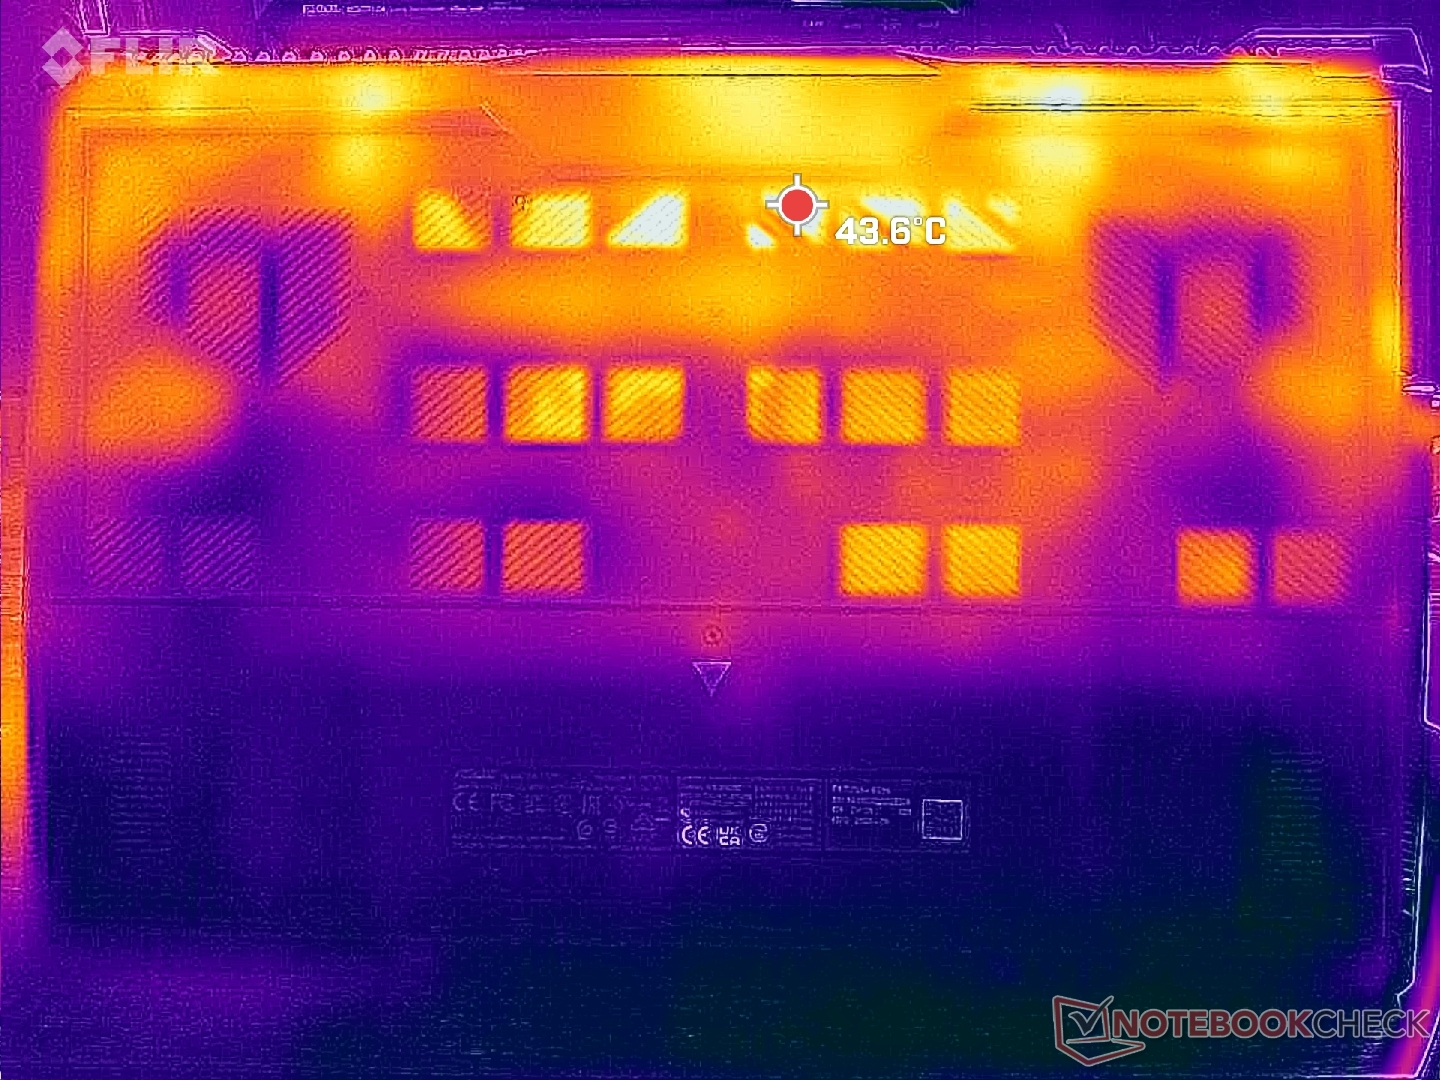
Yüzey sıcaklıkları, büyük ölçüde tabanın plastik malzemeleri ve geniş havalandırma ızgaraları nedeniyle diğer oyun dizüstü bilgisayarlarının çoğundan daha düşüktür. Örneğin, oyun oynarken Asus'umuzun ortalama yüzey sıcaklığı 39 C'ye kıyasla sadece 29 C'ye ulaşıyordu Razer Blade 17 nispeten daha ince, daha az havalandırma ızgarası içeriyor ve çoğunlukla metal alaşımdan oluşuyor. Asus'umuzdaki sıcak noktalar da parmakların dokunma olasılığının daha düşük olduğu arka tarafa doğru daha fazla.
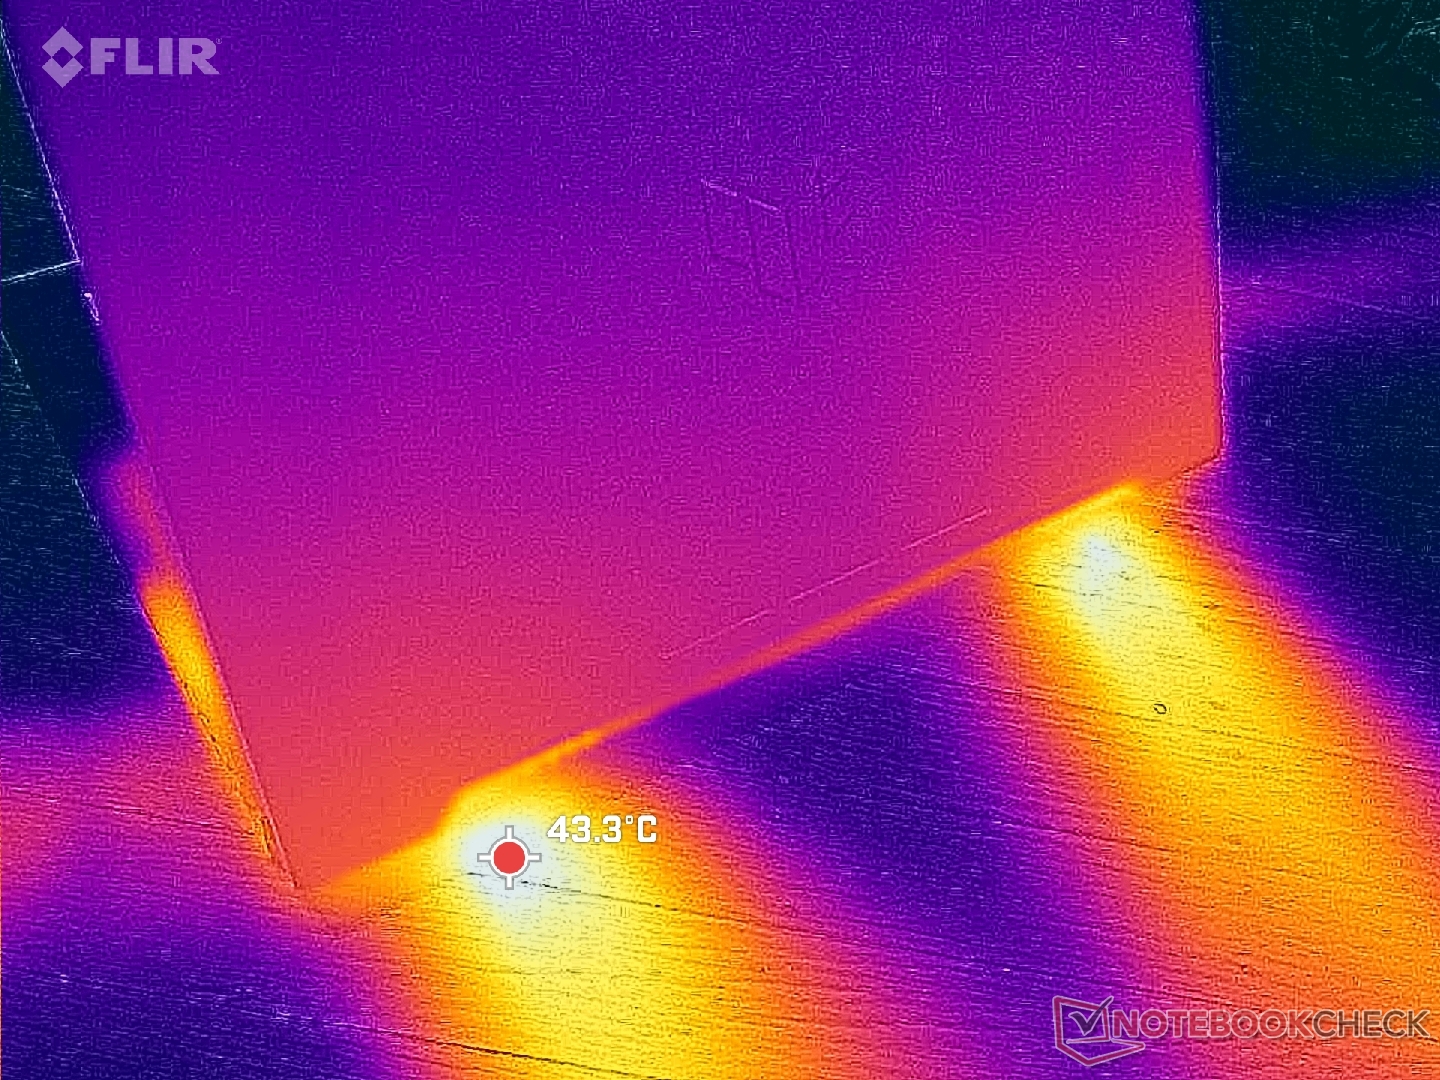
(±) Üst taraftaki maksimum sıcaklık, 40.4 °C / 105 F ortalamasına kıyasla 40 °C / 104 F'dir. , Gaming sınıfı için 21.2 ile 68.8 °C arasında değişir.
(+) Alt kısım, 43.2 °C / 110 F ortalamasına kıyasla maksimum 33.6 °C / 92 F'ye kadar ısınır
(+) Boşta kullanımda, üst tarafın ortalama sıcaklığı 23 °C / 73 F olup, cihazın 33.9 °C / 93 F.
(+) The Witcher 3 oynarken, üst tarafın ortalama sıcaklığı 29.6 °C / 85 F olup, cihazın 33.9 °C / 93 F.
(+) Avuç içi dayanakları ve dokunmatik yüzey, maksimum 22 °C / 71.6 F ile cilt sıcaklığından daha soğuktur ve bu nedenle dokunulduğunda soğuktur.
(+) Benzer cihazların avuç içi dayanağı alanının ortalama sıcaklığı 28.8 °C / 83.8 F (+6.8 °C / 12.2 F) idi.
| Asus TUF Gaming A17 FA707XI-NS94 AMD Ryzen 9 7940HS, NVIDIA GeForce RTX 4070 Laptop GPU | Asus TUF Gaming F17 FX707Z-HX011W Intel Core i7-12700H, NVIDIA GeForce RTX 3060 Laptop GPU | MSI Pulse 17 B13VGK Intel Core i7-13700H, NVIDIA GeForce RTX 4070 Laptop GPU | MSI Katana 17 B13VFK Intel Core i7-13620H, NVIDIA GeForce RTX 4060 Laptop GPU | Razer Blade 17 (i7-12800H, RTX 3070 Ti) Intel Core i7-12800H, NVIDIA GeForce RTX 3070 Ti Laptop GPU | HP Pavilion Gaming 17-cd2146ng Intel Core i5-11300H, NVIDIA GeForce RTX 3050 Ti Laptop GPU | |
|---|---|---|---|---|---|---|
| Heat | -29% | -29% | -25% | -25% | -17% | |
| Maximum Upper Side * (°C) | 40 | 52 -30% | 48 -20% | 41.6 -4% | 43 -8% | 44 -10% |
| Maximum Bottom * (°C) | 33.6 | 47 -40% | 50 -49% | 43.1 -28% | 44 -31% | 48 -43% |
| Idle Upper Side * (°C) | 26.6 | 31 -17% | 30 -13% | 32 -20% | 32 -20% | 27 -2% |
| Idle Bottom * (°C) | 24.4 | 31 -27% | 33 -35% | 35.8 -47% | 34 -39% | 27 -11% |
* ... daha küçük daha iyidir
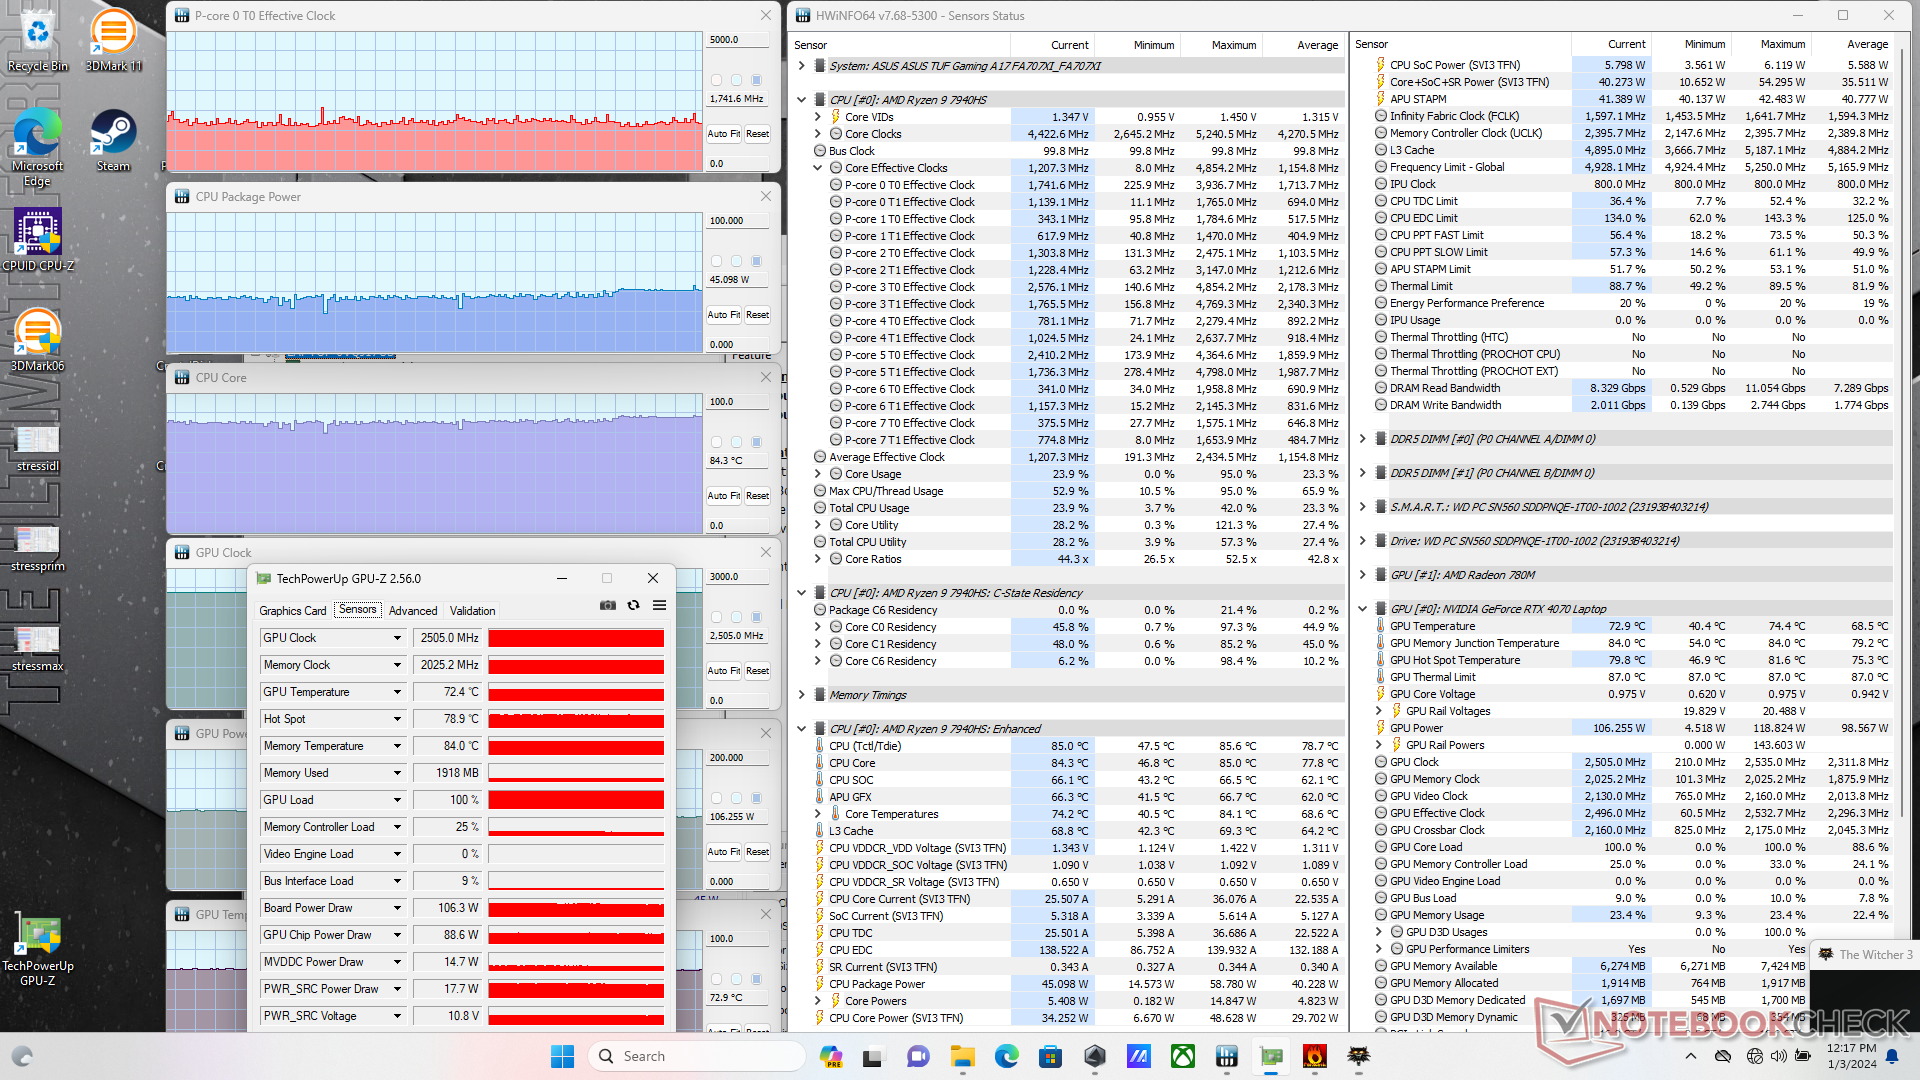
Stres Testi
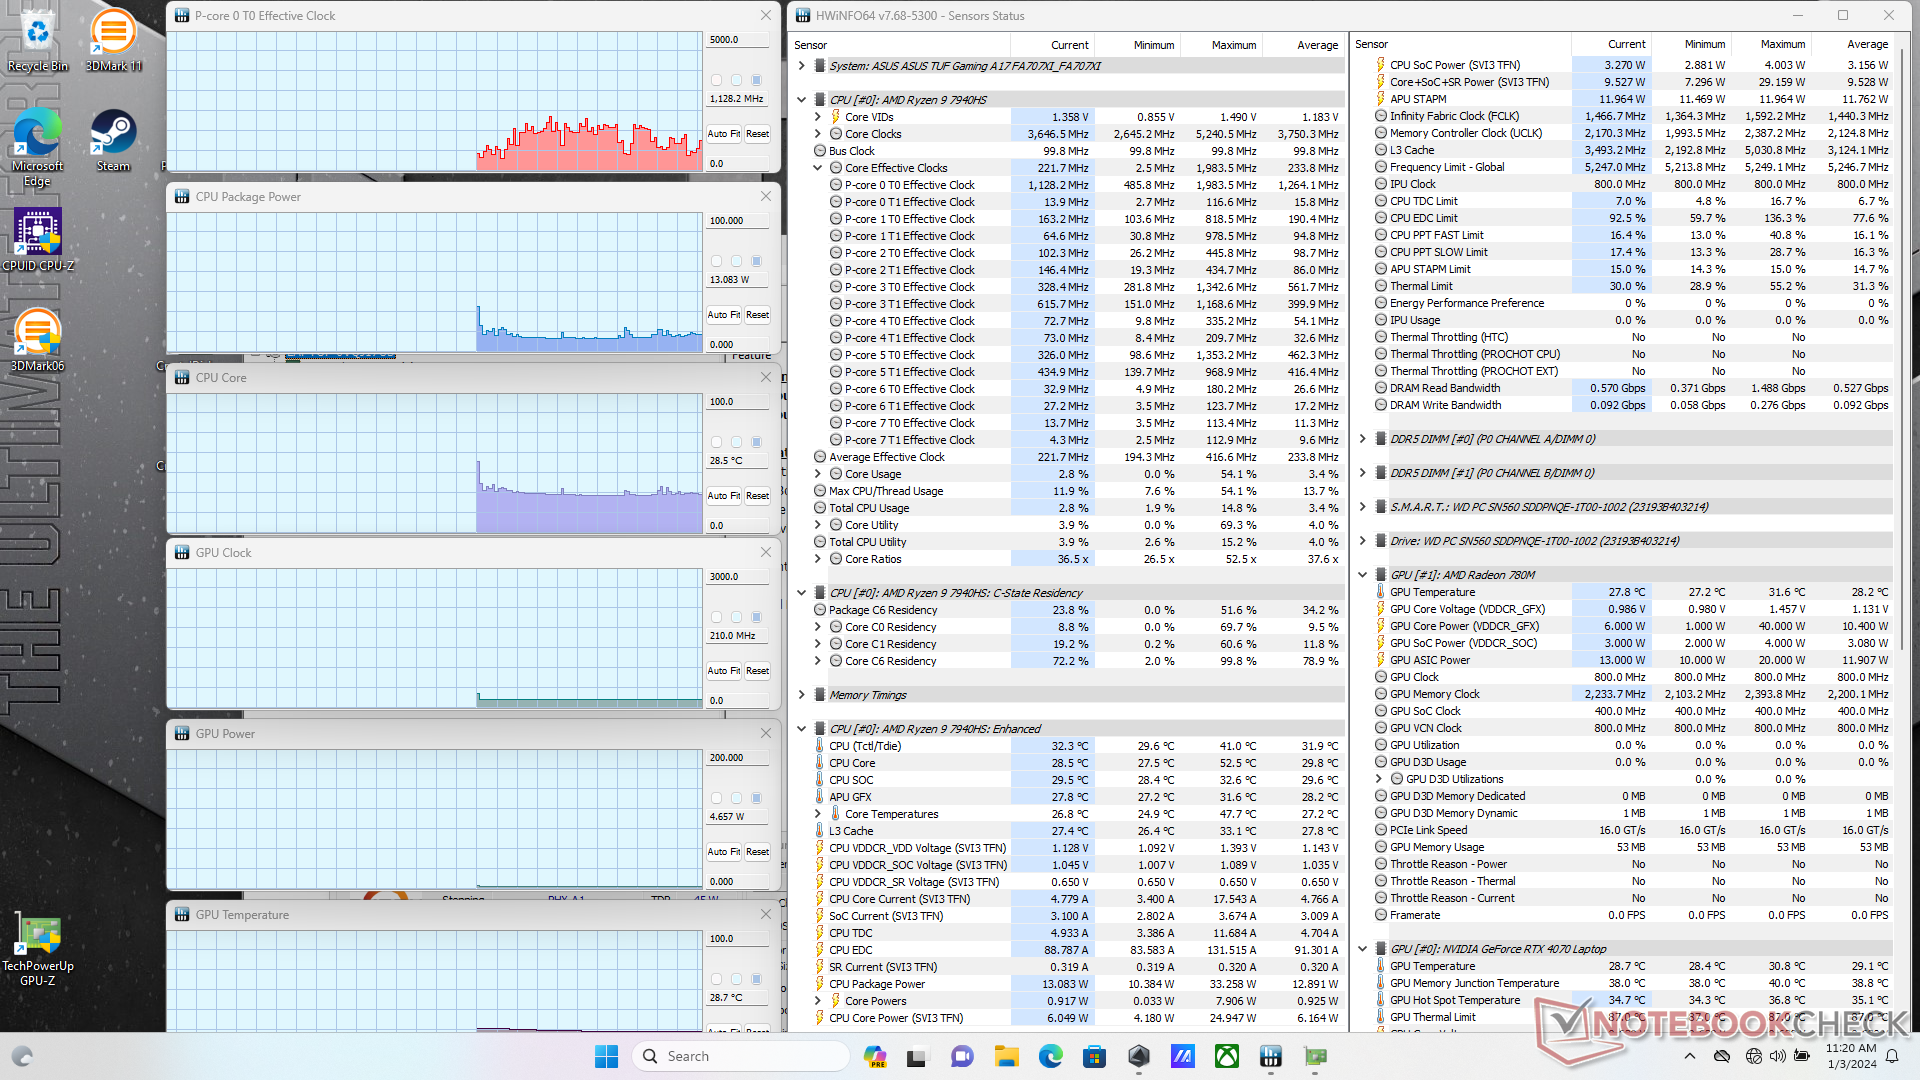
Prime95 altında zorlandığında, CPU 4,8 GHz'e kadar yükseldikten sonra biraz düşerek 4,5 GHz, 80 W ve 82 C'de sabitlendi.
GPU, 2505 MHz çekirdek, 2025 MHz RAM ve 106 W değerlerinde stabilize olurken Witcher 3 turbo modunda çalışırken Performans modunda çalıştırmak tüm bu değerleri sırasıyla 2325 MHz, 2000 MHz ve 95 W'a düşürecektir. Performans modu daha sonra yukarıdaki GPU Performansı bölümünde belirtildiği gibi grafiklere hafif bir darbe indirir. Turbo modda daha yüksek fan tavanına rağmen hem GPU'nun hem de özellikle CPU'nun Turbo moddayken belirgin şekilde daha sıcak çalıştığını unutmayın.
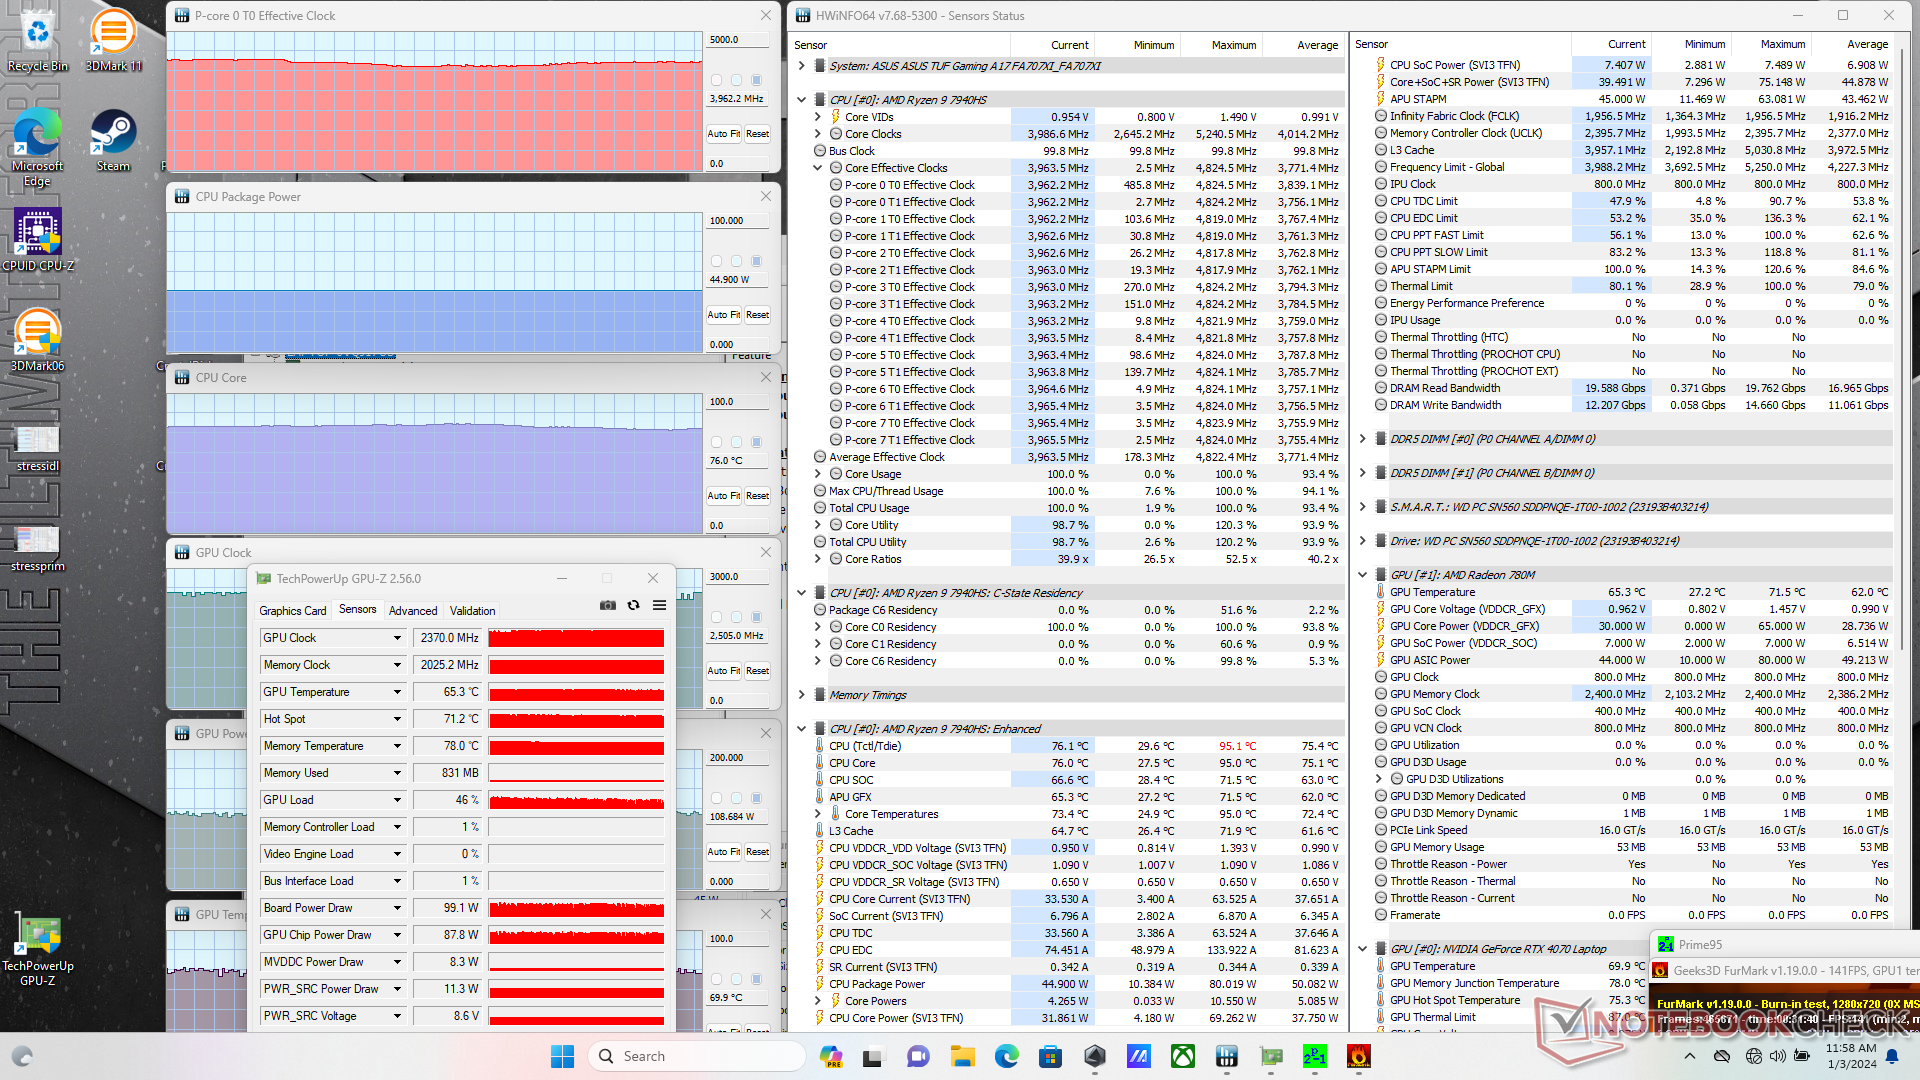
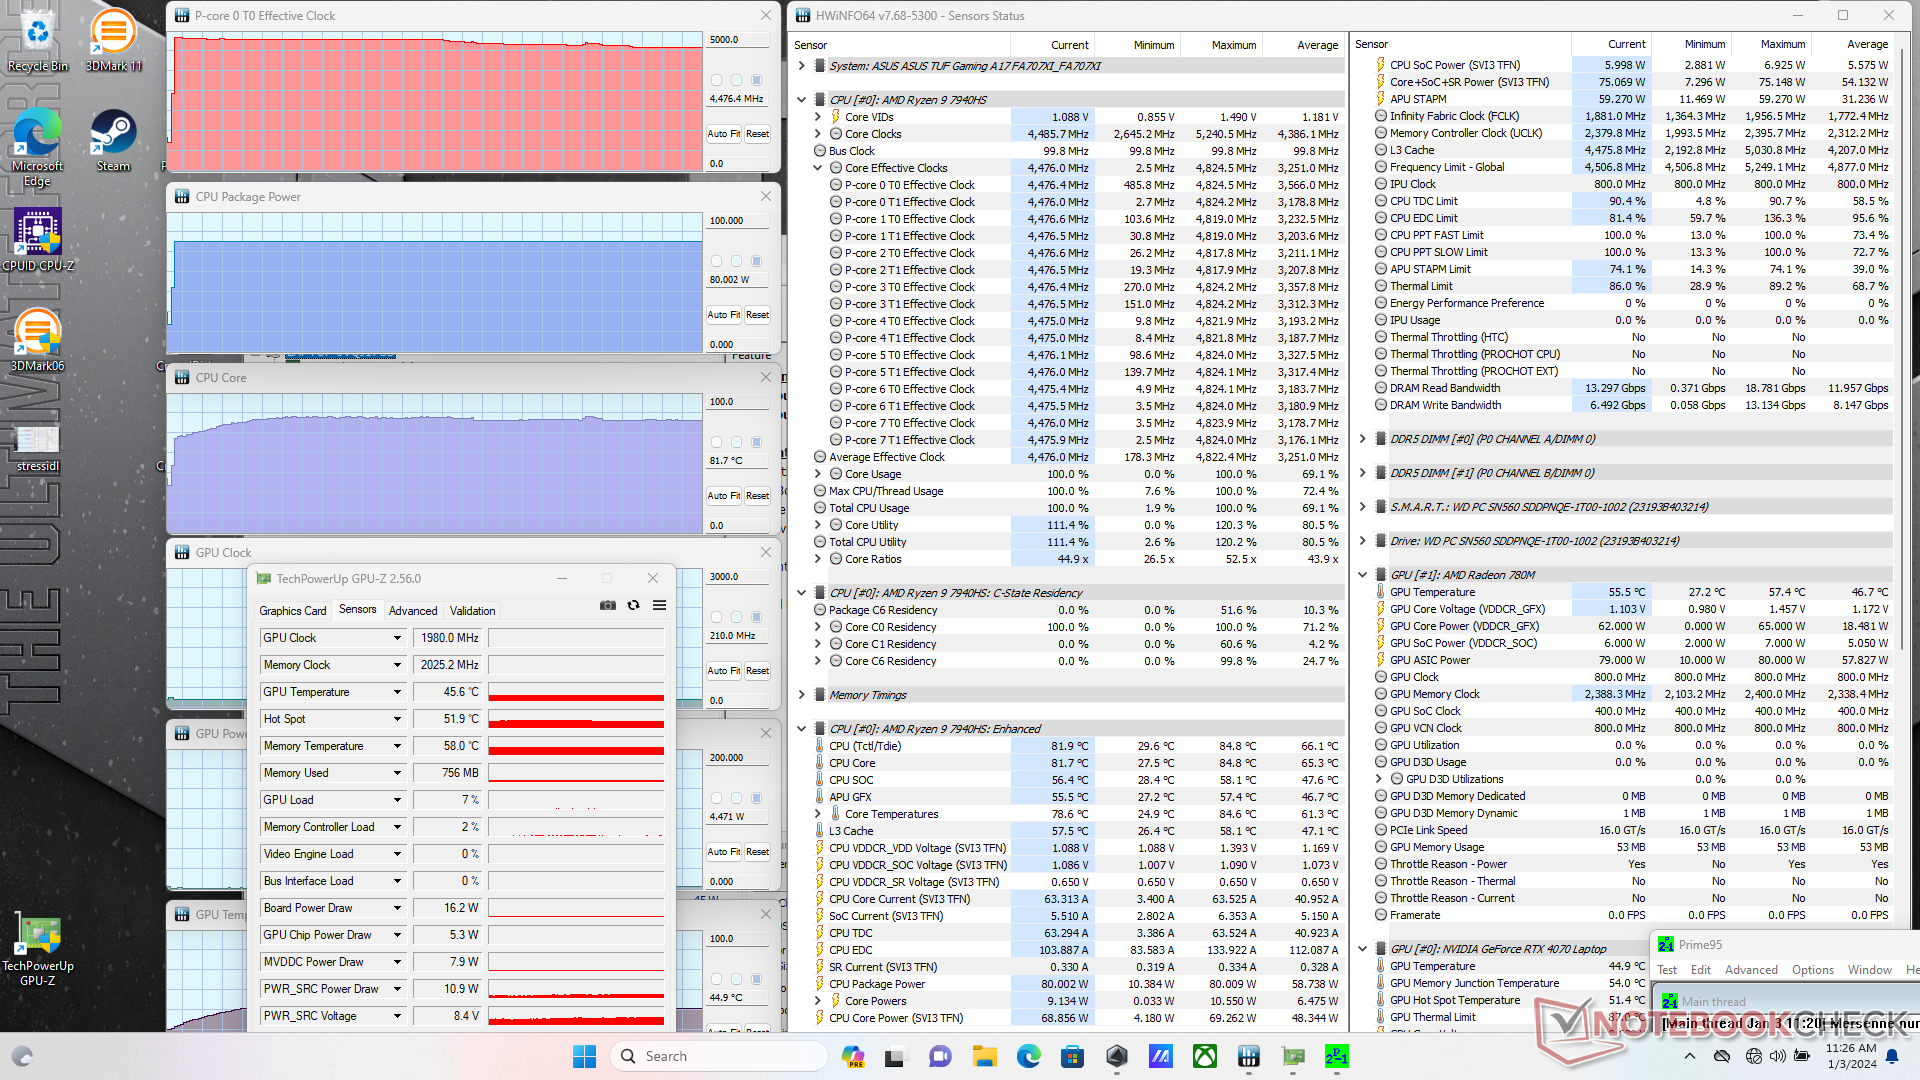
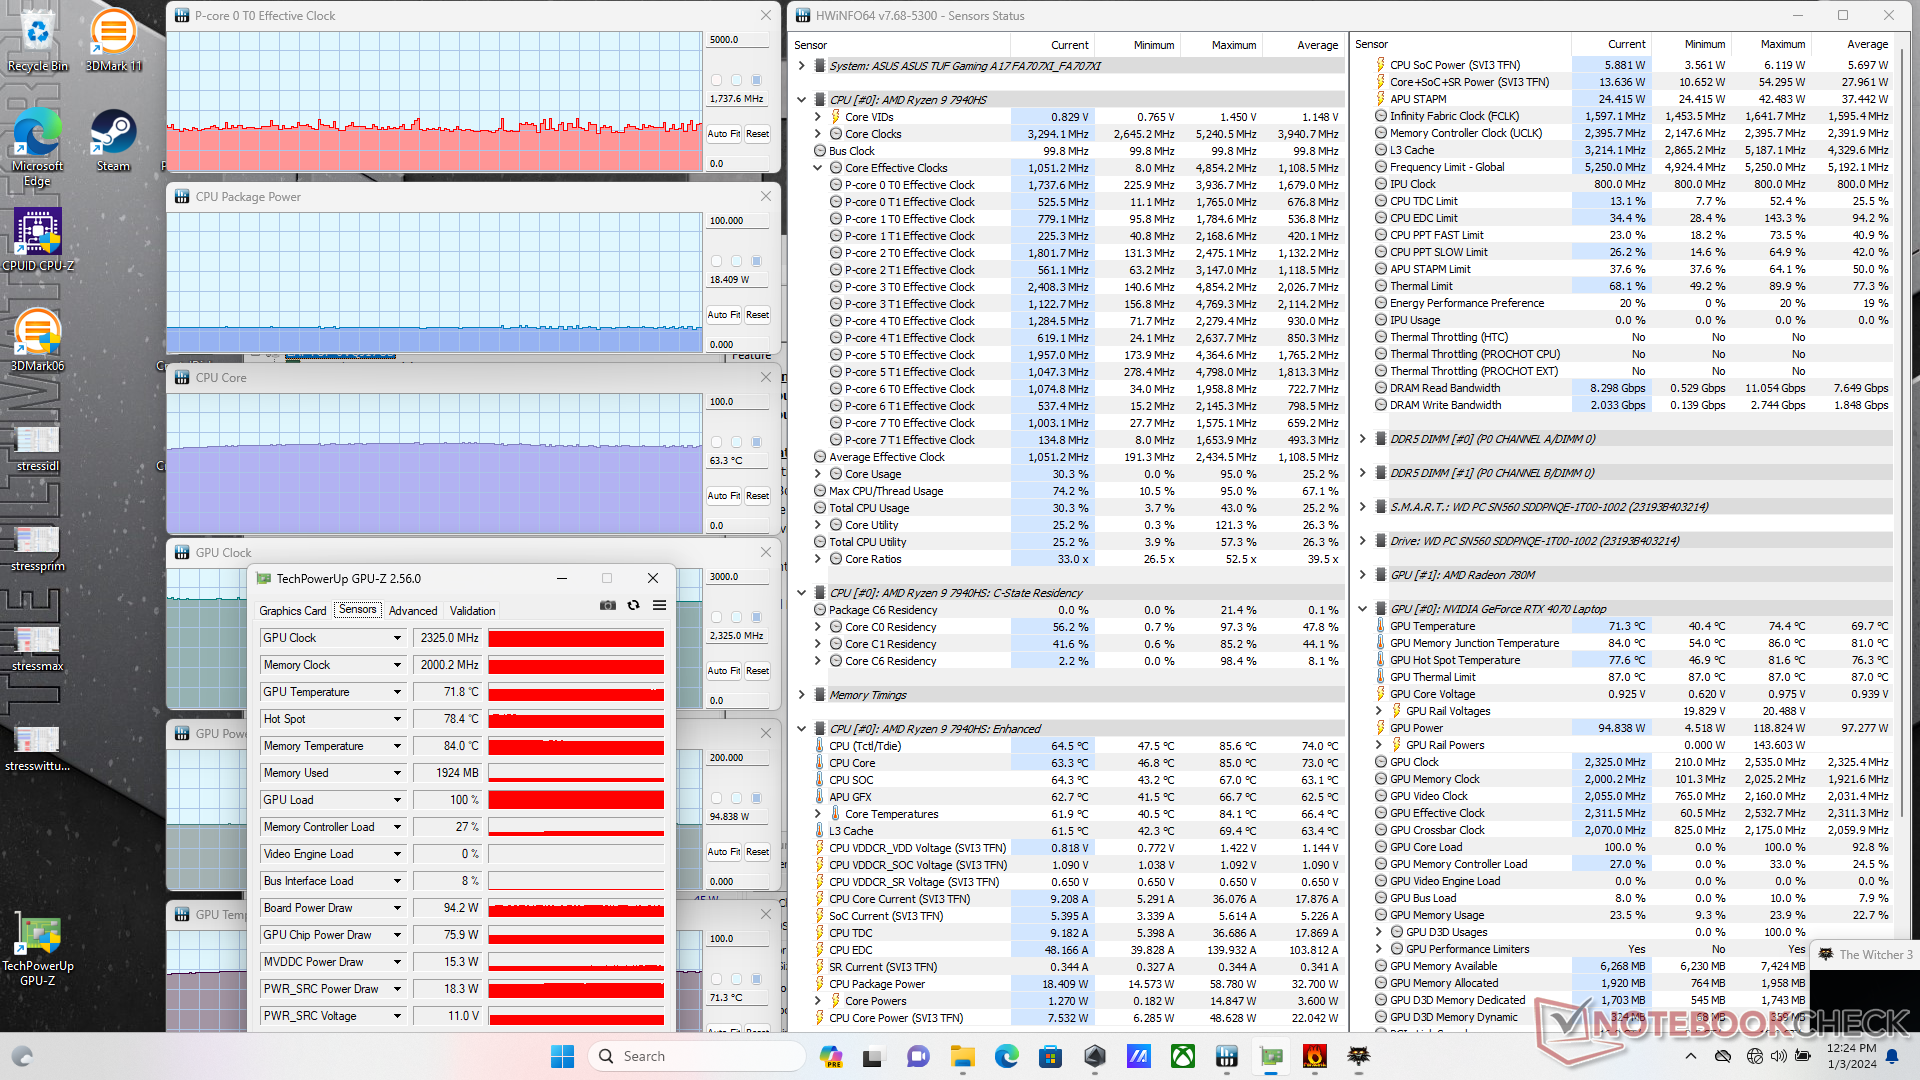
| CPU Saati (GHz) | GPU Saati (MHz) | Ortalama CPU Sıcaklığı (°C) | Ortalama GPU Sıcaklığı (°C) | |
| Sistem Boşta | -- | -- | 29 | 29 |
| Prime95 Stres | 4,5 | -- | 82 | 45 |
| Prime95 + FurMark Stres | 4.0 | 2370 | 76 | 70 |
| Witcher 3 Stres (Performans modu) | ~1.7 | 2325 | 63 | 71 |
| Witcher 3 Stres (Turbo modu) | ~1.7 | 2505 | 84 | 73 |
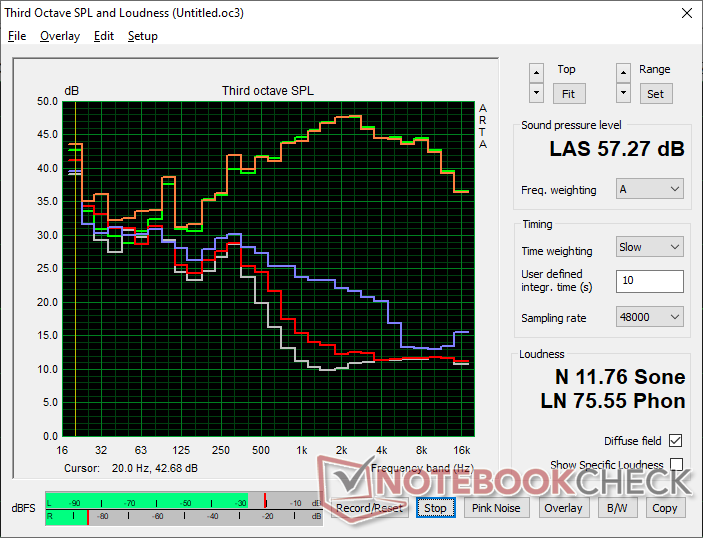
Konuşmacılar
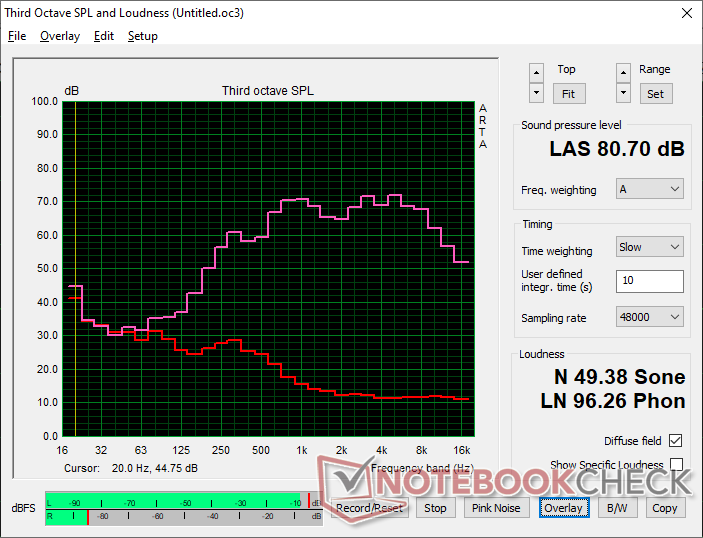
Asus TUF Gaming A17 FA707XI-NS94 ses analizi
(±) | hoparlör ses yüksekliği ortalama ama iyi (80.7 dB)
Bas 100 - 315Hz
(-) | neredeyse hiç bas yok - ortalama olarak medyandan 17.7% daha düşük
(±) | Bas doğrusallığı ortalamadır (8.4% delta - önceki frekans)
Ortalar 400 - 2000 Hz
(+) | dengeli ortalar - medyandan yalnızca 3.7% uzakta
(+) | orta frekanslar doğrusaldır (5.1% deltadan önceki frekansa)
Yüksekler 2 - 16 kHz
(+) | dengeli yüksekler - medyandan yalnızca 4.4% uzakta
(+) | yüksekler doğrusaldır (6.2% deltadan önceki frekansa)
Toplam 100 - 16.000 Hz
(±) | Genel sesin doğrusallığı ortalamadır (17.3% ortancaya göre fark)
Aynı sınıfla karşılaştırıldığında
» Bu sınıftaki tüm test edilen cihazların %47%'si daha iyi, 12% benzer, 41% daha kötüydü
» En iyisinin deltası 6% idi, ortalama 18% idi, en kötüsü 132% idi
Test edilen tüm cihazlarla karşılaştırıldığında
» Test edilen tüm cihazların %32'si daha iyi, 8 benzer, % 59 daha kötüydü
» En iyisinin deltası 4% idi, ortalama 23% idi, en kötüsü 134% idi
Apple MacBook Pro 16 2021 M1 Pro ses analizi
(+) | hoparlörler nispeten yüksek sesle çalabilir (84.7 dB)
Bas 100 - 315Hz
(+) | iyi bas - medyandan yalnızca 3.8% uzakta
(+) | bas doğrusaldır (5.2% delta ile önceki frekans)
Ortalar 400 - 2000 Hz
(+) | dengeli ortalar - medyandan yalnızca 1.3% uzakta
(+) | orta frekanslar doğrusaldır (2.1% deltadan önceki frekansa)
Yüksekler 2 - 16 kHz
(+) | dengeli yüksekler - medyandan yalnızca 1.9% uzakta
(+) | yüksekler doğrusaldır (2.7% deltadan önceki frekansa)
Toplam 100 - 16.000 Hz
(+) | genel ses doğrusaldır (4.6% ortancaya göre fark)
Aynı sınıfla karşılaştırıldığında
» Bu sınıftaki tüm test edilen cihazların %0%'si daha iyi, 0% benzer, 100% daha kötüydü
» En iyisinin deltası 5% idi, ortalama 17% idi, en kötüsü 45% idi
Test edilen tüm cihazlarla karşılaştırıldığında
» Test edilen tüm cihazların %0'si daha iyi, 0 benzer, % 100 daha kötüydü
» En iyisinin deltası 4% idi, ortalama 23% idi, en kötüsü 134% idi
Enerji Yönetimi
Güç Tüketimi
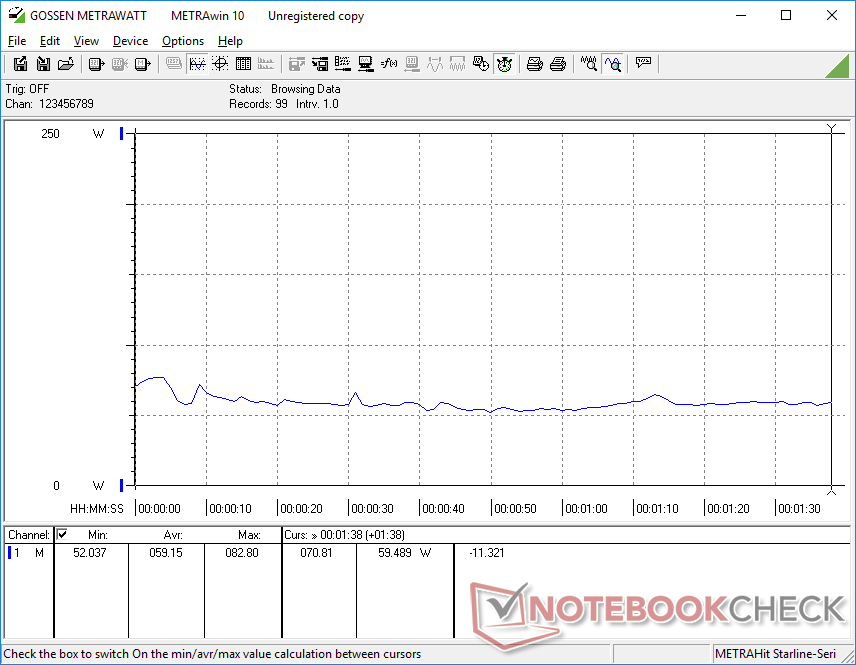
Güç tüketimi, dGPU devre dışıyken Güç Tasarrufu modunda çalışırken 6 W kadar düşük olabilir. Eğer dGPU etkinken maksimum parlaklığa ayarlanırsa, tüketim 22 W'a kadar çıkabilir ki bu da benzer koşullar altında TUF Gaming F17 veya Pulse 17'den iki kat daha fazla güç gerektirir. Bu nedenle, pil ömrü son derece önemliyse sistemi iGPU moduna ayarlamak önemlidir.
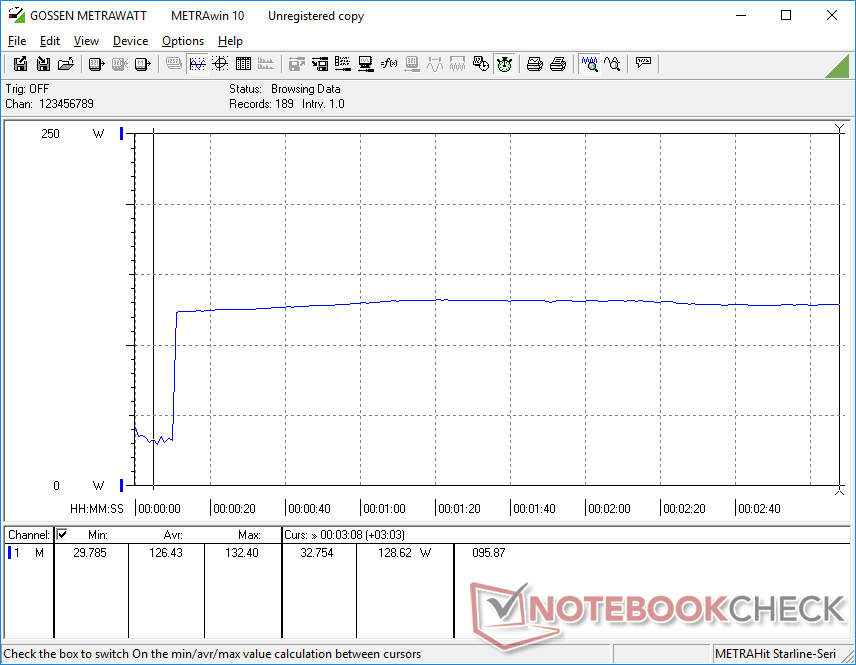
Witcher 3 adresini Turbo modunda çalıştırmak 190 W'a kadar veya TUF Gaming F17 veya Pul 17'den neredeyse 60 W daha fazla tüketecektir MSI Pulse 17 aynı GeForce RTX 4070 GPU ile. Bunun yerine Performans modunda çalıştırılırsa tüketim 150 W'a düşecektir. Genel olarak eski RTX 3060'lı oyun dizüstü bilgisayarlarından daha zorlu olsa da, performans kazanımları bunu fazlasıyla telafi ediyor.
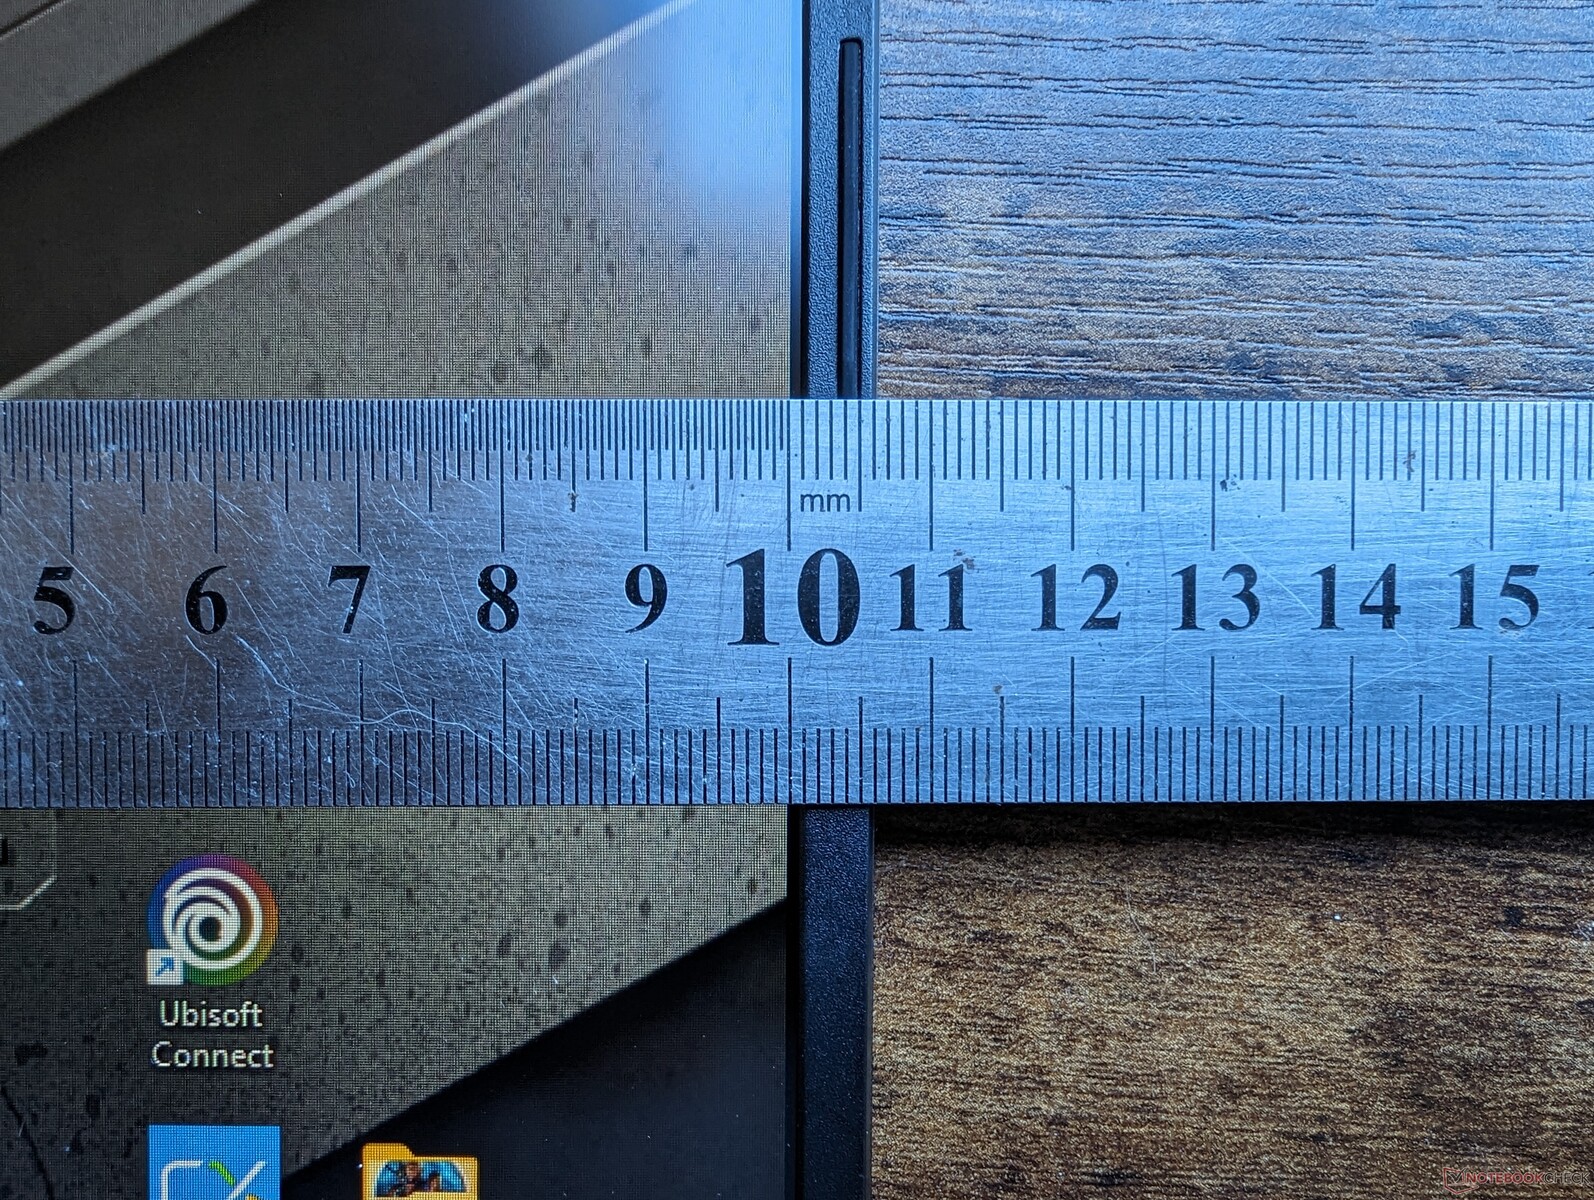
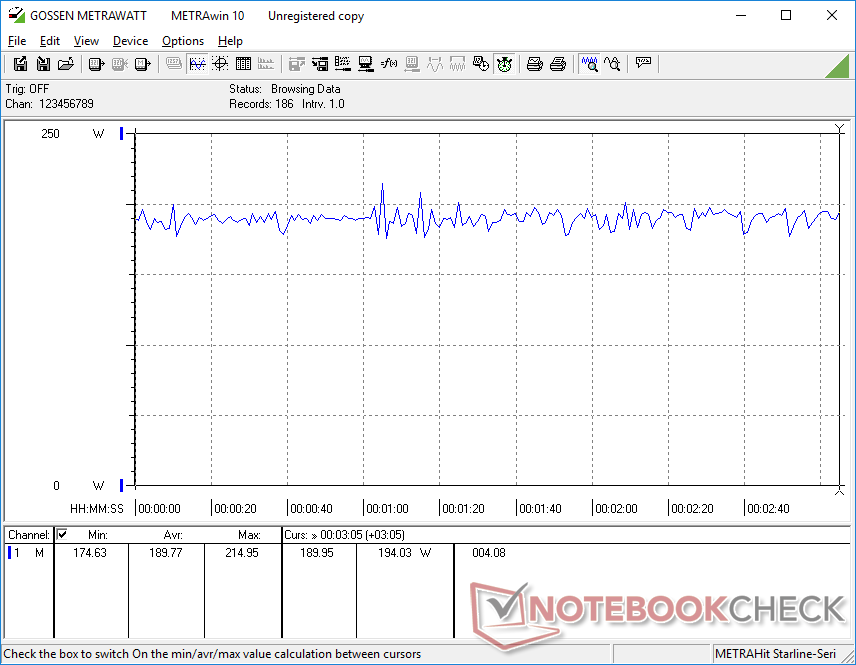
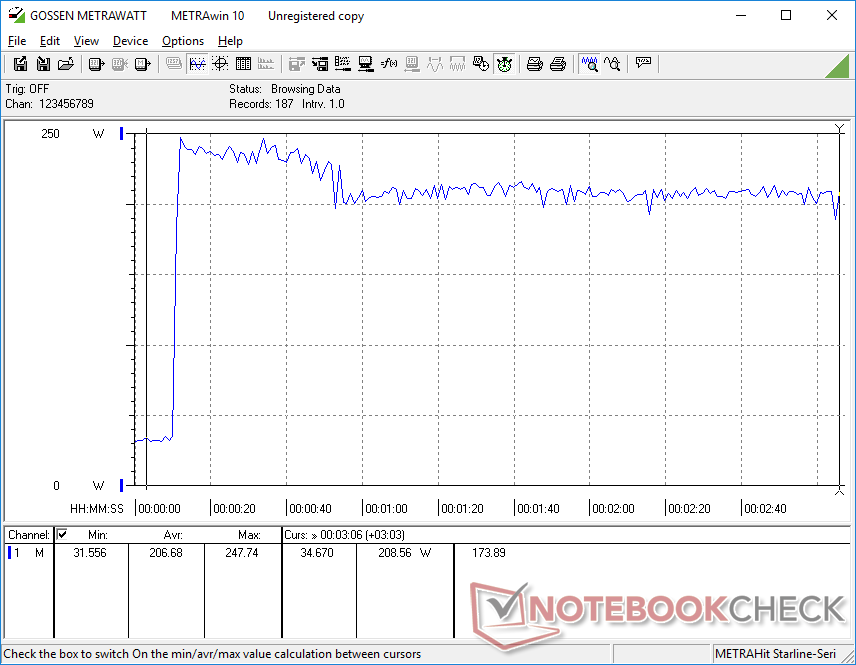
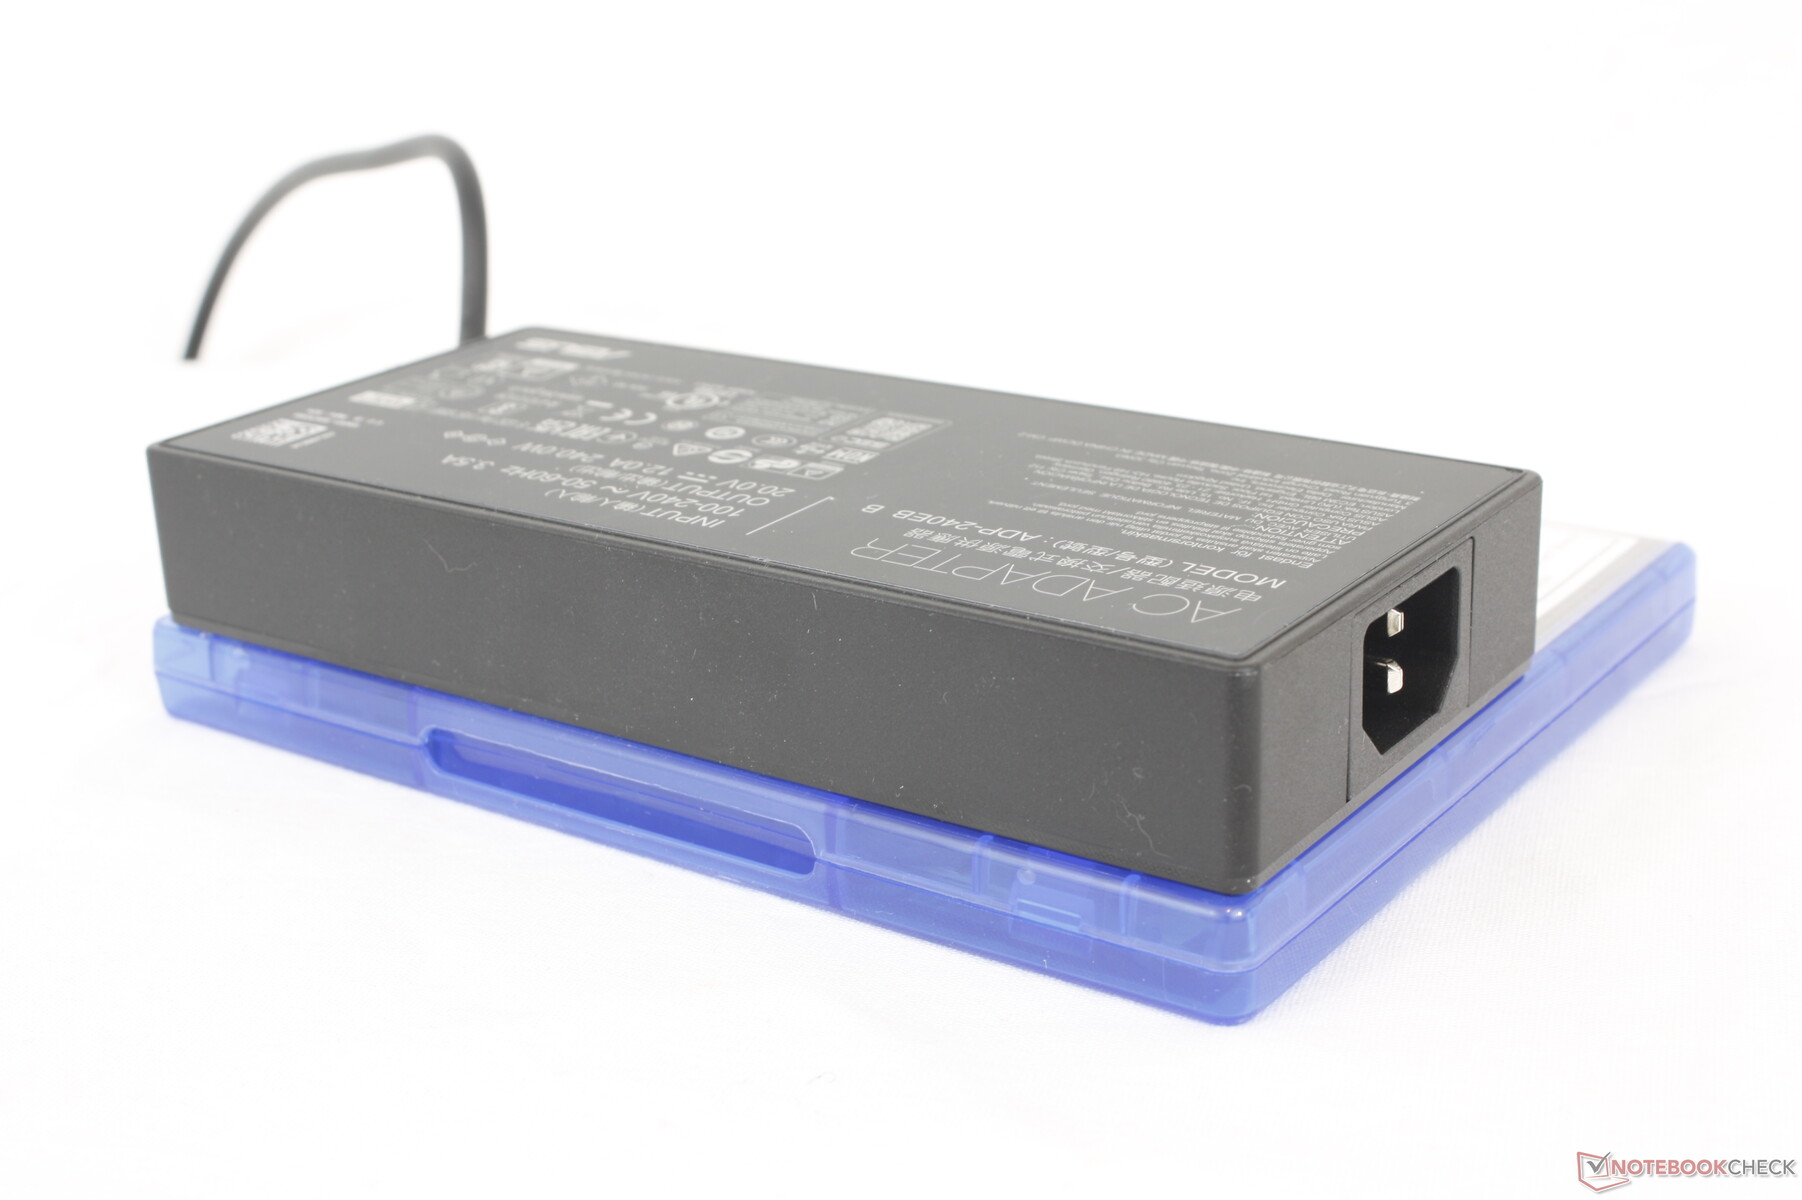
CPU ve GPU'nun her biri yüzde 100 kullanımdayken orta büyüklükteki (~16,5 x 7,6 x 2,5 cm) 240 W AC adaptörden maksimum 248 W çekişi ölçebiliyoruz. Bu oran, termal sınırlamalar nedeniyle aşağıdaki ekran görüntüsünde gösterildiği gibi yalnızca yaklaşık 30 saniye sürmektedir.
| Kapalı / Bekleme modu | |
| Boşta | |
| Çalışırken |
|
Key:
min: | |
| Asus TUF Gaming A17 FA707XI-NS94 R9 7940HS, GeForce RTX 4070 Laptop GPU, WD PC SN560 SDDPNQE-1T00, IPS, 1920x1080, 17.3" | Asus TUF Gaming F17 FX707Z-HX011W i7-12700H, GeForce RTX 3060 Laptop GPU, SK Hynix HFM001TD3JX013N, IPS, 1920x1080, 17.3" | MSI Pulse 17 B13VGK i7-13700H, GeForce RTX 4070 Laptop GPU, Micron 2400 MTFDKBA1T0QFM, IPS, 1920x1080, 17.3" | MSI Katana 17 B13VFK i7-13620H, GeForce RTX 4060 Laptop GPU, Micron 2400 MTFDKBA1T0QFM, IPS LED, 1920x1080, 17.3" | Razer Blade 17 (i7-12800H, RTX 3070 Ti) i7-12800H, GeForce RTX 3070 Ti Laptop GPU, Samsung PM9A1 MZVL21T0HCLR, IPS, 2560x1440, 17.3" | HP Pavilion Gaming 17-cd2146ng i5-11300H, GeForce RTX 3050 Ti Laptop GPU, SK Hynix BC711 512GB HFM512GD3GX013N, IPS, 1920x1080, 17.3" | |
|---|---|---|---|---|---|---|
| Power Consumption | 4% | 13% | -8% | -40% | 21% | |
| Idle Minimum * (Watt) | 6.2 | 6.6 -6% | 9 -45% | 12.2 -97% | 14.4 -132% | 3 52% |
| Idle Average * (Watt) | 21.8 | 8.3 62% | 10.2 53% | 14.9 32% | 20 8% | 8 63% |
| Idle Maximum * (Watt) | 22 | 11.8 46% | 10.8 51% | 15.8 28% | 21.5 2% | 28 -27% |
| Load Average * (Watt) | 59.2 | 119 -101% | 72 -22% | 85.22 -44% | 119 -101% | 88 -49% |
| Witcher 3 ultra * (Watt) | 189.7 | 169 11% | 130 31% | 151.1 20% | 218 -15% | 98.2 48% |
| Load Maximum * (Watt) | 247.8 | 222 10% | 221 11% | 212.8 14% | 248 -0% | 152 39% |
* ... daha küçük daha iyidir
Power Consumption Witcher 3 / Stresstest
Power Consumption external Monitor
Pil Ömrü
Çalışma süreleri, daha hızlı CPU ve GPU'muza rağmen TUF Gaming F17 ile temelde aynıdır. Özellikle WLAN'da gezinme, 17,3 inçlik büyük bir oyun dizüstü bilgisayarı için çok etkileyici olacak şekilde 9 saatin biraz üzerinde sürebilir. Elbette kullanıcıların bu kadar uzun çalışma sürelerine ulaşmak için iGPU modunda çalışmayı unutmamaları gerekiyor.
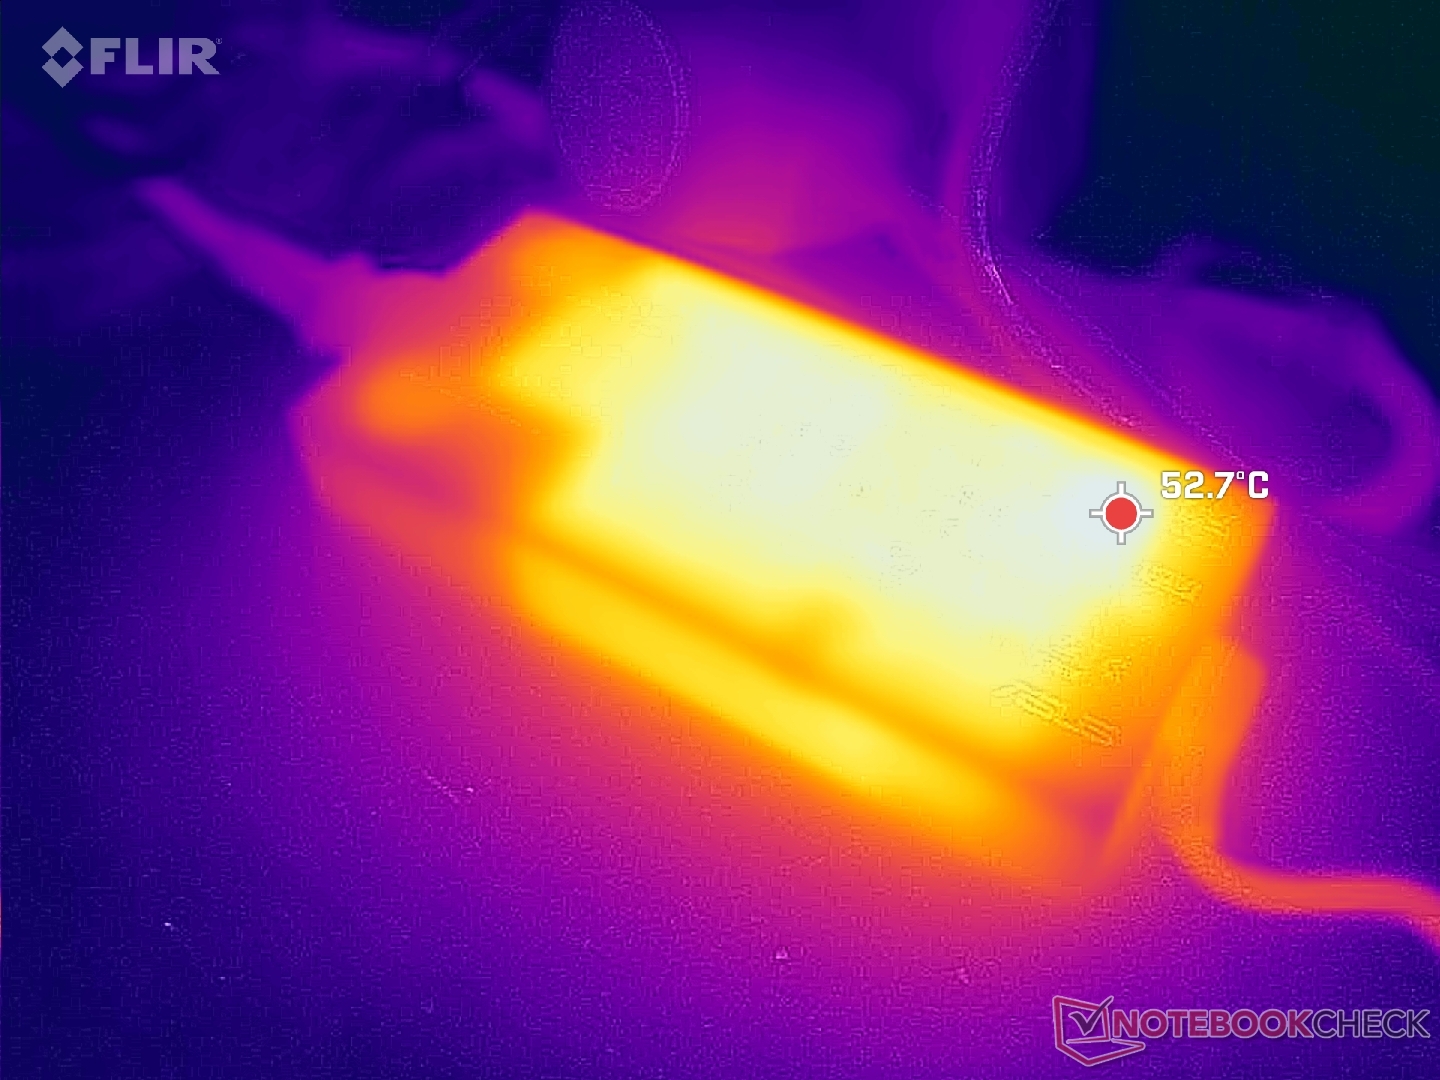
Ürünle birlikte verilen özel AC adaptörle boş kapasiteden tam kapasiteye şarj etmek 90 dakikadan biraz daha kısa sürüyor. Üçüncü taraf USB-C adaptörleriyle şarj etmek daha yavaş ancak yine de destekleniyor.
| Asus TUF Gaming A17 FA707XI-NS94 R9 7940HS, GeForce RTX 4070 Laptop GPU, 90 Wh | Asus TUF Gaming F17 FX707Z-HX011W i7-12700H, GeForce RTX 3060 Laptop GPU, 90 Wh | MSI Pulse 17 B13VGK i7-13700H, GeForce RTX 4070 Laptop GPU, 90 Wh | MSI Katana 17 B13VFK i7-13620H, GeForce RTX 4060 Laptop GPU, 53.5 Wh | Razer Blade 17 (i7-12800H, RTX 3070 Ti) i7-12800H, GeForce RTX 3070 Ti Laptop GPU, 82 Wh | HP Pavilion Gaming 17-cd2146ng i5-11300H, GeForce RTX 3050 Ti Laptop GPU, 52.5 Wh | |
|---|---|---|---|---|---|---|
| Pil Çalışma Süresi | 16% | 14% | -55% | -15% | -45% | |
| Reader / Idle (h) | 19.7 | |||||
| WiFi v1.3 (h) | 9.1 | 8.7 -4% | 9 -1% | 2.9 -68% | 5.9 -35% | 5 -45% |
| Load (h) | 1.7 | 2.3 35% | 2.2 29% | 1 -41% | 1.8 6% | |
| H.264 (h) | 7.7 | 4.9 |
Artılar
Eksiler
Karar - Zayıf Bir Ekranla Harika Performans
TUF Gaming A17 FA707, GeForce RTX 4070 ile en ucuz 17,3 inç oyun dizüstü bilgisayarlarından biridir. Sistemin Zen 4 Ryzen 9 CPU ile gelmesi özellikle etkileyici, yani düşük fiyat için işlemci performansından ödün vermek zorunda değilsiniz. Güçlü CPU ve GPU kombinasyonu, dolar başına performansı en üst düzeye çıkarmak isteyen oyuncular için bu modeli tavsiye etmeyi kolaylaştırıyor.
Kesilen köşeler bunun yerine işlemcileri çevreleyen dizüstü bilgisayarın geri kalanı etrafında dönüyor. Daha spesifik olarak, ekranın dar renk gamı ve ortalama tepki süreleri, aşağıdakiler gibi üst düzey oyun dizüstü bilgisayarlarındaki ekranlarla karşılaştırıldığında soluk kalıyor ROG serisi. Neyse ki Asus, TUF Gaming A17 için inceleme yapılandırmamızdan çok daha iyi renklere ve özelliklere sahip birden fazla ekran seçeneği sunuyor. Mümkünse, inceleme yapılandırmamızdaki Ryzen 9 CPU ve zayıf 1080p paneli, Ryzen 7 CPU ve 1440p panelli bir ünite ile değiştirmenizi öneririz. CPU biraz daha yavaş olabilir, ancak görüntü kalitesindeki iyileştirmeler çok daha belirgin olacak ve bu değiş tokuşa değecektir.
Asus TUF Gaming A17, doğru konfigürasyonu bulabildiğiniz sürece fiyat, performans ve form faktörünü çok iyi dengeliyor. 1080p panele sahip SKU'lar, 1440p seçeneklerine göre belirgin şekilde daha kötü renklere sahiptir.
Diğer dezavantajlar arasında Wi-Fi 6E yerine Wi-Fi 6 bağlantısı, düşük çözünürlüklü 720p web kamerası ve tuş başına RGB aydınlatma olmaması yer alıyor. Ancak bu dezavantajlar oyun deneyimini doğrudan etkilemiyor. Sistem, ince profil, uzun pil ömrü ve yükseltmeler için erişilebilir dahili parçalar gibi tartışmasız daha cazip olan çoğu temel özelliği koruyor.
Fiyat ve Bulunabilirlik
Asus TUF Gaming A17 FA707XI-NS94
- 01/06/2024 v7 (old)
Allen Ngo
Şeffaflık
İncelenecek cihazların seçimi editör ekibimiz tarafından yapılır. Test örneği yazar tarafından masrafları kendisine ait olmak üzere serbestçe satın alınmıştır. Borç verenin bu inceleme üzerinde herhangi bir etkisi olmadığı gibi, üretici de yayınlanmadan önce bu incelemenin bir kopyasını almamıştır. Bu incelemeyi yayınlama zorunluluğu yoktu. Bağımsız bir medya şirketi olarak Notebookcheck, üreticilerin, perakendecilerin veya yayıncıların otoritesine tabi değildir.
Notebookcheck bu şekilde test yapıyor
Notebookcheck, tüm sonuçların karşılaştırılabilir olmasını sağlamak için her yıl yüzlerce dizüstü bilgisayarı ve akıllı telefonu standart prosedürler kullanarak bağımsız olarak inceliyor. Yaklaşık 20 yıldır test yöntemlerimizi sürekli olarak geliştirdik ve bu süreçte endüstri standartlarını belirledik. Test laboratuvarlarımızda deneyimli teknisyenler ve editörler tarafından yüksek kaliteli ölçüm ekipmanları kullanılmaktadır. Bu testler çok aşamalı bir doğrulama sürecini içerir. Karmaşık derecelendirme sistemimiz, nesnelliği koruyan yüzlerce sağlam temellere dayanan ölçüm ve kıyaslamaya dayanmaktadır.Price comparison

