Karar - Ofis için asgari düzeyde
Giriş seviyesi bir ofis dizüstü bilgisayarı olarak MSI Venture 16, kolay servis edilebilirlik, entegre bir numpad ve gri, rahatsız edici olmayan bir tasarım dahil olmak üzere kategori için beklenen temel özelliklerin çoğunu kapsar. Nispeten kalın yapısı Core-H CPU'nun normalden daha serin çalışmasını sağlarken, diğer birçok ekonomik iş dizüstü bilgisayarı bunun yerine daha yavaş Core-U veya Core-V seçeneklerine sahip olabilir. Gibi alternatifler Dell 16 Plus veya Lenovo ThinkPad E16 G3 her biri MSI'dan daha hafif ve daha fazla ekran seçeneğine sahip, ancak aynı zamanda daha yavaş CPU'larla birlikte gönderiliyorlar.
Öte yandan, Venture 16'nın bazı yönleri ofis perspektifinden bakıldığında bile hayal kırıklığı yaratabilir. Nispeten ağır ağırlığı, korkunç 720p web kamerası, eski fıçı AC adaptörlerine bağımlılığı ve birden fazla USB-C bağlantı noktasının olmaması, mobil üretkenliklerini artırmak isteyen gezginleri caydırabilir. Ayrıca, temel IPS ekrandaki renkler çoğu grafik düzenleme için uygun değildir ve bu nedenle yaklaşık 200 $ daha fazla ödeyerek çok daha üstün OLED paneli düşünmenizi öneririz.
Artılar
Eksiler
Fiyat ve Bulunabilirlik
Core Ultra 7 255H, 1200p IPS dokunmatik ekran, 32 GB RAM ve 512 GB SSD'ye sahip MSI 16 AI Amazon'da $1030'a bulunabilir. Benzer bir yapılandırma ancak OLED ile Best Buy'da 1200 $ karşılığında bulunabilir.
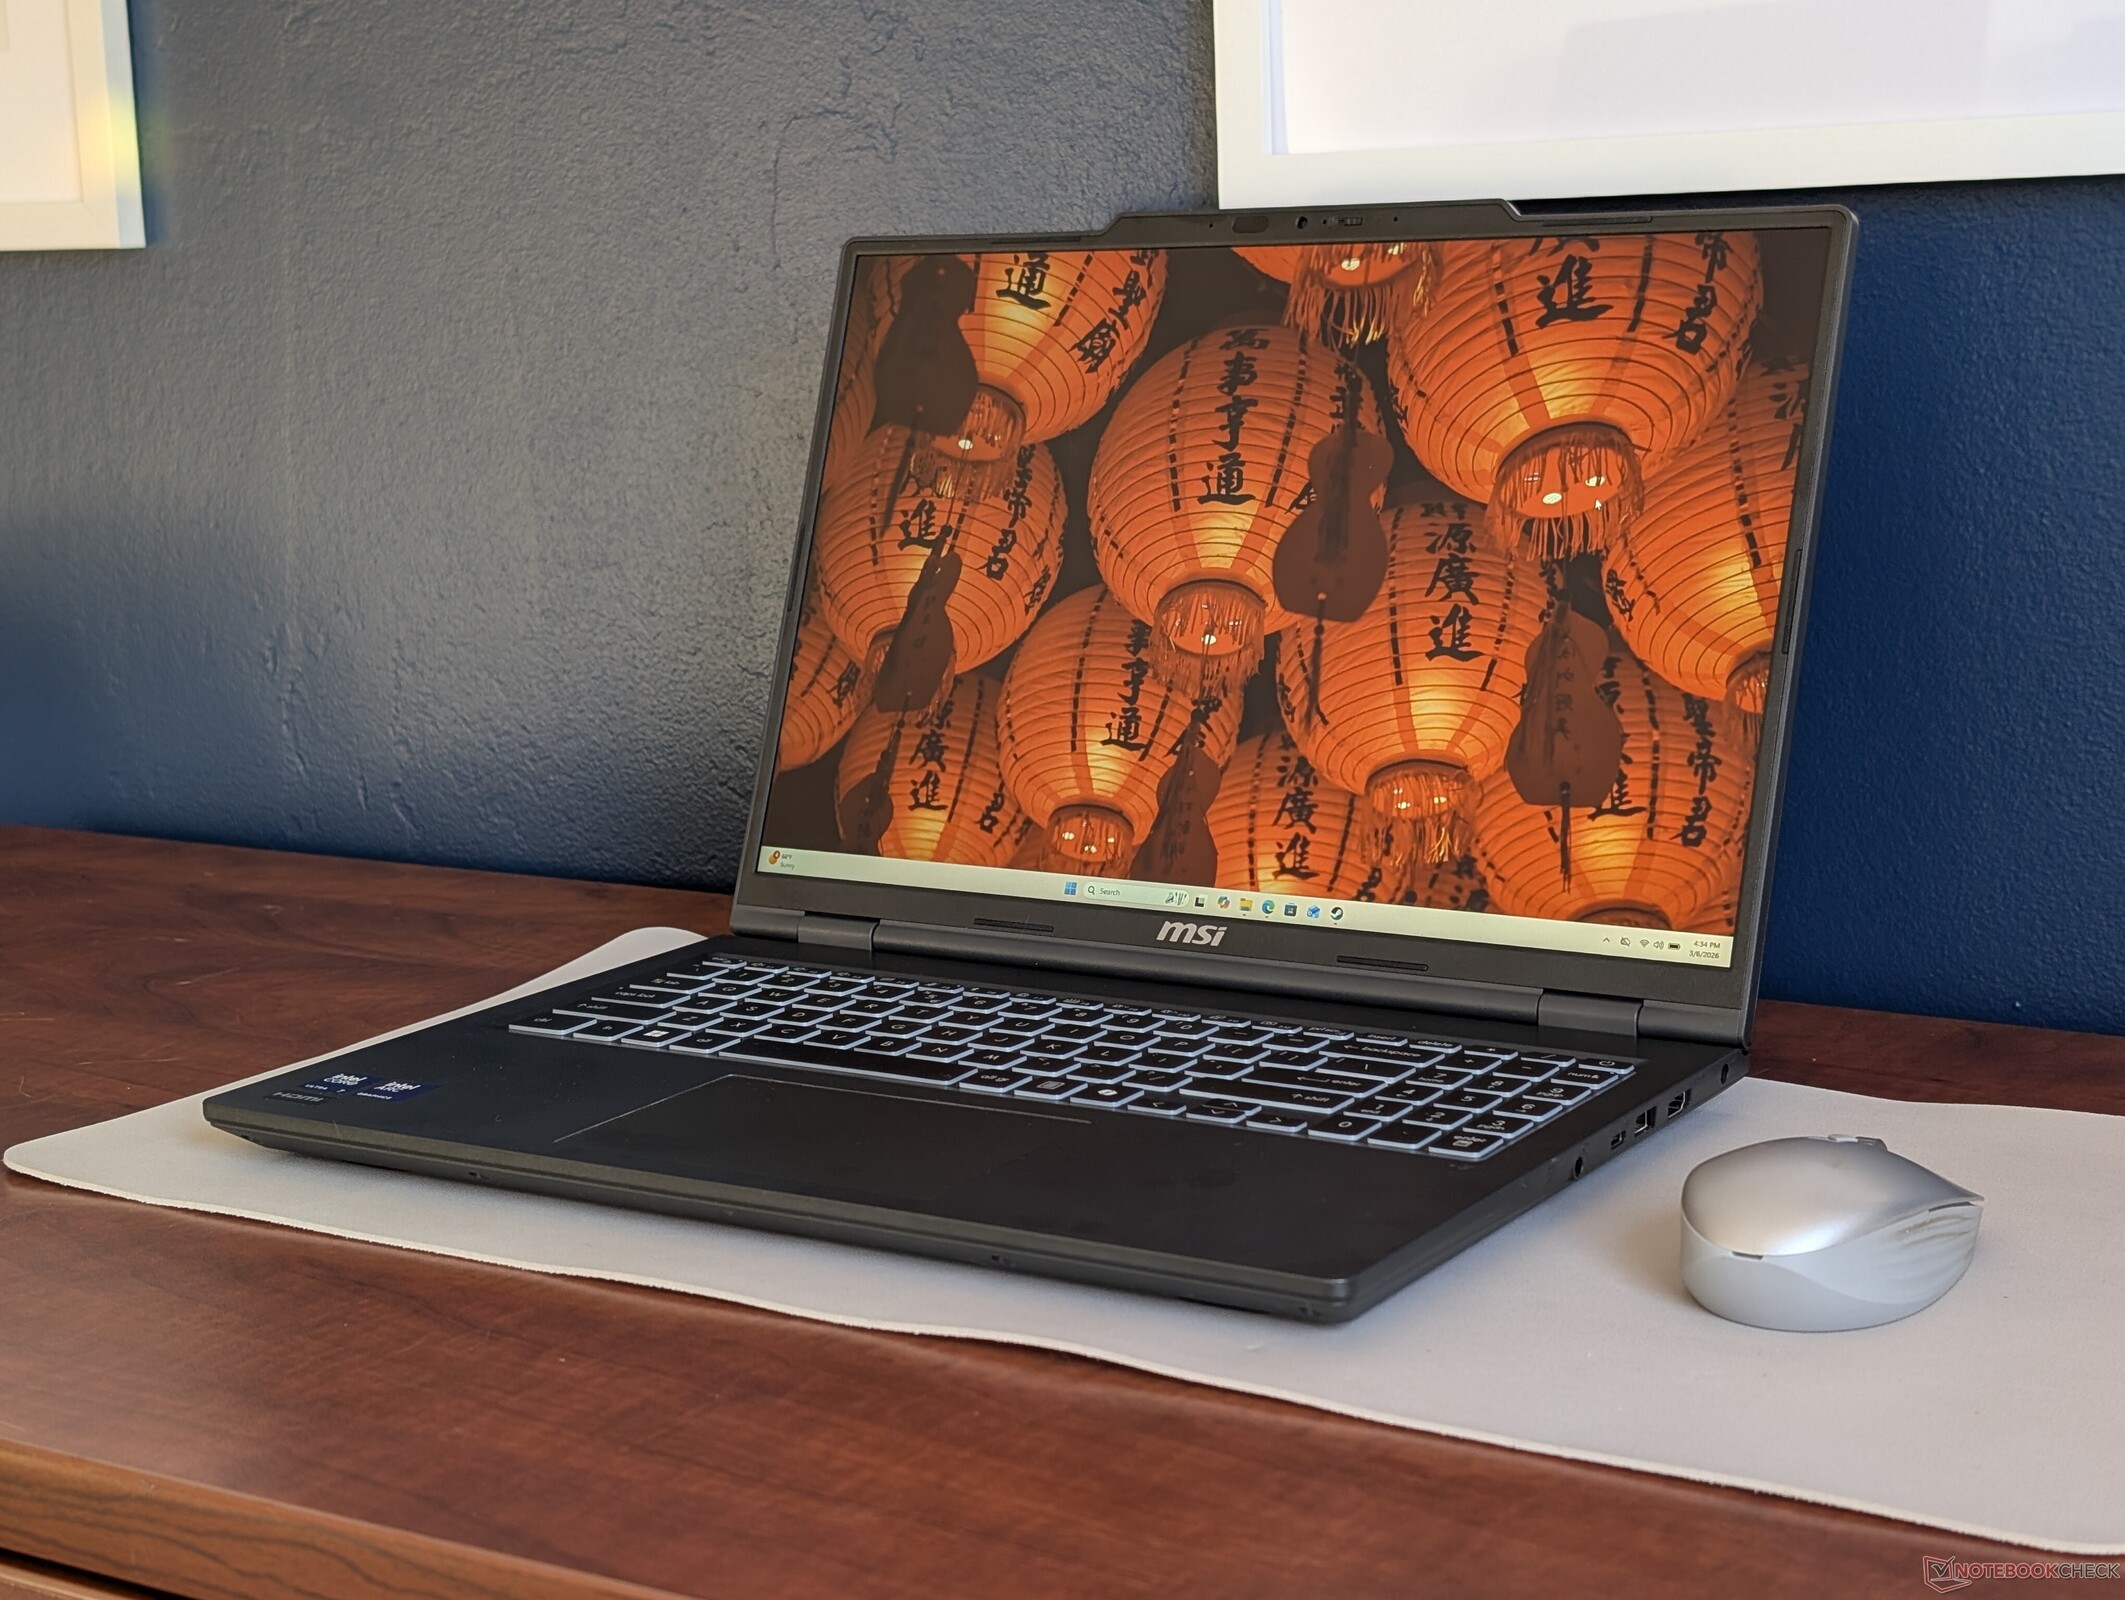
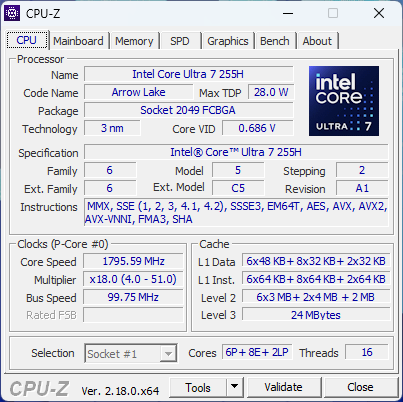
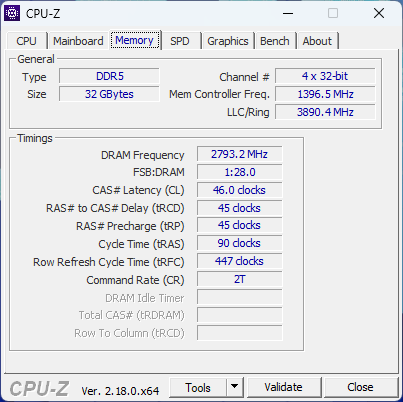
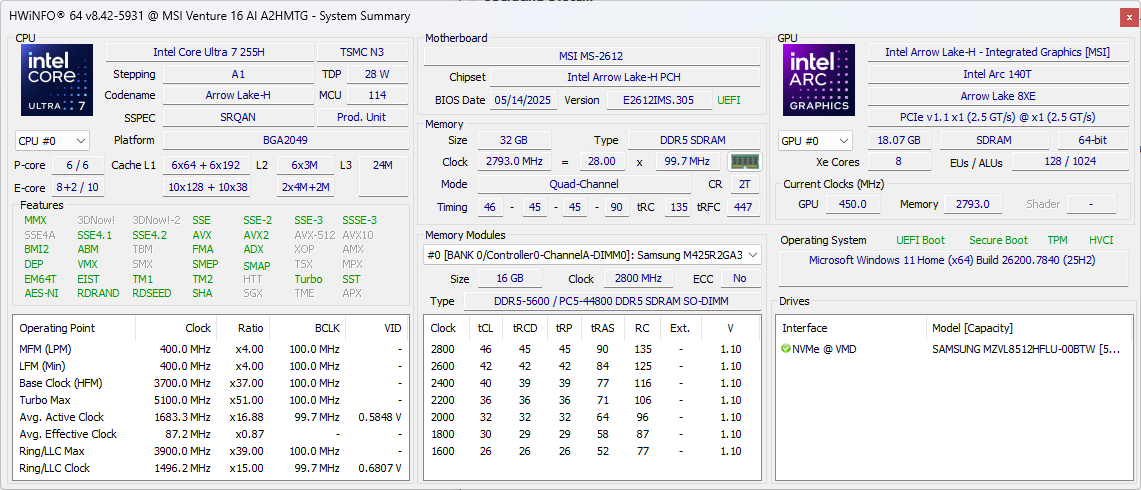
Venture 16, MSI'ın üst düzey Prestige serisini tamamlamak üzere tasarlanmış giriş seviyesi ofis dizüstü bilgisayarıdır. Test ünitemiz Arrow Lake-H Core Ultra 7 255H CPU ve 1200p IPS dokunmatik ekran ile donatılmış olarak yaklaşık 900 USD perakende satış fiyatıyla gelirken, üst düzey yapılandırmalar bunun yerine Core Ultra 9 285H ve 1280p OLED ekran ile gönderilebilir.
Venture 16'nın alternatifleri arasında Dell Inspiron serisi, HP ProBook veya Pavilion serisi veya Lenovo ThinkPad E serisi gibi diğer bütçe dostu ofis dizüstü bilgisayarları yer alıyor.
Daha fazla MSI incelemesi:
Teknik Özellikler
Dava
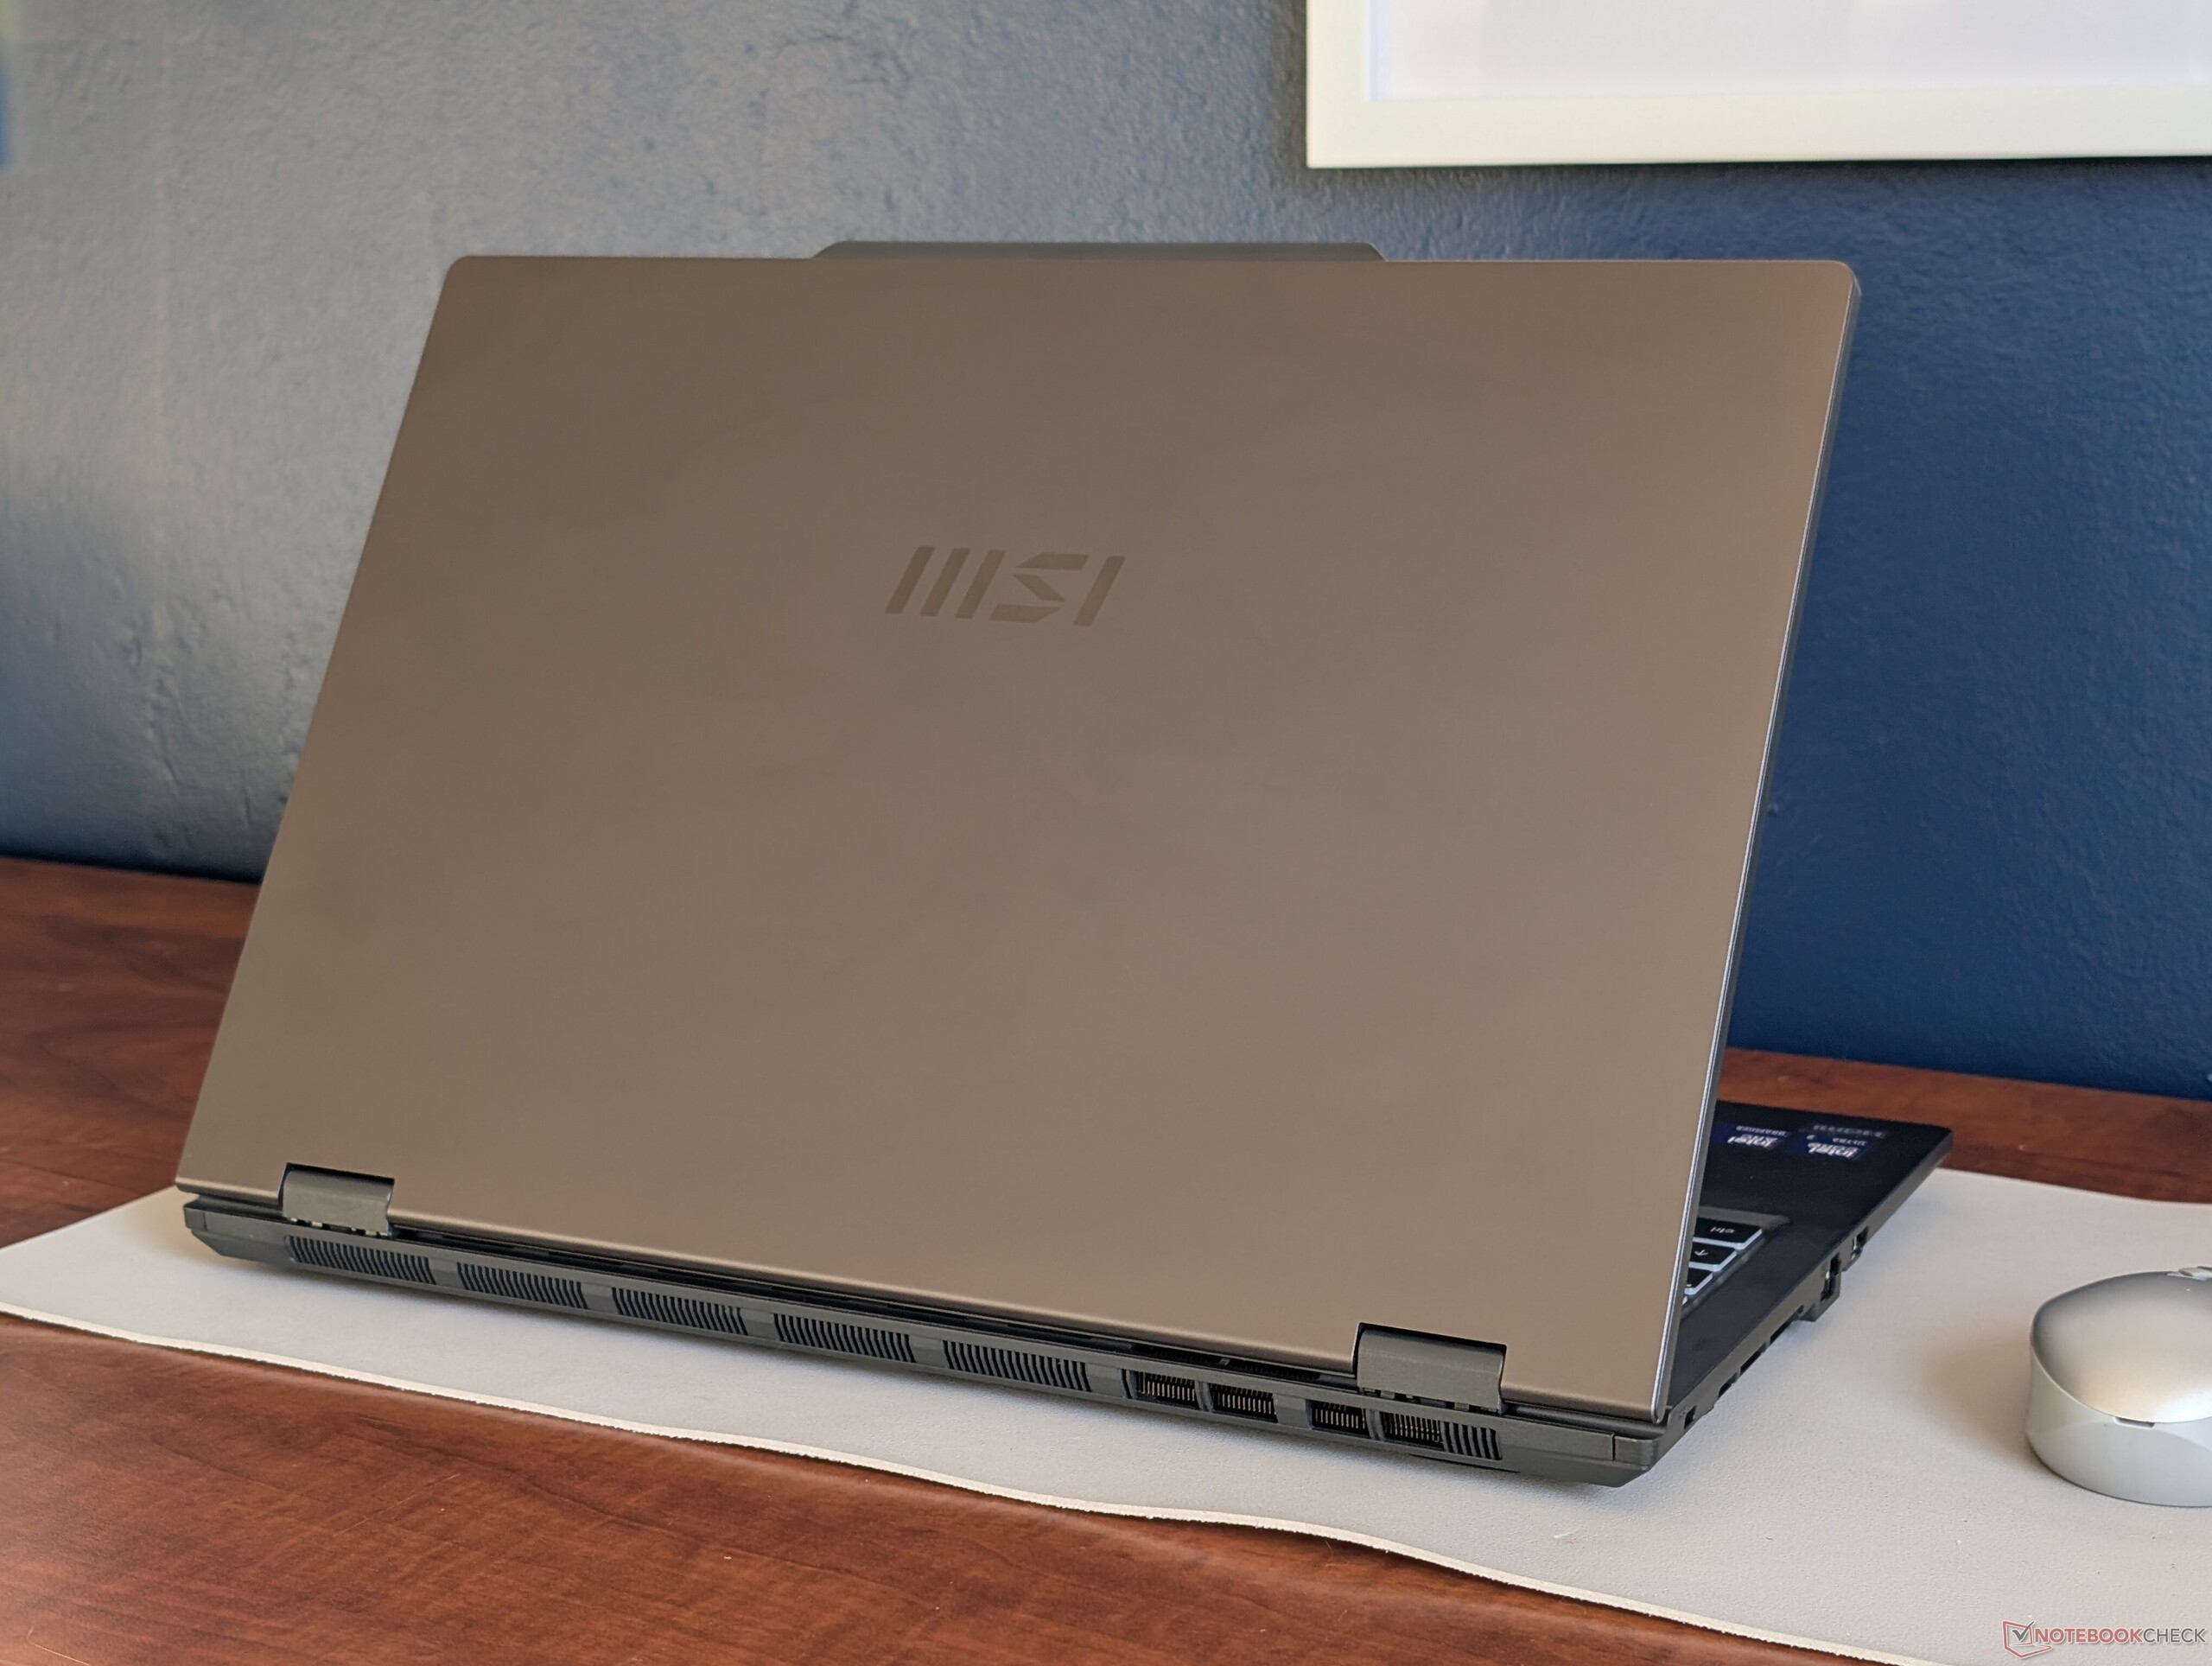
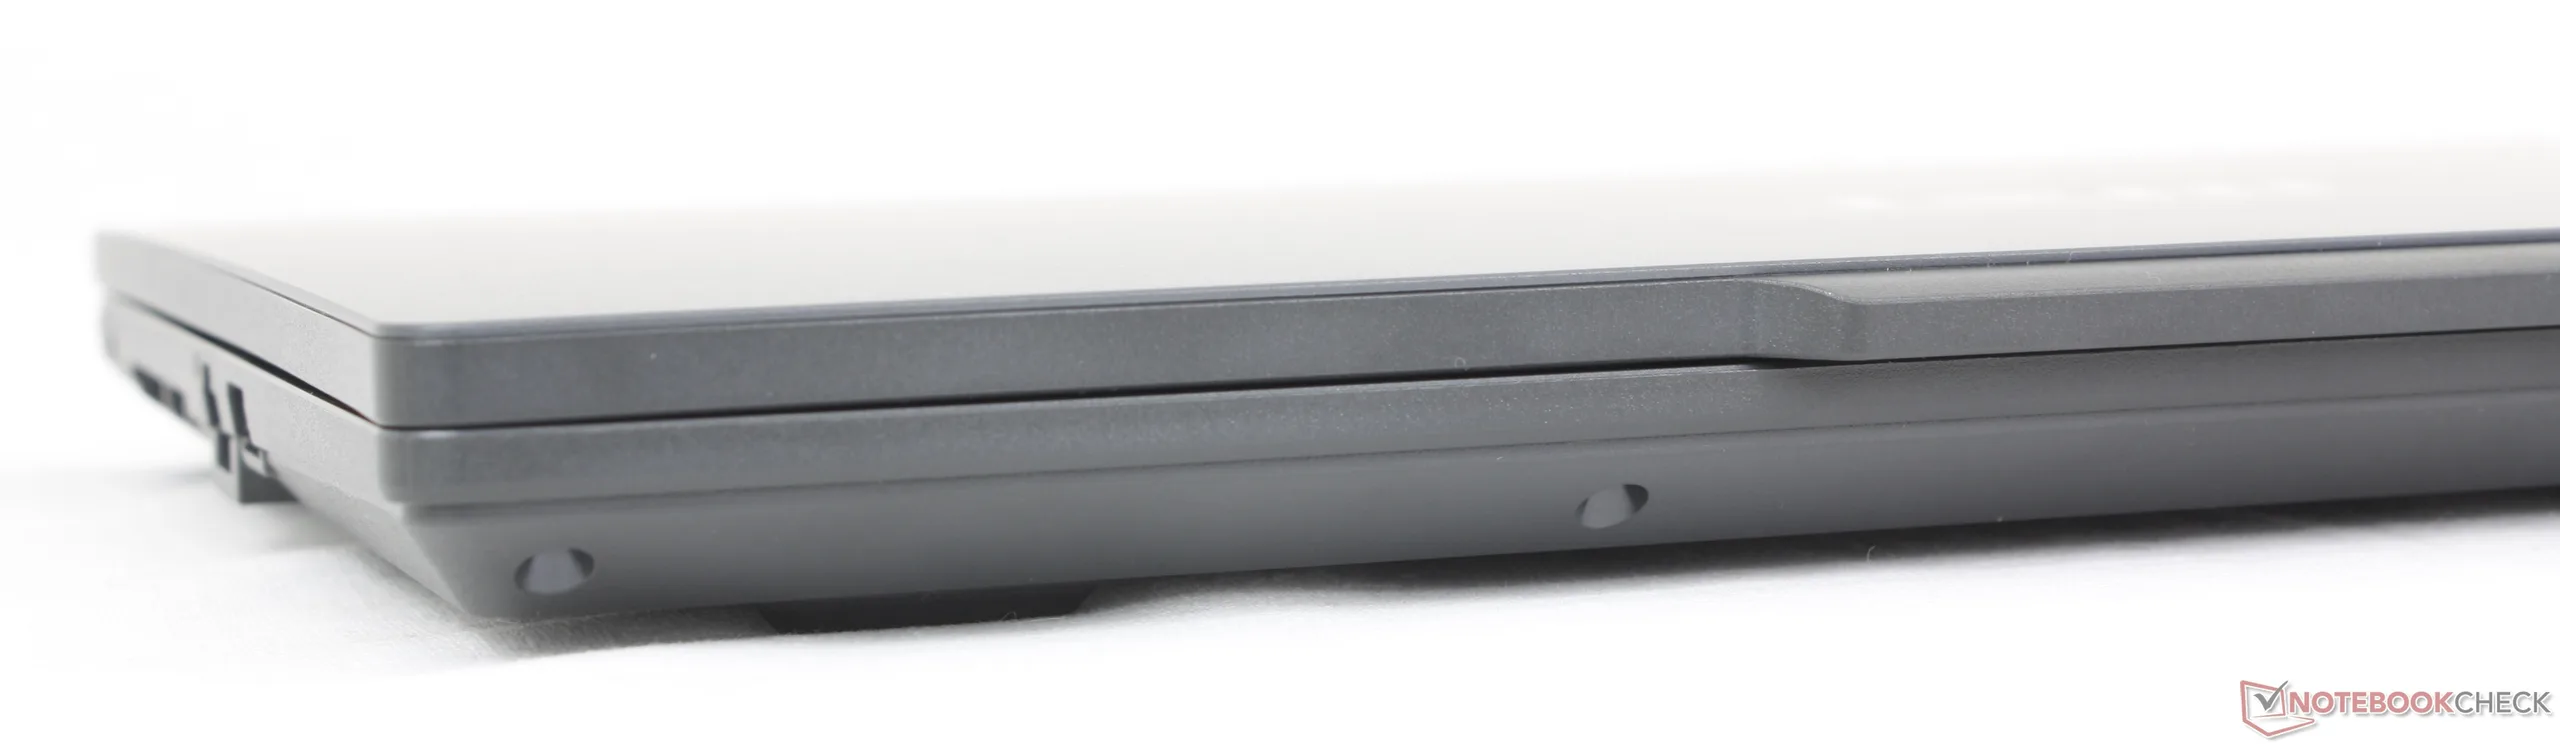
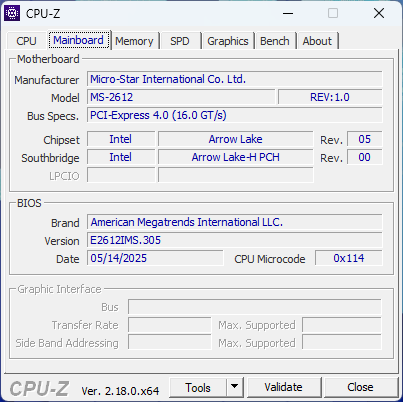
Ağırlıklı olarak pürüzsüz mat plastikten oluşan kasa, maliyeti düşük tutmak için yeterli sertliğe sahip. İlginç bir şekilde, sistem diğer birçok 16 inçlik dizüstü bilgisayardan daha ağır ve kalındır, ancak daha dar çerçeveleri nedeniyle daha küçük bir ayak izine sahiptir.
Bağlanabilirlik
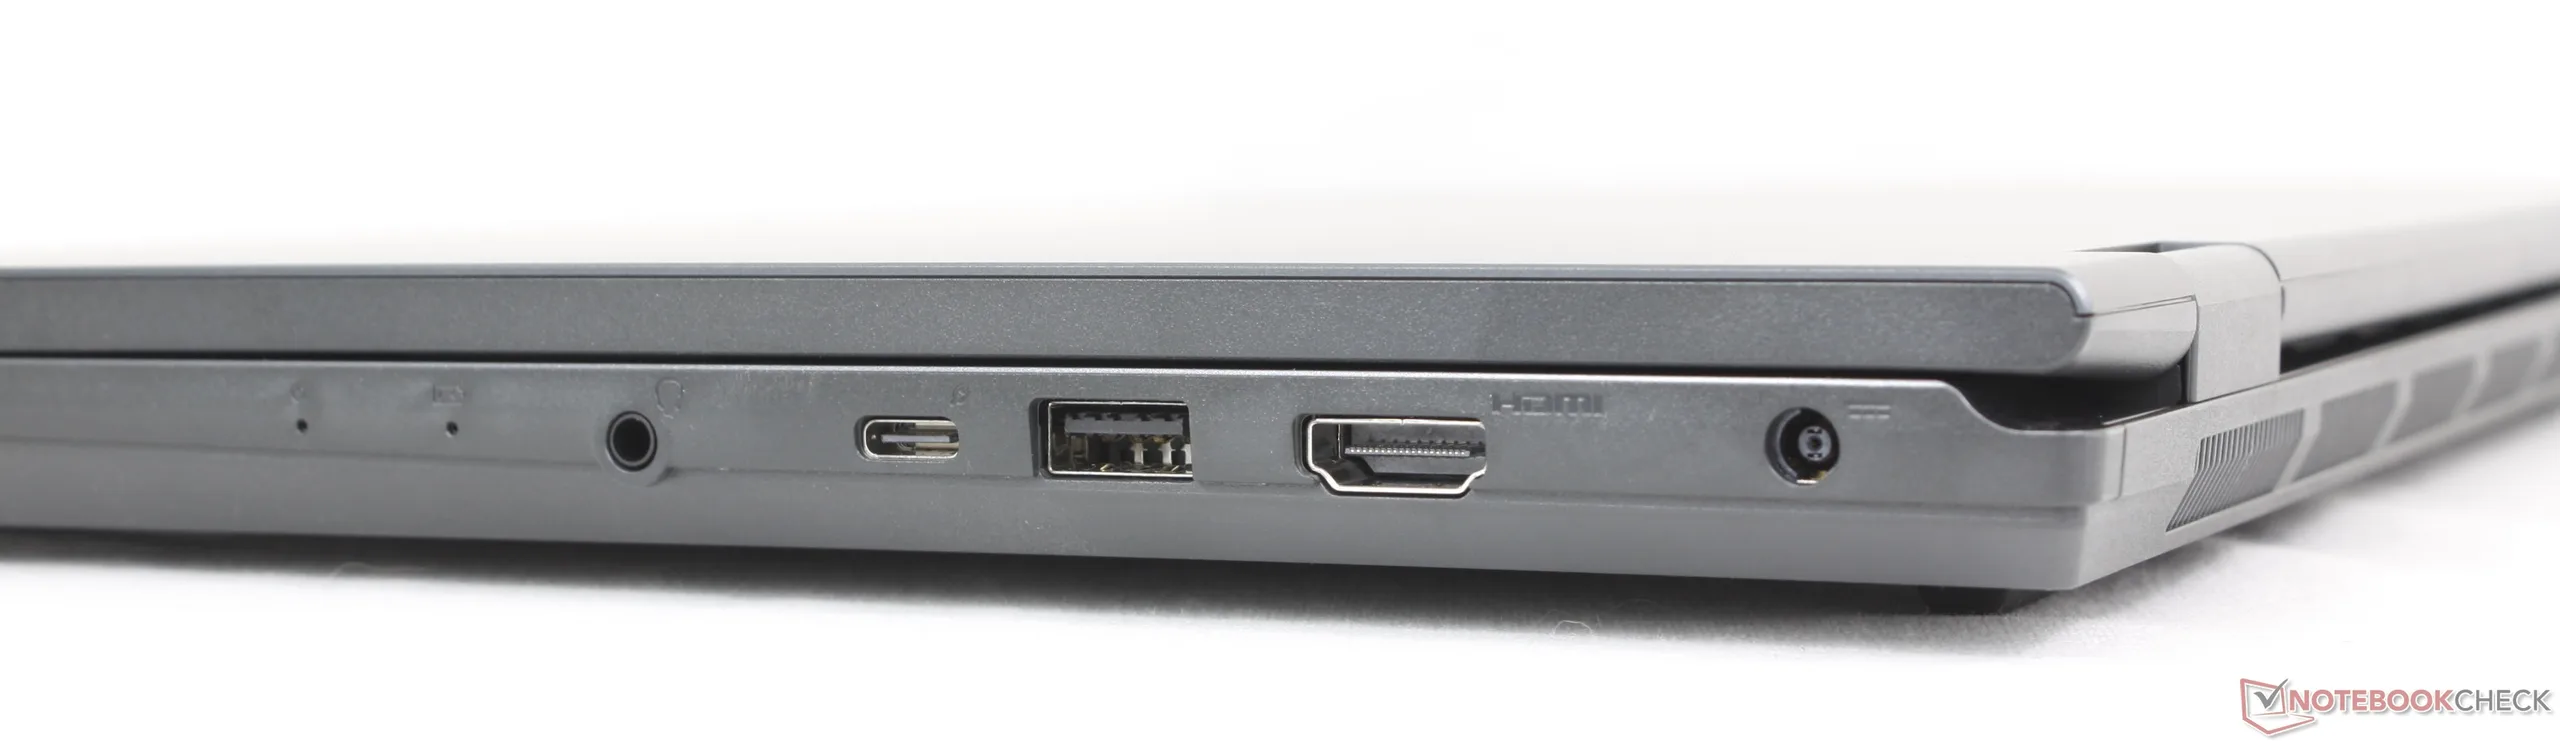
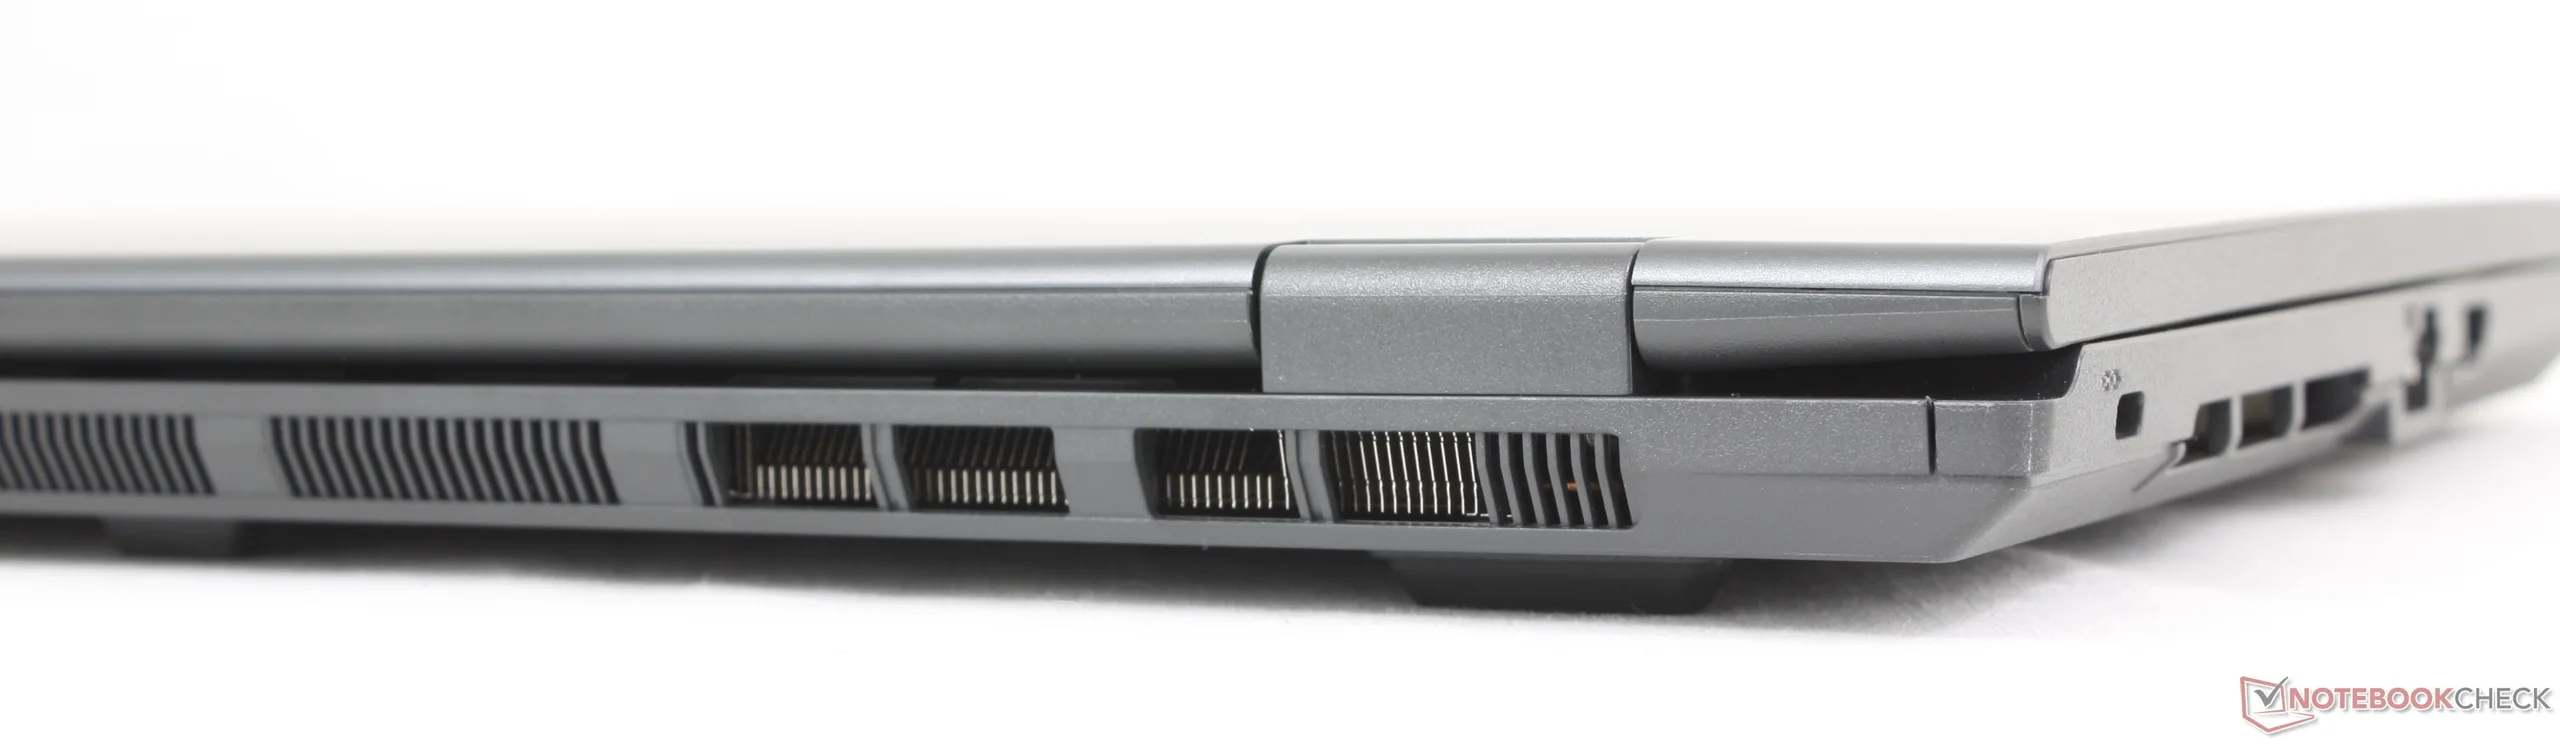
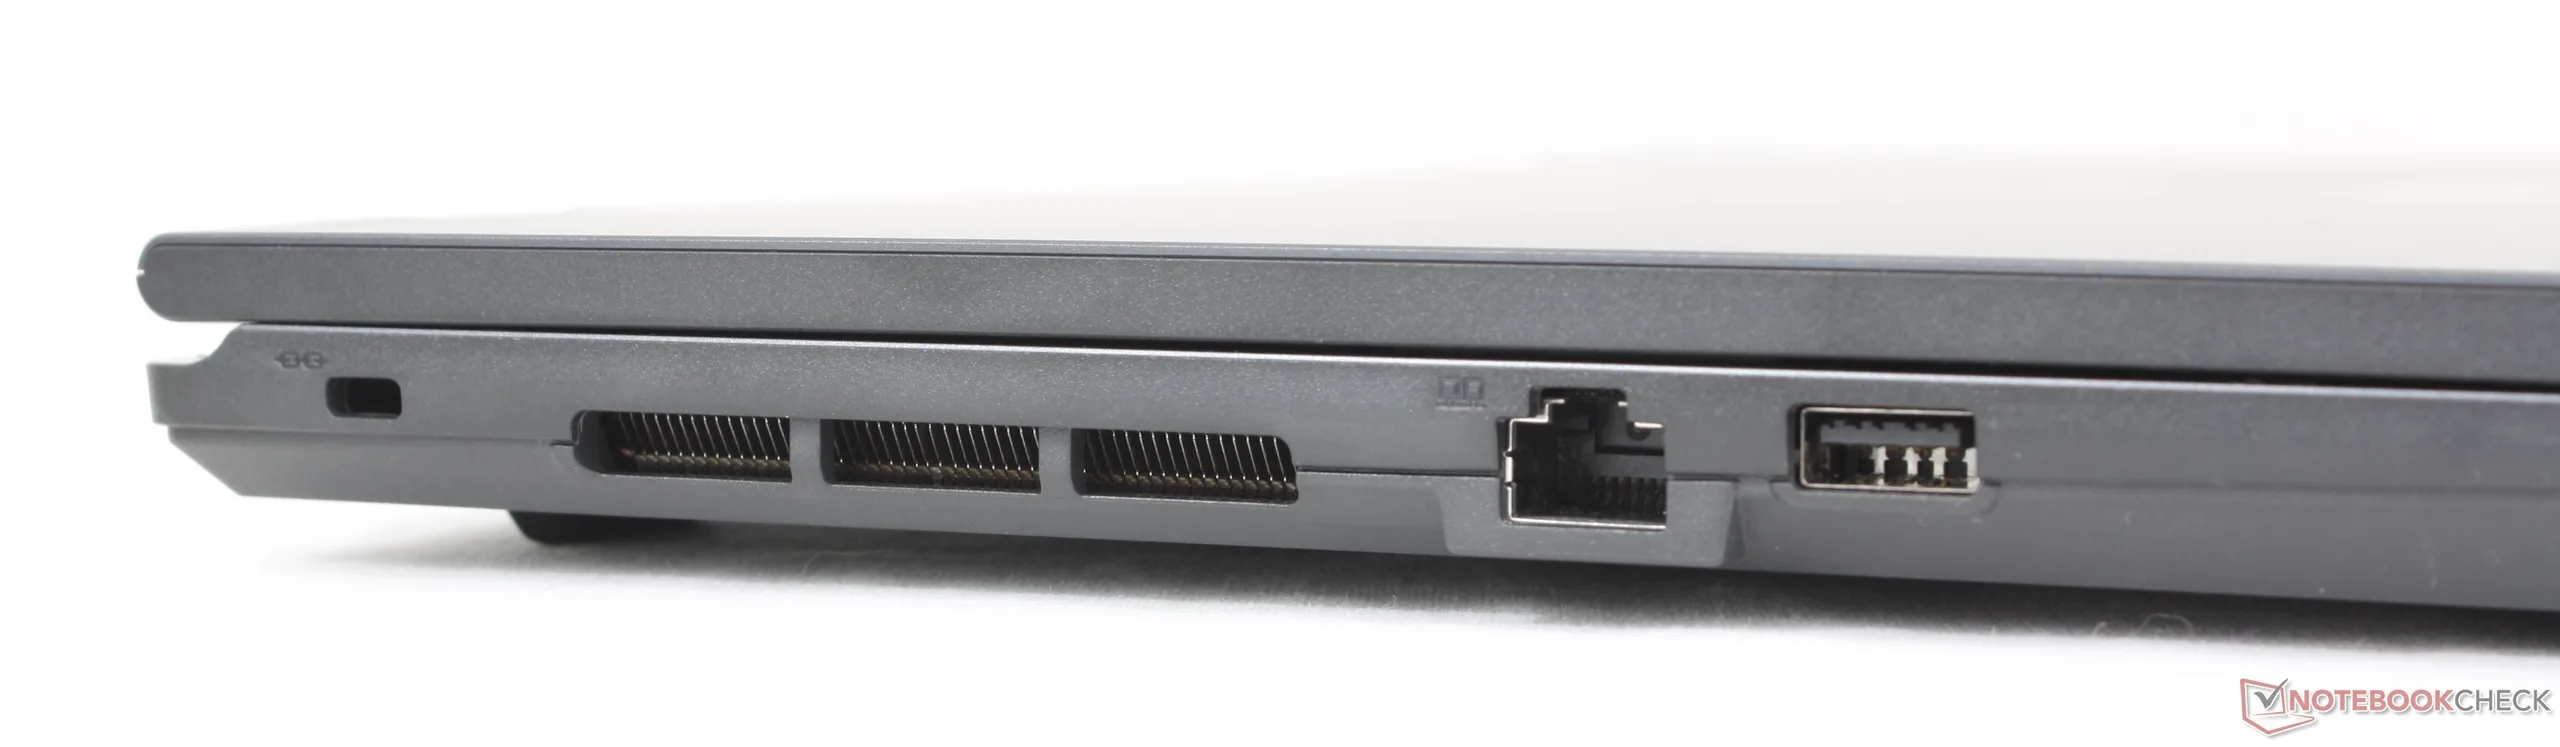
Port seçenekleri, 16 inçlik büyük form faktörü göz önüne alındığında daha iyi olabilirdi. Örneğin, diğer birçok dizüstü bilgisayarda bulunan iki adet USB-C bağlantı noktasına kıyasla yalnızca bir adet USB-C bağlantı noktası bulunmaktadır Dell 16 Plus.
İletişim
| Networking | |
| iperf3 transmit AXE11000 | |
| Lenovo IdeaPad Slim 5 16AKP10 | |
| Dell 16 Plus 2-in-1 | |
| MSI Prestige 16 B1MG-001US | |
| HP Pavilion 16-ag0057ng | |
| Asus V16 V3607V | |
| MSI Venture 16 AI A2HMTG | |
| iperf3 receive AXE11000 | |
| Lenovo IdeaPad Slim 5 16AKP10 | |
| MSI Prestige 16 B1MG-001US | |
| Dell 16 Plus 2-in-1 | |
| HP Pavilion 16-ag0057ng | |
| Asus V16 V3607V | |
| MSI Venture 16 AI A2HMTG | |
| iperf3 transmit AXE11000 6GHz | |
| Dell 16 Plus 2-in-1 | |
| MSI Prestige 16 B1MG-001US | |
| MSI Venture 16 AI A2HMTG | |
| iperf3 receive AXE11000 6GHz | |
| Dell 16 Plus 2-in-1 | |
| MSI Venture 16 AI A2HMTG | |
| MSI Prestige 16 B1MG-001US | |
Web kamerası


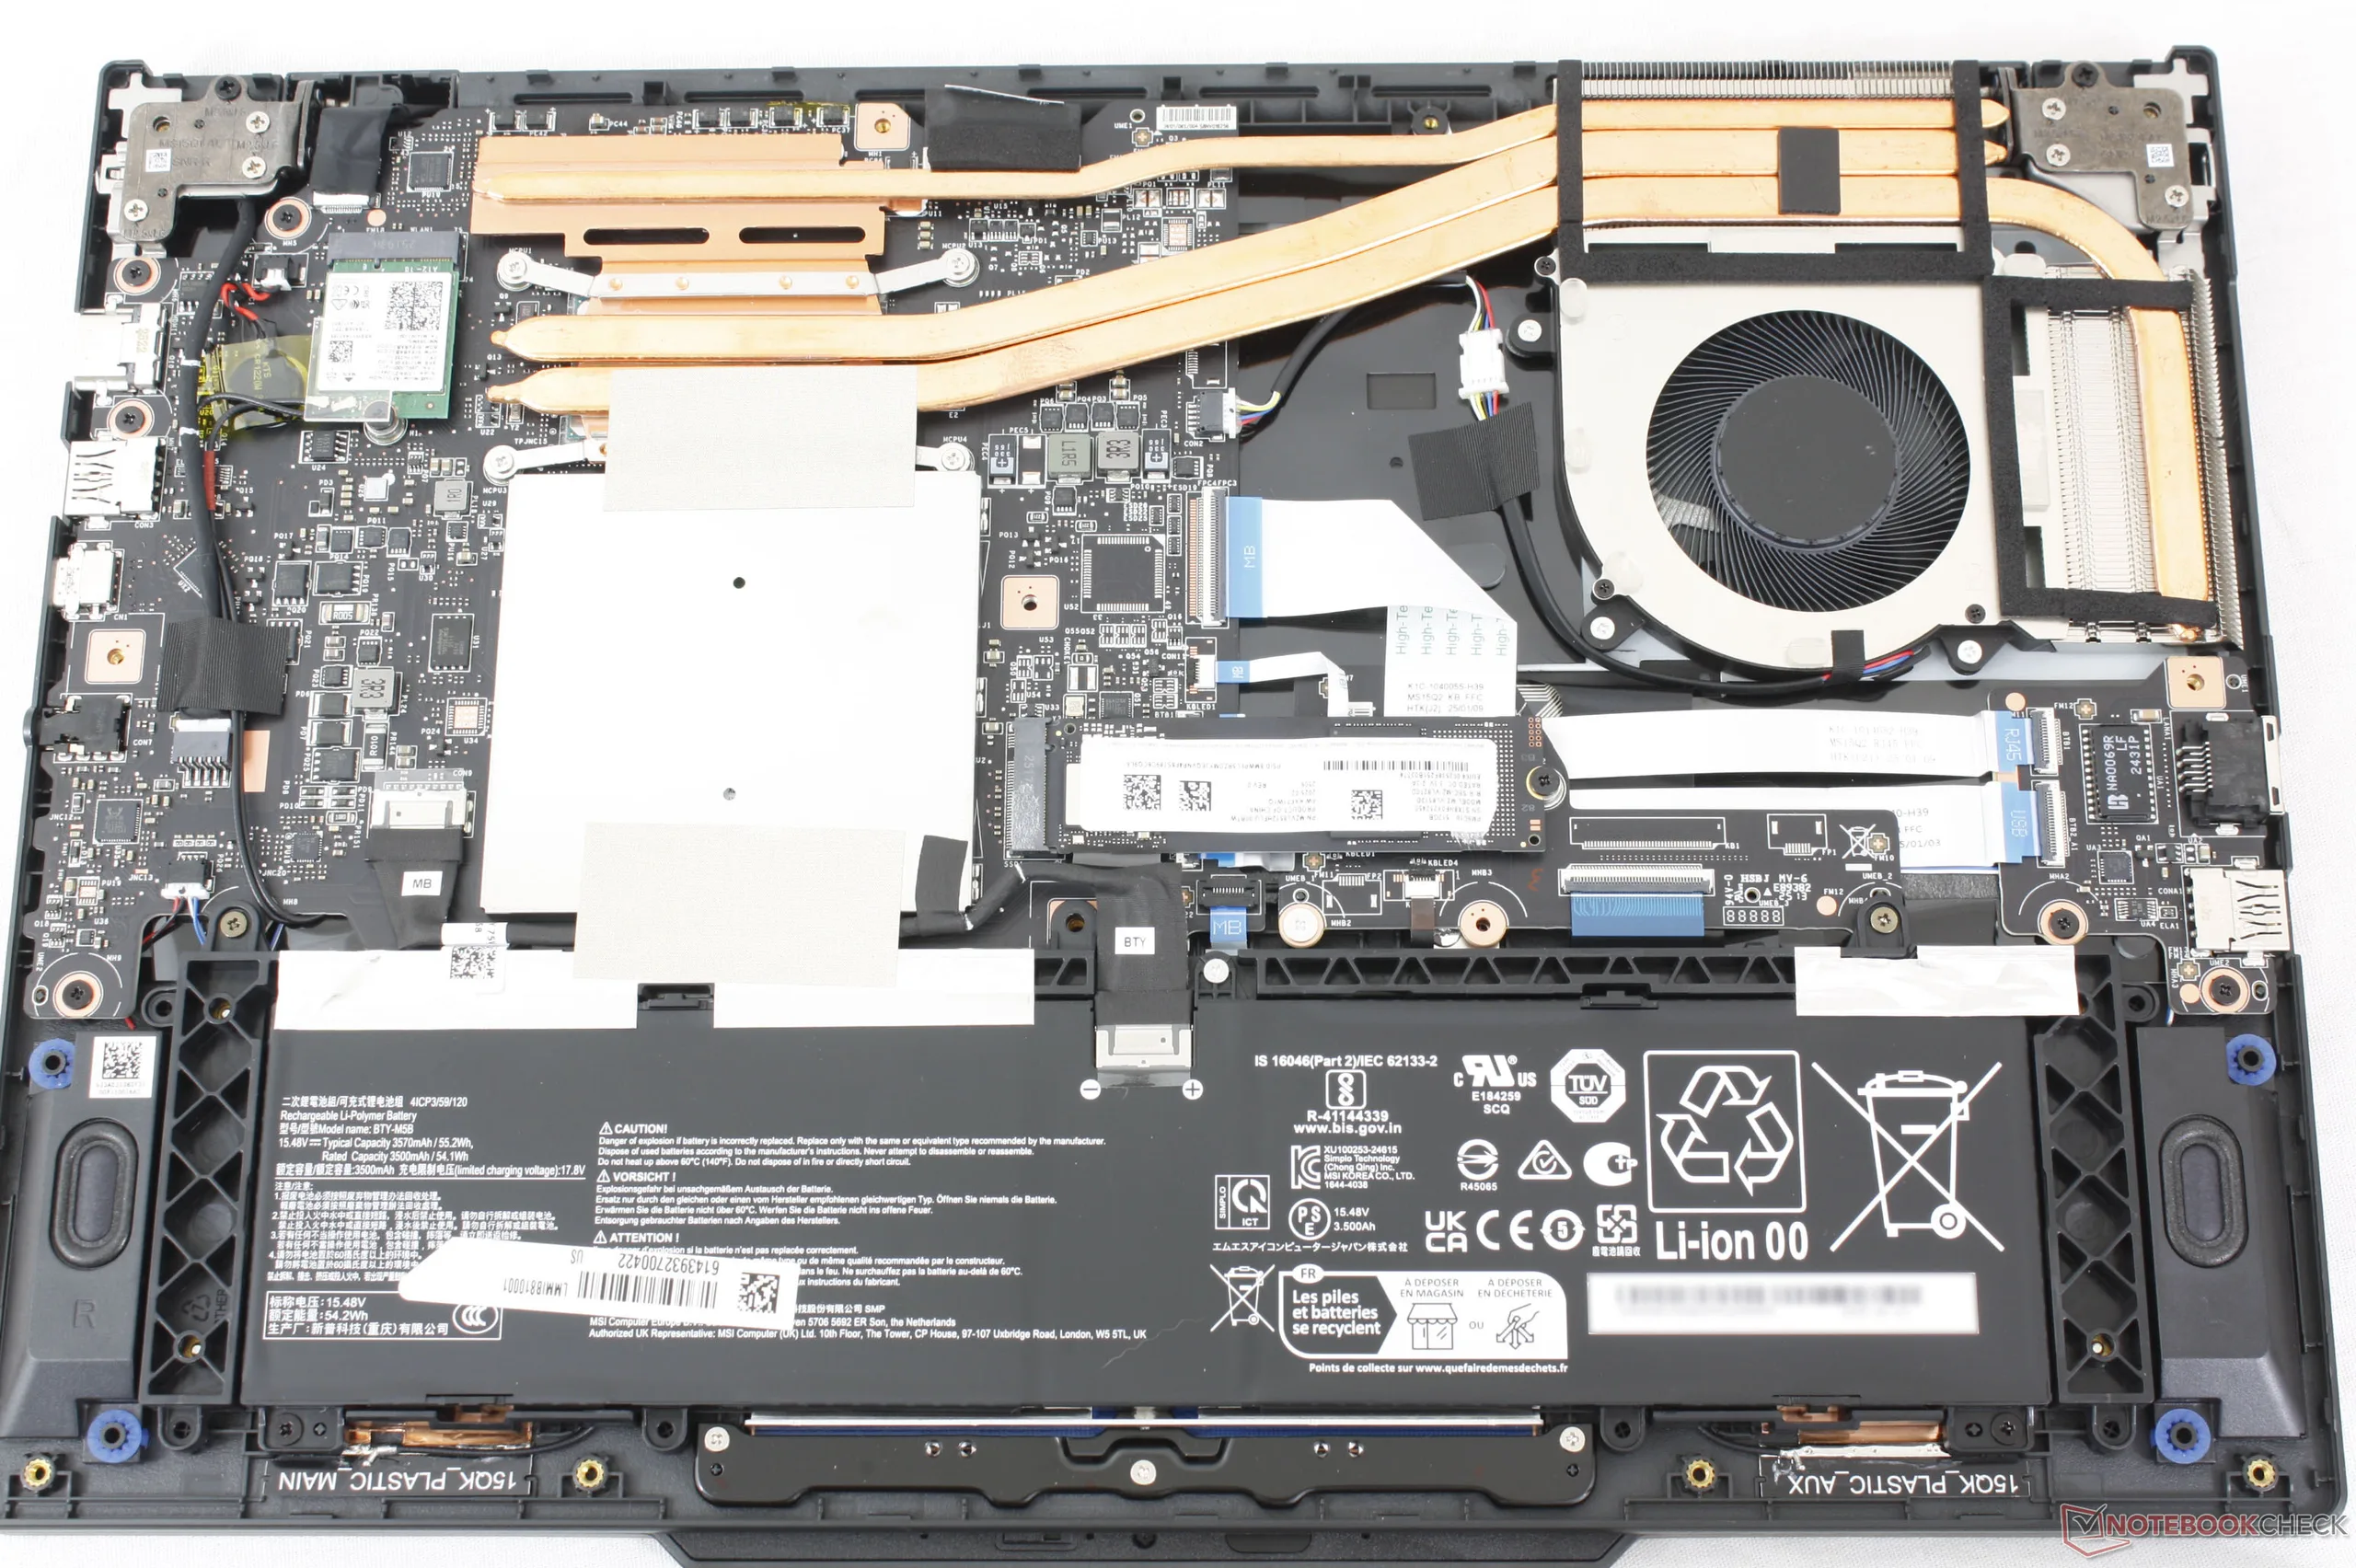
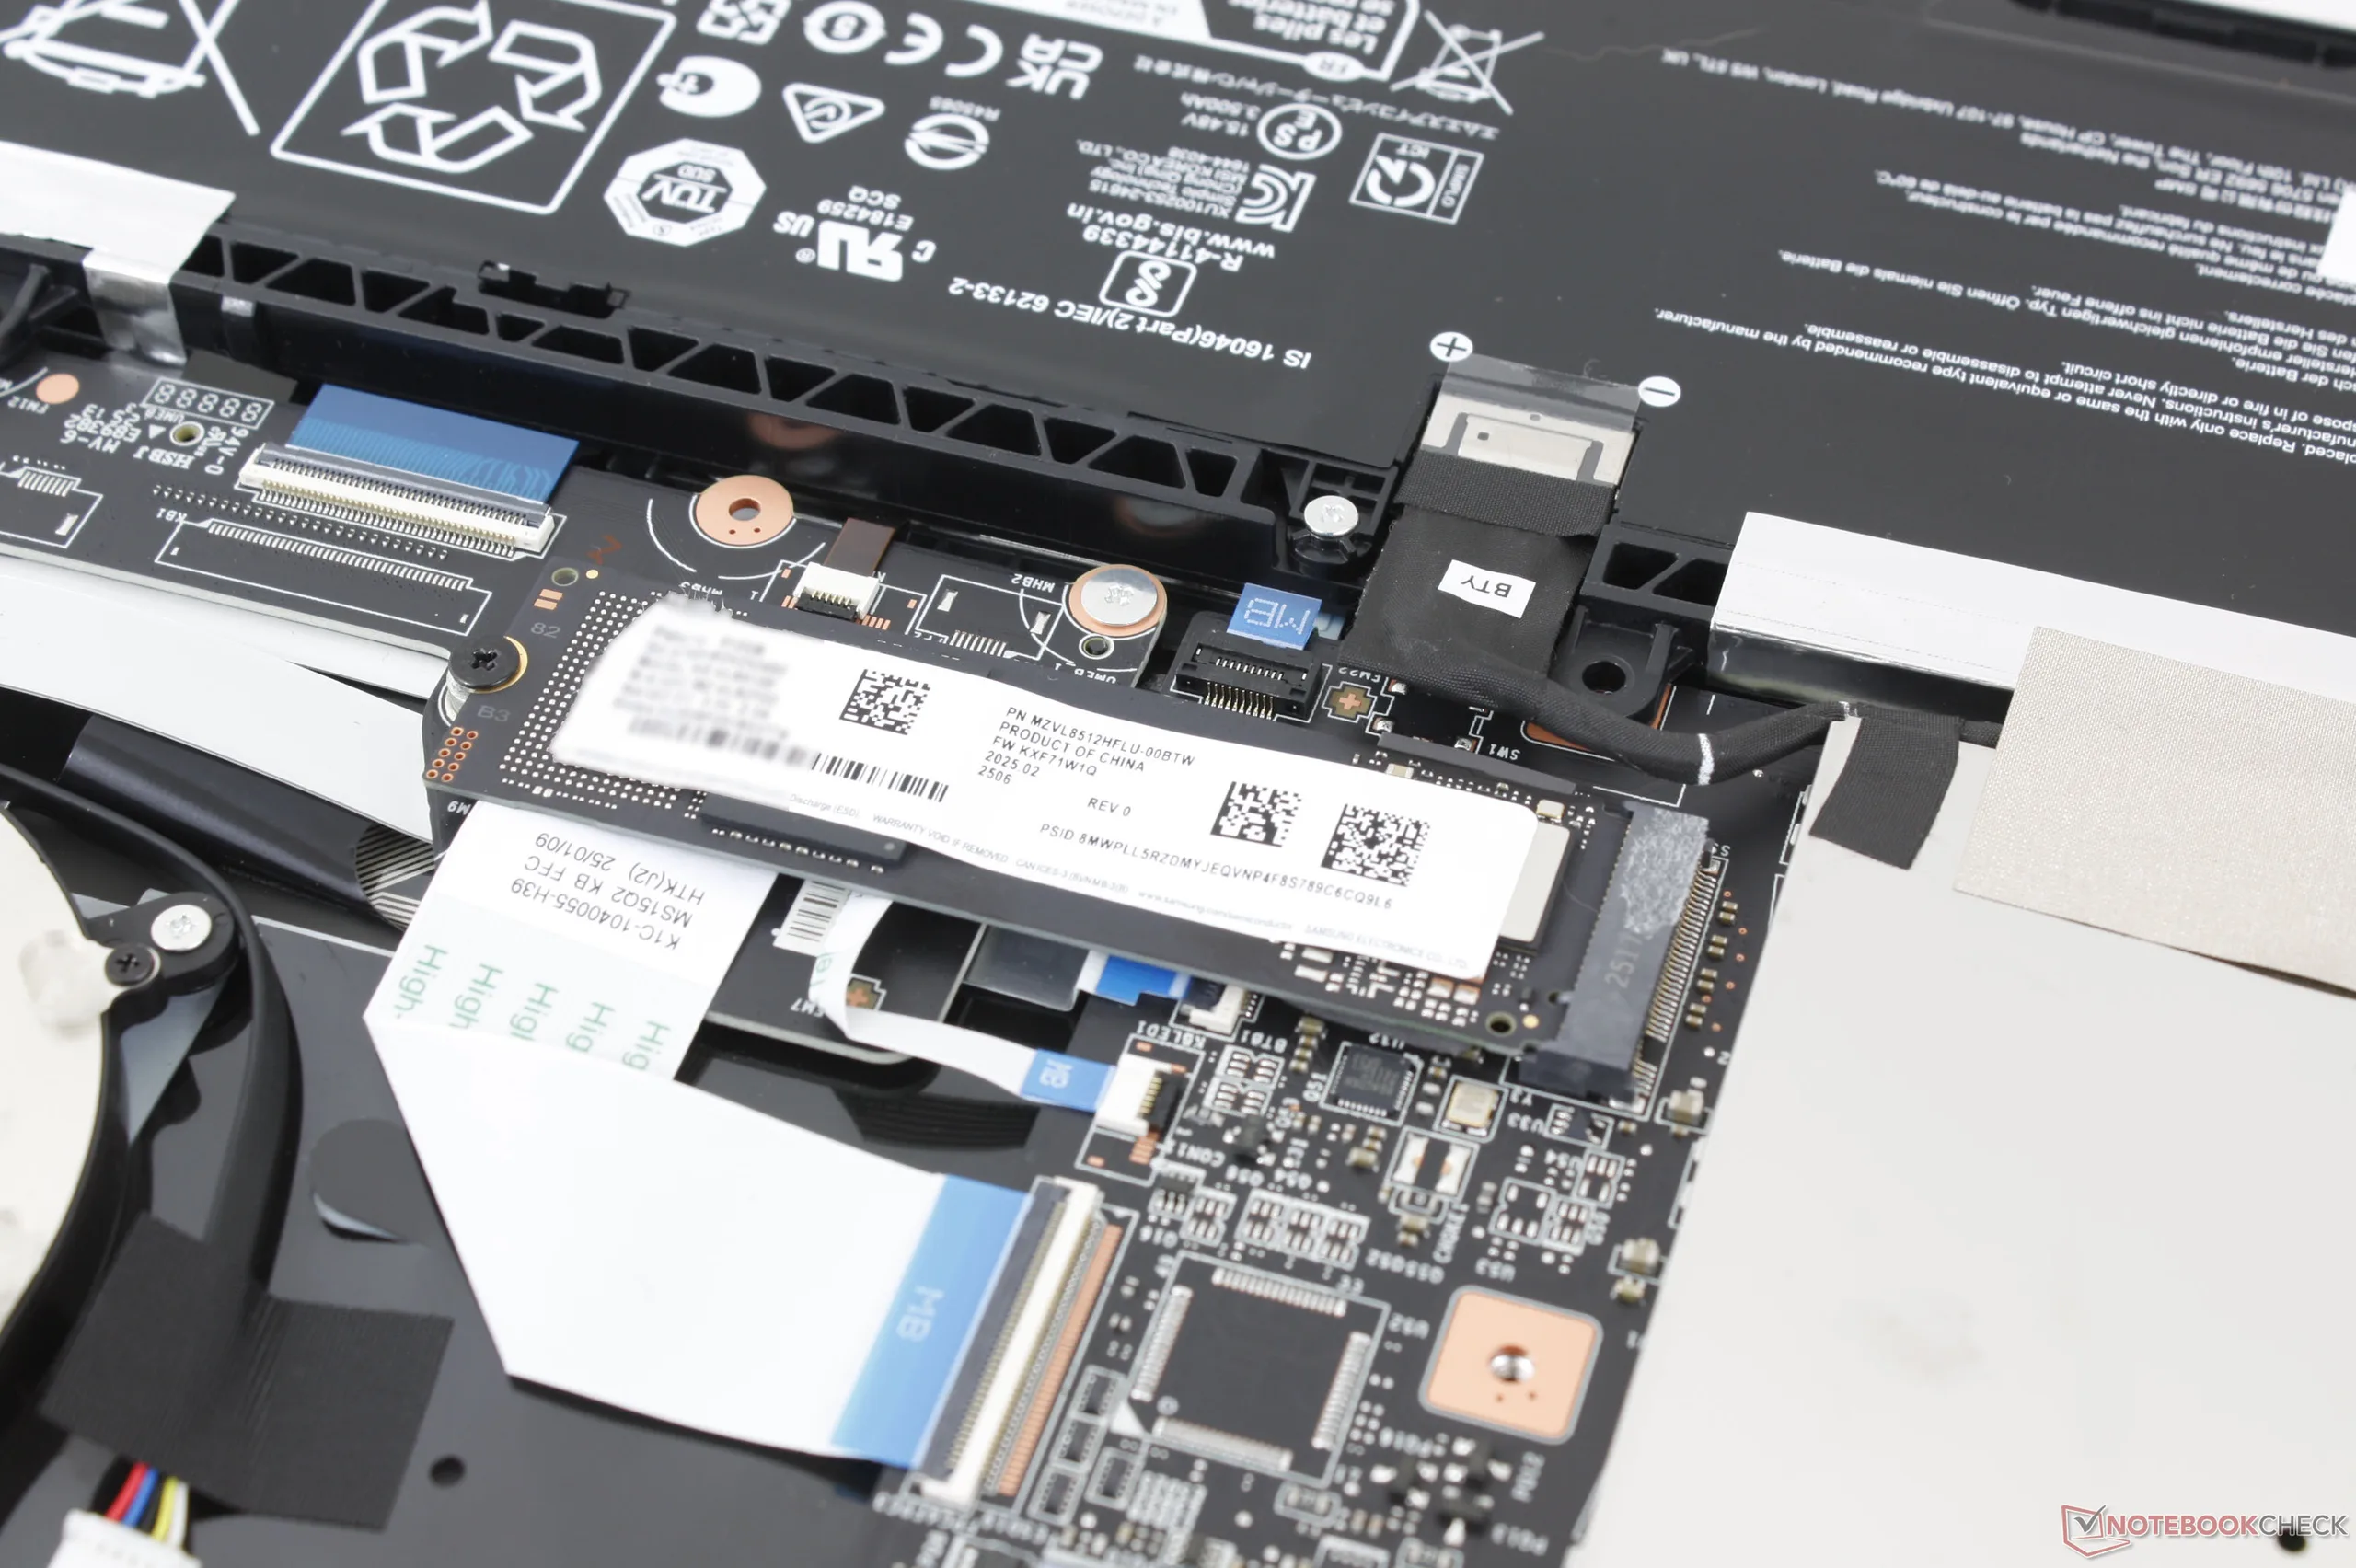
Bakım
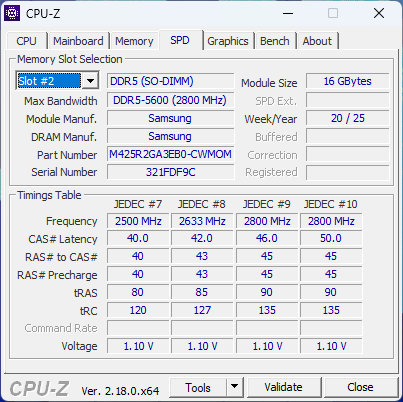
Alt panel sadece bir Philips tornavida ile kolayca çıkarılabilir. RAM iki DDR5 SODIMM yuvası ile yükseltilebilirken yalnızca tek bir M.2 2280 SSD desteklenmektedir.
Sürdürülebilirlik
MSI üretim sırasında geri dönüştürülmüş malzemeleri açıkça listelemese de, şirket yine de Energy Star ve FSC sertifikalarını tanıyor. Ambalajda dizüstü bilgisayar ve AC adaptörü için plastik ambalaj kullanılmış.
Aksesuarlar ve Garanti
Kutuda AC adaptörü ve evraklar dışında ekstra bir şey yoktur. ABD'de satın alındıysa normal bir yıllık sınırlı üretici garantisi geçerlidir.
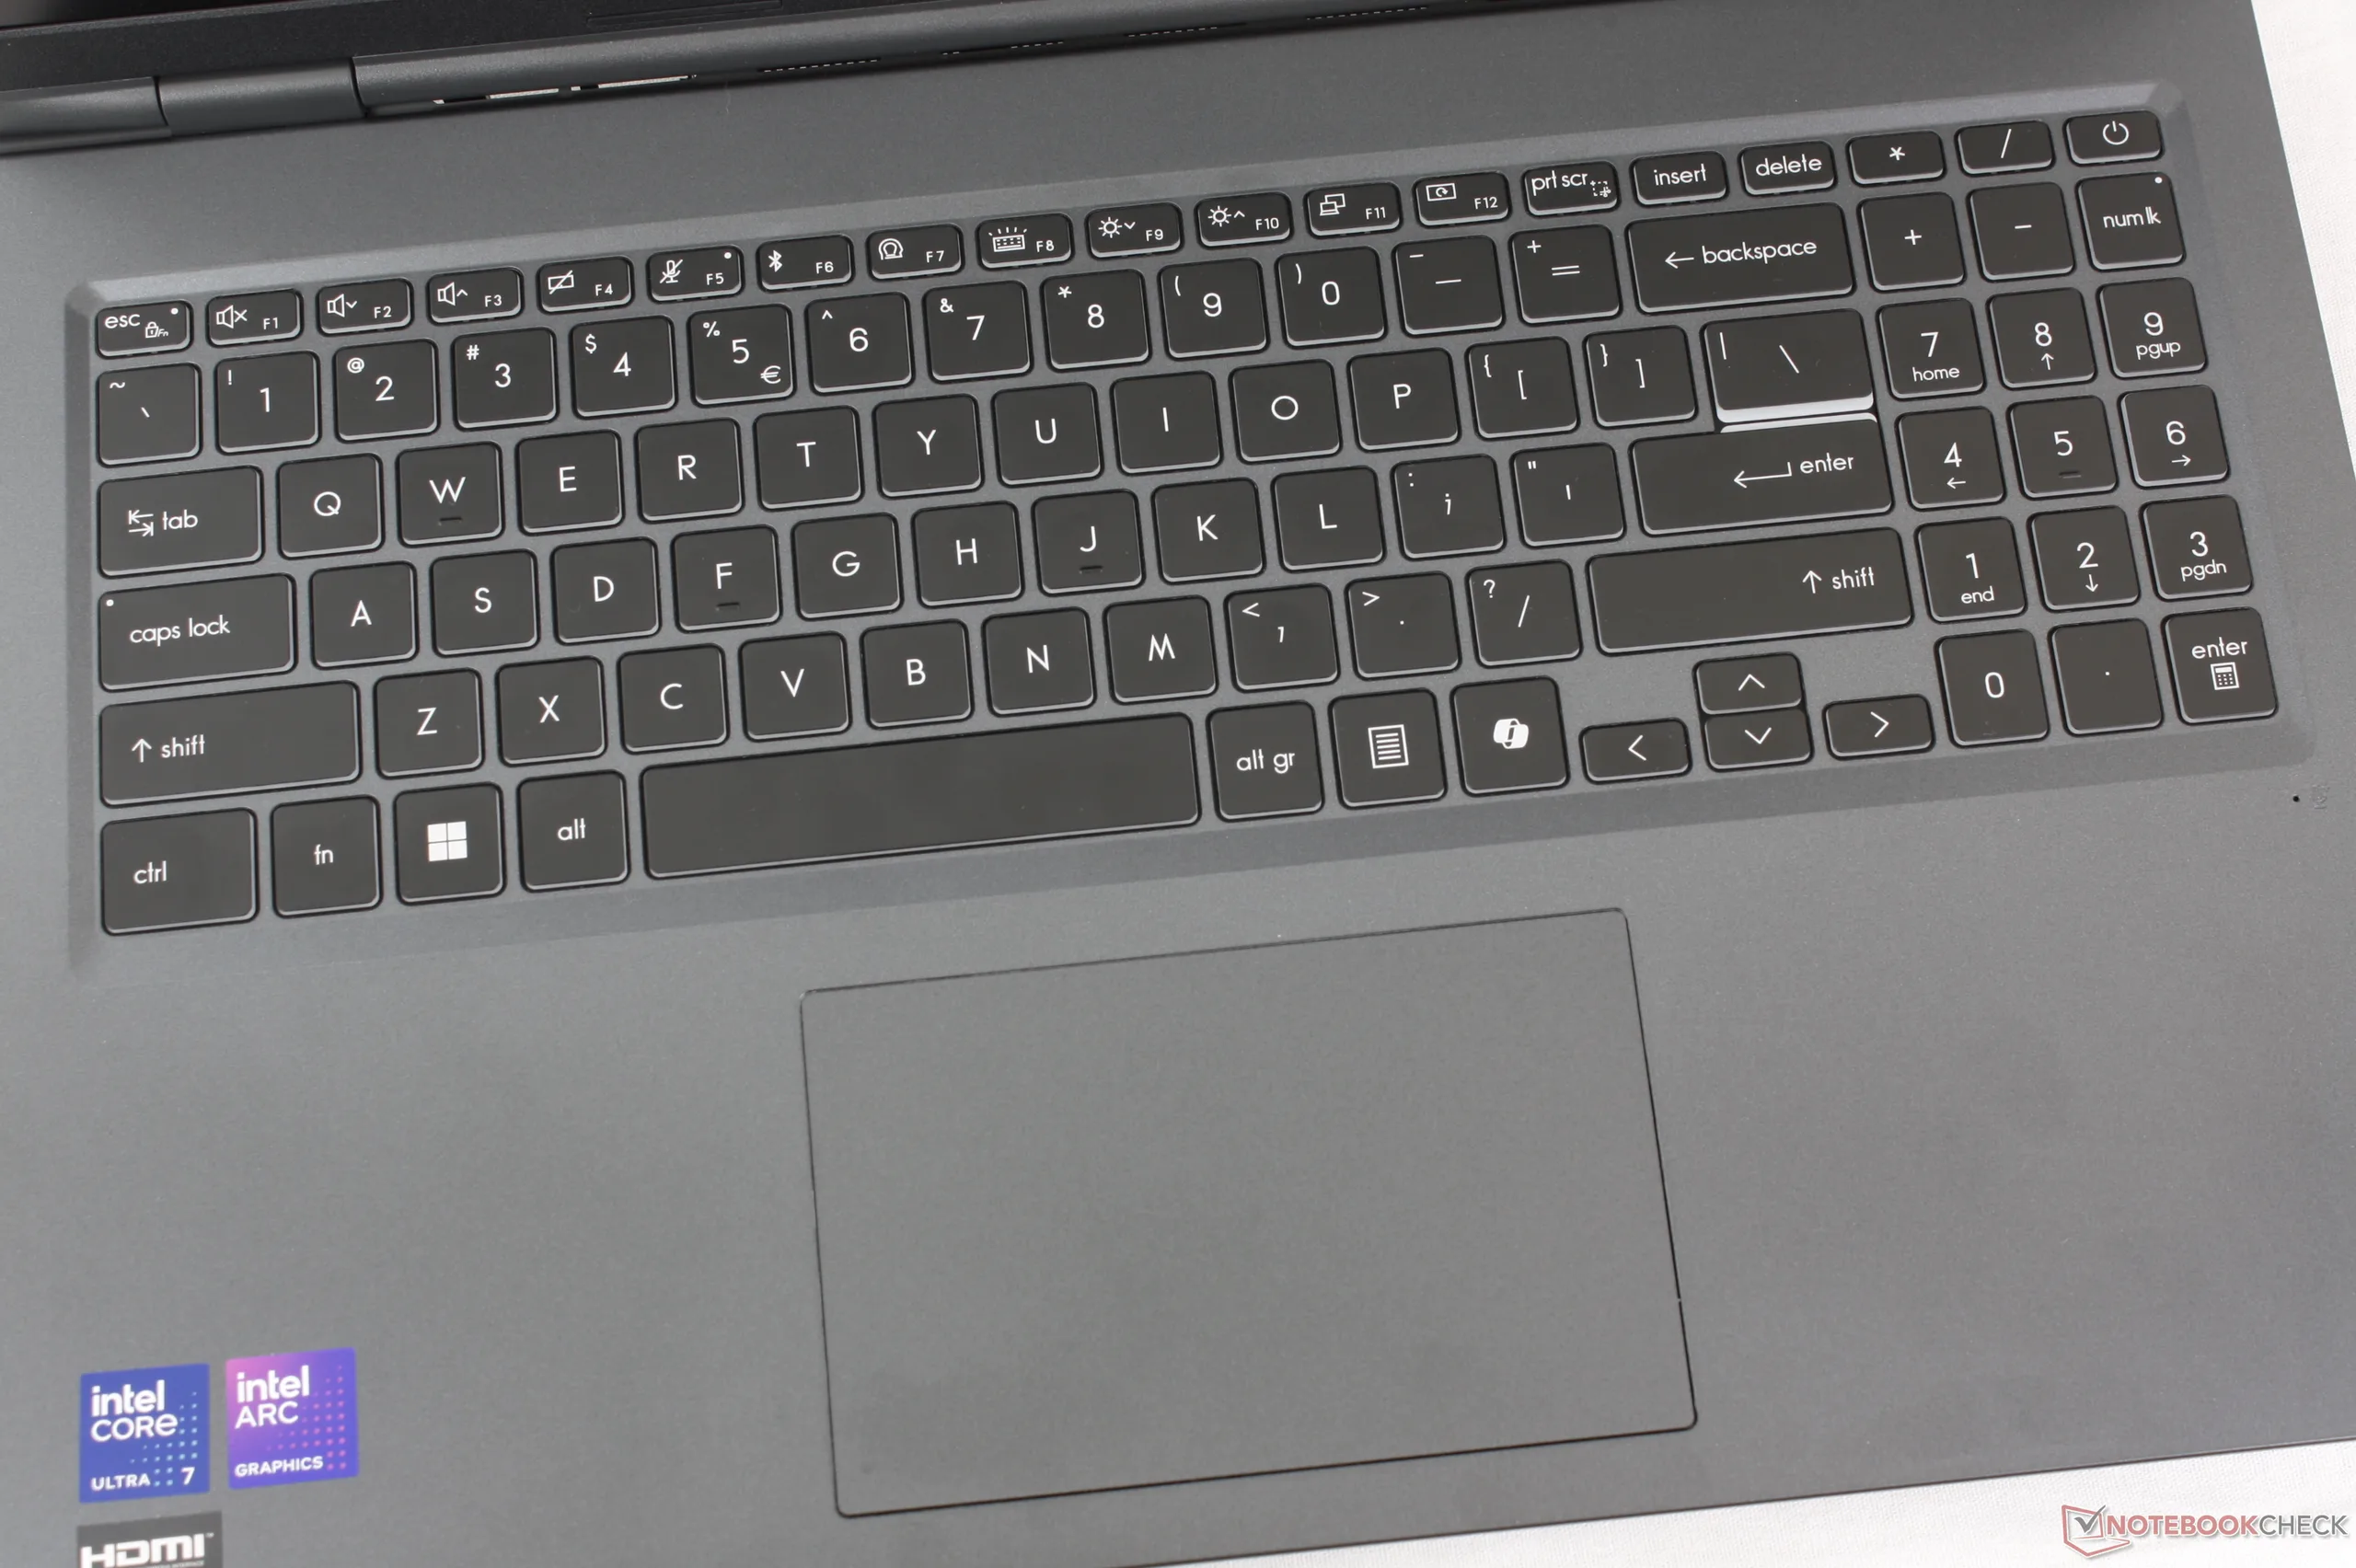
Giriş Aygıtları
Yazma deneyimi, bilgisayarda olduğu gibi neredeyse aynıdır Prestij 16 venture 16'da da benzer tuş başlıkları ve bileşenler kullanılıyor. Geri bildirim, geleneksel ThinkPad ile karşılaştırıldığında sessiz tıkırtı ve daha sığ hareket ile nispeten hafiftir.
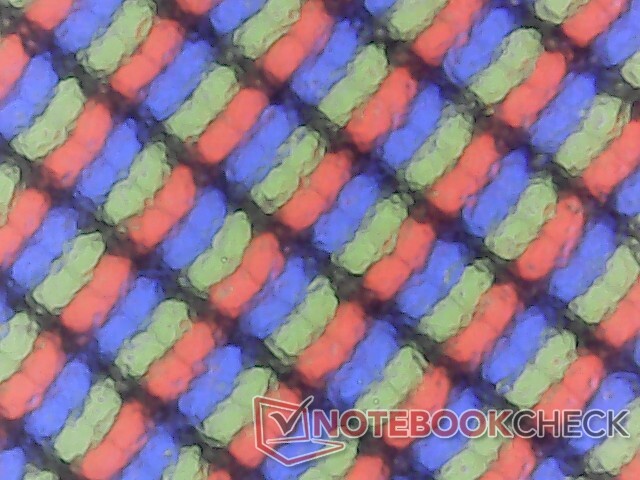
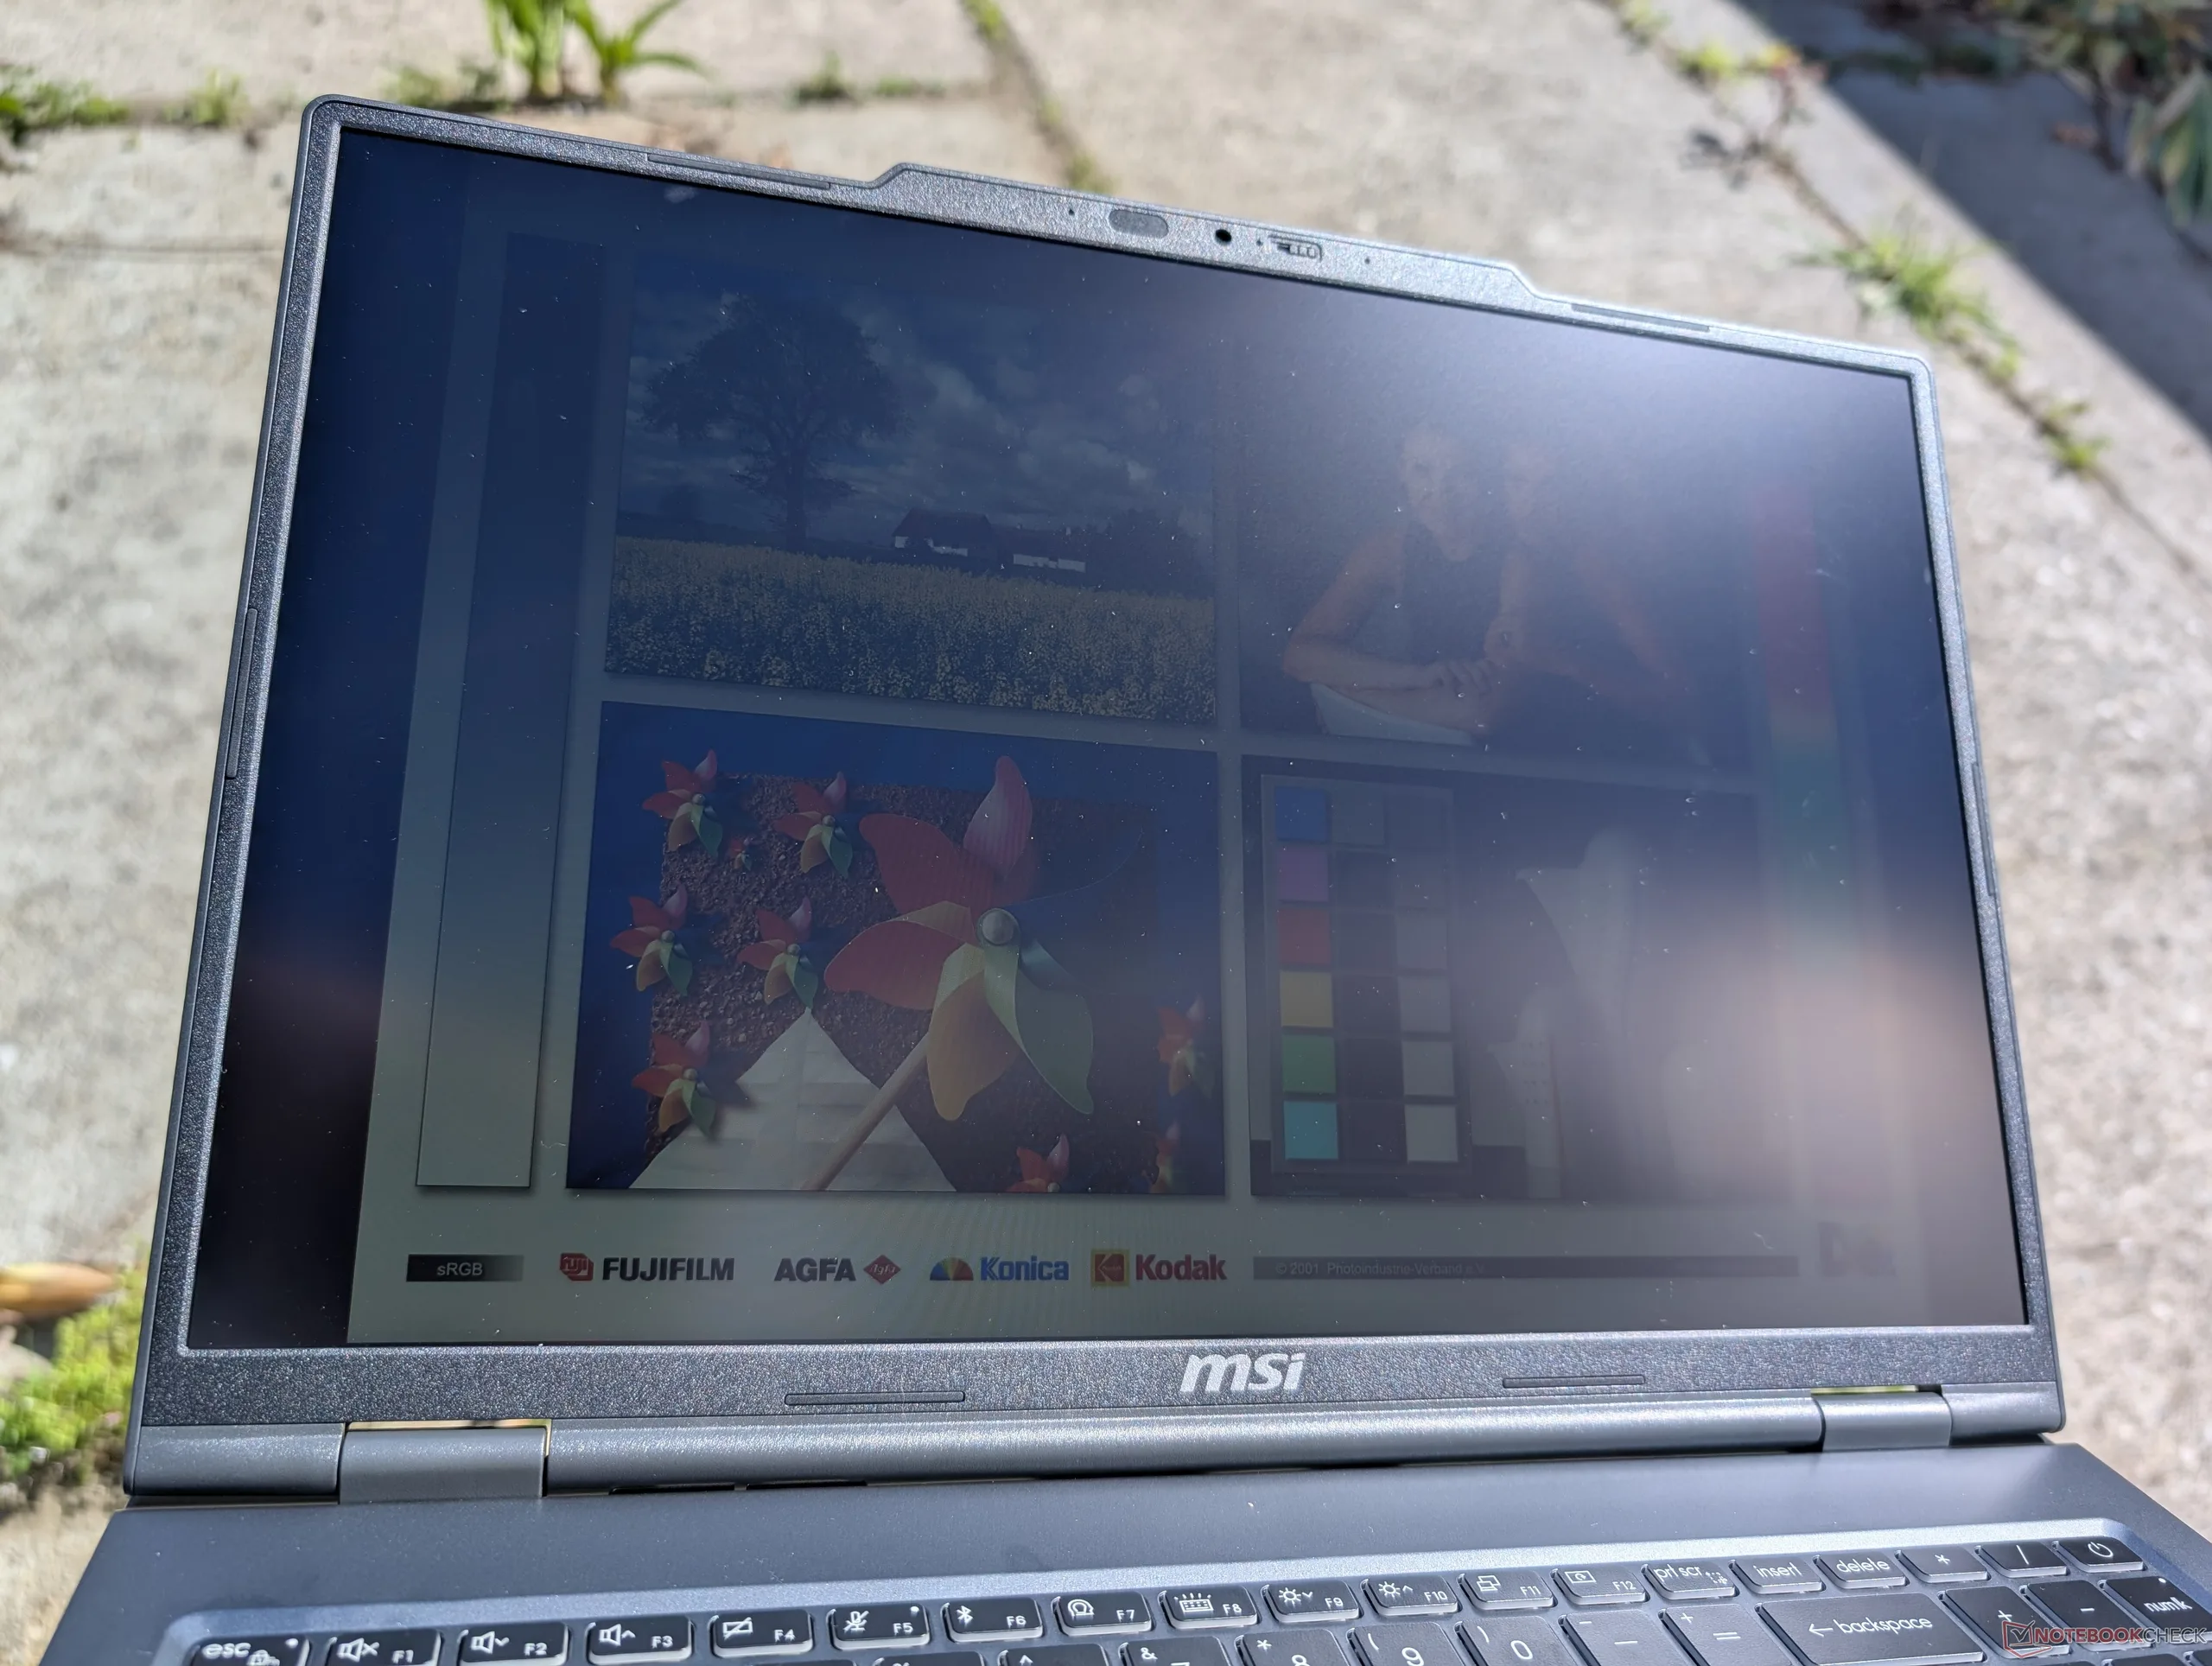
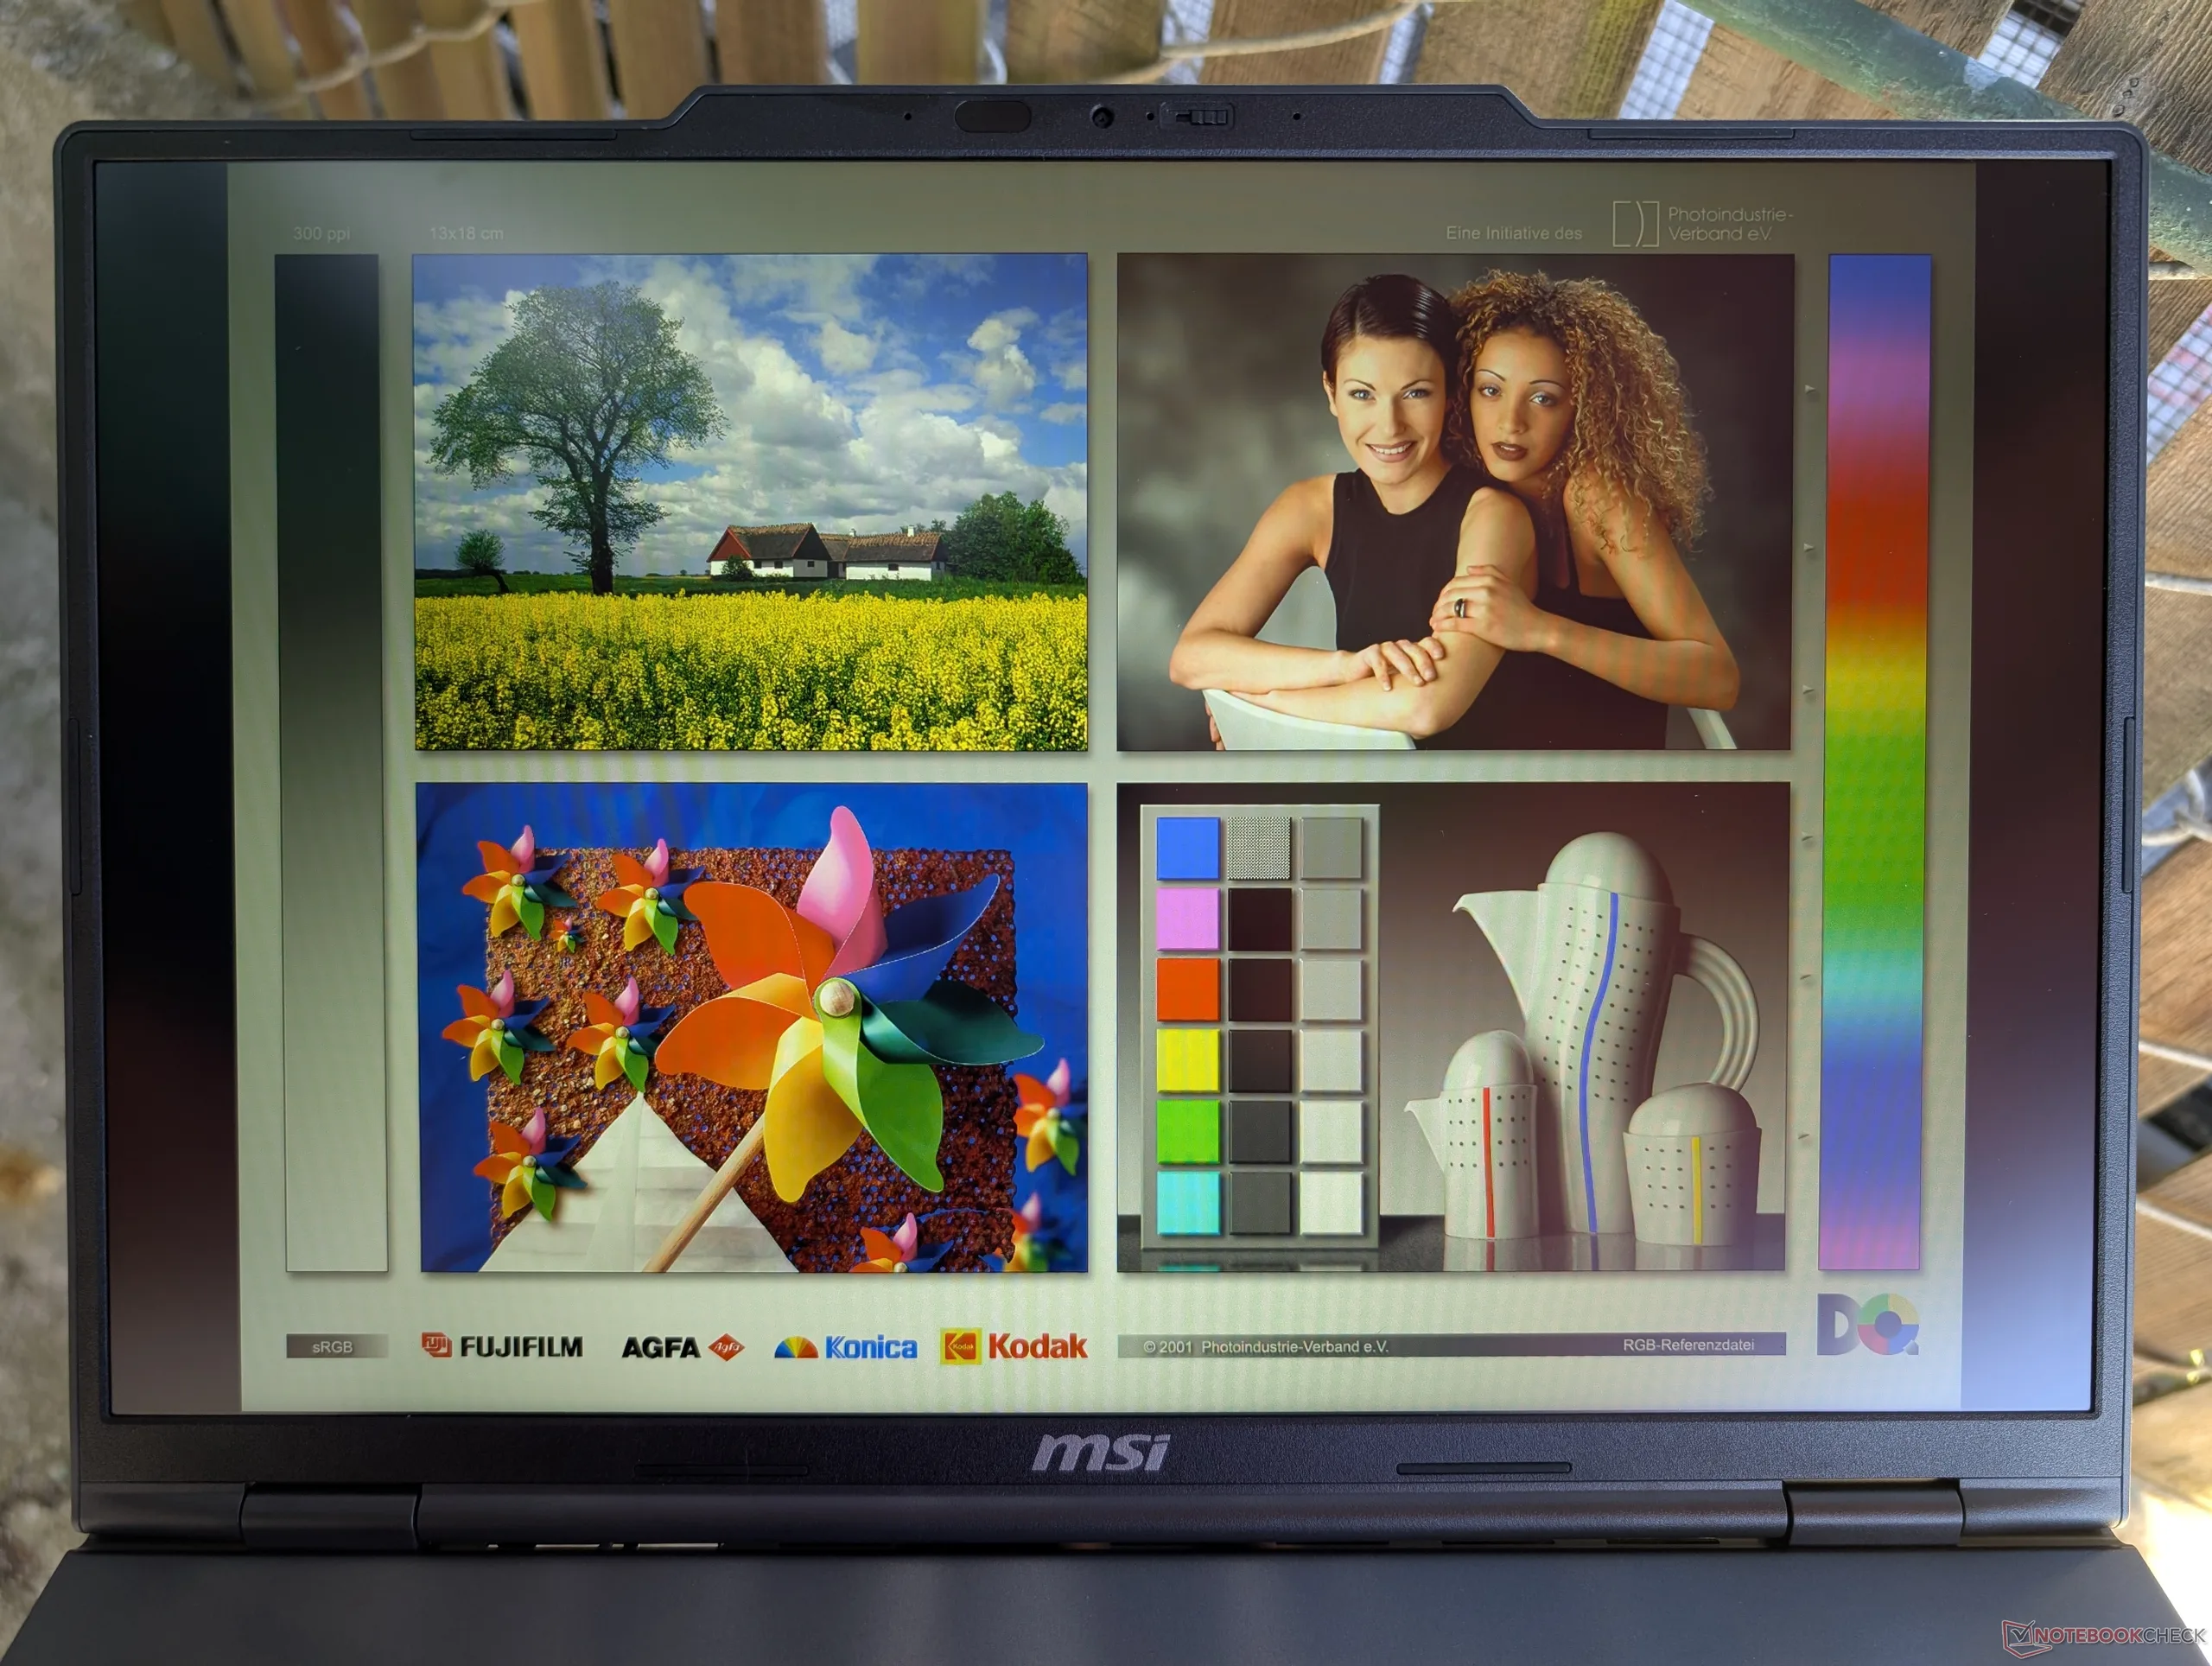
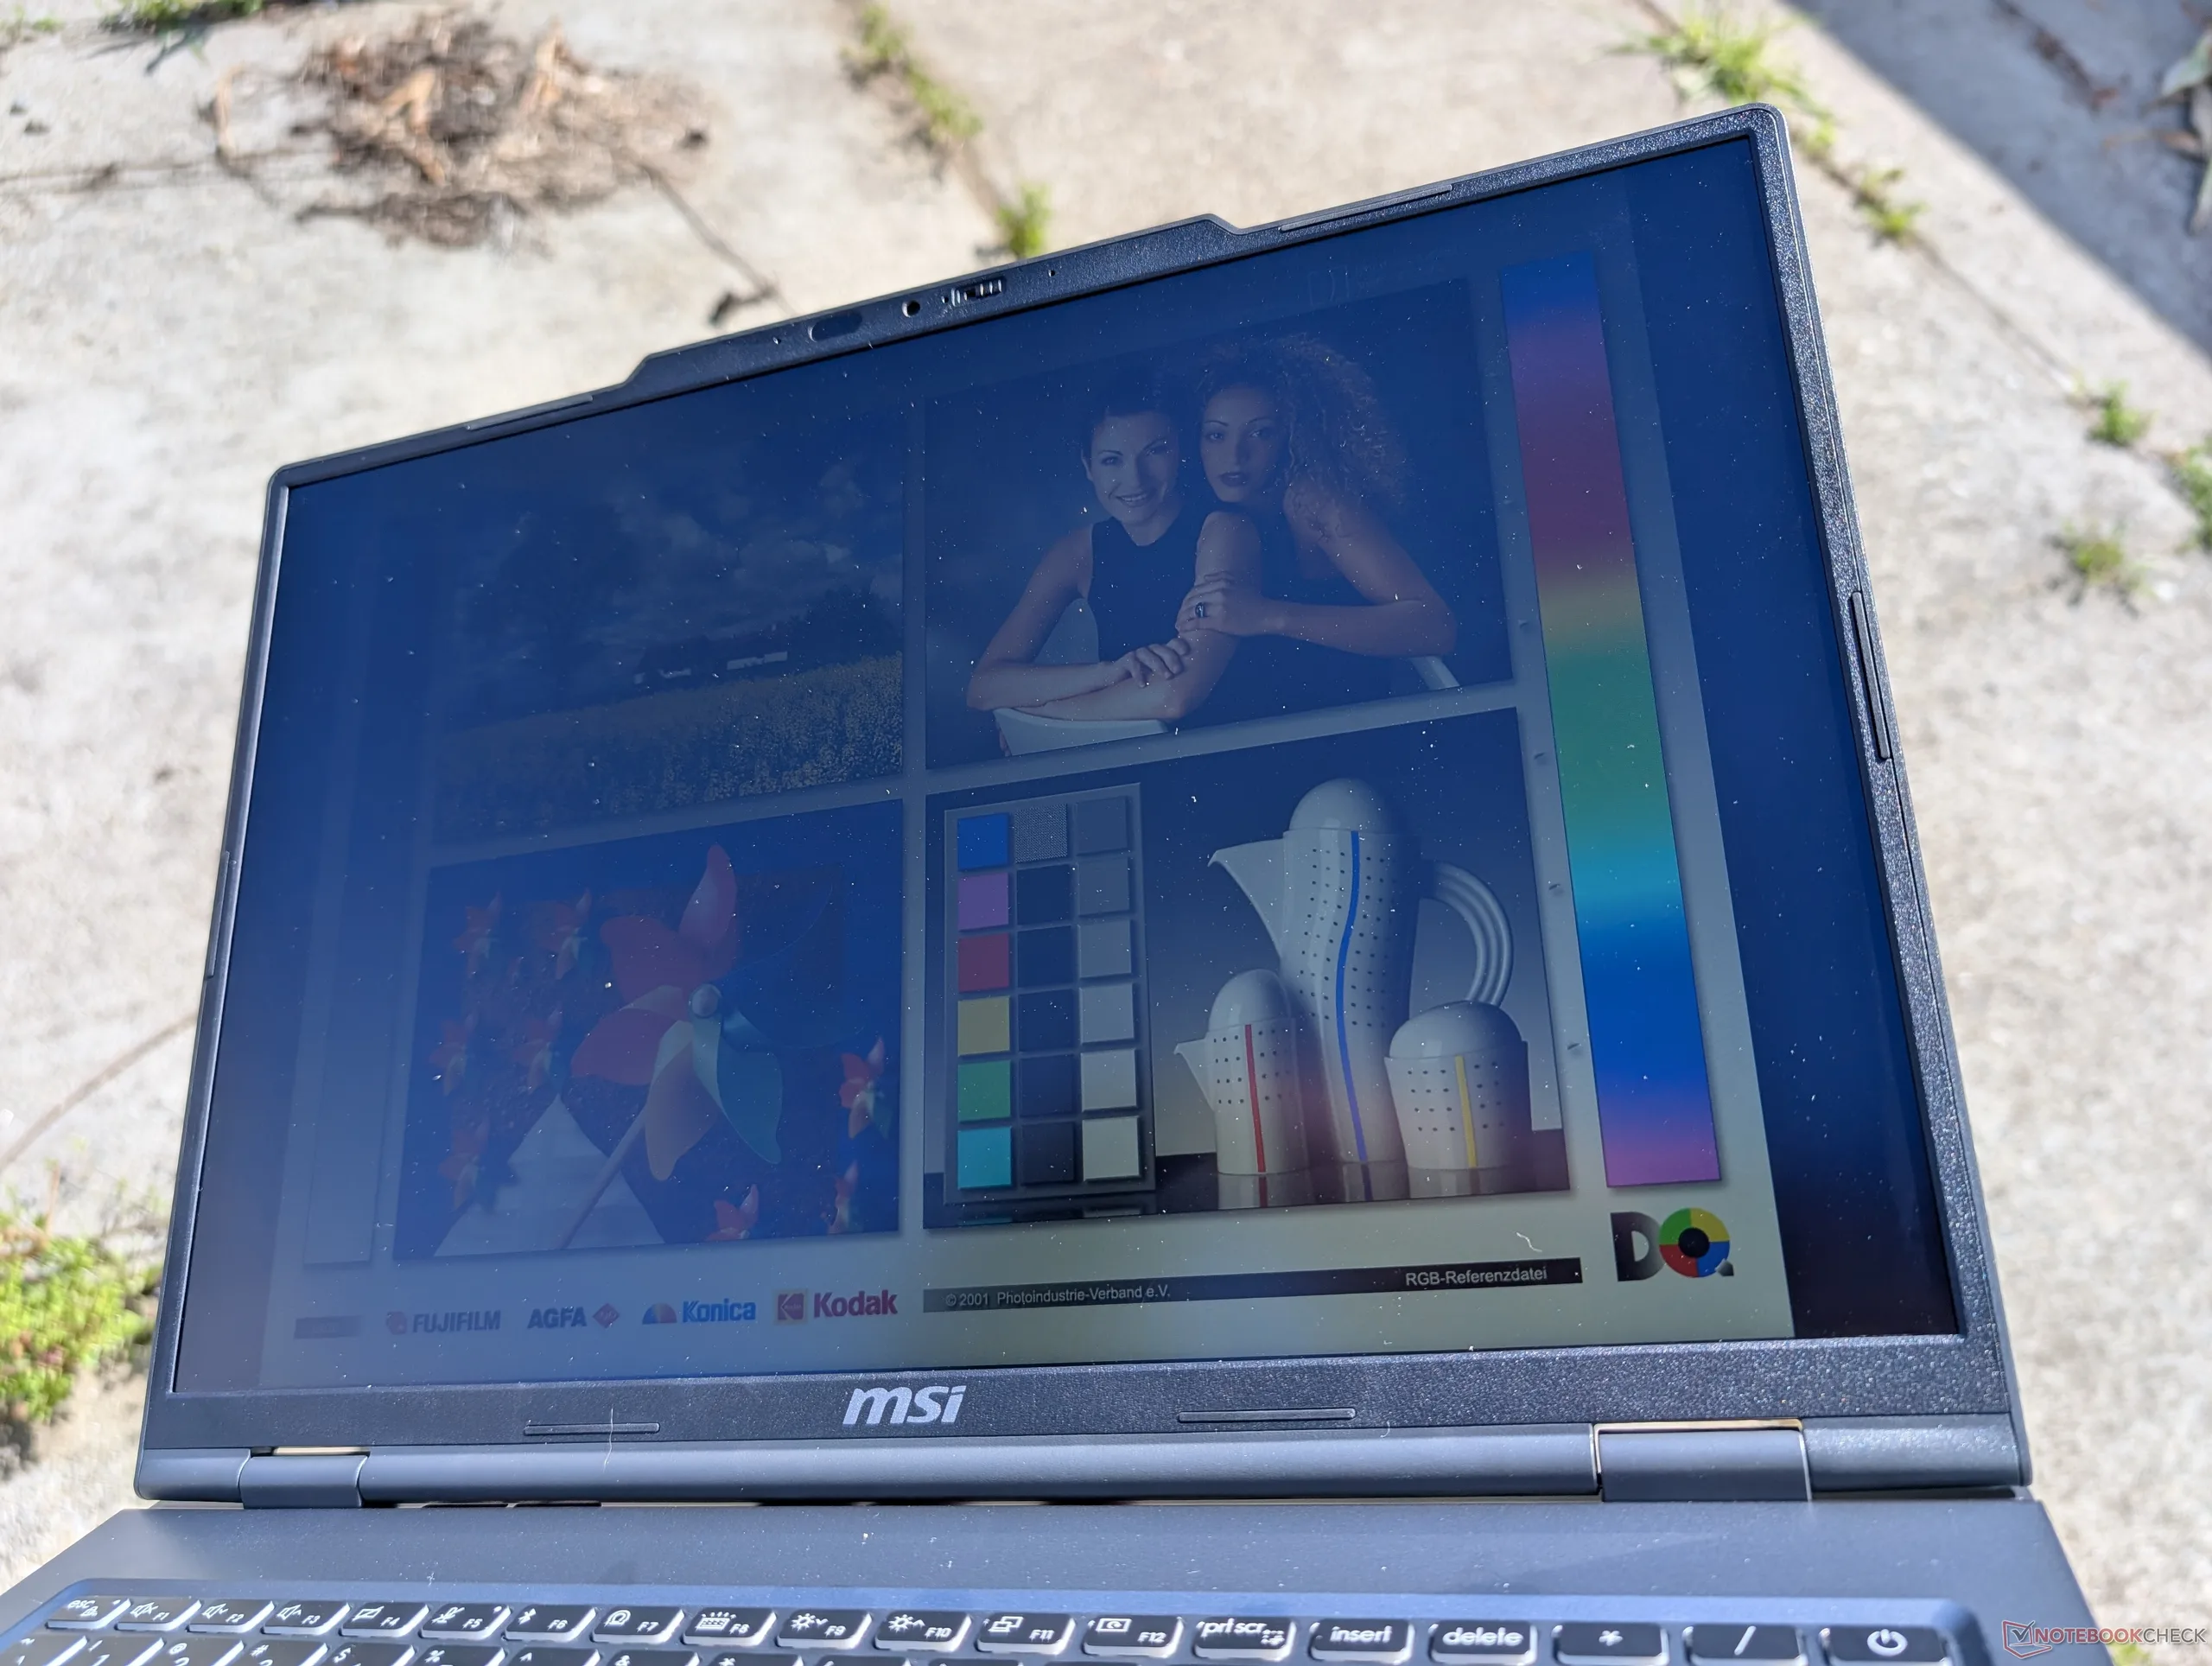
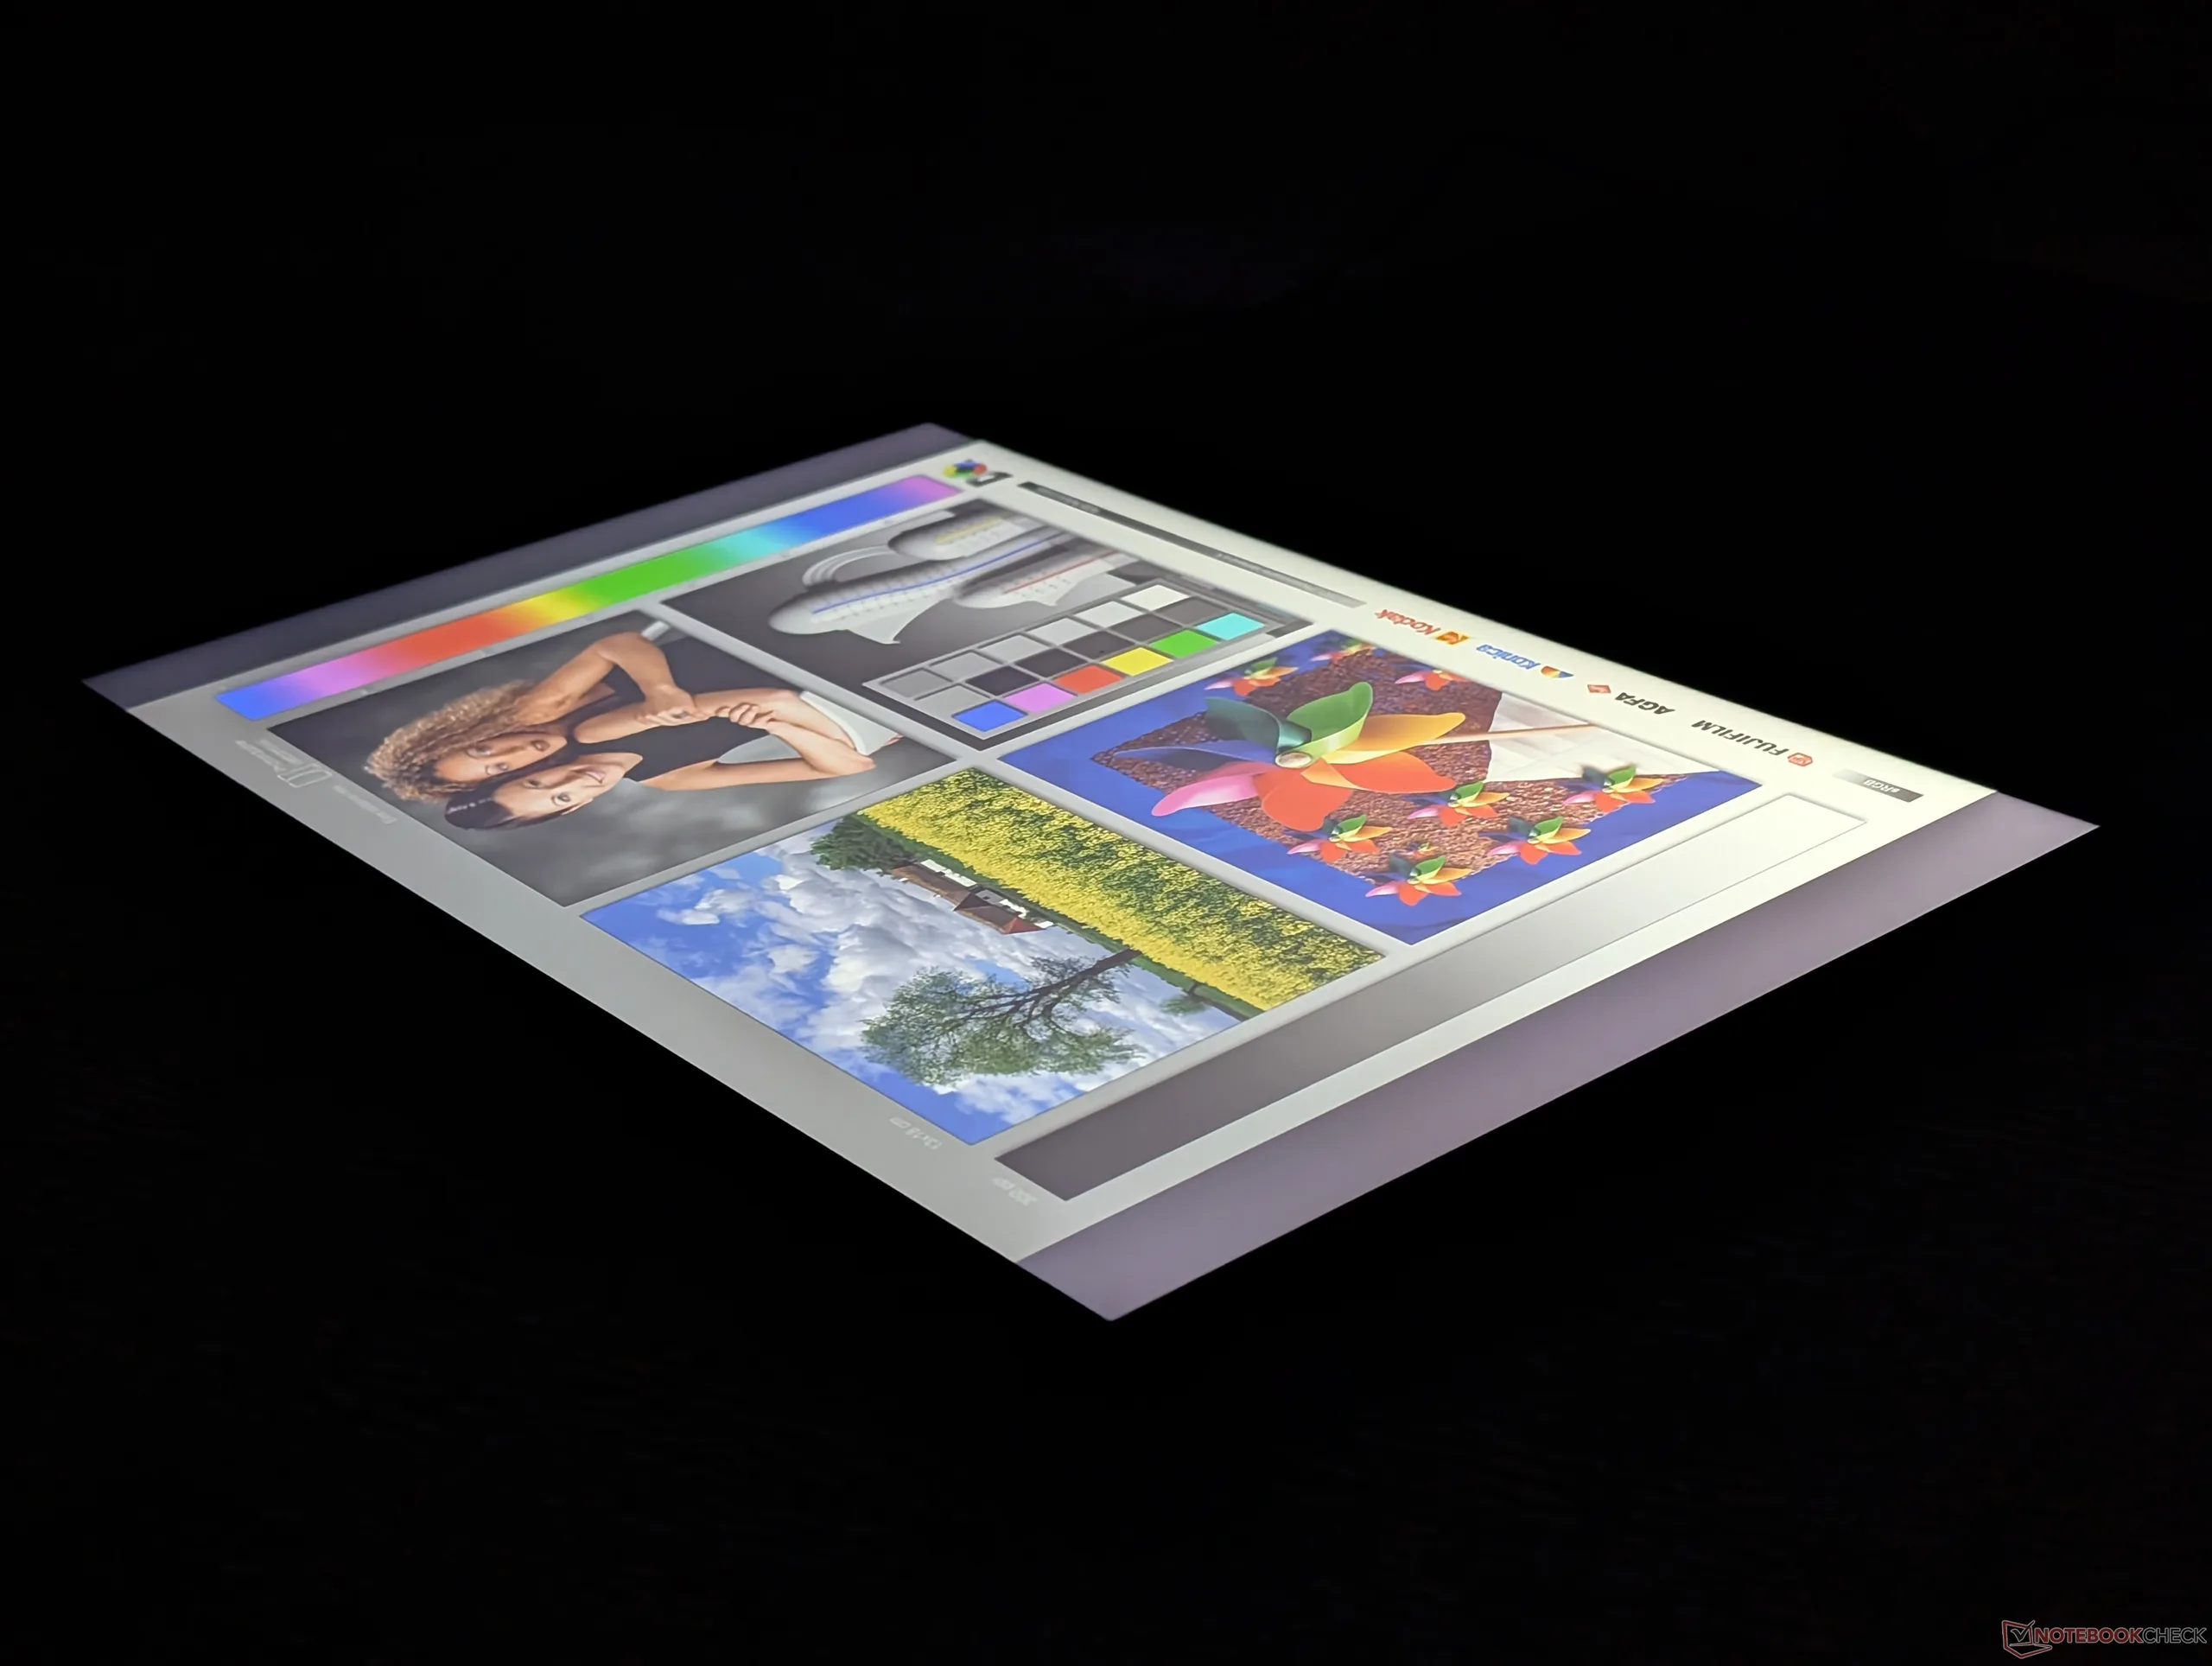
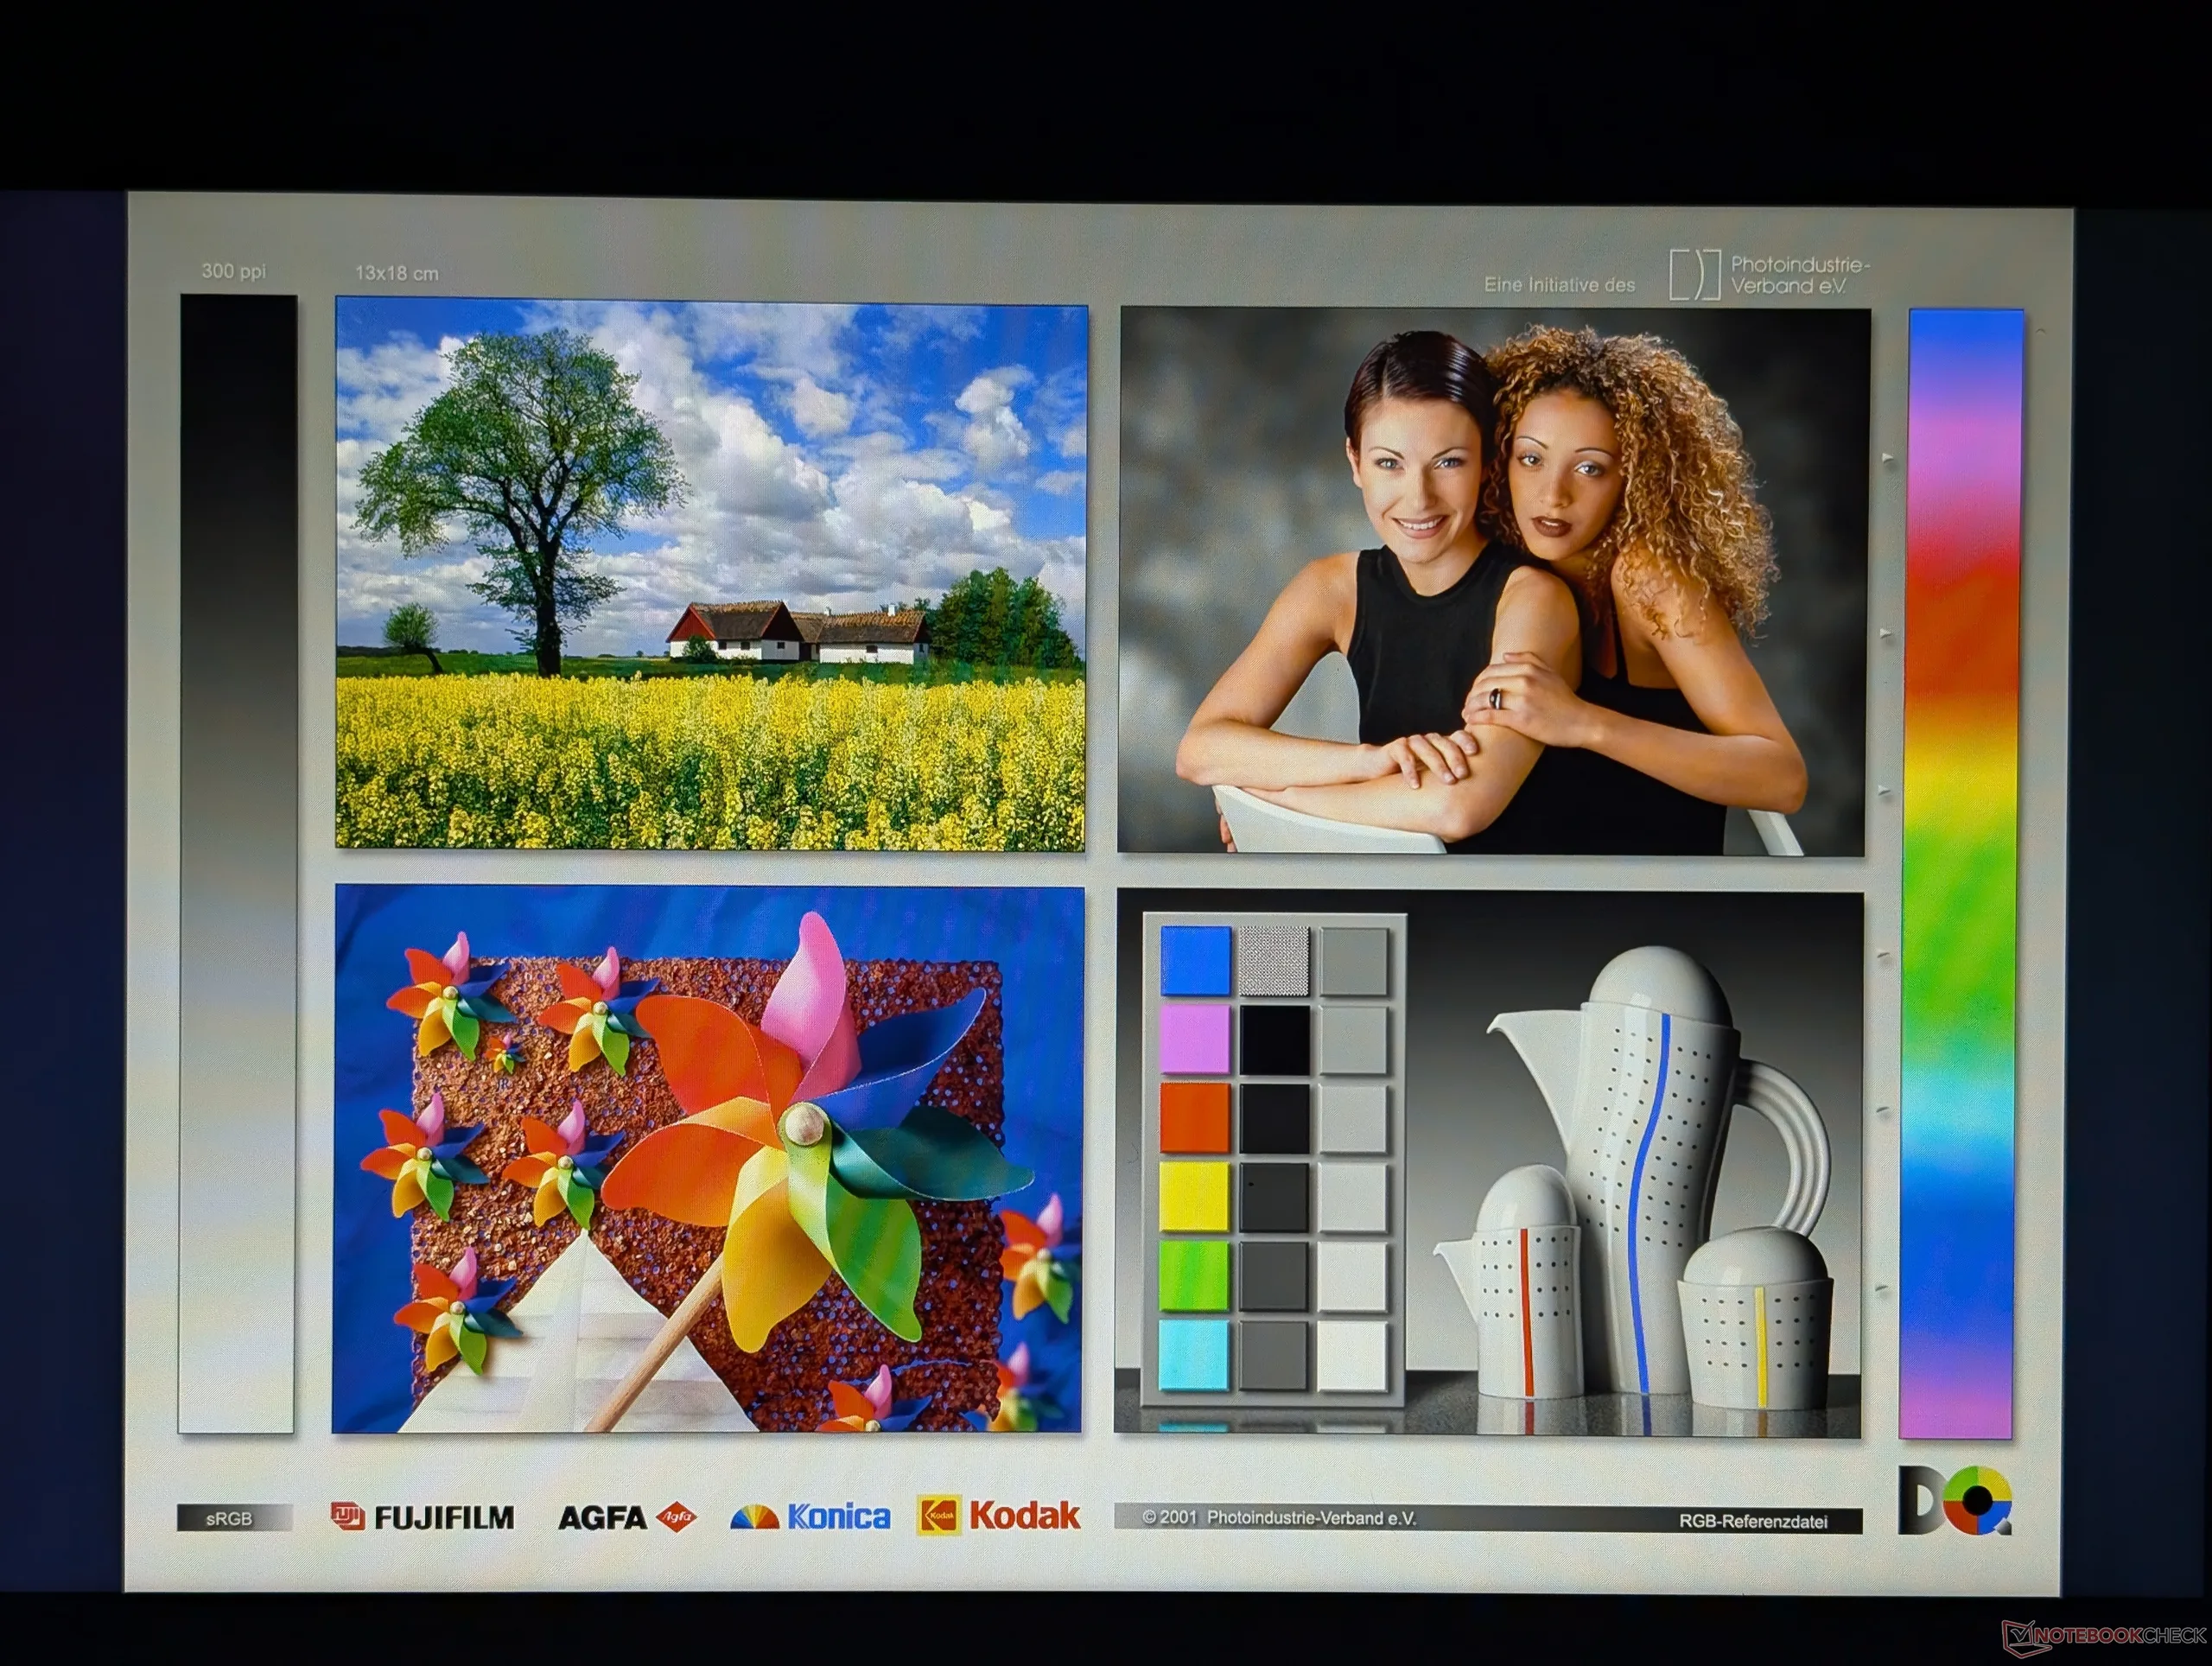
Ekran
Aşağıdaki gibi iki ekran seçeneği mevcuttur:
- 1920 x 1200, IPS, %60 sRGB, 60 Hz, dokunmatik ekran
- 2048 x 1280, OLED, %100 DCI-P3, 120 Hz, dokunmatik olmayan
Temel seçenek sRGB kapsamından yoksundur ve çok daha üstün OLED seçeneğinin aksine 60 Hz yenileme hızıyla sınırlıdır. Kontrast ise 1500:1'in üzerinde bir IPS panel için oldukça iyi.

| |||||||||||||||||||||||||
Aydınlatma: 91 %
Batarya modunda parlaklık: 321.7 cd/m²
Kontrast: 1787:1 (Siyah: 0.18 cd/m²)
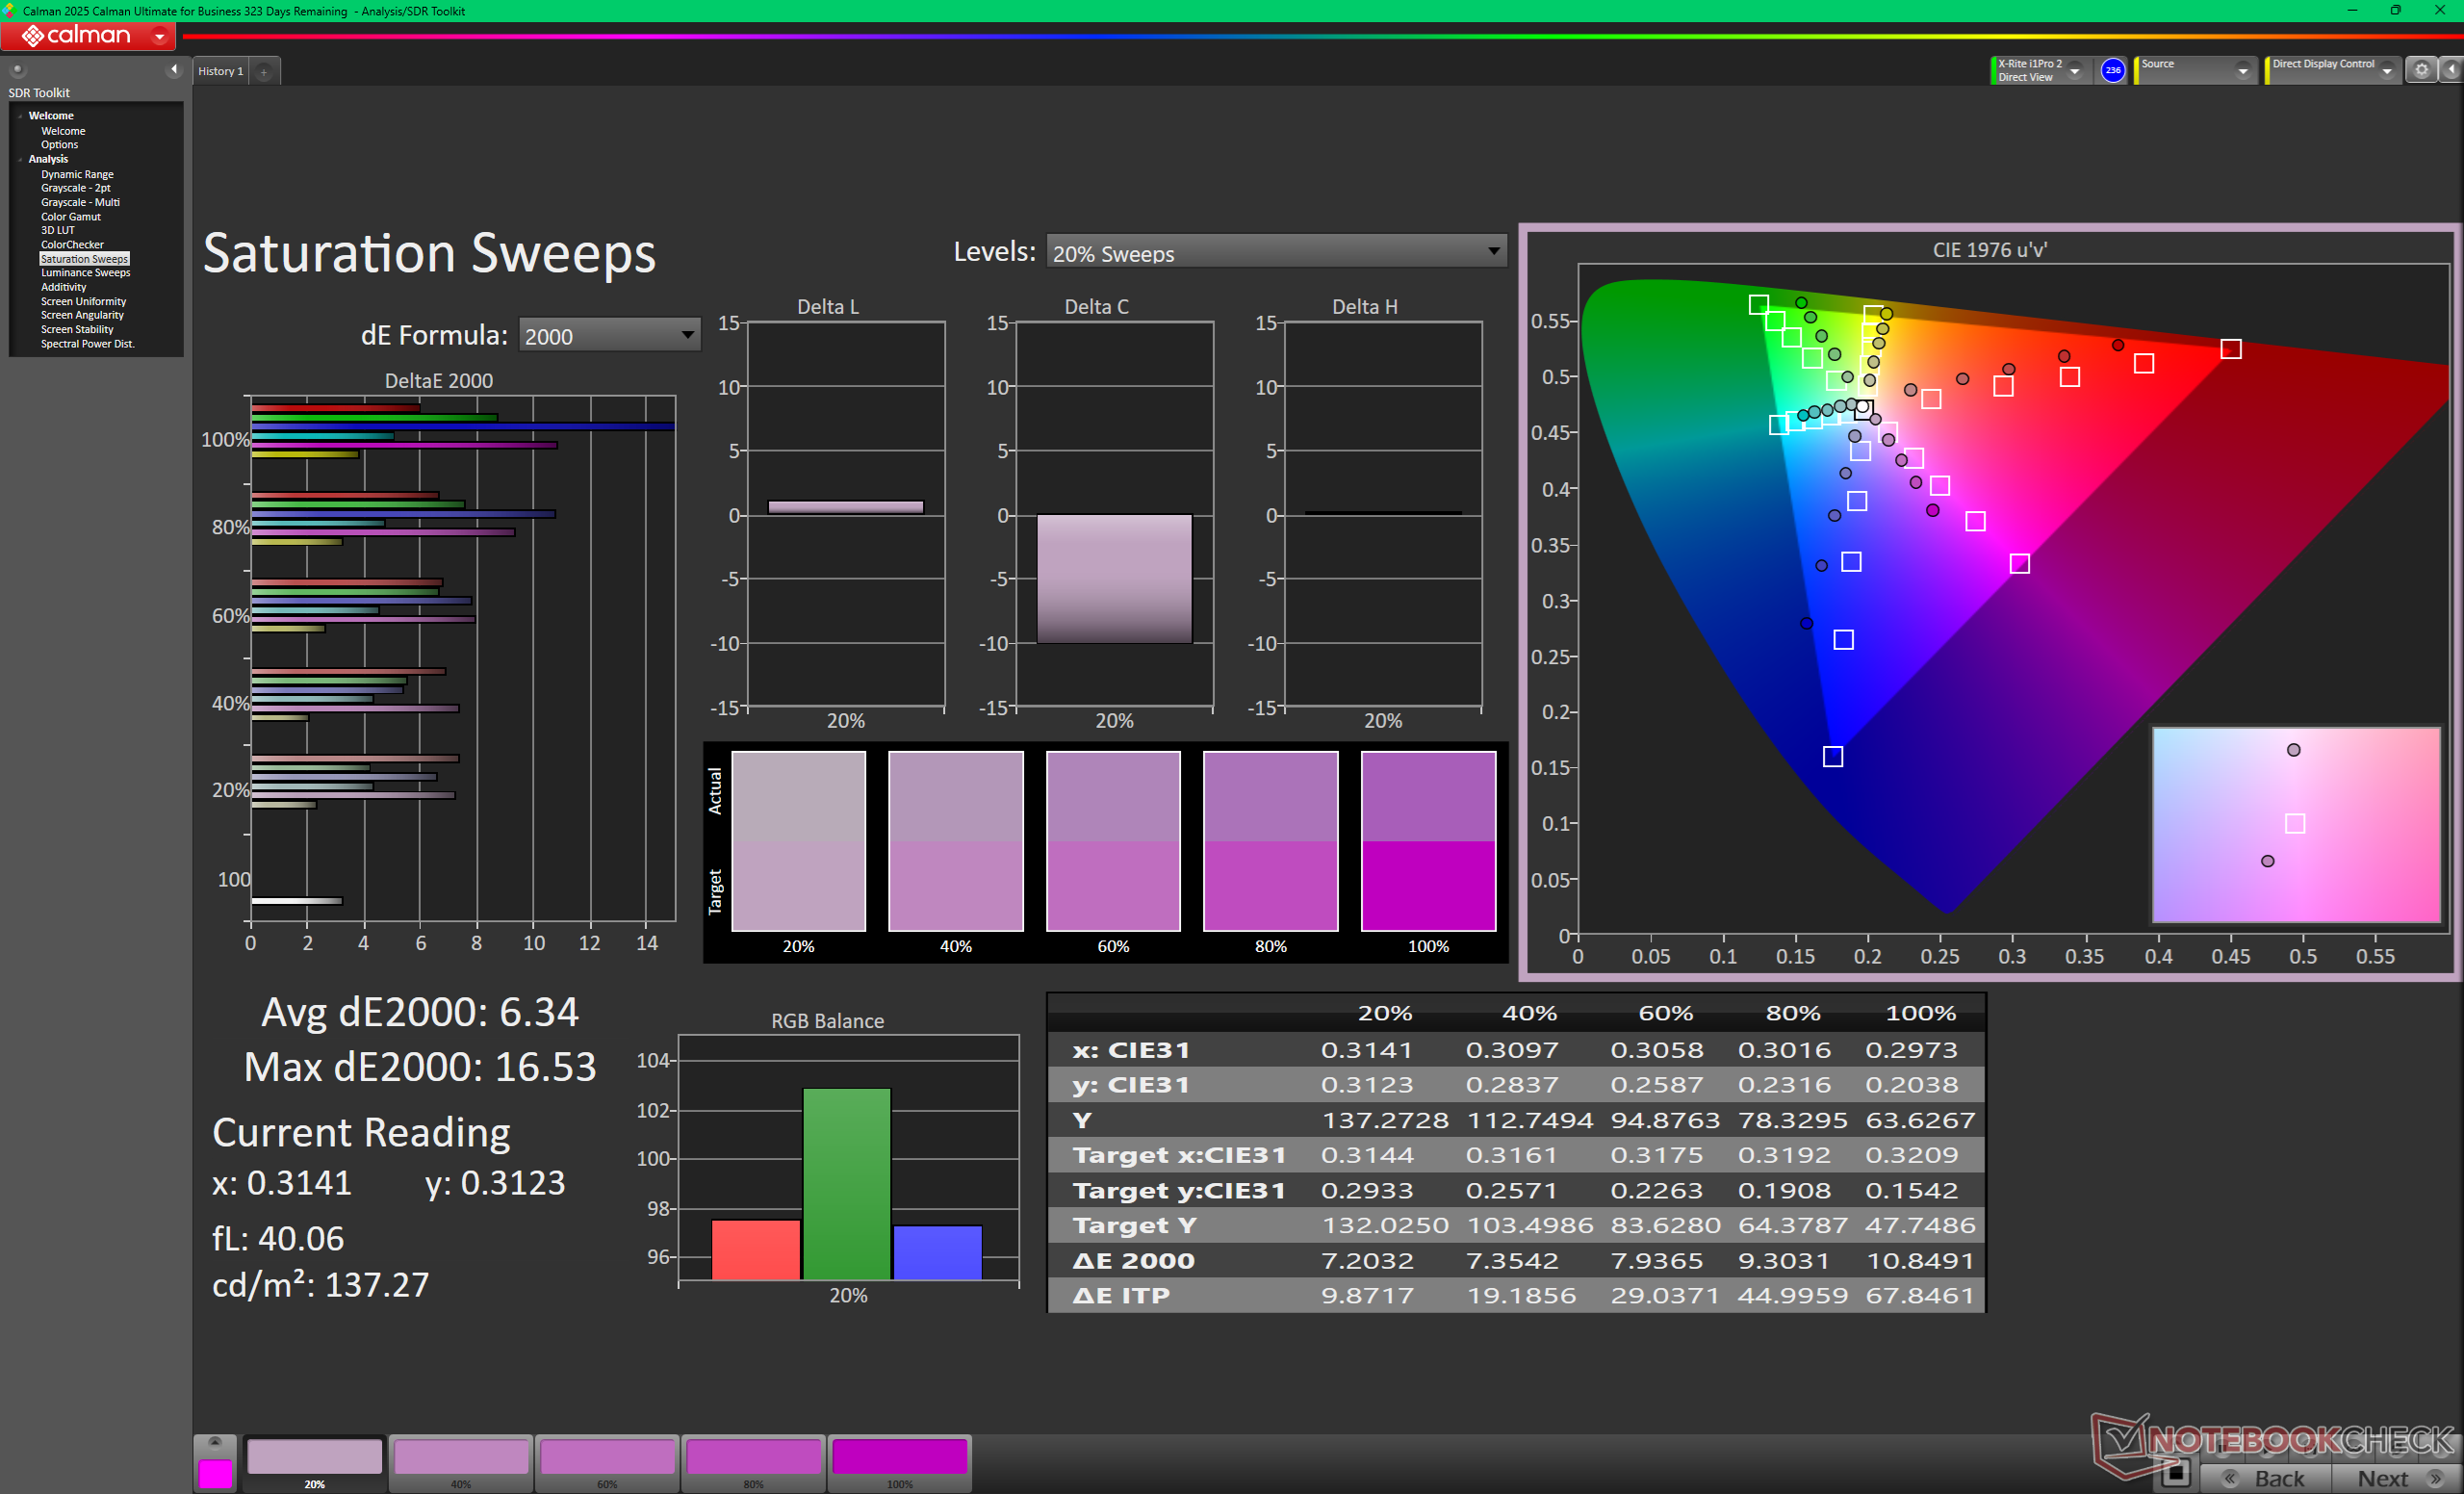
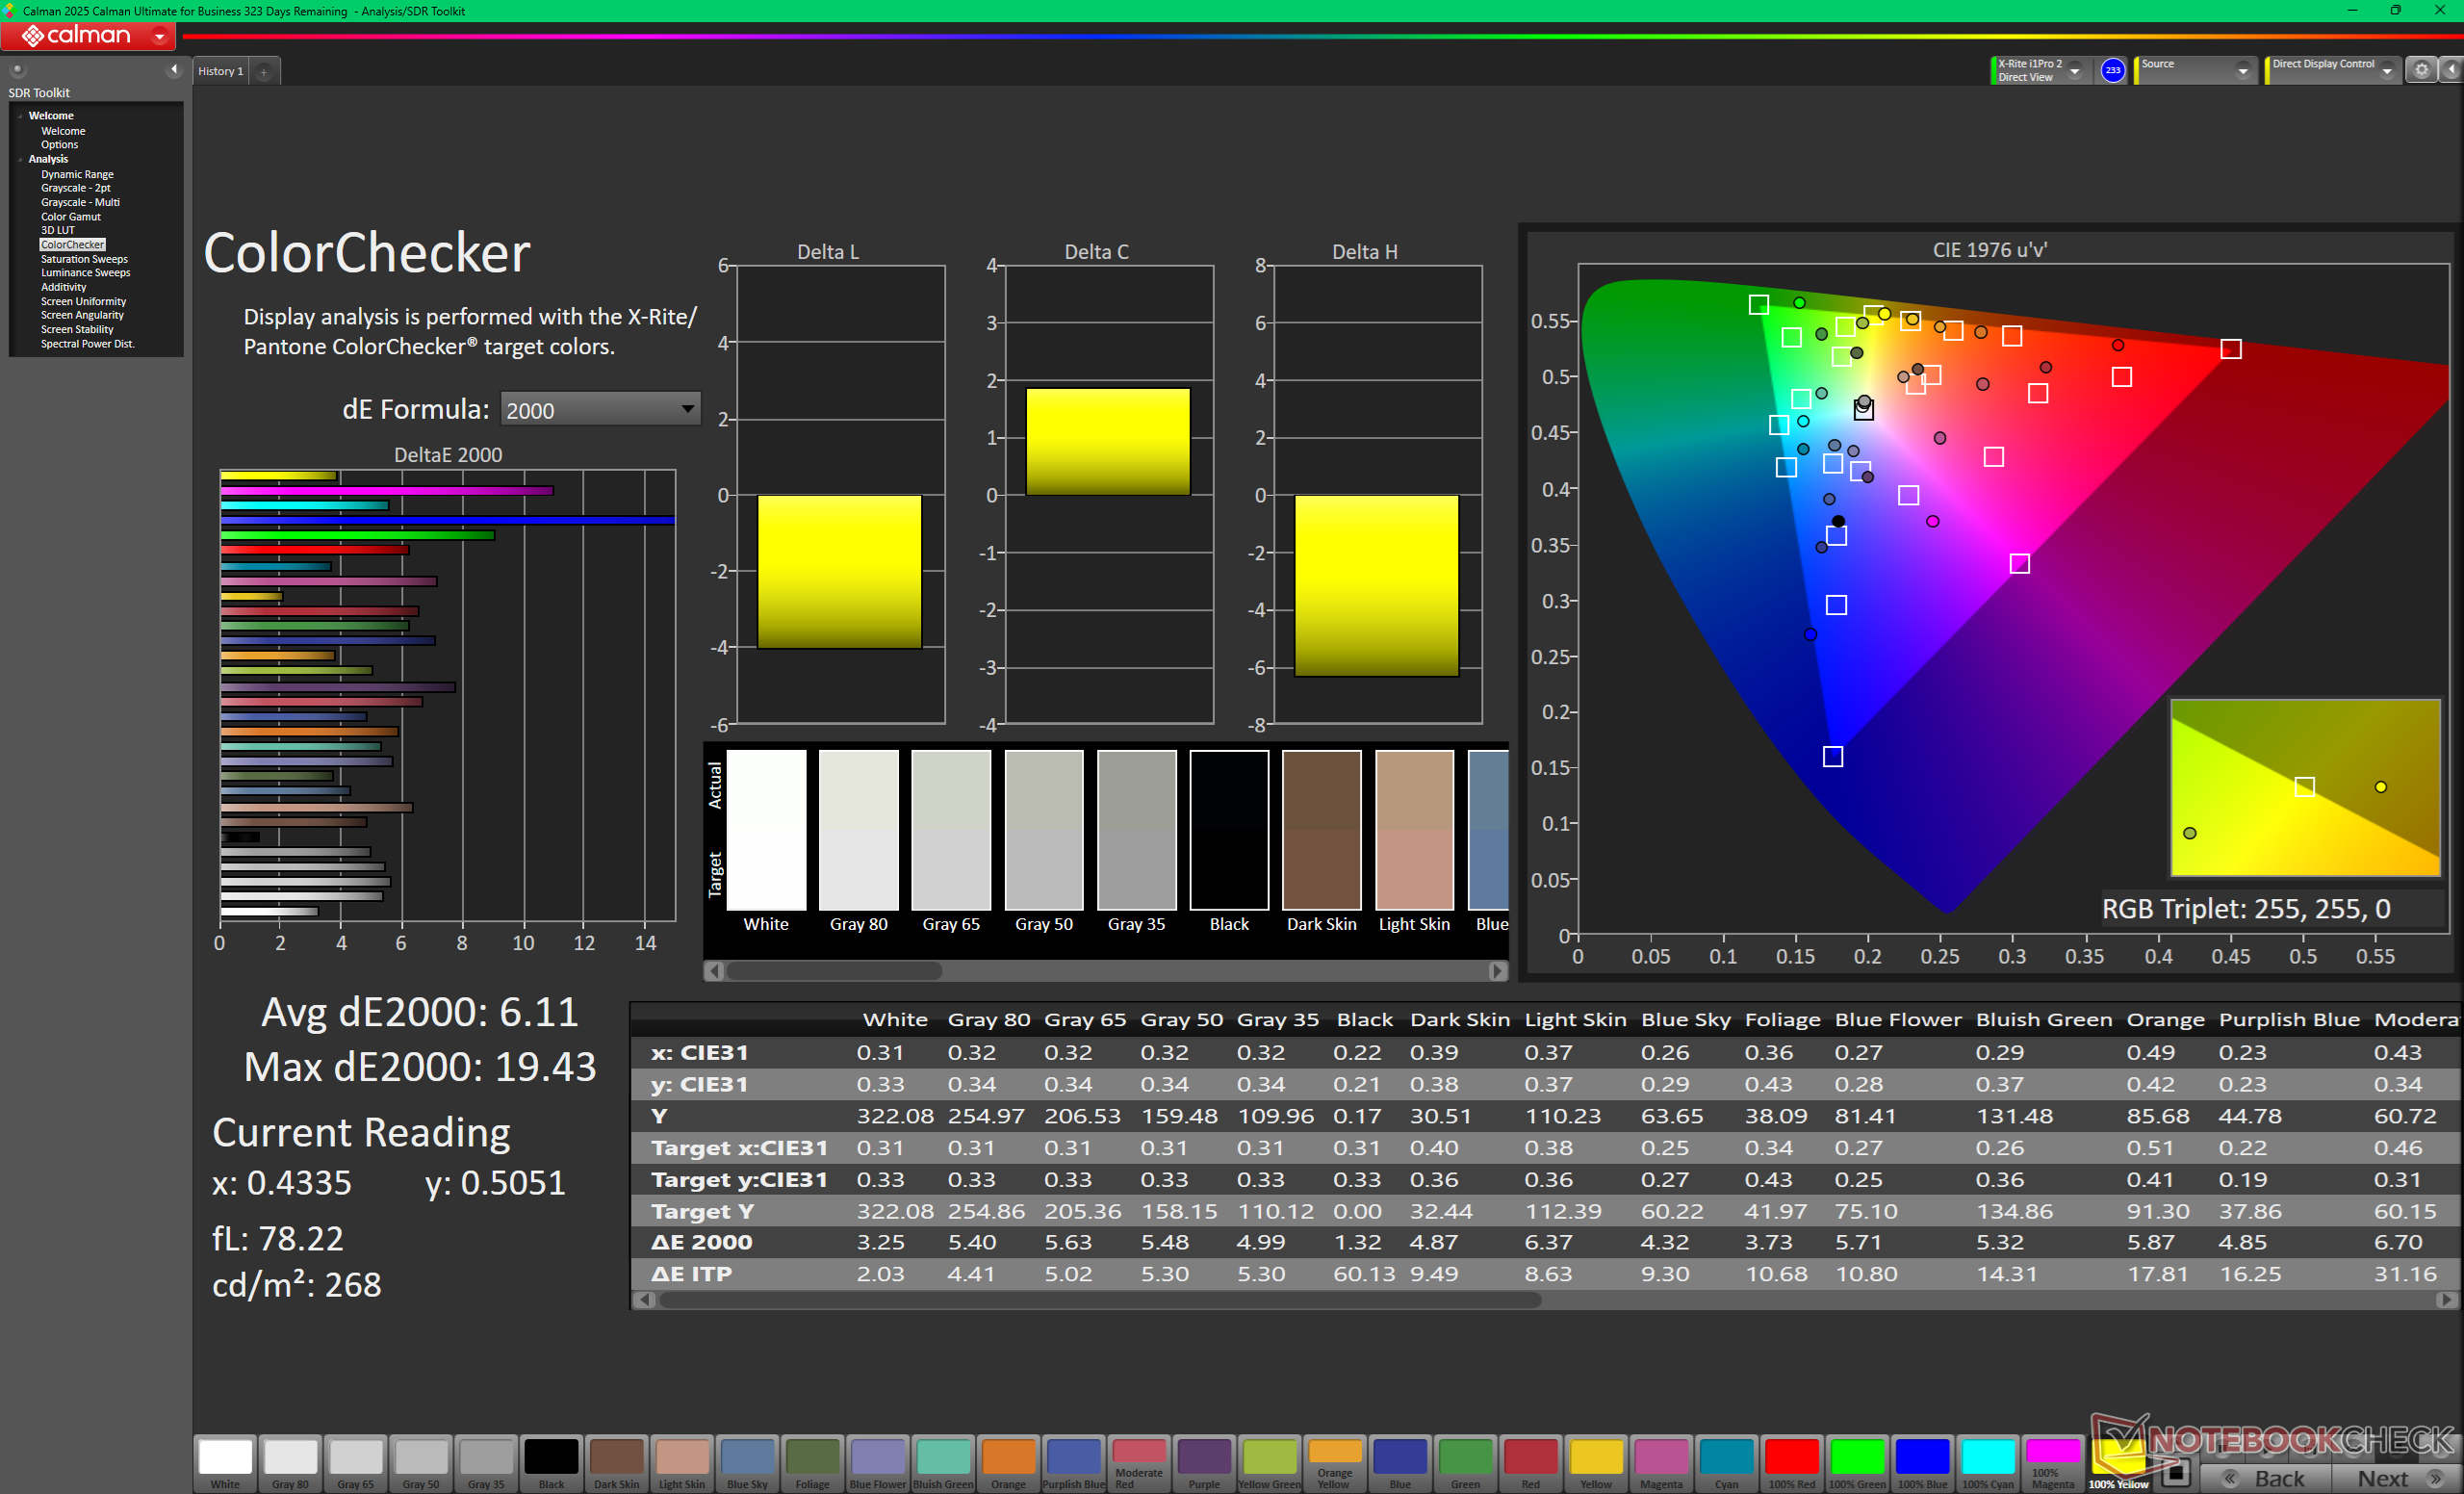
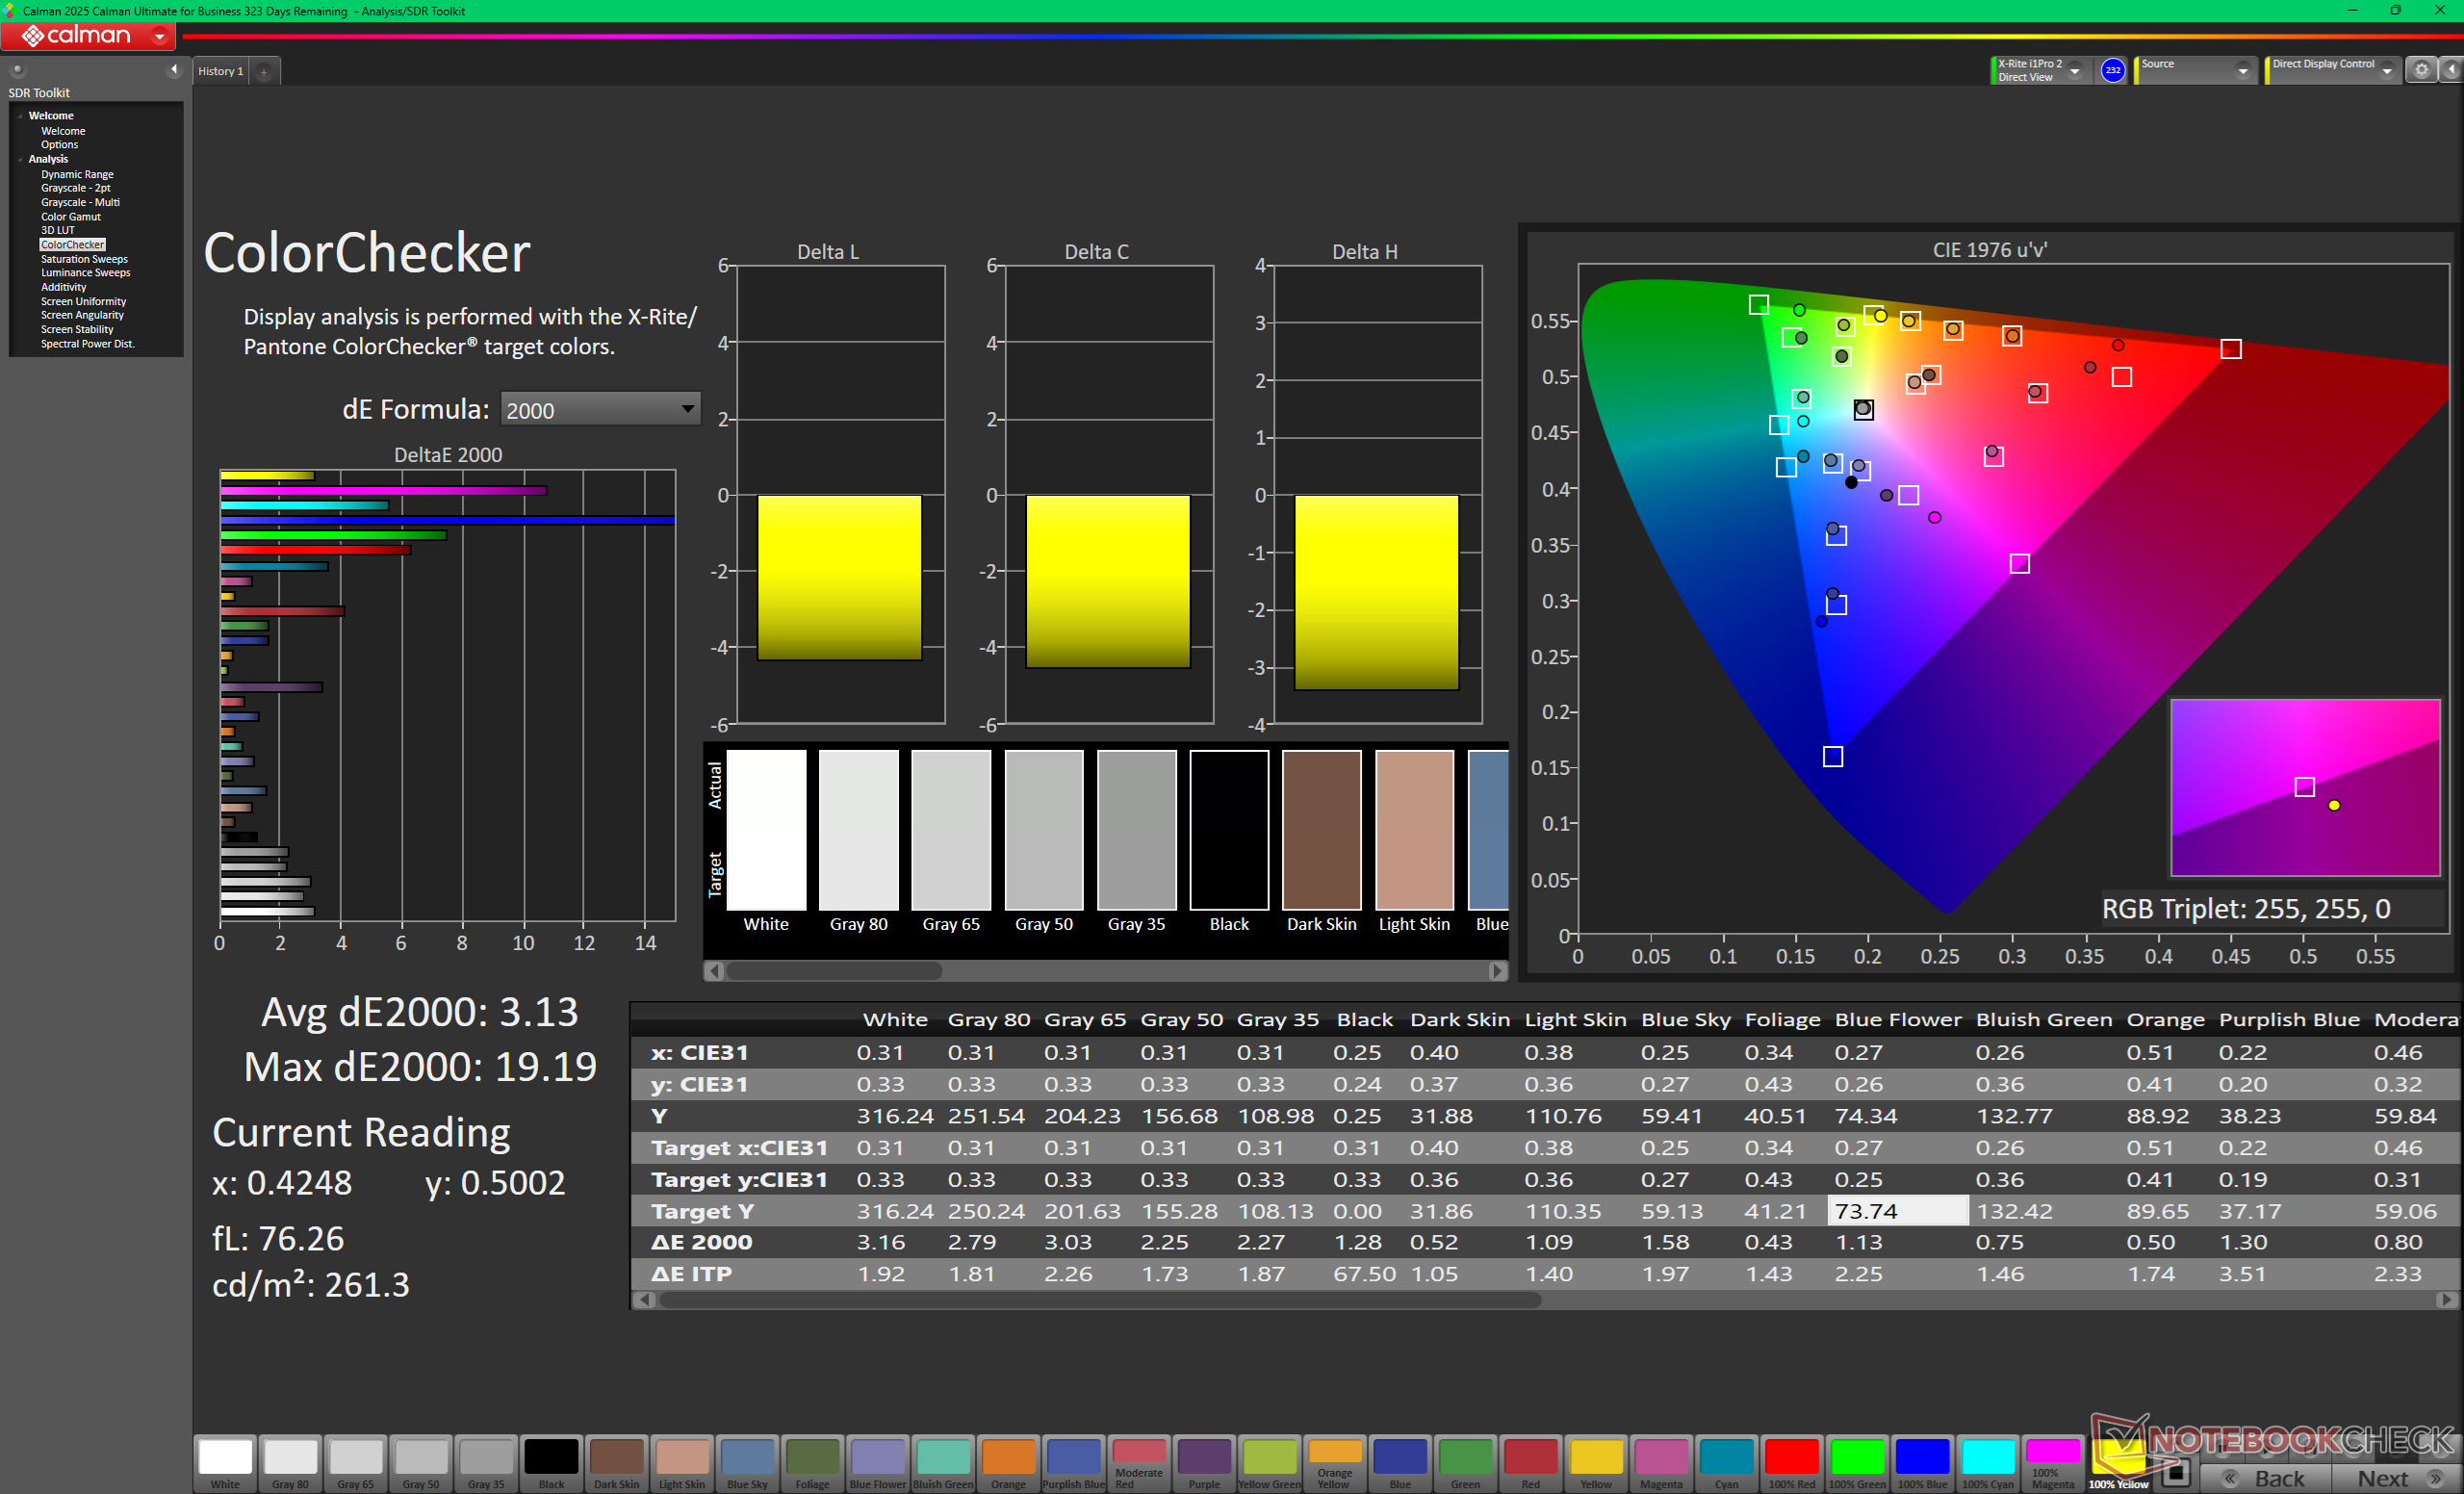
ΔE ColorChecker Calman: 6.11 | ∀{0.5-29.43 Ø4.72}
calibrated: 3.13
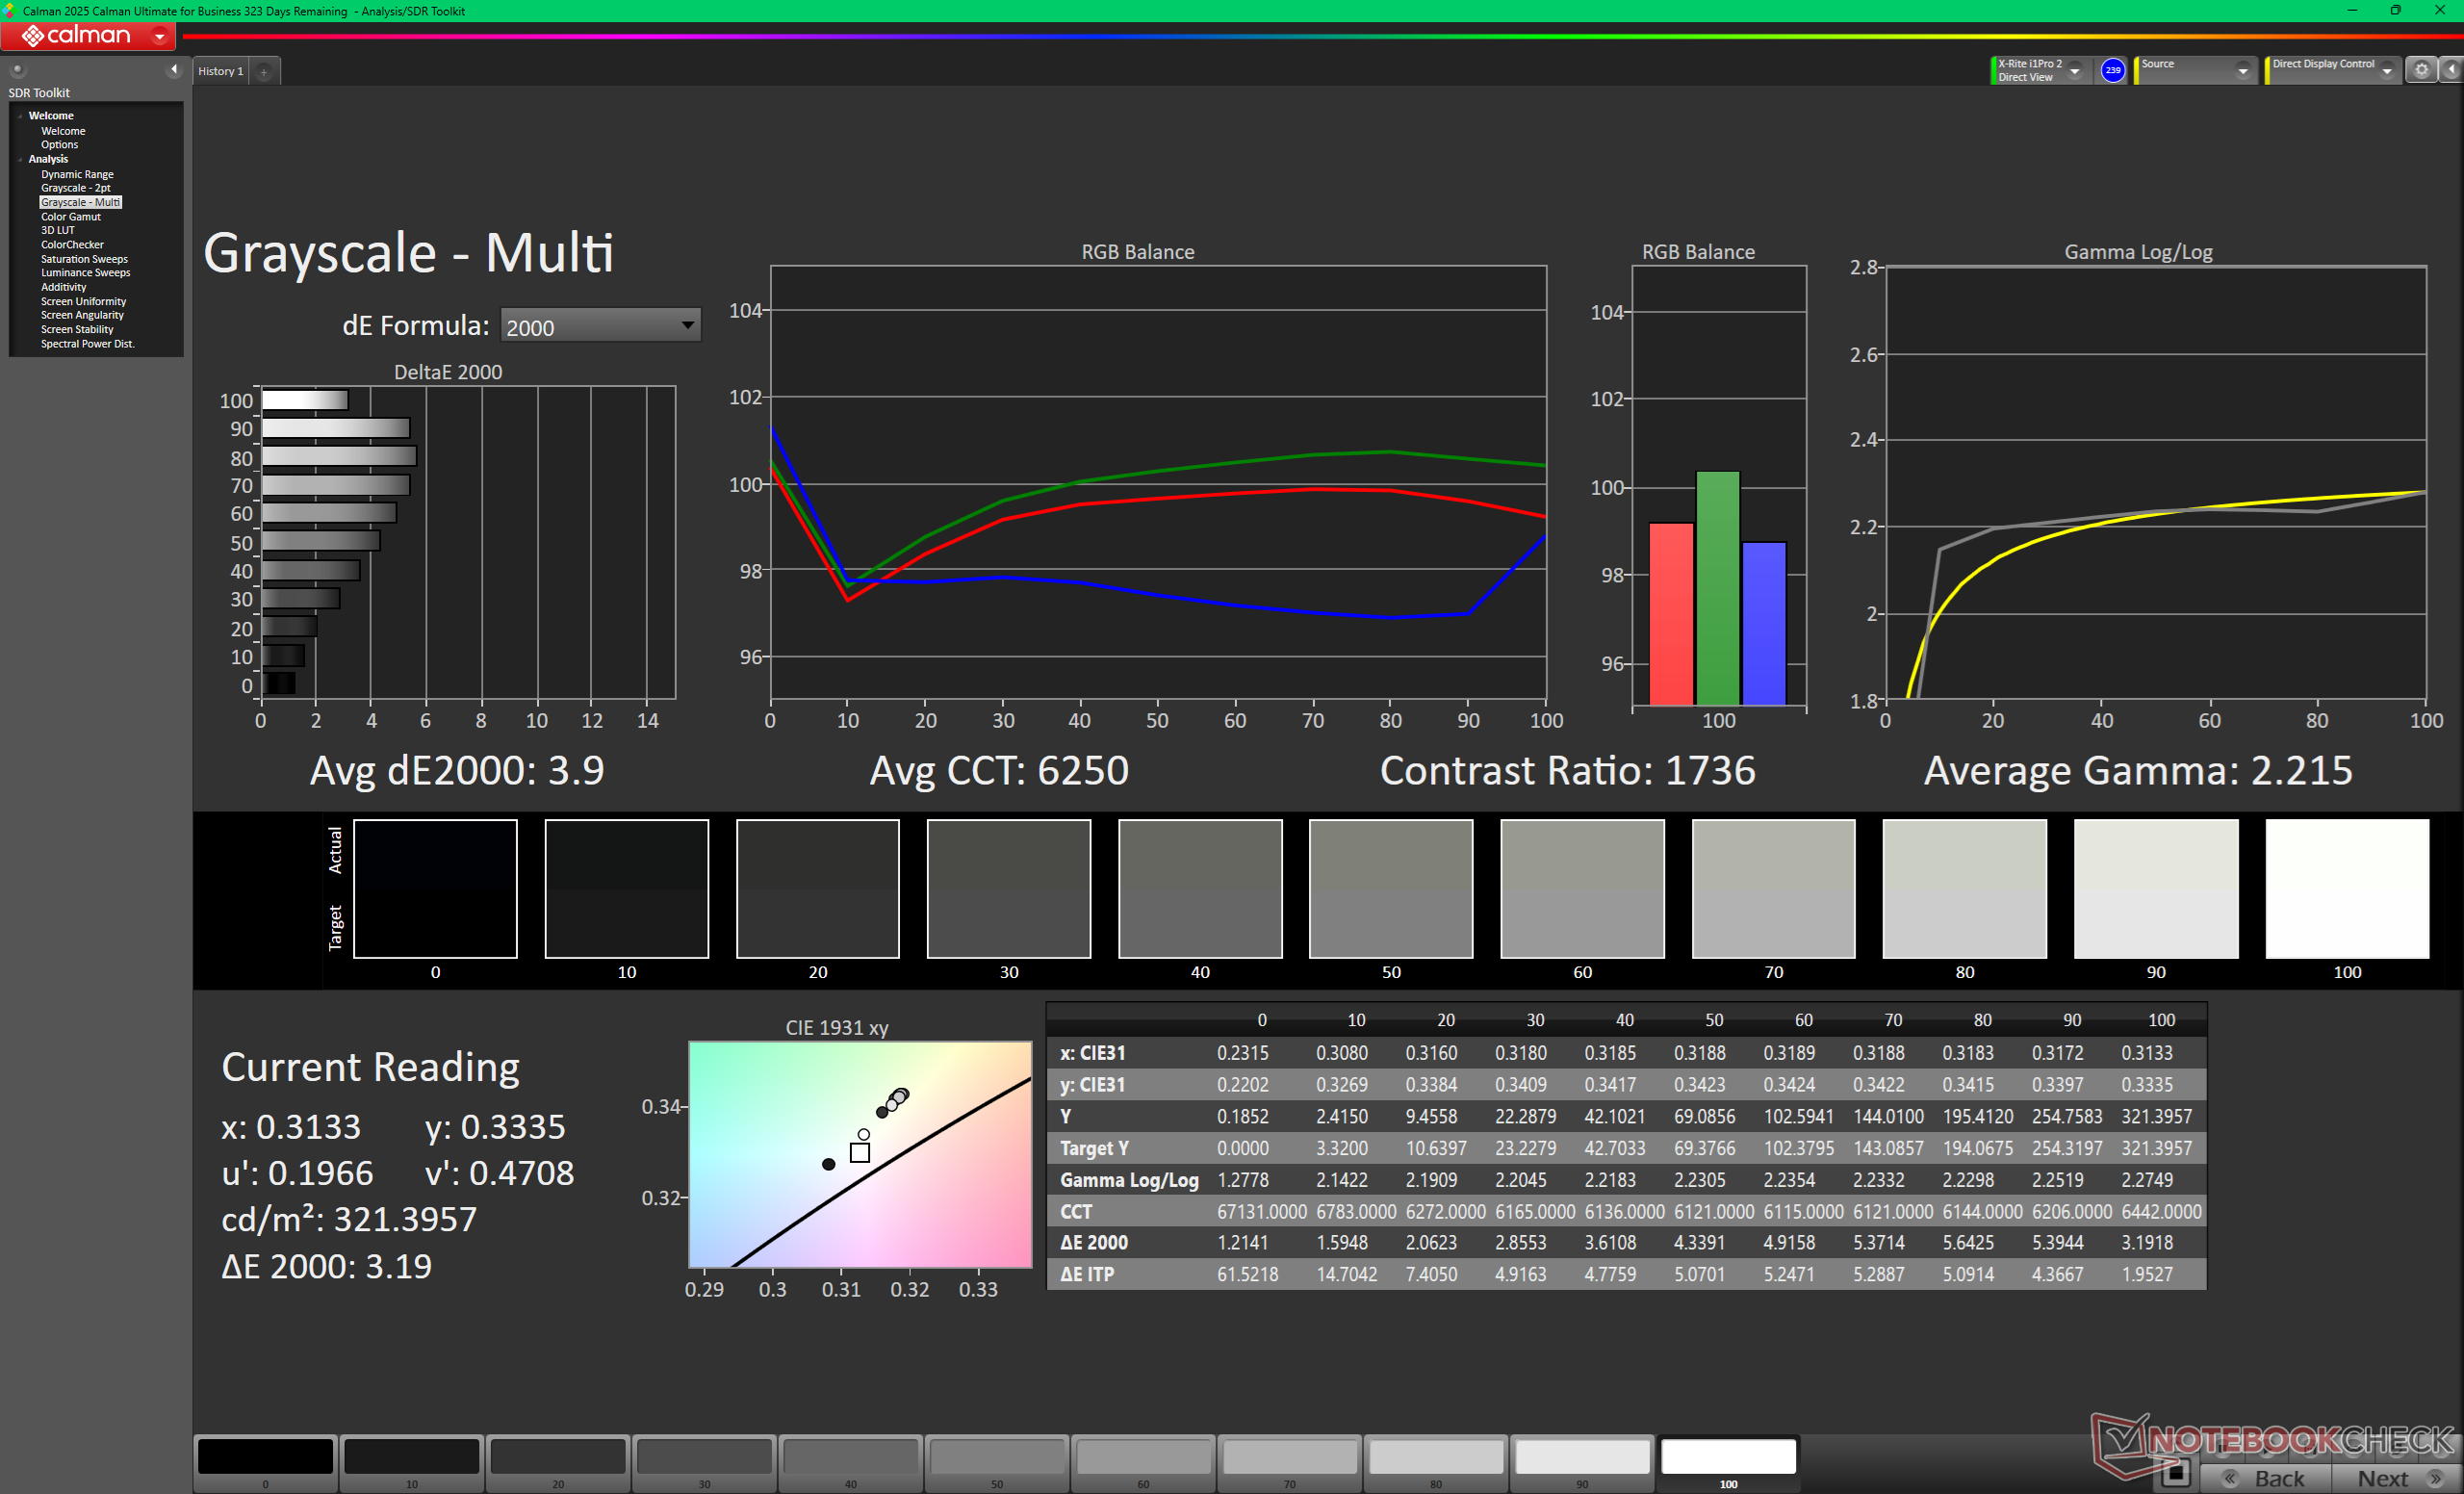
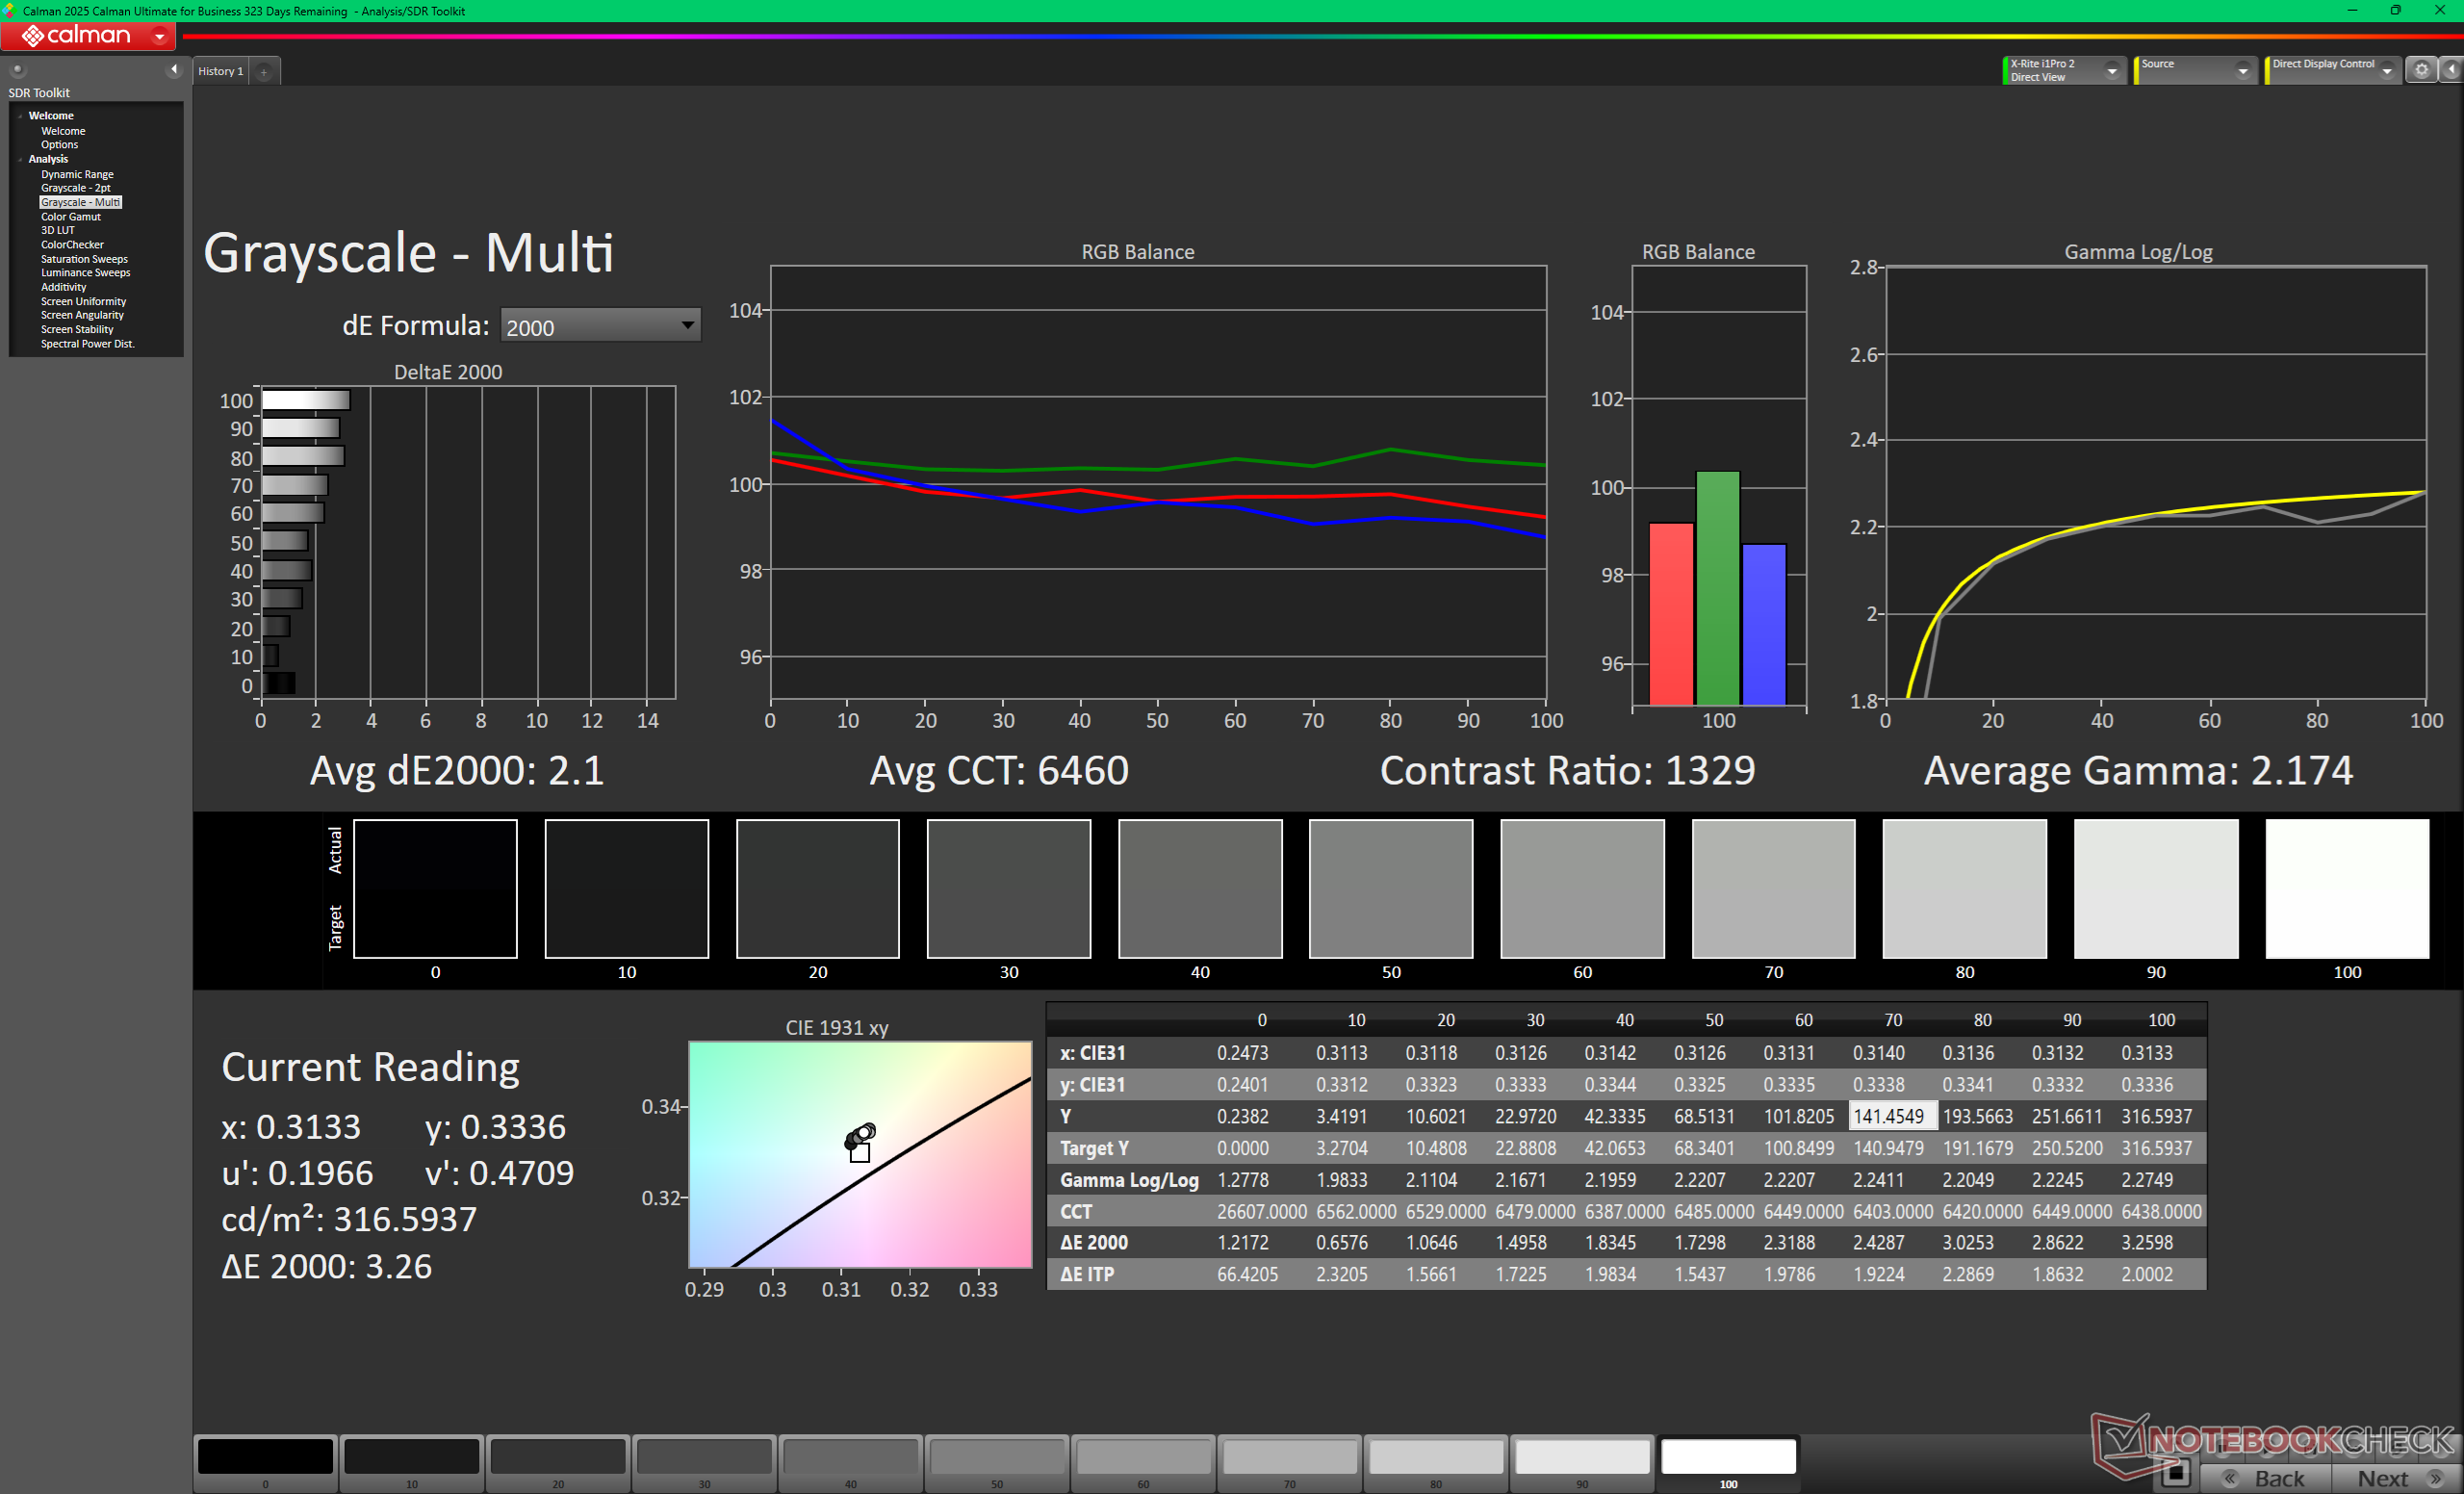
ΔE Greyscale Calman: 3.9 | ∀{0.09-98 Ø4.97}
40.7% AdobeRGB 1998 (Argyll 3D)
57.4% sRGB (Argyll 3D)
39.4% Display P3 (Argyll 3D)
Gamma: 2.22
CCT: 6250 K
| MSI Venture 16 AI A2HMTG BOE0D3E, IPS, 1920x1200, 16", 60 Hz | MSI Prestige 16 B1MG-001US AU Optronics B160QAN03.R, IPS, 2560x1600, 16", 60 Hz | Dell 16 Plus 2-in-1 AU Optronics B160QAT, Mini-LED, 2560x1600, 16", 90 Hz | Asus V16 V3607V MNG007QX2-2, IPS, 1920x1200, 16", 144 Hz | HP Pavilion 16-ag0057ng CMN1640, IPS, 1920x1200, 16", 60 Hz | Lenovo IdeaPad Slim 5 16AKP10 Lenovo LEN160WUM, IPS, 1920x1200, 16", 60 Hz | |
|---|---|---|---|---|---|---|
| Display | 109% | 119% | 4% | 7% | -1% | |
| Display P3 Coverage (%) | 39.4 | 96.7 145% | 99.5 153% | 40.9 4% | 41.6 6% | 39.1 -1% |
| sRGB Coverage (%) | 57.4 | 99.8 74% | 100 74% | 59.7 4% | 62.4 9% | 57.6 0% |
| AdobeRGB 1998 Coverage (%) | 40.7 | 84.6 108% | 94.2 131% | 42.2 4% | 43 6% | 40.4 -1% |
| Response Times | -85% | -148% | 13% | -14% | -16% | |
| Response Time Grey 50% / Grey 80% * (ms) | 26.7 ? | 49.4 ? -85% | 48.8 ? -83% | 22.9 ? 14% | 30.7 ? -15% | 31.9 ? -19% |
| Response Time Black / White * (ms) | 18.4 ? | 33.9 ? -84% | 57.6 ? -213% | 16.1 ? 12% | 20.8 ? -13% | 20.6 ? -12% |
| PWM Frequency (Hz) | 2807 ? | |||||
| PWM Amplitude * (%) | 50 | |||||
| Screen | 18% | 49% | -27% | 0% | -13% | |
| Brightness middle (cd/m²) | 321.7 | 473.6 47% | 432.1 34% | 313.3 -3% | 324 1% | 349 8% |
| Brightness (cd/m²) | 306 | 456 49% | 426 39% | 298 -3% | 295 -4% | 332 8% |
| Brightness Distribution (%) | 91 | 87 -4% | 97 7% | 88 -3% | 88 -3% | 91 0% |
| Black Level * (cd/m²) | 0.18 | 0.19 -6% | 0.5 -178% | 0.2 -11% | 0.33 -83% | |
| Contrast (:1) | 1787 | 2493 40% | 627 -65% | 1620 -9% | 1058 -41% | |
| Colorchecker dE 2000 * | 6.11 | 5.9 3% | 1.95 68% | 6.09 -0% | 5.13 16% | 5.57 9% |
| Colorchecker dE 2000 max. * | 19.43 | 9.37 52% | 3.87 80% | 19.31 1% | 16.11 17% | 19.96 -3% |
| Colorchecker dE 2000 calibrated * | 3.13 | 0.89 72% | 1.16 63% | 2.63 16% | 2.99 4% | 4.52 -44% |
| Greyscale dE 2000 * | 3.9 | 7.3 -87% | 2 49% | 4.1 -5% | 4.24 -9% | 2.7 31% |
| Gamma | 2.22 99% | 1.9 116% | 2.3 96% | 2.18 101% | 2.3 96% | 2.129 103% |
| CCT | 6250 104% | 7260 90% | 6222 104% | 6031 108% | 7318 89% | 6656 98% |
| Toplam Ortalama (Program / Ayarlar) | 14% /
23% | 7% /
34% | -3% /
-14% | -2% /
-0% | -10% /
-11% |
* ... daha küçük daha iyidir
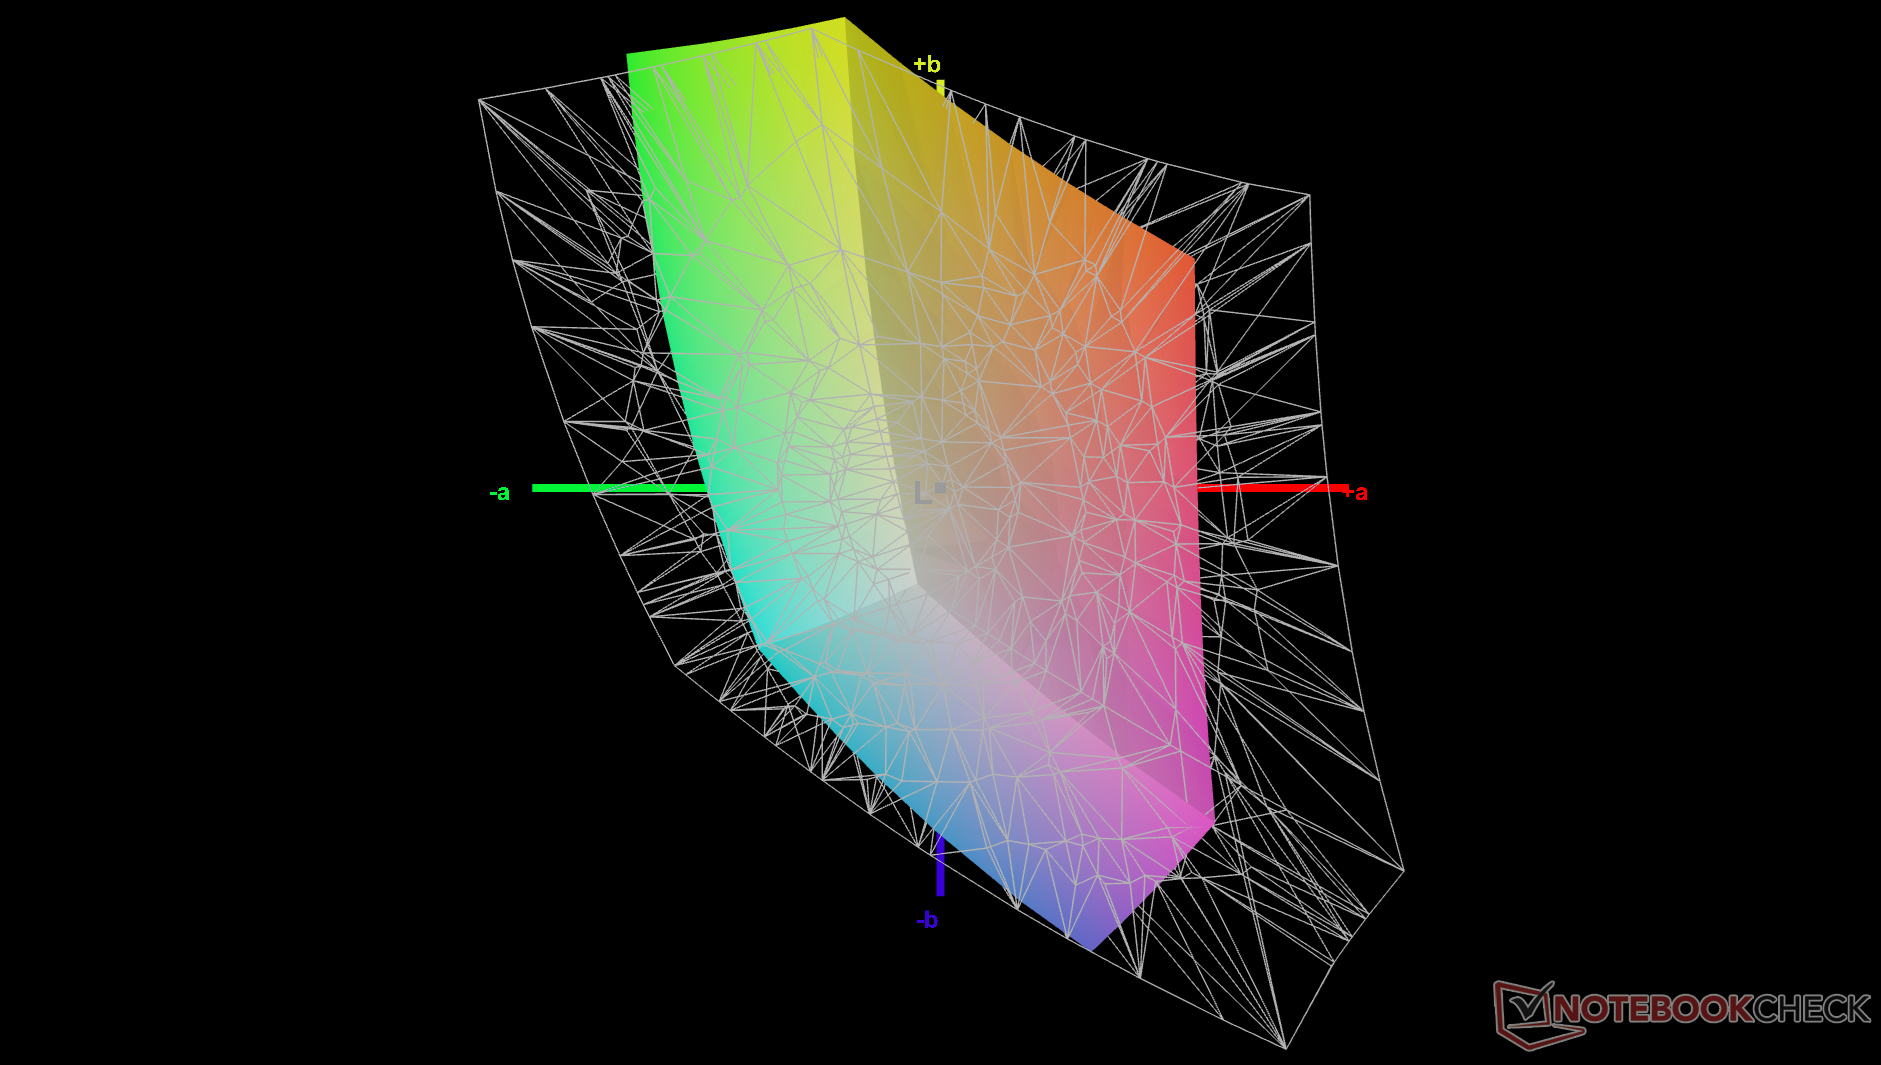
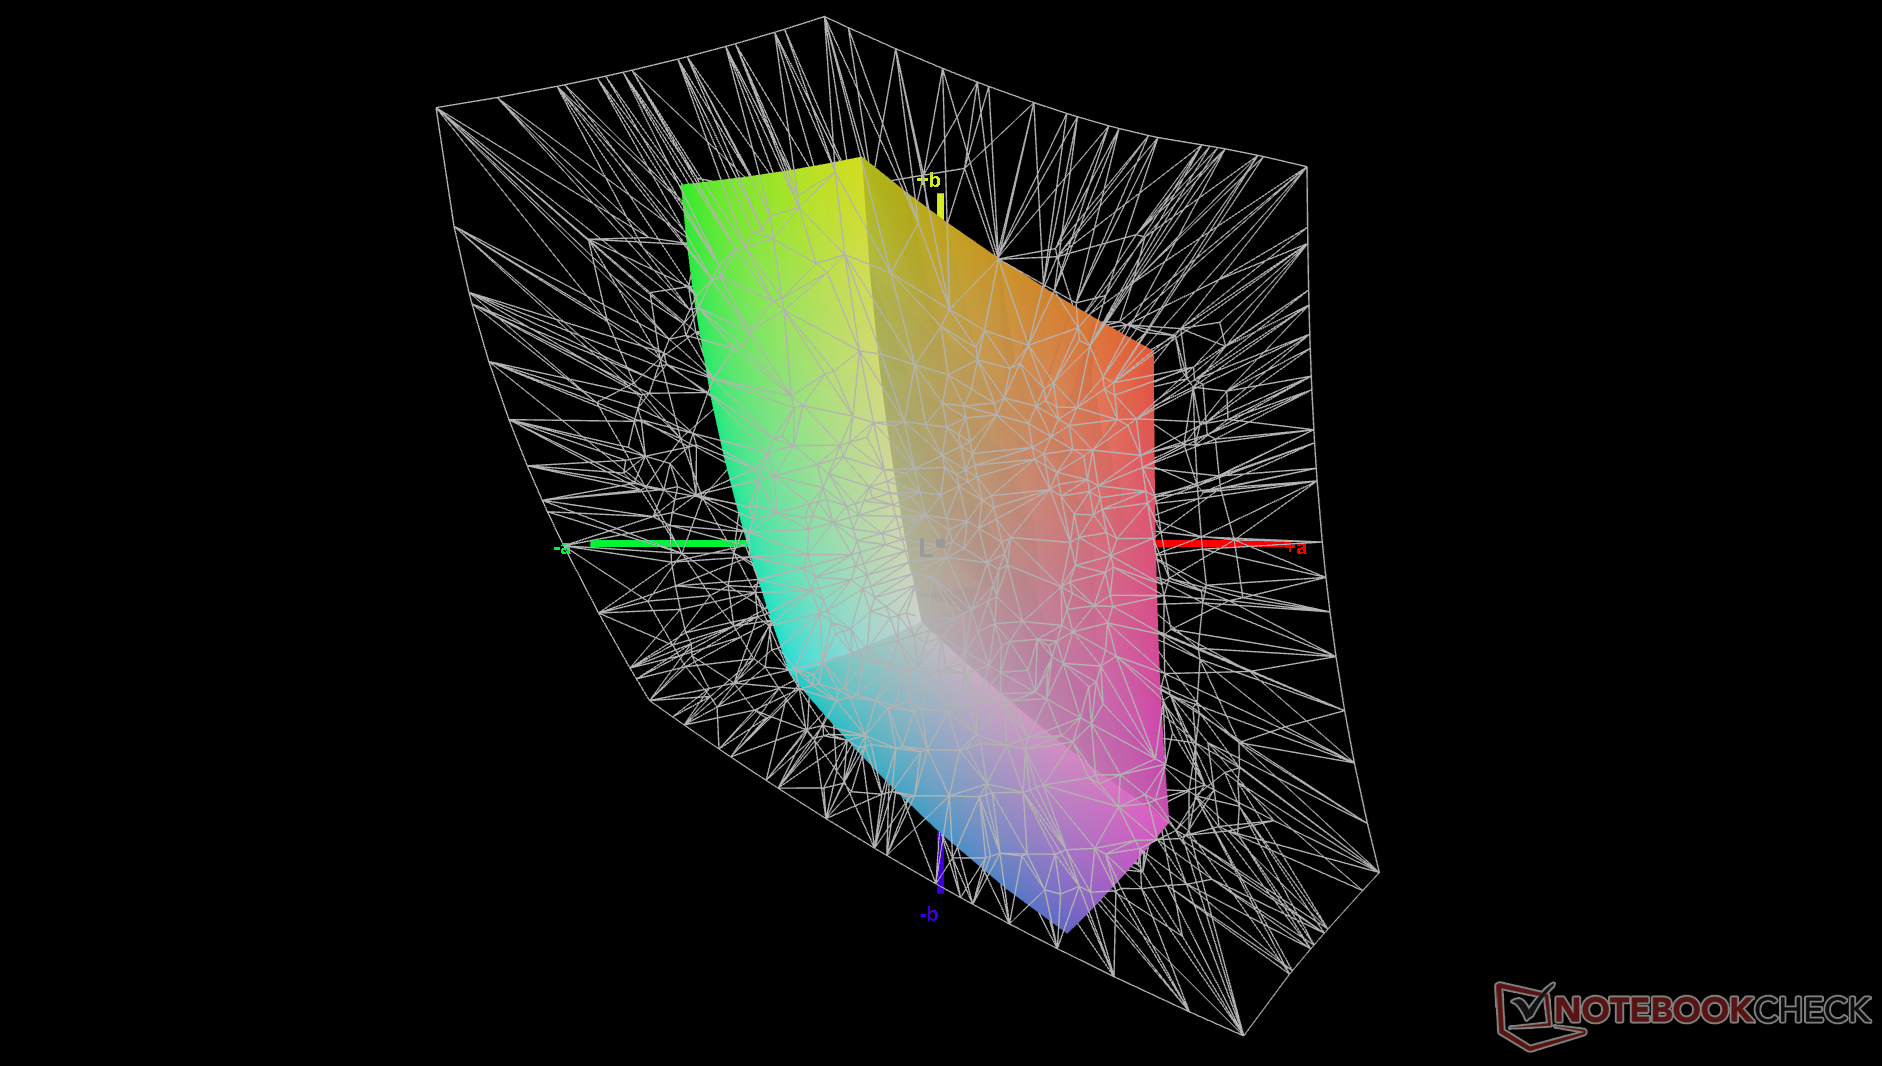
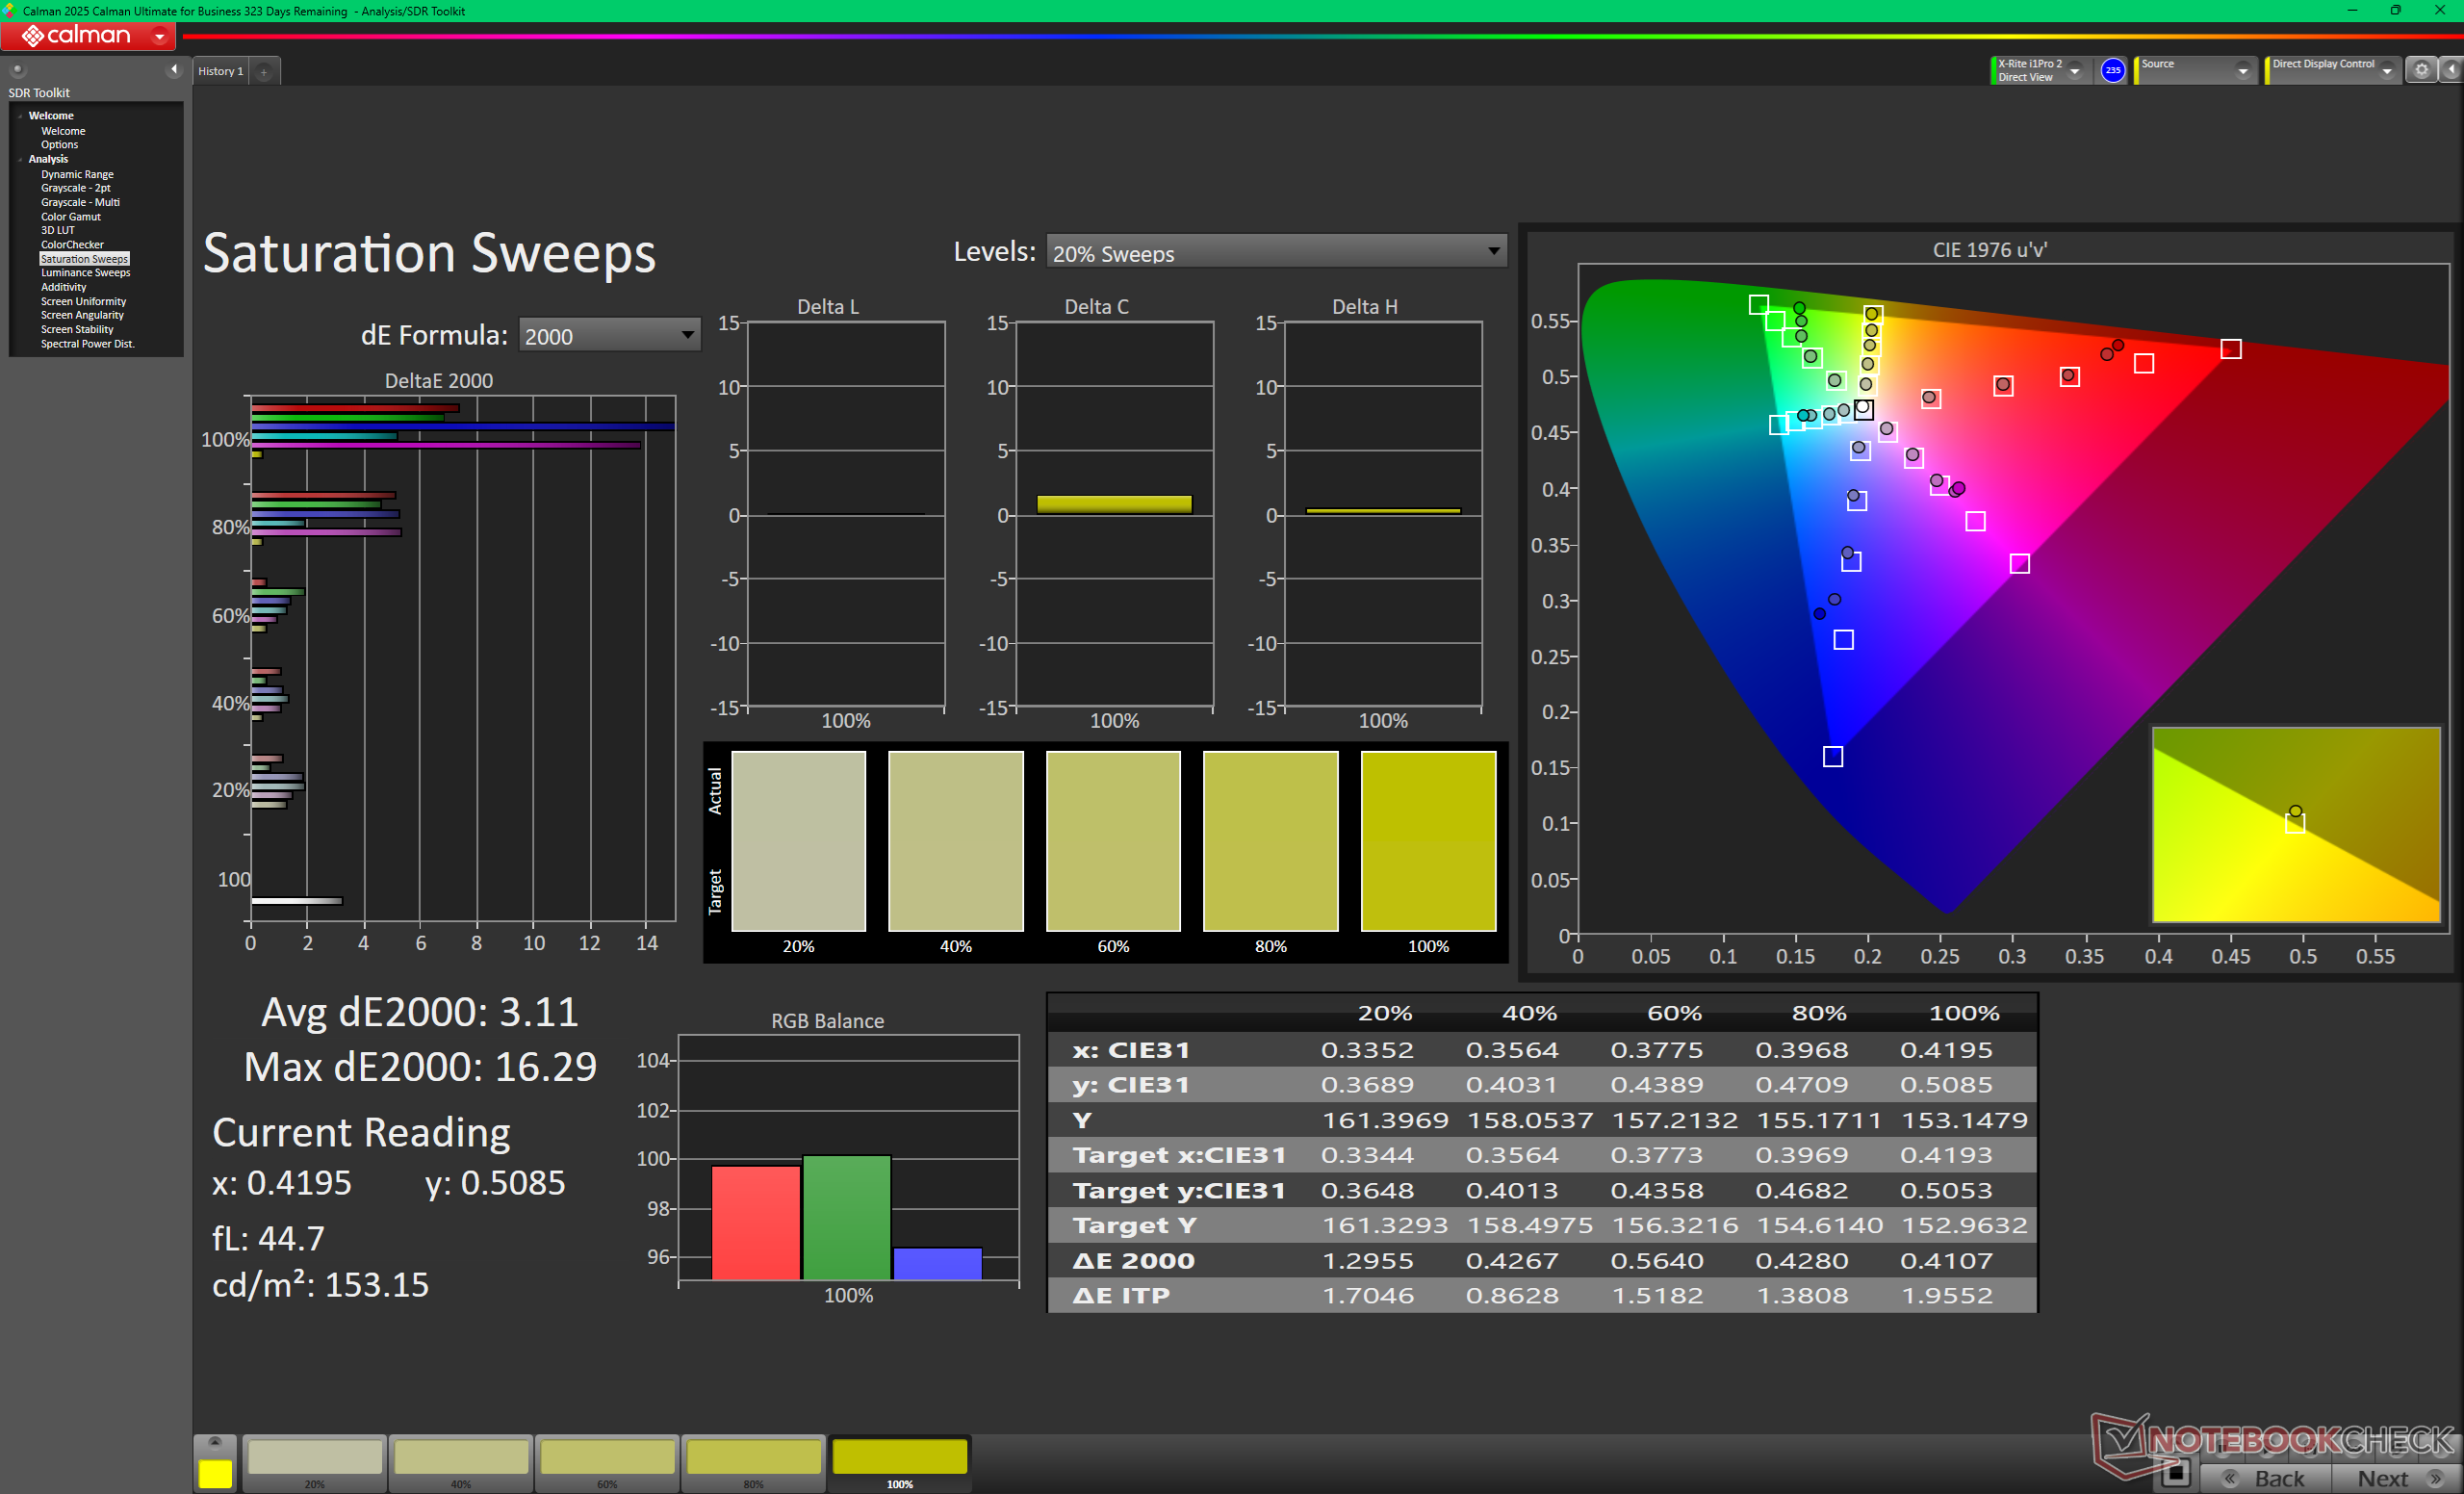
Ekran, ekonomik bir modelden bekleneceği üzere kalibre edilmiş olarak gelmiyor. Özellikle renk sıcaklığı 6250K ile sıcak tarafta olmasına rağmen ortalama gri tonlama deltaE değeri sadece 3.9 ile nispeten düşük. Aşağıdaki CalMAN ekran görüntülerinde gösterildiği gibi sınırlı sRGB kapsamı nedeniyle tamamen olmasa da paneli kendimiz kalibre ederek bu endişeleri gideriyoruz. Kalibre edilmiş ICM profilimiz yukarıda ücretsiz olarak indirilebilir.
Yanıt Sürelerini Görüntüle
| ↔ Tepki Süresi Siyahtan Beyaza | ||
|---|---|---|
| 18.4 ms ... yükseliş ↗ ve sonbahar↘ birleşimi | ↗ 9.9 ms yükseliş | 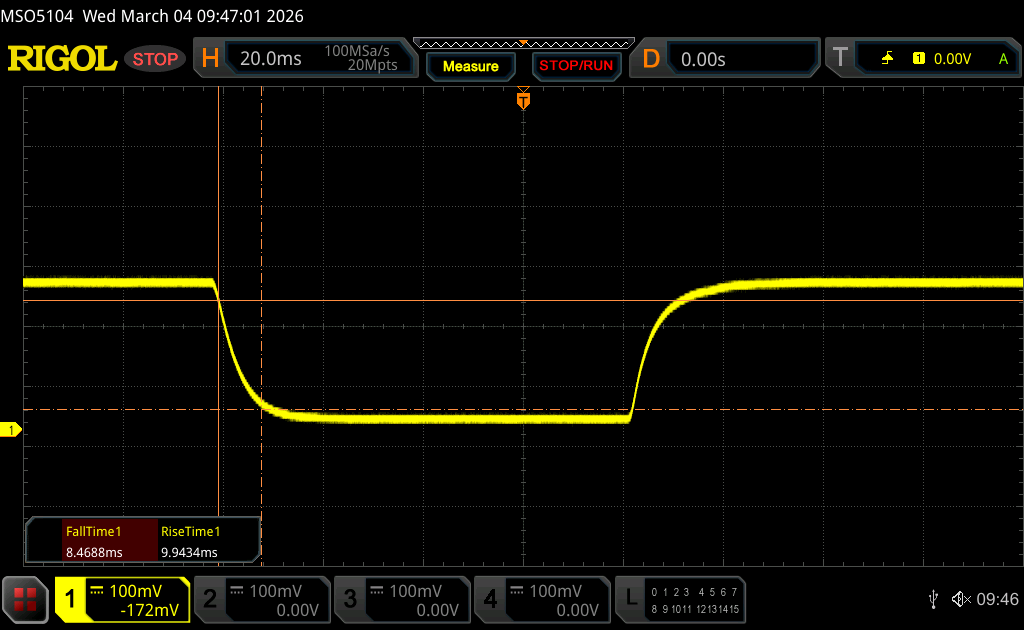 |
| ↘ 8.5 ms sonbahar | ||
| Ekran, testlerimizde iyi yanıt oranları gösteriyor ancak rekabetçi oyuncular için çok yavaş olabilir. Karşılaştırıldığında, test edilen tüm cihazlar 0.1 (minimum) ile 240 (maksimum) ms arasında değişir. » Tüm cihazların 41 %'si daha iyi. Bu, ölçülen yanıt süresinin test edilen tüm cihazların ortalamasına benzer olduğu anlamına gelir (19.8 ms). | ||
| ↔ Tepki Süresi %50 Griden %80 Griye | ||
| 26.7 ms ... yükseliş ↗ ve sonbahar↘ birleşimi | ↗ 12.9 ms yükseliş | 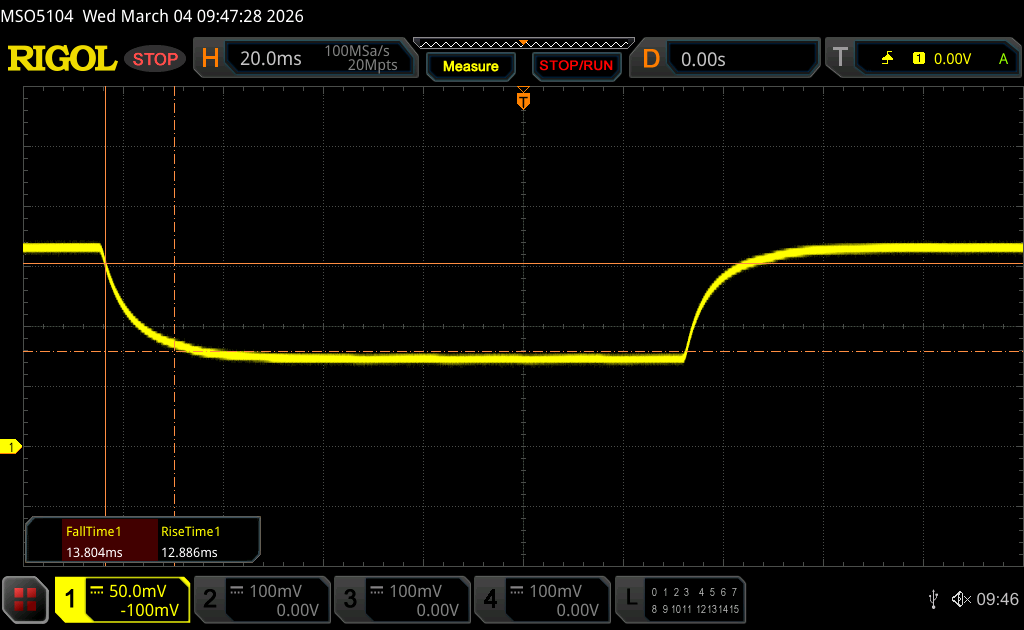 |
| ↘ 13.8 ms sonbahar | ||
| Ekran, testlerimizde nispeten yavaş yanıt oranları gösteriyor ve oyuncular için çok yavaş olabilir. Karşılaştırıldığında, test edilen tüm cihazlar 0.165 (minimum) ile 636 (maksimum) ms arasında değişir. » Tüm cihazların 37 %'si daha iyi. Bu, ölçülen yanıt süresinin test edilen tüm cihazların ortalamasından (31 ms) daha iyi olduğu anlamına gelir. | ||
Ekran Titremesi / PWM (Darbe Genişliği Modülasyonu)
| Ekran titriyor / PWM algılanmadı | 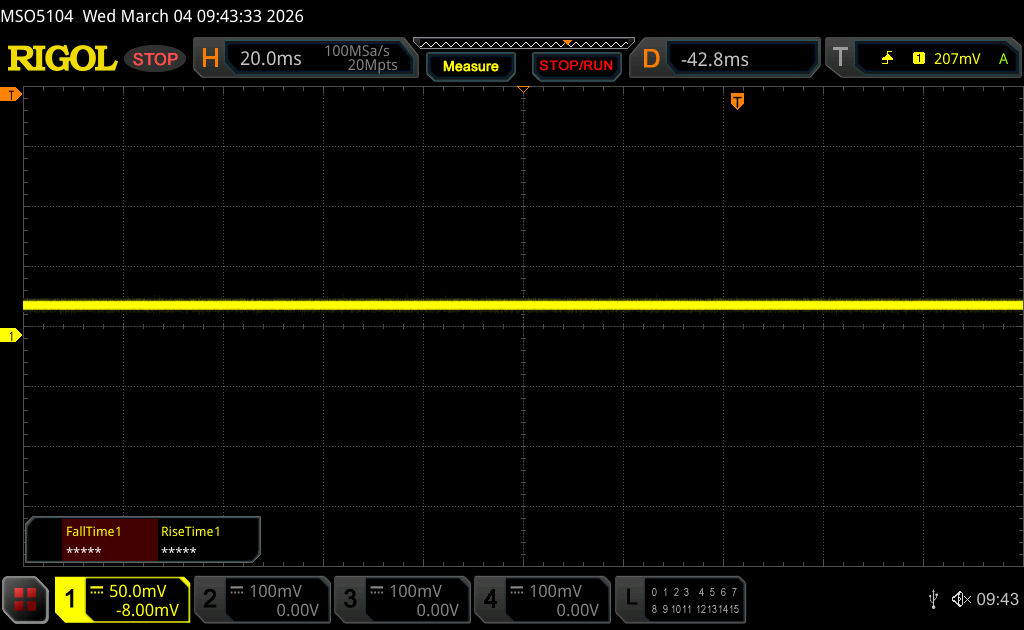 | ||
Karşılaştırıldığında: Test edilen tüm cihazların %52 %'si ekranı karartmak için PWM kullanmıyor. PWM tespit edilirse, ortalama 7747 (minimum: 5 - maksimum: 343500) Hz ölçüldü. | |||
Performans
Test Koşulları
Aşağıdaki kıyaslamaları çalıştırmadan önce hem Windows'u hem de MSI Center'ı Performans moduna ayarladık.
İşlemci
Ham çoklu iş parçacığı performansı Core Ultra 7 255H 'den yaklaşık yüzde 15 ila 20 daha hızlıdır Core Ultra 7 155H prestige 16'da yıldan yıla makul bir artışı temsil ediyor. Bununla birlikte, aynı Core Ultra 7 255H işlemciye sahip diğer dizüstü bilgisayarlarla karşılaştırıldığında, MSI sadece birkaç yüzde puanla biraz geride kalıyor.
Yükseltme Core Ultra 9 285H yapılandırmasının, aşağıdaki karşılaştırma tablosunda gösterildiği gibi çoklu iş parçacığı performansını yüzde 15 ila 25 oranında artırması beklenmektedir.
Cinebench R15 Çoklu Döngü
Cinebench R23: Multi Core | Single Core
Cinebench R20: CPU (Multi Core) | CPU (Single Core)
Cinebench R15: CPU Multi 64Bit | CPU Single 64Bit
Blender: v2.79 BMW27 CPU
7-Zip 18.03: 7z b 4 | 7z b 4 -mmt1
Geekbench 6.7: Multi-Core | Single-Core
Geekbench 5.5: Multi-Core | Single-Core
HWBOT x265 Benchmark v2.2: 4k Preset
LibreOffice : 20 Documents To PDF
R Benchmark 2.5: Overall mean
| HWBOT x265 Benchmark v2.2 / 4k Preset | |
| MSI Prestige 16 AI Evo B2HMG | |
| MSI Venture 16 AI A2HMTG | |
| Asus ZenBook S16 UM5606GA | |
| Ortalama Intel Core Ultra 7 255H (13.7 - 26.5, n=19) | |
| Acer Swift Go 16 AI SFG16-61-R5Y5 | |
| Asus ExpertBook B5 B5605CCA | |
| MSI Prestige 16 B1MG-001US | |
| Asus V16 V3607V | |
| Dynabook Tecra A60 A65-M | |
| Dell 16 Plus 2-in-1 | |
| HP Pavilion 16-ag0057ng | |
| Lenovo IdeaPad Slim 5 16AKP10 | |
* ... daha küçük daha iyidir
AIDA64: FP32 Ray-Trace | FPU Julia | CPU SHA3 | CPU Queen | FPU SinJulia | FPU Mandel | CPU AES | CPU ZLib | FP64 Ray-Trace | CPU PhotoWorxx | CPU CheckMate
| Performance rating | |
| MSI Venture 16 AI A2HMTG -1! | |
| Ortalama Intel Core Ultra 7 255H | |
| MSI Prestige 16 B1MG-001US -1! | |
| HP Pavilion 16-ag0057ng -1! | |
| Asus V16 V3607V -1! | |
| Dell 16 Plus 2-in-1 -1! | |
| Lenovo IdeaPad Slim 5 16AKP10 -1! | |
| AIDA64 / FP32 Ray-Trace | |
| Ortalama Intel Core Ultra 7 255H (13863 - 24741, n=17) | |
| MSI Venture 16 AI A2HMTG (v8.20.8100) | |
| HP Pavilion 16-ag0057ng (v6.92.6600) | |
| MSI Prestige 16 B1MG-001US (v6.92.6600) | |
| Asus V16 V3607V (v6.92.6600) | |
| Lenovo IdeaPad Slim 5 16AKP10 (v6.92.6600) | |
| Dell 16 Plus 2-in-1 (v6.92.6600) | |
| AIDA64 / FPU Julia | |
| MSI Venture 16 AI A2HMTG (v8.20.8100) | |
| Ortalama Intel Core Ultra 7 255H (71030 - 119222, n=17) | |
| MSI Prestige 16 B1MG-001US (v6.92.6600) | |
| HP Pavilion 16-ag0057ng (v6.92.6600) | |
| Asus V16 V3607V (v6.92.6600) | |
| Dell 16 Plus 2-in-1 (v6.92.6600) | |
| Lenovo IdeaPad Slim 5 16AKP10 (v6.92.6600) | |
| AIDA64 / CPU SHA3 | |
| Ortalama Intel Core Ultra 7 255H (3408 - 5548, n=17) | |
| MSI Venture 16 AI A2HMTG (v8.20.8100) | |
| MSI Prestige 16 B1MG-001US (v6.92.6600) | |
| HP Pavilion 16-ag0057ng (v6.92.6600) | |
| Asus V16 V3607V (v6.92.6600) | |
| Dell 16 Plus 2-in-1 (v6.92.6600) | |
| Lenovo IdeaPad Slim 5 16AKP10 (v6.92.6600) | |
| AIDA64 / CPU Queen | |
| MSI Prestige 16 B1MG-001US (v6.92.6600) | |
| Asus V16 V3607V (v6.92.6600) | |
| HP Pavilion 16-ag0057ng (v6.92.6600) | |
| Ortalama Intel Core Ultra 7 255H (59098 - 68460, n=16) | |
| Dell 16 Plus 2-in-1 (v6.92.6600) | |
| Lenovo IdeaPad Slim 5 16AKP10 (v6.92.6600) | |
| AIDA64 / FPU SinJulia | |
| MSI Prestige 16 B1MG-001US (v6.92.6600) | |
| HP Pavilion 16-ag0057ng (v6.92.6600) | |
| Asus V16 V3607V (v6.92.6600) | |
| MSI Venture 16 AI A2HMTG (v8.20.8100) | |
| Ortalama Intel Core Ultra 7 255H (6716 - 9006, n=17) | |
| Lenovo IdeaPad Slim 5 16AKP10 (v6.92.6600) | |
| Dell 16 Plus 2-in-1 (v6.92.6600) | |
| AIDA64 / FPU Mandel | |
| MSI Venture 16 AI A2HMTG (v8.20.8100) | |
| Ortalama Intel Core Ultra 7 255H (37031 - 63347, n=17) | |
| MSI Prestige 16 B1MG-001US (v6.92.6600) | |
| HP Pavilion 16-ag0057ng (v6.92.6600) | |
| Asus V16 V3607V (v6.92.6600) | |
| Dell 16 Plus 2-in-1 (v6.92.6600) | |
| Lenovo IdeaPad Slim 5 16AKP10 (v6.92.6600) | |
| AIDA64 / CPU AES | |
| MSI Prestige 16 B1MG-001US (v6.92.6600) | |
| Ortalama Intel Core Ultra 7 255H (58402 - 83568, n=17) | |
| MSI Venture 16 AI A2HMTG (v8.20.8100) | |
| Asus V16 V3607V (v6.92.6600) | |
| HP Pavilion 16-ag0057ng (v6.92.6600) | |
| Dell 16 Plus 2-in-1 (v6.92.6600) | |
| Lenovo IdeaPad Slim 5 16AKP10 (v6.92.6600) | |
| AIDA64 / CPU ZLib | |
| Ortalama Intel Core Ultra 7 255H (822 - 1316, n=17) | |
| MSI Prestige 16 B1MG-001US (v6.92.6600) | |
| MSI Venture 16 AI A2HMTG (v8.20.8100) | |
| Asus V16 V3607V (v6.92.6600) | |
| HP Pavilion 16-ag0057ng (v6.92.6600) | |
| Dell 16 Plus 2-in-1 (v6.92.6600) | |
| Lenovo IdeaPad Slim 5 16AKP10 (v6.92.6600) | |
| AIDA64 / FP64 Ray-Trace | |
| Ortalama Intel Core Ultra 7 255H (7384 - 13231, n=17) | |
| MSI Venture 16 AI A2HMTG (v8.20.8100) | |
| HP Pavilion 16-ag0057ng (v6.92.6600) | |
| MSI Prestige 16 B1MG-001US (v6.92.6600) | |
| Asus V16 V3607V (v6.92.6600) | |
| Lenovo IdeaPad Slim 5 16AKP10 (v6.92.6600) | |
| Dell 16 Plus 2-in-1 (v6.92.6600) | |
| AIDA64 / CPU PhotoWorxx | |
| Ortalama Intel Core Ultra 7 255H (23836 - 65787, n=17) | |
| Dell 16 Plus 2-in-1 (v6.92.6600) | |
| MSI Venture 16 AI A2HMTG (v8.20.8100) | |
| MSI Prestige 16 B1MG-001US (v6.92.6600) | |
| Lenovo IdeaPad Slim 5 16AKP10 (v6.92.6600) | |
| HP Pavilion 16-ag0057ng (v6.92.6600) | |
| Asus V16 V3607V (v6.92.6600) | |
| AIDA64 / CPU CheckMate | |
| MSI Venture 16 AI A2HMTG (v8.20.8100) | |
| Ortalama Intel Core Ultra 7 255H (n=1) | |
Sistem Performansı
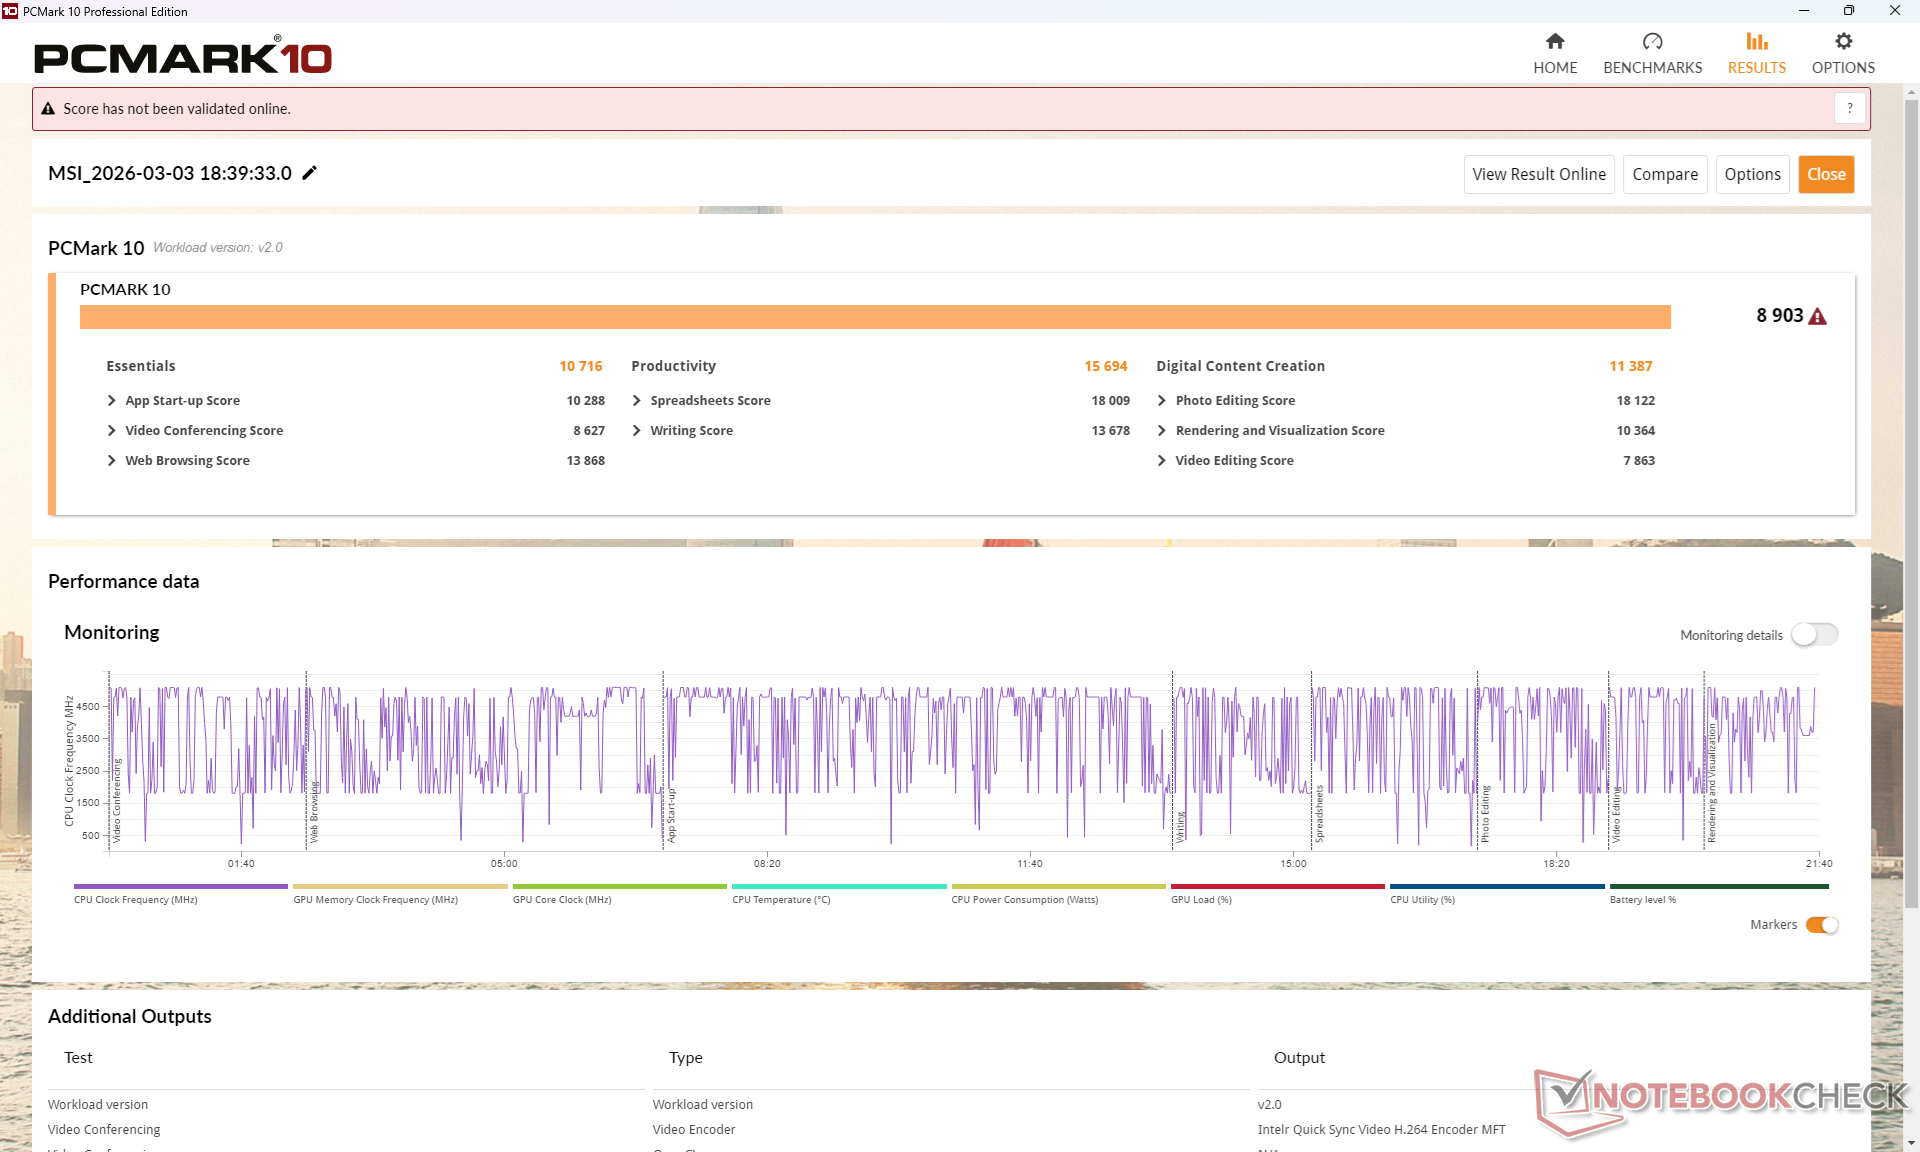
PCMark 10 skorları, güncellemeler ve birden fazla tekrar testten sonra bile alışılmadık derecede yüksek Verimlilik skoru nedeniyle ortalamanın oldukça üzerindedir. Sonuç neredeyse kesinlikle bir hatadır ve bu nedenle aşağıdaki karşılaştırma puanları bir tuz tanesi ile alınmalıdır.
PCMark 10: Score | Essentials | Productivity | Digital Content Creation
CrossMark: Overall | Productivity | Creativity | Responsiveness
WebXPRT 3: Overall
WebXPRT 4: Overall
Mozilla Kraken 1.1: Total
Geekbench AI: Single Precision GPU 1.7 | Half Precision GPU 1.7 | Quantized GPU 1.7
| Performance rating | |
| MSI Venture 16 AI A2HMTG | |
| Ortalama Intel Core Ultra 7 255H, Intel Arc Graphics 140T | |
| Dell 16 Plus 2-in-1 | |
| MSI Prestige 16 B1MG-001US -3! | |
| Asus V16 V3607V -4! | |
| HP Pavilion 16-ag0057ng -7! | |
| Lenovo IdeaPad Slim 5 16AKP10 -4! | |
| PCMark 10 / Score | |
| MSI Venture 16 AI A2HMTG | |
| Ortalama Intel Core Ultra 7 255H, Intel Arc Graphics 140T (6878 - 9156, n=13) | |
| MSI Prestige 16 B1MG-001US | |
| Dell 16 Plus 2-in-1 | |
| Asus V16 V3607V | |
| HP Pavilion 16-ag0057ng | |
| Lenovo IdeaPad Slim 5 16AKP10 | |
| PCMark 10 / Essentials | |
| MSI Prestige 16 B1MG-001US | |
| Ortalama Intel Core Ultra 7 255H, Intel Arc Graphics 140T (10637 - 11556, n=13) | |
| MSI Venture 16 AI A2HMTG | |
| Dell 16 Plus 2-in-1 | |
| HP Pavilion 16-ag0057ng | |
| Asus V16 V3607V | |
| Lenovo IdeaPad Slim 5 16AKP10 | |
| PCMark 10 / Productivity | |
| MSI Venture 16 AI A2HMTG | |
| Ortalama Intel Core Ultra 7 255H, Intel Arc Graphics 140T (7598 - 15694, n=13) | |
| Asus V16 V3607V | |
| Lenovo IdeaPad Slim 5 16AKP10 | |
| HP Pavilion 16-ag0057ng | |
| MSI Prestige 16 B1MG-001US | |
| Dell 16 Plus 2-in-1 | |
| PCMark 10 / Digital Content Creation | |
| Ortalama Intel Core Ultra 7 255H, Intel Arc Graphics 140T (10461 - 12552, n=13) | |
| MSI Venture 16 AI A2HMTG | |
| MSI Prestige 16 B1MG-001US | |
| Dell 16 Plus 2-in-1 | |
| Asus V16 V3607V | |
| HP Pavilion 16-ag0057ng | |
| Lenovo IdeaPad Slim 5 16AKP10 | |
| CrossMark / Overall | |
| MSI Venture 16 AI A2HMTG | |
| Ortalama Intel Core Ultra 7 255H, Intel Arc Graphics 140T (1610 - 2018, n=13) | |
| Asus V16 V3607V | |
| MSI Prestige 16 B1MG-001US | |
| Dell 16 Plus 2-in-1 | |
| Lenovo IdeaPad Slim 5 16AKP10 | |
| CrossMark / Productivity | |
| MSI Venture 16 AI A2HMTG | |
| Ortalama Intel Core Ultra 7 255H, Intel Arc Graphics 140T (1566 - 1908, n=13) | |
| Asus V16 V3607V | |
| MSI Prestige 16 B1MG-001US | |
| Dell 16 Plus 2-in-1 | |
| Lenovo IdeaPad Slim 5 16AKP10 | |
| CrossMark / Creativity | |
| MSI Venture 16 AI A2HMTG | |
| Ortalama Intel Core Ultra 7 255H, Intel Arc Graphics 140T (1827 - 2396, n=13) | |
| Asus V16 V3607V | |
| MSI Prestige 16 B1MG-001US | |
| Dell 16 Plus 2-in-1 | |
| Lenovo IdeaPad Slim 5 16AKP10 | |
| CrossMark / Responsiveness | |
| MSI Prestige 16 B1MG-001US | |
| Asus V16 V3607V | |
| Ortalama Intel Core Ultra 7 255H, Intel Arc Graphics 140T (1194 - 1781, n=13) | |
| MSI Venture 16 AI A2HMTG | |
| Dell 16 Plus 2-in-1 | |
| Lenovo IdeaPad Slim 5 16AKP10 | |
| WebXPRT 3 / Overall | |
| MSI Venture 16 AI A2HMTG | |
| Ortalama Intel Core Ultra 7 255H, Intel Arc Graphics 140T (273 - 327, n=13) | |
| MSI Prestige 16 B1MG-001US | |
| Dell 16 Plus 2-in-1 | |
| HP Pavilion 16-ag0057ng | |
| HP Pavilion 16-ag0057ng | |
| Lenovo IdeaPad Slim 5 16AKP10 | |
| WebXPRT 4 / Overall | |
| MSI Venture 16 AI A2HMTG | |
| Ortalama Intel Core Ultra 7 255H, Intel Arc Graphics 140T (247 - 317, n=13) | |
| Dell 16 Plus 2-in-1 | |
| Asus V16 V3607V | |
| MSI Prestige 16 B1MG-001US | |
| HP Pavilion 16-ag0057ng | |
| HP Pavilion 16-ag0057ng | |
| Mozilla Kraken 1.1 / Total | |
| Lenovo IdeaPad Slim 5 16AKP10 | |
| HP Pavilion 16-ag0057ng | |
| HP Pavilion 16-ag0057ng | |
| MSI Prestige 16 B1MG-001US | |
| Asus V16 V3607V | |
| Dell 16 Plus 2-in-1 | |
| MSI Venture 16 AI A2HMTG | |
| Ortalama Intel Core Ultra 7 255H, Intel Arc Graphics 140T (427 - 510, n=13) | |
| Geekbench AI / Single Precision GPU 1.7 | |
| Dell 16 Plus 2-in-1 | |
| Ortalama Intel Core Ultra 7 255H, Intel Arc Graphics 140T (6840 - 8478, n=7) | |
| MSI Venture 16 AI A2HMTG | |
| Geekbench AI / Half Precision GPU 1.7 | |
| Dell 16 Plus 2-in-1 | |
| Ortalama Intel Core Ultra 7 255H, Intel Arc Graphics 140T (8108 - 12393, n=7) | |
| MSI Venture 16 AI A2HMTG | |
| Geekbench AI / Quantized GPU 1.7 | |
| Dell 16 Plus 2-in-1 | |
| Ortalama Intel Core Ultra 7 255H, Intel Arc Graphics 140T (4705 - 5621, n=7) | |
| MSI Venture 16 AI A2HMTG | |
* ... daha küçük daha iyidir
| PCMark 10 Score | 8903 puan | |
Yardım | ||
| AIDA64 / Memory Copy | |
| Dell 16 Plus 2-in-1 | |
| Ortalama Intel Core Ultra 7 255H (39188 - 110930, n=17) | |
| MSI Prestige 16 B1MG-001US | |
| HP Pavilion 16-ag0057ng | |
| MSI Venture 16 AI A2HMTG | |
| Lenovo IdeaPad Slim 5 16AKP10 | |
| Asus V16 V3607V | |
| AIDA64 / Memory Read | |
| Dell 16 Plus 2-in-1 | |
| MSI Venture 16 AI A2HMTG | |
| Ortalama Intel Core Ultra 7 255H (43703 - 90552, n=17) | |
| MSI Prestige 16 B1MG-001US | |
| Lenovo IdeaPad Slim 5 16AKP10 | |
| HP Pavilion 16-ag0057ng | |
| Asus V16 V3607V | |
| AIDA64 / Memory Write | |
| Dell 16 Plus 2-in-1 | |
| HP Pavilion 16-ag0057ng | |
| Lenovo IdeaPad Slim 5 16AKP10 | |
| MSI Venture 16 AI A2HMTG | |
| MSI Prestige 16 B1MG-001US | |
| Ortalama Intel Core Ultra 7 255H (36438 - 87199, n=17) | |
| Asus V16 V3607V | |
| AIDA64 / Memory Latency | |
| MSI Prestige 16 B1MG-001US | |
| Ortalama Intel Core Ultra 7 255H (107.6 - 147.2, n=17) | |
| HP Pavilion 16-ag0057ng | |
| MSI Venture 16 AI A2HMTG | |
| Dell 16 Plus 2-in-1 | |
| Asus V16 V3607V | |
| Lenovo IdeaPad Slim 5 16AKP10 | |
* ... daha küçük daha iyidir
DPC Gecikme Süresi
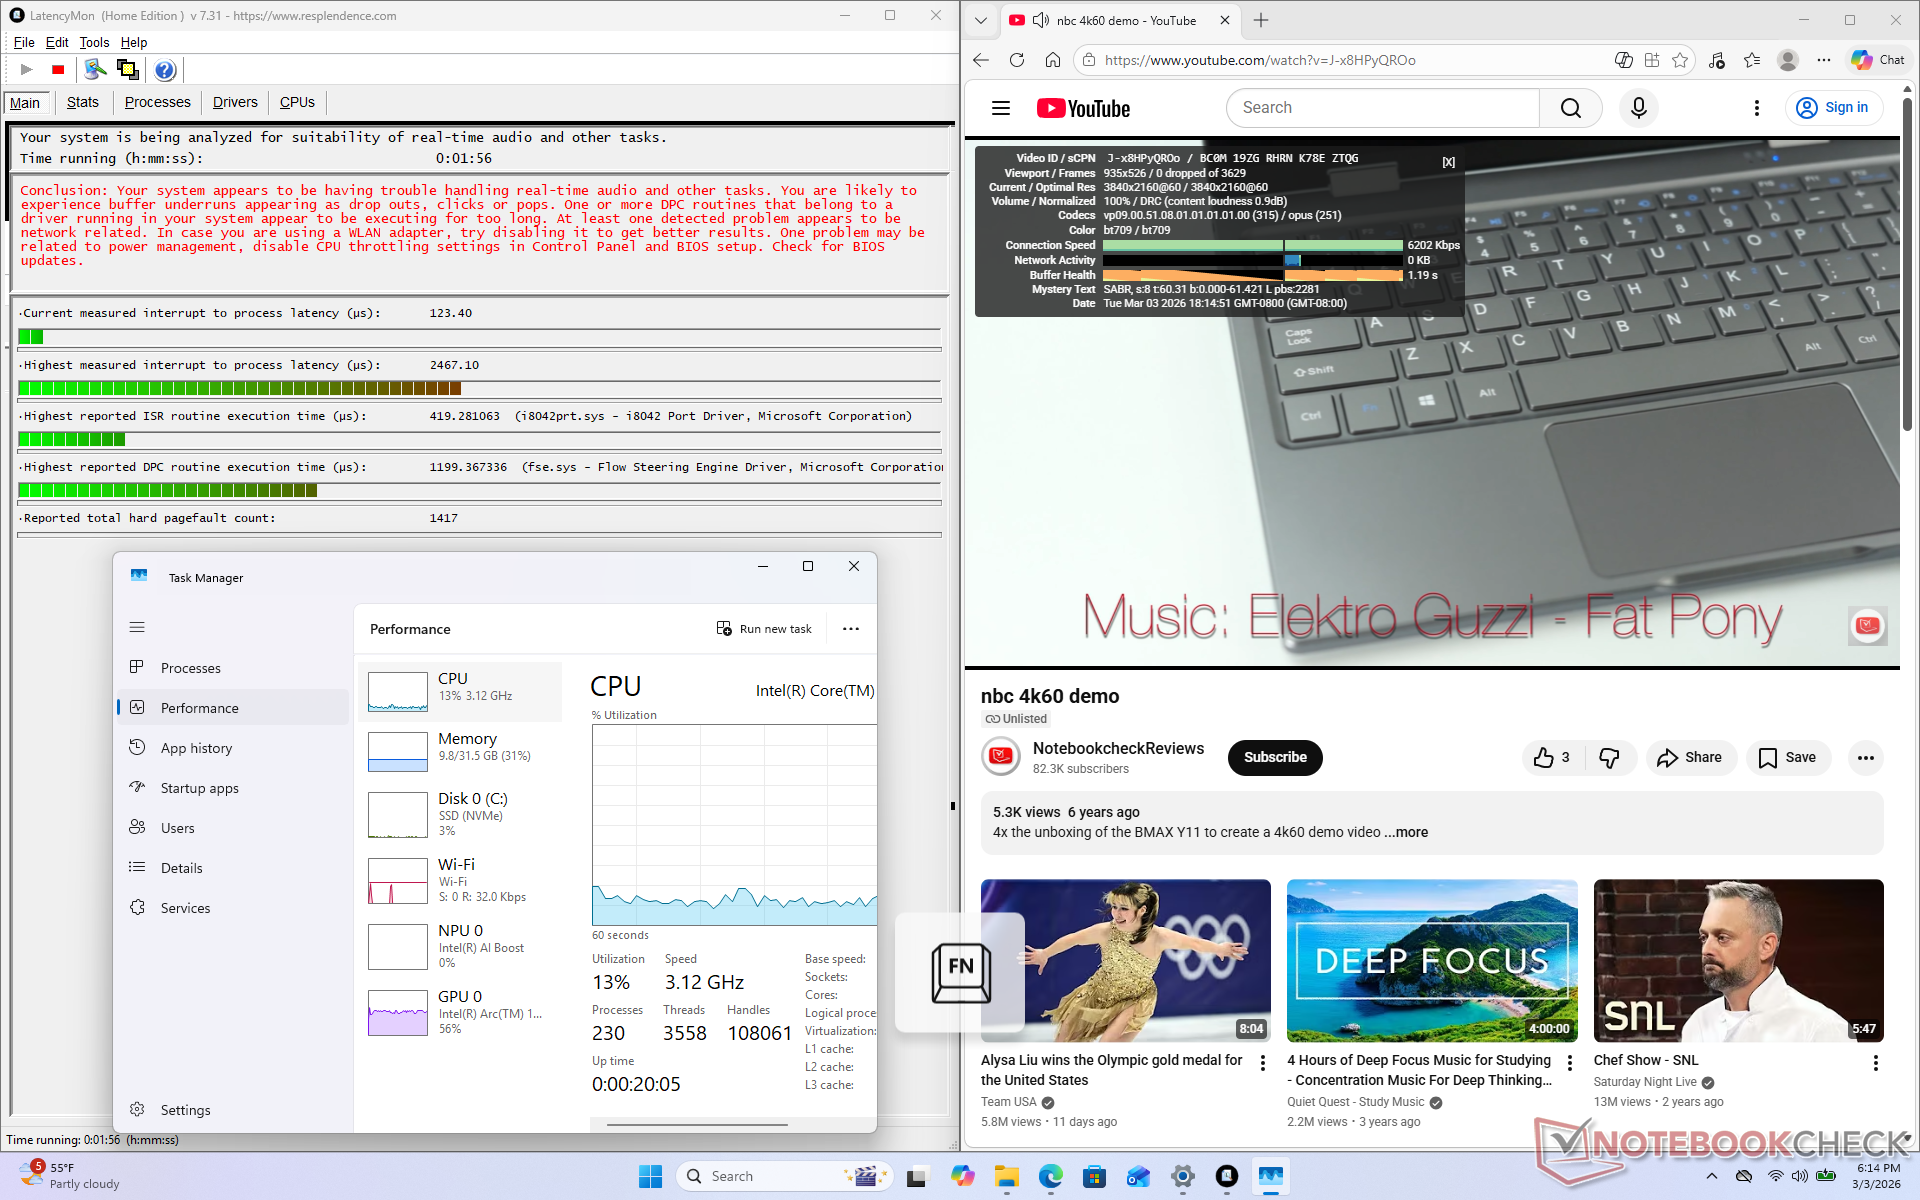
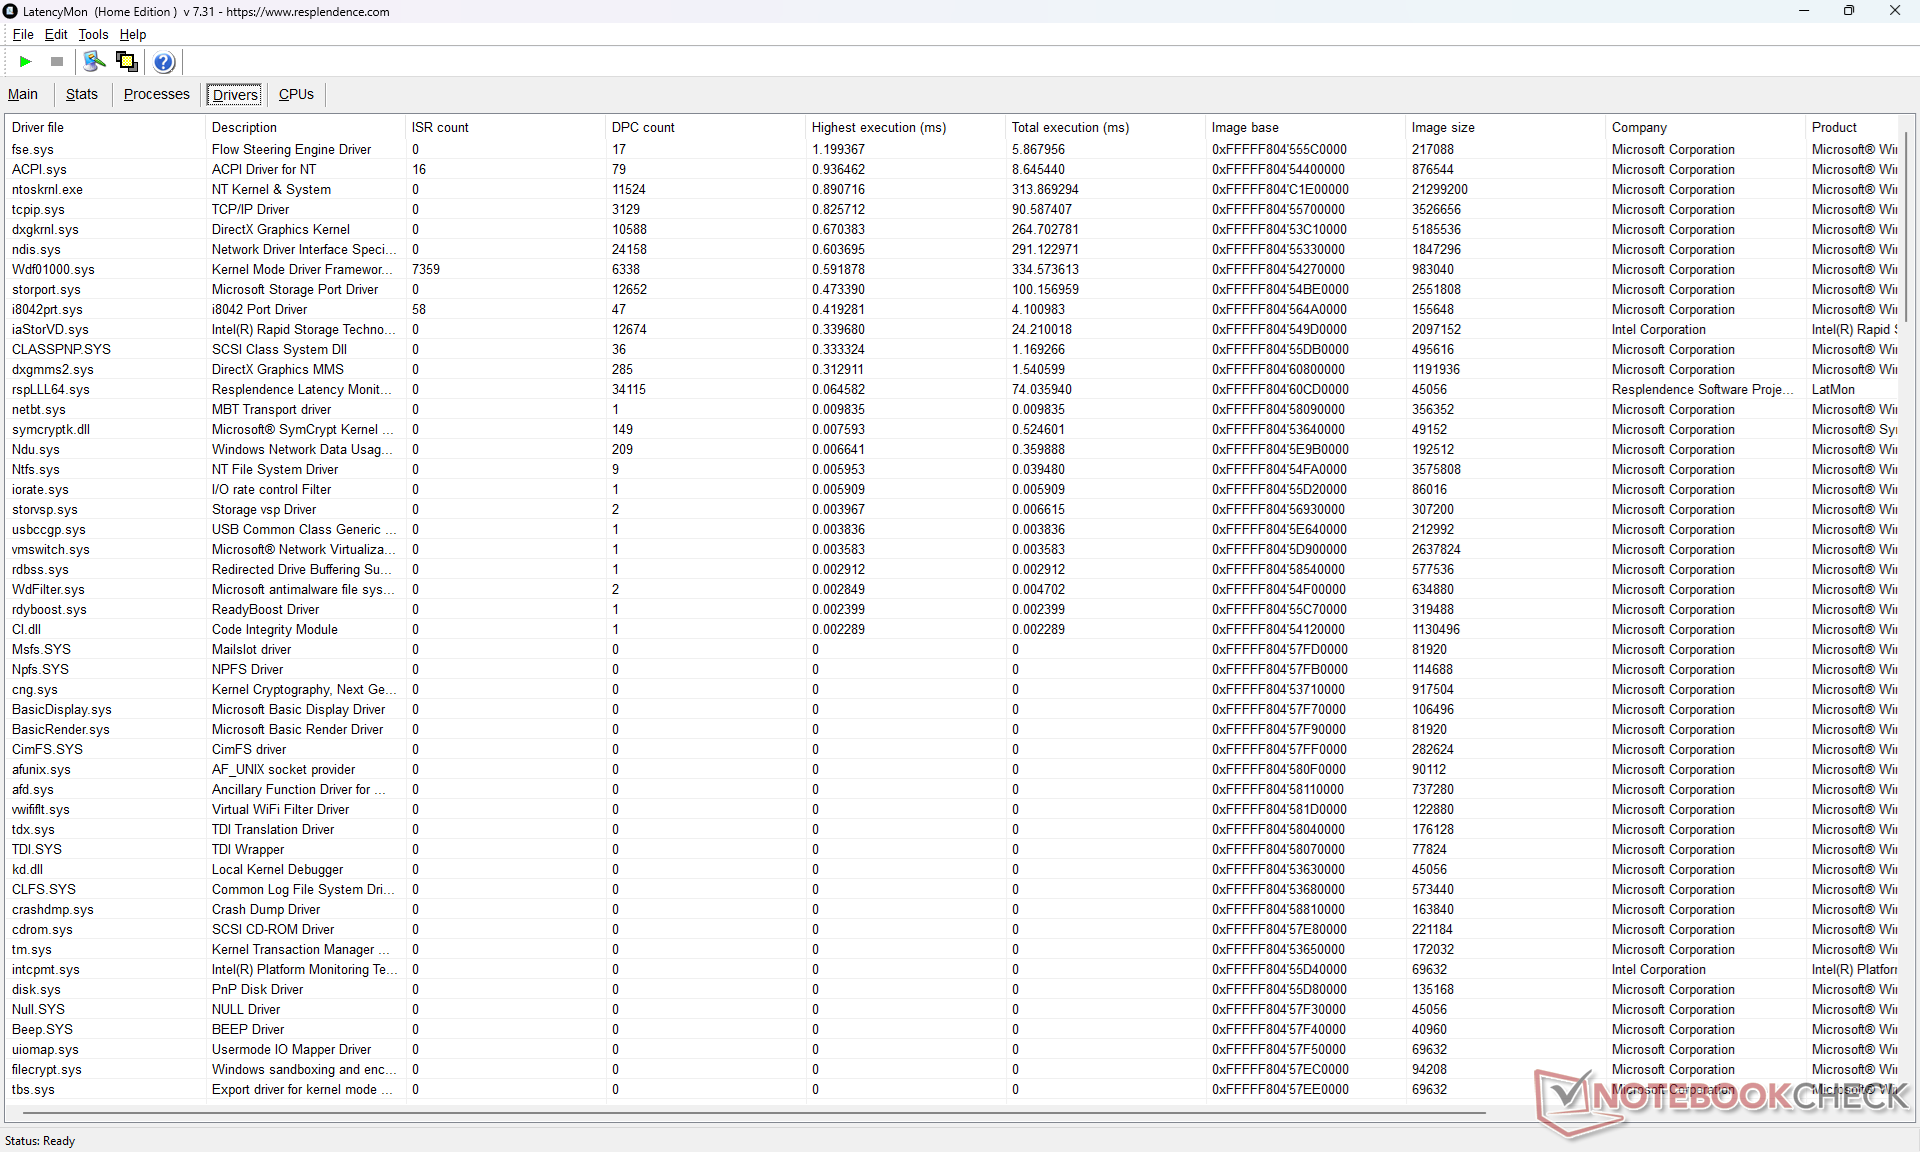
LatencyMon, 4K60 video oynatma sırasında küçük DPC sorunları olduğunu ancak bunun dışında kare düşmesi olmadığını gösteriyor.
| DPC Latencies / LatencyMon - interrupt to process latency (max), Web, Youtube, Prime95 | |
| Lenovo IdeaPad Slim 5 16AKP10 | |
| Asus V16 V3607V | |
| MSI Venture 16 AI A2HMTG | |
| Dell 16 Plus 2-in-1 | |
| HP Pavilion 16-ag0057ng | |
| MSI Prestige 16 B1MG-001US | |
* ... daha küçük daha iyidir
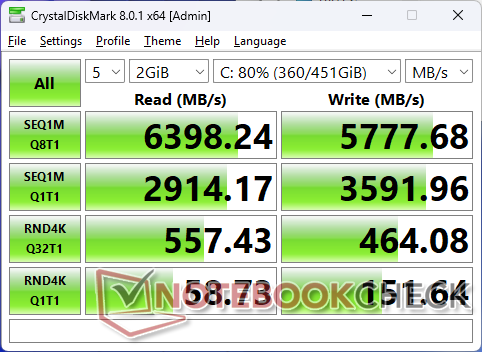
Depolama Cihazları
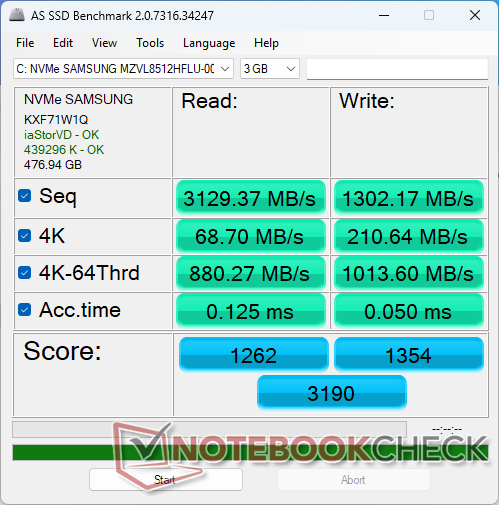
Bu Samsung MZVL8512HFLU PCIe4 x4 NVMe SSD, özel bir soğutucu olmadan bile 7000 MB/sn'ye varan aktarım hızlarını sürdürebilir.

| Drive Performance rating - Percent | |
| MSI Prestige 16 B1MG-001US | |
| Asus V16 V3607V | |
| MSI Venture 16 AI A2HMTG | |
| HP Pavilion 16-ag0057ng | |
| Lenovo IdeaPad Slim 5 16AKP10 | |
| Dell 16 Plus 2-in-1 | |
* ... daha küçük daha iyidir
Disk Daraltma: DiskSpd Okuma Döngüsü, Kuyruk Derinliği 8
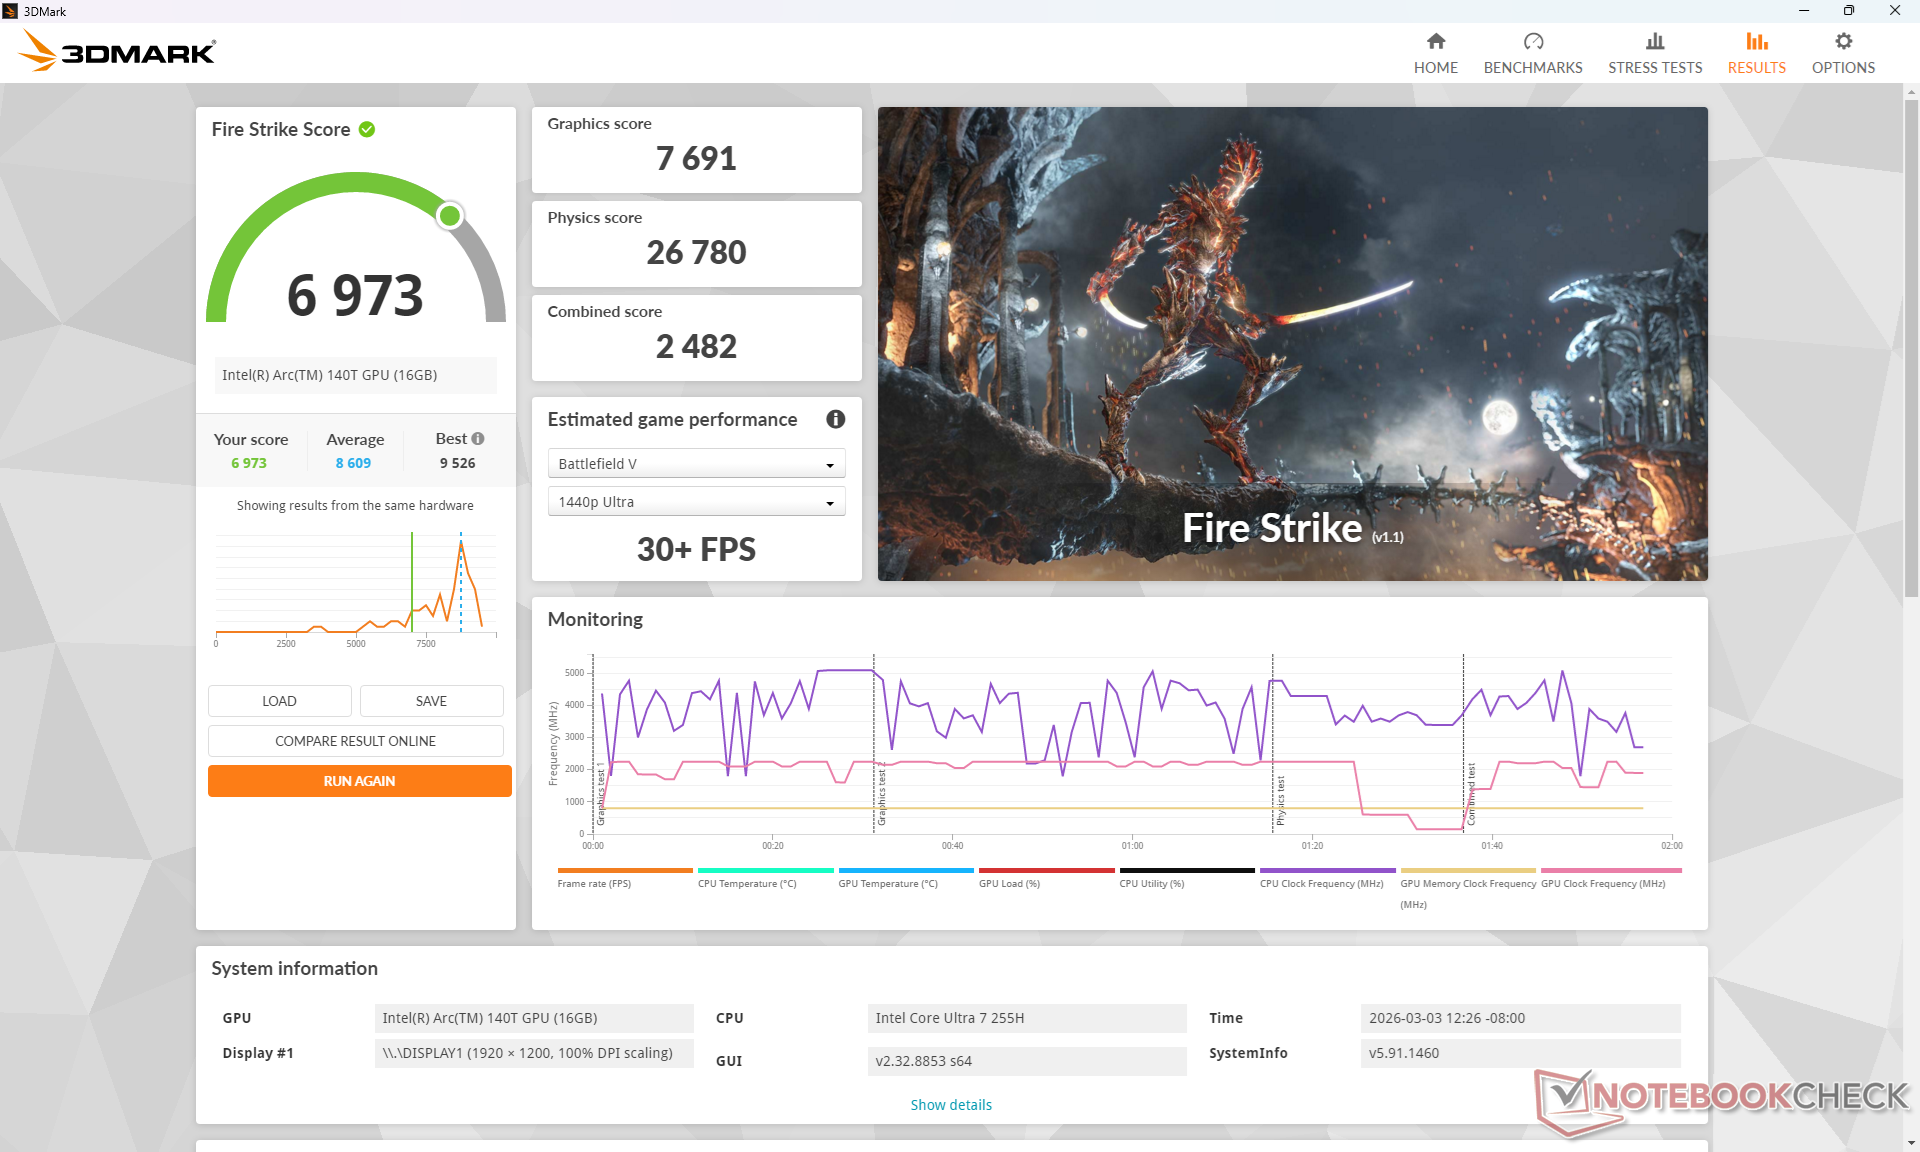
GPU Performansı
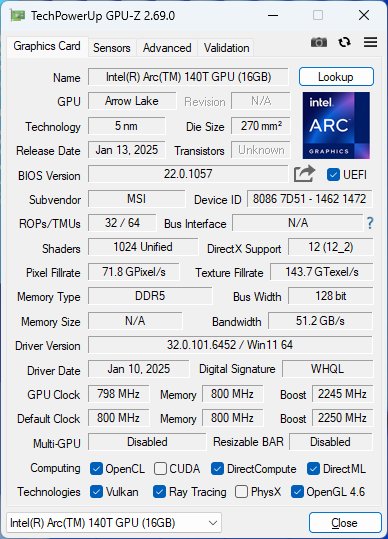
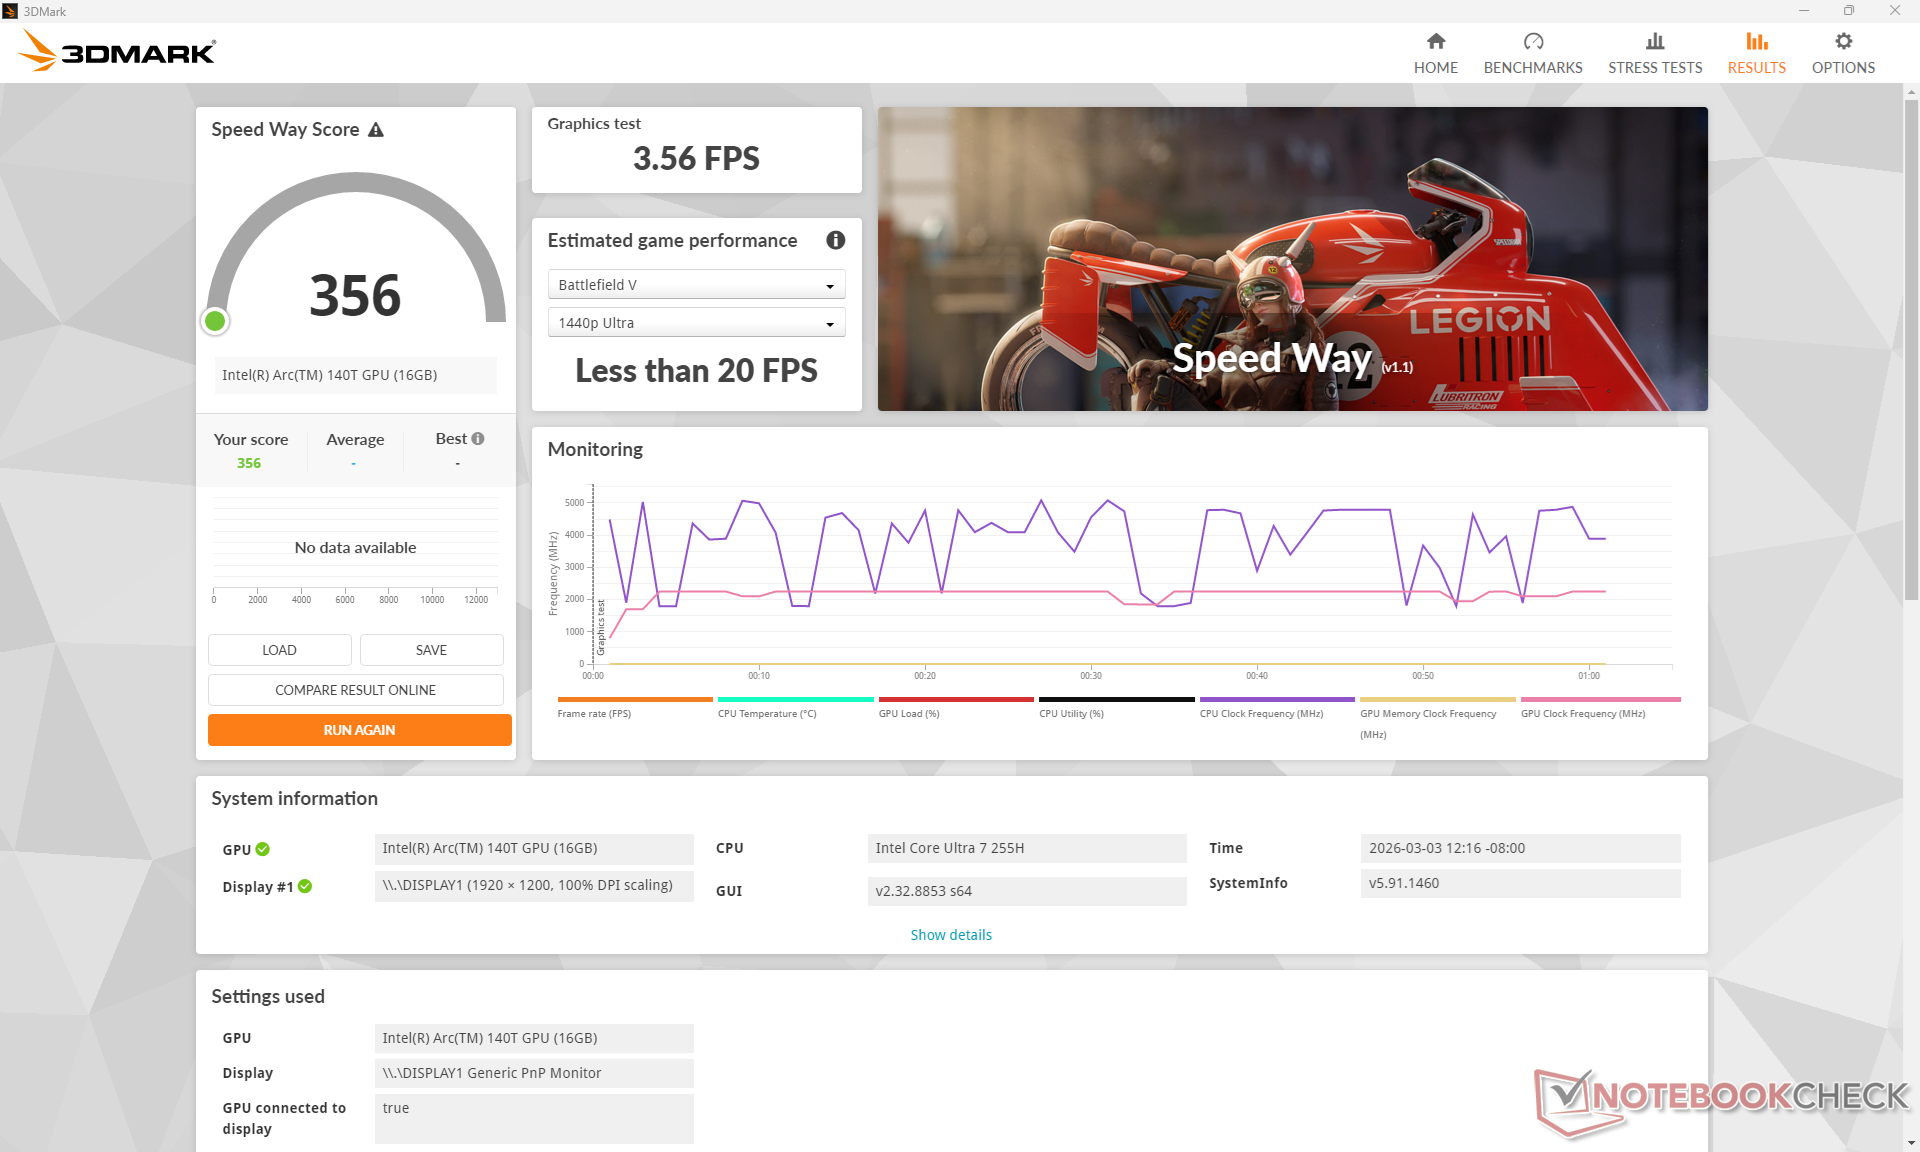
Grafik performansı, bir iGPU için hala iyi olsa da, ne yazık ki veritabanımızdaki aynı özelliklere sahip ortalama dizüstü bilgisayardan yüzde 10 daha yavaş Ark 140T. Geçen yılın eski model MSI Prestige 16'sı Ark 8 sonuç olarak, oyun ve GPU ağırlıklı görevler söz konusu olduğunda MSI'ımızla karşılaştırılabilir.
| Güç Profili | Grafik Puanı | Fizik Puanı | Birleşik Puan |
| Performans Modu | 7691 | 26780 | 2482 |
| Dengeli Mod | 7416 (-4%) | 26626 (-1%) | 2521 (-0%) |
| Akü Gücü | 7319 (-5%) | 25231 (-6%) | 2459 (-0%) |
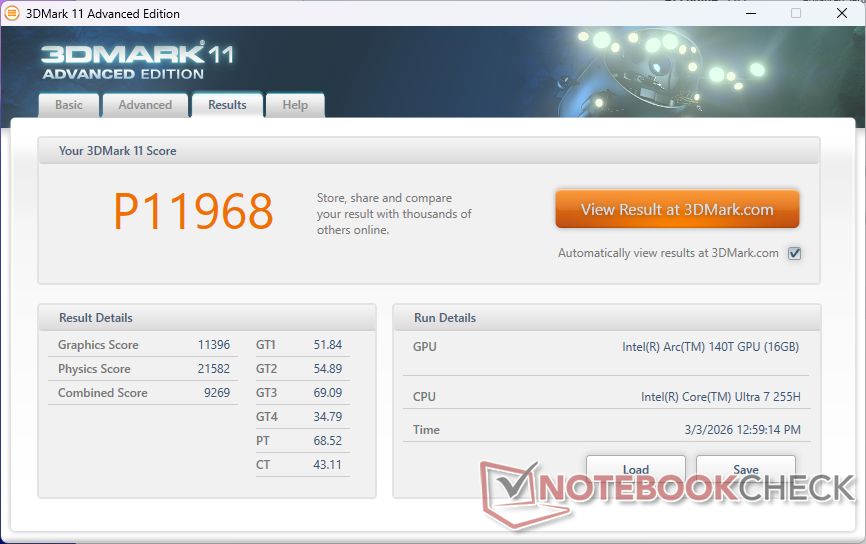
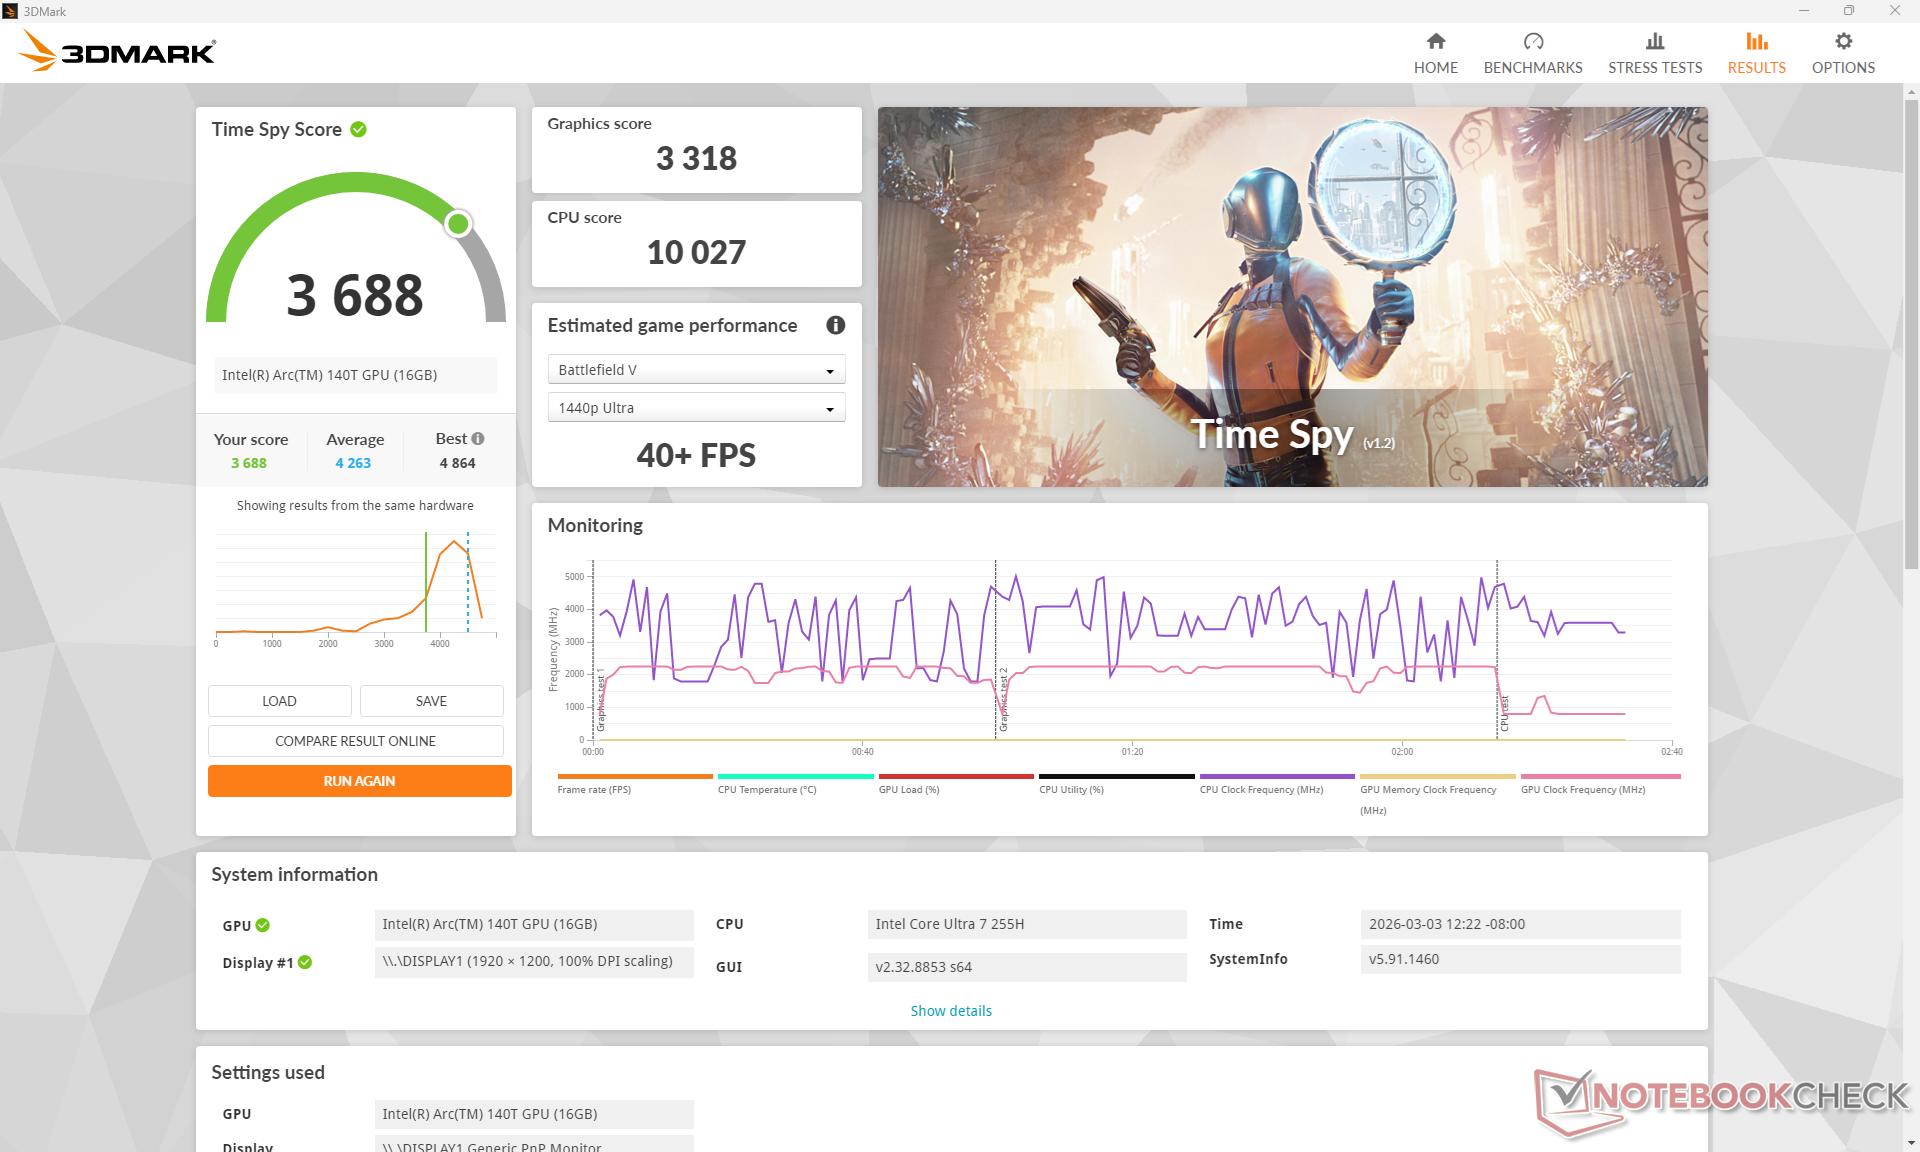
| 3DMark 11 Performance | 11968 puan | |
| 3DMark Cloud Gate Standard Score | 35142 puan | |
| 3DMark Fire Strike Score | 6973 puan | |
| 3DMark Time Spy Score | 3688 puan | |
Yardım | ||
| Blender | |
| v3.3 Classroom OPTIX/RTX | |
| Asus V16 V3607V | |
| v3.3 Classroom CUDA | |
| Asus V16 V3607V | |
| v3.3 Classroom CPU | |
| Lenovo IdeaPad Slim 5 16AKP10 | |
| Dell 16 Plus 2-in-1 | |
| HP Pavilion 16-ag0057ng | |
| Dynabook Tecra A60 A65-M | |
| Asus V16 V3607V | |
| MSI Prestige 16 B1MG-001US | |
| Asus ExpertBook B5 B5605CCA | |
| Ortalama Intel Arc Graphics 140T (254 - 492, n=20) | |
| Acer Swift Go 16 AI SFG16-61-R5Y5 | |
| Acer Swift Go 16 AI SFG16-61-R5Y5 | |
| MSI Venture 16 AI A2HMTG | |
| Asus ZenBook S16 UM5606GA | |
| v3.3 Classroom oneAPI/Intel | |
| Ortalama Intel Arc Graphics 140T (147 - 396, n=6) | |
| Dell 16 Plus 2-in-1 | |
| MSI Venture 16 AI A2HMTG | |
| v4.3 Barbershop CPU | |
| Dell 16 Plus 2-in-1 | |
| Asus V16 V3607V | |
| Dynabook Tecra A60 A65-M | |
| Acer Swift Go 16 AI SFG16-61-R5Y5 | |
| Ortalama Intel Arc Graphics 140T (1349 - 1839, n=9) | |
| MSI Venture 16 AI A2HMTG | |
| v4.3 Barbershop oneAPI | |
| Dell 16 Plus 2-in-1 | |
| Ortalama Intel Arc Graphics 140T (533 - 1037, n=5) | |
| MSI Venture 16 AI A2HMTG | |
| v4.3 Barbershop HIP | |
| Acer Swift Go 16 AI SFG16-61-R5Y5 | |
| v4.3 Barbershop OPTIX | |
| Asus V16 V3607V | |
* ... daha küçük daha iyidir
| Performance rating - Percent | |
| Asus V16 V3607V | |
| Dell 16 Plus 2-in-1 -1! | |
| MSI Prestige 16 B1MG-001US -1! | |
| MSI Venture 16 AI A2HMTG | |
| HP Pavilion 16-ag0057ng | |
| Lenovo IdeaPad Slim 5 16AKP10 | |
| Cyberpunk 2077 - 1920x1080 Ultra Preset (FSR off) | |
| Asus V16 V3607V | |
| Dell 16 Plus 2-in-1 | |
| MSI Venture 16 AI A2HMTG | |
| MSI Prestige 16 B1MG-001US | |
| HP Pavilion 16-ag0057ng | |
| Lenovo IdeaPad Slim 5 16AKP10 | |
| Baldur's Gate 3 - 1920x1080 Ultra Preset AA:T | |
| Asus V16 V3607V | |
| Dell 16 Plus 2-in-1 | |
| MSI Venture 16 AI A2HMTG | |
| MSI Prestige 16 B1MG-001US | |
| HP Pavilion 16-ag0057ng | |
| Lenovo IdeaPad Slim 5 16AKP10 | |
| GTA V - 1920x1080 Highest AA:4xMSAA + FX AF:16x | |
| Asus V16 V3607V | |
| MSI Venture 16 AI A2HMTG | |
| HP Pavilion 16-ag0057ng | |
| Lenovo IdeaPad Slim 5 16AKP10 | |
| Final Fantasy XV Benchmark - 1920x1080 High Quality | |
| Asus V16 V3607V | |
| Dell 16 Plus 2-in-1 | |
| MSI Venture 16 AI A2HMTG | |
| MSI Prestige 16 B1MG-001US | |
| HP Pavilion 16-ag0057ng | |
| Lenovo IdeaPad Slim 5 16AKP10 | |
| Strange Brigade - 1920x1080 ultra AA:ultra AF:16 | |
| Asus V16 V3607V | |
| Dell 16 Plus 2-in-1 | |
| MSI Venture 16 AI A2HMTG | |
| MSI Prestige 16 B1MG-001US | |
| HP Pavilion 16-ag0057ng | |
| Lenovo IdeaPad Slim 5 16AKP10 | |
| Dota 2 Reborn - 1920x1080 ultra (3/3) best looking | |
| Asus V16 V3607V | |
| Dell 16 Plus 2-in-1 | |
| MSI Venture 16 AI A2HMTG | |
| MSI Prestige 16 B1MG-001US | |
| HP Pavilion 16-ag0057ng | |
| Lenovo IdeaPad Slim 5 16AKP10 | |
| X-Plane 11.11 - 1920x1080 high (fps_test=3) | |
| Asus V16 V3607V | |
| MSI Venture 16 AI A2HMTG | |
| MSI Prestige 16 B1MG-001US | |
| Dell 16 Plus 2-in-1 | |
| Lenovo IdeaPad Slim 5 16AKP10 | |
| HP Pavilion 16-ag0057ng | |
| F1 24 | |
| 1920x1080 Low Preset AA:T AF:16x | |
| Dell 16 Plus 2-in-1 | |
| Asus ZenBook S16 UM5606GA | |
| Ortalama Intel Arc Graphics 140T (53.5 - 93.4, n=15) | |
| MSI Venture 16 AI A2HMTG | |
| Asus ExpertBook B5 B5605CCA | |
| Dynabook Tecra A60 A65-M | |
| 1920x1080 Medium Preset AA:T AF:16x | |
| Dell 16 Plus 2-in-1 | |
| Asus ZenBook S16 UM5606GA | |
| Ortalama Intel Arc Graphics 140T (47.4 - 85.7, n=15) | |
| MSI Venture 16 AI A2HMTG | |
| Asus ExpertBook B5 B5605CCA | |
| Dynabook Tecra A60 A65-M | |
| 1920x1080 High Preset AA:T AF:16x | |
| Dell 16 Plus 2-in-1 | |
| Asus ZenBook S16 UM5606GA | |
| Ortalama Intel Arc Graphics 140T (37.5 - 64.9, n=14) | |
| MSI Venture 16 AI A2HMTG | |
| Asus ExpertBook B5 B5605CCA | |
| 1920x1080 Ultra High Preset AA:T AF:16x | |
| Dell 16 Plus 2-in-1 | |
| Ortalama Intel Arc Graphics 140T (15.7 - 20.8, n=12) | |
| MSI Venture 16 AI A2HMTG | |
| Asus ZenBook S16 UM5606GA | |
Cyberpunk 2077 ultra FPS Tablosu
| düşük | orta | yüksek | ultra | |
|---|---|---|---|---|
| GTA V (2015) | 167.9 | 155 | 41.1 | 16.7 |
| Dota 2 Reborn (2015) | 103.6 | 86.5 | 79.4 | 75.8 |
| Final Fantasy XV Benchmark (2018) | 68 | 39.2 | 26 | |
| X-Plane 11.11 (2018) | 55.8 | 44.6 | 39.7 | |
| Strange Brigade (2018) | 167.5 | 70.6 | 60.2 | 50.1 |
| Baldur's Gate 3 (2023) | 36.7 | 31 | 26.5 | 26.1 |
| Cyberpunk 2077 (2023) | 36.2 | 29.6 | 25.5 | 23 |
| F1 24 (2024) | 76.1 | 69.9 | 48 | 15.7 |
Emisyonlar
Sistem Gürültüsü
Tarama gibi günlük yükleri çalıştırırken fan gürültüsü 27 dB(A) civarında seyretme eğilimindedir, ancak oyunlar gibi daha yüksek yükler 45 dB(A) gürültü seviyesine neden olabilir. Fan ne yazık ki tiz sesli ve bu nedenle herhangi bir titreşim oldukça fark edilebilir.
Ses yüksekliği
| Boşta |
| 23.1 / 23.1 / 24.1 dB |
| Çalışırken |
| 45.2 / 44.7 dB |
 | ||
30 dB sessiz 40 dB(A) duyulabilirlik 50 dB(A) gürültülü |
||
min: | ||
| MSI Venture 16 AI A2HMTG Ultra 7 255H, Arc 140T | MSI Prestige 16 B1MG-001US Ultra 7 155H, Arc 8-Core | Dell 16 Plus 2-in-1 Core Ultra 7 258V, Arc 140V | Asus V16 V3607V Core 7 240H, GeForce RTX 3050 6GB Laptop GPU | HP Pavilion 16-ag0057ng R5 8540U, Radeon 740M | Lenovo IdeaPad Slim 5 16AKP10 Ryzen AI 5 330, Radeon 820M | |
|---|---|---|---|---|---|---|
| Noise | -6% | 2% | -4% | 1% | -3% | |
| kapalı / ortam * (dB) | 22.9 | 24.5 -7% | 23.2 -1% | 23.3 -2% | 24 -5% | 24 -5% |
| Idle Minimum * (dB) | 23.1 | 24.5 -6% | 23 -0% | 23.5 -2% | 24 -4% | 24 -4% |
| Idle Average * (dB) | 23.1 | 26.3 -14% | 23 -0% | 23.7 -3% | 25 -8% | 25 -8% |
| Idle Maximum * (dB) | 24.1 | 26.3 -9% | 24.7 -2% | 23.7 2% | 26 -8% | 26 -8% |
| Load Average * (dB) | 45.2 | 36.5 19% | 32.5 28% | 48 -6% | 38 16% | 43 5% |
| Cyberpunk 2077 ultra * (dB) | 39.4 | 42.6 -8% | 40.5 -3% | 37 6% | 42 -7% | |
| Load Maximum * (dB) | 44.7 | 52.9 -18% | 45.6 -2% | 51 -14% | 39 13% | 43 4% |
| Witcher 3 ultra * (dB) | 46.3 |
* ... daha küçük daha iyidir
Sıcaklık
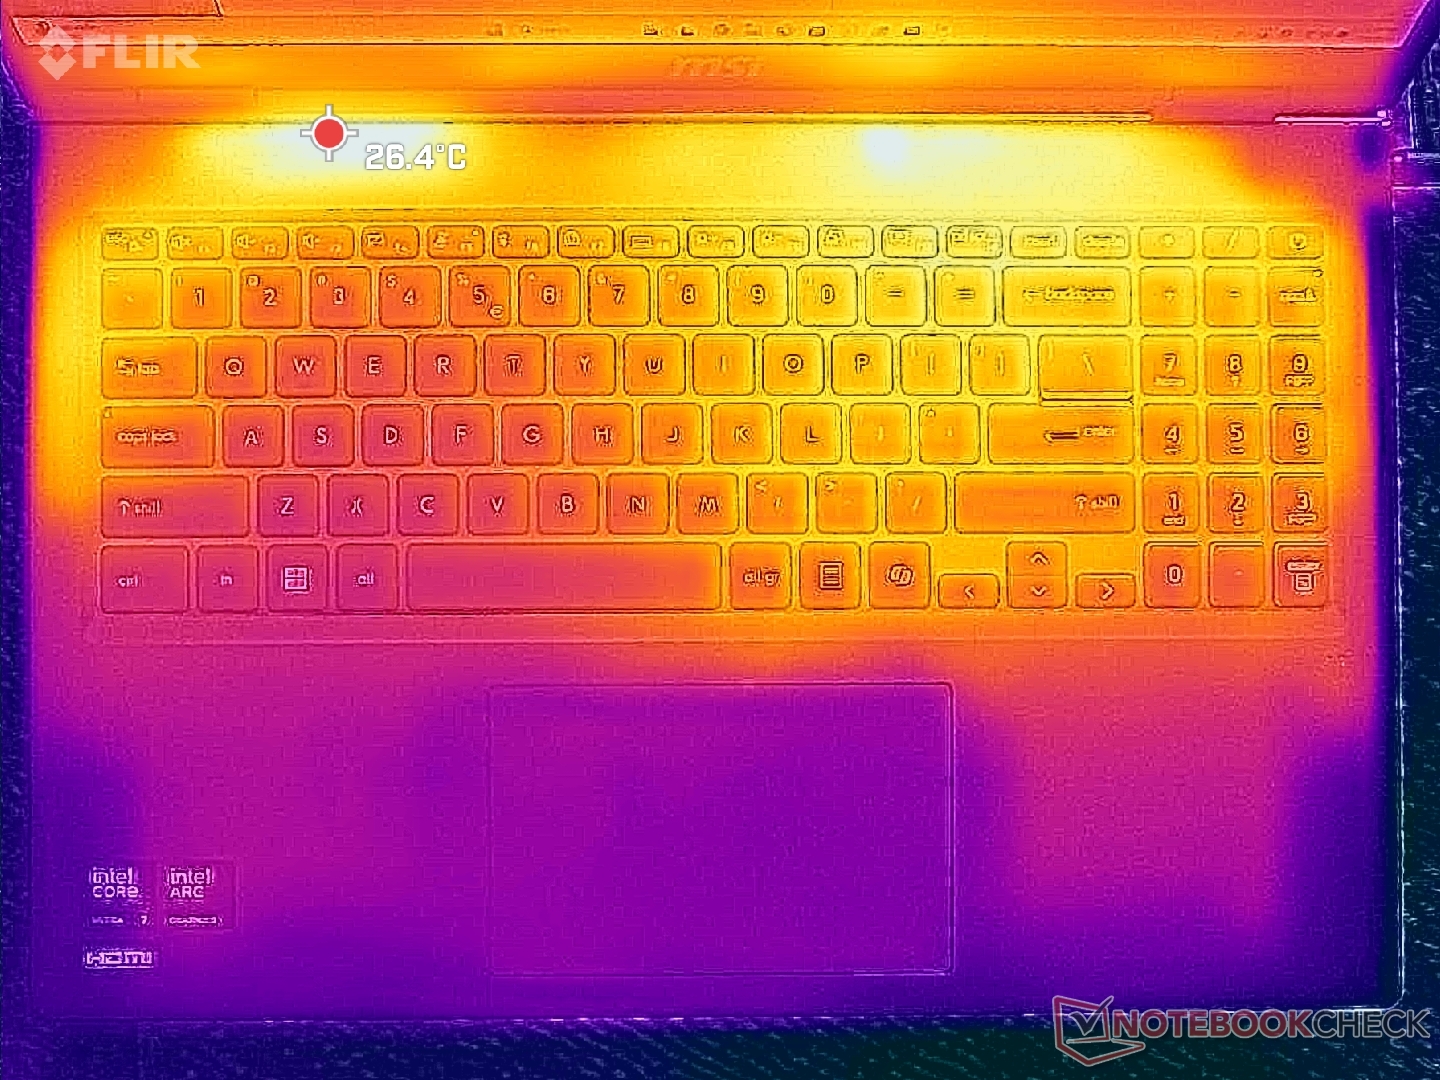
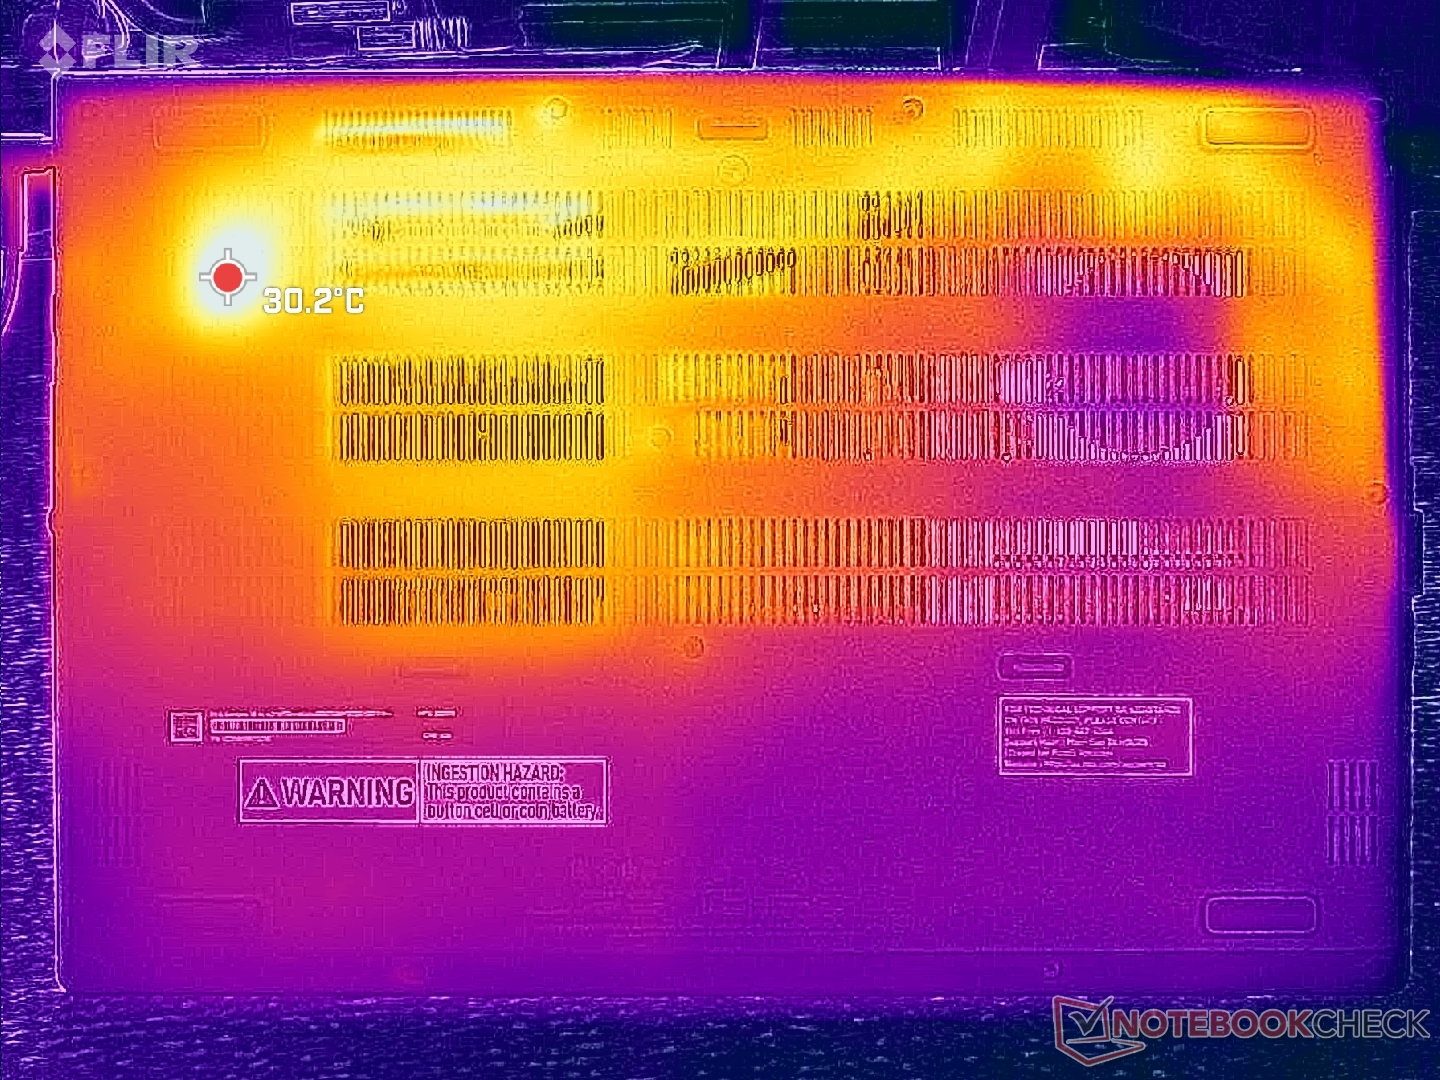
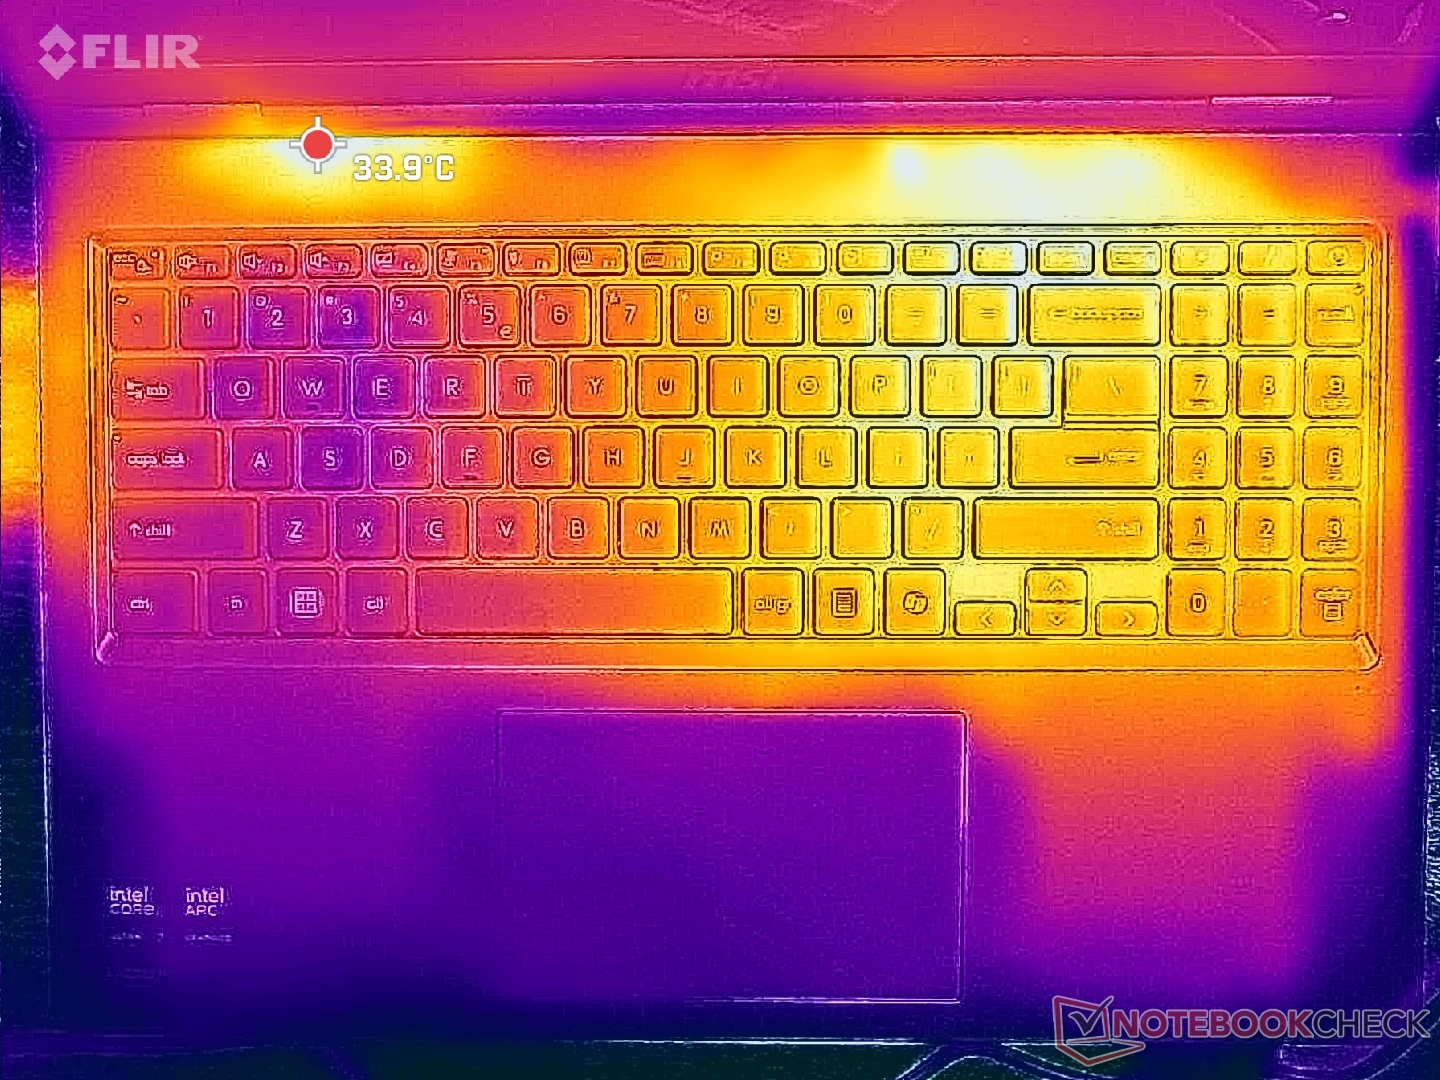
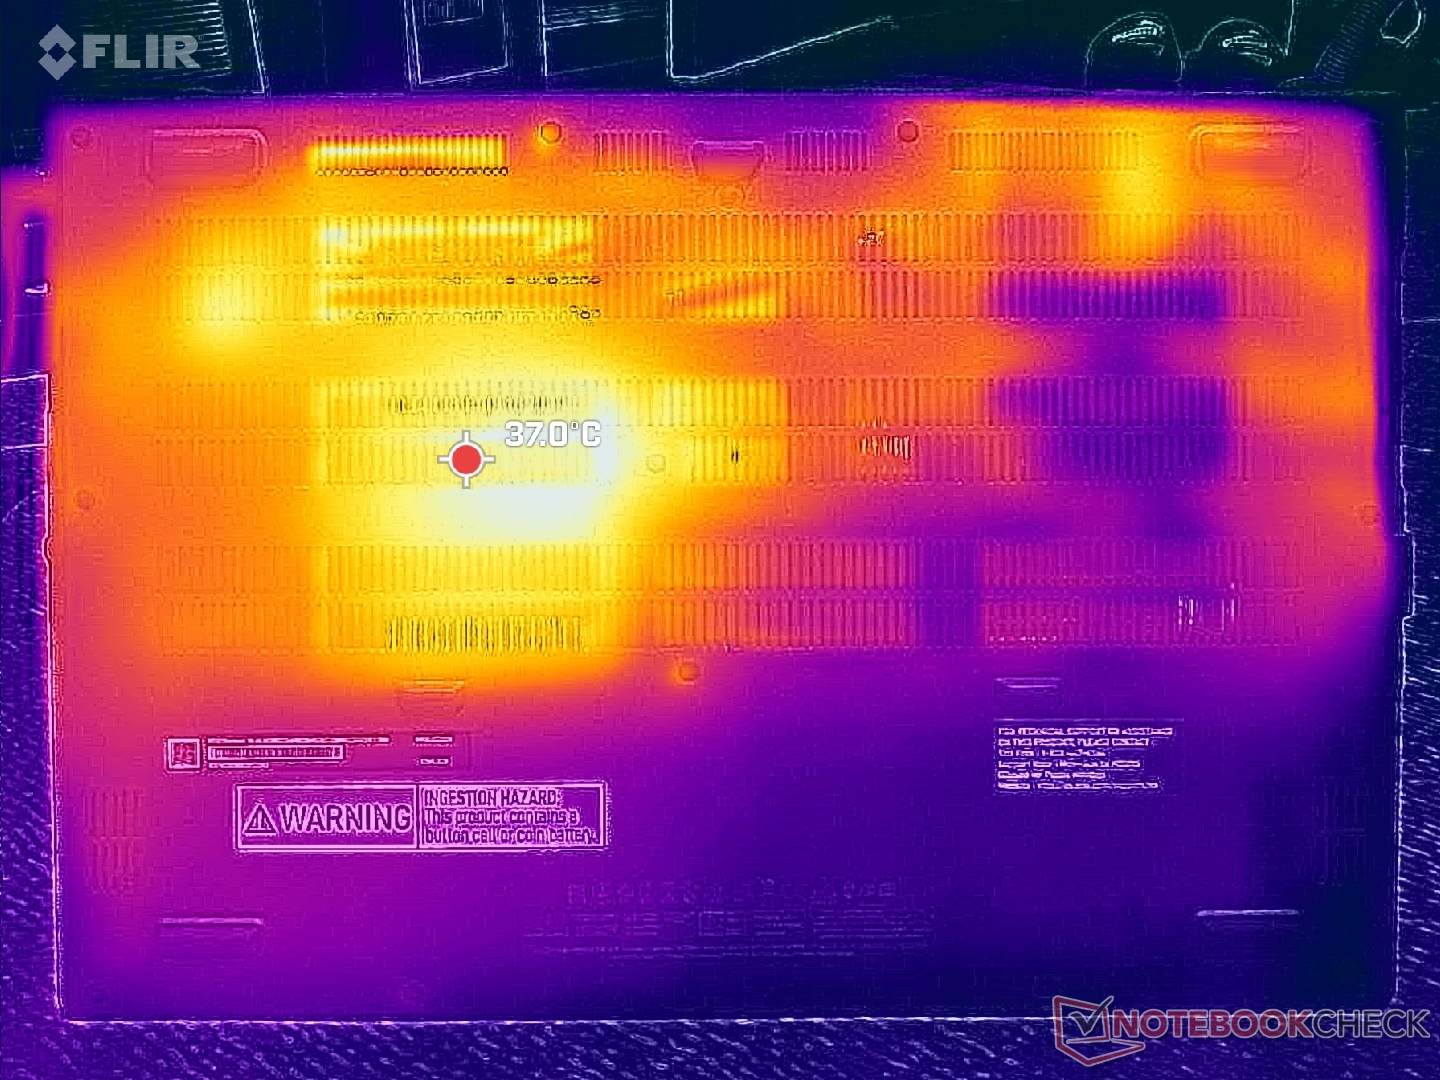
Yüzey sıcaklığı sistemin sağ yarısında sola göre daha yüksektir. Buna rağmen, kısmen nispeten kalın profil nedeniyle sıcak noktalar sadece 35 C ila 37 C'ye ulaşmaktadır.
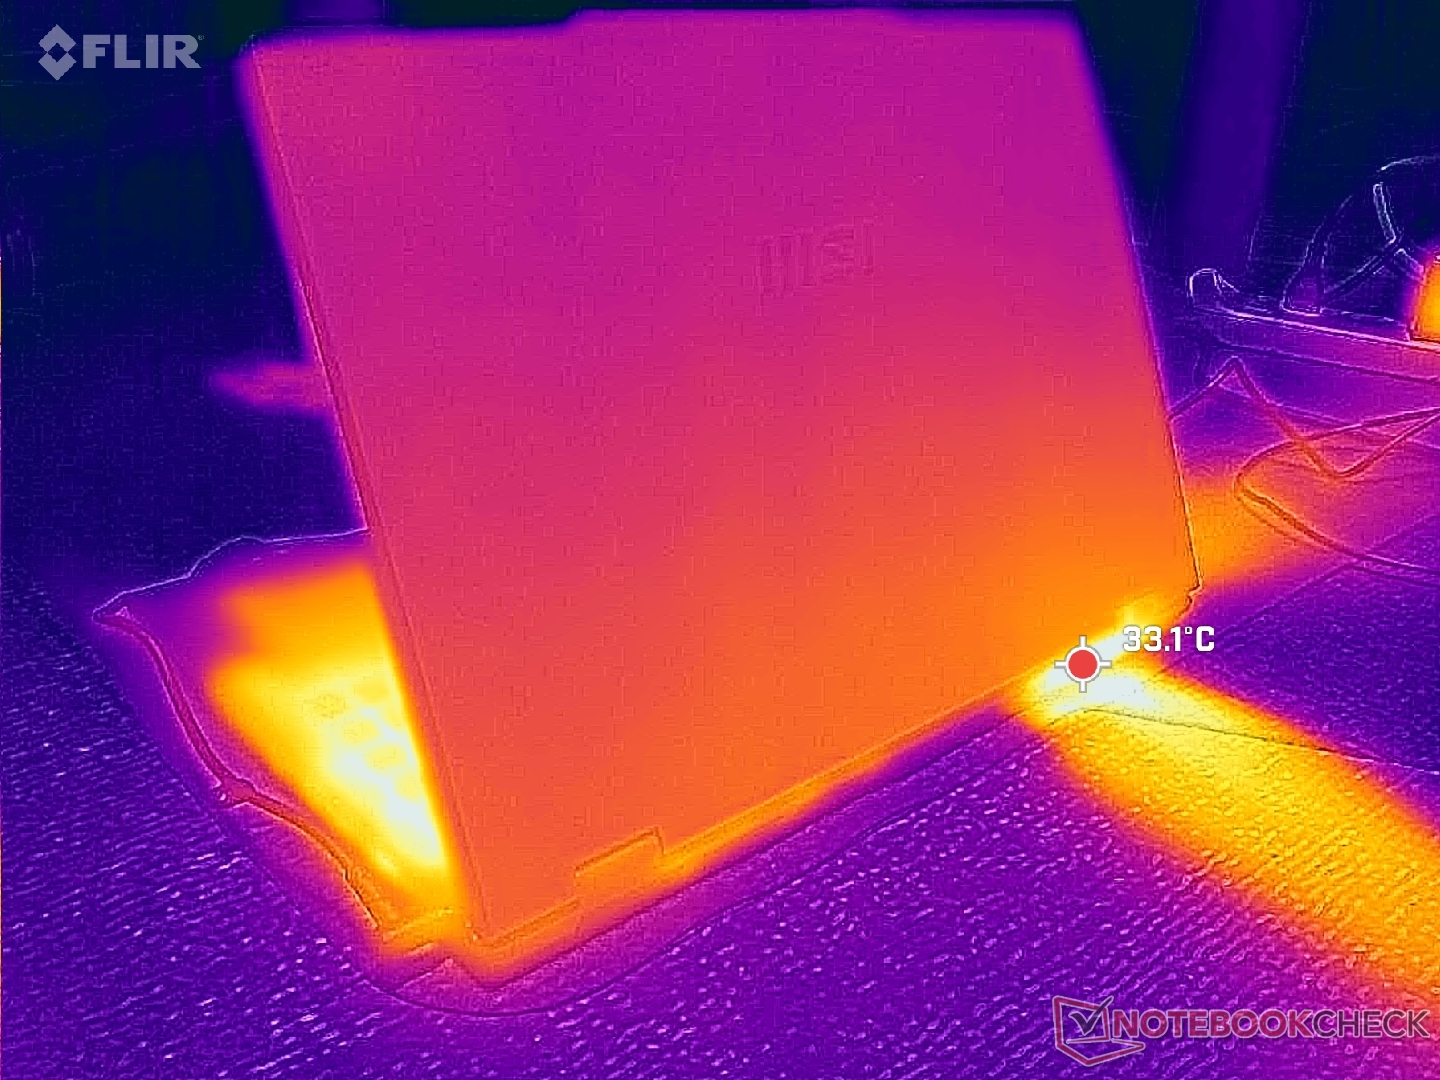
(+) Üst taraftaki maksimum sıcaklık, 34.3 °C / 94 F ortalamasına kıyasla 35 °C / 95 F'dir. , Office sınıfı için 21.2 ile 62.5 °C arasında değişir.
(+) Alt kısım, 36.8 °C / 98 F ortalamasına kıyasla maksimum 37.4 °C / 99 F'ye kadar ısınır
(+) Boşta kullanımda, üst tarafın ortalama sıcaklığı 26.8 °C / 80 F olup, cihazın 29.5 °C / 85 F.
(+) Avuç içi dayanakları ve dokunmatik yüzey, maksimum 30.6 °C / 87.1 F ile cilt sıcaklığından daha soğuktur ve bu nedenle dokunulduğunda soğuktur.
(-) Benzer cihazların avuç içi dayanağı alanının ortalama sıcaklığı 27.5 °C / 81.5 F (-3.1 °C / -5.6 F) idi.
| MSI Venture 16 AI A2HMTG Ultra 7 255H, Arc 140T | MSI Prestige 16 B1MG-001US Ultra 7 155H, Arc 8-Core | Dell 16 Plus 2-in-1 Core Ultra 7 258V, Arc 140V | Asus V16 V3607V Core 7 240H, GeForce RTX 3050 6GB Laptop GPU | HP Pavilion 16-ag0057ng R5 8540U, Radeon 740M | Lenovo IdeaPad Slim 5 16AKP10 Ryzen AI 5 330, Radeon 820M | |
|---|---|---|---|---|---|---|
| Heat | -5% | -10% | 2% | -2% | 8% | |
| Maximum Upper Side * (°C) | 35 | 48.8 -39% | 44 -26% | 41.2 -18% | 42 -20% | 35 -0% |
| Maximum Bottom * (°C) | 37.4 | 47.6 -27% | 39.4 -5% | 34.4 8% | 44 -18% | 37 1% |
| Idle Upper Side * (°C) | 30.2 | 24.2 20% | 31.8 -5% | 28.8 5% | 26 14% | 26 14% |
| Idle Bottom * (°C) | 33 | 23.6 28% | 34.2 -4% | 29 12% | 28 15% | 27 18% |
* ... daha küçük daha iyidir
Stres Testi
CPU, Prime95 stresini başlatırken 2,7 GHz, 71 C ve 44 W'da stabilize olur. Çekirdek sıcaklığı, benzer bir Core H-serisi CPU ile donatılmış Prestige 16'daki orta 80 C aralığına kıyasla stres altındayken bile düşük 70 C aralığında kalacaktır.
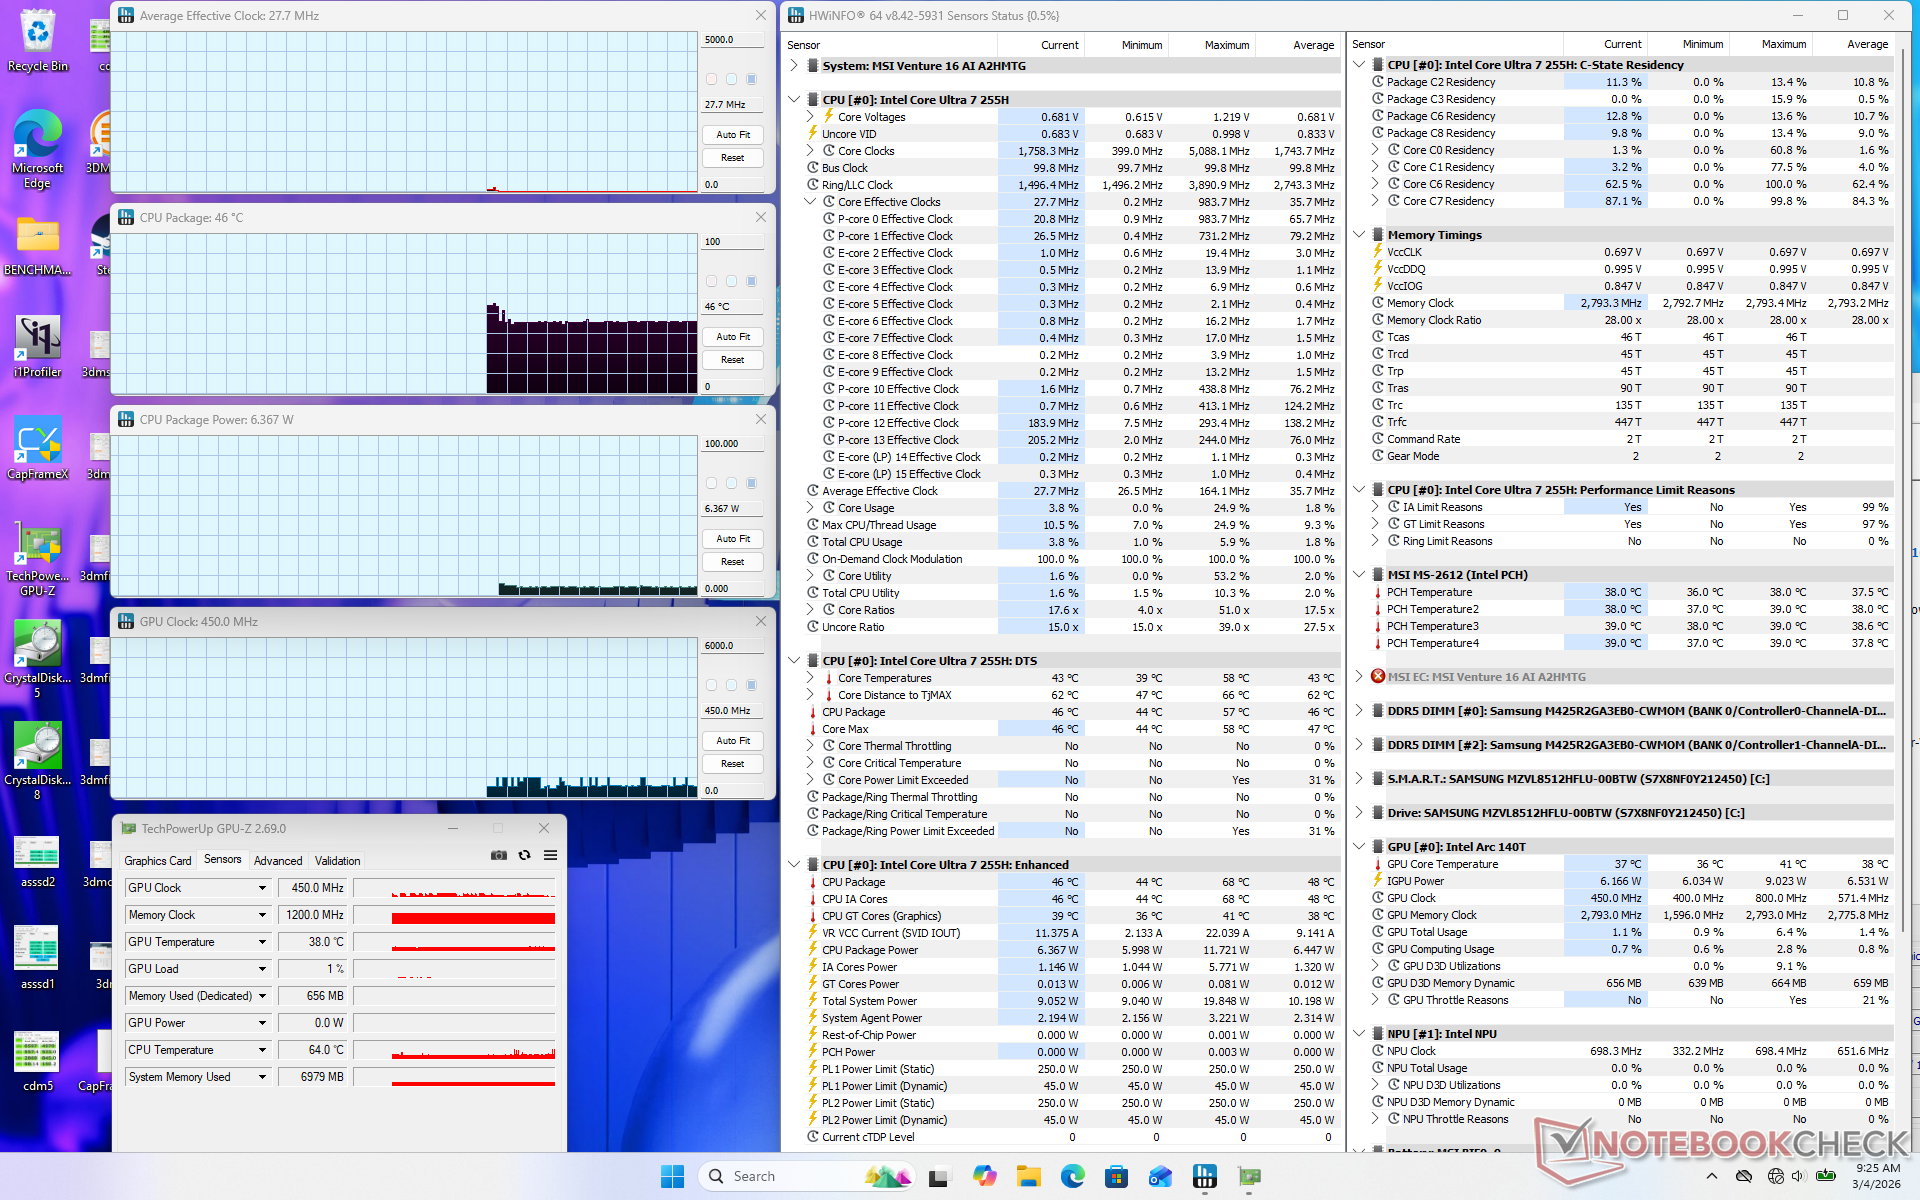
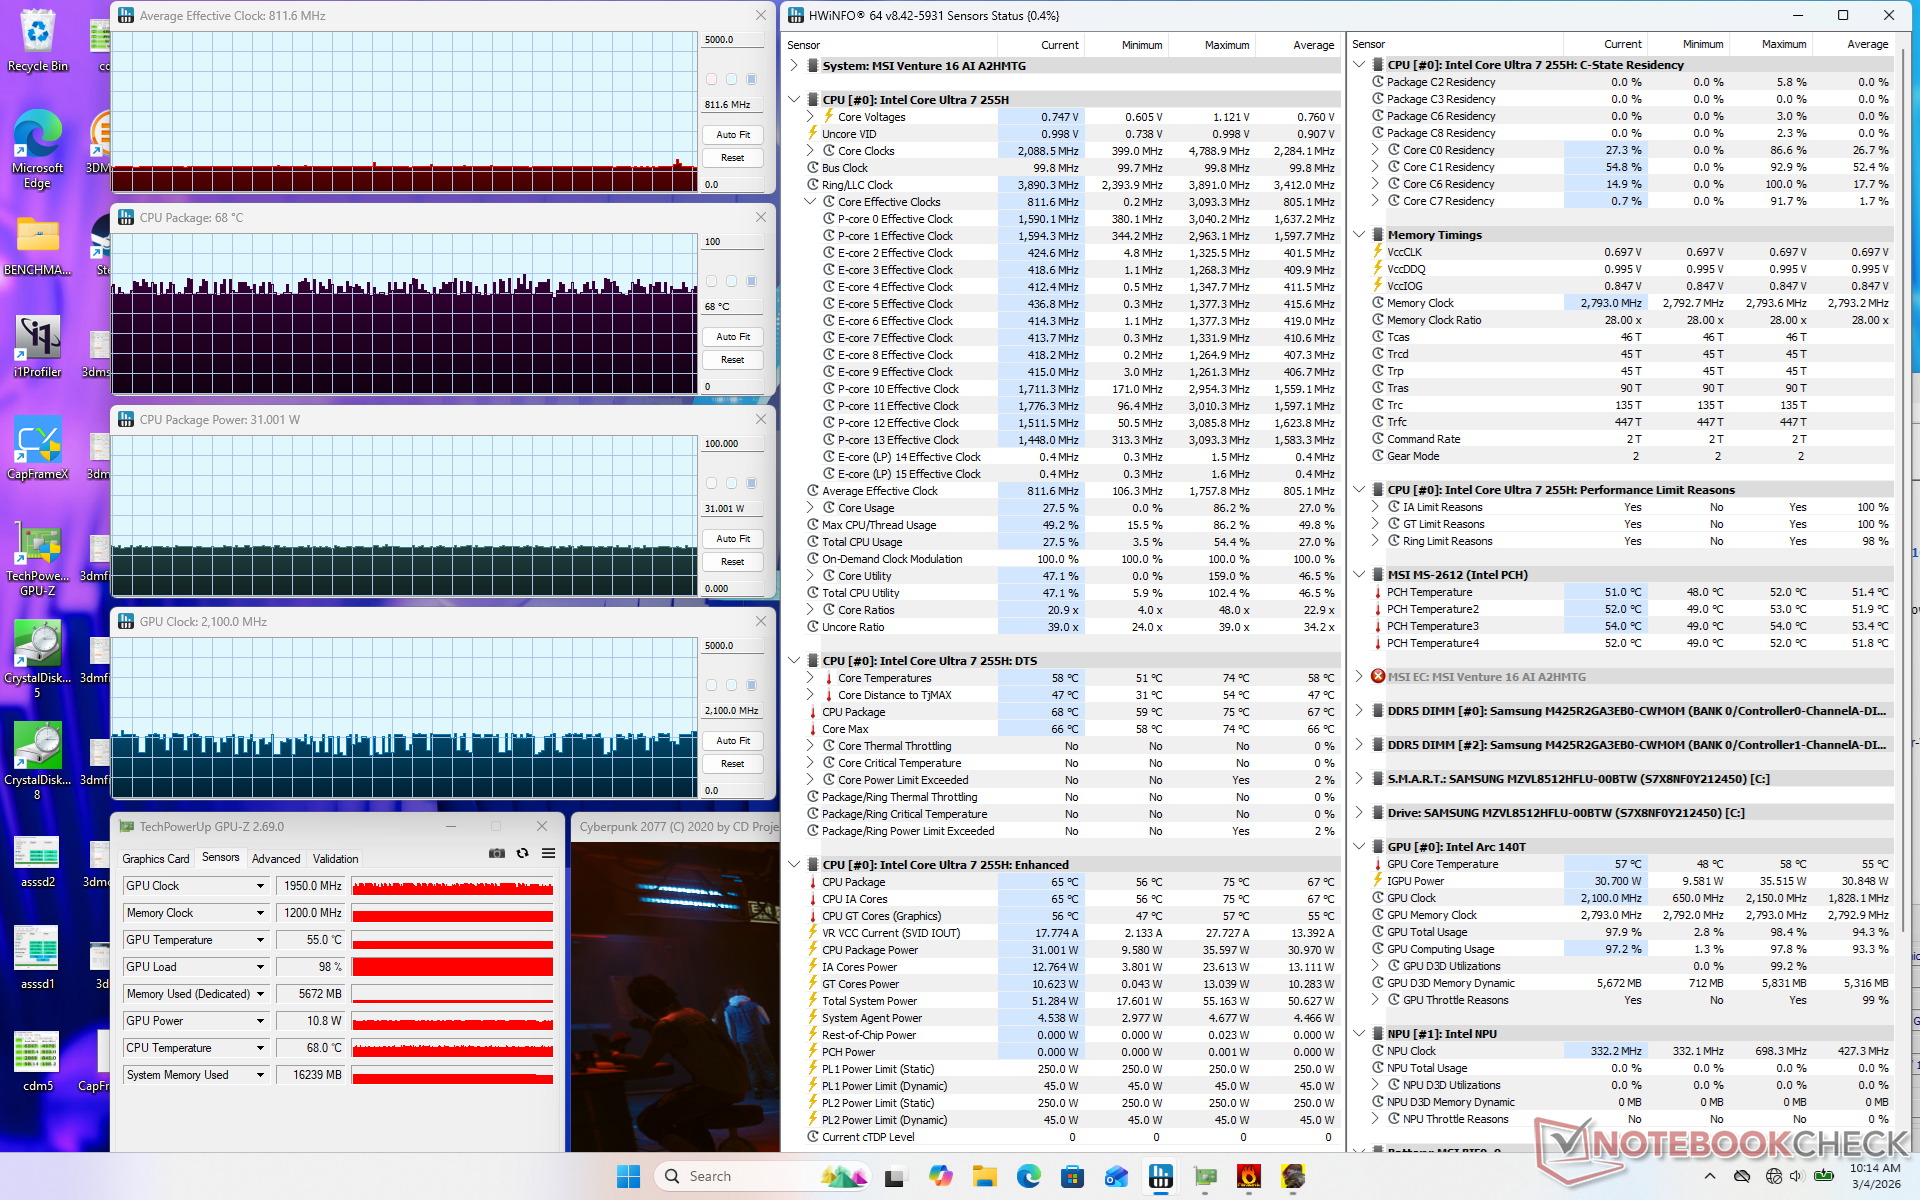
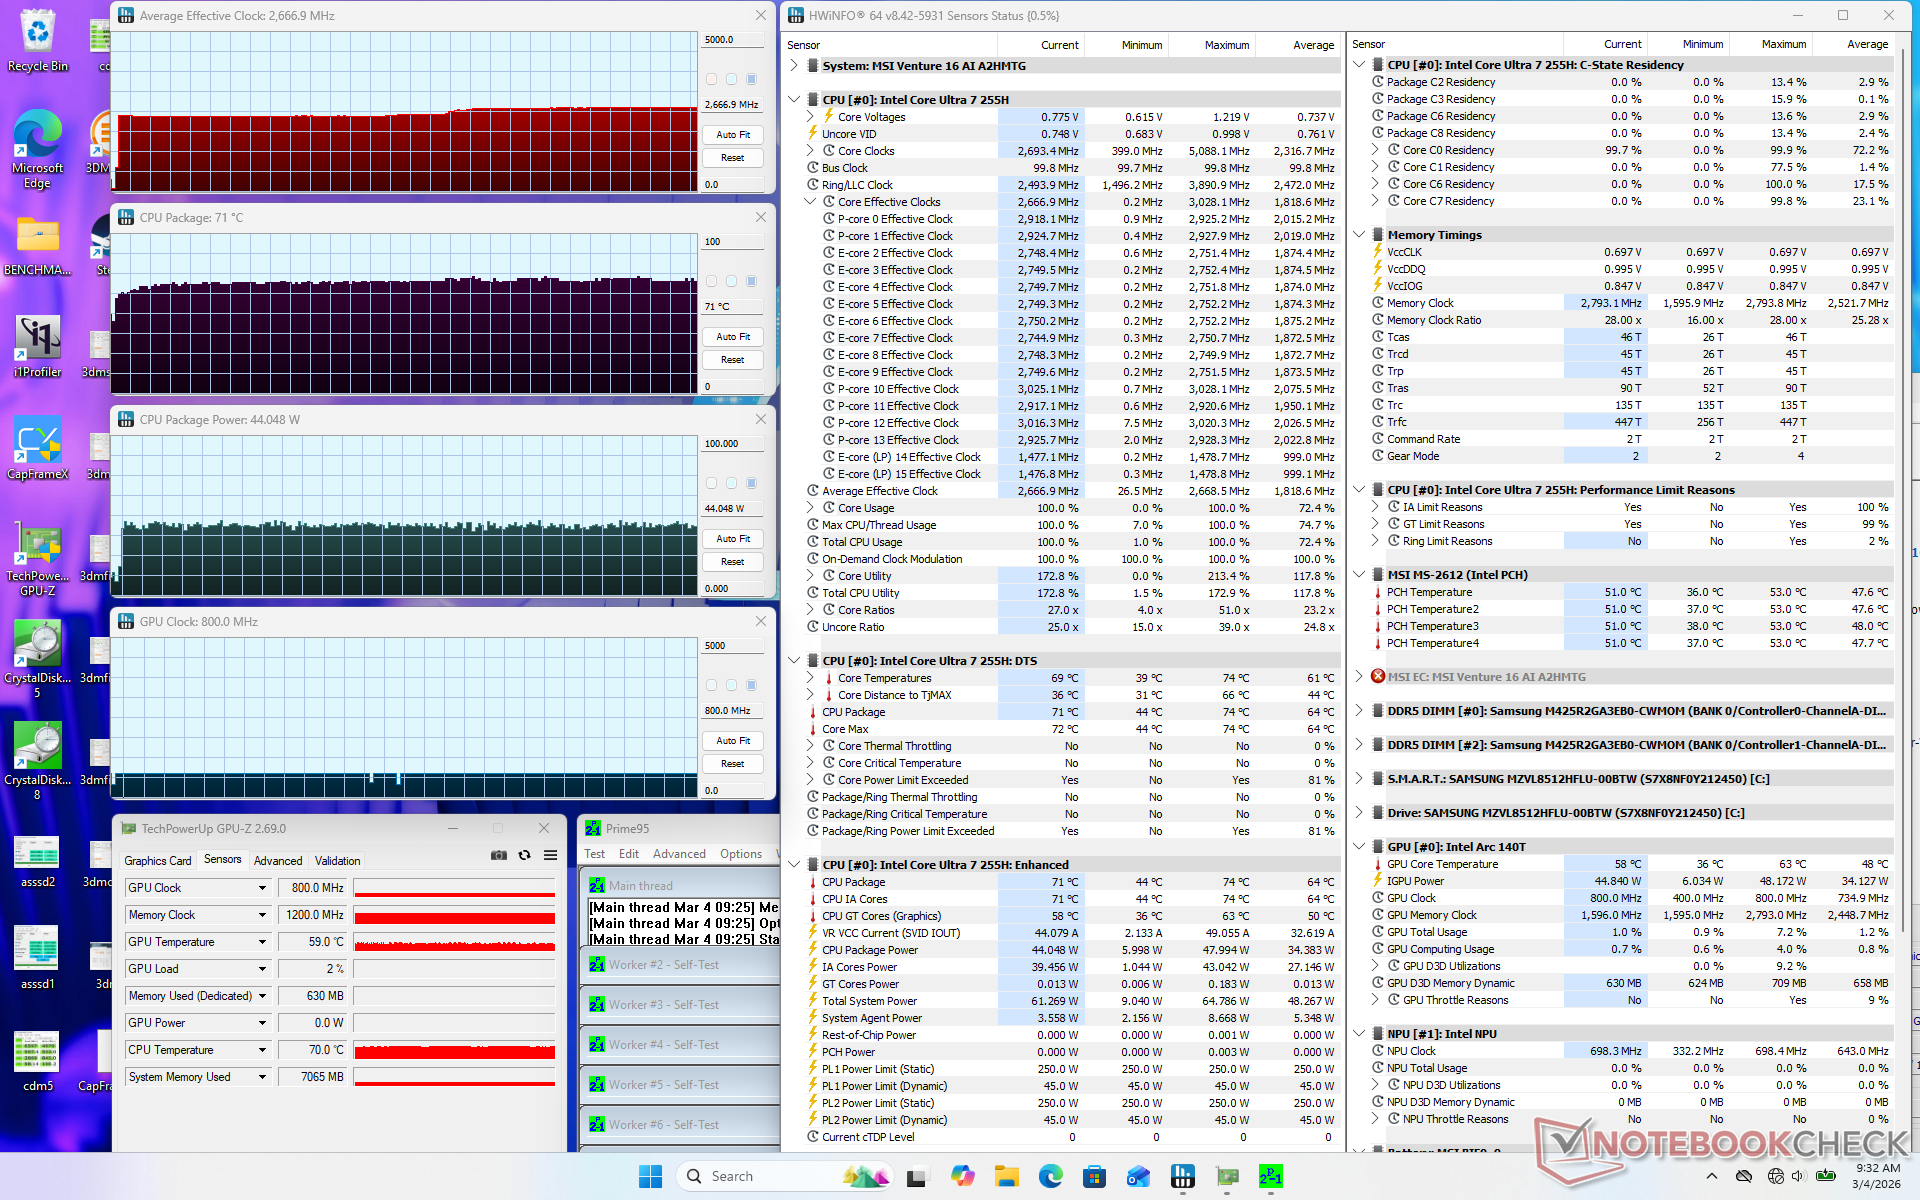
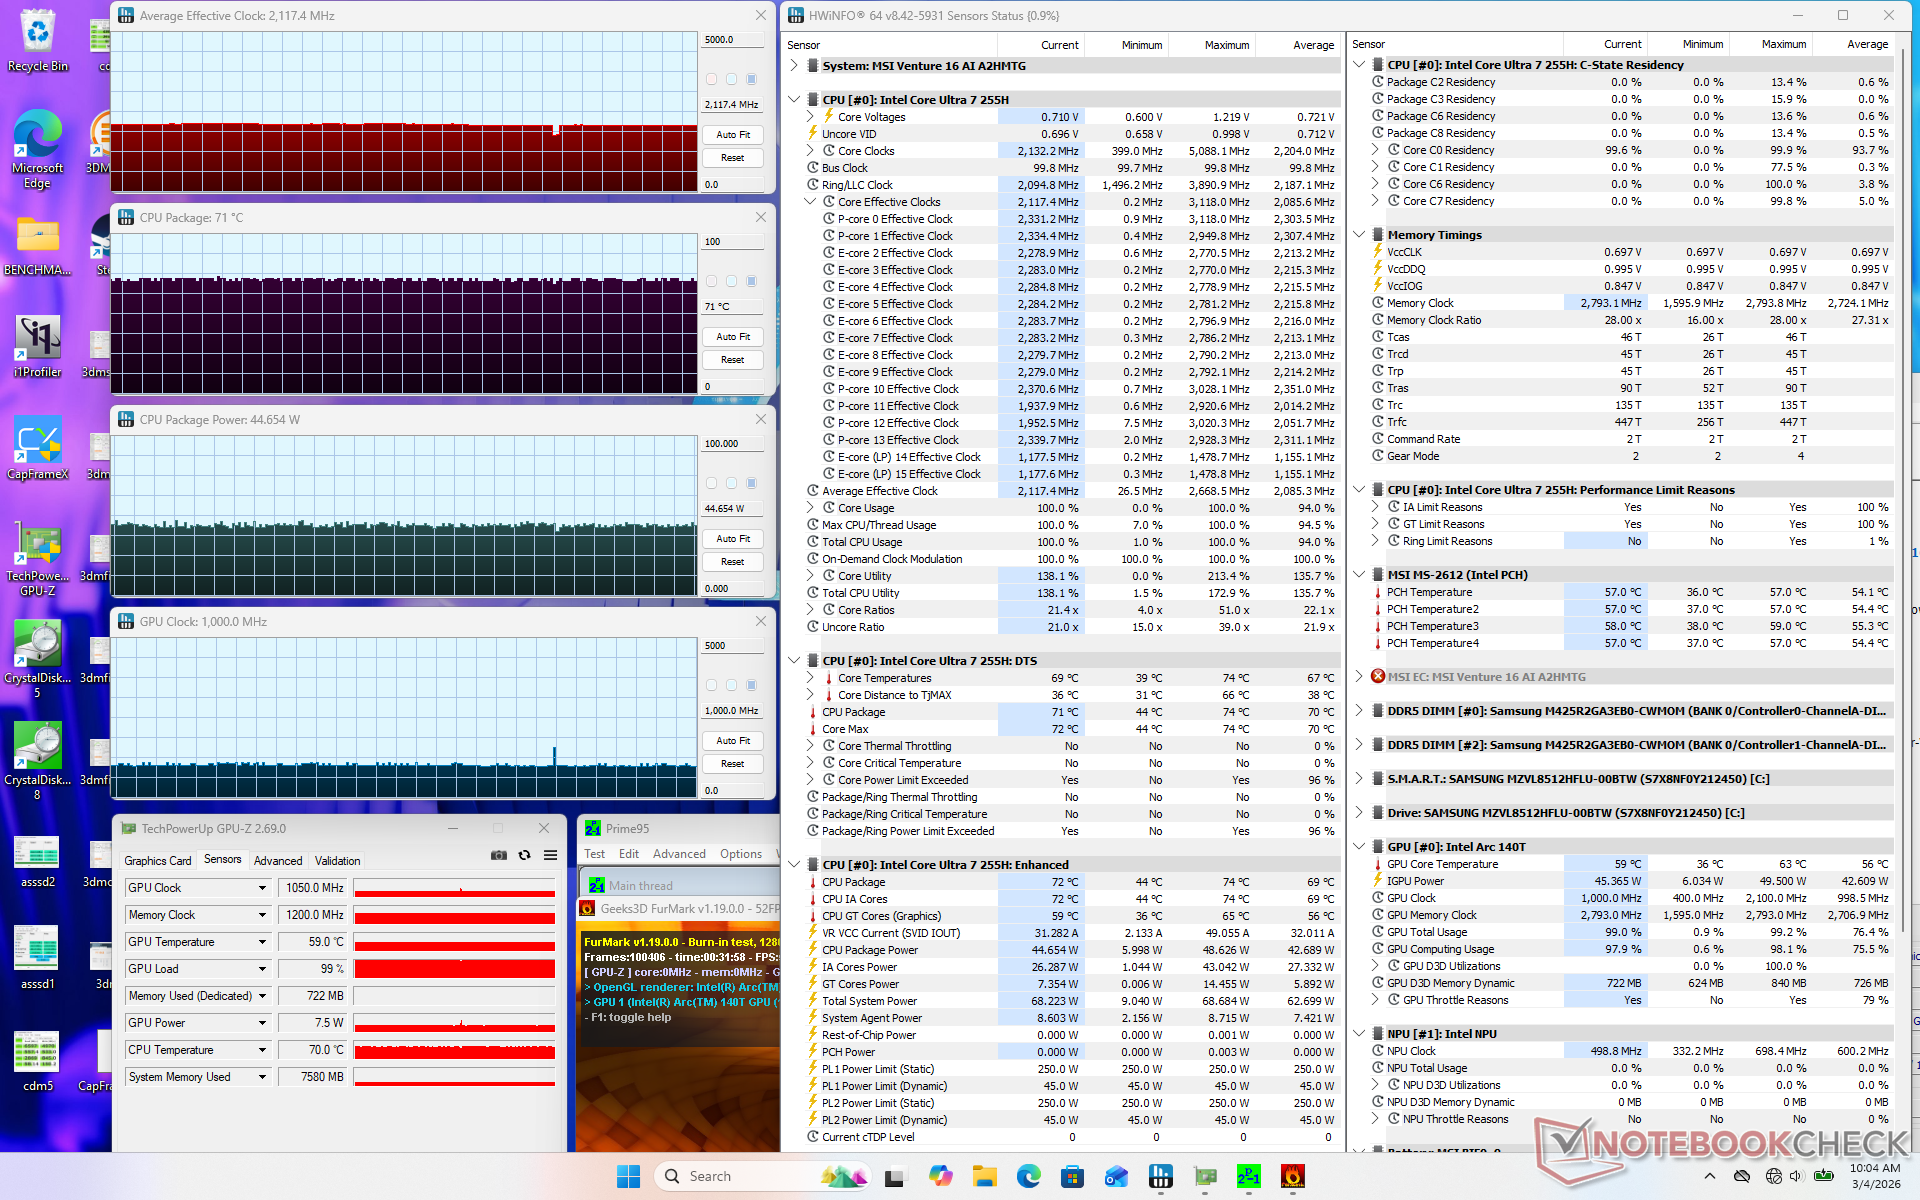
| Ortalama CPU Saati (GHz) | GPU Saati (MHz) | Ortalama CPU Sıcaklığı (°C) | |
| Sistem Boşta | -- | -- | 46 |
| Prime95 Stres | 2.7 | -- | 71 |
| Prime95 + FurMark Stres | 2.1 | 1000 | 71 |
| Cyberpunk 2077 Stres | 0.8 | 1400 - 2100 | 68 |
Konuşmacılar
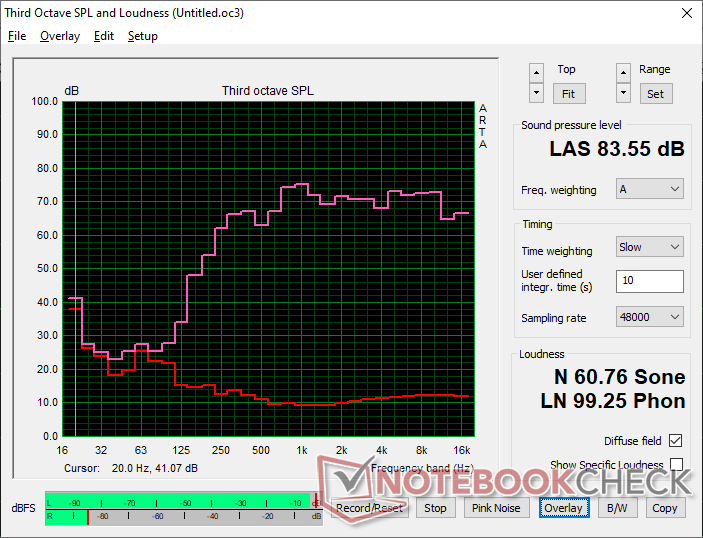
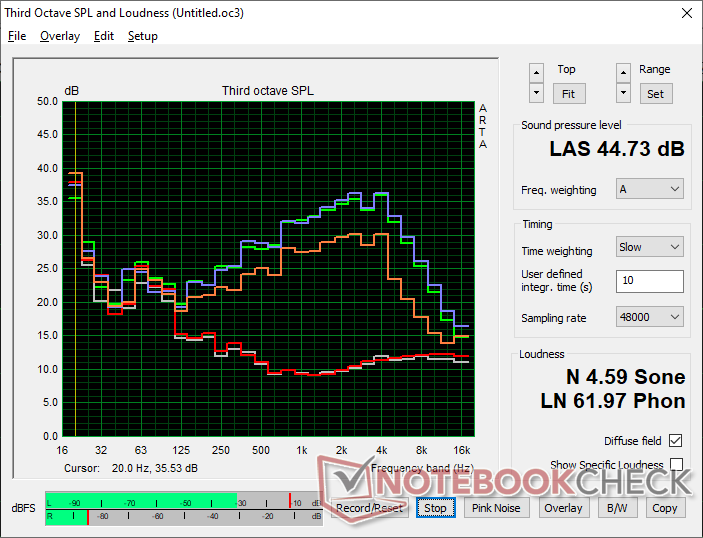
MSI Venture 16 AI A2HMTG ses analizi
(+) | hoparlörler nispeten yüksek sesle çalabilir (83.6 dB)
Bas 100 - 315Hz
(-) | neredeyse hiç bas yok - ortalama olarak medyandan 19.3% daha düşük
(±) | Bas doğrusallığı ortalamadır (12.2% delta - önceki frekans)
Ortalar 400 - 2000 Hz
(+) | dengeli ortalar - medyandan yalnızca 3.6% uzakta
(+) | orta frekanslar doğrusaldır (5.8% deltadan önceki frekansa)
Yüksekler 2 - 16 kHz
(+) | dengeli yüksekler - medyandan yalnızca 3.5% uzakta
(+) | yüksekler doğrusaldır (2.8% deltadan önceki frekansa)
Toplam 100 - 16.000 Hz
(+) | genel ses doğrusaldır (14% ortancaya göre fark)
Aynı sınıfla karşılaştırıldığında
» Bu sınıftaki tüm test edilen cihazların %9%'si daha iyi, 4% benzer, 87% daha kötüydü
» En iyisinin deltası 7% idi, ortalama 21% idi, en kötüsü 53% idi
Test edilen tüm cihazlarla karşılaştırıldığında
» Test edilen tüm cihazların %16'si daha iyi, 4 benzer, % 80 daha kötüydü
» En iyisinin deltası 4% idi, ortalama 23% idi, en kötüsü 134% idi
Apple MacBook Pro 16 2021 M1 Pro ses analizi
(+) | hoparlörler nispeten yüksek sesle çalabilir (84.7 dB)
Bas 100 - 315Hz
(+) | iyi bas - medyandan yalnızca 3.8% uzakta
(+) | bas doğrusaldır (5.2% delta ile önceki frekans)
Ortalar 400 - 2000 Hz
(+) | dengeli ortalar - medyandan yalnızca 1.3% uzakta
(+) | orta frekanslar doğrusaldır (2.1% deltadan önceki frekansa)
Yüksekler 2 - 16 kHz
(+) | dengeli yüksekler - medyandan yalnızca 1.9% uzakta
(+) | yüksekler doğrusaldır (2.7% deltadan önceki frekansa)
Toplam 100 - 16.000 Hz
(+) | genel ses doğrusaldır (4.6% ortancaya göre fark)
Aynı sınıfla karşılaştırıldığında
» Bu sınıftaki tüm test edilen cihazların %0%'si daha iyi, 0% benzer, 100% daha kötüydü
» En iyisinin deltası 5% idi, ortalama 17% idi, en kötüsü 45% idi
Test edilen tüm cihazlarla karşılaştırıldığında
» Test edilen tüm cihazların %0'si daha iyi, 0 benzer, % 100 daha kötüydü
» En iyisinin deltası 4% idi, ortalama 23% idi, en kötüsü 134% idi
Enerji Yönetimi
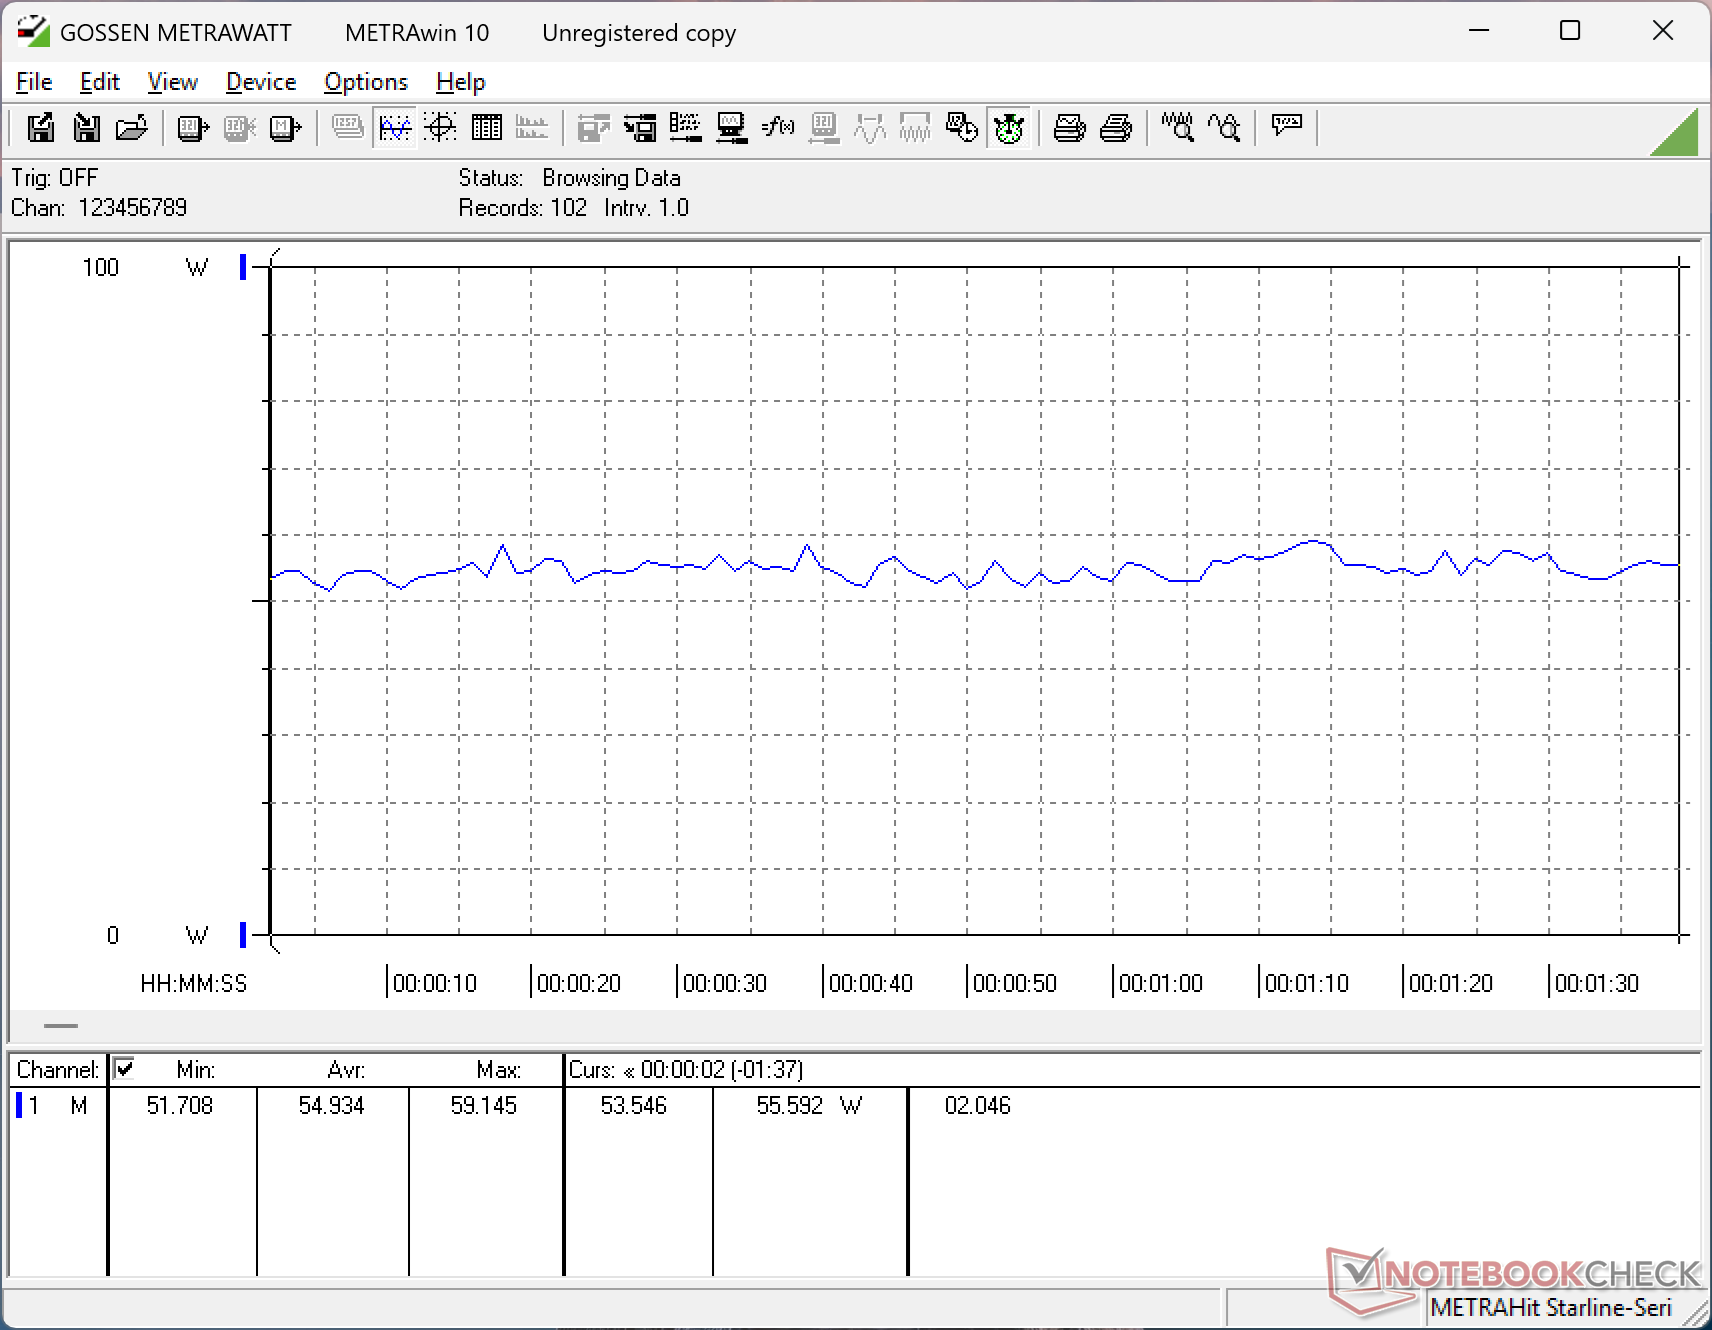
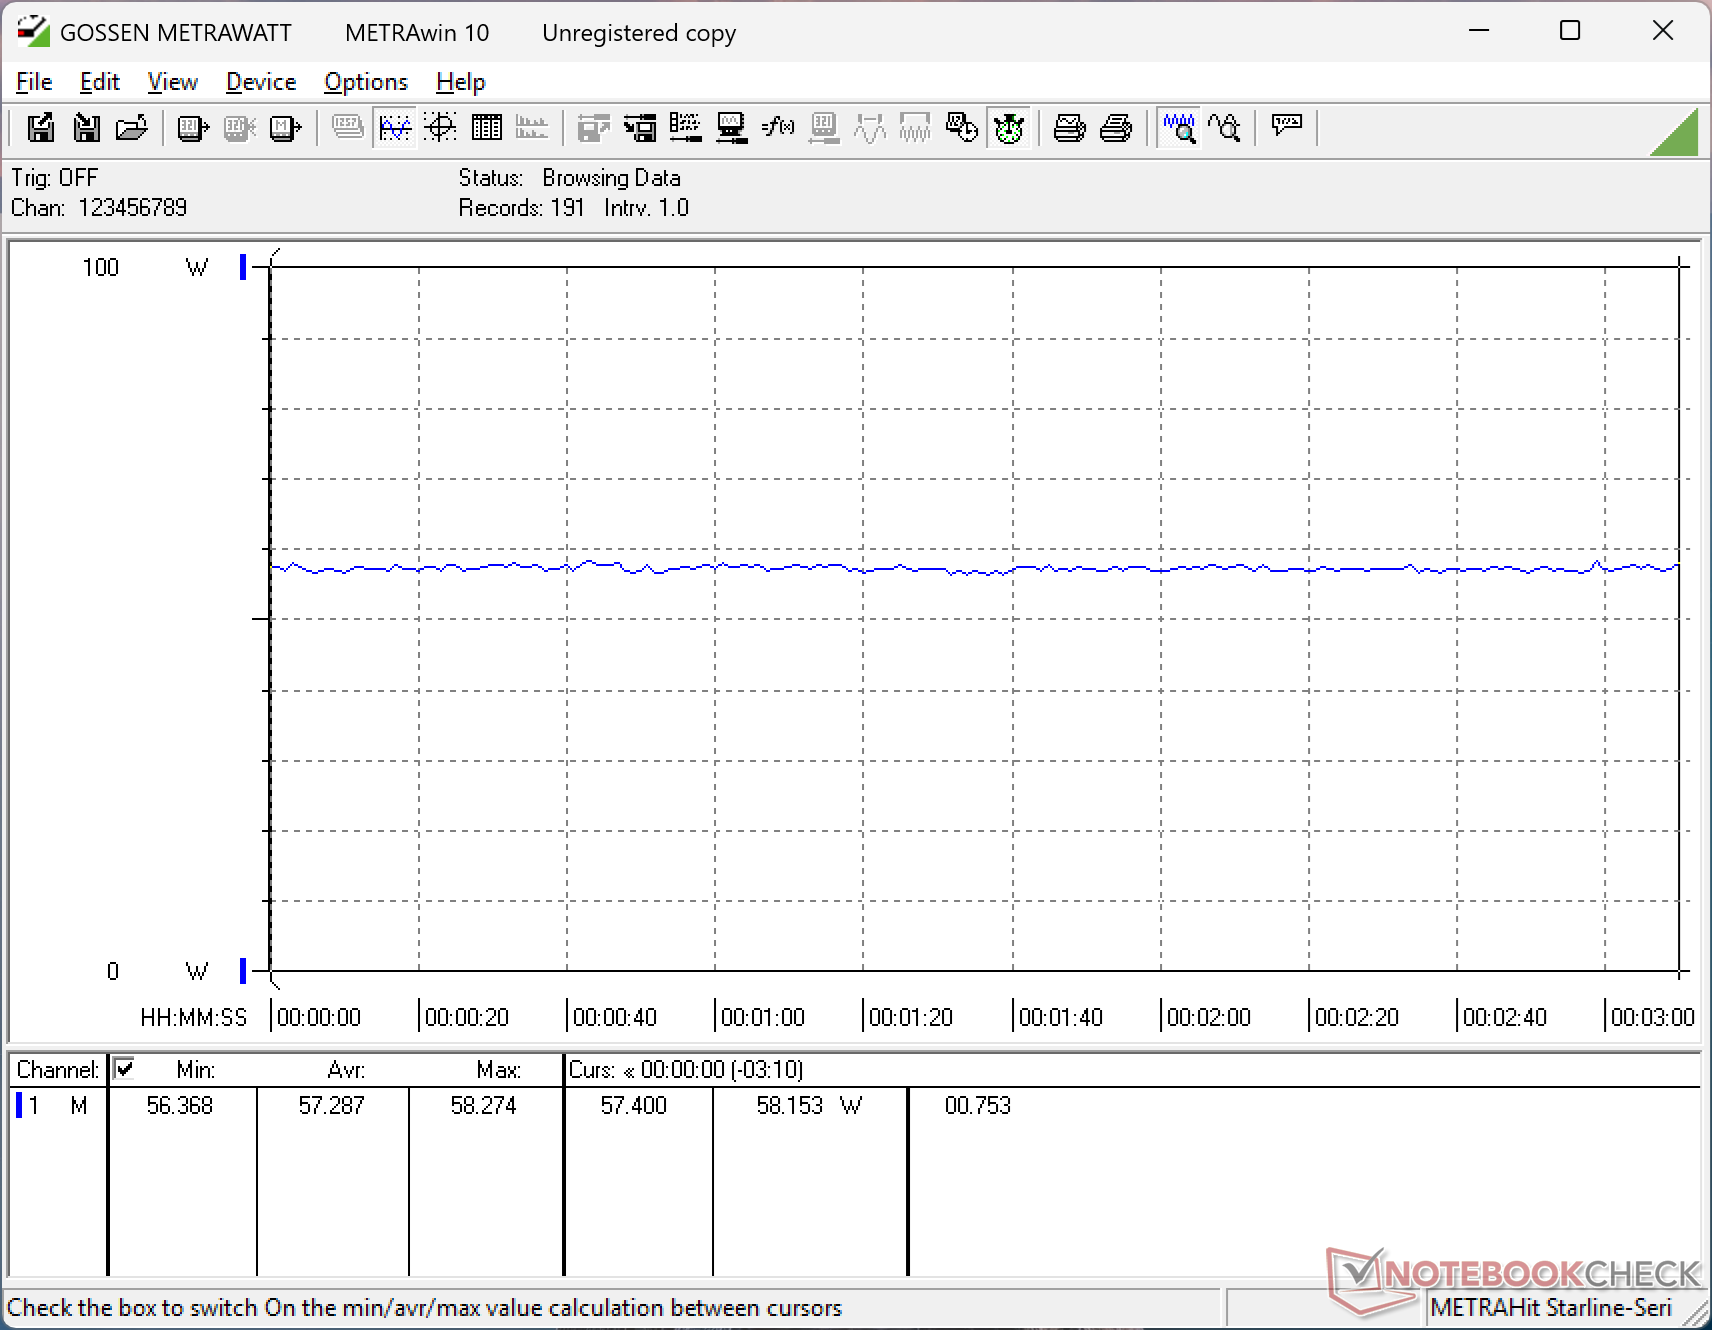
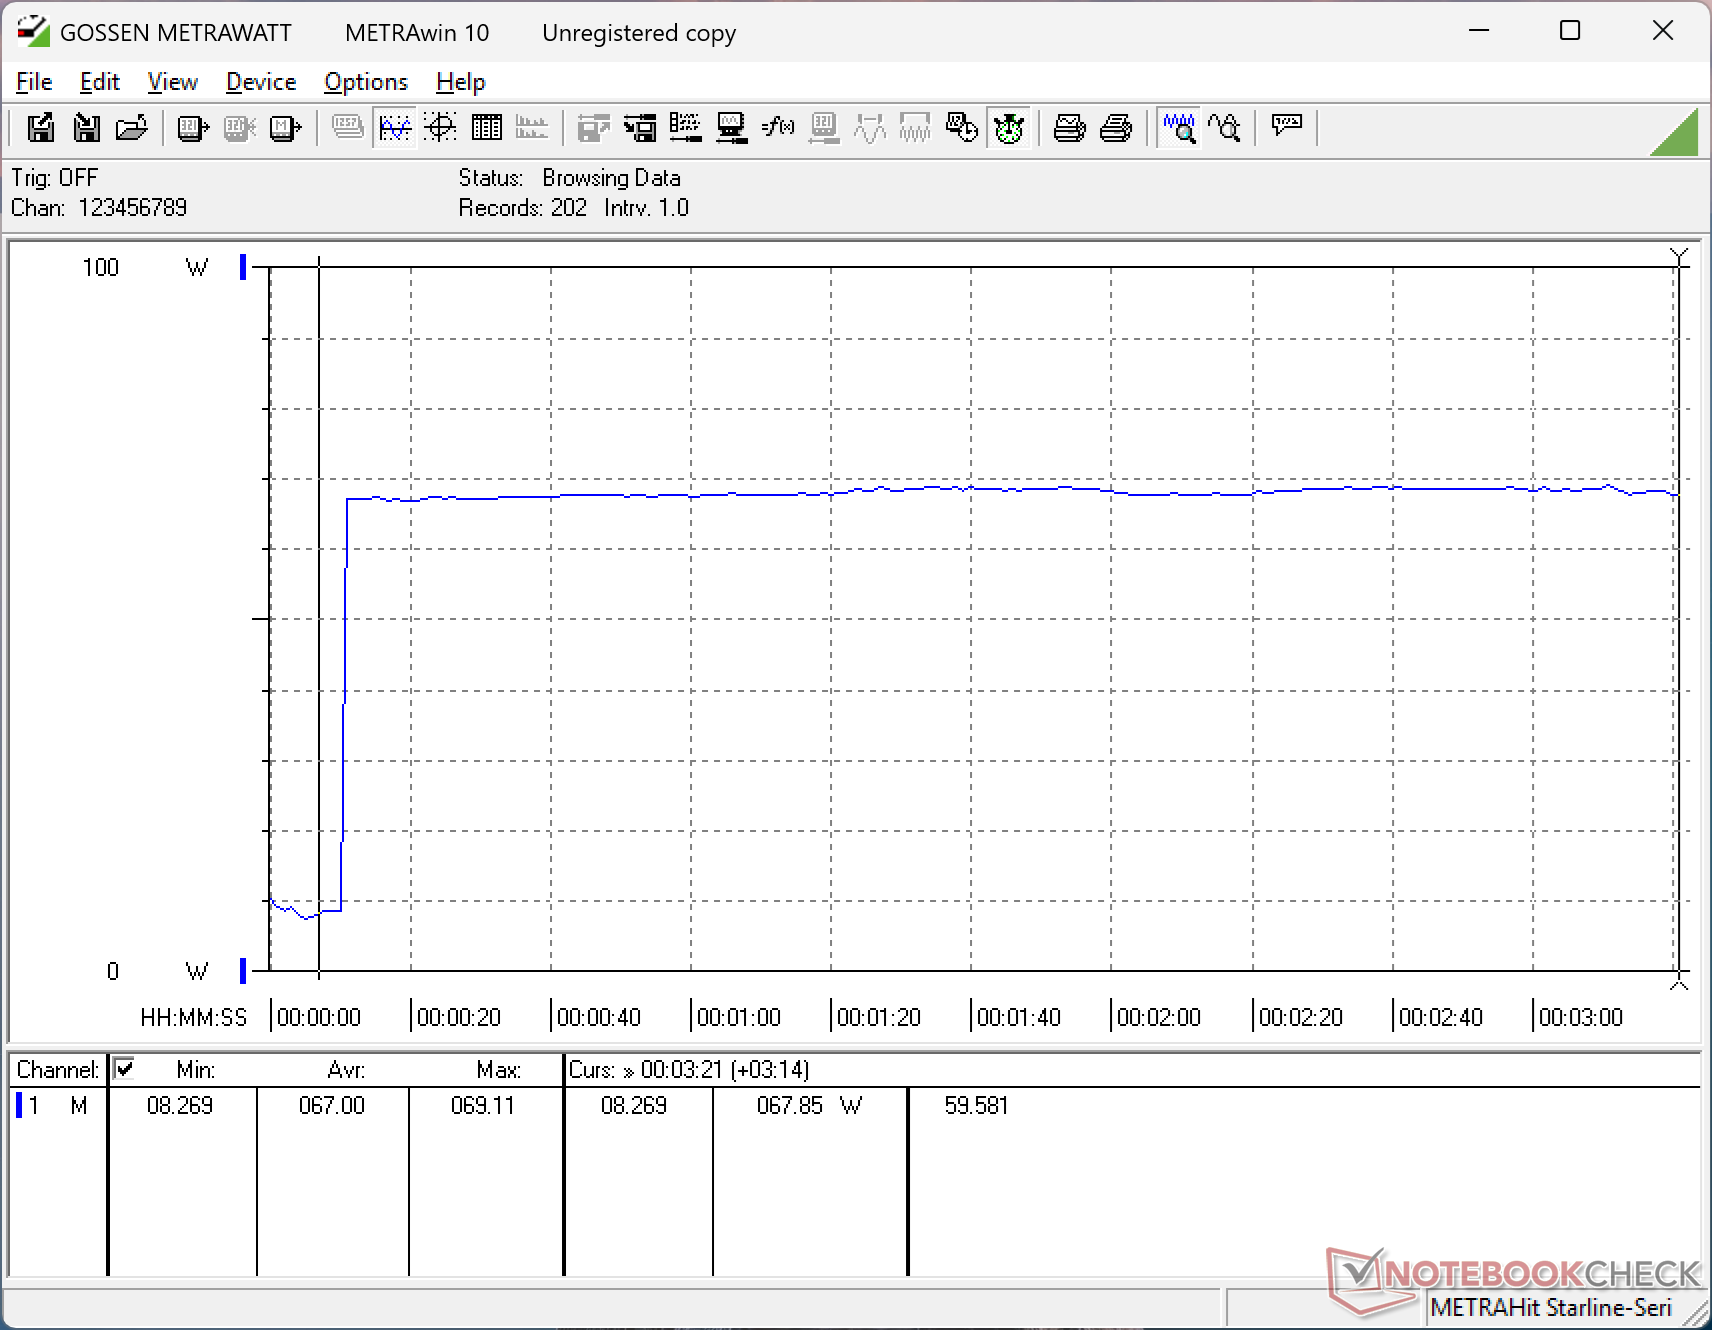
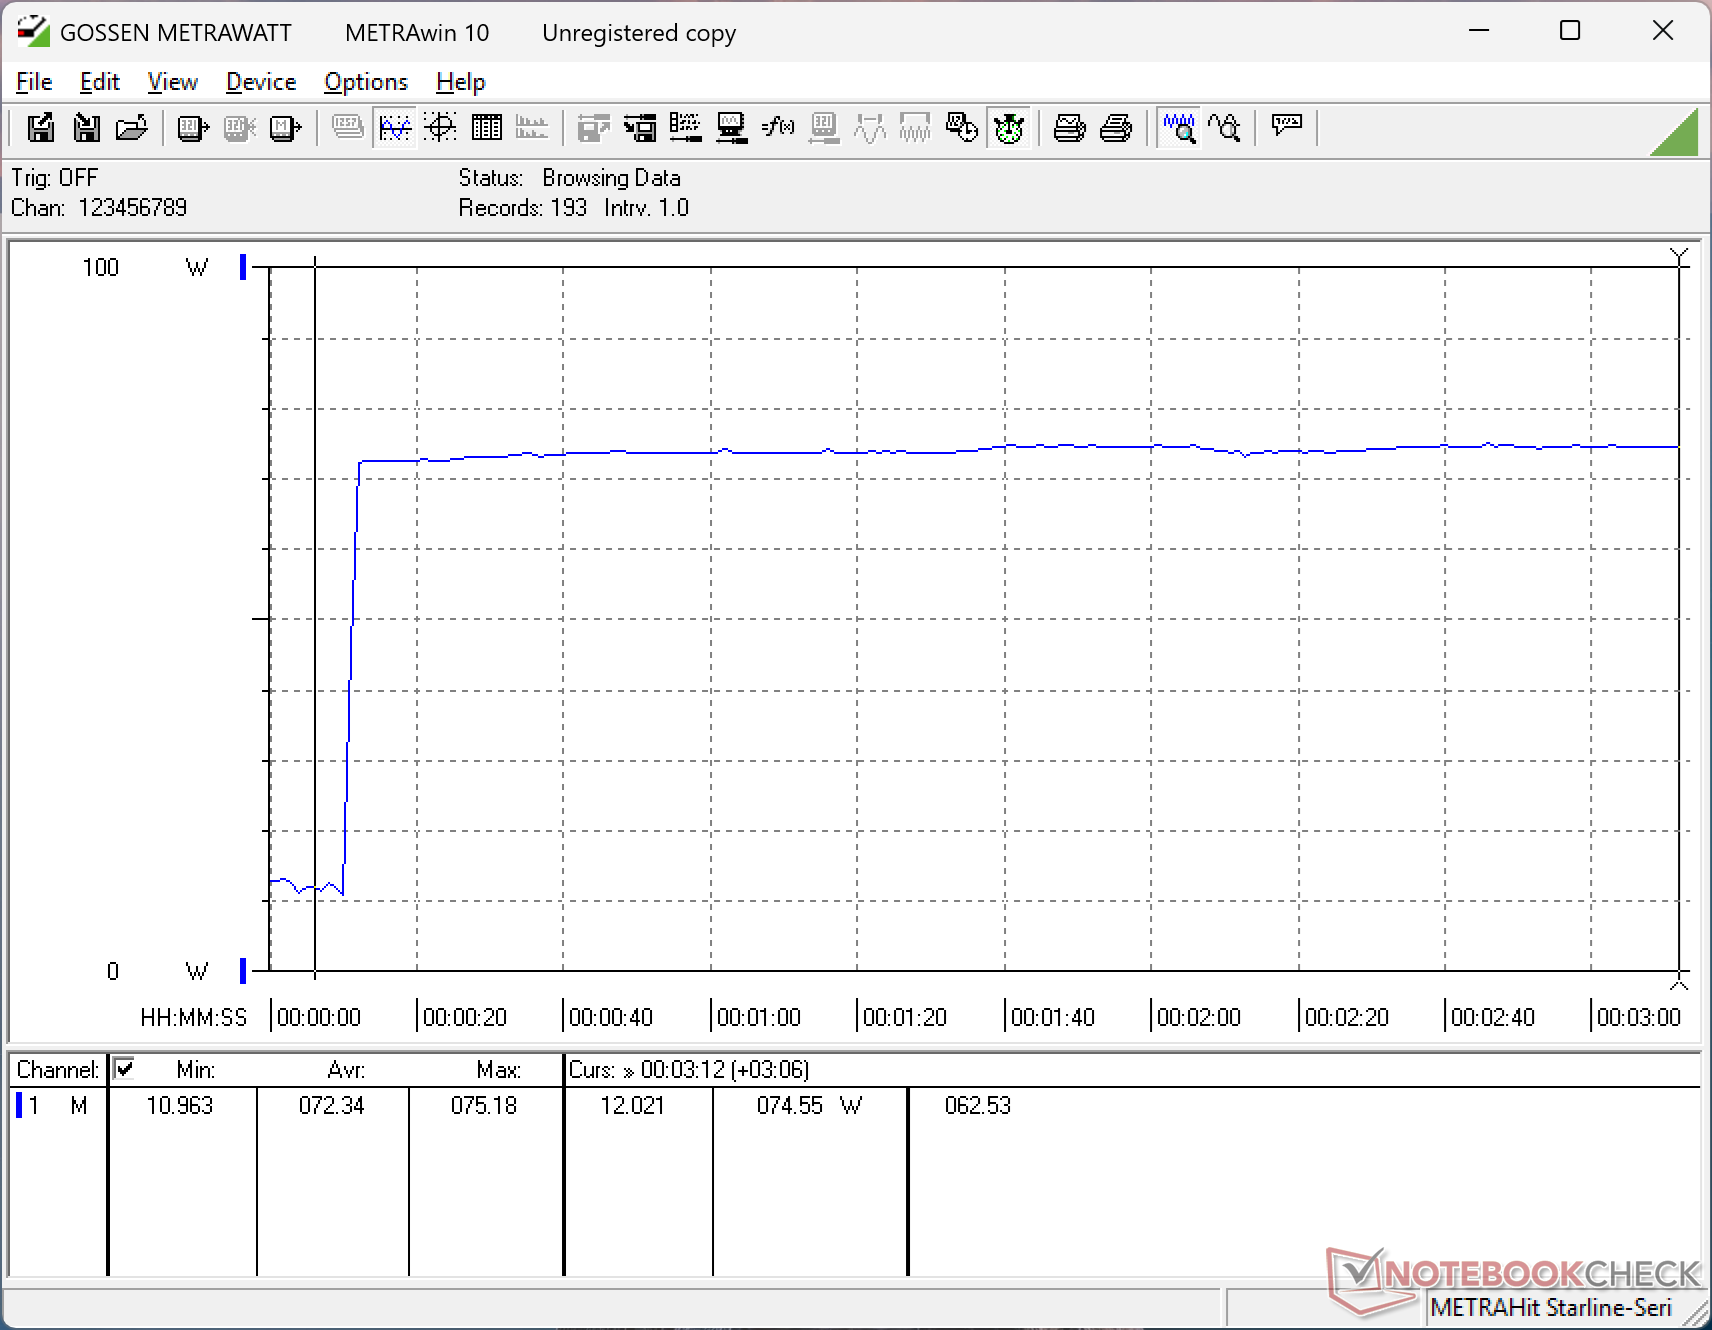
Güç Tüketimi
Genel tüketim, büyük ölçüde daha hızlı Core-H serisi CPU nedeniyle diğer birçok bütçe odaklı 16 inç dizüstü bilgisayardan daha yüksektir. Örneğin, Prime95'i çalıştırmak, Lunar Lake-V destekli cihazda sadece 40 W'a kıyasla neredeyse 70 W gerektirecektir Dell 16 Plus.
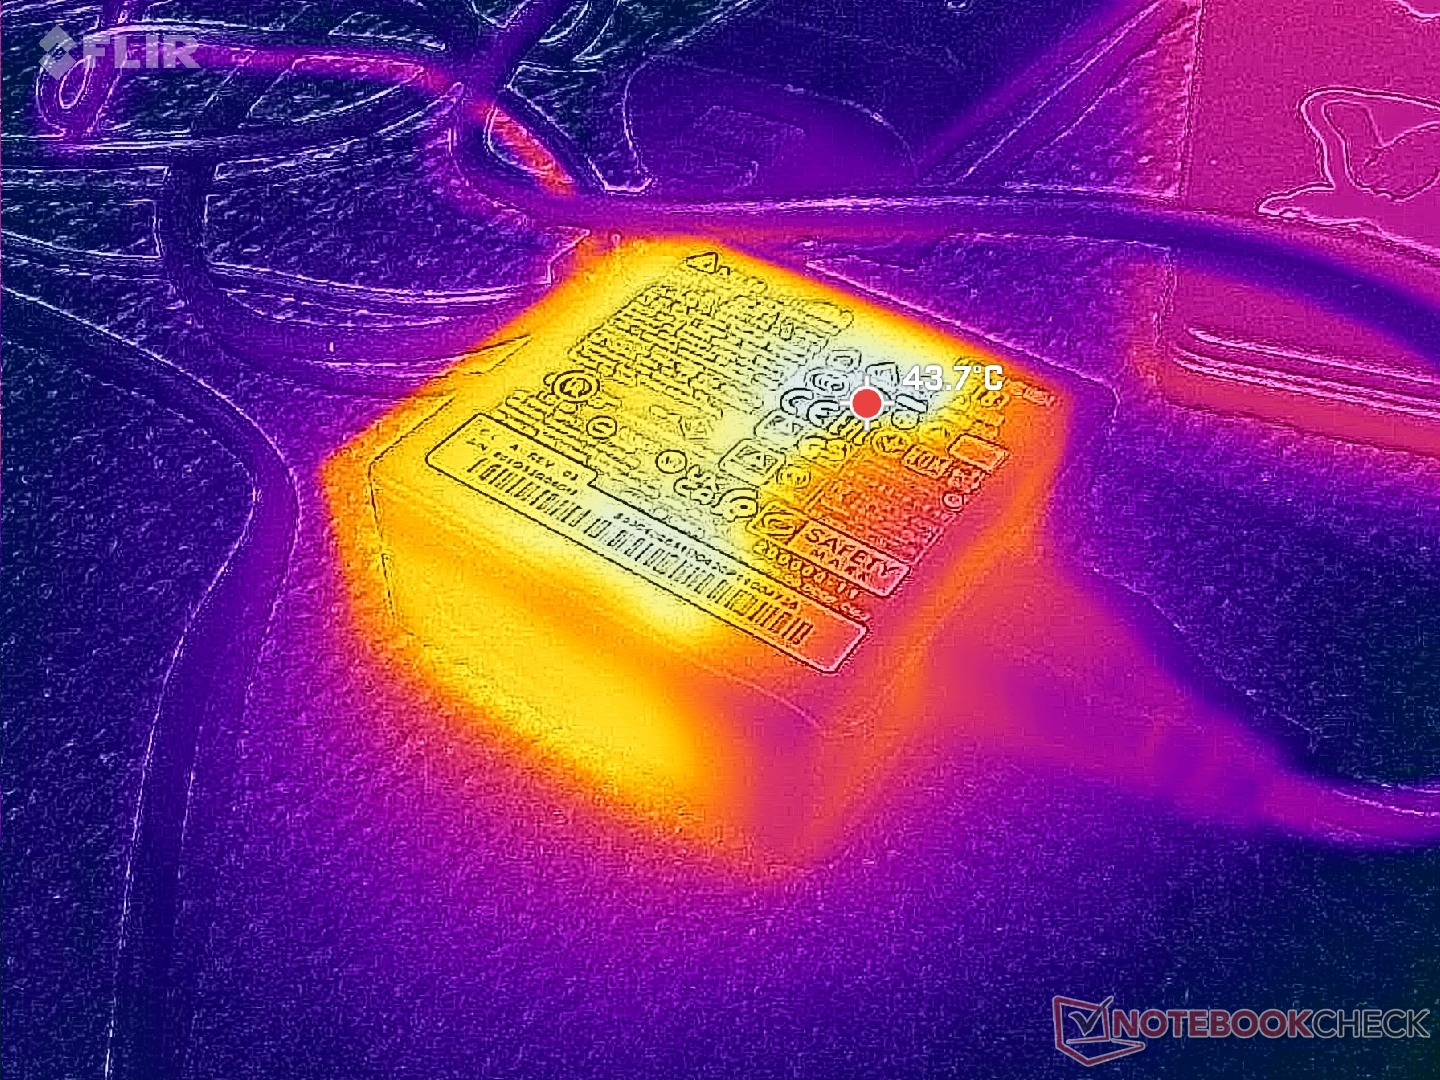
90 W AC adaptörü sadece ~7,5 x 7,5 x 2,8 cm boyutlarında oldukça kompakt. Ancak modelin evrensel USB-C yerine varil AC şarj cihazına dayanması hayal kırıklığı yaratıyor.
| Kapalı / Bekleme modu | |
| Boşta | |
| Çalışırken |
|
Key:
min: | |
| MSI Venture 16 AI A2HMTG Ultra 7 255H, Arc 140T, , IPS, 1920x1200, 16" | MSI Prestige 16 B1MG-001US Ultra 7 155H, Arc 8-Core, Samsung PM9A1 MZVL22T0HBLB, IPS, 2560x1600, 16" | Dell 16 Plus 2-in-1 Core Ultra 7 258V, Arc 140V, Samsung BM9C1 1024GB, Mini-LED, 2560x1600, 16" | Asus V16 V3607V Core 7 240H, GeForce RTX 3050 6GB Laptop GPU, Samsung PM9C1 MZVL8512HELU, IPS, 1920x1200, 16" | HP Pavilion 16-ag0057ng R5 8540U, Radeon 740M, SK hynix BC901 HFS001TEJ4X164N, IPS, 1920x1200, 16" | Lenovo IdeaPad Slim 5 16AKP10 Ryzen AI 5 330, Radeon 820M, Western Digital PC SN5000S SDEPMSJ-512G, IPS, 1920x1200, 16" | |
|---|---|---|---|---|---|---|
| Power Consumption | -10% | -4% | -32% | 33% | 22% | |
| Idle Minimum * (Watt) | 5.9 | 3 49% | 7 -19% | 2.1 64% | 4 32% | 5.2 12% |
| Idle Average * (Watt) | 9 | 9.5 -6% | 13.2 -47% | 7.2 20% | 5 44% | 6 33% |
| Idle Maximum * (Watt) | 9.7 | 12 -24% | 13.4 -38% | 10.7 -10% | 6 38% | 7.7 21% |
| Load Average * (Watt) | 54.9 | 68.3 -24% | 43.9 20% | 99.4 -81% | 40 27% | 44 20% |
| Cyberpunk 2077 ultra * (Watt) | 57.3 | 44.9 22% | 92.1 -61% | 43 25% | 43 25% | |
| Cyberpunk 2077 ultra external monitor * (Watt) | 54.2 | 40.7 25% | 88.7 -64% | 39.1 28% | 40.4 25% | |
| Load Maximum * (Watt) | 72.3 | 104.8 -45% | 67.8 6% | 137.8 -91% | 46 36% | 58 20% |
| Witcher 3 ultra * (Watt) | 59.8 |
* ... daha küçük daha iyidir
Güç Tüketimi Cyberpunk / Stres Testi
Güç Tüketimi harici Monitör
Pil Ömrü
WLAN çalışma süresi, nispeten küçük 55 Wh pil kapasitesiyle yaklaşık 7 saat gibi iyi bir seviyede.
| MSI Venture 16 AI A2HMTG Ultra 7 255H, Arc 140T, 55.2 Wh | MSI Prestige 16 B1MG-001US Ultra 7 155H, Arc 8-Core, 99.9 Wh | Dell 16 Plus 2-in-1 Core Ultra 7 258V, Arc 140V, 64 Wh | Asus V16 V3607V Core 7 240H, GeForce RTX 3050 6GB Laptop GPU, 63 Wh | HP Pavilion 16-ag0057ng R5 8540U, Radeon 740M, 59 Wh | Lenovo IdeaPad Slim 5 16AKP10 Ryzen AI 5 330, Radeon 820M, 60 Wh | |
|---|---|---|---|---|---|---|
| Pil Çalışma Süresi | 161% | 27% | 29% | 63% | 50% | |
| WiFi v1.3 (h) | 7 | 18.3 161% | 8.9 27% | 9 29% | 11.4 63% | 10.5 50% |
| Reader / Idle (h) | 25.1 | |||||
| Load (h) | 2.8 |
Notebookcheck Değerlendirmesi
Venture 16 AI, özellikle temel yapılandırmada iyi servis kolaylığı ancak bunun dışında sınırlı yeteneklere sahip daha temel MSI tekliflerinden biridir.
MSI Venture 16 AI A2HMTG
- 03/06/2026 v8
Allen Ngo
 Total Sustainability Score:
 Karşılaştırmada Potansiyel Rakipler
Resim | Modeli / incelemeler | Fiyat | Ağırlık | Yükseklik | Ekran |
|---|---|---|---|---|---|
1. 80.7%  | MSI Venture 16 AI A2HMTG Intel Core Ultra 7 255H ⎘ Intel Arc Graphics 140T ⎘ 32 GB Bellek | Amazon: Liste fiyatı: 1000 USD | 2.1 kg | 23.15 mm | 16.00" 1920x1200 142 PPI IPS |
2. 88.1% v7 (old)  | MSI Prestige 16 B1MG-001US Intel Core Ultra 7 155H ⎘ Intel Arc 8-Core iGPU ⎘ 32 GB Bellek, 2048 GB SSD | Amazon: 1. $43.99 AC Adapter Charger Compatibl... 2. $130.00 16.0 inch WQXGA 2560(RGB)*16... 3. $140.00 Replacement Screen 16.0 inch... Liste fiyatı: 1300 USD | 1.6 kg | 19.1 mm | 16.00" 2560x1600 189 PPI IPS |
3. 83.5%  | Dell 16 Plus 2-in-1 Intel Core Ultra 7 258V ⎘ Intel Arc Graphics 140V ⎘ 32 GB Bellek, 1024 GB SSD | Amazon: $1,149.99 Liste fiyatı: 1500 USD | 2 kg | 16.99 mm | 16.00" 2560x1600 189 PPI Mini-LED |
4. 78.5%  | Asus V16 V3607V Intel Core 7 240H ⎘ NVIDIA GeForce RTX 3050 6GB Laptop GPU ⎘ 16 GB Bellek, 512 GB SSD | Amazon: 1. $49.99 180W 150W 20V 9A Charger for... 2. $125.98 KrystalPix Replacement LCD f... 3. $125.98 KrystalPix Replacement LCD f... Liste fiyatı: 900 USD | 2 kg | 22 mm | 16.00" 1920x1200 142 PPI IPS |
5. 77.3%  | HP Pavilion 16-ag0057ng AMD Ryzen 5 8540U ⎘ AMD Radeon 740M ⎘ 16 GB Bellek, 1024 GB SSD | Amazon: Liste fiyatı: 730 EUR | 1.7 kg | 18.6 mm | 16.00" 1920x1200 142 PPI IPS |
6. 80.8%  | Lenovo IdeaPad Slim 5 16AKP10 AMD Ryzen AI 5 330 ⎘ AMD Radeon 820M ⎘ 16 GB Bellek, 512 GB SSD | Amazon: Liste fiyatı: 700 EUR | 1.9 kg | 18.4 mm | 16.00" 1920x1200 142 PPI IPS |
Şeffaflık
İncelenecek cihazların seçimi editör ekibimiz tarafından yapılır. Test örneği, bu incelemenin amacı doğrultusunda üretici veya perakendeci tarafından yazara ödünç olarak sağlanmıştır. Borç verenin bu inceleme üzerinde herhangi bir etkisi olmadığı gibi, üretici de yayınlanmadan önce bu incelemenin bir kopyasını almamıştır. Bu incelemeyi yayınlama zorunluluğu yoktu. Bağımsız bir medya şirketi olarak Notebookcheck, üreticilerin, perakendecilerin veya yayıncıların otoritesine tabi değildir.
Notebookcheck bu şekilde test yapıyor
Notebookcheck, tüm sonuçların karşılaştırılabilir olmasını sağlamak için her yıl yüzlerce dizüstü bilgisayarı ve akıllı telefonu standart prosedürler kullanarak bağımsız olarak inceliyor. Yaklaşık 20 yıldır test yöntemlerimizi sürekli olarak geliştirdik ve bu süreçte endüstri standartlarını belirledik. Test laboratuvarlarımızda deneyimli teknisyenler ve editörler tarafından yüksek kaliteli ölçüm ekipmanları kullanılmaktadır. Bu testler çok aşamalı bir doğrulama sürecini içerir. Karmaşık derecelendirme sistemimiz, nesnelliği koruyan yüzlerce sağlam temellere dayanan ölçüm ve kıyaslamaya dayanmaktadır.
