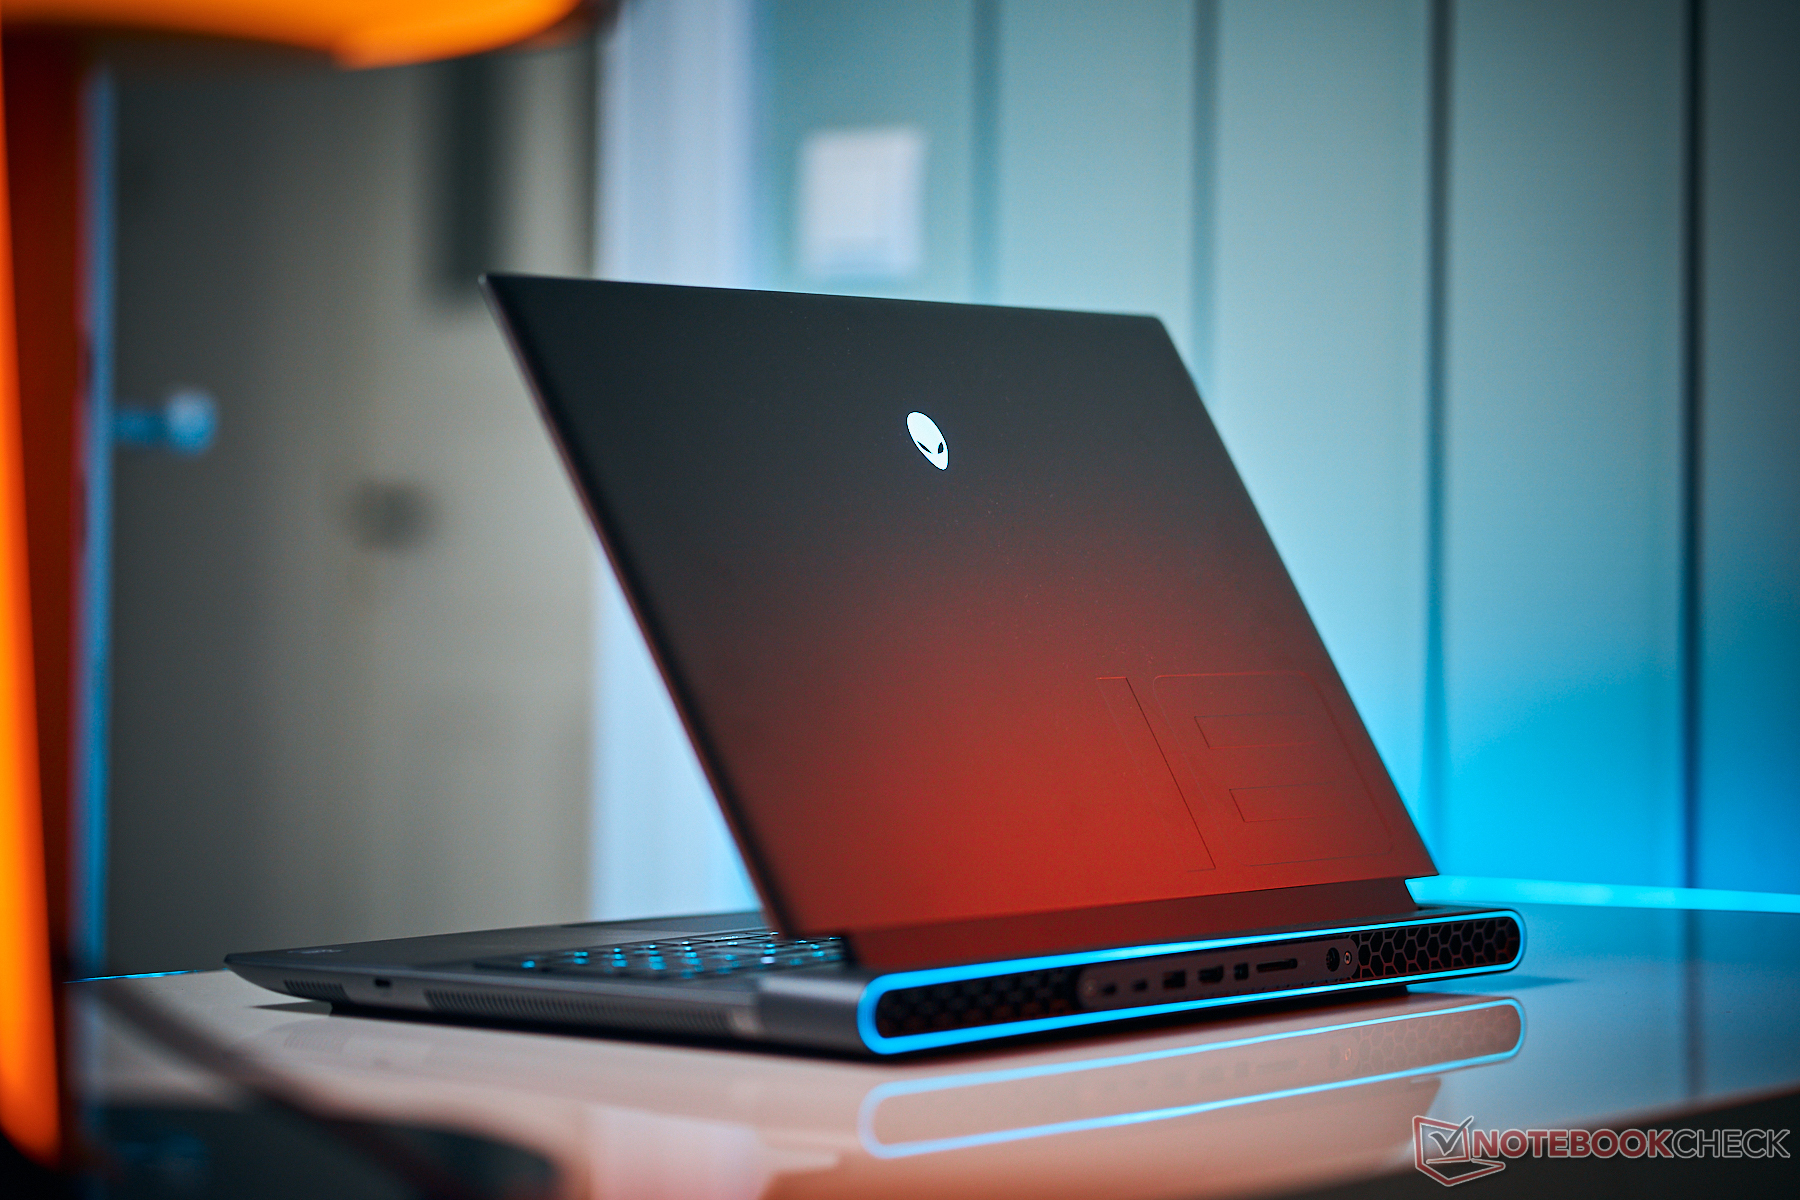
Alienware m18 R2 dizüstü bilgisayar incelemesi: Core i9-13980HX'ten i9-14900HX'e geçiş

Dell, Alienware m18 serisini bu yıl yeni m18 R2 ile yeniledi. M18'den farklı olarak m16 R1 için m16 R2bununla birlikte, m18 R2 selefiyle aynı kasa tasarımını kullanıyor ancak eski Core ix-13000HX seçeneklerinin yerini yeni Raptor Lake-HX Core ix-14000HX CPU'lar alıyor. Neredeyse diğer her şey değişmeden kalıyor ve bu nedenle m18 R2 ile ilgili mevcut incelemelerimize göz atmanızı öneririz m18 R1 ve m18 R1 AMD m18 r2'nin fiziksel özellikleri hakkında daha fazla bilgi edinmek için konfigürasyonlar.
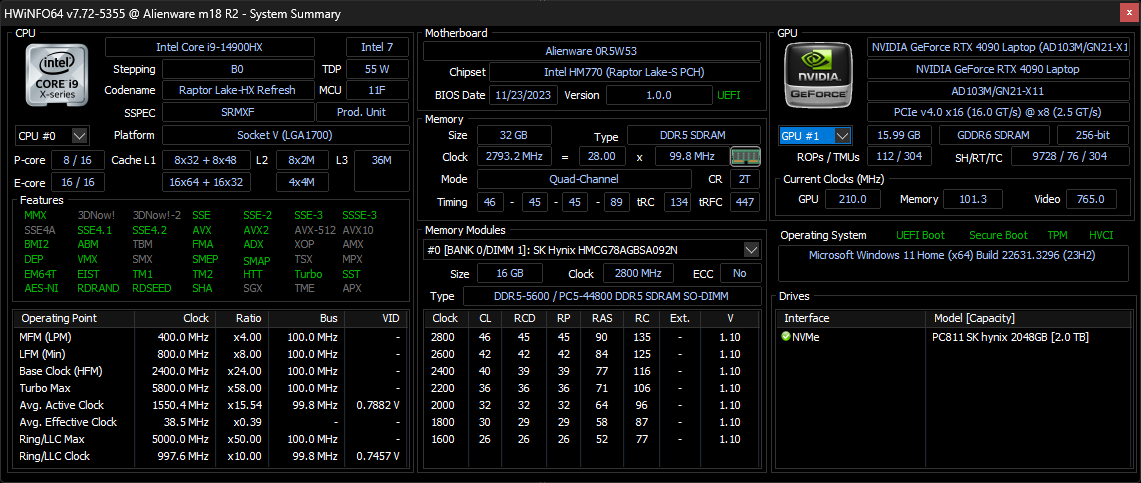
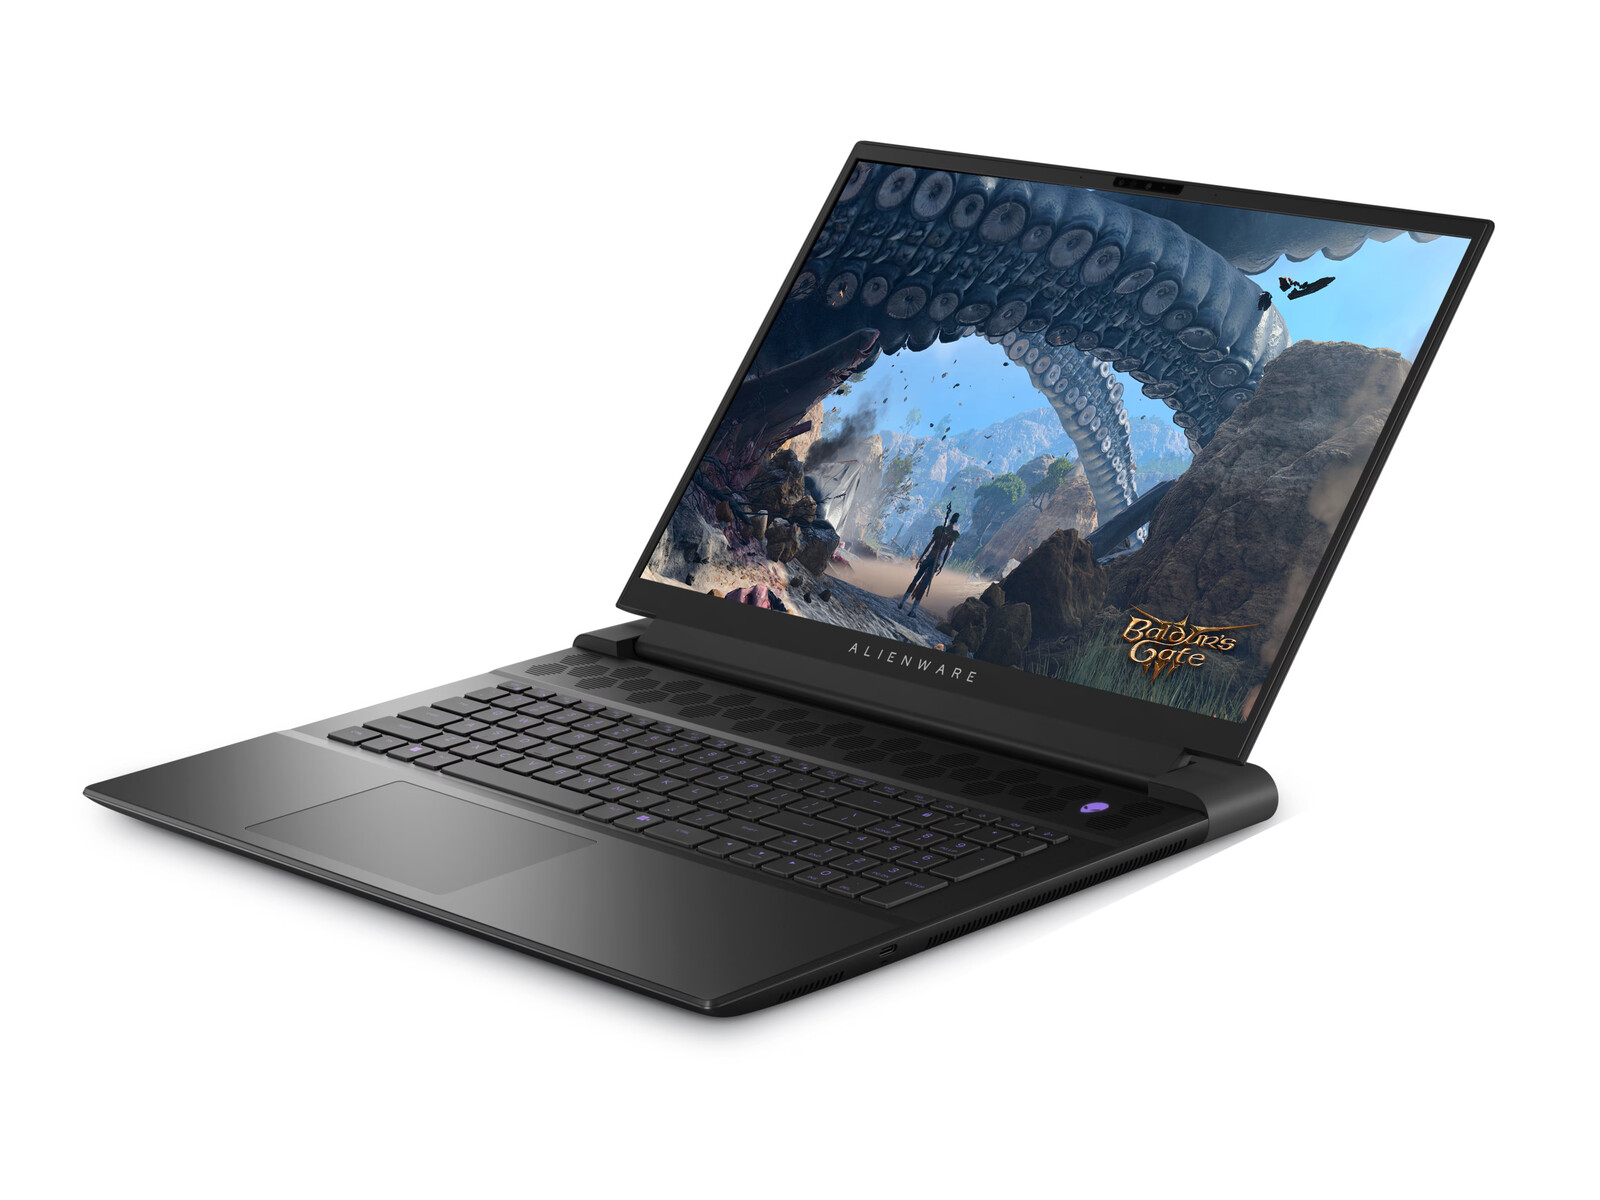
İnceleme birimimiz Core i9-14900HX CPU, 175 W GeForce RTX 4090 GPU, 1600p 165 Hz IPS ekran ve CherryMX ultra düşük profilli mekanik klavye ile yaklaşık 3200 $ karşılığında en üst düzey yapılandırmadır. Diğer SKU'lar Core i7-14650HX, RTX 4060, 1200p 480 Hz ekran ve standart membran tabanlı klavyeyi 2000 doların biraz altından başlayan fiyatlarla içerebilir.
Daha fazla Alienware incelemesi:
Karşılaştırmalı olarak olası rakipler
Derecelendirme | Tarih | Modeli | Ağırlık | Yükseklik | Boyut | Çözünürlük | Fiyat |
|---|---|---|---|---|---|---|---|
| 89.5 % v7 (old) | 03/2024 | Alienware m18 R2 i9-14900HX, GeForce RTX 4090 Laptop GPU | 4 kg | 26.7 mm | 18.00" | 2560x1600 | |
| 89.2 % v7 (old) | 11/2023 | Alienware m18 R1 AMD R9 7945HX, Radeon RX 7900M | 3.9 kg | 26.7 mm | 18.00" | 1920x1200 | |
| 90.7 % v7 (old) | 04/2023 | Alienware m18 R1 i9-13980HX, GeForce RTX 4090 Laptop GPU | 3.9 kg | 26.7 mm | 18.00" | 1920x1200 | |
| 88.8 % v7 (old) | 01/2024 | MSI Titan 18 HX A14VIG i9-14900HX, GeForce RTX 4090 Laptop GPU | 3.6 kg | 32.1 mm | 18.00" | 3840x2400 | |
| 87.4 % v7 (old) | 04/2023 | Asus ROG Strix G18 G814JI i7-13650HX, GeForce RTX 4070 Laptop GPU | 3 kg | 31 mm | 18.00" | 2560x1600 | |
| 88.3 % v7 (old) | 10/2023 | Acer Predator Helios 18 N23Q2 i9-13900HX, GeForce RTX 4080 Laptop GPU | 3.2 kg | 29.15 mm | 18.00" | 2560x1600 |
Kasa - Arka Termal Güverte ile Hala Büyük
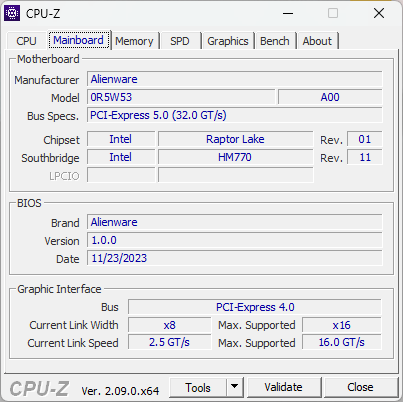
RJ-45 bağlantı noktası bu yıl Killer E3000'den Killer E5000'e yükseltilerek 2 kat daha fazla verim elde edildi (2,5 Gbps'ye karşı 5 Gbps). Aksi takdirde, dış tasarım eskisi gibi kalır.
SD Kart Okuyucu
| SD Card Reader | |
| average JPG Copy Test (av. of 3 runs) | |
| Alienware m18 R1 (Angelibird AV Pro V60) | |
| Alienware m18 R2 (Toshiba Exceria Pro SDXC 64 GB UHS-II) | |
| Alienware m18 R1 AMD (Toshiba Exceria Pro SDXC 64 GB UHS-II) | |
| MSI Titan 18 HX A14VIG (Toshiba Exceria Pro SDXC 64 GB UHS-II) | |
| Acer Predator Helios 18 N23Q2 | |
| maximum AS SSD Seq Read Test (1GB) | |
| Alienware m18 R1 AMD (Toshiba Exceria Pro SDXC 64 GB UHS-II) | |
| Alienware m18 R2 (Toshiba Exceria Pro SDXC 64 GB UHS-II) | |
| Alienware m18 R1 (Angelibird AV Pro V60) | |
| MSI Titan 18 HX A14VIG (Toshiba Exceria Pro SDXC 64 GB UHS-II) | |
| Acer Predator Helios 18 N23Q2 | |
İletişim
| Networking | |
| iperf3 transmit AXE11000 | |
| Asus ROG Strix G18 G814JI | |
| Alienware m18 R1 AMD | |
| Alienware m18 R1 | |
| MSI Titan 18 HX A14VIG | |
| Acer Predator Helios 18 N23Q2 | |
| Alienware m18 R2 | |
| iperf3 receive AXE11000 | |
| Asus ROG Strix G18 G814JI | |
| Alienware m18 R1 AMD | |
| Alienware m18 R2 | |
| Alienware m18 R1 | |
| MSI Titan 18 HX A14VIG | |
| Acer Predator Helios 18 N23Q2 | |
| iperf3 transmit AXE11000 6GHz | |
| Alienware m18 R1 AMD | |
| Acer Predator Helios 18 N23Q2 | |
| Alienware m18 R1 | |
| MSI Titan 18 HX A14VIG | |
| Alienware m18 R2 | |
| iperf3 receive AXE11000 6GHz | |
| Alienware m18 R1 AMD | |
| Acer Predator Helios 18 N23Q2 | |
| MSI Titan 18 HX A14VIG | |
| Alienware m18 R1 | |
| Alienware m18 R2 | |
Web kamerası


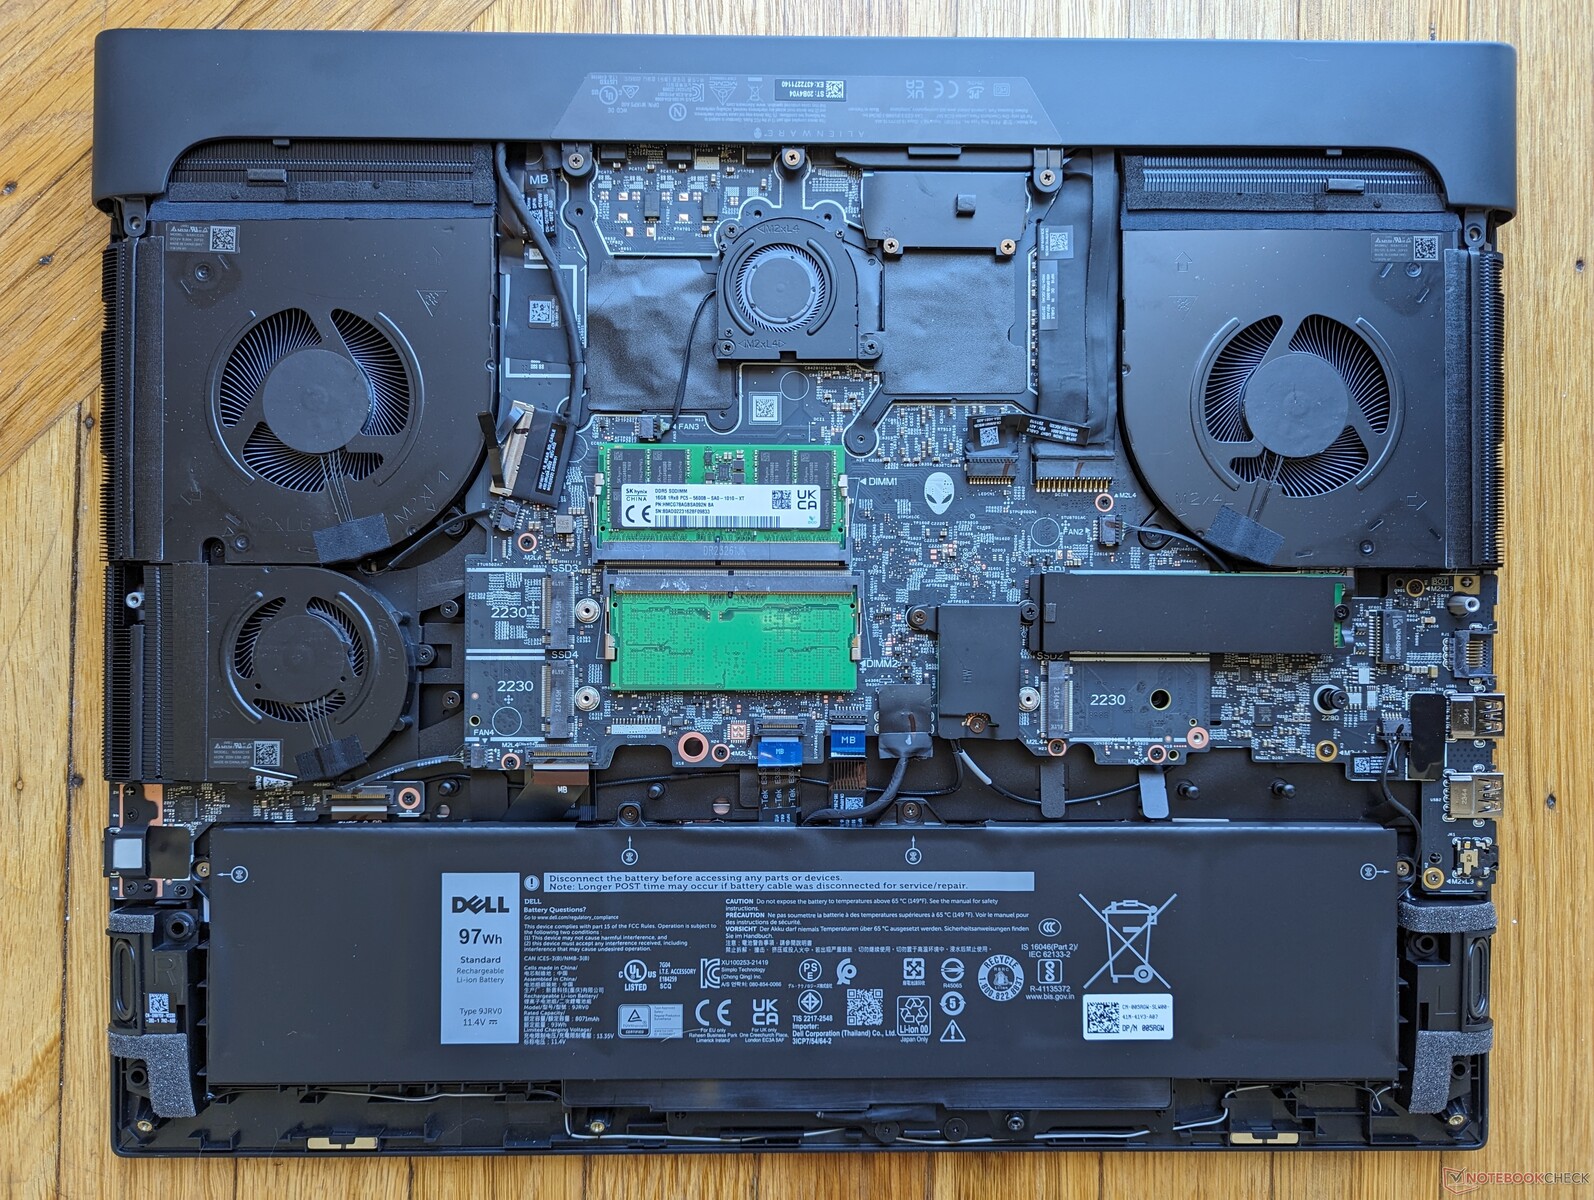
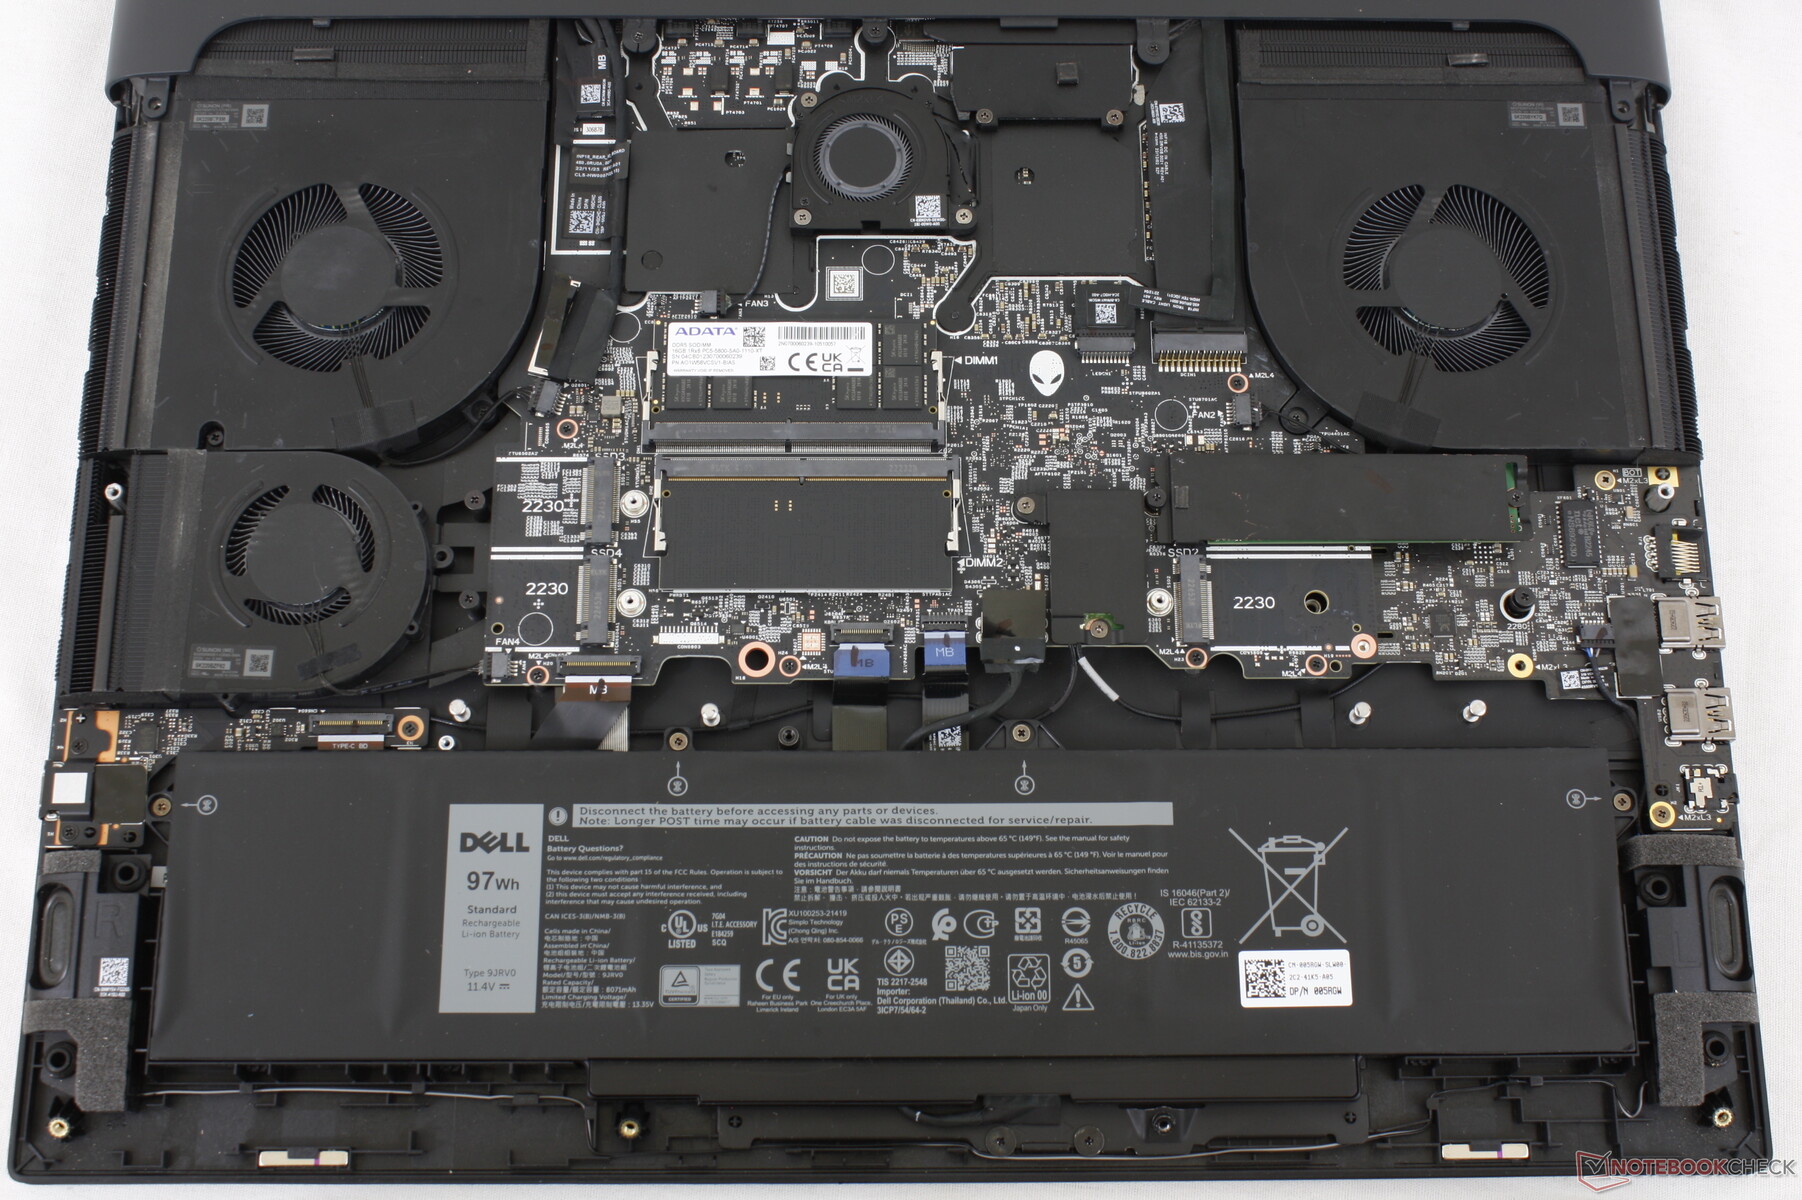
Bakım
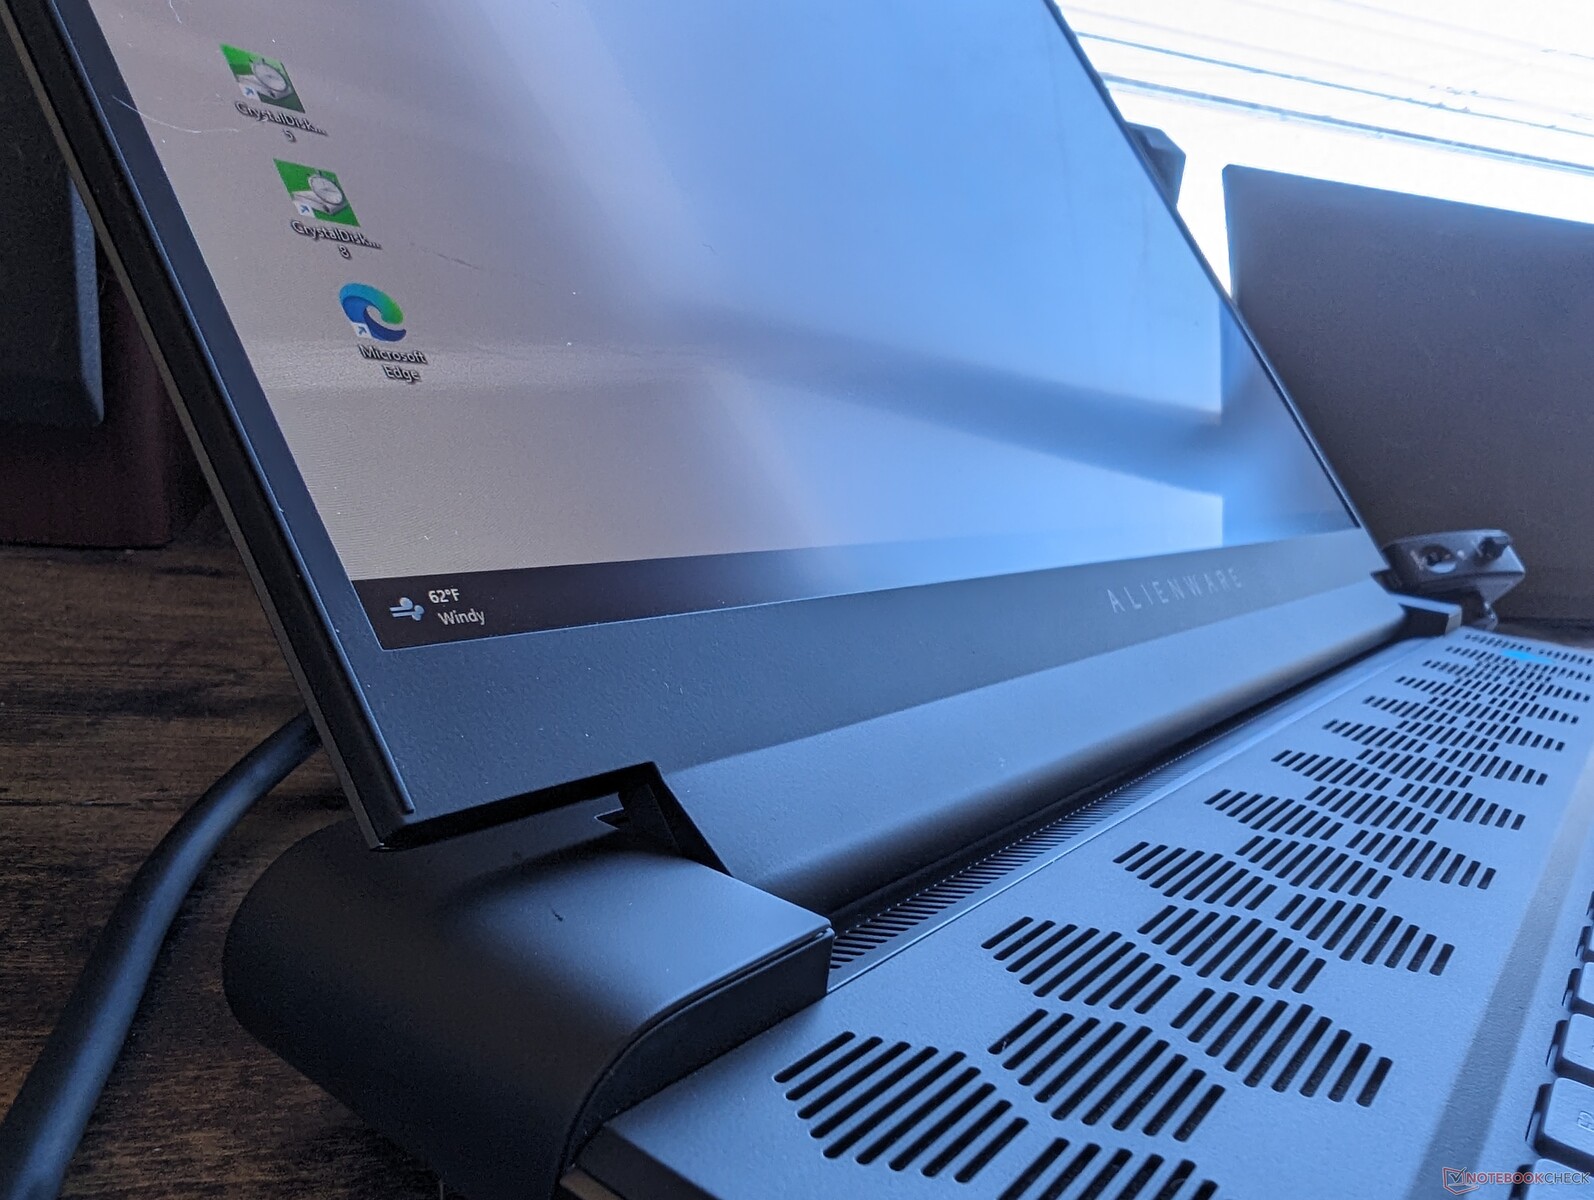
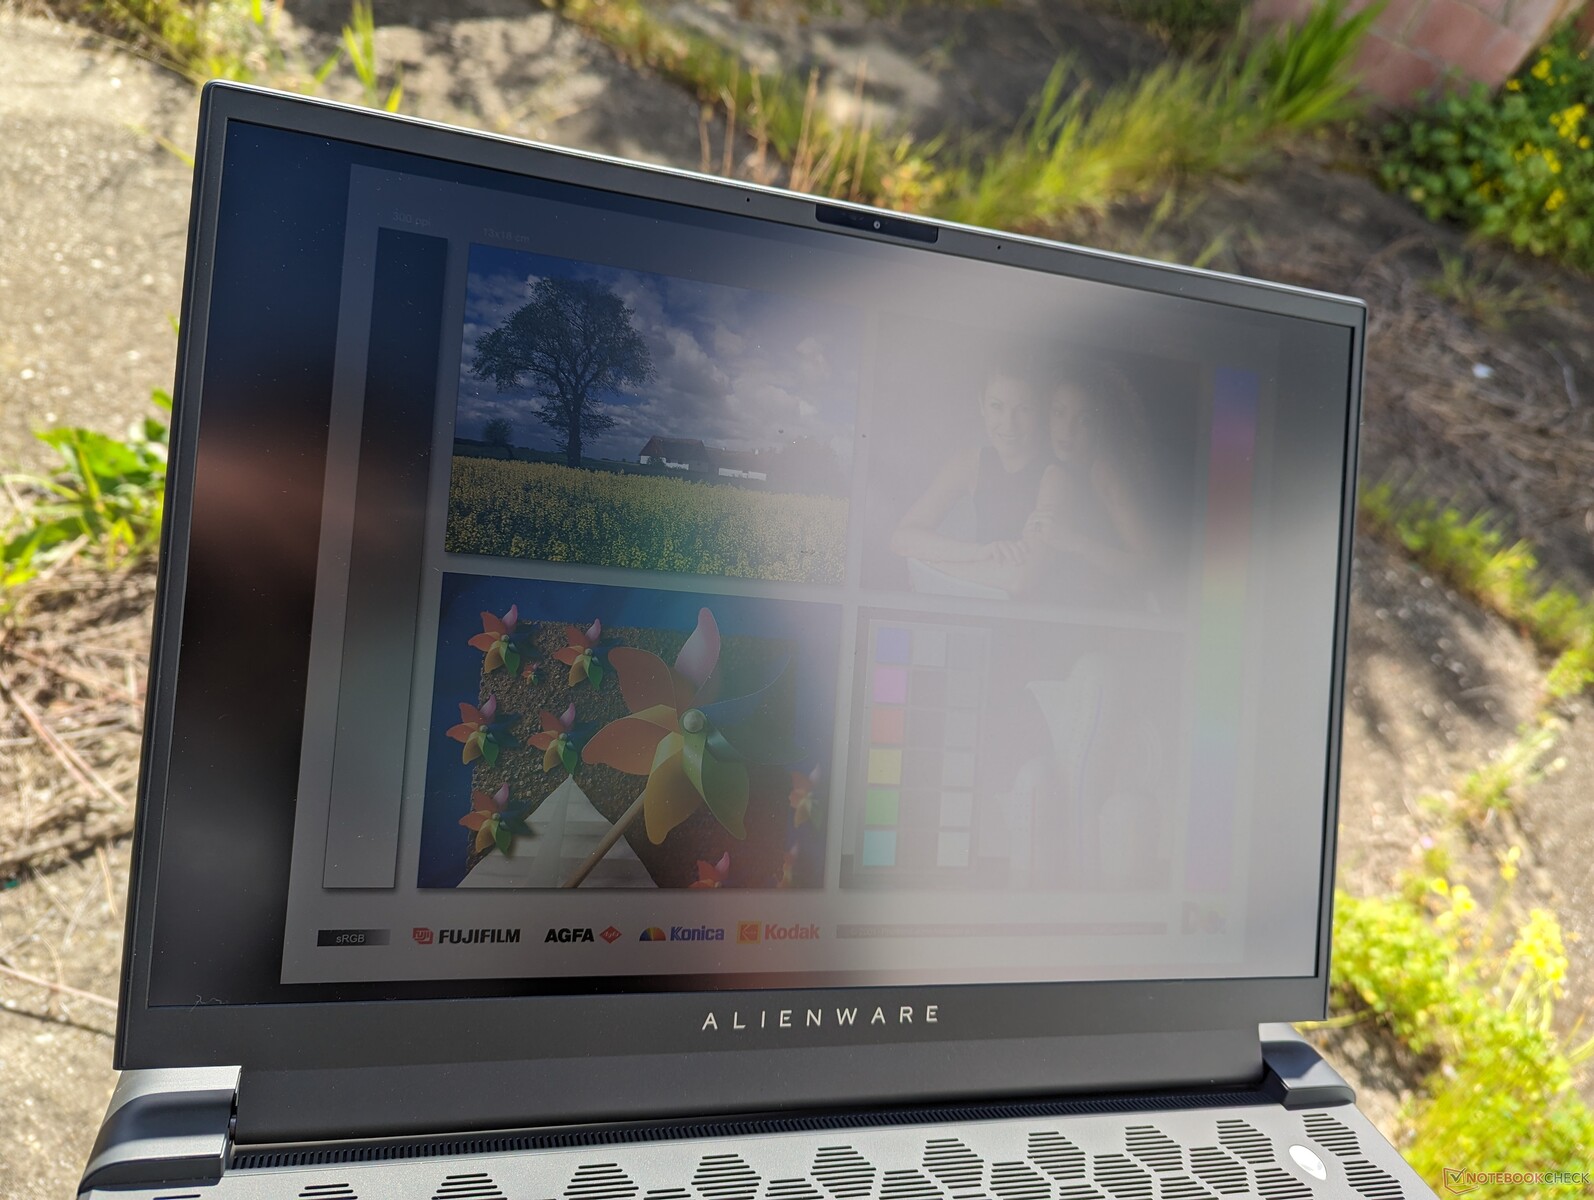
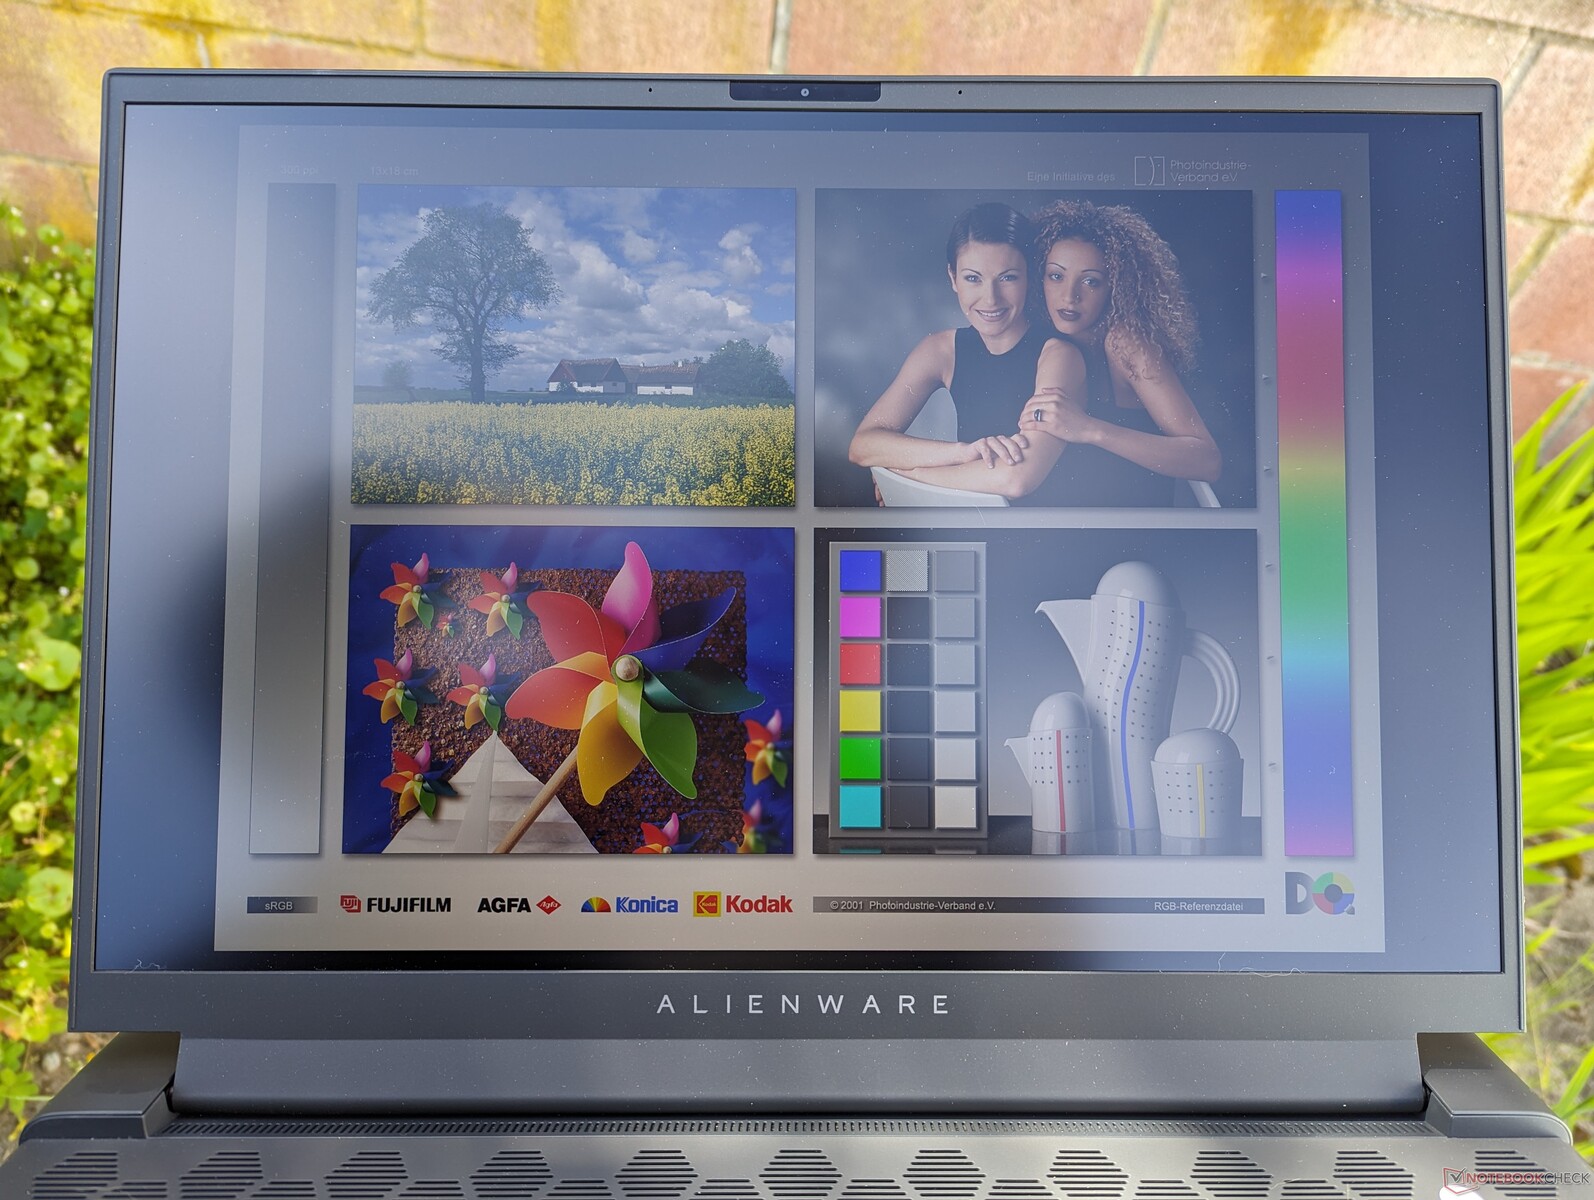
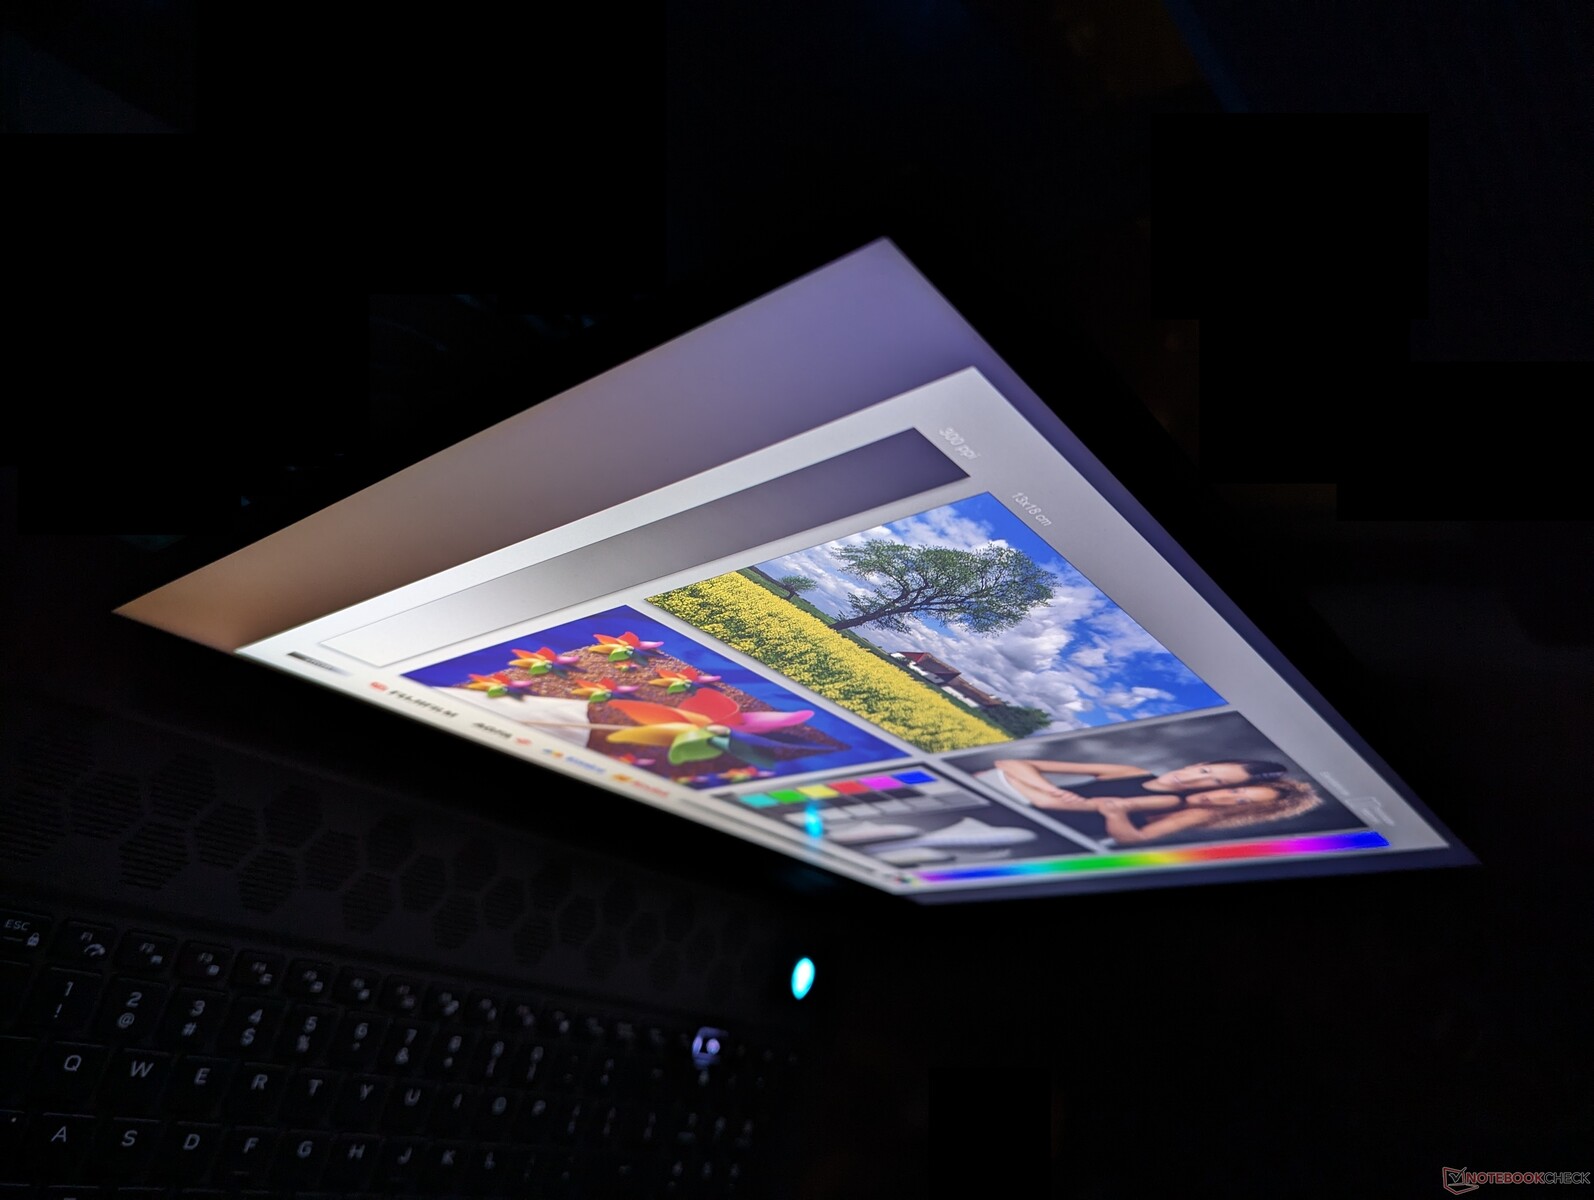
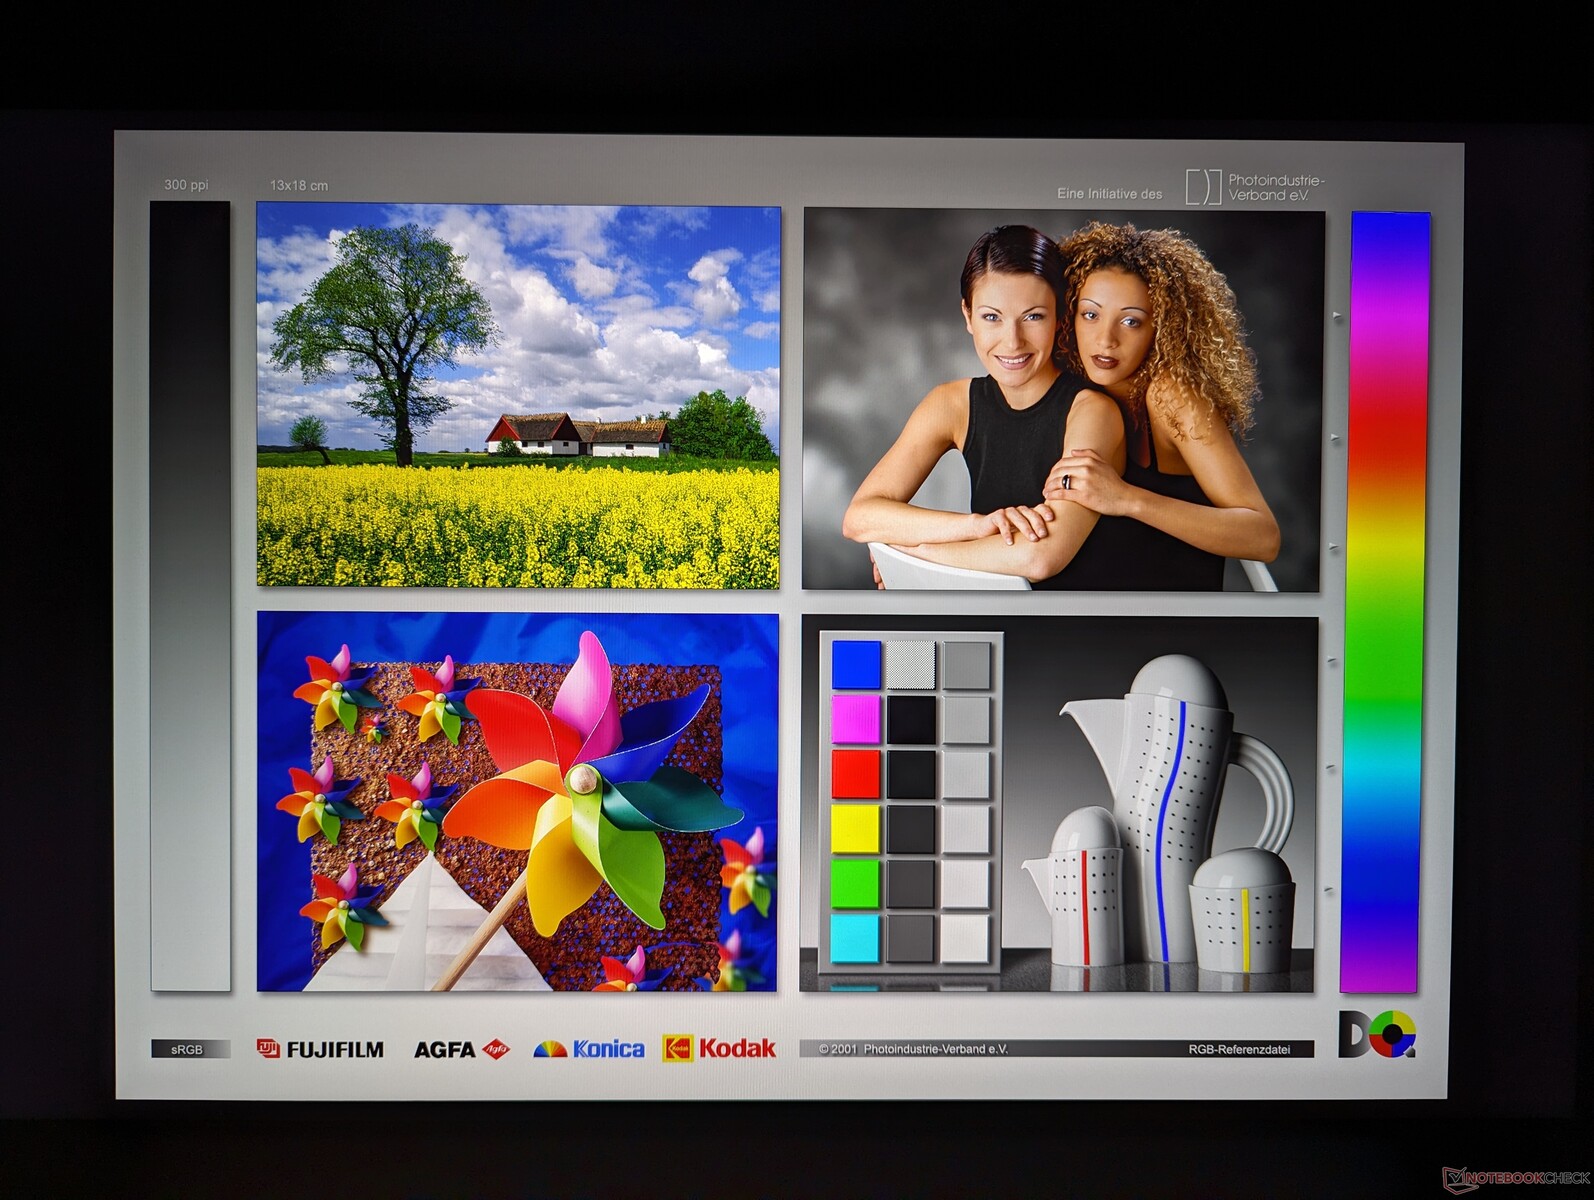
Ekran - 1200p mi 1600p mi?
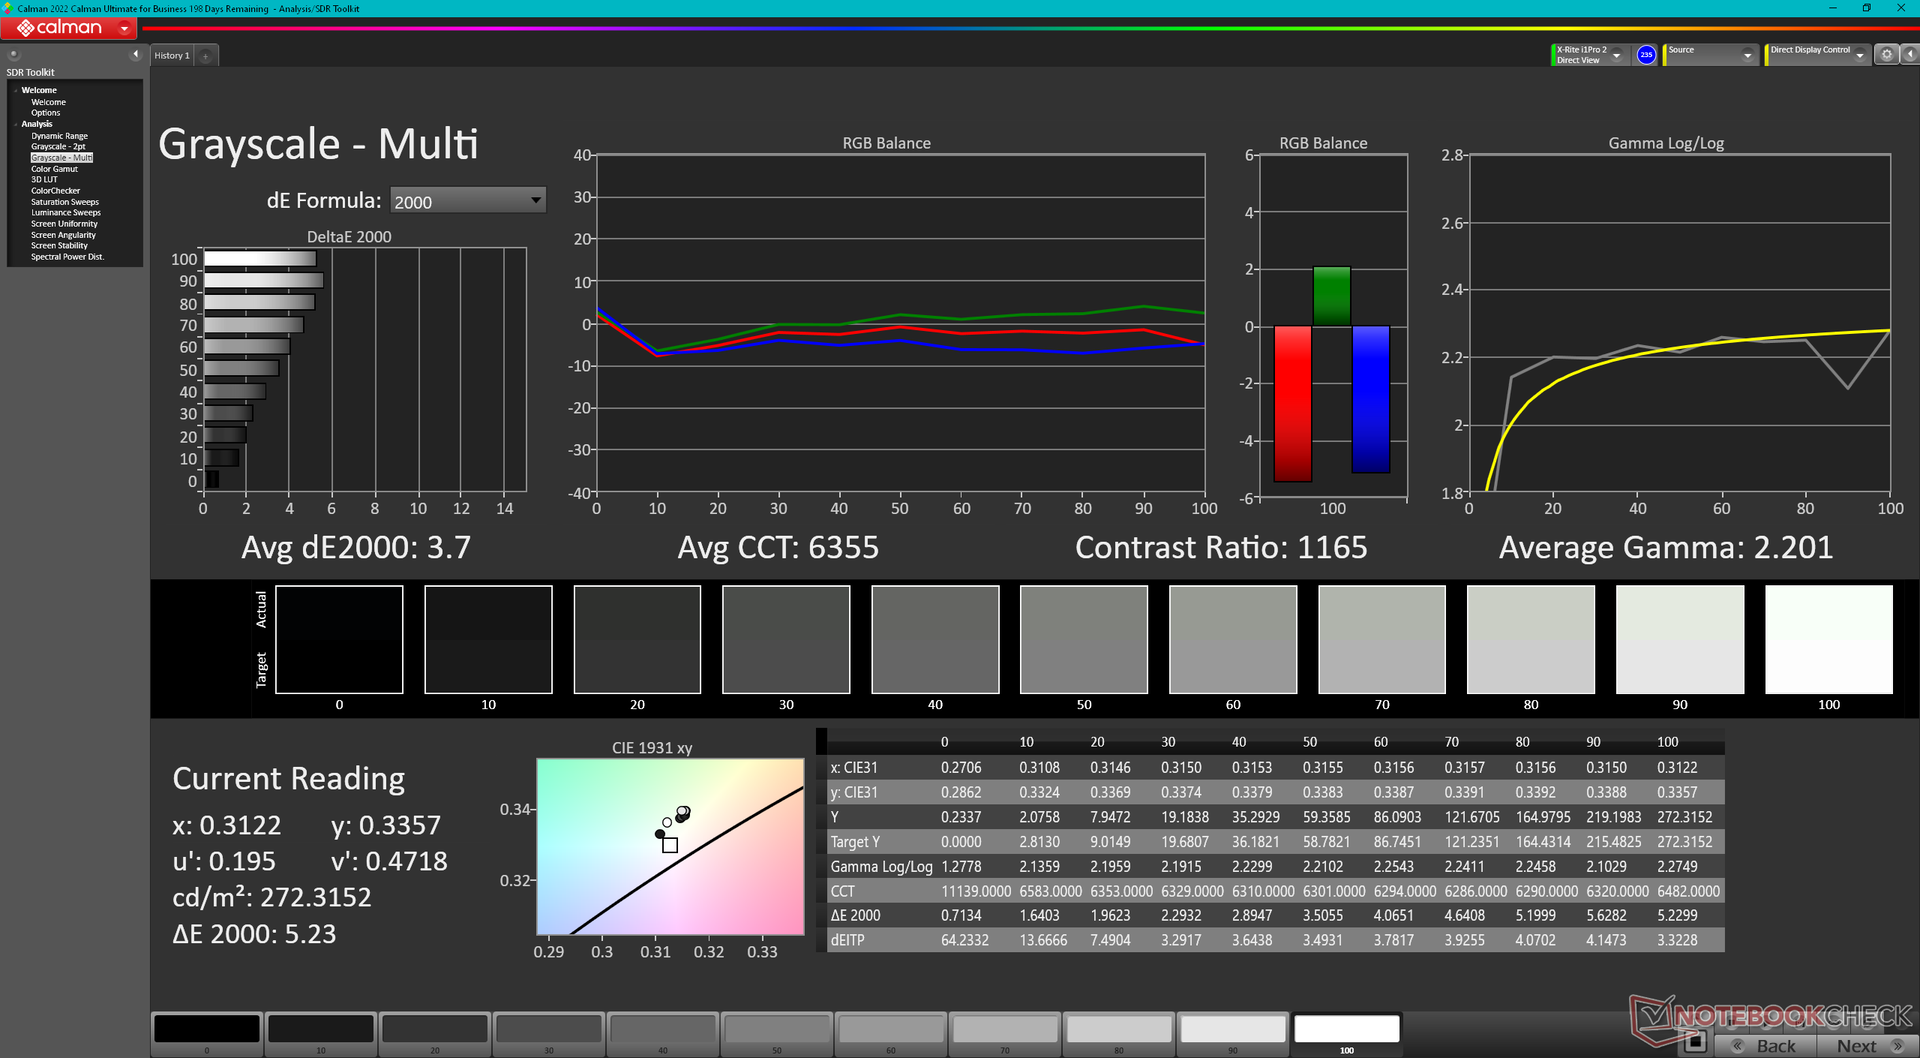
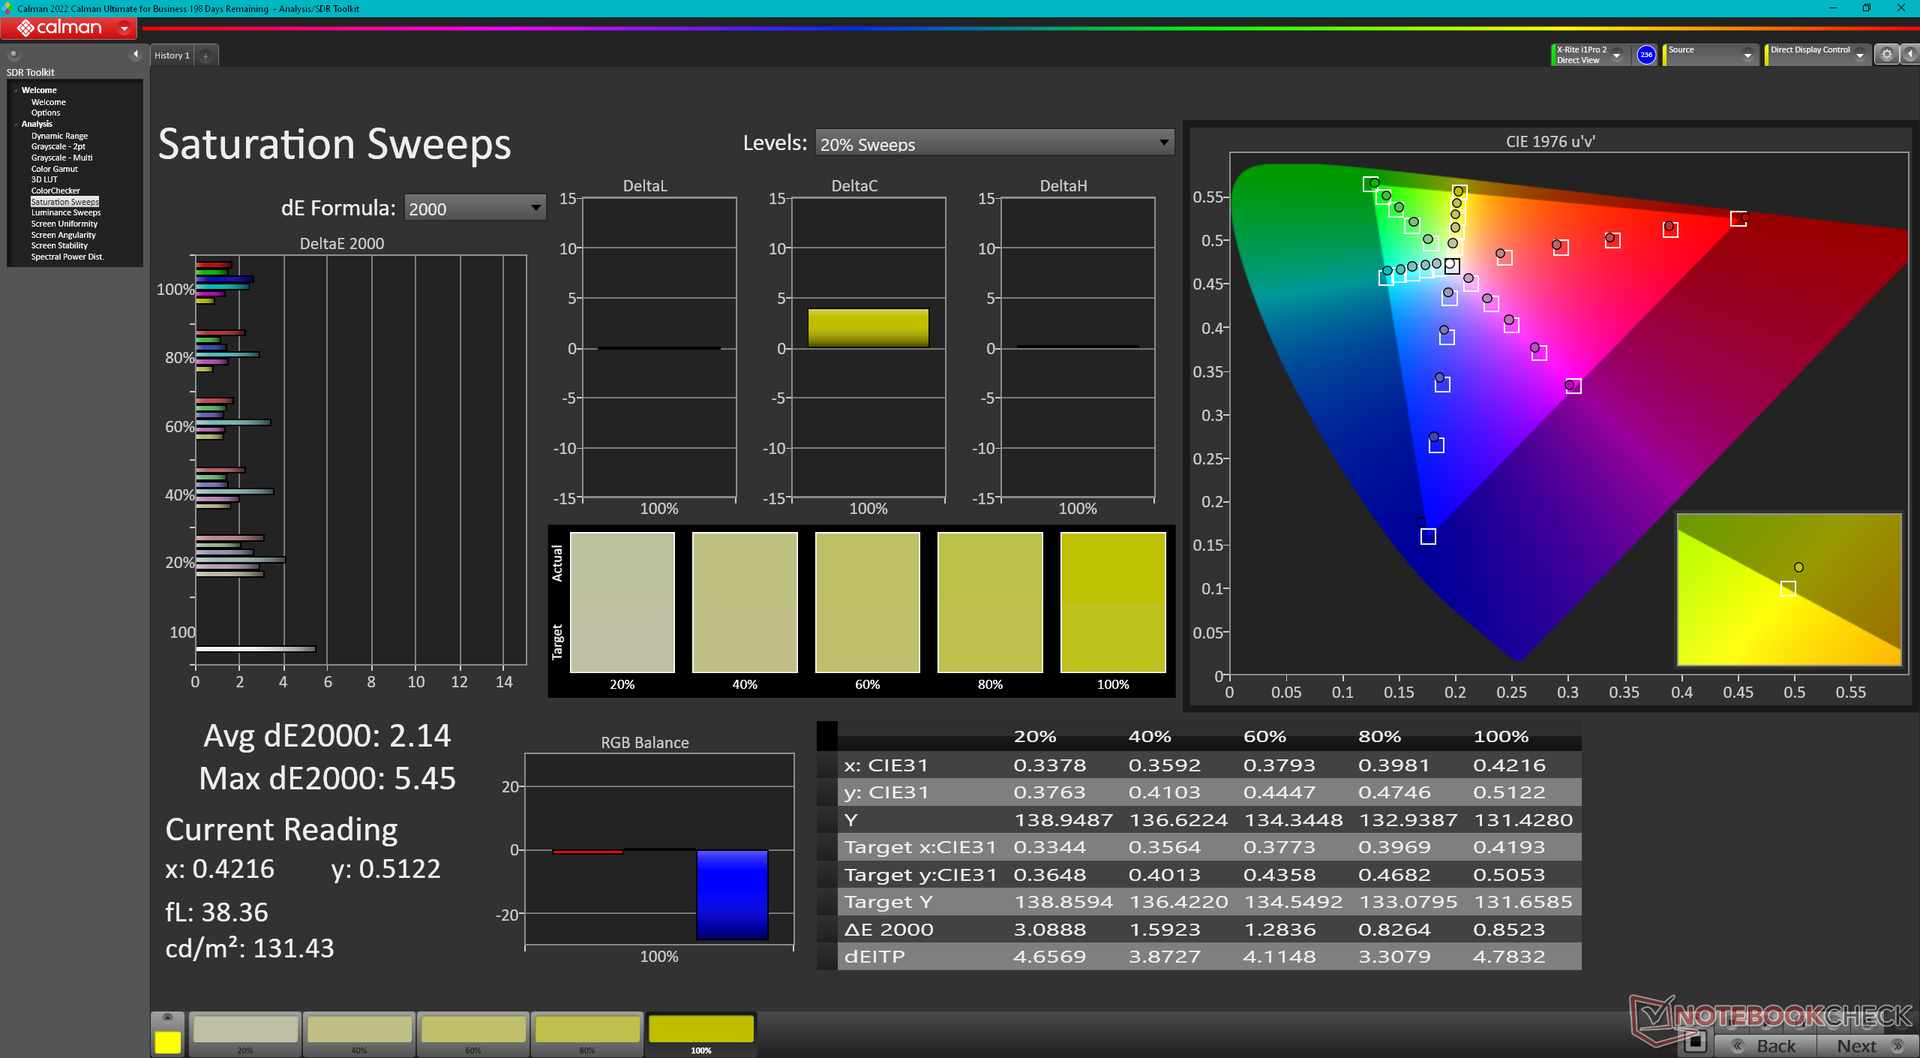
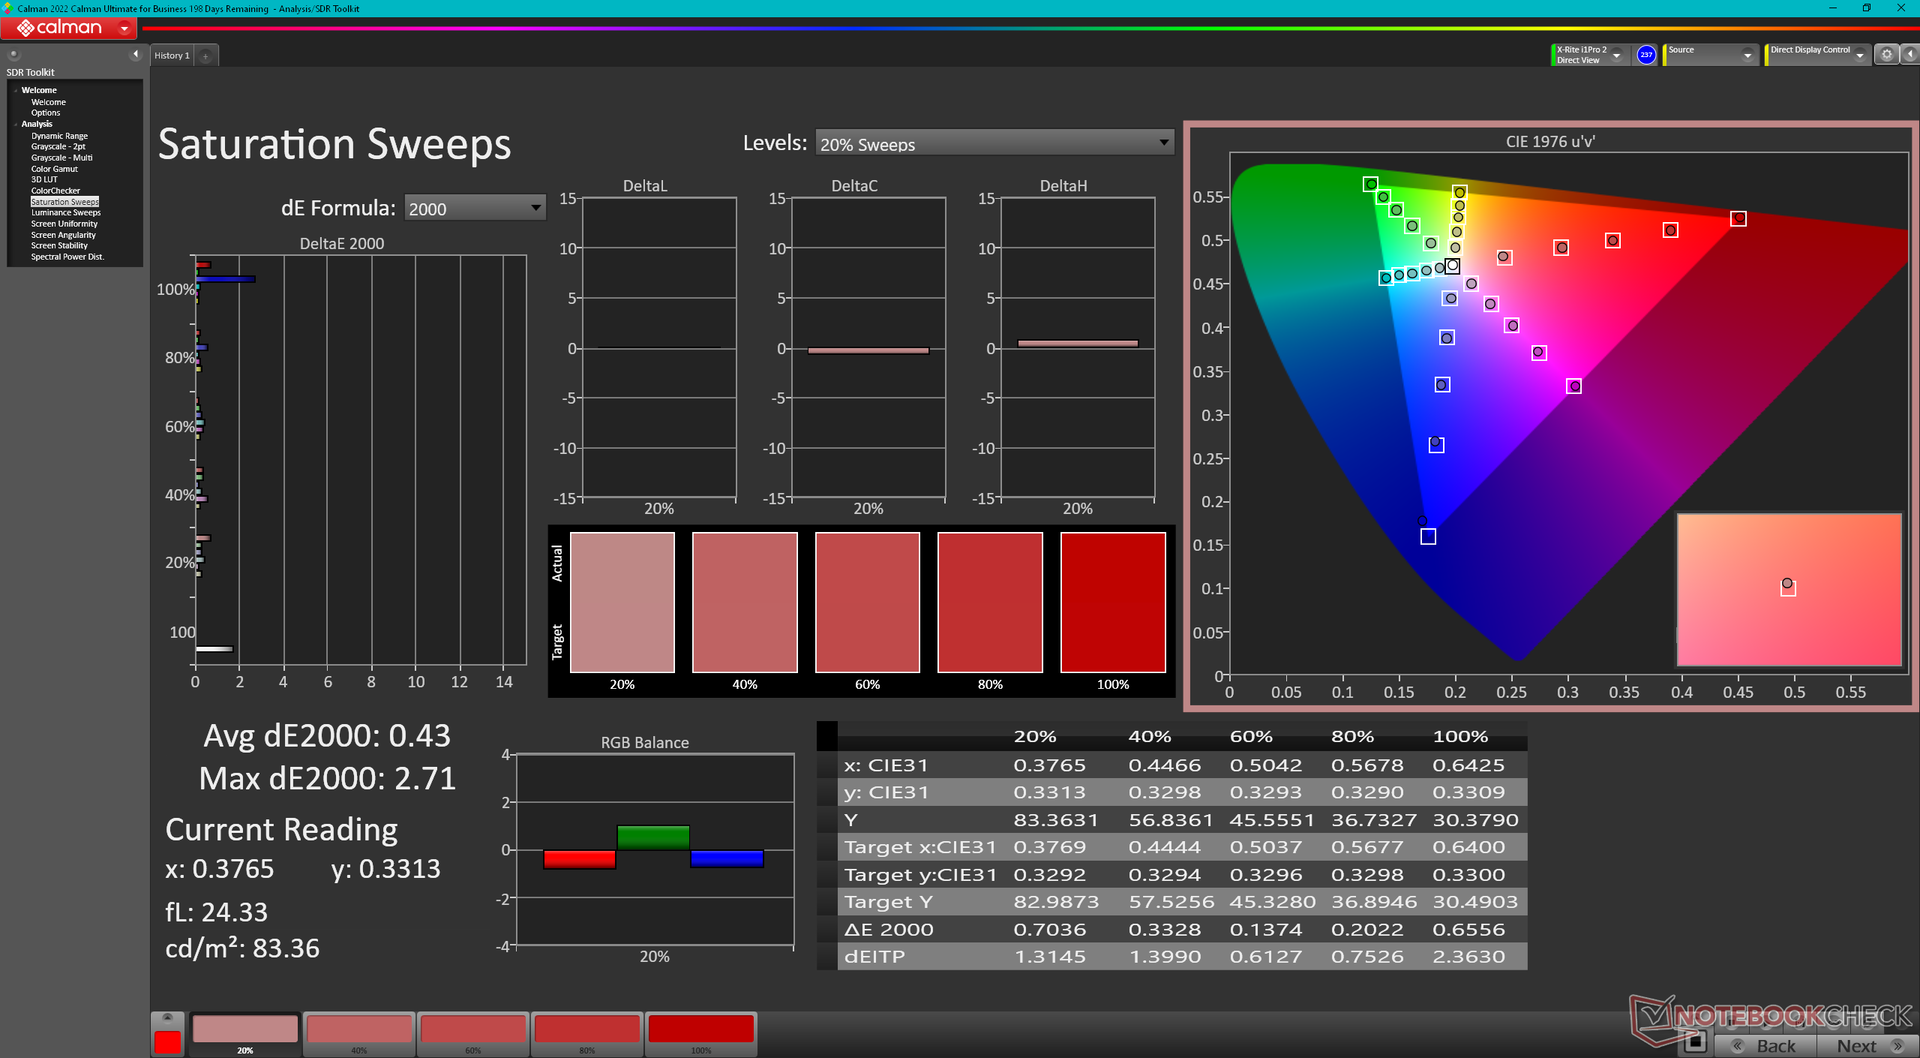
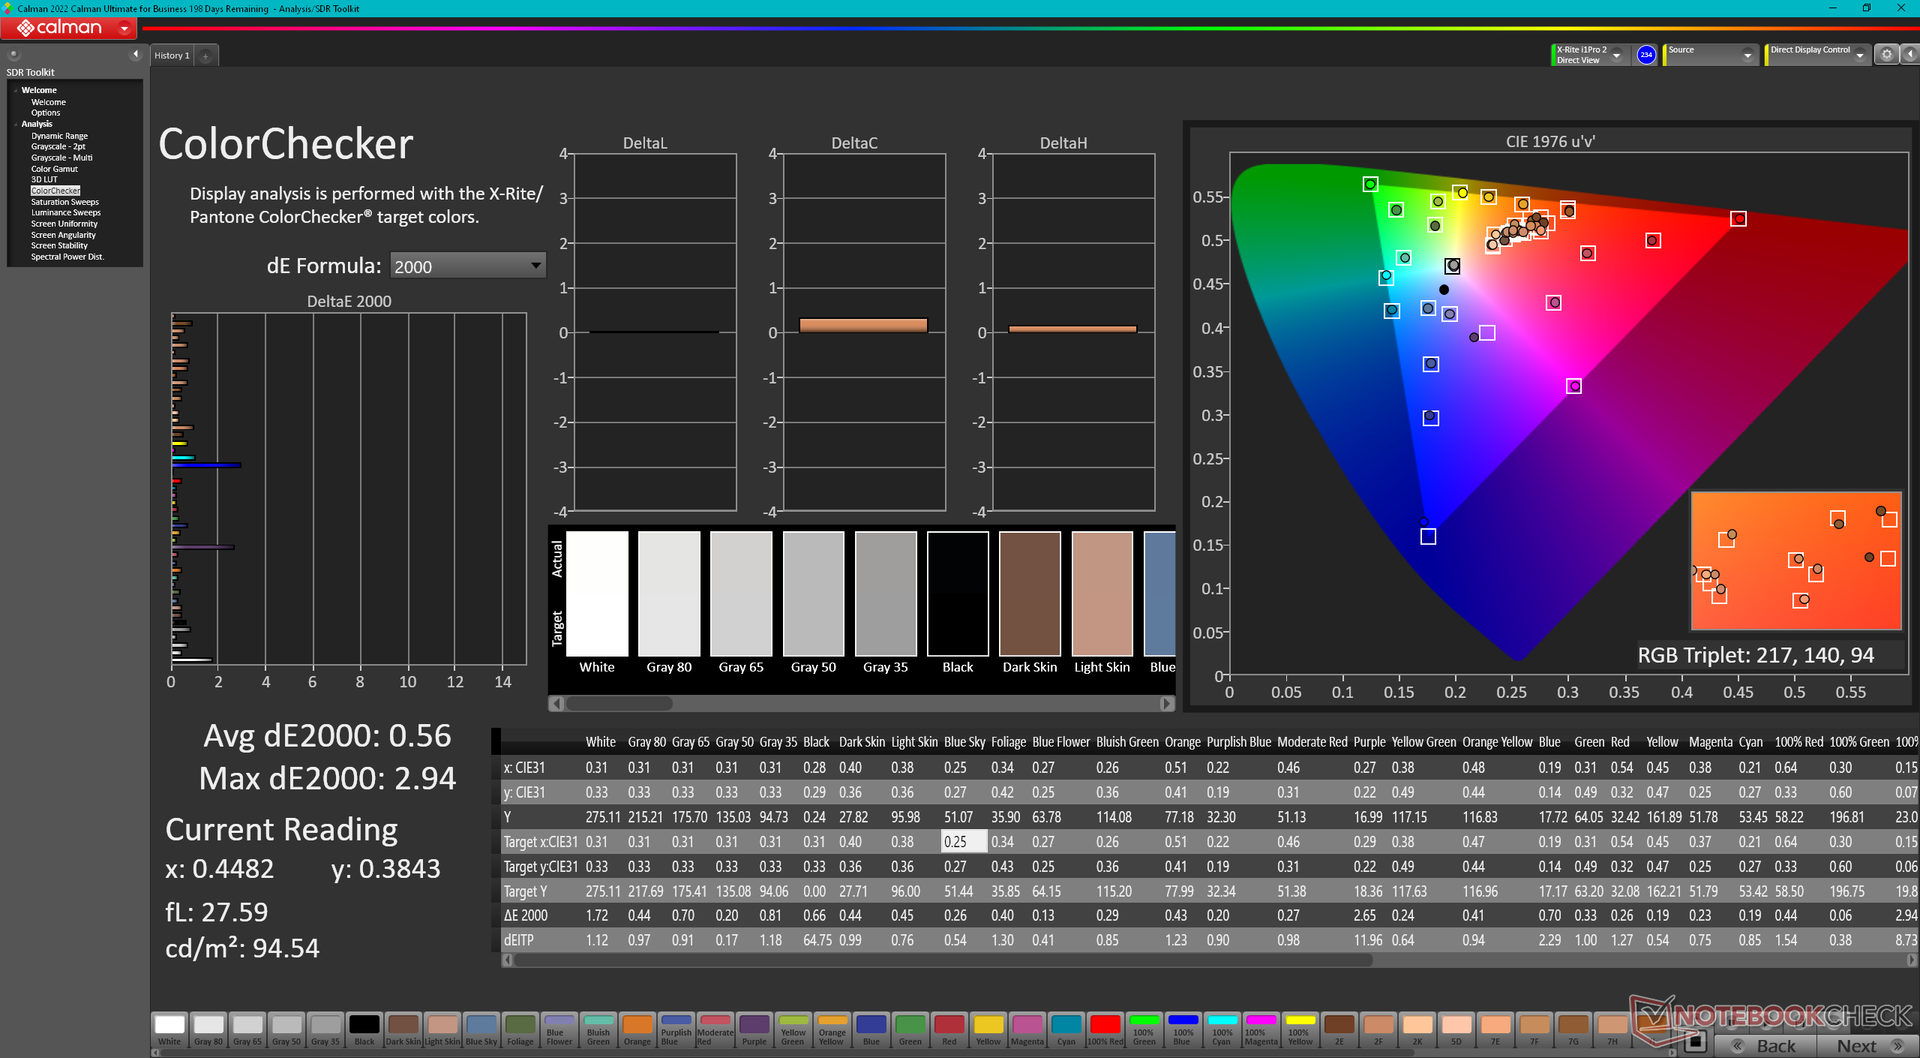
İlginç bir şekilde, m18 R2 yapılandırmamızdaki panel adı, farklı doğal çözünürlüklere (1600p'ye karşı 1200p) ve yenileme hızlarına (165 Hz'ye karşı 480 Hz) sahip olmalarına rağmen m18 R1 yapılandırmamızdakiyle aynı. Bunun dışında her iki panel de benzer P3 renkleri, hızlı tepki süreleri ve iyi ~1000:1 kontrast oranları sunuyor.
Her iki paneli de gördükten sonra, 18 inçlik bir ekranda 1200p çok keskin olmadığından ve 480 Hz yenileme hızı kullanım durumlarının büyük çoğunluğu için 165 Hz'e göre sadece marjinal avantajlar sunduğundan 1600p seçeneğini öneriyoruz.
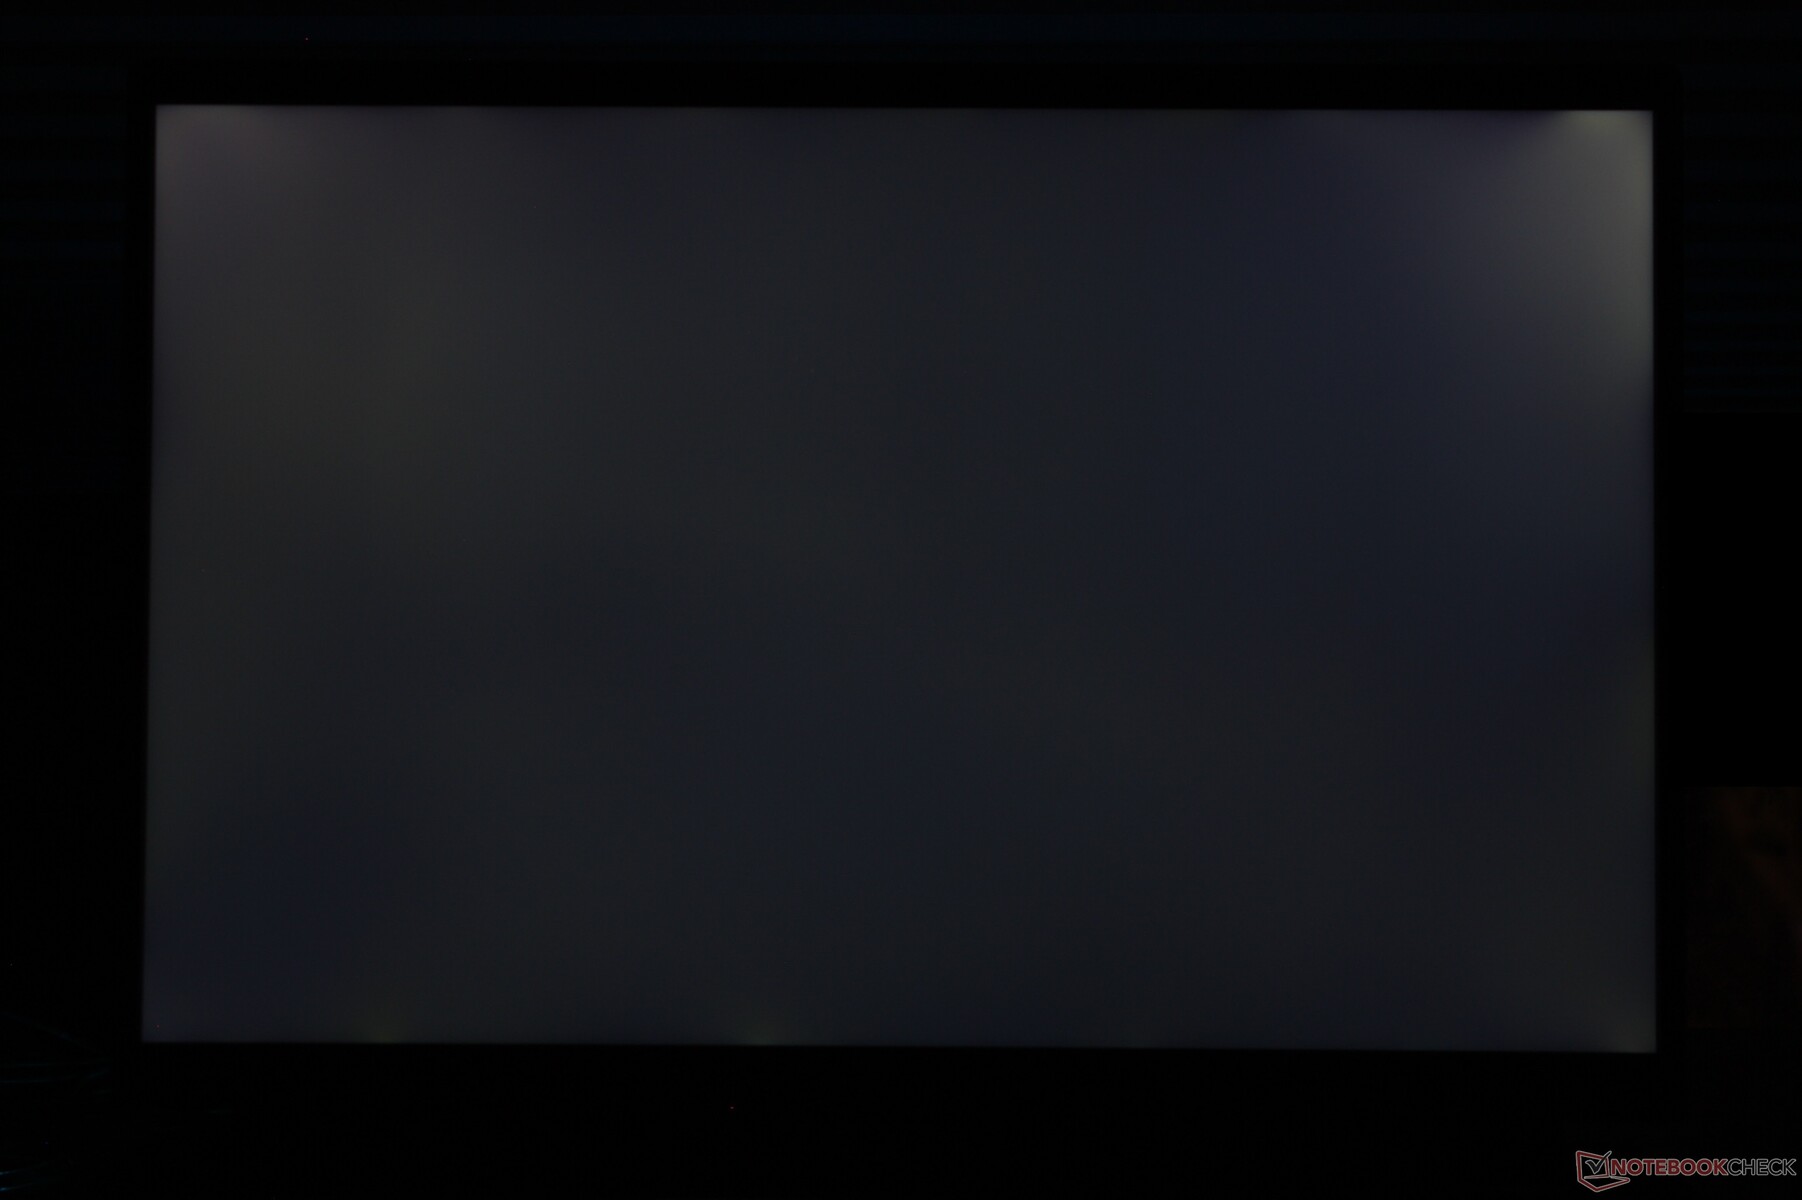
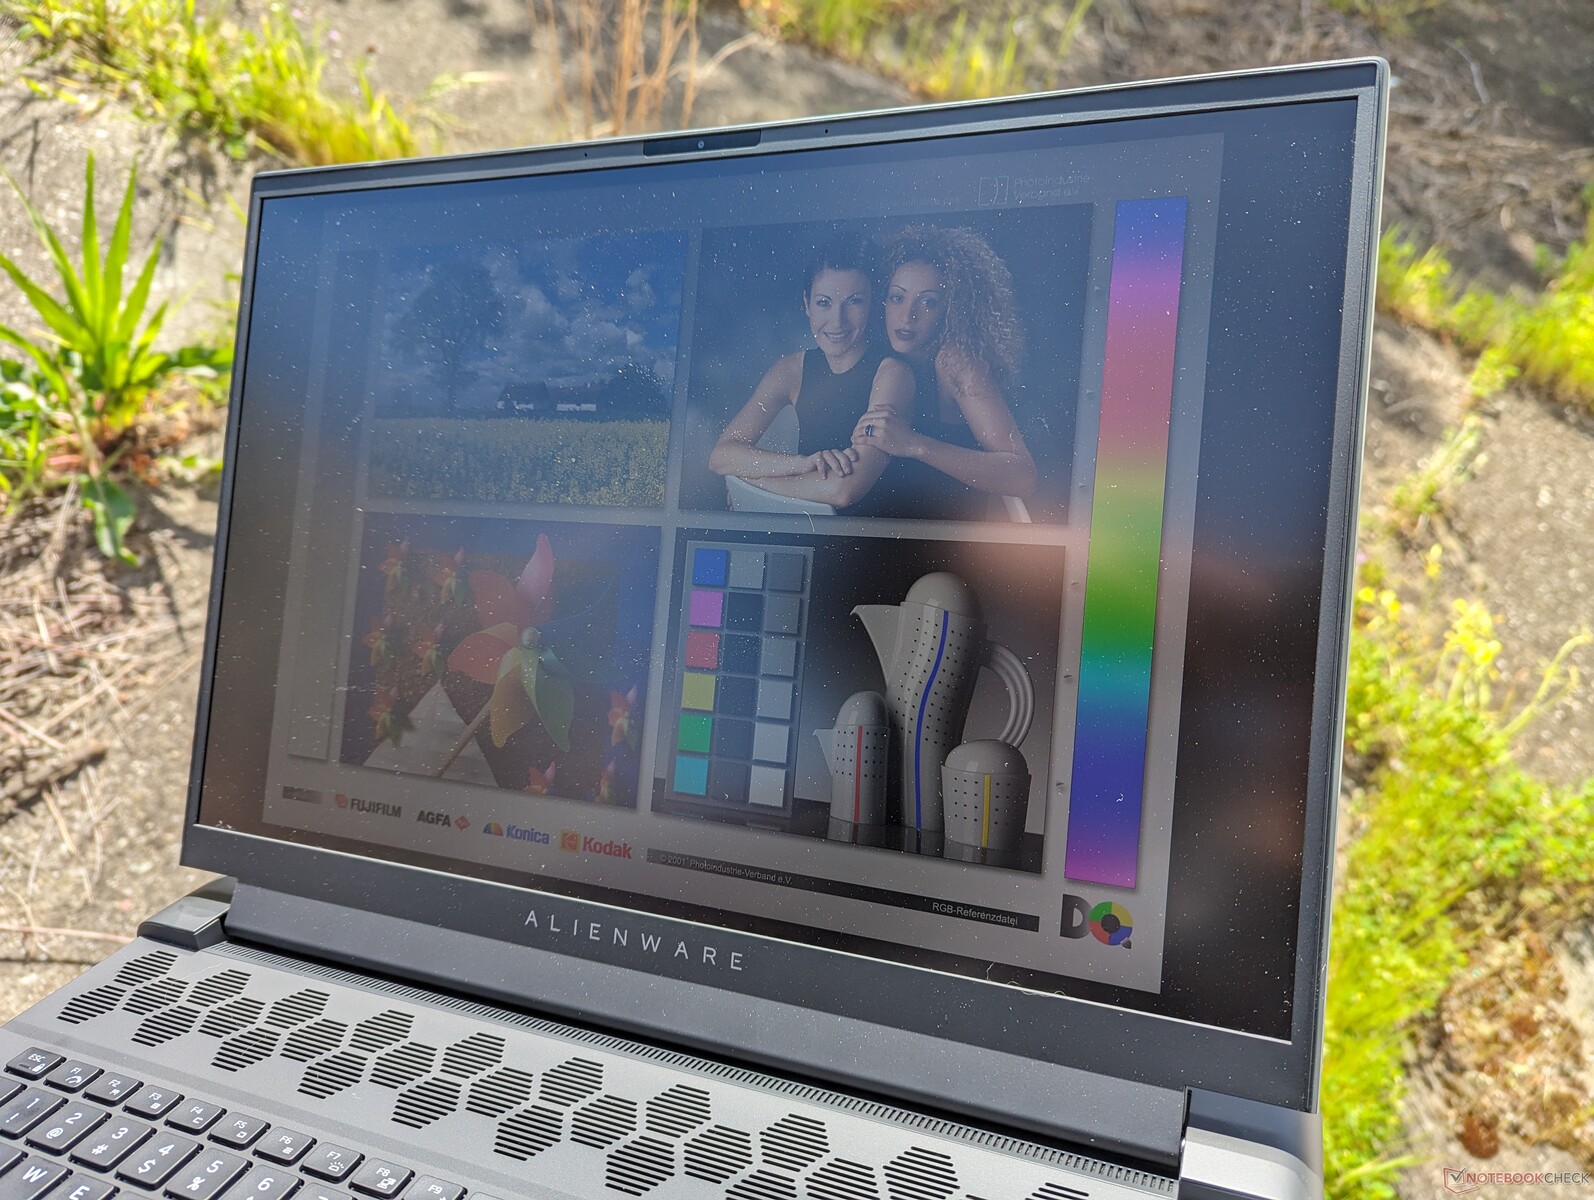
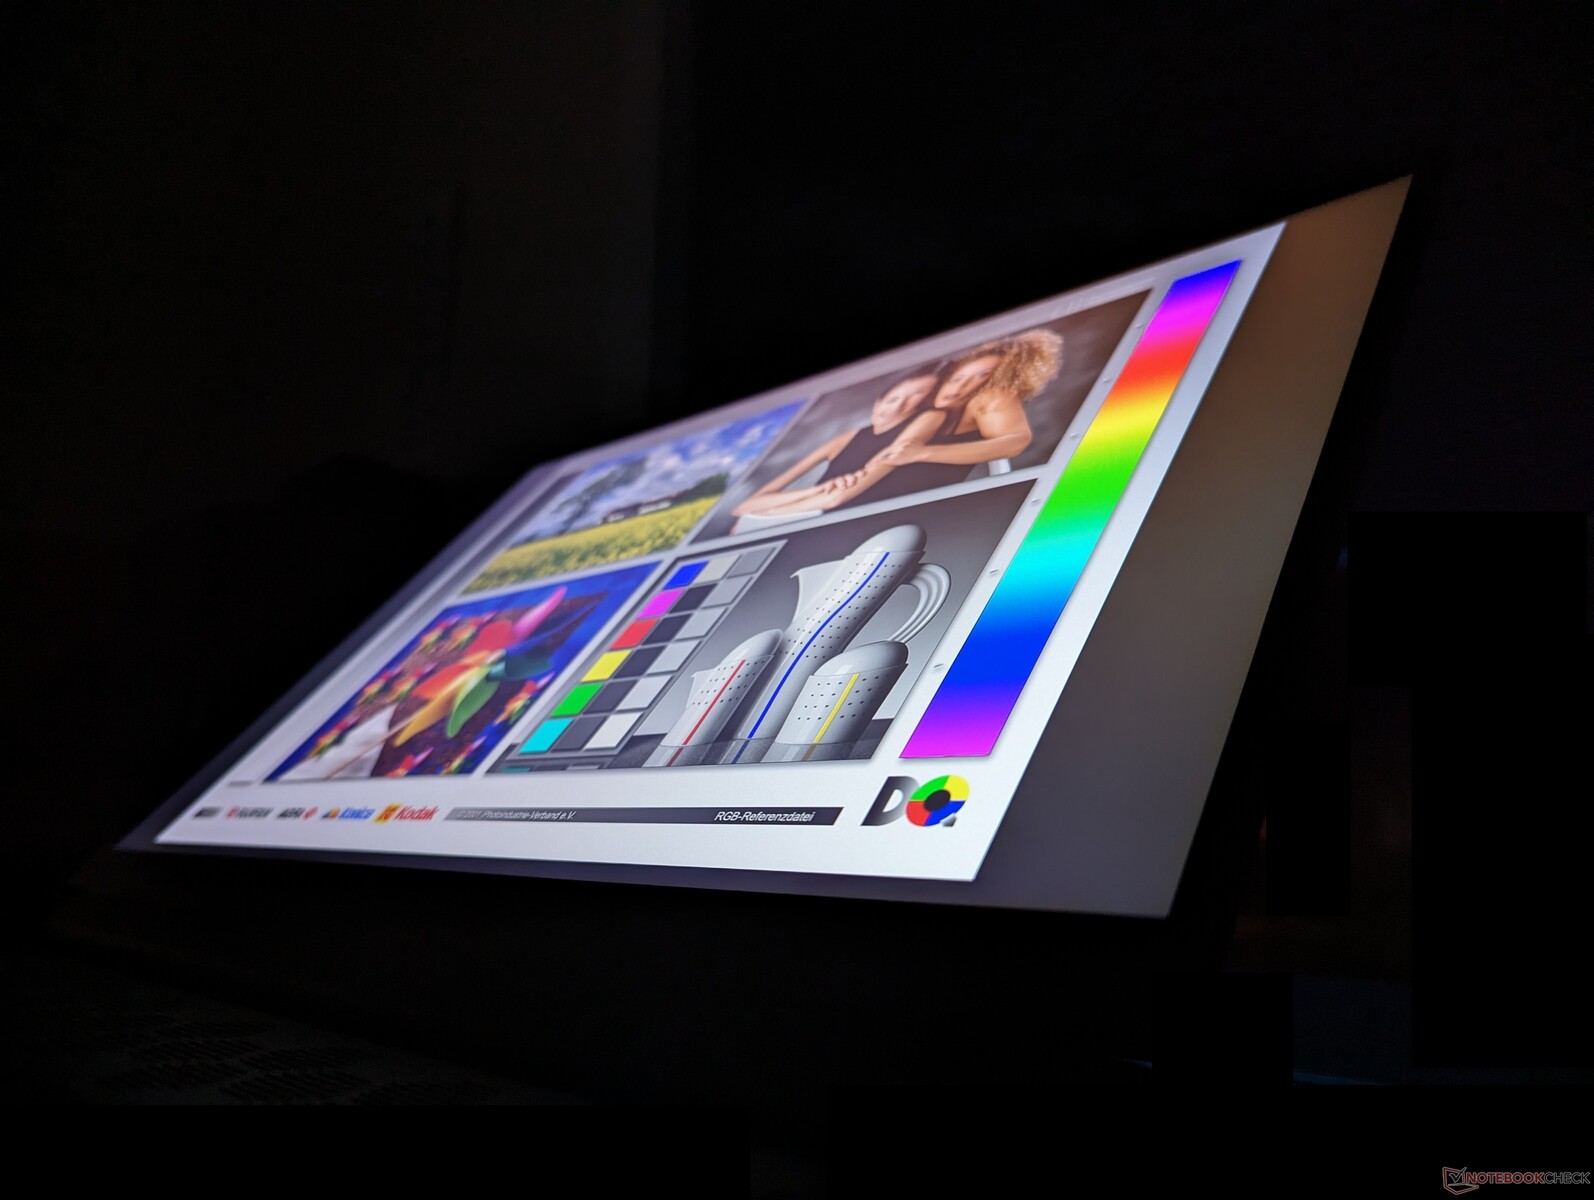
Windows Dinamik Çözünürlük desteklenmez ve bu nedenle yenileme hızı işletim sisteminde 165 Hz veya 60 Hz olarak sabitlenir. Bununla birlikte, dGPU modunda oyun çalıştırırken G-Sync hala desteklenmektedir. Arka ışık HDR gereksinimlerini karşılayacak kadar parlak olmadığından HDR desteklenmez. Aslında, 1600p ekranımız 1200p konfigürasyonundan ortalama olarak biraz daha sönük.
| |||||||||||||||||||||||||
Aydınlatma: 78 %
Batarya modunda parlaklık: 271.8 cd/m²
Kontrast: 1007:1 (Siyah: 0.27 cd/m²)
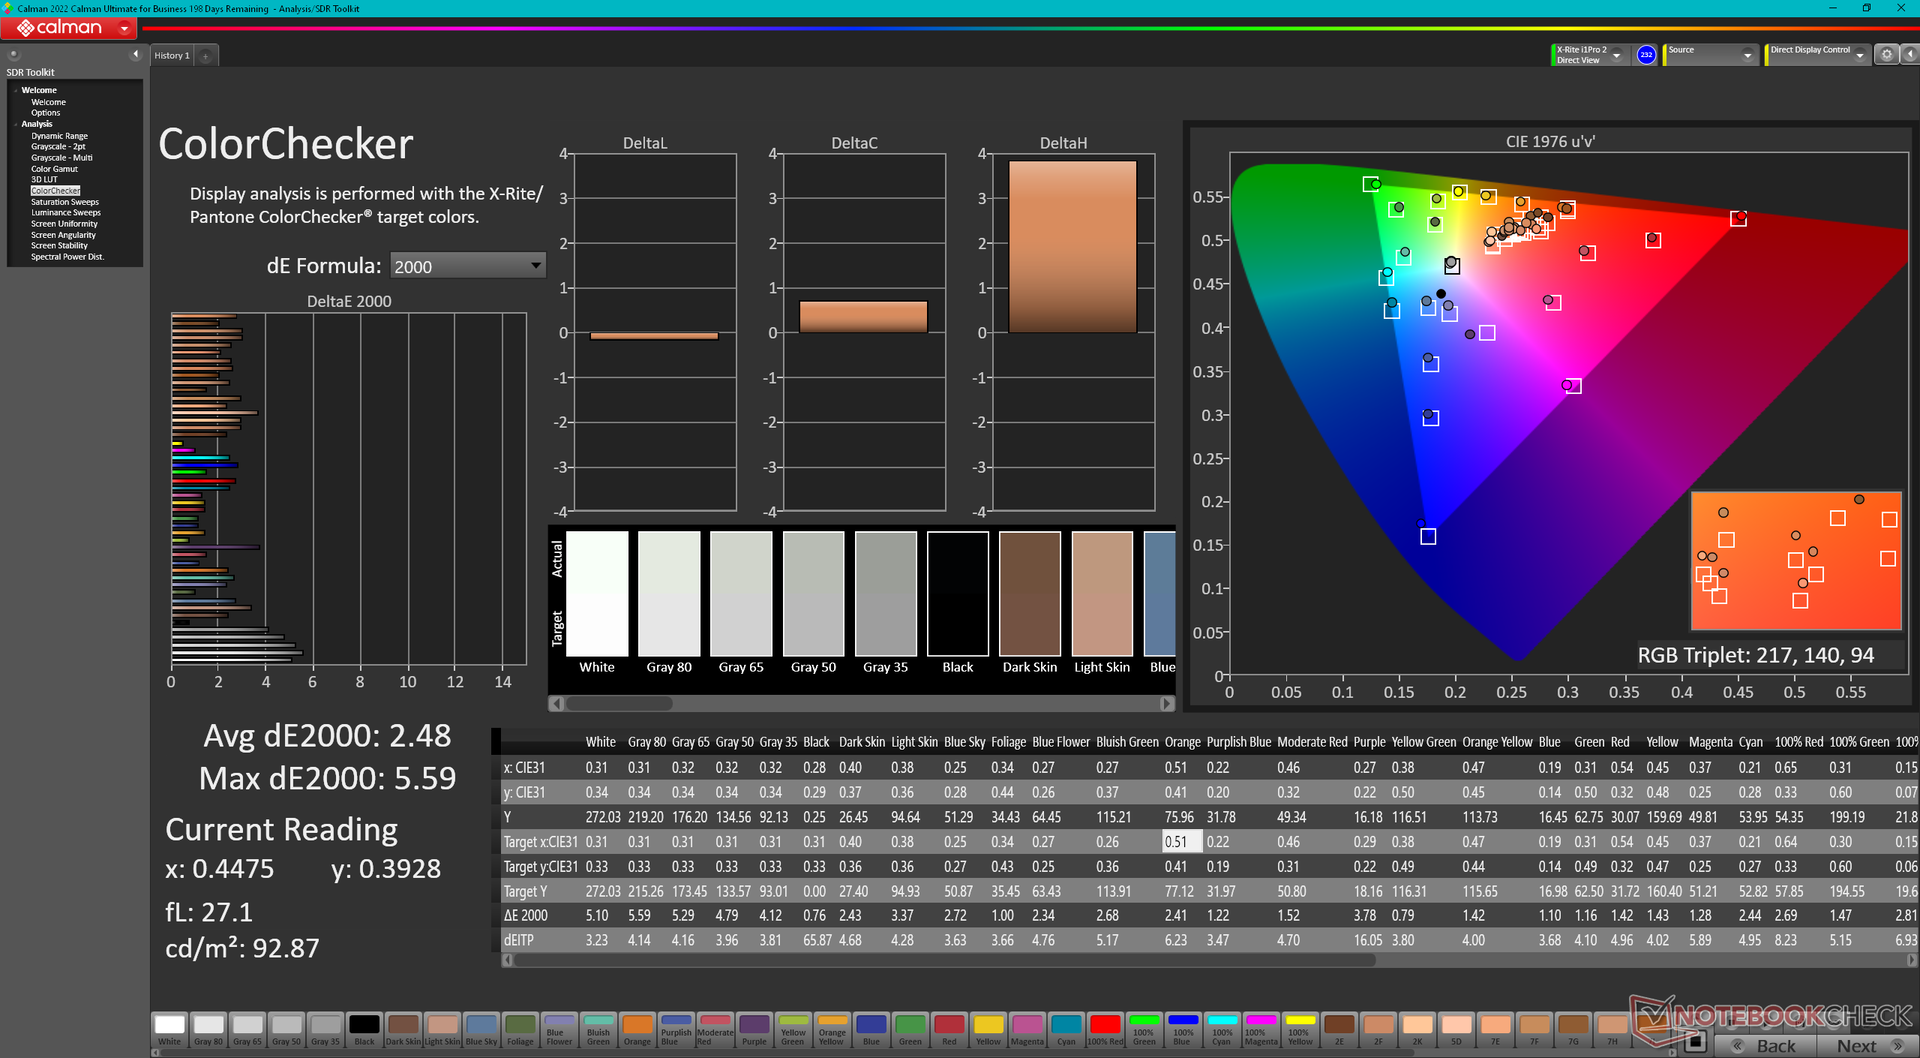
ΔE ColorChecker Calman: 2.48 | ∀{0.5-29.43 Ø4.73}
calibrated: 0.56
ΔE Greyscale Calman: 3.7 | ∀{0.09-98 Ø4.97}
88.9% AdobeRGB 1998 (Argyll 3D)
99.5% sRGB (Argyll 3D)
97.8% Display P3 (Argyll 3D)
Gamma: 2.2
CCT: 6355 K
| Alienware m18 R2 BOE NE18NZ1, IPS, 2560x1600, 18" | Alienware m18 R1 AMD BOE NE18NZ1, IPS, 1920x1200, 18" | Alienware m18 R1 Chi Mei 180JME, IPS, 1920x1200, 18" | MSI Titan 18 HX A14VIG AU Optronics B180ZAN01.0, Mini-LED, 3840x2400, 18" | Asus ROG Strix G18 G814JI NE180QDM-NZ2 (BOE0B35), IPS, 2560x1600, 18" | Acer Predator Helios 18 N23Q2 AUO45A8 (B180QAN01.2), IPS, 2560x1600, 18" | |
|---|---|---|---|---|---|---|
| Display | 0% | 1% | -1% | -1% | 2% | |
| Display P3 Coverage (%) | 97.8 | 98.5 1% | 97.7 0% | 98.1 0% | 98.1 0% | 99.8 2% |
| sRGB Coverage (%) | 99.5 | 99.7 0% | 100 1% | 99.8 0% | 99.9 0% | 100 1% |
| AdobeRGB 1998 Coverage (%) | 88.9 | 88.7 0% | 89.8 1% | 86.2 -3% | 85.6 -4% | 91.8 3% |
| Response Times | 28% | 24% | -375% | 4% | -57% | |
| Response Time Grey 50% / Grey 80% * (ms) | 5.3 ? | 2.8 ? 47% | 3 ? 43% | 8.6 ? -62% | 5.6 ? -6% | 7.6 ? -43% |
| Response Time Black / White * (ms) | 10.4 ? | 9.6 ? 8% | 9.9 ? 5% | 81.8 ? -687% | 9 ? 13% | 17.8 ? -71% |
| PWM Frequency (Hz) | 2592 ? | 2509 | ||||
| Screen | 29% | 24% | -45% | 9% | -28% | |
| Brightness middle (cd/m²) | 271.8 | 319.6 18% | 372.8 37% | 467.5 72% | 471 73% | 360 32% |
| Brightness (cd/m²) | 275 | 304 11% | 367 33% | 459 67% | 422 53% | 355 29% |
| Brightness Distribution (%) | 78 | 87 12% | 97 24% | 90 15% | 83 6% | 92 18% |
| Black Level * (cd/m²) | 0.27 | 0.25 7% | 0.32 -19% | 0.47 -74% | 0.21 22% | |
| Contrast (:1) | 1007 | 1278 27% | 1165 16% | 1002 0% | 1714 70% | |
| Colorchecker dE 2000 * | 2.48 | 1.22 51% | 1.92 23% | 3.77 -52% | 2.05 17% | 3.82 -54% |
| Colorchecker dE 2000 max. * | 5.59 | 3.1 45% | 3.65 35% | 6.12 -9% | 4.15 26% | 7.38 -32% |
| Colorchecker dE 2000 calibrated * | 0.56 | 0.47 16% | 0.51 9% | 2.94 -425% | 0.8 -43% | 2.24 -300% |
| Greyscale dE 2000 * | 3.7 | 0.8 78% | 1.5 59% | 3.2 14% | 2.8 24% | 5.06 -37% |
| Gamma | 2.2 100% | 2.23 99% | 2.34 94% | 2.43 91% | 2.204 100% | 2.52 87% |
| CCT | 6355 102% | 6471 100% | 6607 98% | 6478 100% | 7122 91% | 5657 115% |
| Toplam Ortalama (Program / Ayarlar) | 19% /
23% | 16% /
19% | -140% /
-89% | 4% /
6% | -28% /
-26% |
* ... daha küçük daha iyidir
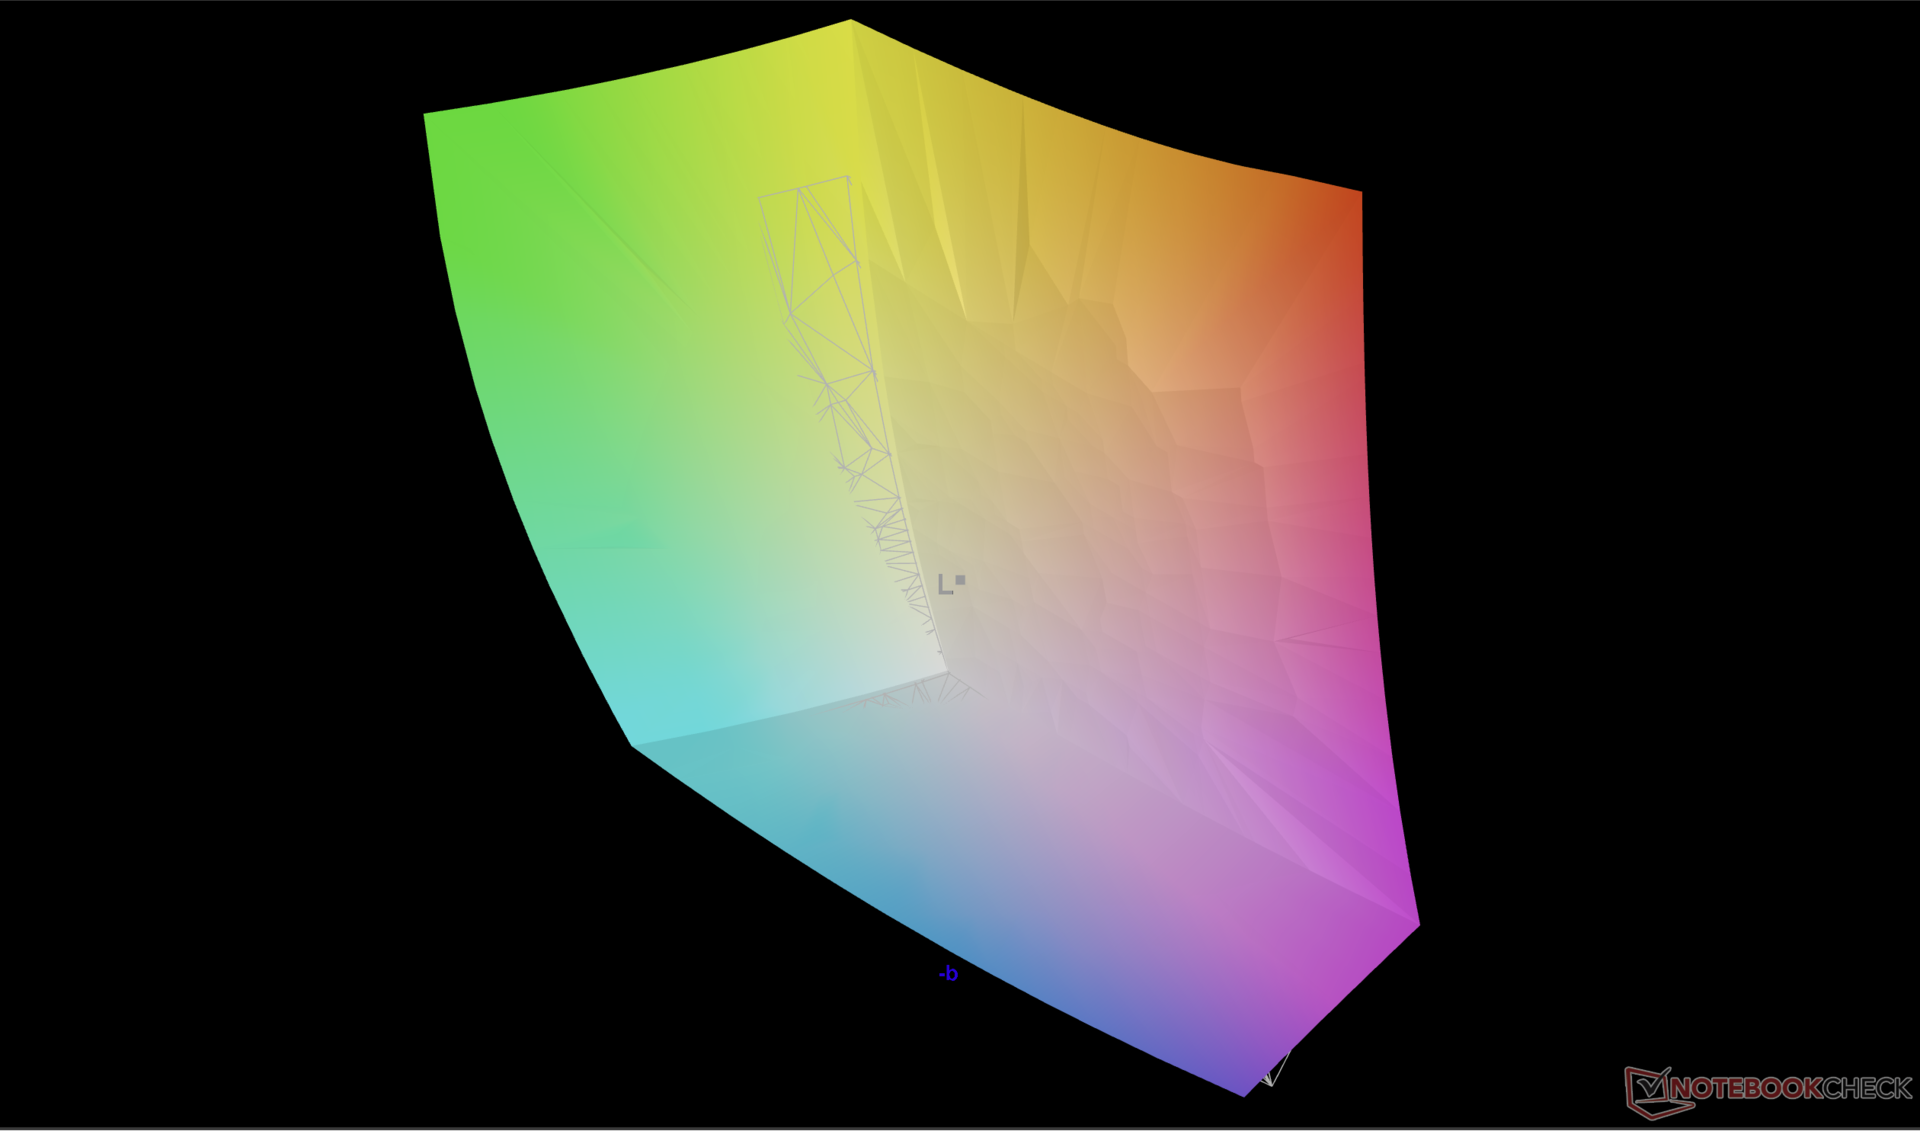
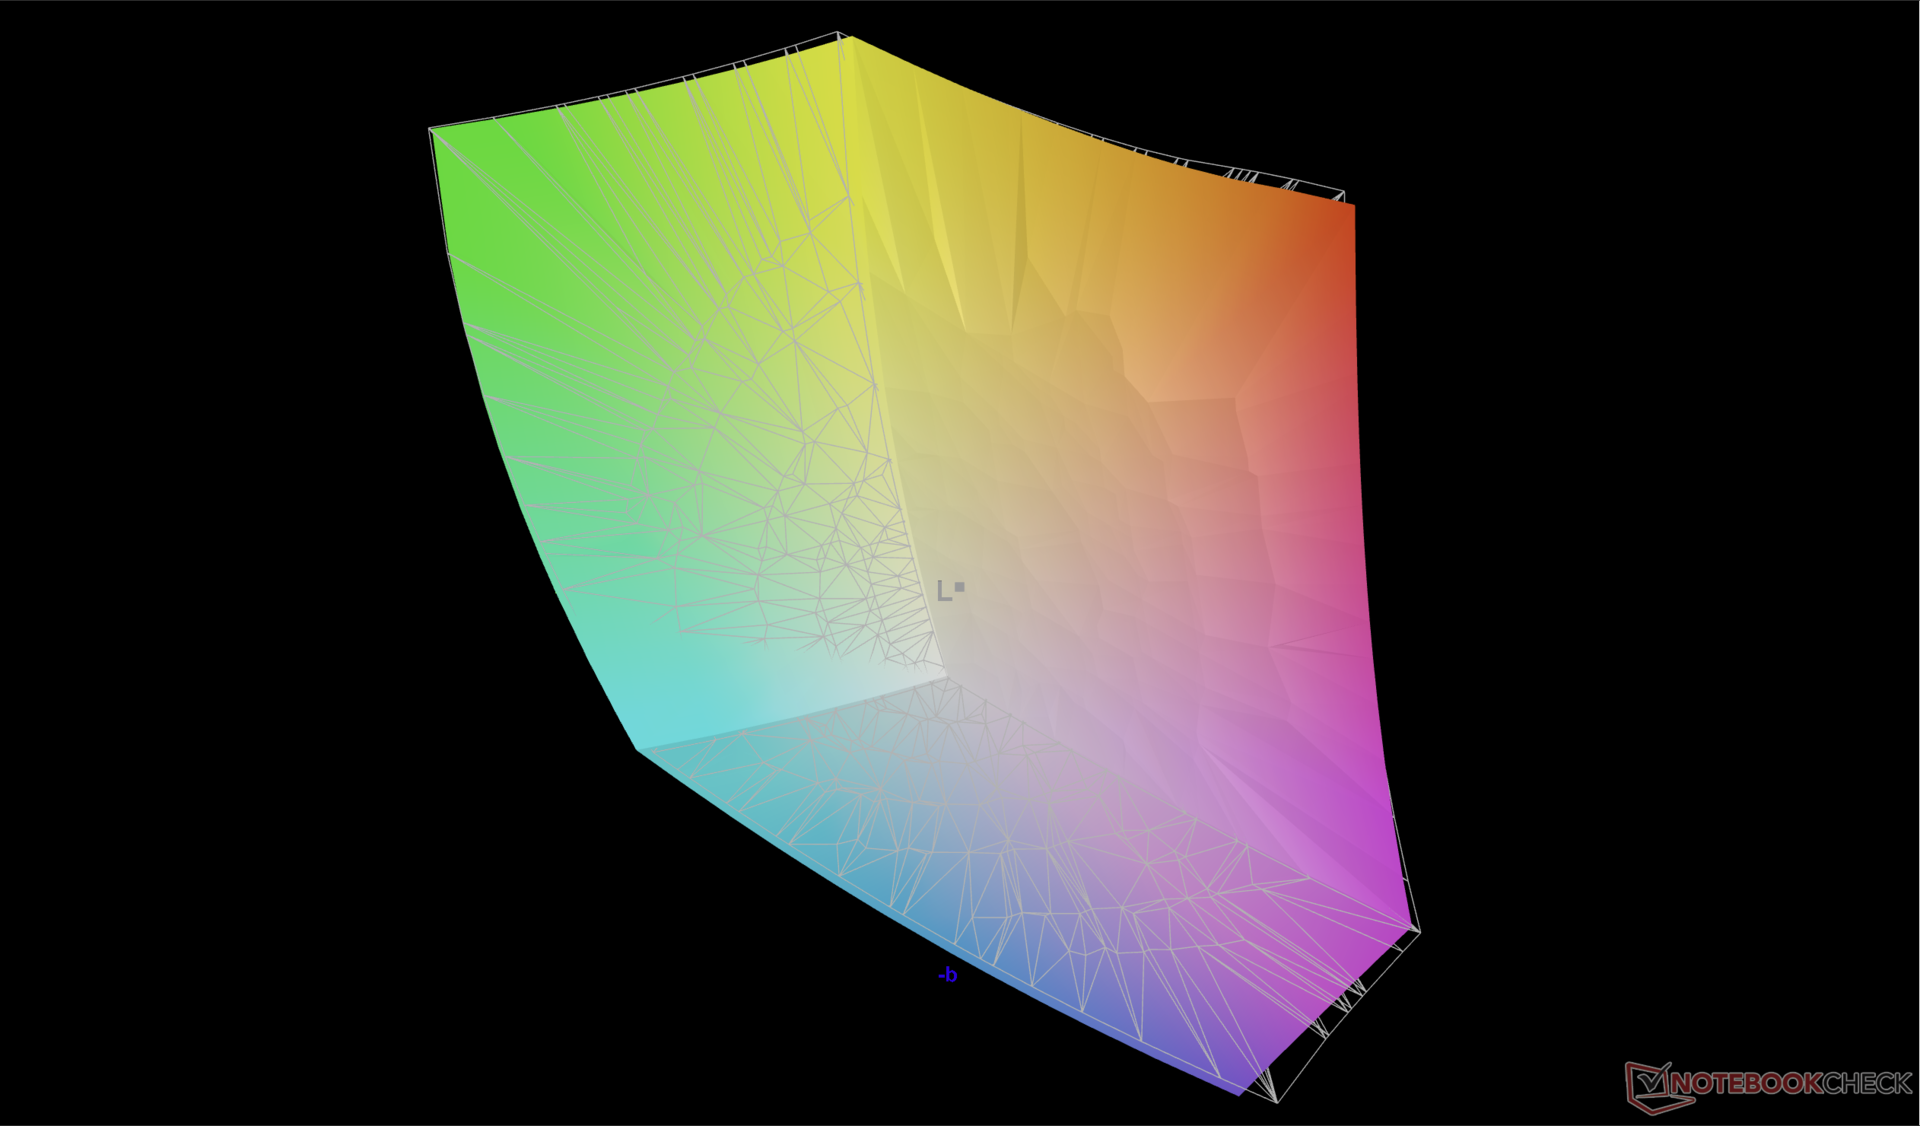
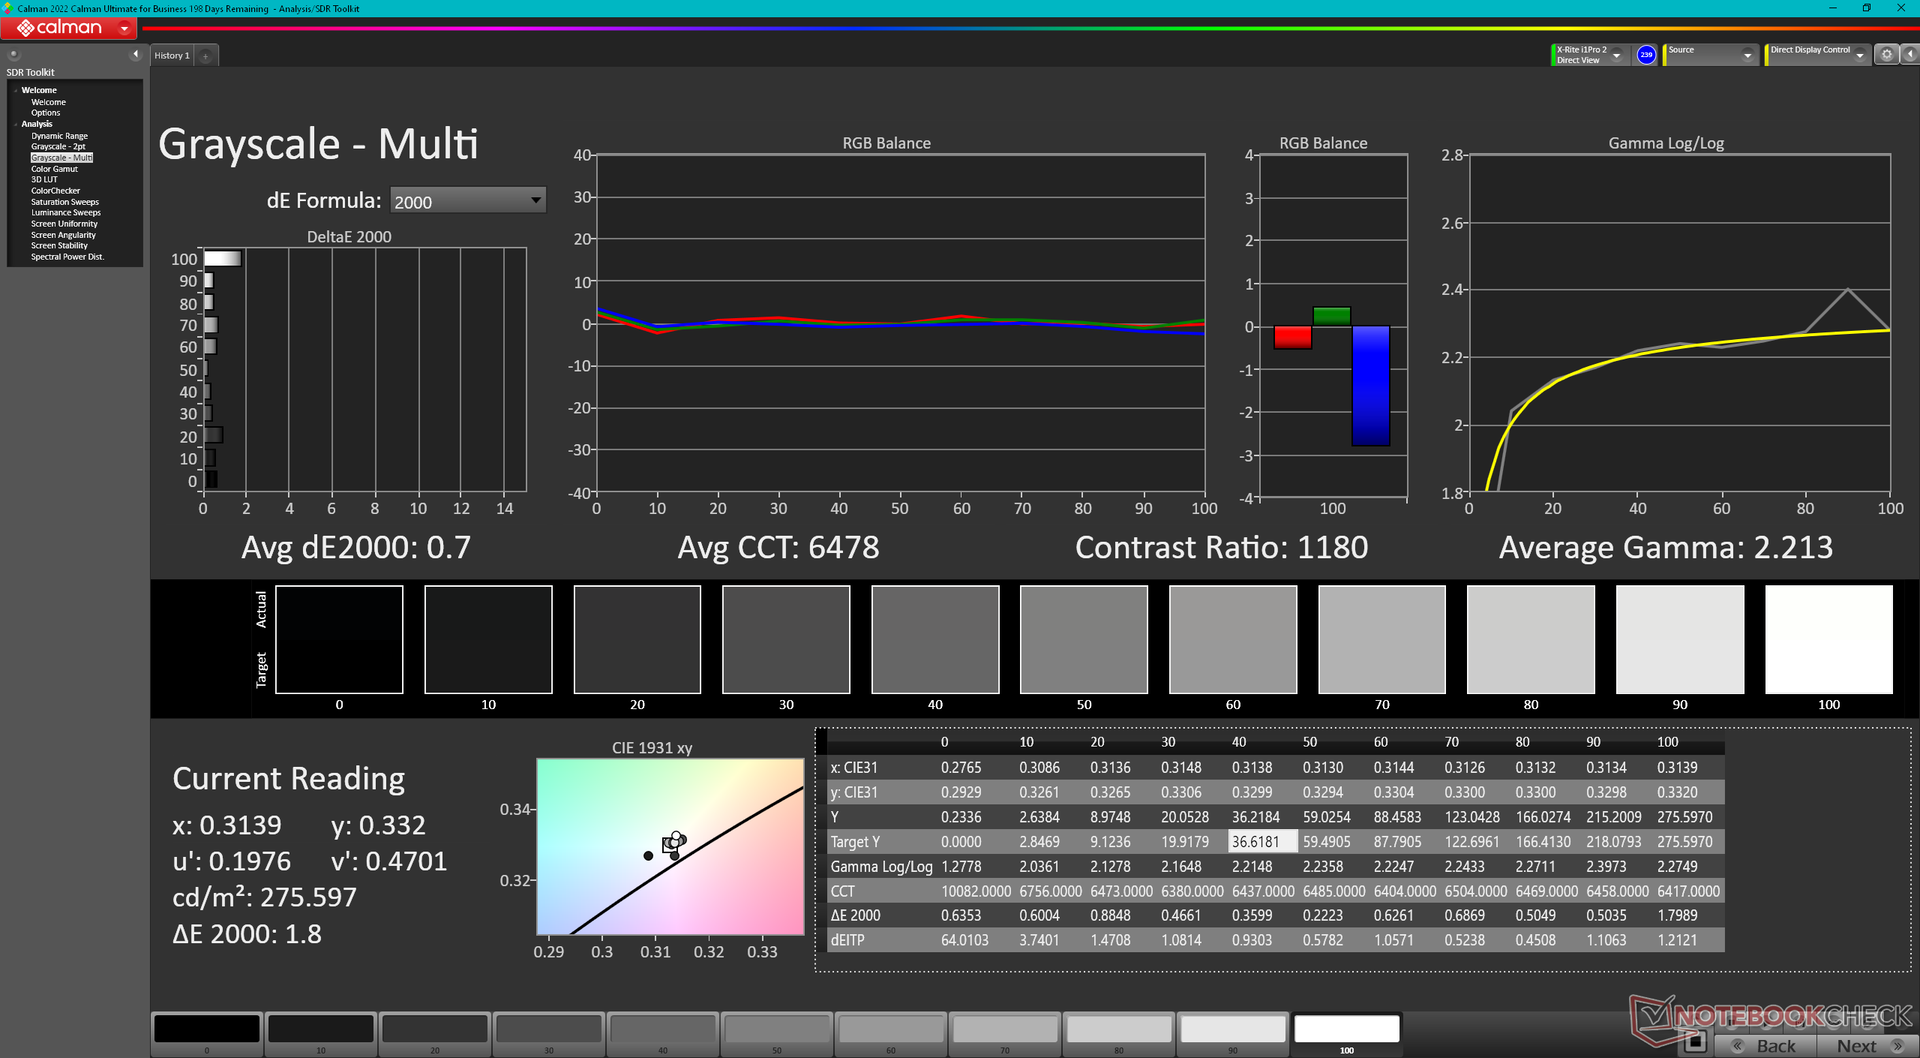
Ekran önceden kalibre edilmemiş olsa da gri tonlama ve renkler kutudan çıktığı haliyle oldukça doğru. Paneli kendimiz kalibre edersek ortalama deltaE değerleri <1'e iner ve P3 renklerinin tamamından daha iyi faydalanabiliriz. Kalibre edilmiş ICM profilimiz yukarıda ücretsiz olarak indirilebilir.
Yanıt Sürelerini Görüntüle
| ↔ Tepki Süresi Siyahtan Beyaza | ||
|---|---|---|
| 10.4 ms ... yükseliş ↗ ve sonbahar↘ birleşimi | ↗ 4.8 ms yükseliş | 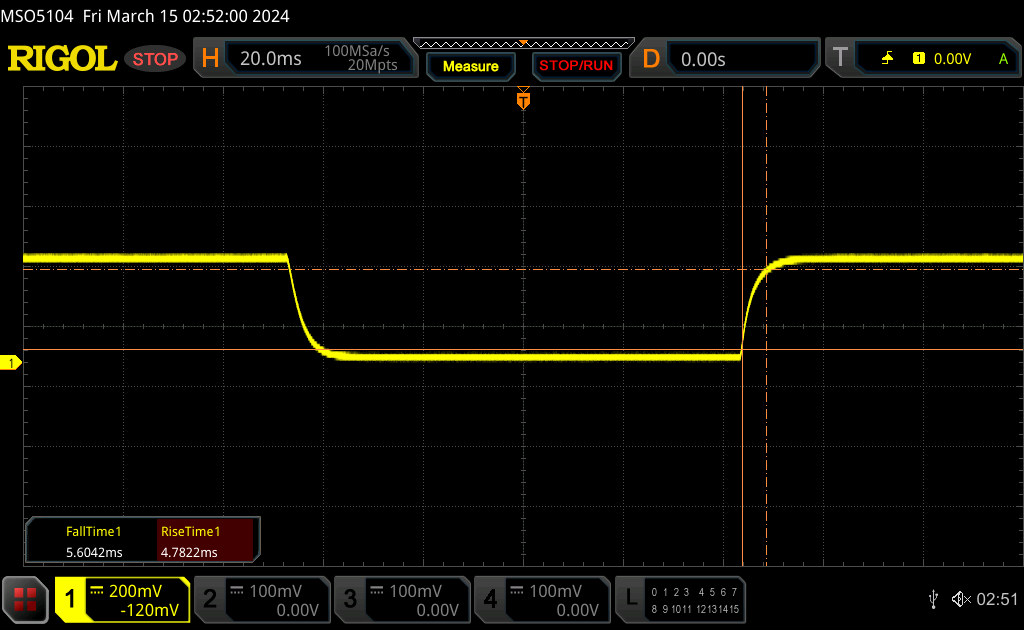 |
| ↘ 5.6 ms sonbahar | ||
| Ekran, testlerimizde iyi yanıt oranları gösteriyor ancak rekabetçi oyuncular için çok yavaş olabilir. Karşılaştırıldığında, test edilen tüm cihazlar 0.1 (minimum) ile 240 (maksimum) ms arasında değişir. » Tüm cihazların 28 %'si daha iyi. Bu, ölçülen yanıt süresinin test edilen tüm cihazların ortalamasından (19.9 ms) daha iyi olduğu anlamına gelir. | ||
| ↔ Tepki Süresi %50 Griden %80 Griye | ||
| 5.3 ms ... yükseliş ↗ ve sonbahar↘ birleşimi | ↗ 2.2 ms yükseliş | 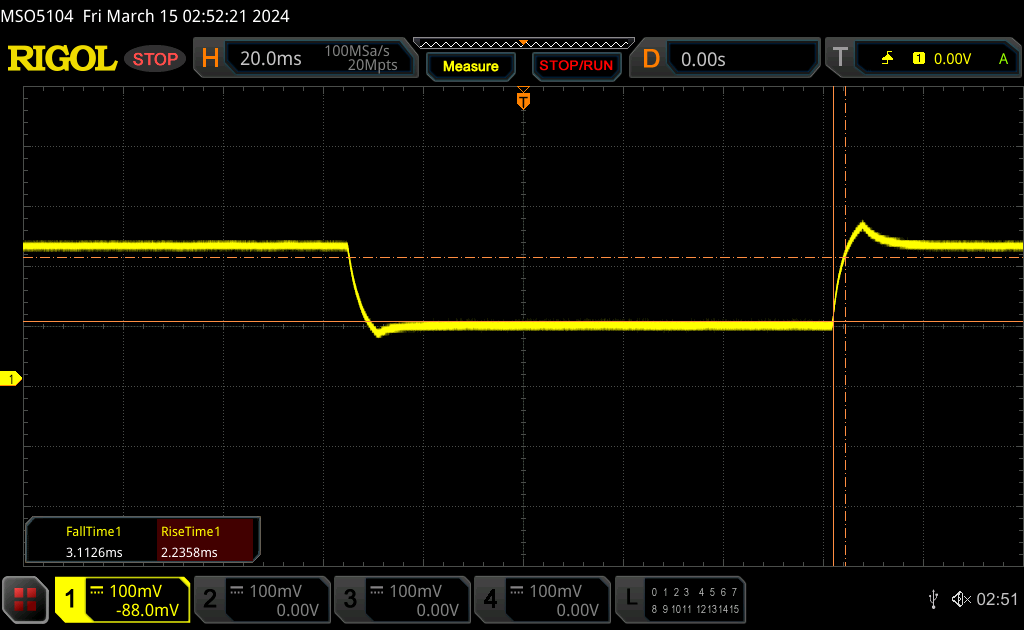 |
| ↘ 3.1 ms sonbahar | ||
| Ekran, testlerimizde çok hızlı yanıt oranları gösteriyor ve hızlı oyun oynamaya çok uygun olmalı. Karşılaştırıldığında, test edilen tüm cihazlar 0.165 (minimum) ile 636 (maksimum) ms arasında değişir. » Tüm cihazların 17 %'si daha iyi. Bu, ölçülen yanıt süresinin test edilen tüm cihazların ortalamasından (31.1 ms) daha iyi olduğu anlamına gelir. | ||
Ekran Titremesi / PWM (Darbe Genişliği Modülasyonu)
| Ekran titriyor / PWM algılanmadı | 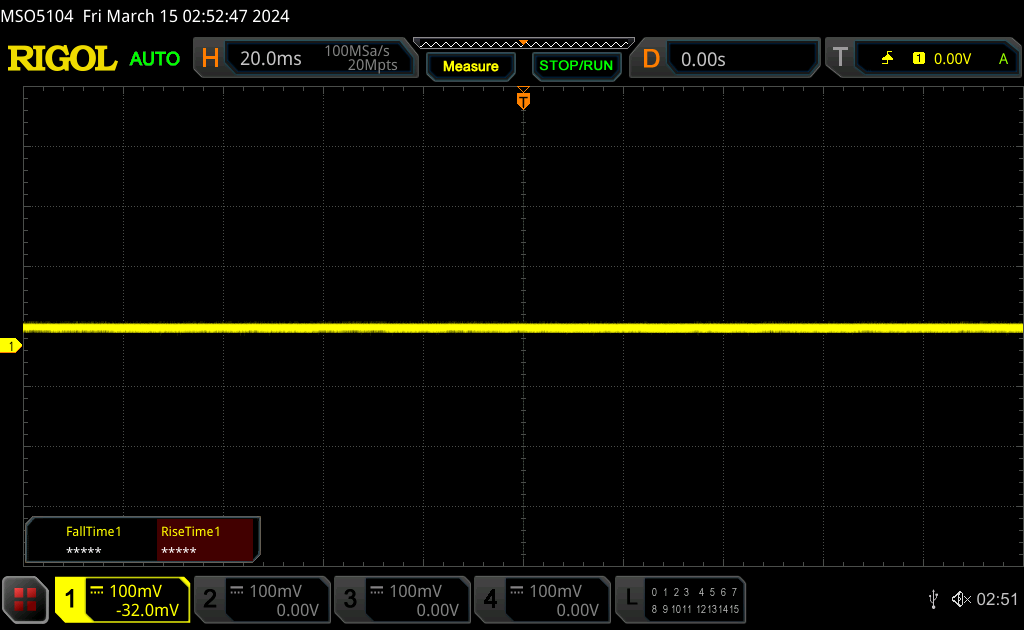 | ||
Karşılaştırıldığında: Test edilen tüm cihazların %52 %'si ekranı karartmak için PWM kullanmıyor. PWM tespit edilirse, ortalama 7798 (minimum: 5 - maksimum: 343500) Hz ölçüldü. | |||
Performans - Raptor Lake-HX Yenileme
Test Koşulları
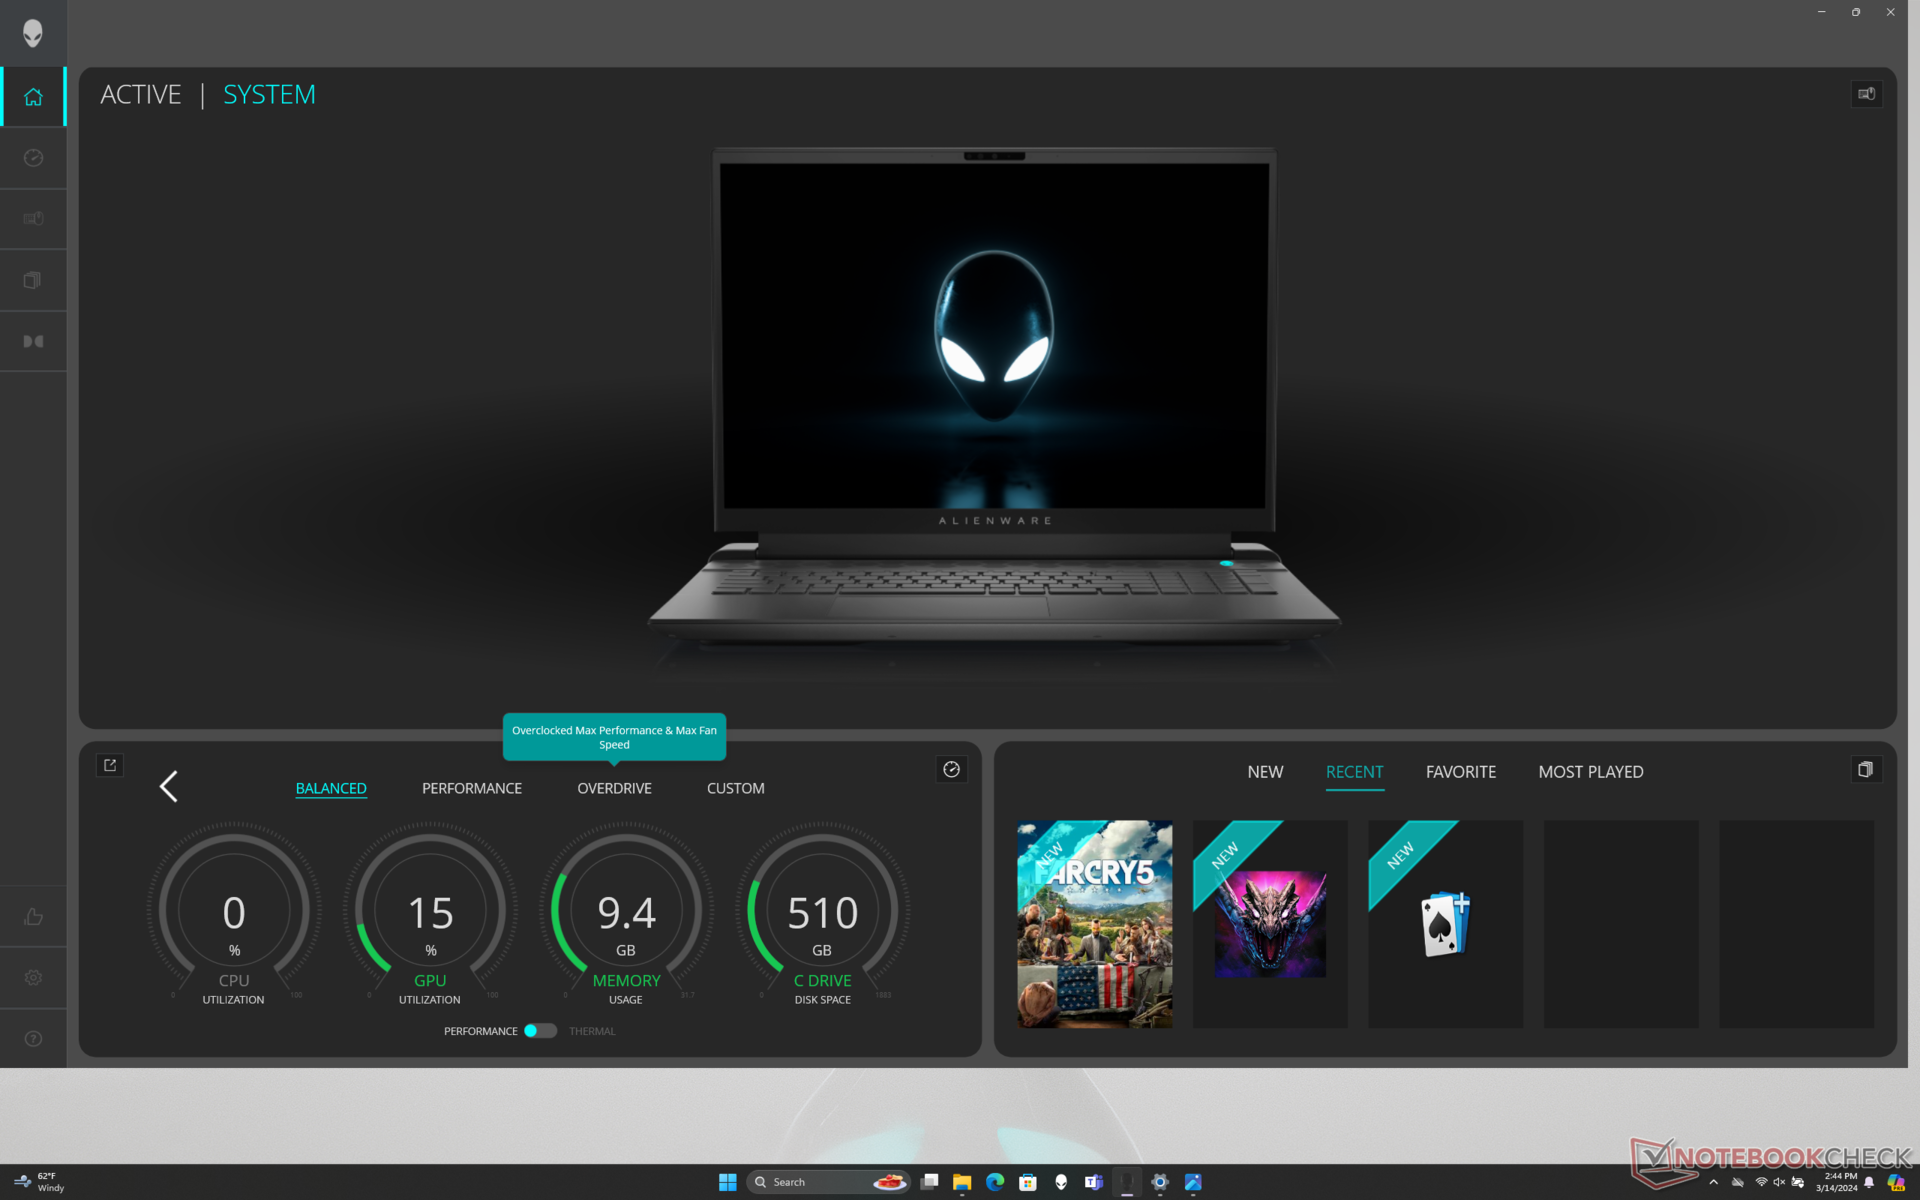
Aşağıdaki kıyaslamaları çalıştırmadan önce Alienware Command Center'ı Overdrive moduna ve Windows'u Performans moduna ayarladık. Ayrıca sistemi Nvidia Denetim Masası üzerinden dGPU moduna ayarladık. Gelişmiş Optimus ve MUX destekleniyor, yani iGPU ve dGPU arasında geçiş yaparken yeniden başlatma gerekmiyor.
Ünitemizde Uyku moduyla ilgili birkaç hata yaşadığımızı belirtmek gerekir. Sistem bazen kapağı kapatırken Uyku moduna doğru şekilde girmiyor ve sonuç olarak sebepsiz yere çok ısınıyordu. Bu durum seyahat ederken meydana gelirse, pil herhangi bir uyarı olmadan tükenebilir. Ayrıca, Uyku modundan çıkarken ekran bazen birkaç saniye donabiliyordu. Bunun MUX veya otomatik GPU geçişi ile ilgili bir sorun olabileceğinden şüpheleniyoruz.

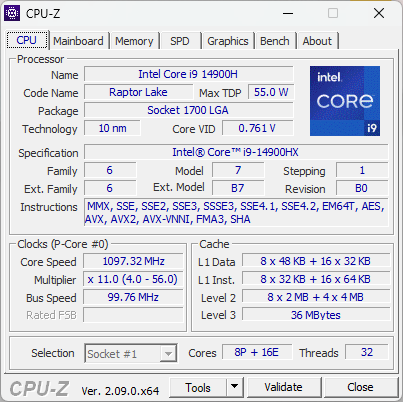
İşlemci
Bu Core i9-14900HX geçen yılki Core i9-13900HX bu nedenle aralarındaki performans farkları en iyi ihtimalle küçüktür. Aslında Core i9-13980HX geçen yılki m18 R1'de i9-14900HX işlemcimiz çok iş parçacıklı iş yüklerinde sürekli olarak birkaç yüzde puan daha iyi performans gösteriyordu.
Core i7-14700HX veya Core i7-14650HX'e geçişin işlemci performansını sırasıyla yaklaşık yüzde 25 ila 30 ve yüzde 30 ila 35 oranında düşürmesi bekleniyor. Bu daha düşük CPU'lar aynı zamanda daha eski Core i7-13700HX ve Core i7-14750HX'in yeniden markalarıdır.
Cinebench R15 Multi Loop
Cinebench R23: Multi Core | Single Core
Cinebench R20: CPU (Multi Core) | CPU (Single Core)
Cinebench R15: CPU Multi 64Bit | CPU Single 64Bit
Blender: v2.79 BMW27 CPU
7-Zip 18.03: 7z b 4 | 7z b 4 -mmt1
Geekbench 6.7: Multi-Core | Single-Core
Geekbench 5.5: Multi-Core | Single-Core
HWBOT x265 Benchmark v2.2: 4k Preset
LibreOffice : 20 Documents To PDF
R Benchmark 2.5: Overall mean
| CPU Performance rating | |
| Alienware m18 R1 AMD | |
| Alienware m18 R2 | |
| Alienware m18 R1 -2! | |
| MSI Titan 18 HX A14VIG | |
| Acer Predator Helios 18 N23Q2 | |
| Ortalama Intel Core i9-14900HX | |
| Razer Blade 18 RTX 4070 -2! | |
| Asus TUF Gaming A17 FA707XI-NS94 | |
| Asus ROG Strix G18 G814JI -2! | |
| Schenker XMG Apex 17 (Late 23) | |
| Acer Nitro 17 AN17-51-71ER -2! | |
| Acer Nitro 17 AN17-41-R9LN | |
| Geekbench 6.7 / Multi-Core | |
| Alienware m18 R2 | |
| Acer Predator Helios 18 N23Q2 | |
| Ortalama Intel Core i9-14900HX (13158 - 19665, n=37) | |
| MSI Titan 18 HX A14VIG | |
| Alienware m18 R1 AMD | |
| Schenker XMG Apex 17 (Late 23) | |
| Asus TUF Gaming A17 FA707XI-NS94 | |
| Acer Nitro 17 AN17-41-R9LN | |
| Geekbench 6.7 / Single-Core | |
| Alienware m18 R2 | |
| Ortalama Intel Core i9-14900HX (2419 - 3129, n=37) | |
| Acer Predator Helios 18 N23Q2 | |
| Alienware m18 R1 AMD | |
| MSI Titan 18 HX A14VIG | |
| Asus TUF Gaming A17 FA707XI-NS94 | |
| Schenker XMG Apex 17 (Late 23) | |
| Acer Nitro 17 AN17-41-R9LN | |
| HWBOT x265 Benchmark v2.2 / 4k Preset | |
| Alienware m18 R1 AMD | |
| Alienware m18 R1 | |
| Alienware m18 R2 | |
| Razer Blade 18 RTX 4070 | |
| MSI Titan 18 HX A14VIG | |
| Acer Predator Helios 18 N23Q2 | |
| Ortalama Intel Core i9-14900HX (16.8 - 38.9, n=37) | |
| Asus ROG Strix G18 G814JI | |
| Asus TUF Gaming A17 FA707XI-NS94 | |
| Schenker XMG Apex 17 (Late 23) | |
| Acer Nitro 17 AN17-51-71ER | |
| Acer Nitro 17 AN17-41-R9LN | |
* ... daha küçük daha iyidir
AIDA64: FP32 Ray-Trace | FPU Julia | CPU SHA3 | CPU Queen | FPU SinJulia | FPU Mandel | CPU AES | CPU ZLib | FP64 Ray-Trace | CPU PhotoWorxx
| Performance rating | |
| Alienware m18 R1 AMD | |
| Acer Predator Helios 18 N23Q2 | |
| Alienware m18 R1 | |
| Alienware m18 R2 | |
| MSI Titan 18 HX A14VIG | |
| Ortalama Intel Core i9-14900HX | |
| Asus ROG Strix G18 G814JI | |
| AIDA64 / FP32 Ray-Trace | |
| Alienware m18 R1 AMD | |
| Alienware m18 R1 | |
| MSI Titan 18 HX A14VIG | |
| Alienware m18 R2 | |
| Acer Predator Helios 18 N23Q2 | |
| Ortalama Intel Core i9-14900HX (13098 - 33474, n=36) | |
| Asus ROG Strix G18 G814JI | |
| AIDA64 / FPU Julia | |
| Alienware m18 R1 AMD | |
| MSI Titan 18 HX A14VIG | |
| Alienware m18 R1 | |
| Alienware m18 R2 | |
| Acer Predator Helios 18 N23Q2 | |
| Ortalama Intel Core i9-14900HX (67573 - 166040, n=36) | |
| Asus ROG Strix G18 G814JI | |
| AIDA64 / CPU SHA3 | |
| Alienware m18 R1 AMD | |
| MSI Titan 18 HX A14VIG | |
| Alienware m18 R1 | |
| Alienware m18 R2 | |
| Acer Predator Helios 18 N23Q2 | |
| Ortalama Intel Core i9-14900HX (3589 - 7979, n=36) | |
| Asus ROG Strix G18 G814JI | |
| AIDA64 / CPU Queen | |
| Alienware m18 R1 AMD | |
| MSI Titan 18 HX A14VIG | |
| Alienware m18 R1 | |
| Alienware m18 R2 | |
| Ortalama Intel Core i9-14900HX (118405 - 148966, n=36) | |
| Acer Predator Helios 18 N23Q2 | |
| Asus ROG Strix G18 G814JI | |
| AIDA64 / FPU SinJulia | |
| Alienware m18 R1 AMD | |
| MSI Titan 18 HX A14VIG | |
| Alienware m18 R1 | |
| Alienware m18 R2 | |
| Acer Predator Helios 18 N23Q2 | |
| Ortalama Intel Core i9-14900HX (10475 - 18517, n=36) | |
| Asus ROG Strix G18 G814JI | |
| AIDA64 / FPU Mandel | |
| Alienware m18 R1 AMD | |
| Alienware m18 R1 | |
| Alienware m18 R2 | |
| MSI Titan 18 HX A14VIG | |
| Acer Predator Helios 18 N23Q2 | |
| Ortalama Intel Core i9-14900HX (32543 - 83662, n=36) | |
| Asus ROG Strix G18 G814JI | |
| AIDA64 / CPU AES | |
| Acer Predator Helios 18 N23Q2 | |
| Alienware m18 R1 AMD | |
| Ortalama Intel Core i9-14900HX (86964 - 241777, n=36) | |
| MSI Titan 18 HX A14VIG | |
| Alienware m18 R1 | |
| Alienware m18 R2 | |
| Asus ROG Strix G18 G814JI | |
| AIDA64 / CPU ZLib | |
| Alienware m18 R1 AMD | |
| MSI Titan 18 HX A14VIG | |
| Alienware m18 R2 | |
| Alienware m18 R1 | |
| Acer Predator Helios 18 N23Q2 | |
| Ortalama Intel Core i9-14900HX (1054 - 2292, n=36) | |
| Asus ROG Strix G18 G814JI | |
| AIDA64 / FP64 Ray-Trace | |
| Alienware m18 R1 AMD | |
| Alienware m18 R1 | |
| Alienware m18 R2 | |
| MSI Titan 18 HX A14VIG | |
| Acer Predator Helios 18 N23Q2 | |
| Ortalama Intel Core i9-14900HX (6809 - 18349, n=36) | |
| Asus ROG Strix G18 G814JI | |
| AIDA64 / CPU PhotoWorxx | |
| Alienware m18 R1 | |
| Acer Predator Helios 18 N23Q2 | |
| Alienware m18 R2 | |
| Ortalama Intel Core i9-14900HX (23903 - 54702, n=36) | |
| Asus ROG Strix G18 G814JI | |
| Alienware m18 R1 AMD | |
| MSI Titan 18 HX A14VIG | |
Stres Testi
Prime95 stresini çalıştırırken çekirdek sıcaklığı, daha yeni bir işlemciye geçilmesine rağmen geçen yılki m18 R1'de gözlemlediğimize benzer şekilde 100 C'de sabitleniyor. Bununla birlikte, saat hızları i9-14900HX'te daha sık dalgalanıyor gibi görünüyor, bu da yukarıda belirtildiği gibi i9-13980HX'ten biraz daha yavaş performansını açıklayabilir.
GPU saat hızları ve kart güç çekişi, aşağıdaki GPU Performansı bölümündeki Fire Strike test sonuçlarımızla uyumlu olan Dengeli, Performans ve Aşırı Hız modları arasında geçiş yaparken neredeyse hiç değişmiyor. Bu davranış, Dengeli ve Performans modları arasında daha büyük bir performans farkının olduğu diğer oyun dizüstü bilgisayarlarının çoğundan farklıdır.
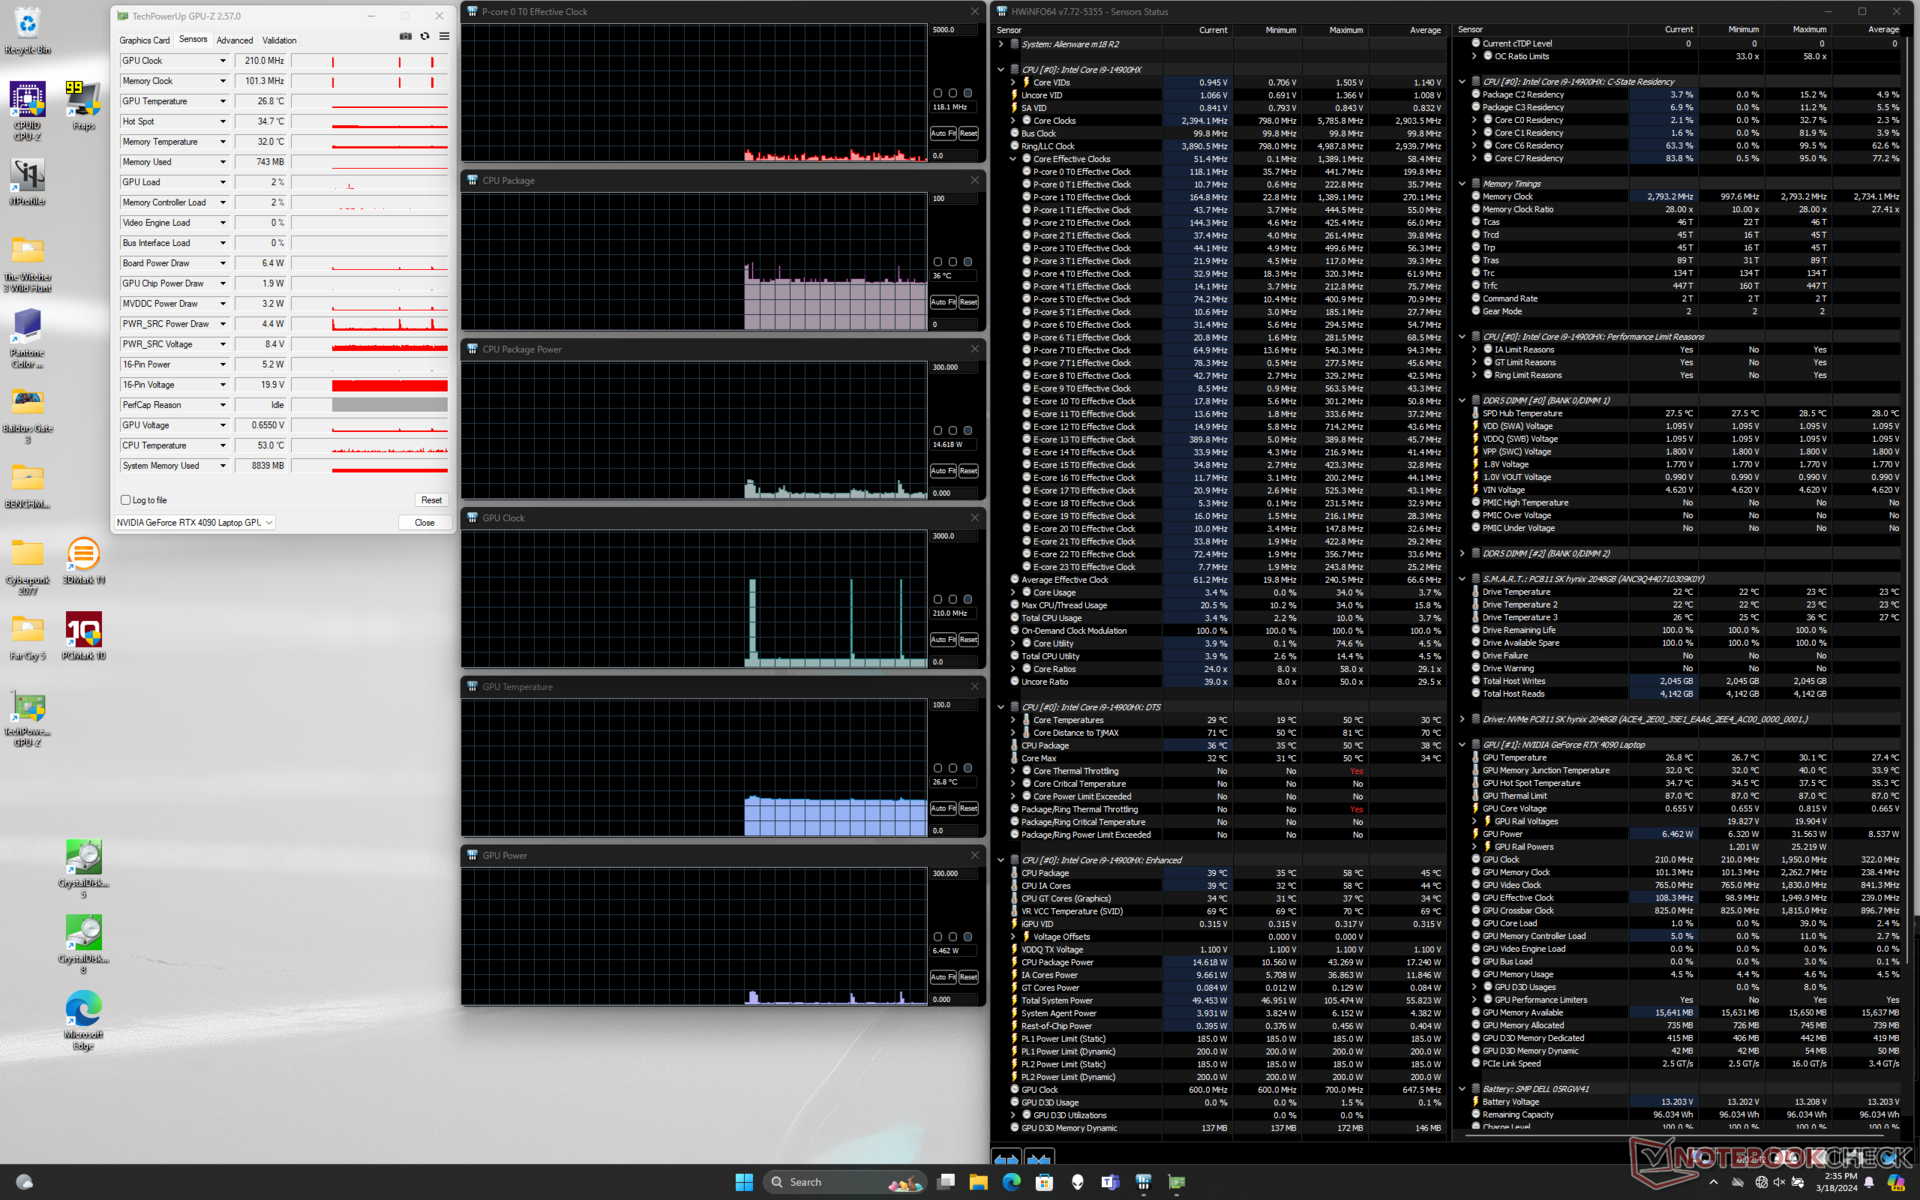
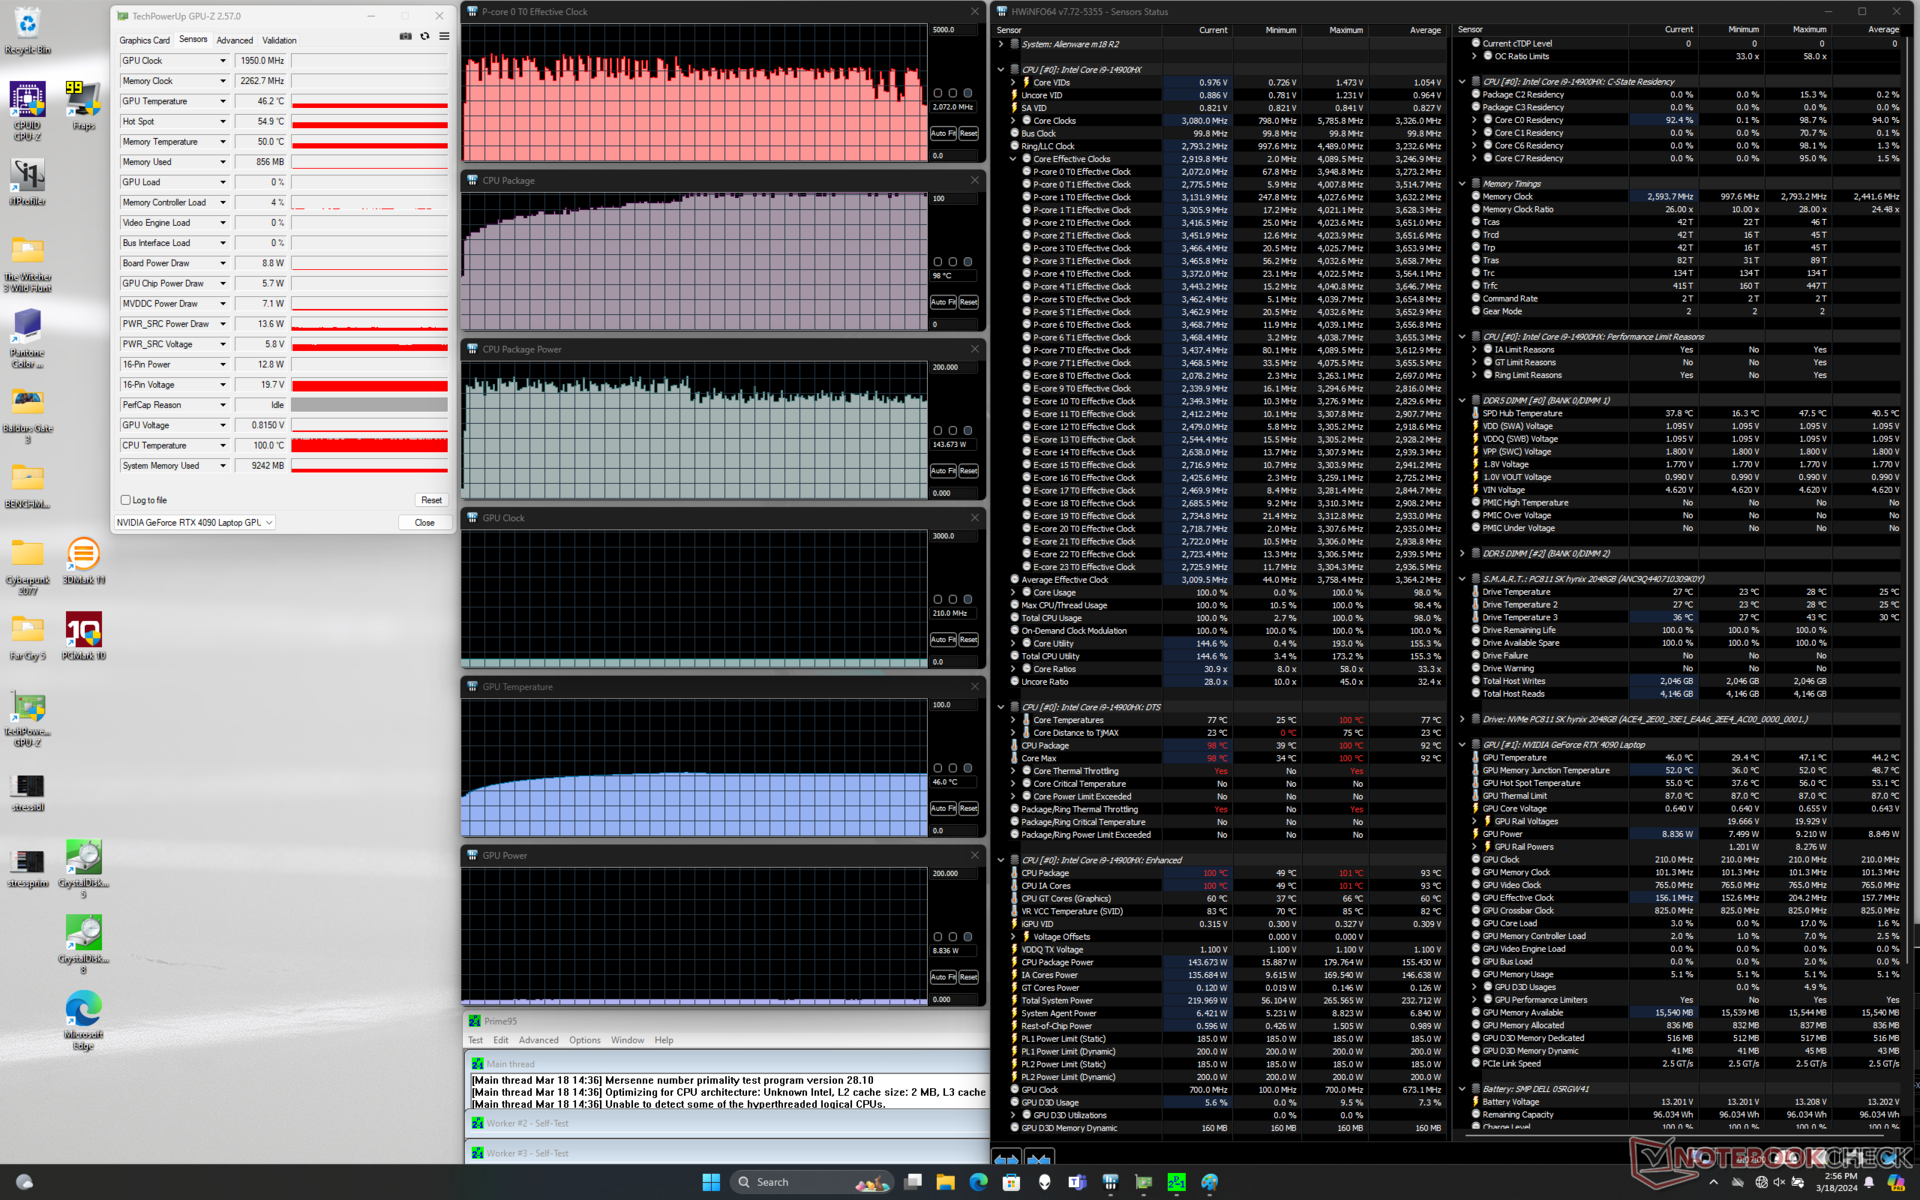
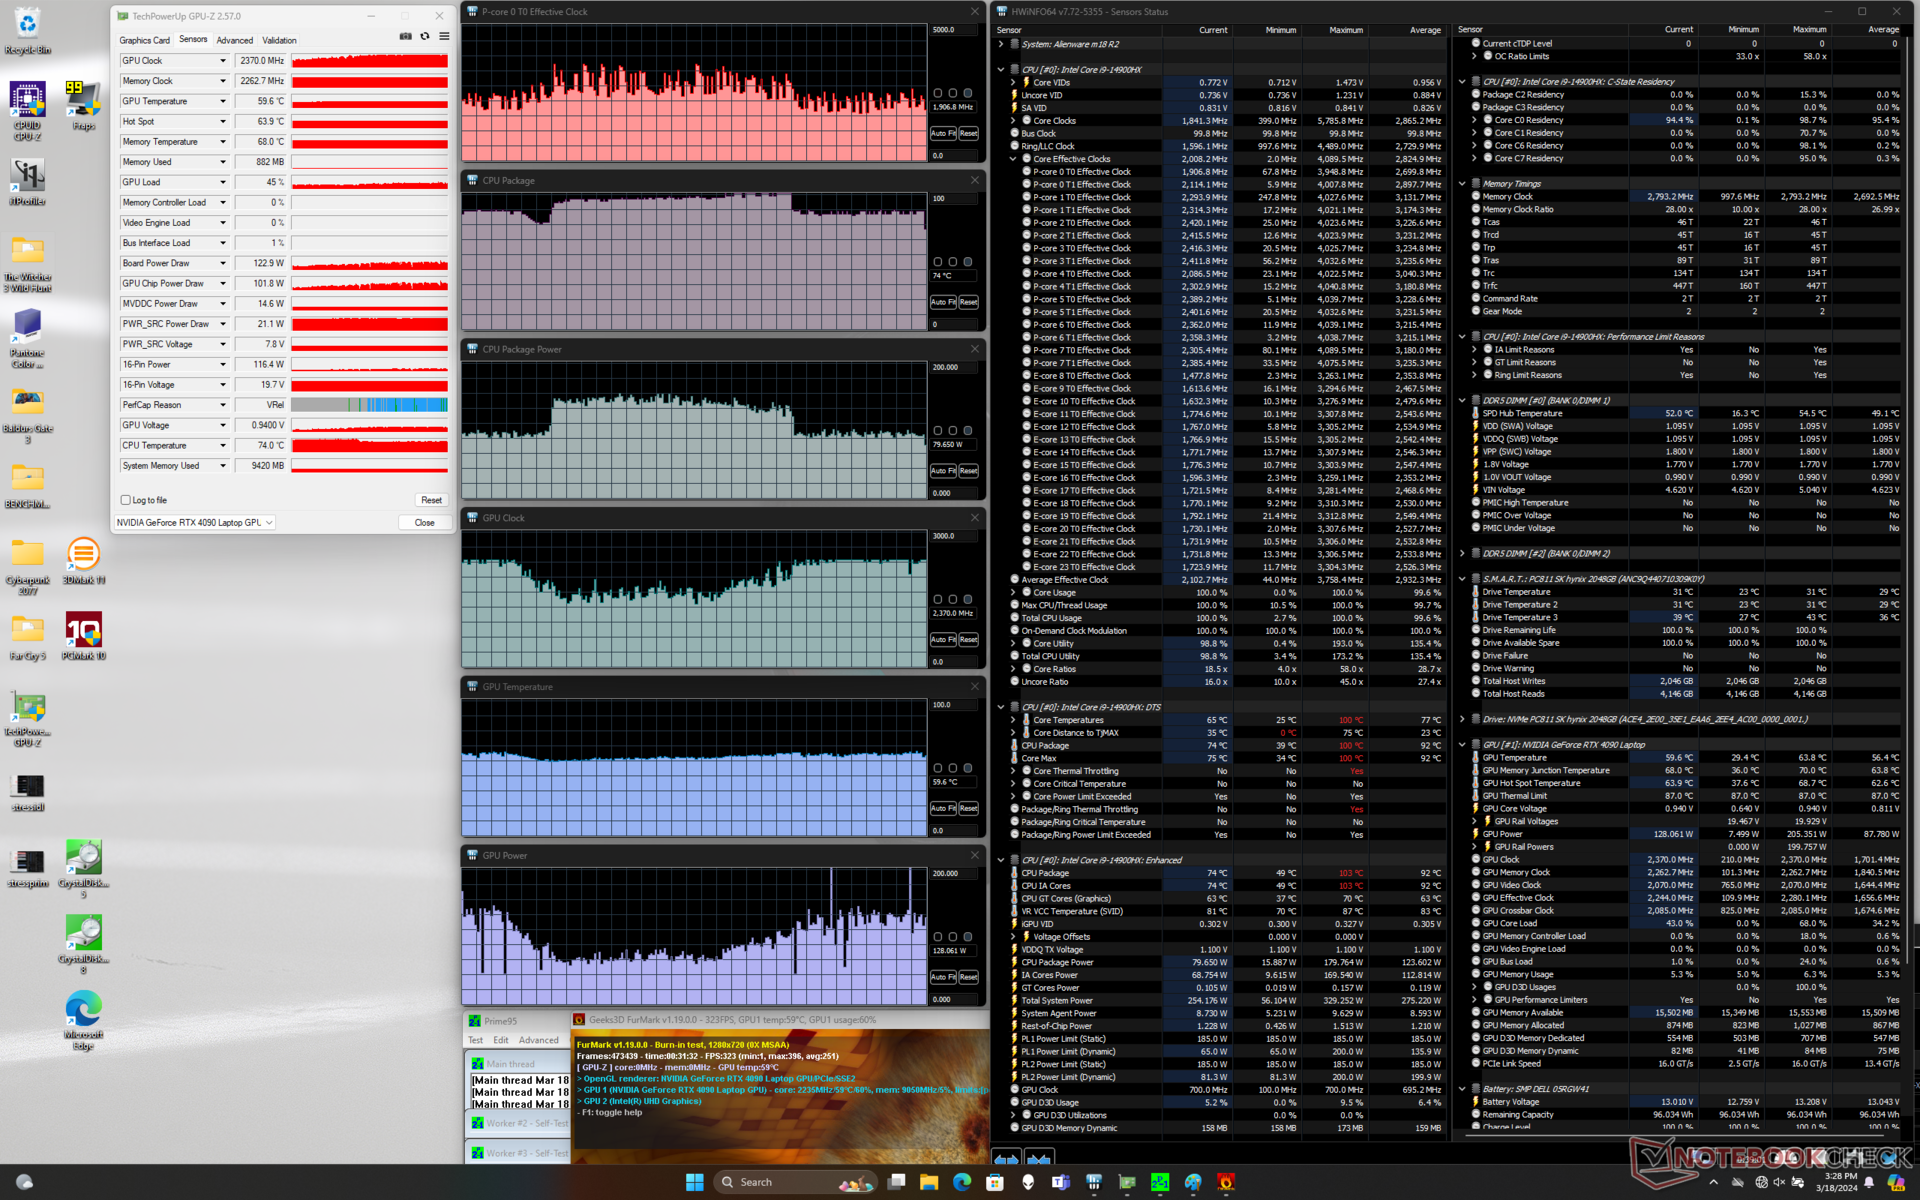
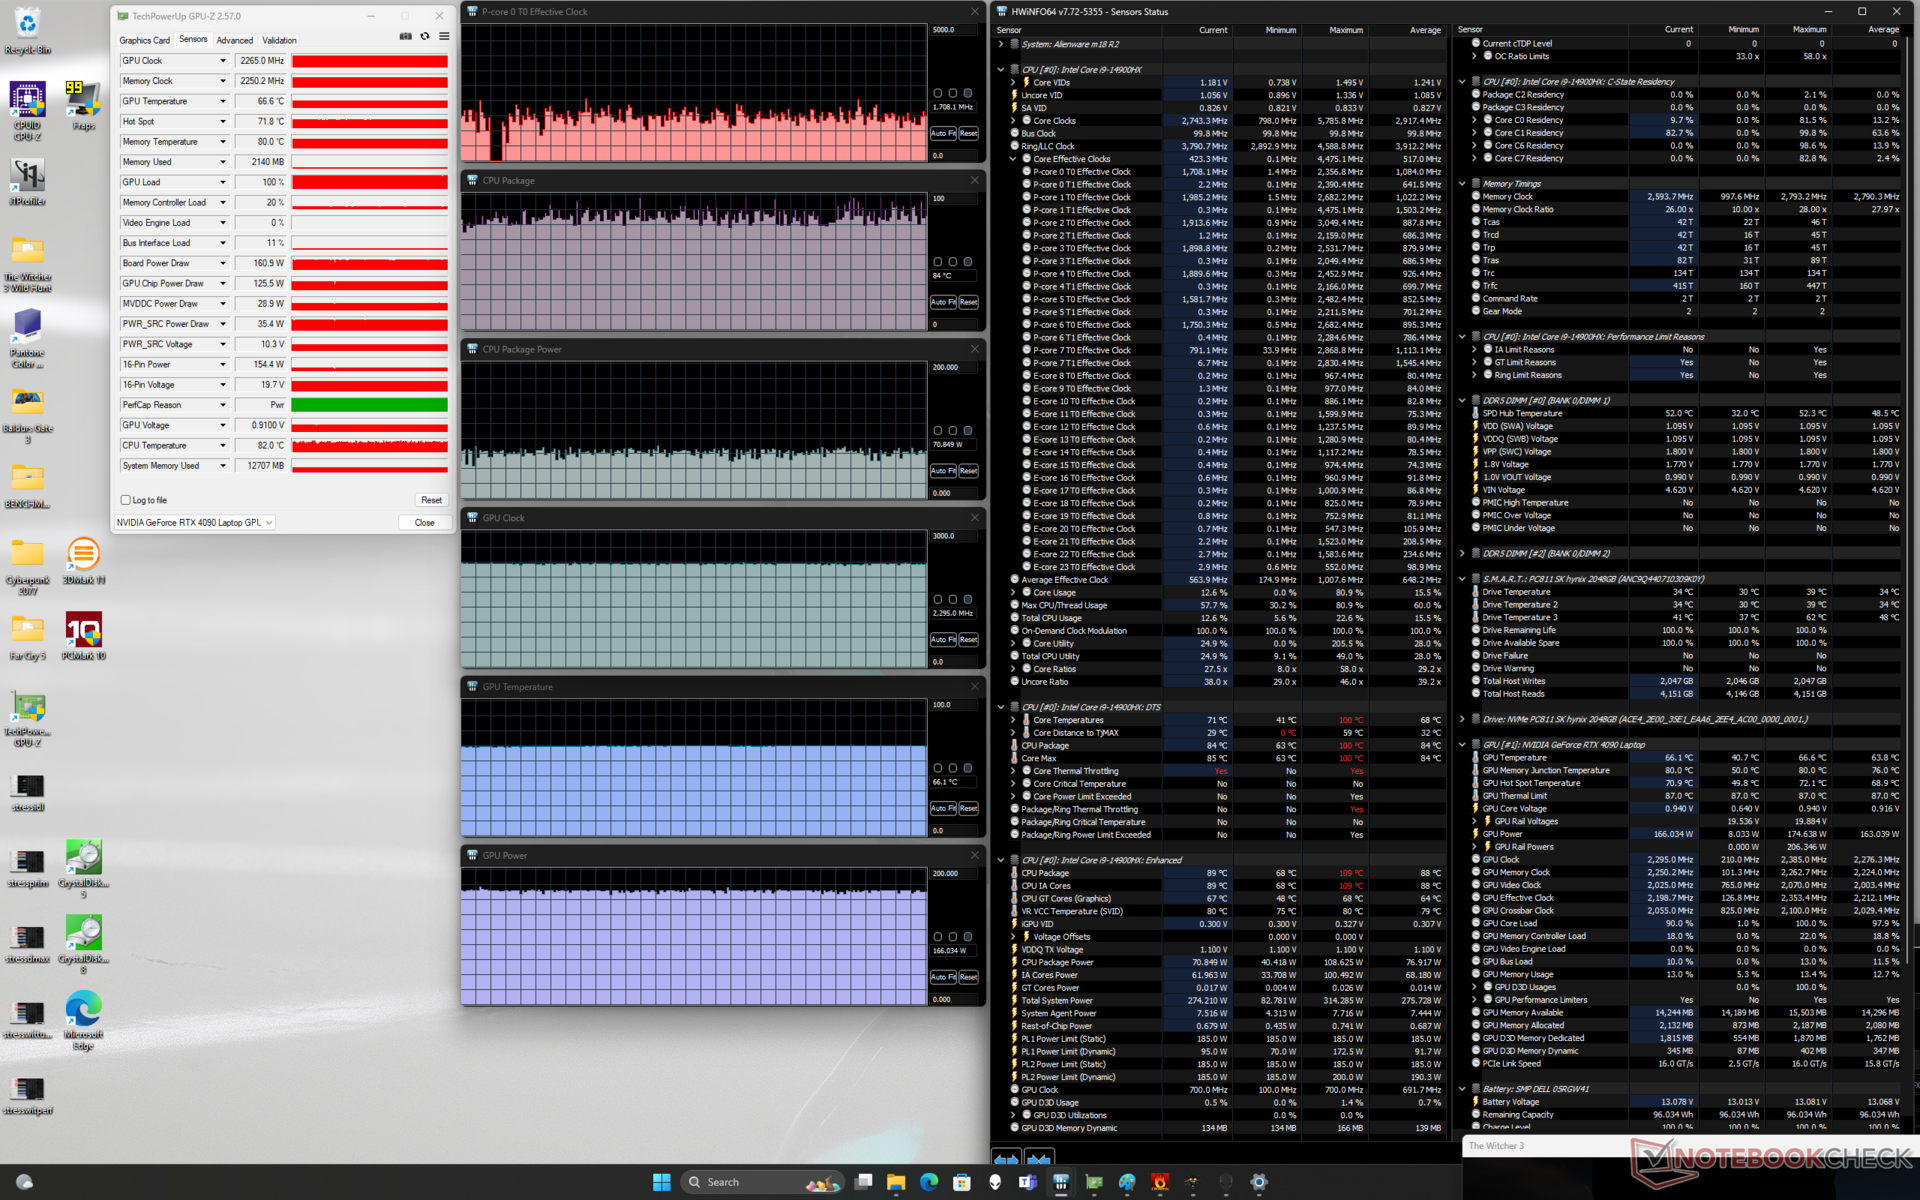
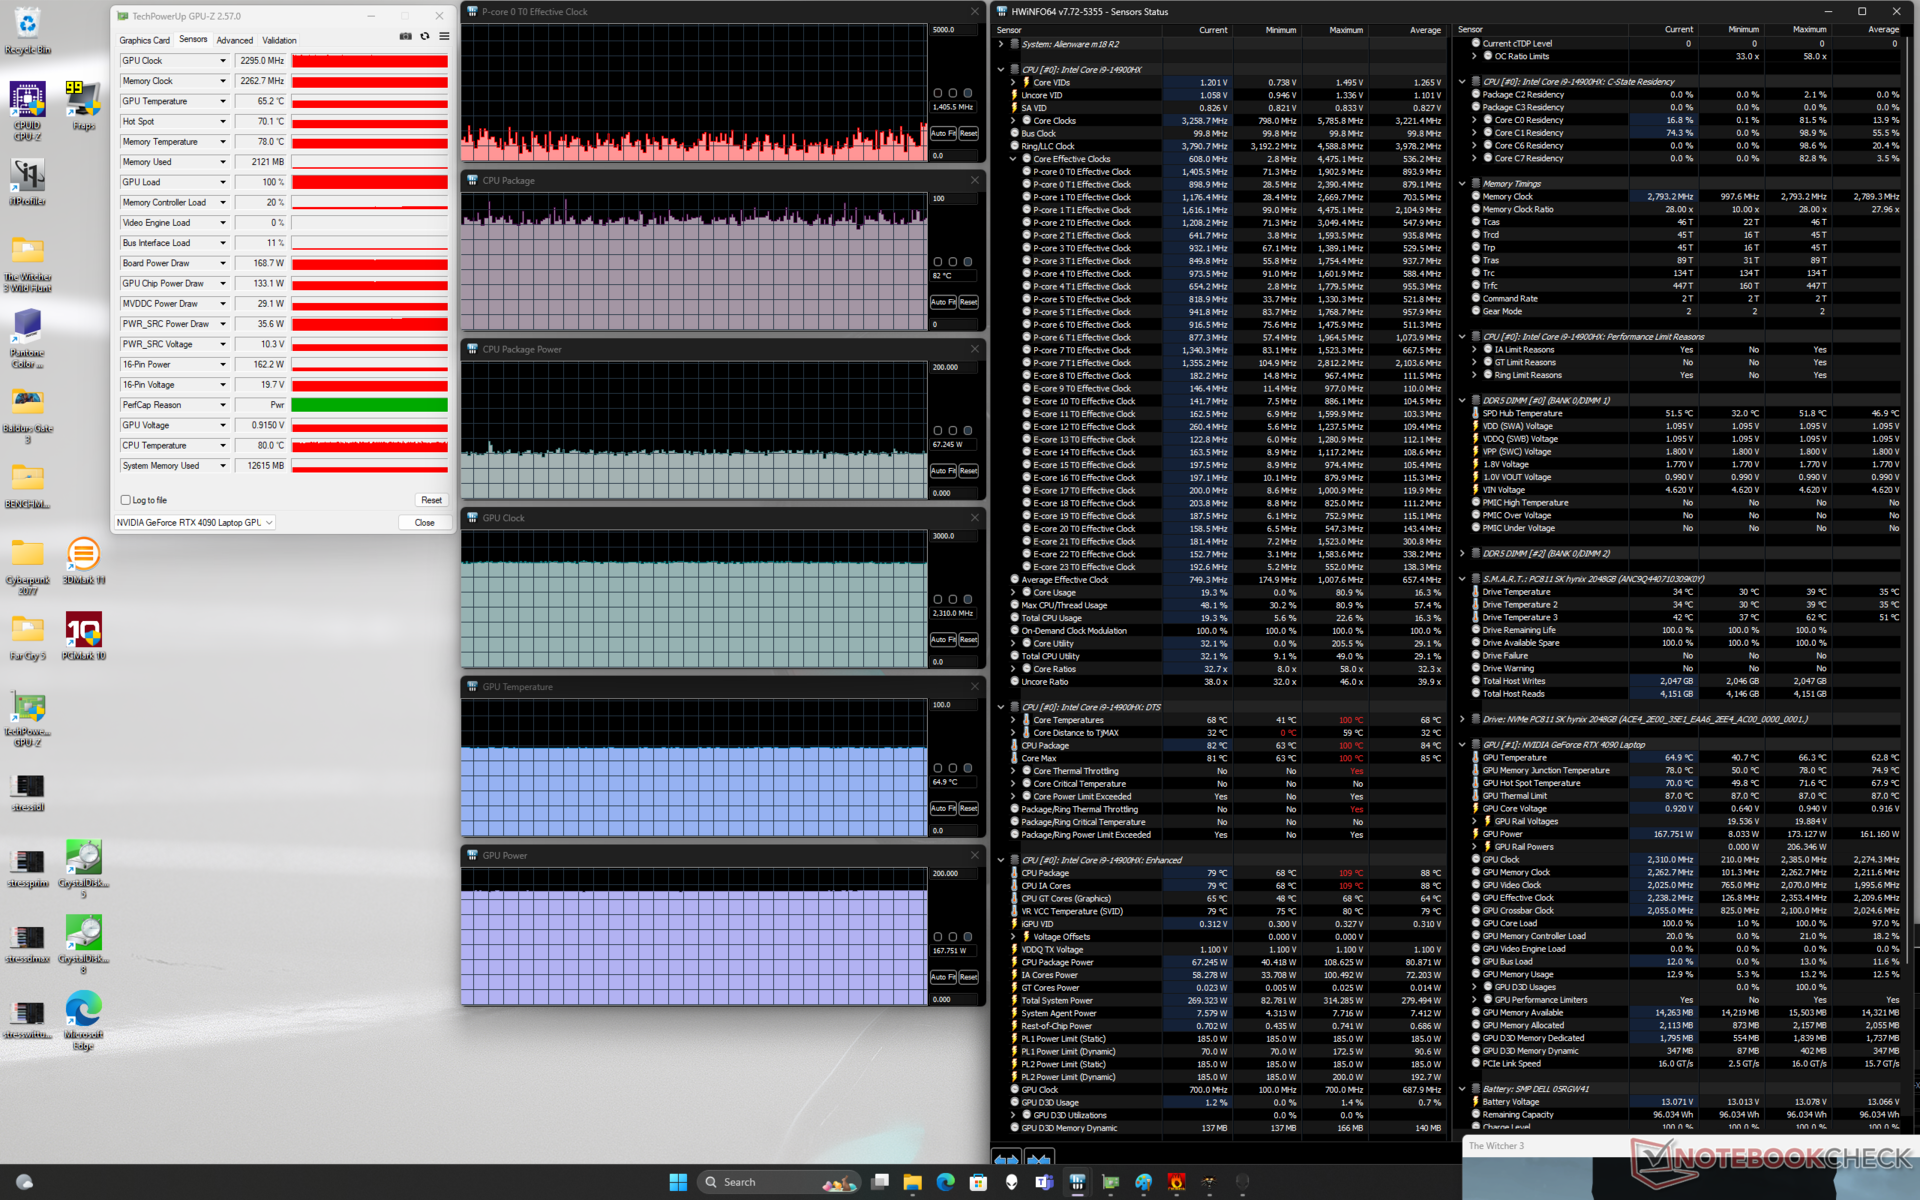
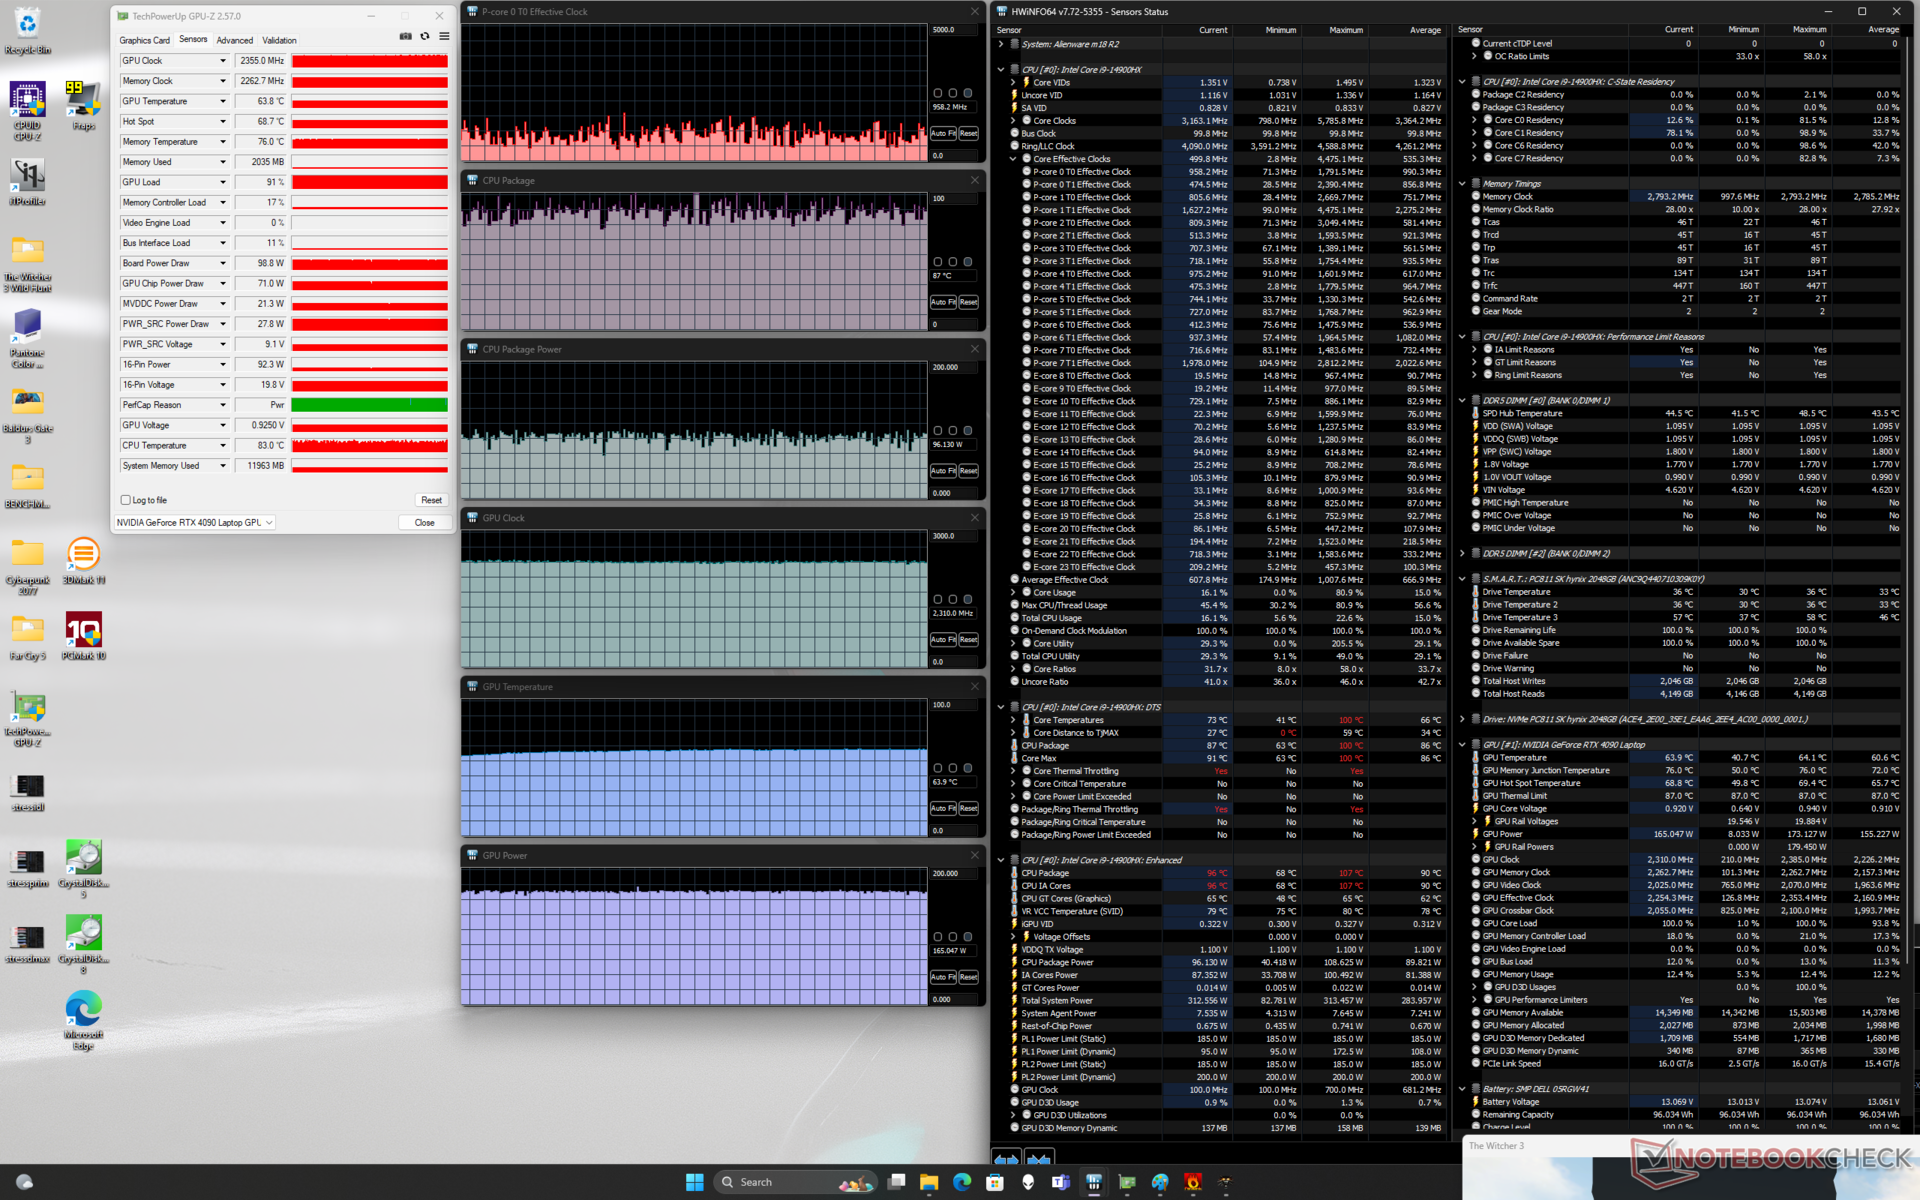
| CPU Saati (GHz) | GPU Saati (MHz) | Ortalama CPU Sıcaklığı (°C) | Ortalama GPU Sıcaklığı (°C) | |
| Sistem Boşta | -- | -- | 36 | 27 |
| Prime95 Stres | 2.1 - 3.3 | -- | 99 | 46 |
| Prime95 + FurMark Stres | 1,7 - 3,7 | 1350 - 2370 | 74 - 100 | 54 - 61 |
| Witcher 3 Stres (Dengeli mod) | ~1.7 | 2295 | ~84 | 66 |
| Witcher 3 Stres (Performans modu) | ~1.4 | 2310 | ~82 | 65 |
| Witcher 3 Stres (Overdrive modu) | ~1.0 | 2310 | ~87 | 64 |
Sistem Performansı
CrossMark: Overall | Productivity | Creativity | Responsiveness
WebXPRT 3: Overall
WebXPRT 4: Overall
Mozilla Kraken 1.1: Total
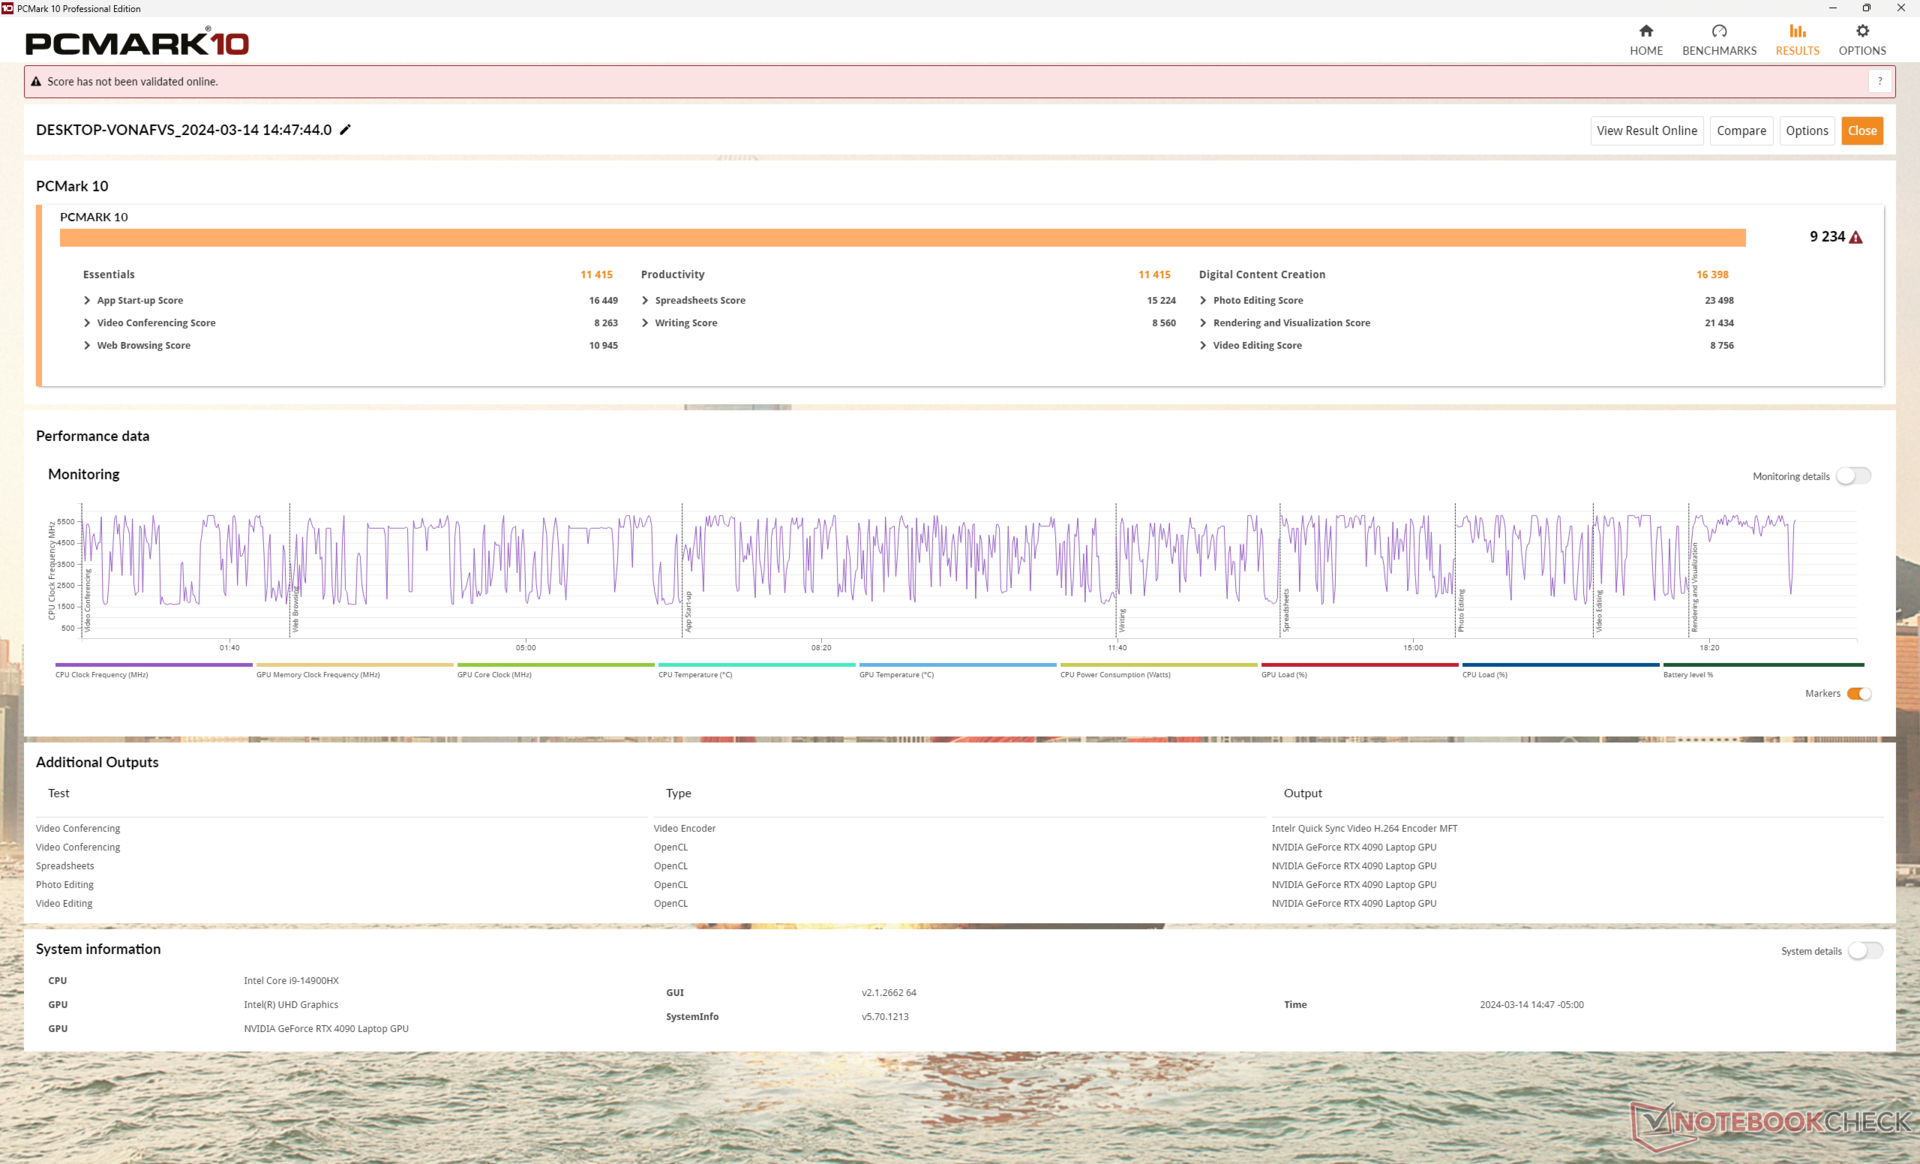
| PCMark 10 / Score | |
| Alienware m18 R1 AMD | |
| Alienware m18 R2 | |
| MSI Titan 18 HX A14VIG | |
| Alienware m18 R1 | |
| Ortalama Intel Core i9-14900HX, NVIDIA GeForce RTX 4090 Laptop GPU (8230 - 9234, n=13) | |
| Acer Predator Helios 18 N23Q2 | |
| Asus ROG Strix G18 G814JI | |
| PCMark 10 / Essentials | |
| Alienware m18 R1 AMD | |
| MSI Titan 18 HX A14VIG | |
| Alienware m18 R2 | |
| Alienware m18 R1 | |
| Ortalama Intel Core i9-14900HX, NVIDIA GeForce RTX 4090 Laptop GPU (10778 - 11628, n=13) | |
| Acer Predator Helios 18 N23Q2 | |
| Asus ROG Strix G18 G814JI | |
| PCMark 10 / Productivity | |
| Alienware m18 R2 | |
| Alienware m18 R1 AMD | |
| Ortalama Intel Core i9-14900HX, NVIDIA GeForce RTX 4090 Laptop GPU (9458 - 11759, n=13) | |
| Acer Predator Helios 18 N23Q2 | |
| MSI Titan 18 HX A14VIG | |
| Alienware m18 R1 | |
| Asus ROG Strix G18 G814JI | |
| PCMark 10 / Digital Content Creation | |
| Alienware m18 R1 AMD | |
| MSI Titan 18 HX A14VIG | |
| Alienware m18 R2 | |
| Alienware m18 R1 | |
| Ortalama Intel Core i9-14900HX, NVIDIA GeForce RTX 4090 Laptop GPU (13219 - 16462, n=13) | |
| Acer Predator Helios 18 N23Q2 | |
| Asus ROG Strix G18 G814JI | |
| CrossMark / Overall | |
| Acer Predator Helios 18 N23Q2 | |
| Alienware m18 R1 | |
| Ortalama Intel Core i9-14900HX, NVIDIA GeForce RTX 4090 Laptop GPU (1877 - 2344, n=10) | |
| Alienware m18 R2 | |
| Alienware m18 R1 AMD | |
| MSI Titan 18 HX A14VIG | |
| CrossMark / Productivity | |
| Acer Predator Helios 18 N23Q2 | |
| Alienware m18 R1 | |
| Ortalama Intel Core i9-14900HX, NVIDIA GeForce RTX 4090 Laptop GPU (1738 - 2162, n=10) | |
| Alienware m18 R2 | |
| Alienware m18 R1 AMD | |
| MSI Titan 18 HX A14VIG | |
| CrossMark / Creativity | |
| Alienware m18 R1 | |
| Acer Predator Helios 18 N23Q2 | |
| Alienware m18 R2 | |
| Ortalama Intel Core i9-14900HX, NVIDIA GeForce RTX 4090 Laptop GPU (2195 - 2660, n=10) | |
| Alienware m18 R1 AMD | |
| MSI Titan 18 HX A14VIG | |
| CrossMark / Responsiveness | |
| Acer Predator Helios 18 N23Q2 | |
| Alienware m18 R1 | |
| Ortalama Intel Core i9-14900HX, NVIDIA GeForce RTX 4090 Laptop GPU (1478 - 2327, n=10) | |
| Alienware m18 R2 | |
| Alienware m18 R1 AMD | |
| MSI Titan 18 HX A14VIG | |
| WebXPRT 3 / Overall | |
| Alienware m18 R1 AMD | |
| Alienware m18 R1 | |
| MSI Titan 18 HX A14VIG | |
| Alienware m18 R2 | |
| Ortalama Intel Core i9-14900HX, NVIDIA GeForce RTX 4090 Laptop GPU (279 - 339, n=10) | |
| Acer Predator Helios 18 N23Q2 | |
| Asus ROG Strix G18 G814JI | |
| Asus ROG Strix G18 G814JI | |
| WebXPRT 4 / Overall | |
| Alienware m18 R2 | |
| Alienware m18 R1 | |
| Alienware m18 R1 AMD | |
| Ortalama Intel Core i9-14900HX, NVIDIA GeForce RTX 4090 Laptop GPU (246 - 309, n=8) | |
| MSI Titan 18 HX A14VIG | |
| Asus ROG Strix G18 G814JI | |
| Asus ROG Strix G18 G814JI | |
| Mozilla Kraken 1.1 / Total | |
| Asus ROG Strix G18 G814JI | |
| Asus ROG Strix G18 G814JI | |
| Alienware m18 R1 AMD | |
| Alienware m18 R1 | |
| Acer Predator Helios 18 N23Q2 | |
| Ortalama Intel Core i9-14900HX, NVIDIA GeForce RTX 4090 Laptop GPU (428 - 535, n=11) | |
| MSI Titan 18 HX A14VIG | |
| Alienware m18 R2 | |
* ... daha küçük daha iyidir
| PCMark 10 Score | 9234 puan | |
Yardım | ||
| AIDA64 / Memory Copy | |
| Alienware m18 R1 | |
| Alienware m18 R2 | |
| Acer Predator Helios 18 N23Q2 | |
| Ortalama Intel Core i9-14900HX (38028 - 83392, n=36) | |
| Asus ROG Strix G18 G814JI | |
| MSI Titan 18 HX A14VIG | |
| Alienware m18 R1 AMD | |
| AIDA64 / Memory Read | |
| Alienware m18 R1 | |
| Acer Predator Helios 18 N23Q2 | |
| Alienware m18 R2 | |
| Ortalama Intel Core i9-14900HX (43306 - 87568, n=36) | |
| Asus ROG Strix G18 G814JI | |
| Alienware m18 R1 AMD | |
| MSI Titan 18 HX A14VIG | |
| AIDA64 / Memory Write | |
| Alienware m18 R1 | |
| Alienware m18 R2 | |
| Acer Predator Helios 18 N23Q2 | |
| Ortalama Intel Core i9-14900HX (37146 - 80589, n=36) | |
| Alienware m18 R1 AMD | |
| Asus ROG Strix G18 G814JI | |
| MSI Titan 18 HX A14VIG | |
| AIDA64 / Memory Latency | |
| MSI Titan 18 HX A14VIG | |
| Alienware m18 R1 AMD | |
| Alienware m18 R2 | |
| Ortalama Intel Core i9-14900HX (76.1 - 105, n=36) | |
| Asus ROG Strix G18 G814JI | |
| Acer Predator Helios 18 N23Q2 | |
| Alienware m18 R1 | |
* ... daha küçük daha iyidir
DPC Gecikme Süresi
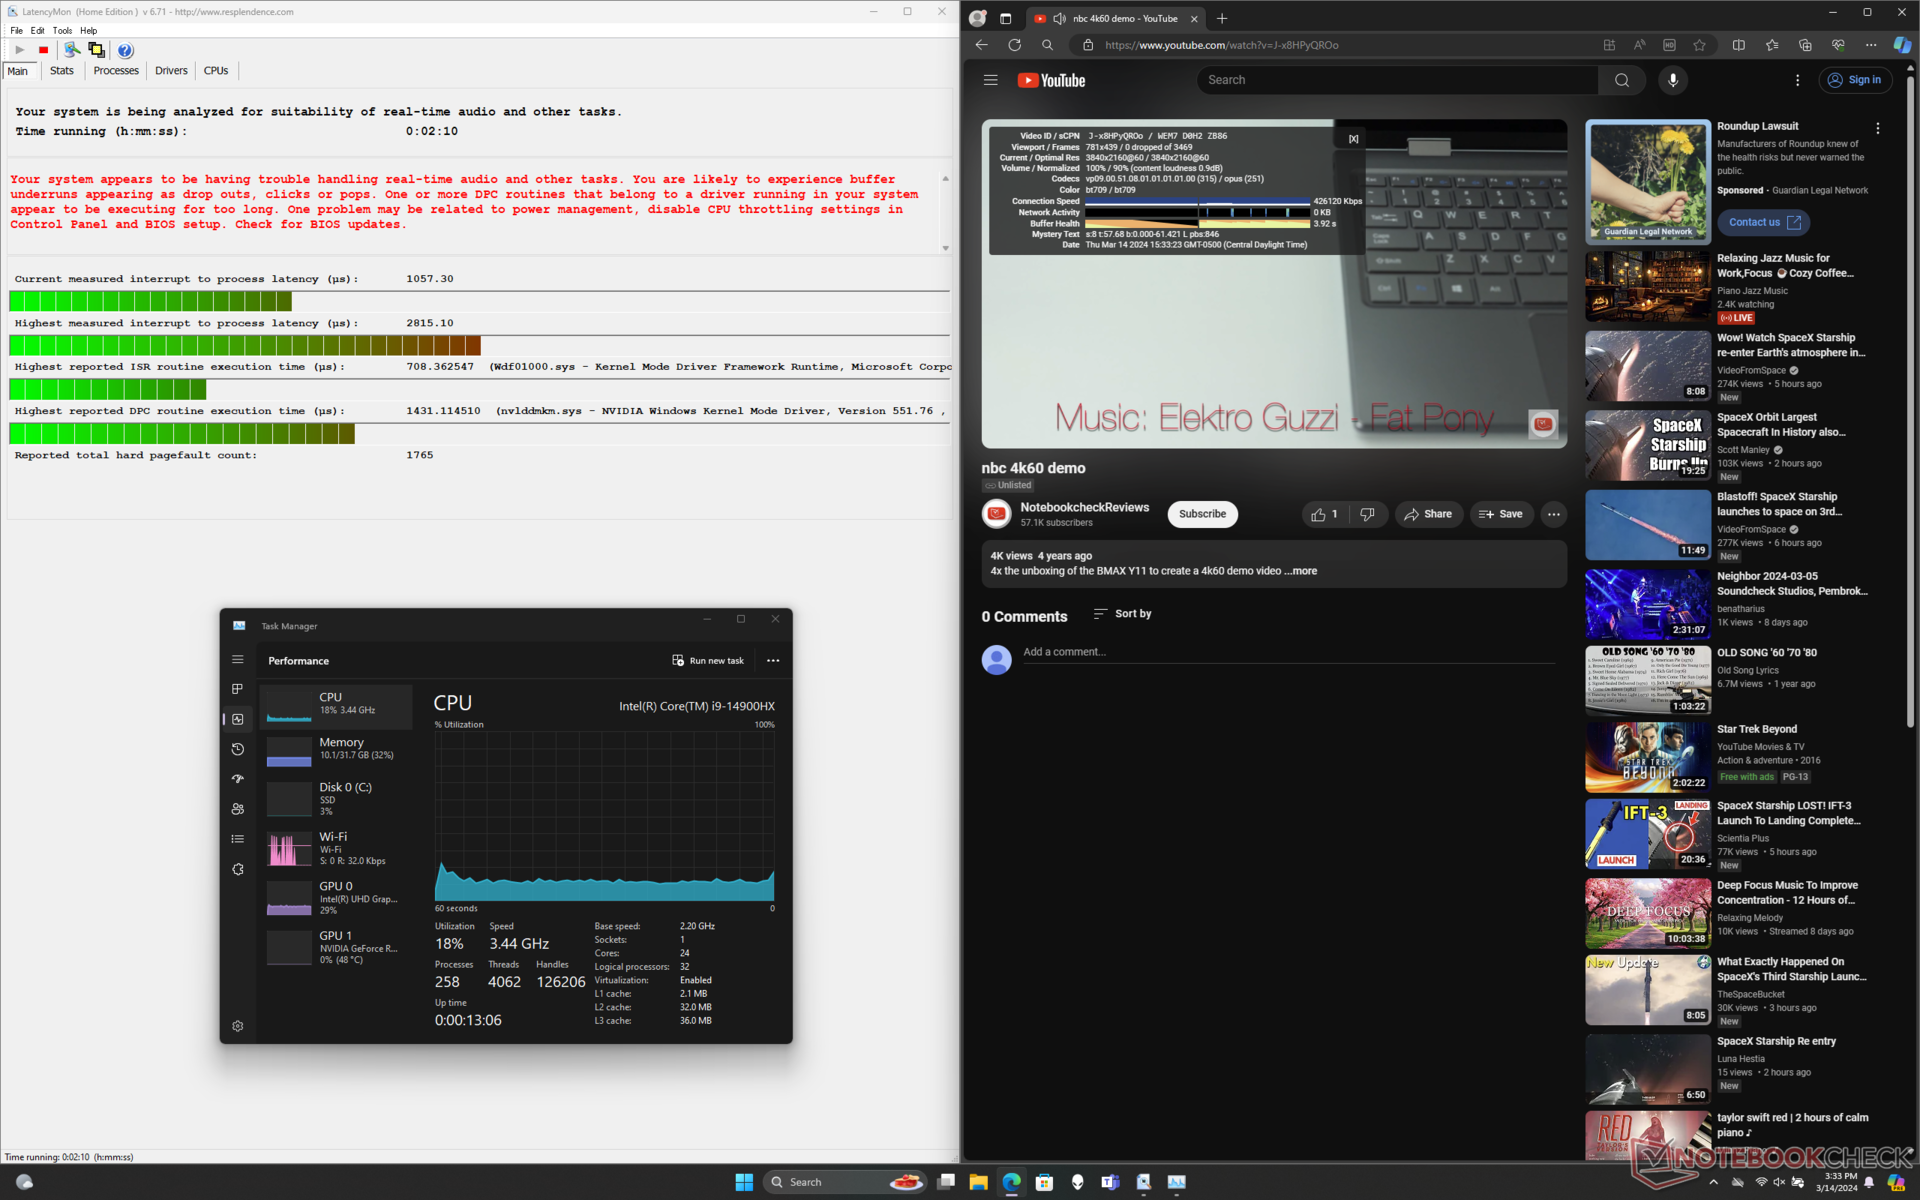
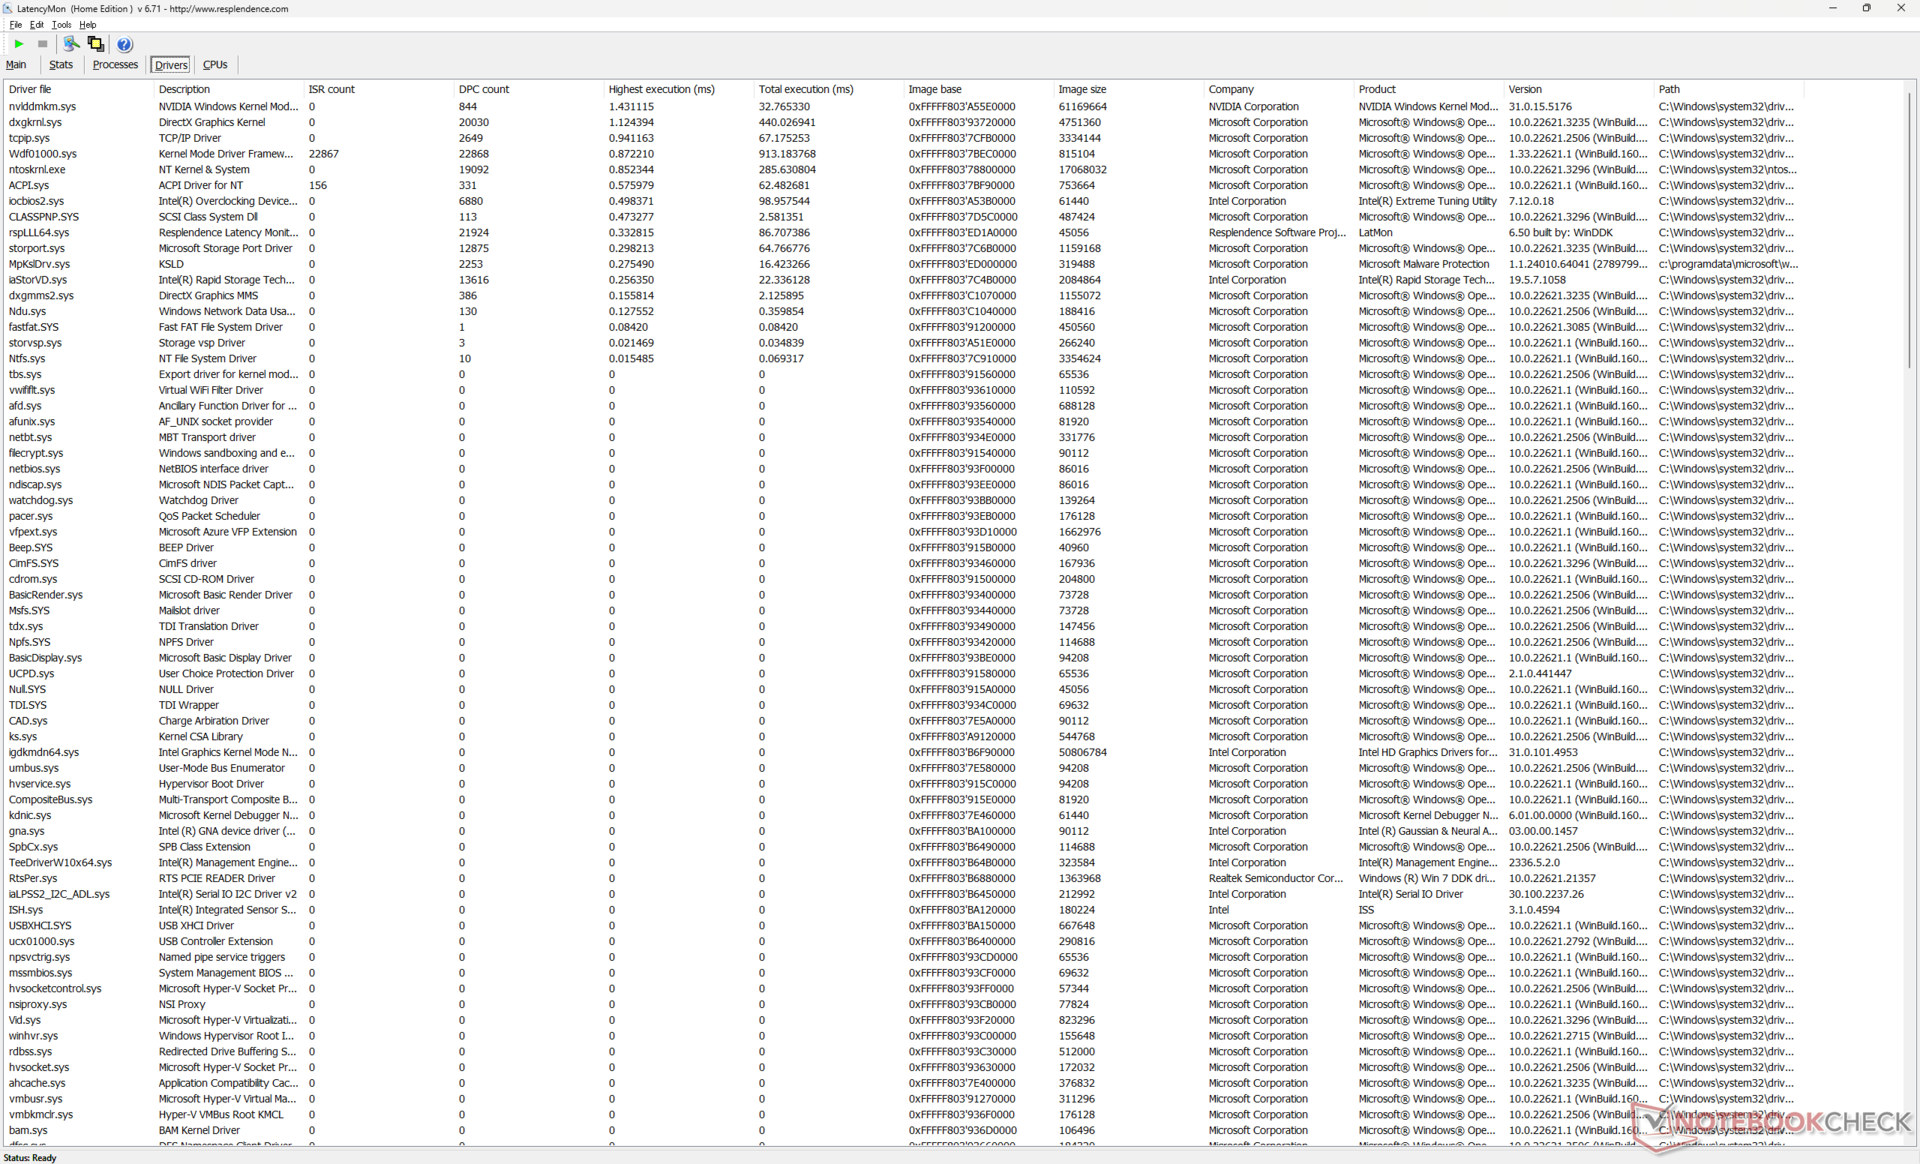
| DPC Latencies / LatencyMon - interrupt to process latency (max), Web, Youtube, Prime95 | |
| Acer Predator Helios 18 N23Q2 | |
| Alienware m18 R2 | |
| Alienware m18 R1 | |
| MSI Titan 18 HX A14VIG | |
| Alienware m18 R1 AMD | |
| Asus ROG Strix G18 G814JI | |
* ... daha küçük daha iyidir
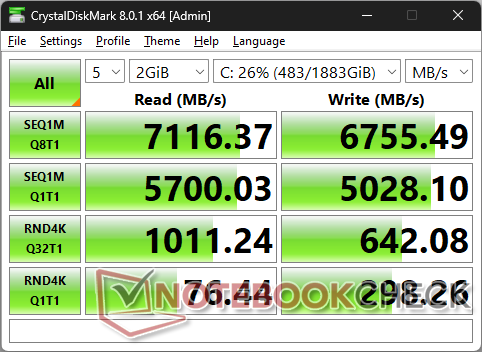
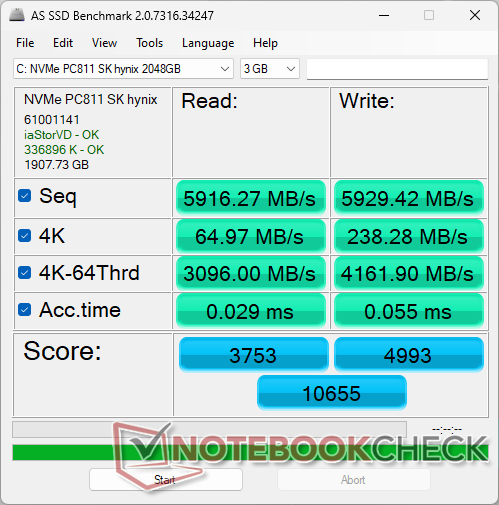
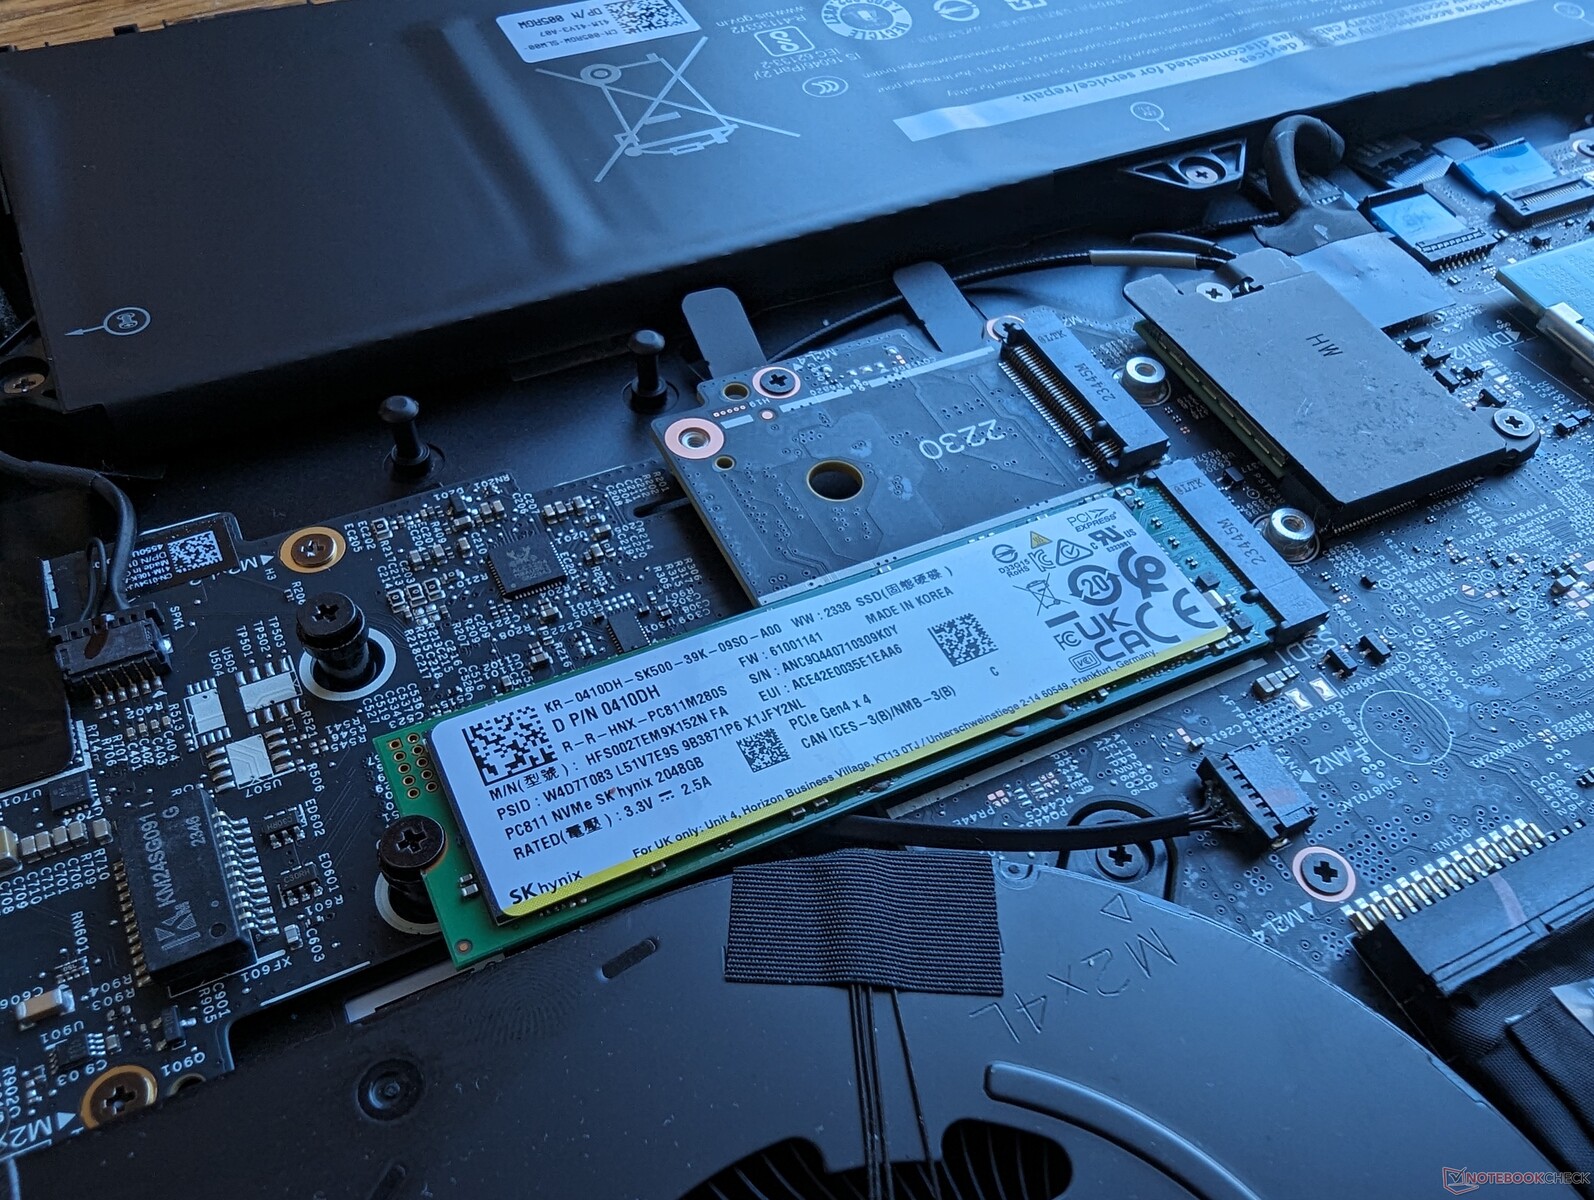
Depolama Cihazları
Alienware, 2 TB ile birlikte gönderilen ilk ürünlerden biridir SK Hynix PC811 PCIe4 x4 NVMe SSD. PC801 serisi ile karşılaştırıldığında PC811 serisi, genel olarak daha yoğun bir depolama kapasitesi ve gelişmiş güç verimliliği için 4D NAND yerine 8D NAND flash içermektedir. Sürücü, tekil PCIe4 x4 SSD'ler için performans tavanı olan ~7100 MB/sn'lik maksimum aktarım hızlarını zorlandığında sürdürebilmektedir.
Dell, toplam 8 TB depolama alanı için iki adet 4 TB sürücü ile yapılandırabilir.

| Drive Performance rating - Percent | |
| Alienware m18 R2 | |
| Alienware m18 R1 | |
| Acer Predator Helios 18 N23Q2 | |
| MSI Titan 18 HX A14VIG | |
| Alienware m18 R1 AMD | |
| Asus ROG Strix G18 G814JI | |
* ... daha küçük daha iyidir
Disk Throttling: DiskSpd Read Loop, Queue Depth 8
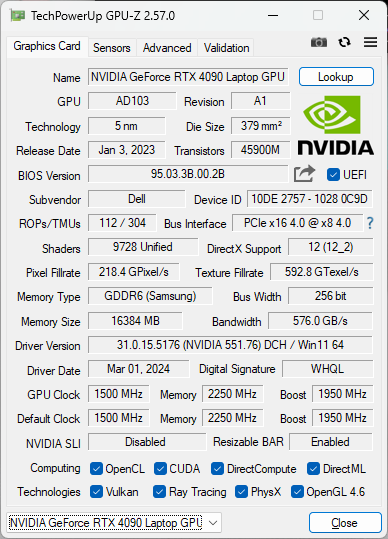
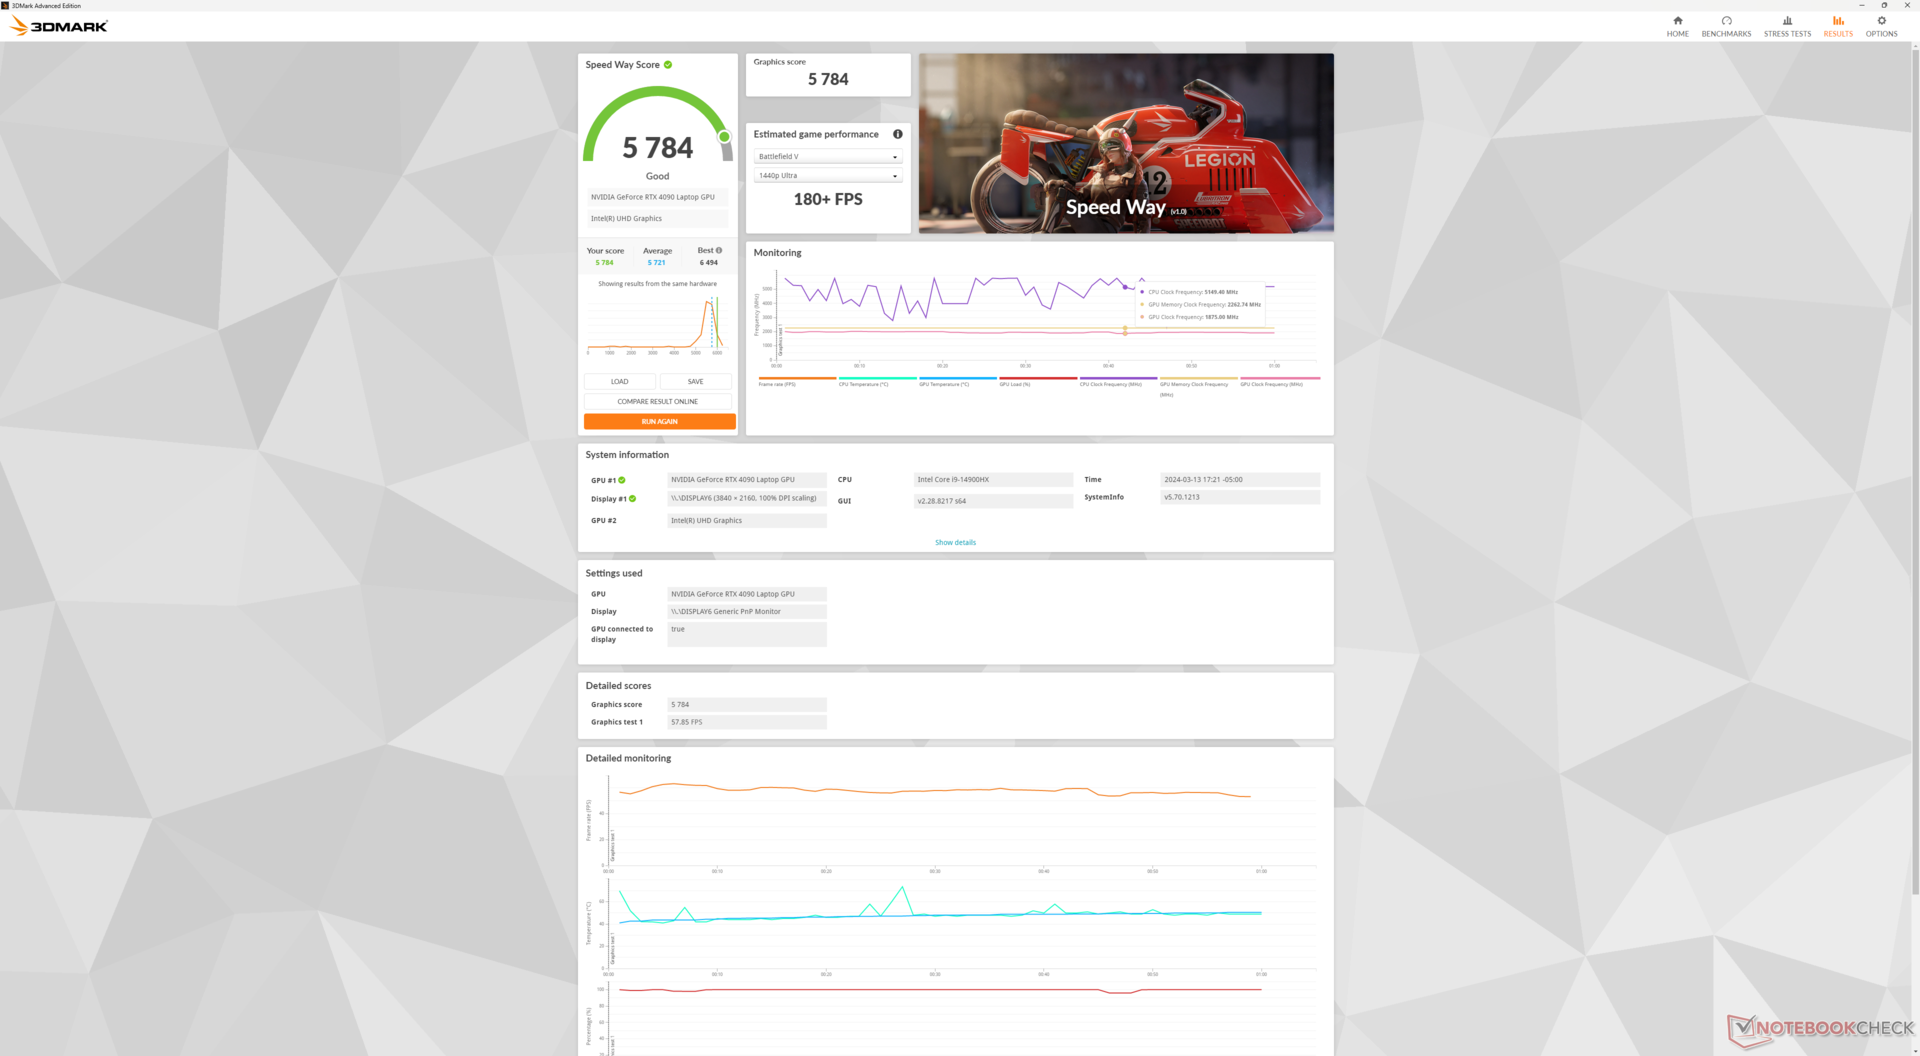
GPU Performansı - 175 W TGP Graphics
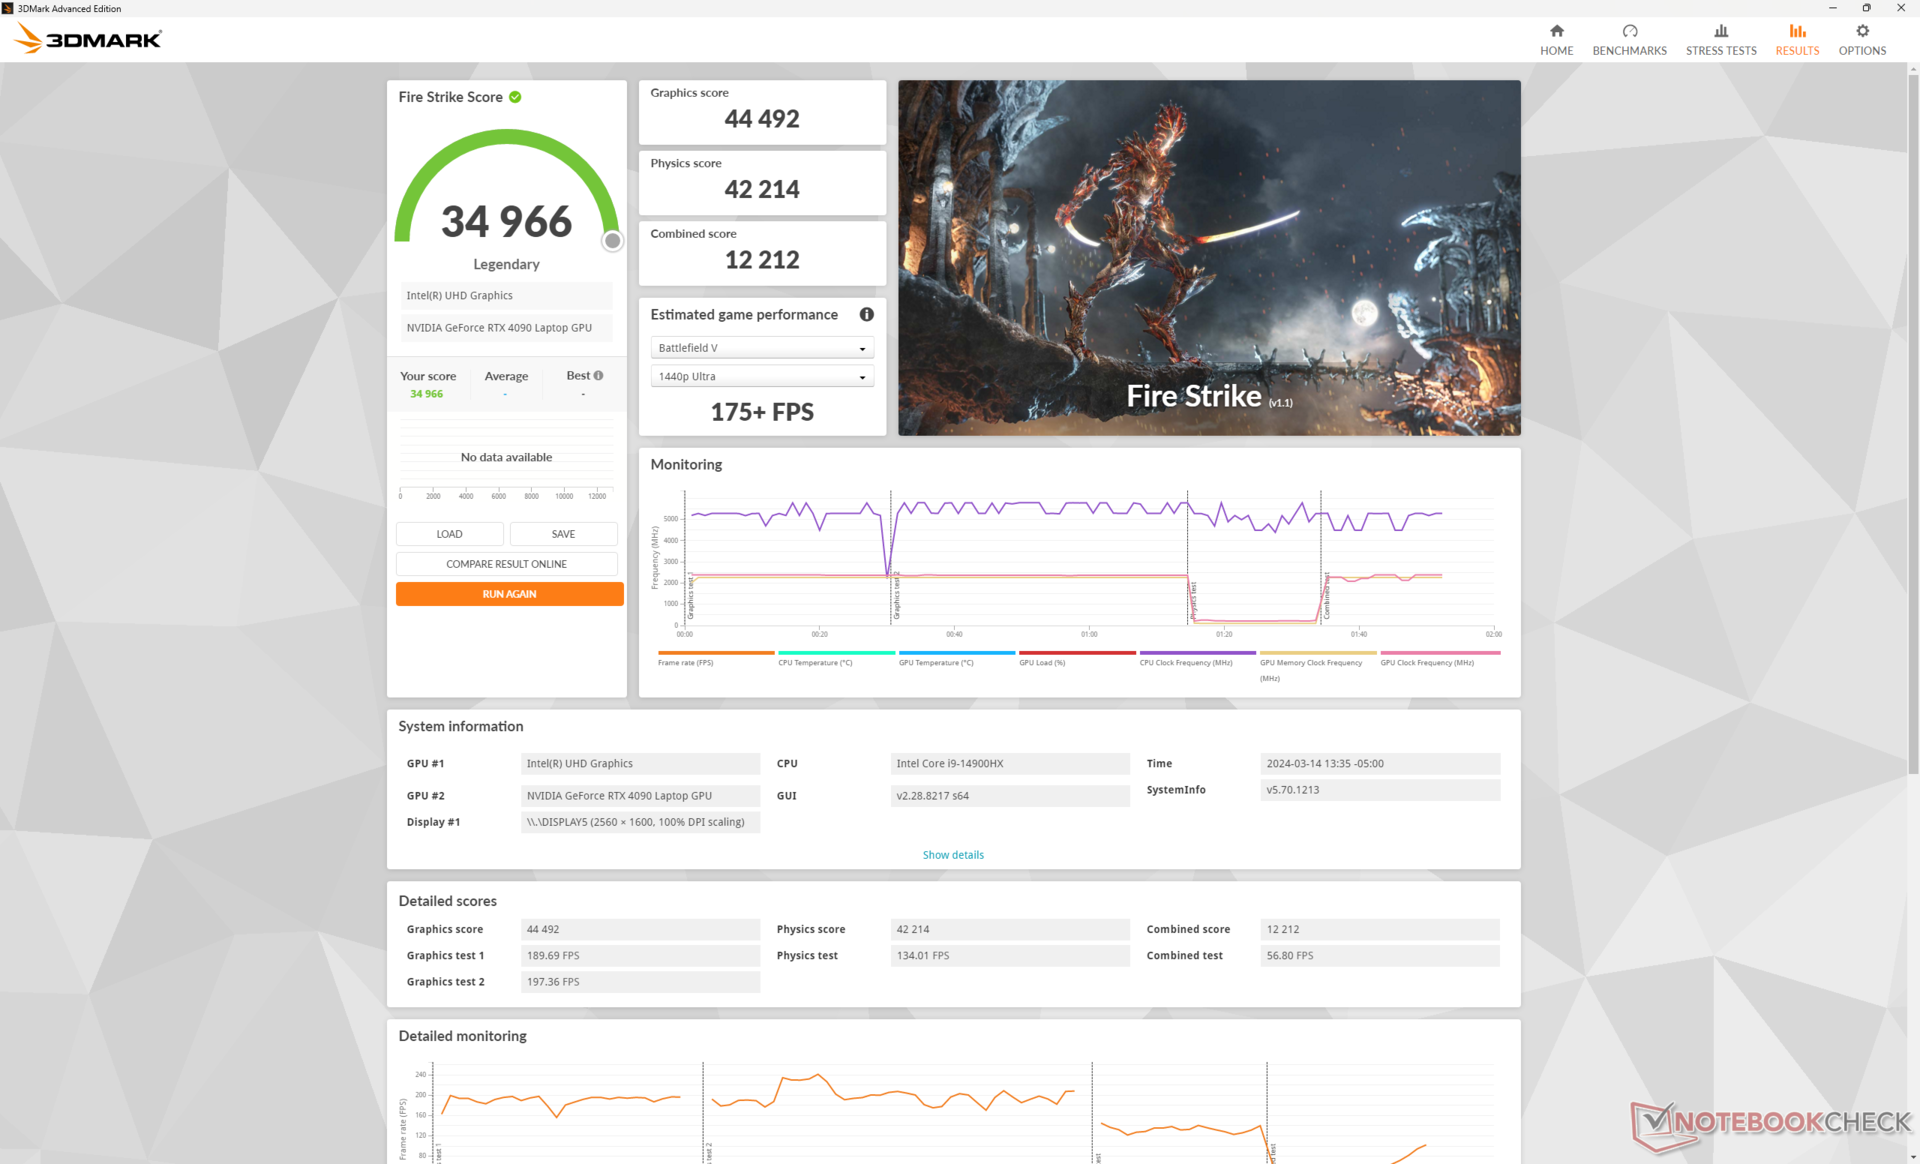
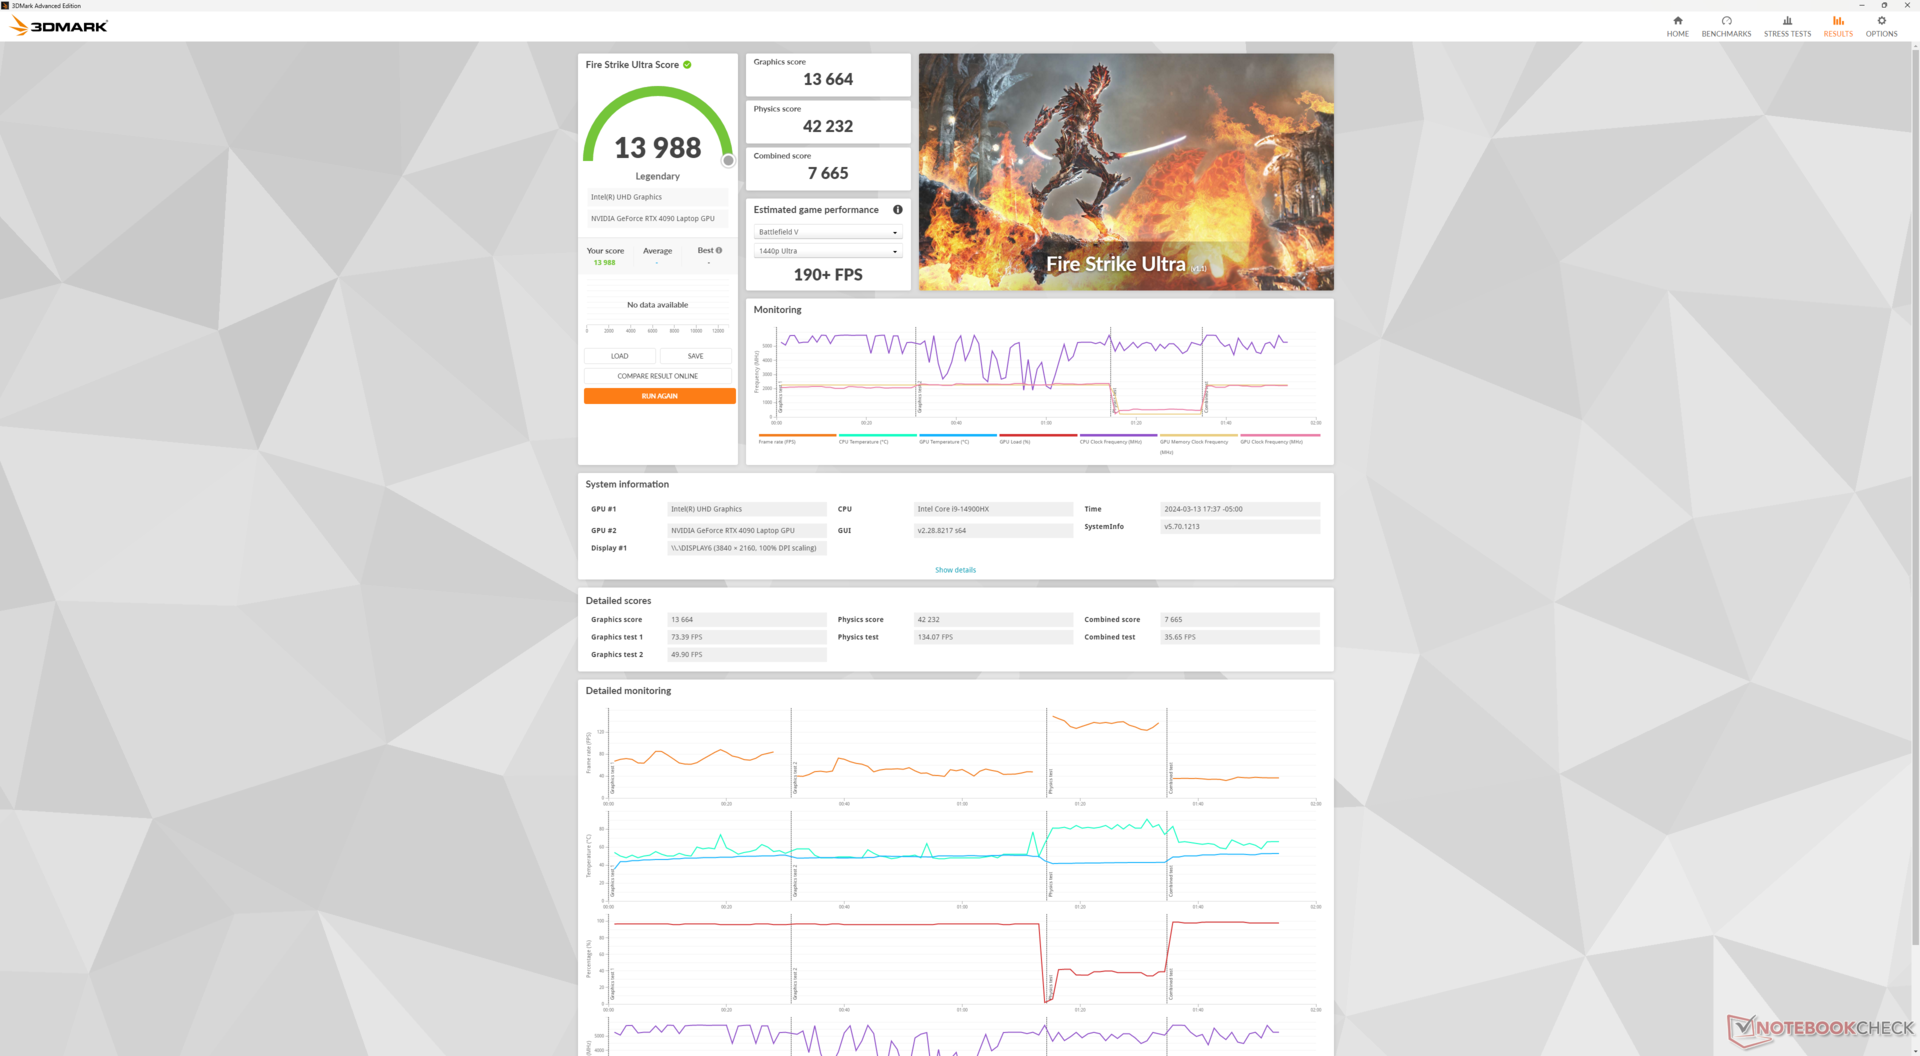
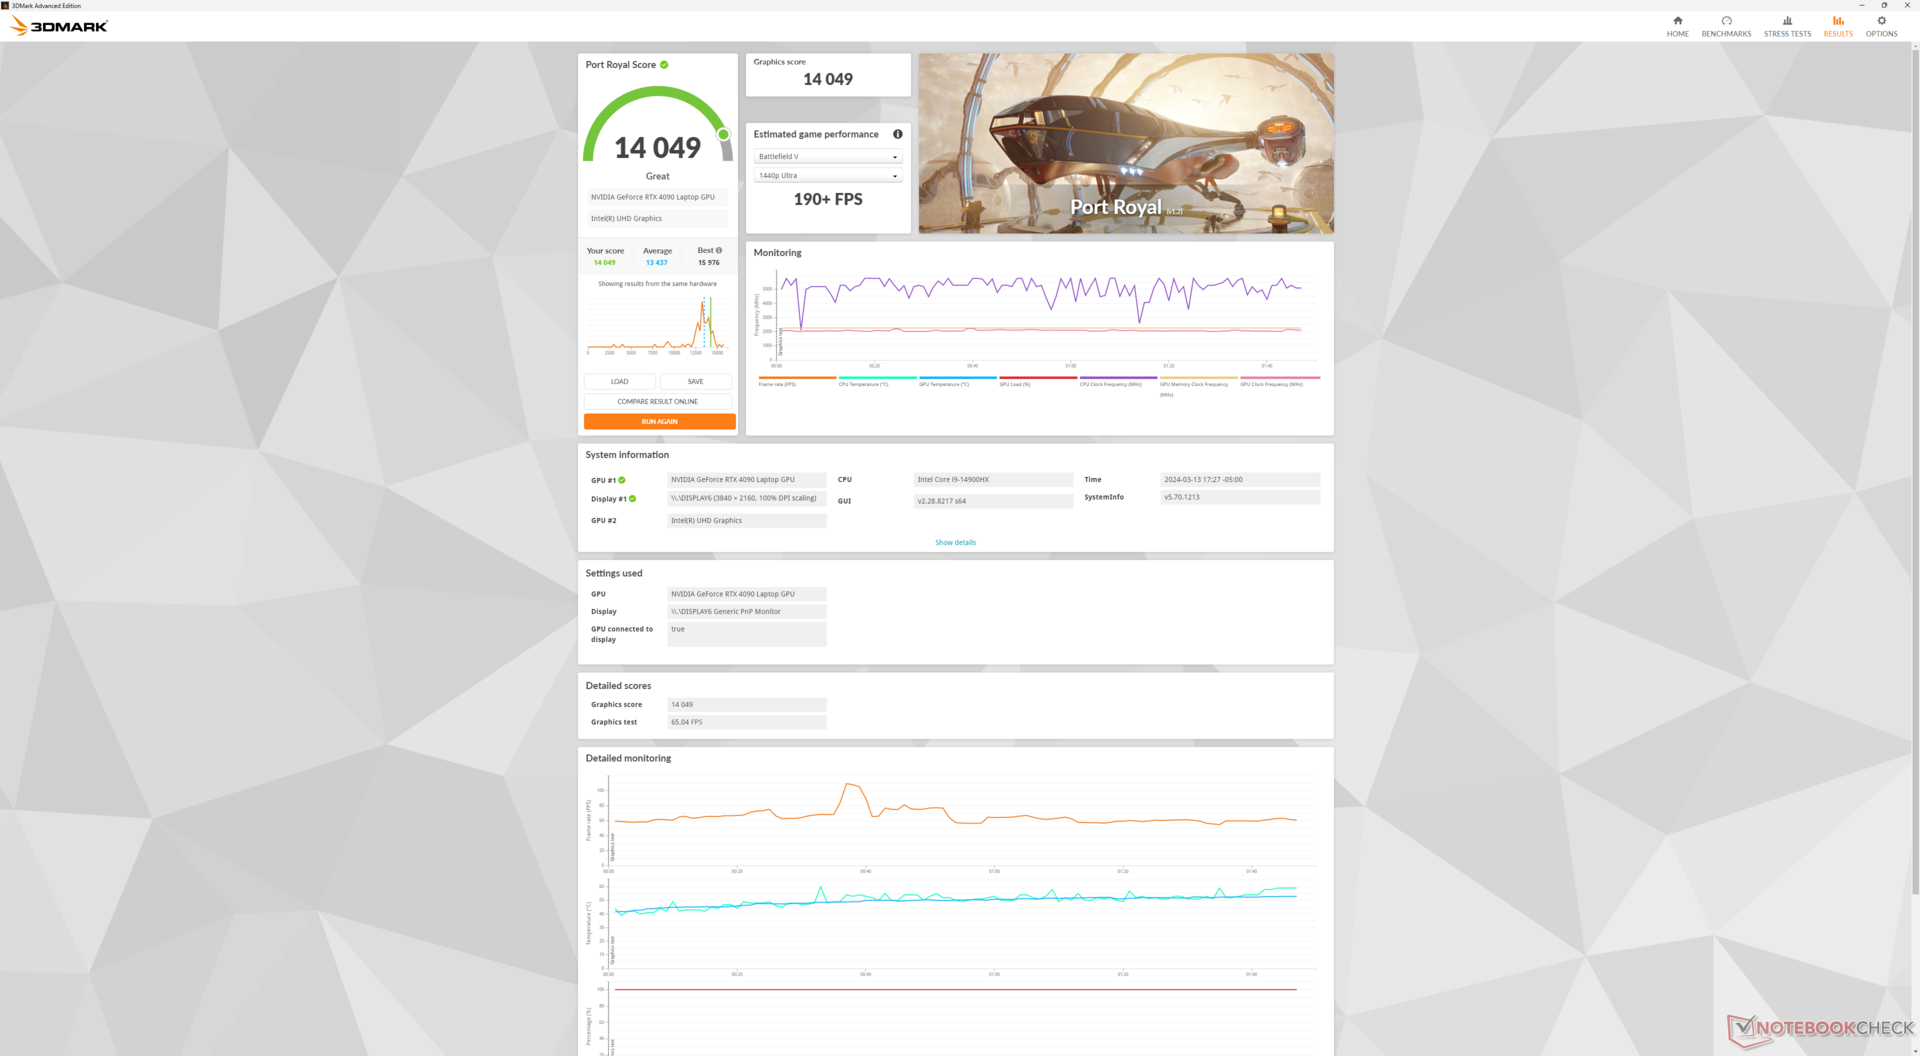
175 W GeForce RTX 4090, geçen yılki m18 R1 ile aynı oyun performansı için büyük bir değişiklik olmadan bu yıl geri döndü. Belki de en önemlisi, aşağıdaki Fire Strike sonuç tablomuzda gösterildiği gibi Overdrive, Performance ve Balanced profilleri arasında yine büyük performans farkları yok.
| Güç Profili | Grafik Puanı | Fizik Puanı | Birleşik Puan |
| Overdrive Modu | 13664 | 42232 | 7665 |
| Performans Modu | 13579 (-0%) | 42217 (-0%) | 7541 (-2%) |
| Dengeli Mod | 13449 (-1%) | 40978 (-3%) | 7592 (-1%) |
| Akü Gücü | 5116 (-63%) | 22857 (-46%) | 2102 (-73%) |
Aşağıya inmek RTX 40804070 veya 4060 yapılandırmasının grafik performansını sırasıyla yaklaşık yüzde 5 ila 10, yüzde 30 ila 35 ve yüzde 45 ila 55 oranında düşürmesi beklenmektedir. Dolayısıyla performanstaki düşüş en fazla RTX 4080 ve RTX 4070 arasında görülüyor.
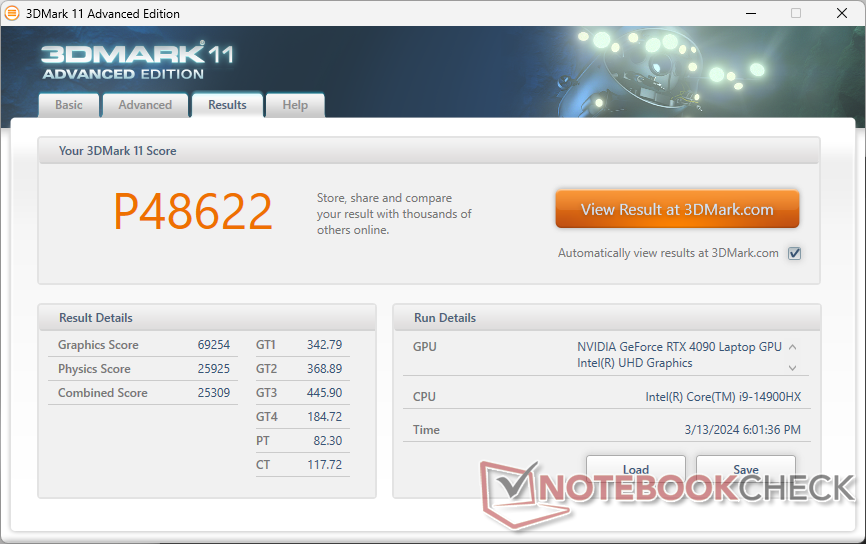
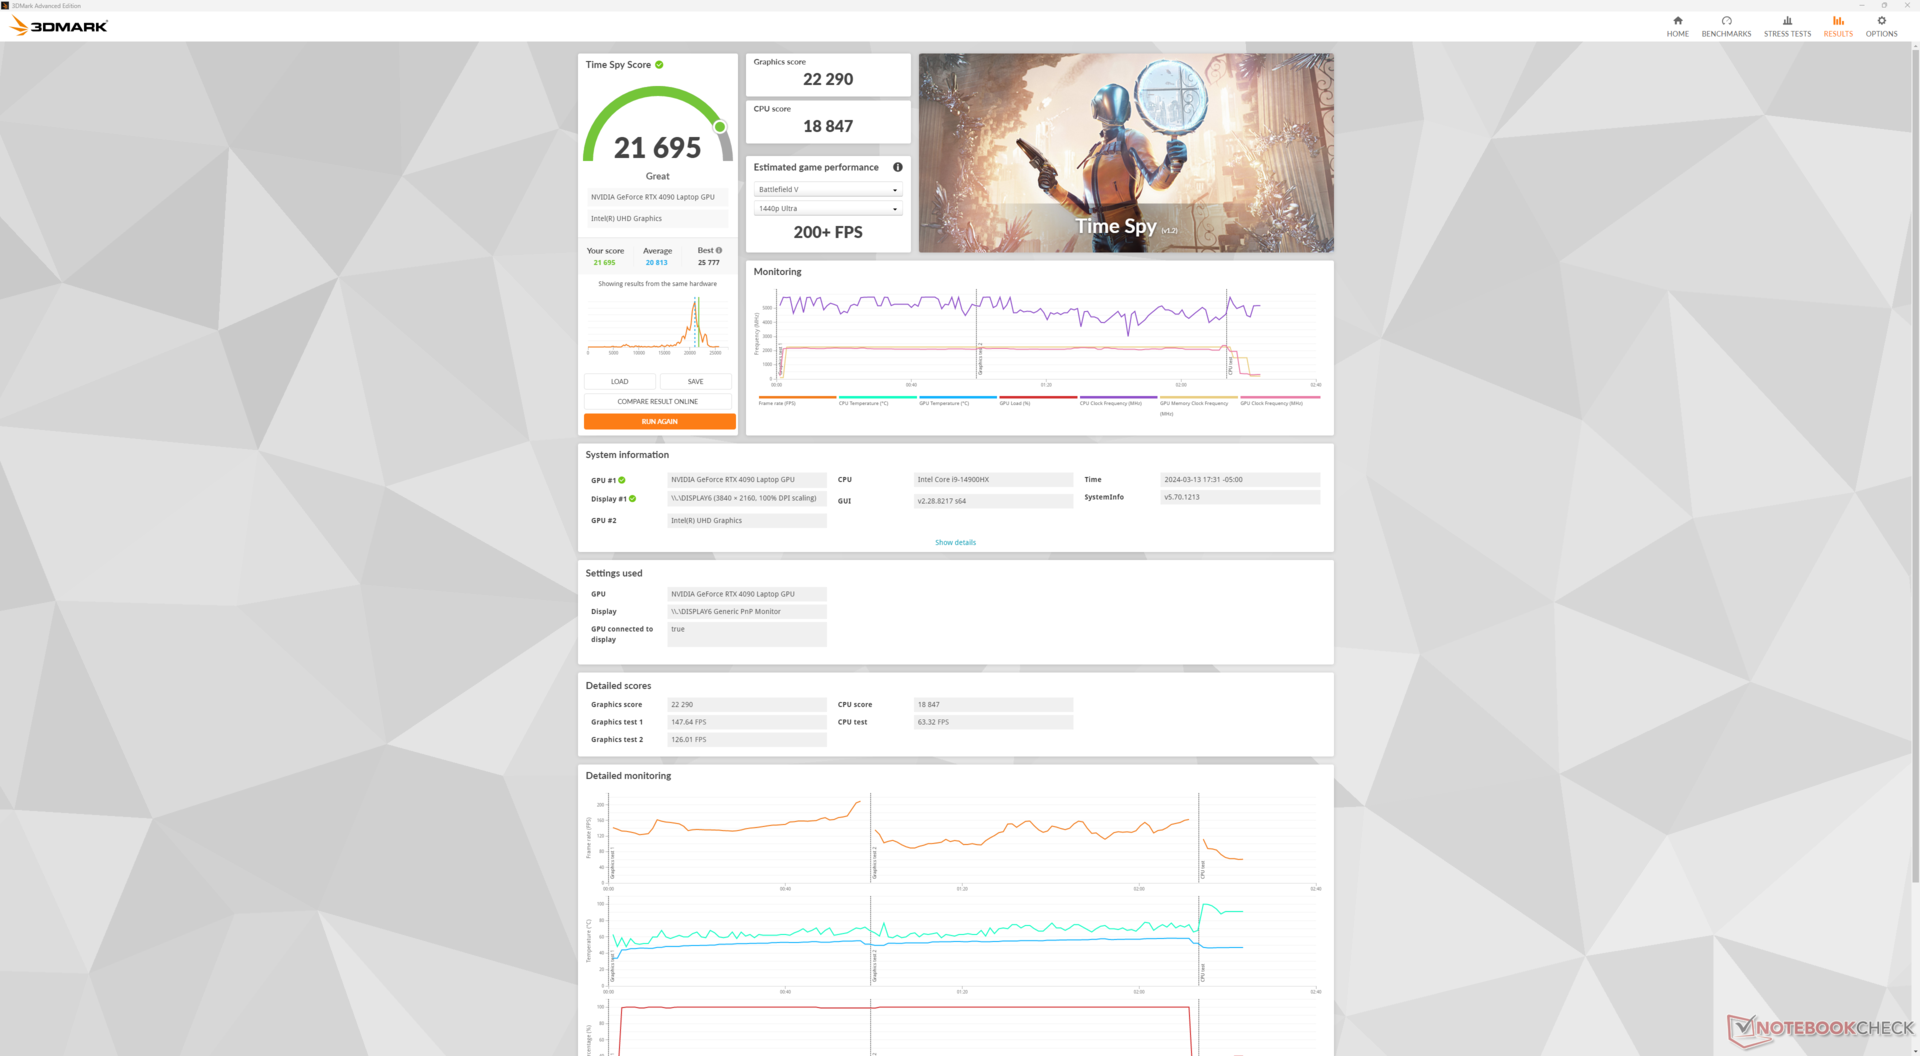
| 3DMark 11 Performance | 48622 puan | |
| 3DMark Fire Strike Score | 34966 puan | |
| 3DMark Time Spy Score | 21695 puan | |
Yardım | ||
* ... daha küçük daha iyidir
Oyun Performansı
CPU değişimine rağmen oyun performansı m18 R1 ile aynı kalıyor. RTX 4090, 60 FPS'nin üzerindeki kare hızlarını hedeflerken 1600p çözünürlüklü ekranla çok iyi eşleşiyor.
| Performance rating - Percent | |
| Alienware m18 R1 | |
| Alienware m18 R2 | |
| MSI Titan 18 HX A14VIG | |
| Acer Predator Helios 18 N23Q2 | |
| Alienware m18 R1 AMD | |
| Asus ROG Strix G18 G814JI | |
| The Witcher 3 - 1920x1080 Ultra Graphics & Postprocessing (HBAO+) | |
| Alienware m18 R1 | |
| MSI Titan 18 HX A14VIG | |
| Alienware m18 R2 | |
| Acer Predator Helios 18 N23Q2 | |
| Alienware m18 R1 AMD | |
| Asus ROG Strix G18 G814JI | |
| GTA V - 1920x1080 Highest AA:4xMSAA + FX AF:16x | |
| Acer Predator Helios 18 N23Q2 | |
| Alienware m18 R1 | |
| MSI Titan 18 HX A14VIG | |
| Alienware m18 R2 | |
| Asus ROG Strix G18 G814JI | |
| Alienware m18 R1 AMD | |
| Final Fantasy XV Benchmark - 1920x1080 High Quality | |
| Alienware m18 R1 | |
| Alienware m18 R2 | |
| MSI Titan 18 HX A14VIG | |
| Acer Predator Helios 18 N23Q2 | |
| Alienware m18 R1 AMD | |
| Asus ROG Strix G18 G814JI | |
| Strange Brigade - 1920x1080 ultra AA:ultra AF:16 | |
| MSI Titan 18 HX A14VIG | |
| Alienware m18 R1 | |
| Alienware m18 R2 | |
| Alienware m18 R1 AMD | |
| Acer Predator Helios 18 N23Q2 | |
| Asus ROG Strix G18 G814JI | |
| Dota 2 Reborn - 1920x1080 ultra (3/3) best looking | |
| Alienware m18 R1 | |
| Acer Predator Helios 18 N23Q2 | |
| MSI Titan 18 HX A14VIG | |
| Alienware m18 R2 | |
| Asus ROG Strix G18 G814JI | |
| Alienware m18 R1 AMD | |
| X-Plane 11.11 - 1920x1080 high (fps_test=3) | |
| Alienware m18 R1 | |
| Alienware m18 R2 | |
| Acer Predator Helios 18 N23Q2 | |
| MSI Titan 18 HX A14VIG | |
| Asus ROG Strix G18 G814JI | |
| Alienware m18 R1 AMD | |
Witcher 3 FPS Chart
| düşük | orta | yüksek | ultra | QHD DLSS | QHD | 4K DLSS | 4K | |
|---|---|---|---|---|---|---|---|---|
| GTA V (2015) | 185.2 | 181.6 | 179.6 | 137 | 134.7 | 174.9 | ||
| The Witcher 3 (2015) | 585.5 | 525.8 | 405.6 | 205.7 | 157.7 | |||
| Dota 2 Reborn (2015) | 217 | 190.1 | 181.5 | 171.8 | 160.8 | |||
| Final Fantasy XV Benchmark (2018) | 229 | 199.2 | 193.2 | 160.1 | 93.8 | |||
| X-Plane 11.11 (2018) | 201 | 180.1 | 140.6 | 120.4 | ||||
| Far Cry 5 (2018) | 181 | 171 | 160 | 154 | 112 | |||
| Strange Brigade (2018) | 471 | 387 | 383 | 369 | 309 | 160.2 | ||
| Tiny Tina's Wonderlands (2022) | 348.6 | 285.3 | 227.2 | 187.5 | 132.8 | 71.2 | ||
| F1 22 (2022) | 305 | 295 | 276 | 135.1 | 91.4 | 45.4 | ||
| Baldur's Gate 3 (2023) | 246.9 | 222.5 | 206.7 | 202 | 151.6 | 81.7 | ||
| Cyberpunk 2077 (2023) | 149.3 | 148.7 | 142.9 | 133.9 | 94.1 | 43.4 | ||
| Assassin's Creed Mirage (2023) | 230 | 215 | 205 | 160 | 135 | 110 | 81 | |
| Alan Wake 2 (2023) | 124.6 | 121.4 | 116.9 | 83.1 | 62.3 | 45.2 | ||
| Call of Duty Modern Warfare 3 2023 (2023) | 276 | 255 | 220 | 205 | 160 | 113 | 106 | |
| Avatar Frontiers of Pandora (2023) | 162 | 150 | 131 | 103 | 70 | 63 | 36 | |
| Black Myth: Wukong (2024) | 55 | 62 | 42 | 25 | ||||
| Indiana Jones and the Great Circle (2024) | 121.1 | 95.6 | 60.9 | |||||
| Monster Hunter Wilds (2025) | 78.54 | 76.96 | 66.98 | 42.01 | ||||
| Assassin's Creed Shadows (2025) | 100 | 90 | 77 | 57 | 59 | 50 |
Emisyonlar
Sistem Gürültüsü
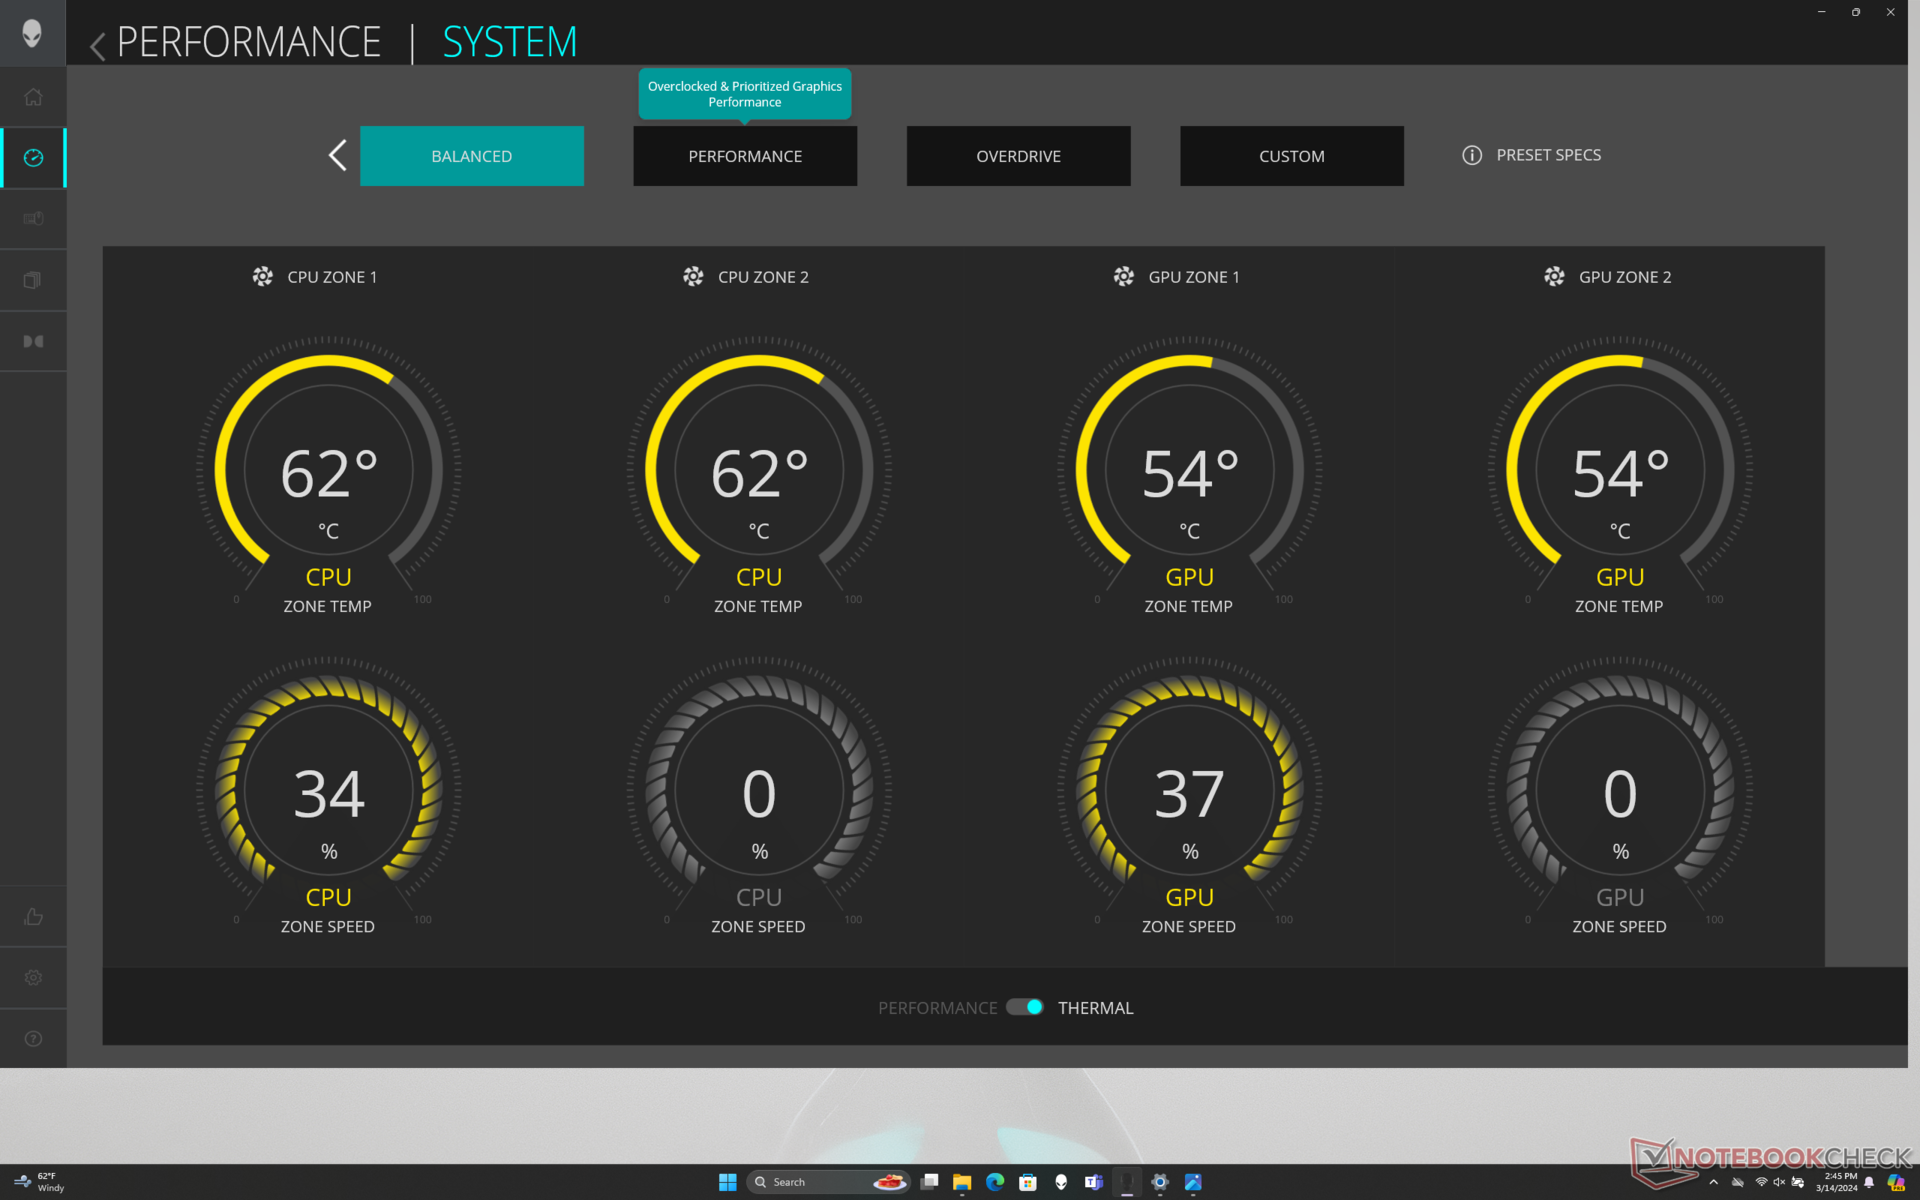
Fan gürültüsü davranışında önemli bir değişiklik yoktur. Akılda tutulması gereken en önemli şey, genel performans her üç mod arasında genellikle aynı olsa da, Dengeli moda kıyasla Performans ve Overdrive modlarında fan gürültüsünün biraz daha yüksek olmasıdır. Bu, önemli bir oyun performansından ödün vermek zorunda kalmadan daha sessiz bir deneyim için Dengeli veya Performans modlarında oynayabileceğiniz anlamına gelir. Overdrive modu bunun yerine hız aşırtma amaçları için ayrılmalıdır.
Ses yüksekliği
| Boşta |
| 23.8 / 26.1 / 31.5 dB |
| Çalışırken |
| 31.5 / 56.6 dB |
 | ||
30 dB sessiz 40 dB(A) duyulabilirlik 50 dB(A) gürültülü |
||
min: | ||
| Alienware m18 R2 GeForce RTX 4090 Laptop GPU, i9-14900HX, SK Hynix PC811 HFS002TEM9X152N | Alienware m18 R1 AMD Radeon RX 7900M, R9 7945HX, Kioxia XG8 KXG80ZNV1T02 | Alienware m18 R1 GeForce RTX 4090 Laptop GPU, i9-13980HX, SK hynix PC801 HFS001TEJ9X101N | MSI Titan 18 HX A14VIG GeForce RTX 4090 Laptop GPU, i9-14900HX, 2x Samsung PM9A1a MZVL22T0HDLB (RAID 0) | Asus ROG Strix G18 G814JI GeForce RTX 4070 Laptop GPU, i7-13650HX, Micron 2400 MTFDKBA1T0QFM | Acer Predator Helios 18 N23Q2 GeForce RTX 4080 Laptop GPU, i9-13900HX, Samsung PM9A1 MZVL22T0HBLB | |
|---|---|---|---|---|---|---|
| Noise | 1% | 5% | -3% | -1% | -3% | |
| kapalı / ortam * (dB) | 23.6 | 22.4 5% | 22.8 3% | 22.8 3% | 25 -6% | 23 3% |
| Idle Minimum * (dB) | 23.8 | 23 3% | 23 3% | 23.8 -0% | 26 -9% | 23 3% |
| Idle Average * (dB) | 26.1 | 23.4 10% | 23 12% | 23.8 9% | 28 -7% | 23 12% |
| Idle Maximum * (dB) | 31.5 | 33.5 -6% | 23 27% | 28 11% | 29 8% | 23 27% |
| Load Average * (dB) | 31.5 | 33.5 -6% | 35.6 -13% | 38 -21% | 41 -30% | 45.26 -44% |
| Witcher 3 ultra * (dB) | 52.1 | 53.6 -3% | 51.3 2% | 57.3 -10% | 44 16% | 59.82 -15% |
| Load Maximum * (dB) | 56.6 | 53.6 5% | 56.7 -0% | 62.8 -11% | 46 19% | 59.94 -6% |
* ... daha küçük daha iyidir
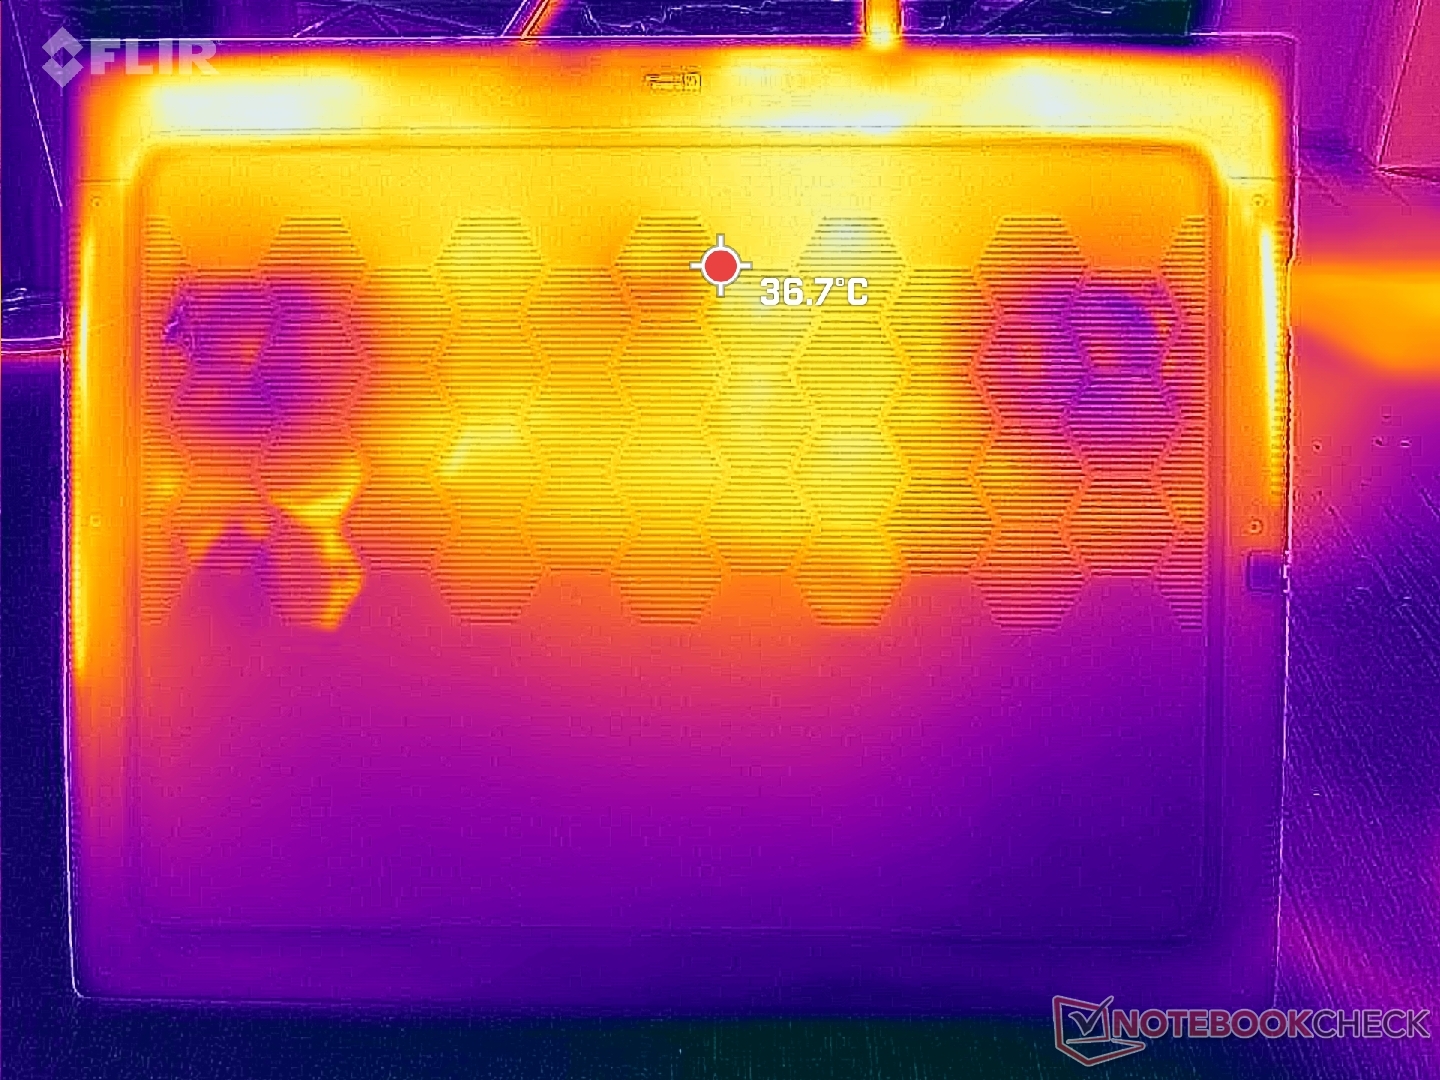
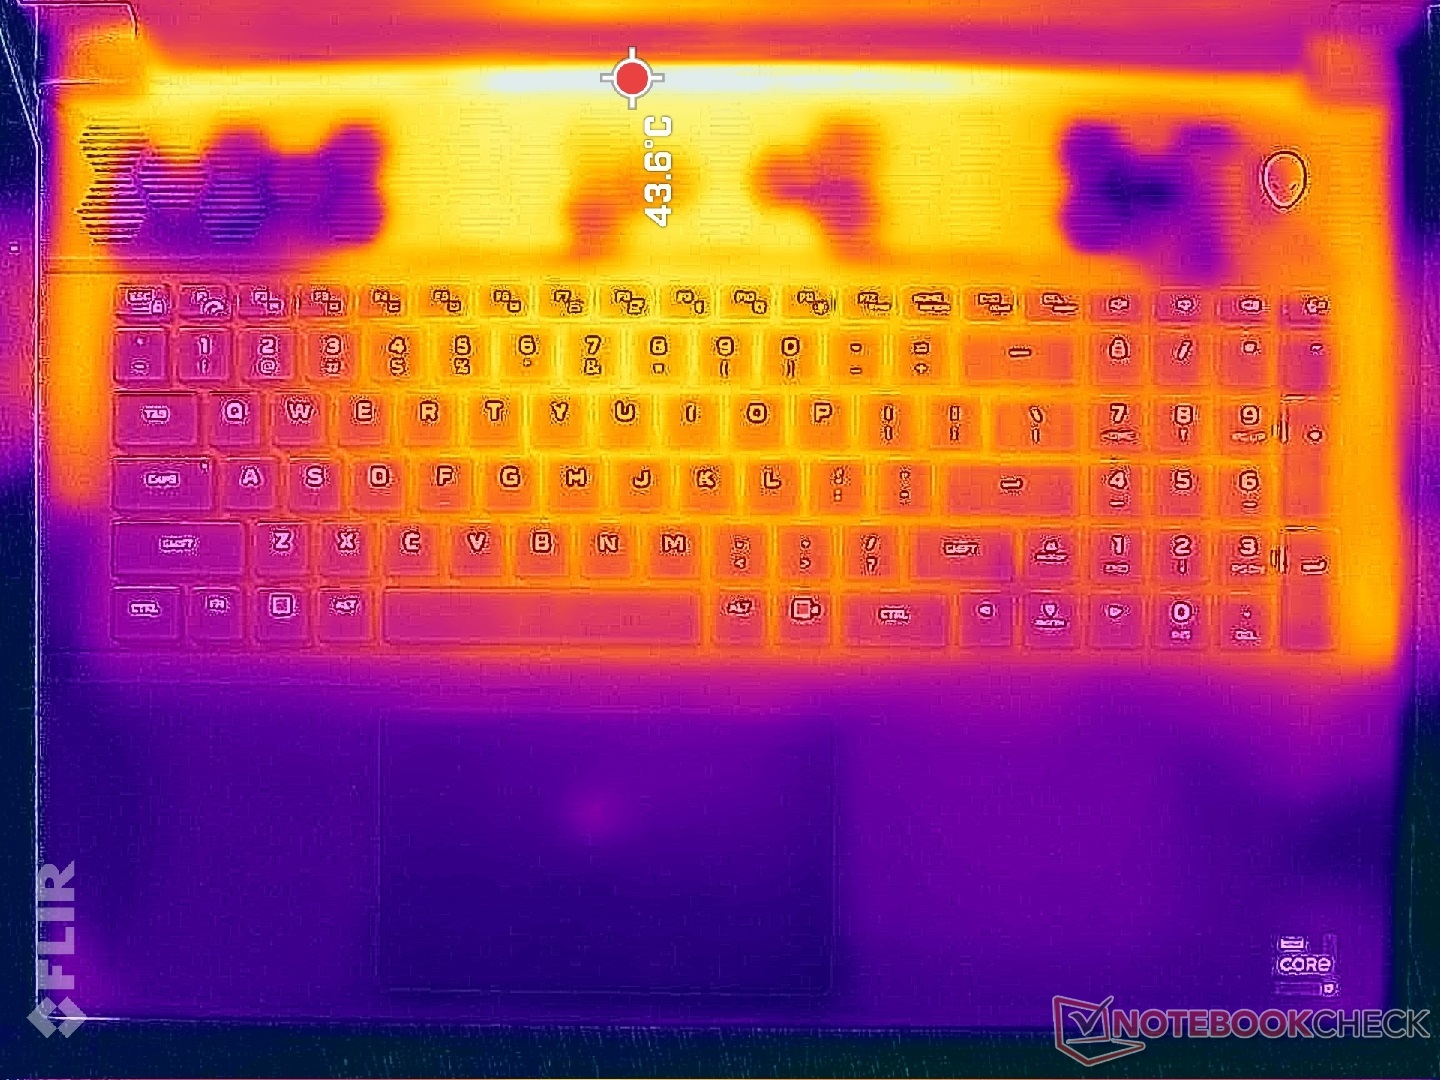
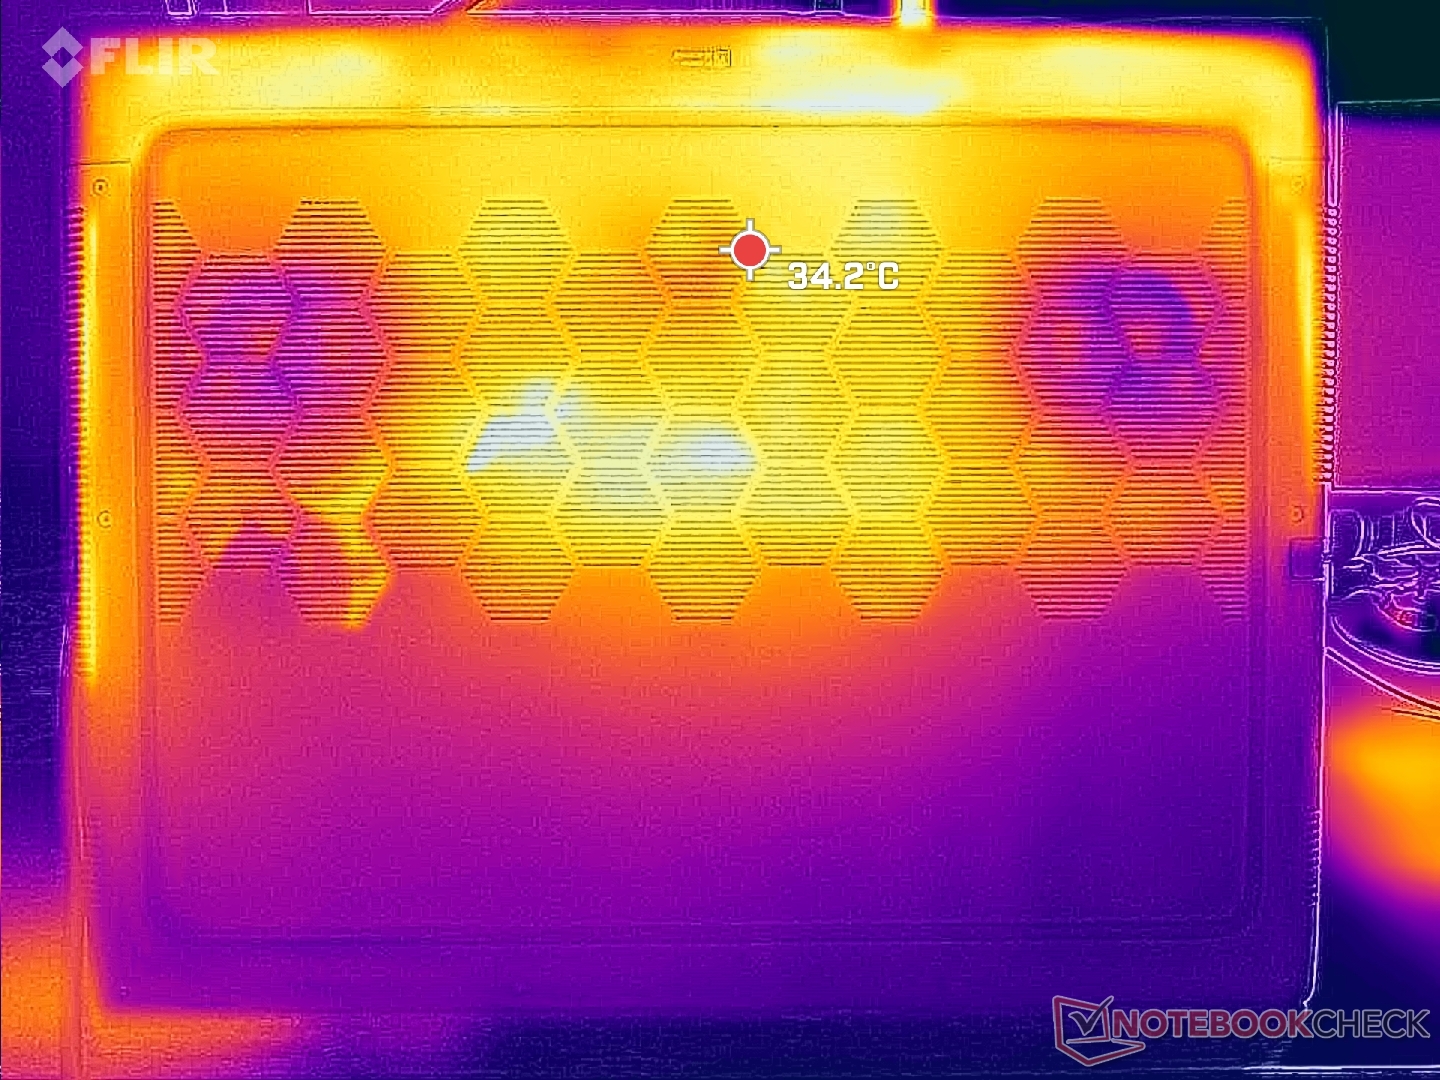
Sıcaklık
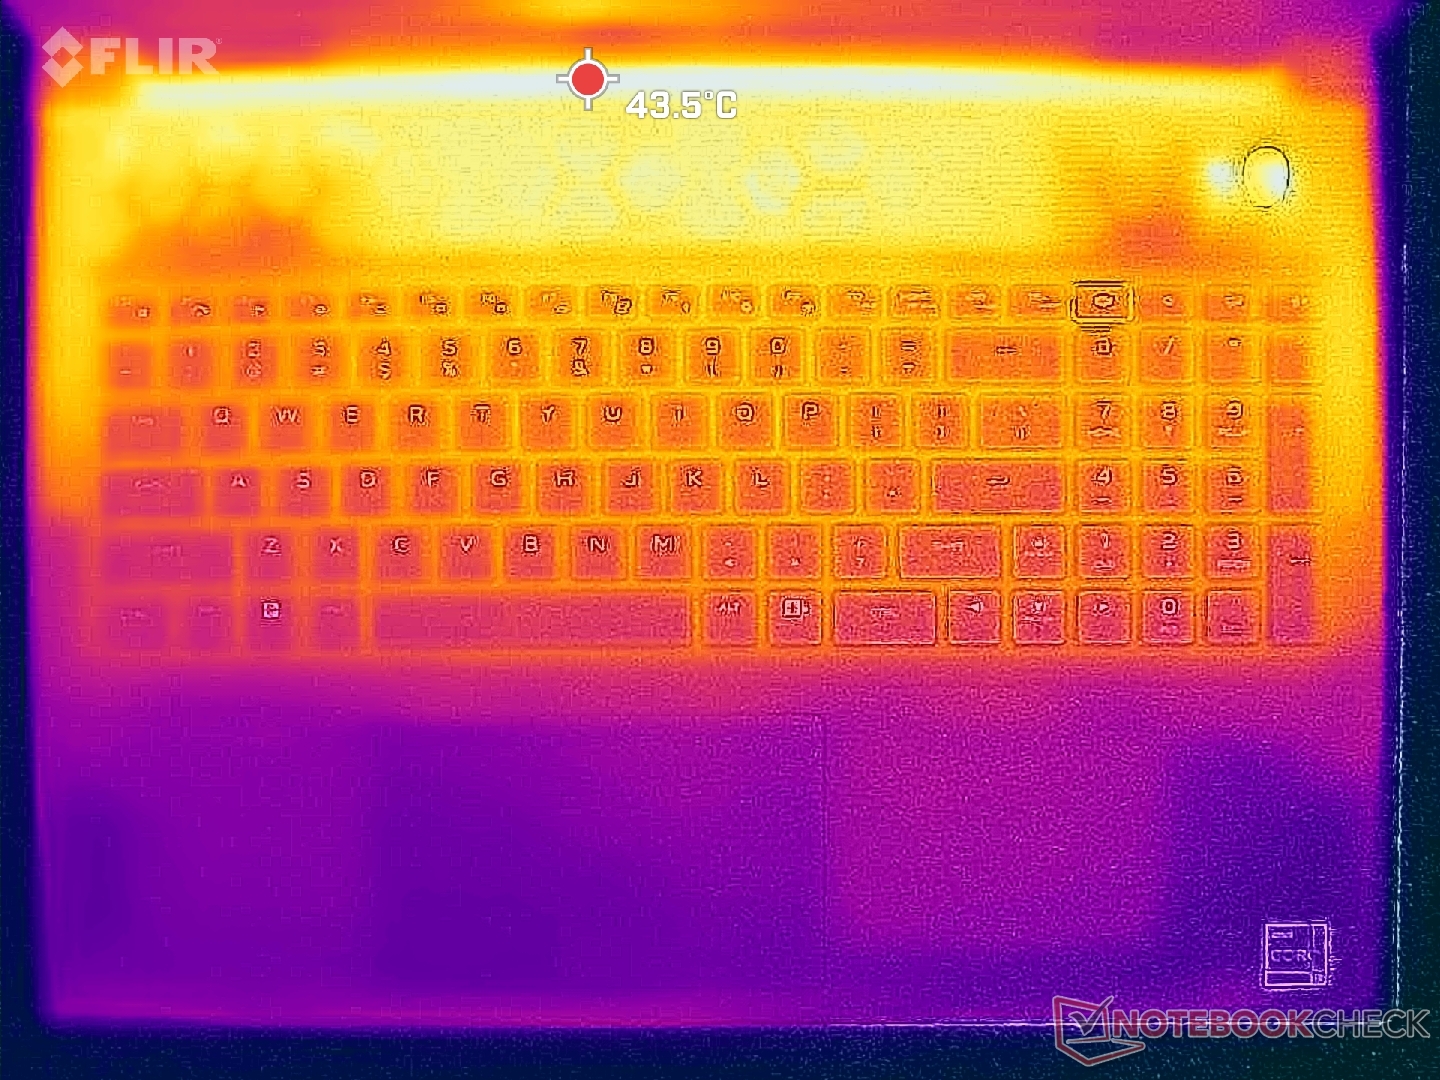
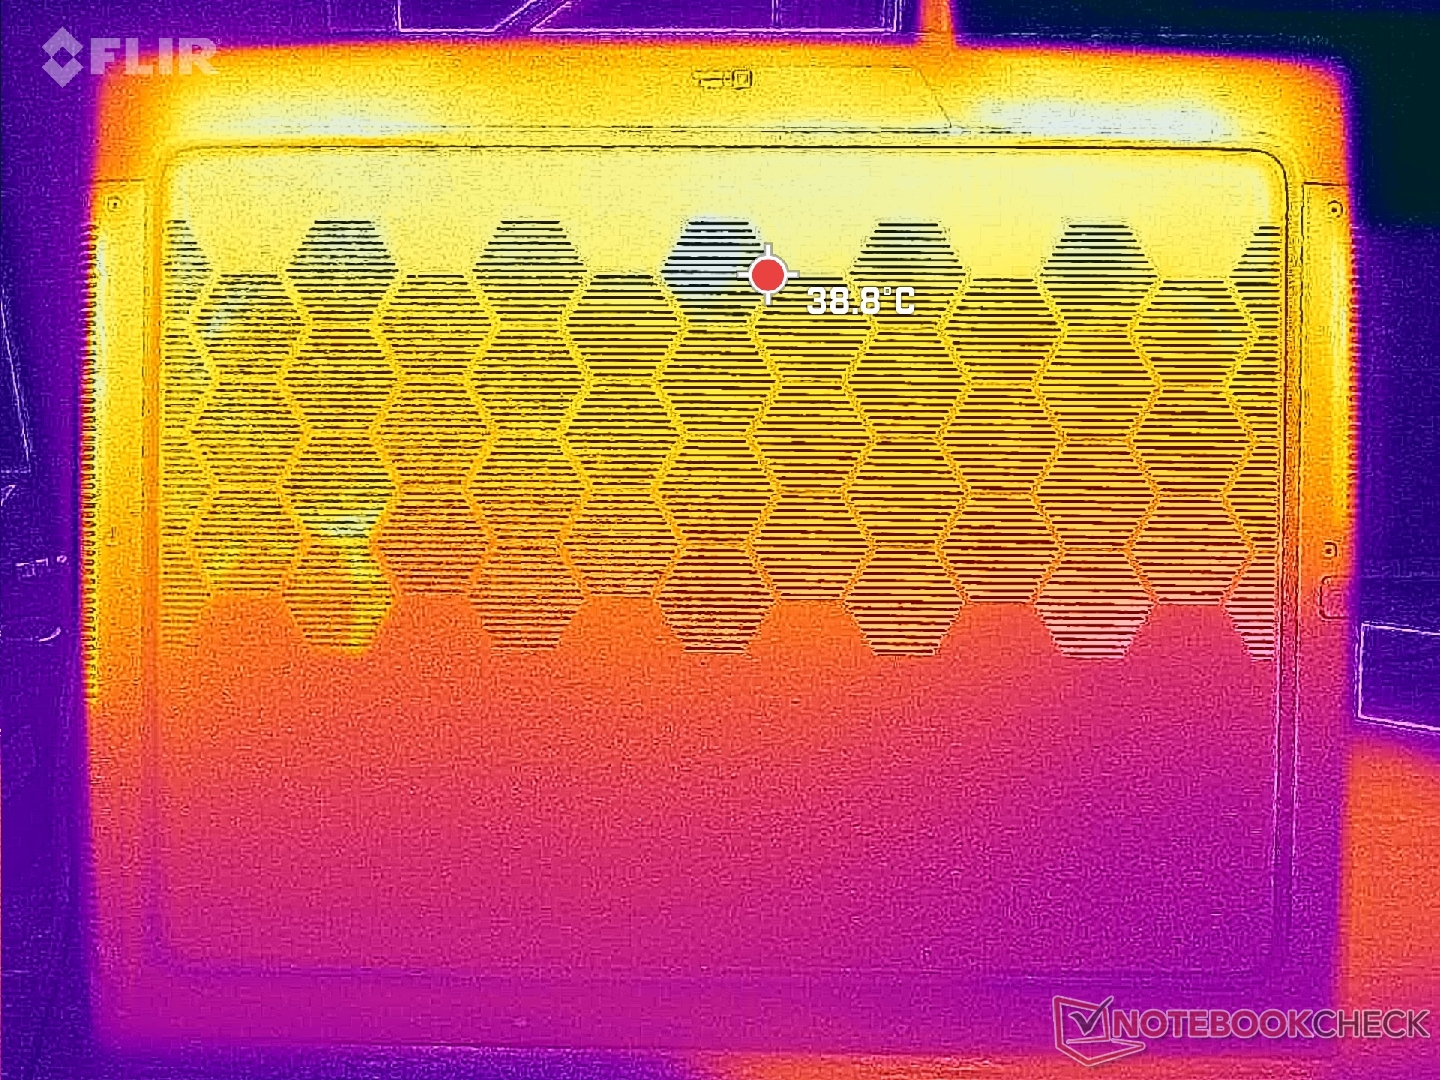
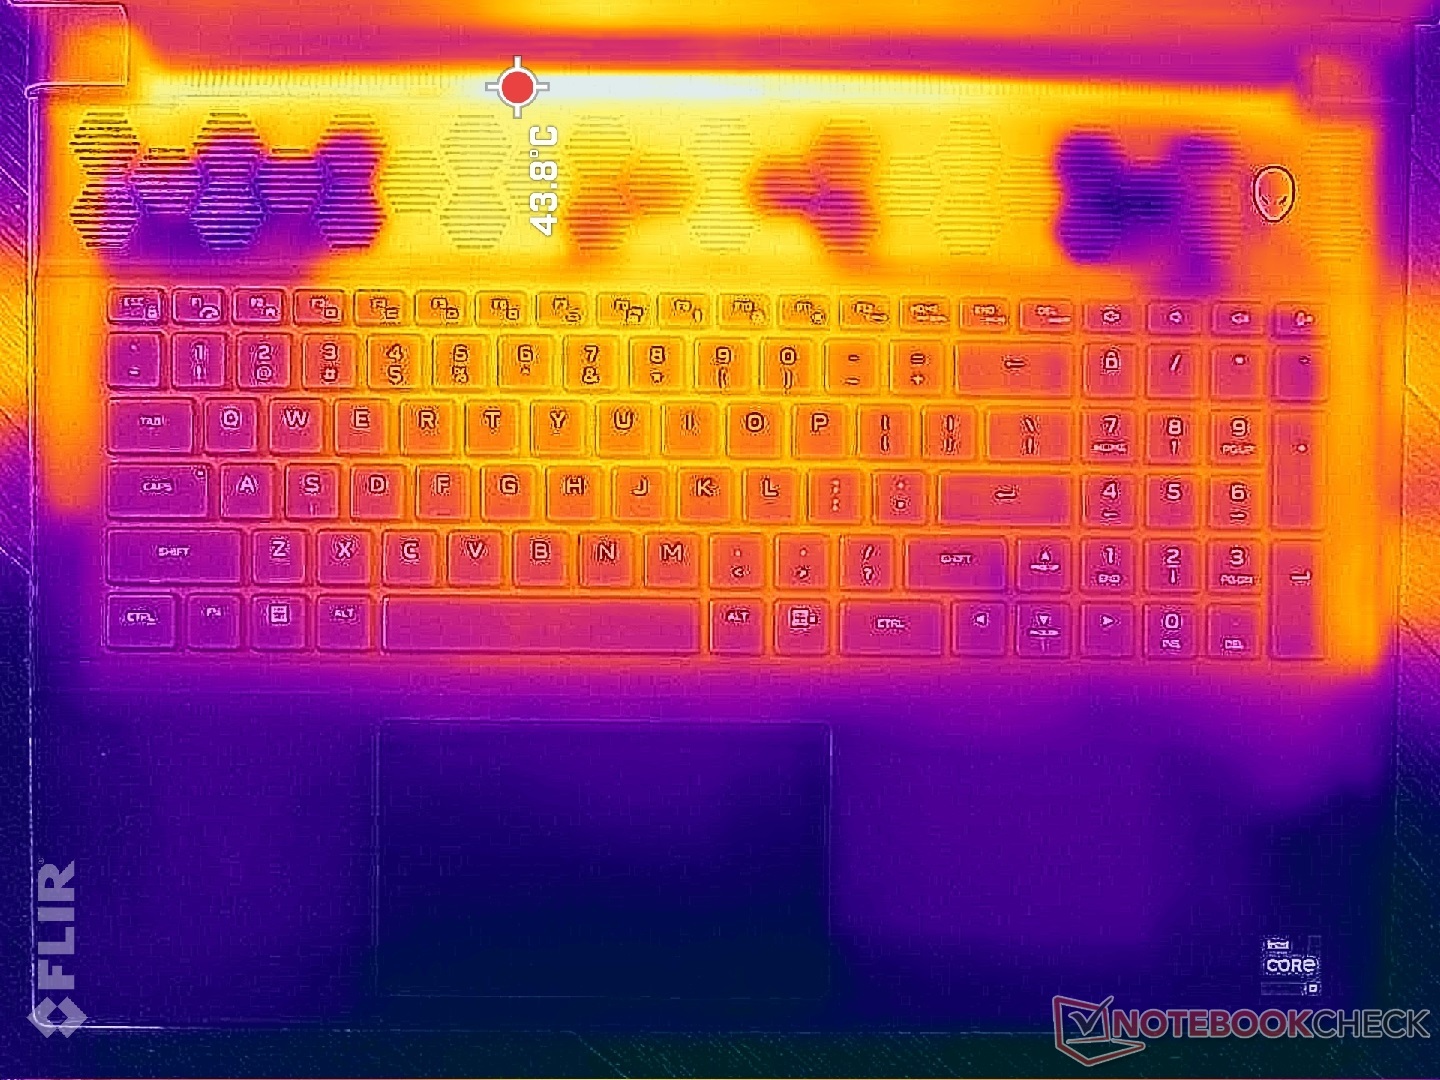
Ortalama yüzey sıcaklıkları genel olarak gözlemlediğimizden daha soğuktur Asus ROG Strix G18. Sıcak noktalar, cilt temasını en aza indirmek için şasinin arkasına doğru indirilmiştir.
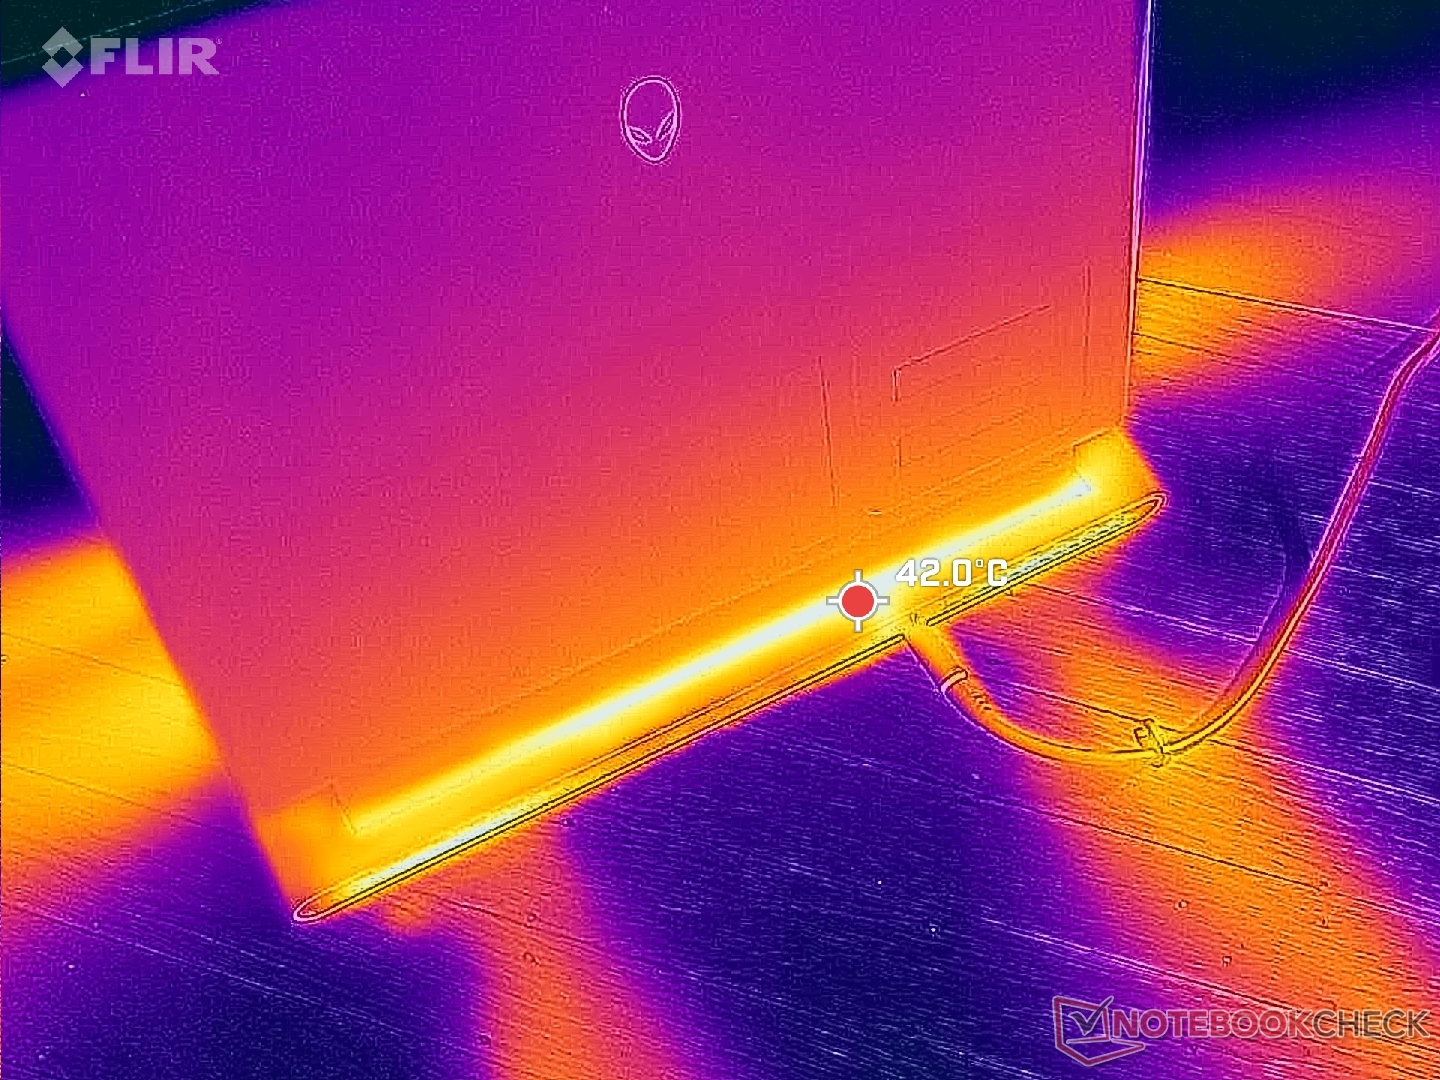
(±) Üst taraftaki maksimum sıcaklık, 40.4 °C / 105 F ortalamasına kıyasla 41.2 °C / 106 F'dir. , Gaming sınıfı için 21.2 ile 68.8 °C arasında değişir.
(+) Alt kısım, 43.2 °C / 110 F ortalamasına kıyasla maksimum 34.6 °C / 94 F'ye kadar ısınır
(±) Boşta kullanımda, üst tarafın ortalama sıcaklığı 34.9 °C / 95 F olup, cihazın 33.9 °C / 93 F.
(±) The Witcher 3 oynarken, üst tarafın ortalama sıcaklığı 32 °C / 90 F olup, cihazın 33.9 °C / 93 F.
(+) Avuç içi dayanakları ve dokunmatik yüzey, maksimum 28.2 °C / 82.8 F ile cilt sıcaklığından daha soğuktur ve bu nedenle dokunulduğunda soğuktur.
(±) Benzer cihazların avuç içi dayanağı alanının ortalama sıcaklığı 28.8 °C / 83.8 F (+0.6 °C / 1 F) idi.
| Alienware m18 R2 Intel Core i9-14900HX, NVIDIA GeForce RTX 4090 Laptop GPU | Alienware m18 R1 AMD AMD Ryzen 9 7945HX, AMD Radeon RX 7900M | Alienware m18 R1 Intel Core i9-13980HX, NVIDIA GeForce RTX 4090 Laptop GPU | MSI Titan 18 HX A14VIG Intel Core i9-14900HX, NVIDIA GeForce RTX 4090 Laptop GPU | Asus ROG Strix G18 G814JI Intel Core i7-13650HX, NVIDIA GeForce RTX 4070 Laptop GPU | Acer Predator Helios 18 N23Q2 Intel Core i9-13900HX, NVIDIA GeForce RTX 4080 Laptop GPU | |
|---|---|---|---|---|---|---|
| Heat | 13% | 17% | 9% | 5% | -4% | |
| Maximum Upper Side * (°C) | 41.2 | 40.2 2% | 39 5% | 37.8 8% | 45 -9% | 35 15% |
| Maximum Bottom * (°C) | 34.6 | 37.4 -8% | 36.4 -5% | 37.6 -9% | 47 -36% | 56 -62% |
| Idle Upper Side * (°C) | 42.8 | 31.6 26% | 29.2 32% | 34.8 19% | 28 35% | 34 21% |
| Idle Bottom * (°C) | 43.6 | 30.6 30% | 27.8 36% | 36 17% | 31 29% | 39 11% |
* ... daha küçük daha iyidir
Konuşmacılar
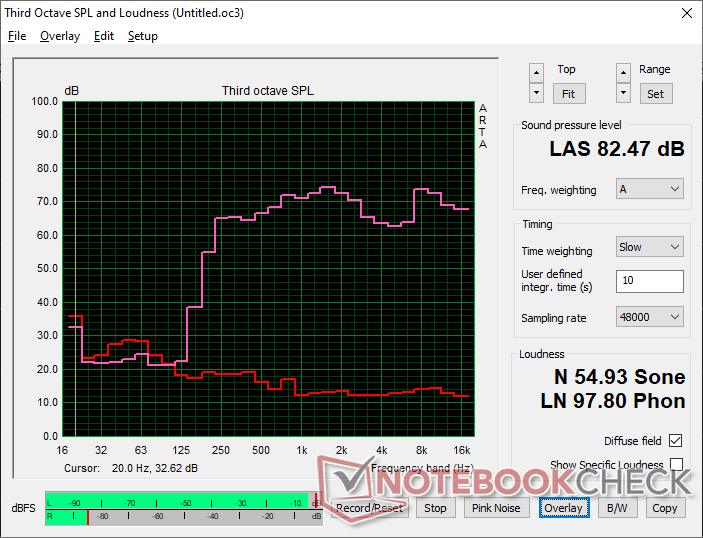
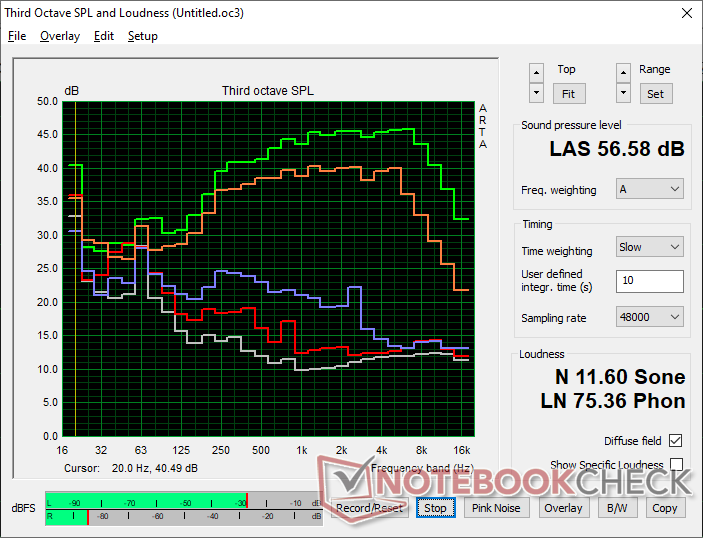
Alienware m18 R2 ses analizi
(+) | hoparlörler nispeten yüksek sesle çalabilir (82.5 dB)
Bas 100 - 315Hz
(-) | neredeyse hiç bas yok - ortalama olarak medyandan 22.1% daha düşük
(±) | Bas doğrusallığı ortalamadır (14% delta - önceki frekans)
Ortalar 400 - 2000 Hz
(+) | dengeli ortalar - medyandan yalnızca 4.1% uzakta
(+) | orta frekanslar doğrusaldır (3.3% deltadan önceki frekansa)
Yüksekler 2 - 16 kHz
(+) | dengeli yüksekler - medyandan yalnızca 4% uzakta
(+) | yüksekler doğrusaldır (6.1% deltadan önceki frekansa)
Toplam 100 - 16.000 Hz
(±) | Genel sesin doğrusallığı ortalamadır (17% ortancaya göre fark)
Aynı sınıfla karşılaştırıldığında
» Bu sınıftaki tüm test edilen cihazların %45%'si daha iyi, 12% benzer, 43% daha kötüydü
» En iyisinin deltası 6% idi, ortalama 18% idi, en kötüsü 132% idi
Test edilen tüm cihazlarla karşılaştırıldığında
» Test edilen tüm cihazların %30'si daha iyi, 8 benzer, % 62 daha kötüydü
» En iyisinin deltası 4% idi, ortalama 24% idi, en kötüsü 134% idi
Apple MacBook Pro 16 2021 M1 Pro ses analizi
(+) | hoparlörler nispeten yüksek sesle çalabilir (84.7 dB)
Bas 100 - 315Hz
(+) | iyi bas - medyandan yalnızca 3.8% uzakta
(+) | bas doğrusaldır (5.2% delta ile önceki frekans)
Ortalar 400 - 2000 Hz
(+) | dengeli ortalar - medyandan yalnızca 1.3% uzakta
(+) | orta frekanslar doğrusaldır (2.1% deltadan önceki frekansa)
Yüksekler 2 - 16 kHz
(+) | dengeli yüksekler - medyandan yalnızca 1.9% uzakta
(+) | yüksekler doğrusaldır (2.7% deltadan önceki frekansa)
Toplam 100 - 16.000 Hz
(+) | genel ses doğrusaldır (4.6% ortancaya göre fark)
Aynı sınıfla karşılaştırıldığında
» Bu sınıftaki tüm test edilen cihazların %0%'si daha iyi, 0% benzer, 100% daha kötüydü
» En iyisinin deltası 5% idi, ortalama 17% idi, en kötüsü 45% idi
Test edilen tüm cihazlarla karşılaştırıldığında
» Test edilen tüm cihazların %0'si daha iyi, 0 benzer, % 100 daha kötüydü
» En iyisinin deltası 4% idi, ortalama 24% idi, en kötüsü 134% idi
Enerji Yönetimi
Güç Tüketimi
Koşmak Witcher 3 tipik oyun yüklerini temsil etmek için ortalama 328 W çekecektir ki bu da geçen yılki m18 R1 Intel versiyonunda kaydettiğimizden biraz daha yüksektir. Bu nedenle, temel donanım değişmediği için watt başına performans açısından büyük bir kazanç yoktur.
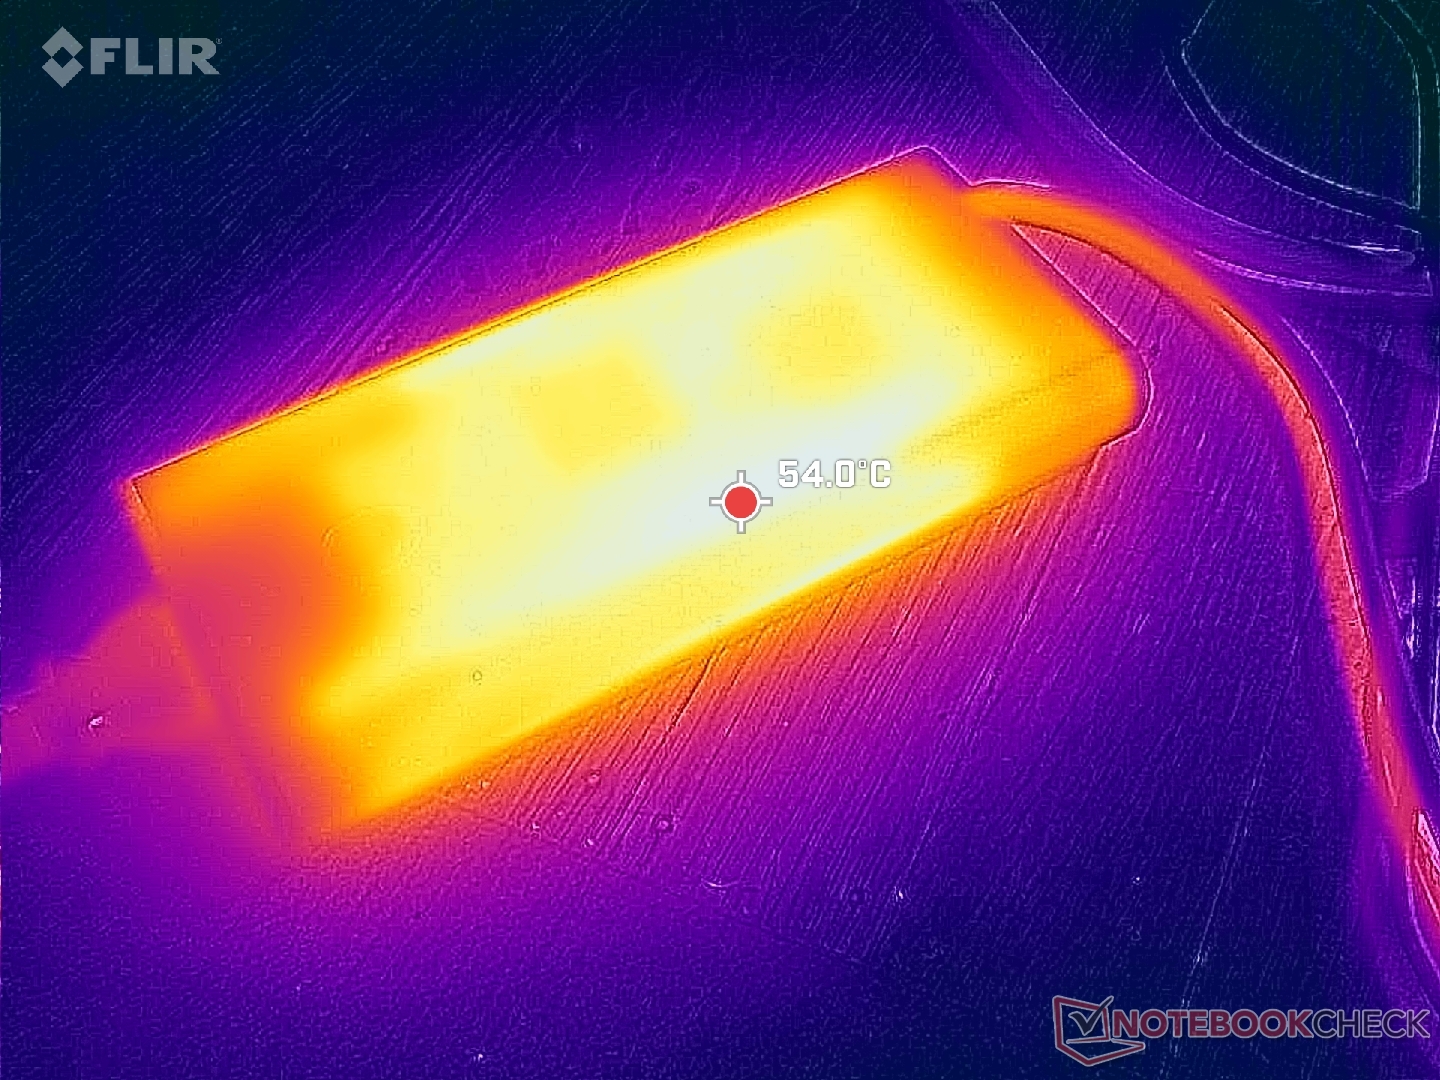
Bu yıl yeni olan, m18 R1 330 W'lık bir adaptörle gönderilirken 360 W'lık daha yüksek kapasiteli AC adaptörüdür. GaN teknolojisine geçiş nedeniyle yeni adaptör daha küçük (~18,9 x 8,6 x 2,6 cm'ye karşılık ~19,5 x 9,8 x 4 cm). Daha yüksek kapasiteli adaptör yavaşlama olasılığını azaltırken aynı anda zorlu yükler çalıştırıldığında daha hızlı şarj edilmesini sağlar.
(Editörün notu: Metrahit Energy multimetremizin onarımı tamamlandığında bu bölüm güncellenecektir. Verdiğimiz rahatsızlıktan dolayı özür dileriz)
| Kapalı / Bekleme modu | |
| Boşta | |
| Çalışırken |
|
Key:
min: | |
| Alienware m18 R2 i9-14900HX, GeForce RTX 4090 Laptop GPU, SK Hynix PC811 HFS002TEM9X152N, IPS, 2560x1600, 18" | Alienware m18 R1 AMD R9 7945HX, Radeon RX 7900M, Kioxia XG8 KXG80ZNV1T02, IPS, 1920x1200, 18" | Alienware m18 R1 i9-13980HX, GeForce RTX 4090 Laptop GPU, SK hynix PC801 HFS001TEJ9X101N, IPS, 1920x1200, 18" | MSI Titan 18 HX A14VIG i9-14900HX, GeForce RTX 4090 Laptop GPU, 2x Samsung PM9A1a MZVL22T0HDLB (RAID 0), Mini-LED, 3840x2400, 18" | Asus ROG Strix G18 G814JI i7-13650HX, GeForce RTX 4070 Laptop GPU, Micron 2400 MTFDKBA1T0QFM, IPS, 2560x1600, 18" | Acer Predator Helios 18 N23Q2 i9-13900HX, GeForce RTX 4080 Laptop GPU, Samsung PM9A1 MZVL22T0HBLB, IPS, 2560x1600, 18" | |
|---|---|---|---|---|---|---|
| Power Consumption | -72% | -21% | -9% | 36% | 13% | |
| Idle Minimum * (Watt) | 10.6 | 30.3 -186% | 21.6 -104% | 13.2 -25% | 8 25% | 16 -51% |
| Idle Average * (Watt) | 20.9 | 55.6 -166% | 25.2 -21% | 25.4 -22% | 15 28% | 19 9% |
| Idle Maximum * (Watt) | 40 | 101.1 -153% | 56.7 -42% | 53.5 -34% | 26 35% | 21.3 47% |
| Load Average * (Watt) | 201.1 | 160.3 20% | 164.1 18% | 151.4 25% | 102 49% | 124 38% |
| Witcher 3 ultra * (Watt) | 358 | 216 40% | 311 13% | 336 6% | 178.6 50% | 289 19% |
| Load Maximum * (Watt) | 378.9 | 332.1 12% | 338.9 11% | 395.2 -4% | 267 30% | 319 16% |
* ... daha küçük daha iyidir
Power Consumption Witcher 3 / Stresstest
Power Consumption external Monitor
Pil Ömrü
Çalışma süreleri, yaklaşık yarım saat kadar biraz daha uzun olmasa da, eskisiyle hemen hemen aynı kalıyor. Bu, test sırasında pil tükenme sorunları sergileyen m18 R1 AMD yapılandırmamızın aksine.
USB-C üzerinden şarj hala mümkün değil.
| Alienware m18 R2 i9-14900HX, GeForce RTX 4090 Laptop GPU, 97 Wh | Alienware m18 R1 AMD R9 7945HX, Radeon RX 7900M, 97 Wh | Alienware m18 R1 i9-13980HX, GeForce RTX 4090 Laptop GPU, 97 Wh | MSI Titan 18 HX A14VIG i9-14900HX, GeForce RTX 4090 Laptop GPU, 99.9 Wh | Asus ROG Strix G18 G814JI i7-13650HX, GeForce RTX 4070 Laptop GPU, 90 Wh | Acer Predator Helios 18 N23Q2 i9-13900HX, GeForce RTX 4080 Laptop GPU, 90 Wh | |
|---|---|---|---|---|---|---|
| Pil Çalışma Süresi | -71% | -10% | -12% | 69% | -8% | |
| WiFi v1.3 (h) | 4.8 | 1.4 -71% | 4.3 -10% | 4.2 -12% | 8.1 69% | 4.4 -8% |
| Reader / Idle (h) | 4.5 | 5.6 | 5.9 | 11.7 | ||
| Load (h) | 0.7 | 0.7 | 1.2 | 1.2 | 1.7 | |
| H.264 (h) | 4.8 |
Artılar
Eksiler
Karar - Daha Çok Bir Alienware m18 R1.1 Gibi
Oyun dizüstü bilgisayarları bu yıl zor bir durumda. Raptor Lake-HX yenileme CPU'ları 2023'teki muadilleriyle neredeyse aynı performansı gösterirken, bir yıllık RTX 4090'ın yerini alacak yeni bir şey duyurulmadı. Sonuç olarak, Alienware m18 R2 gibi yeni oyun dizüstü bilgisayarları, geçen yılki modellerle aynı parçaları kullanmak zorunda kaldı. Bu nedenle Alienware m18 R2 pazarındaki kullanıcılar, performans seviyelerinin geçen yılki modellerle aynı seviyede olmasını beklemelidir Alienware m18 R1.
Alienware m18 R2, Alienware m18 R1 ile karşılaştırıldığında yana doğru bir adımdır. Hala piyasadaki en hızlı oyun dizüstü bilgisayarlarından biri, ancak yıldan yıla yapılan iyileştirmeler en iyi ihtimalle marjinal.
Daha hızlı RJ-45 bağlantı noktası, daha küçük AC adaptörü ve daha yeni SSD seçenekleri gibi birkaç küçük iyileştirme var, ancak kullanıcı deneyimi temelde aynı. Özellikle m18 R1 artık daha ucuz olduğu için m18 R2'den önce m18 R1'i düşünmenizi öneririz.
Fiyat ve Bulunabilirlik
Dell şu anda Alienware m18 R2'yi temel Core i7-14650HX, GeForce RTX 4060 ve 1600p165 ekran konfigürasyonu için 1900 USD'den başlayıp Core i9-14900HX, RTX 4090 ve 1200p480 ekran ile yapılandırılmış 3200 USD'nin üzerine kadar gönderiyor.
Alienware m18 R2
- 03/22/2024 v7 (old)
Allen Ngo
Şeffaflık
İncelenecek cihazların seçimi editör ekibimiz tarafından yapılır. Test örneği, bu incelemenin amacı doğrultusunda üretici veya perakendeci tarafından yazara ödünç olarak sağlanmıştır. Borç verenin bu inceleme üzerinde herhangi bir etkisi olmadığı gibi, üretici de yayınlanmadan önce bu incelemenin bir kopyasını almamıştır. Bu incelemeyi yayınlama zorunluluğu yoktu. Bağımsız bir medya şirketi olarak Notebookcheck, üreticilerin, perakendecilerin veya yayıncıların otoritesine tabi değildir.
Notebookcheck bu şekilde test yapıyor
Notebookcheck, tüm sonuçların karşılaştırılabilir olmasını sağlamak için her yıl yüzlerce dizüstü bilgisayarı ve akıllı telefonu standart prosedürler kullanarak bağımsız olarak inceliyor. Yaklaşık 20 yıldır test yöntemlerimizi sürekli olarak geliştirdik ve bu süreçte endüstri standartlarını belirledik. Test laboratuvarlarımızda deneyimli teknisyenler ve editörler tarafından yüksek kaliteli ölçüm ekipmanları kullanılmaktadır. Bu testler çok aşamalı bir doğrulama sürecini içerir. Karmaşık derecelendirme sistemimiz, nesnelliği koruyan yüzlerce sağlam temellere dayanan ölçüm ve kıyaslamaya dayanmaktadır.Price comparison

