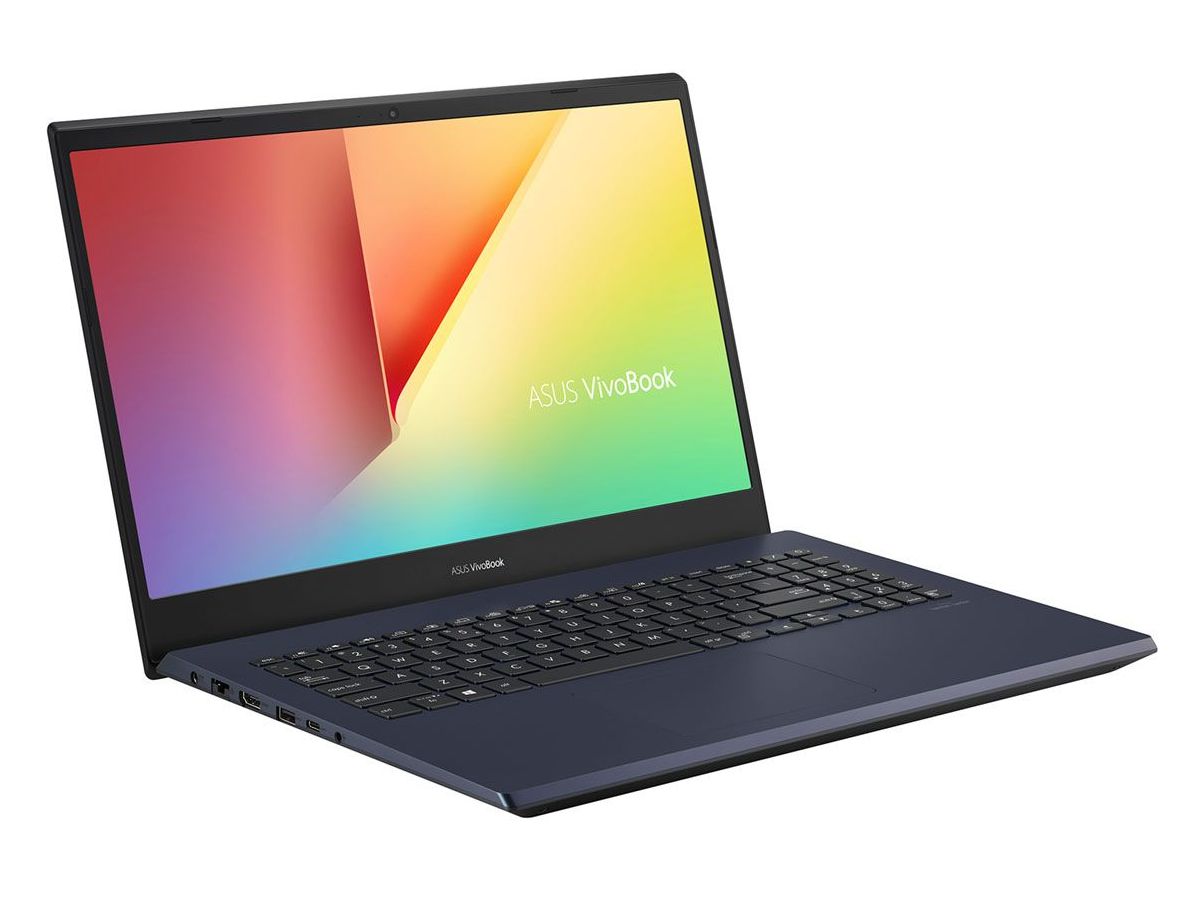
Asus VivoBook 15 K571LI Dizüstü Bilgisayar İncelemesi: Oyun Multimedya Hibrit
VivoBook serisi, Asus'un orta sınıf multimedya dizüstü bilgisayarlarına veya daha pahalı olan amiral gemisi ZenBook serisinden bir adım aşağı olacak şekilde tasarlanmış Ultrabook'lara ev sahipliği yapıyor. Bu durumda VivoBook 15 K571LI, HP Envy 15, MacBook Pro 15 veya Dell XPS 15'e yüzlerce dolar daha fazla harcamaya hazır olmayan performans kullanıcılarını hedefleyen ailede daha üst düzey bir modeldir. Bu özel sistem şunları sunar: Core H-serisi CPU'lar ve GeForce GTX-level GPU'lar da dahil olmak üzere aynı performans özelliklerinin birçoğu, bankayı bozmadan. Bugün test ünitemiz, yaklaşık 1100-1200 USD perakende için Computer Upgrade King tarafından tam donanımlı olarak geliyor. Core i7 CPU, 120 Hz 1080p ekran, 1 TB SSD ve 40 GB RAM içermeyen daha küçük SKU'lar da mevcuttur.Daha fazla Asus incelemesi: VivoBook 17 F712Zephyrus G15 GA502ROG Phone 3ZenBook 13 UX325Strix Scar 17
Derecelendirme | Tarih | Modeli | Ağırlık | Yükseklik | Boyut | Çözünürlük | Fiyat |
|---|---|---|---|---|---|---|---|
| 78.6 % v7 (old) | 10/2020 | Asus VivoBook 15 K571LI-PB71 i7-10750H, GeForce GTX 1650 Ti Mobile | 2.1 kg | 21.9 mm | 15.60" | 1920x1080 | |
| 83 % v7 (old) | 08/2020 | HP Envy 15-ep0098nr i7-10750H, GeForce RTX 2060 Max-Q | 2 kg | 19 mm | 15.60" | 3840x2160 | |
| 81.5 % v7 (old) | Acer Aspire 5 A515-54G i5-10210U, GeForce MX250 | 1.7 kg | 17.9 mm | 15.60" | 1920x1080 | ||
| 85.2 % v7 (old) | 03/2020 | Asus ZenBook 15 UX534FTC-A8190T i7-10510U, GeForce GTX 1650 Max-Q | 1.6 kg | 18.9 mm | 15.60" | 1920x1080 | |
| 81.4 % v7 (old) | 03/2020 | Lenovo Ideapad S540-15IML i5-10210U, GeForce MX250 | 1.9 kg | 17 mm | 15.60" | 1920x1080 | |
| 79.7 % v6 (old) | Dell Inspiron 15 5000 5585 R7 3700U, Vega 10 | 1.8 kg | 19.5 mm | 15.60" | 1920x1080 |
Durum
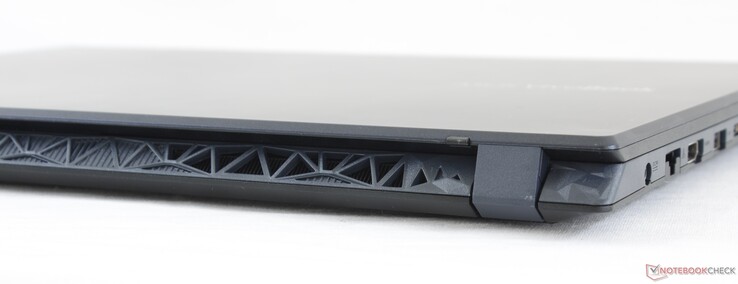
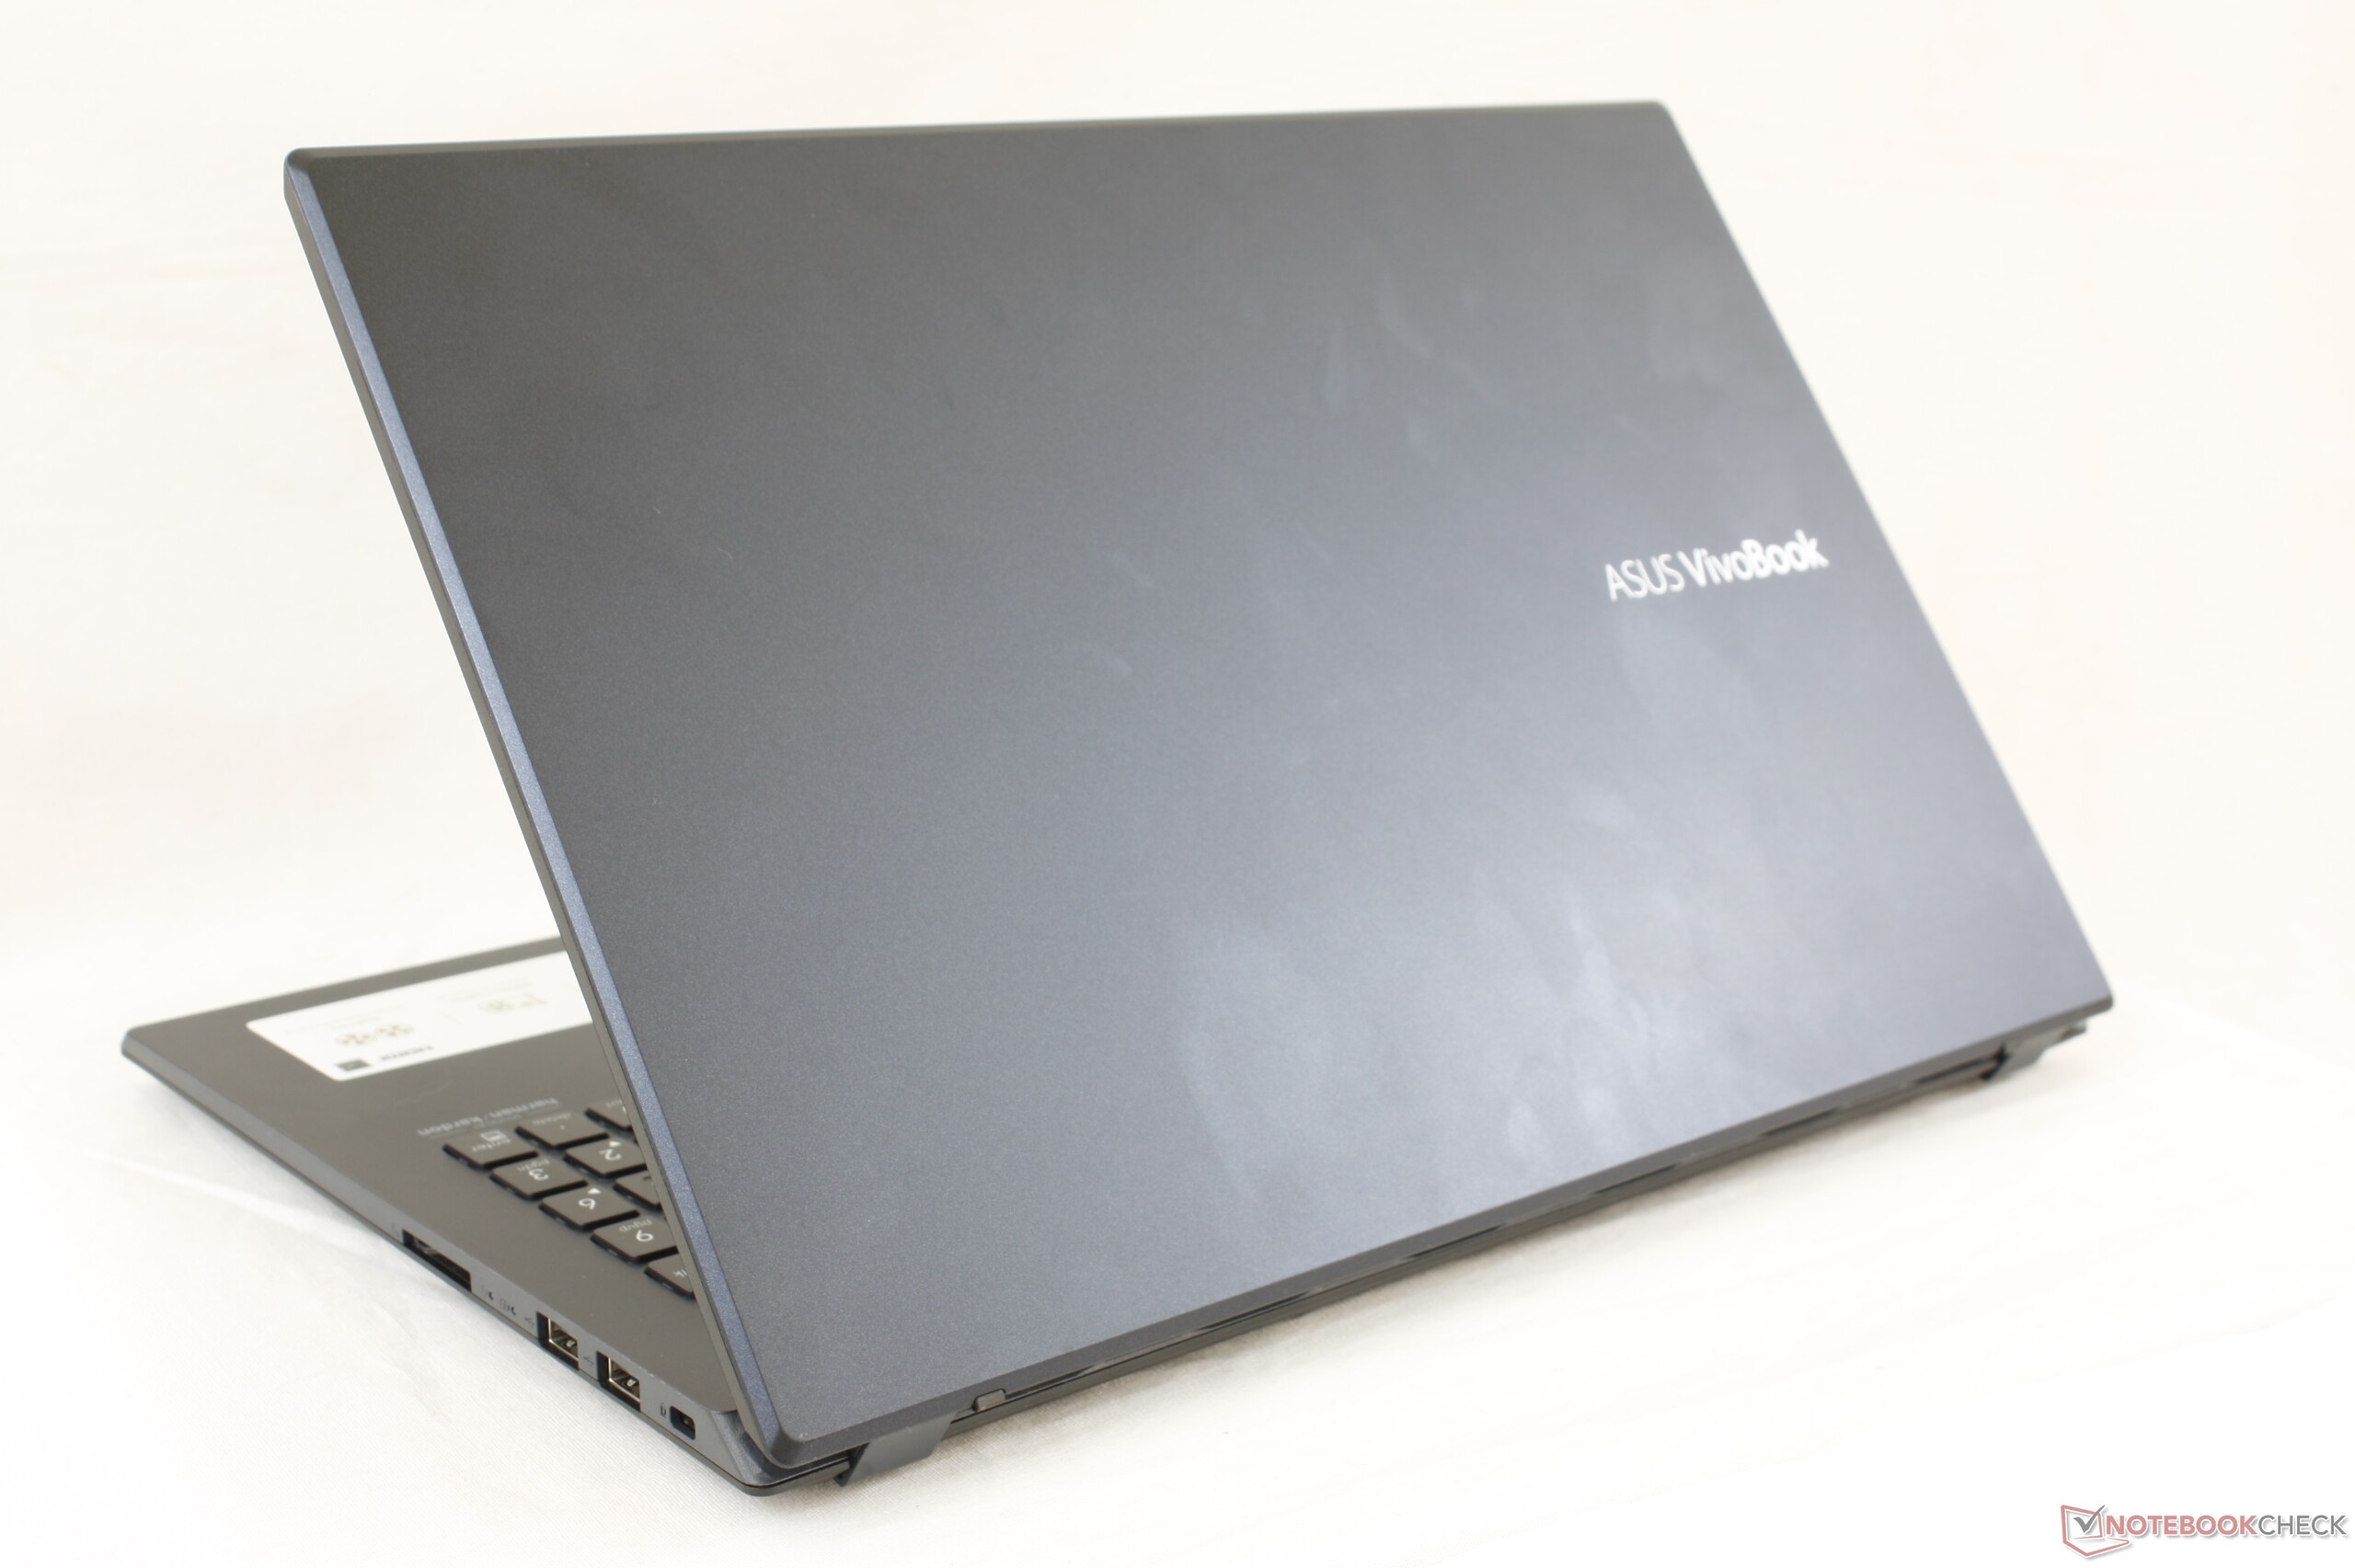
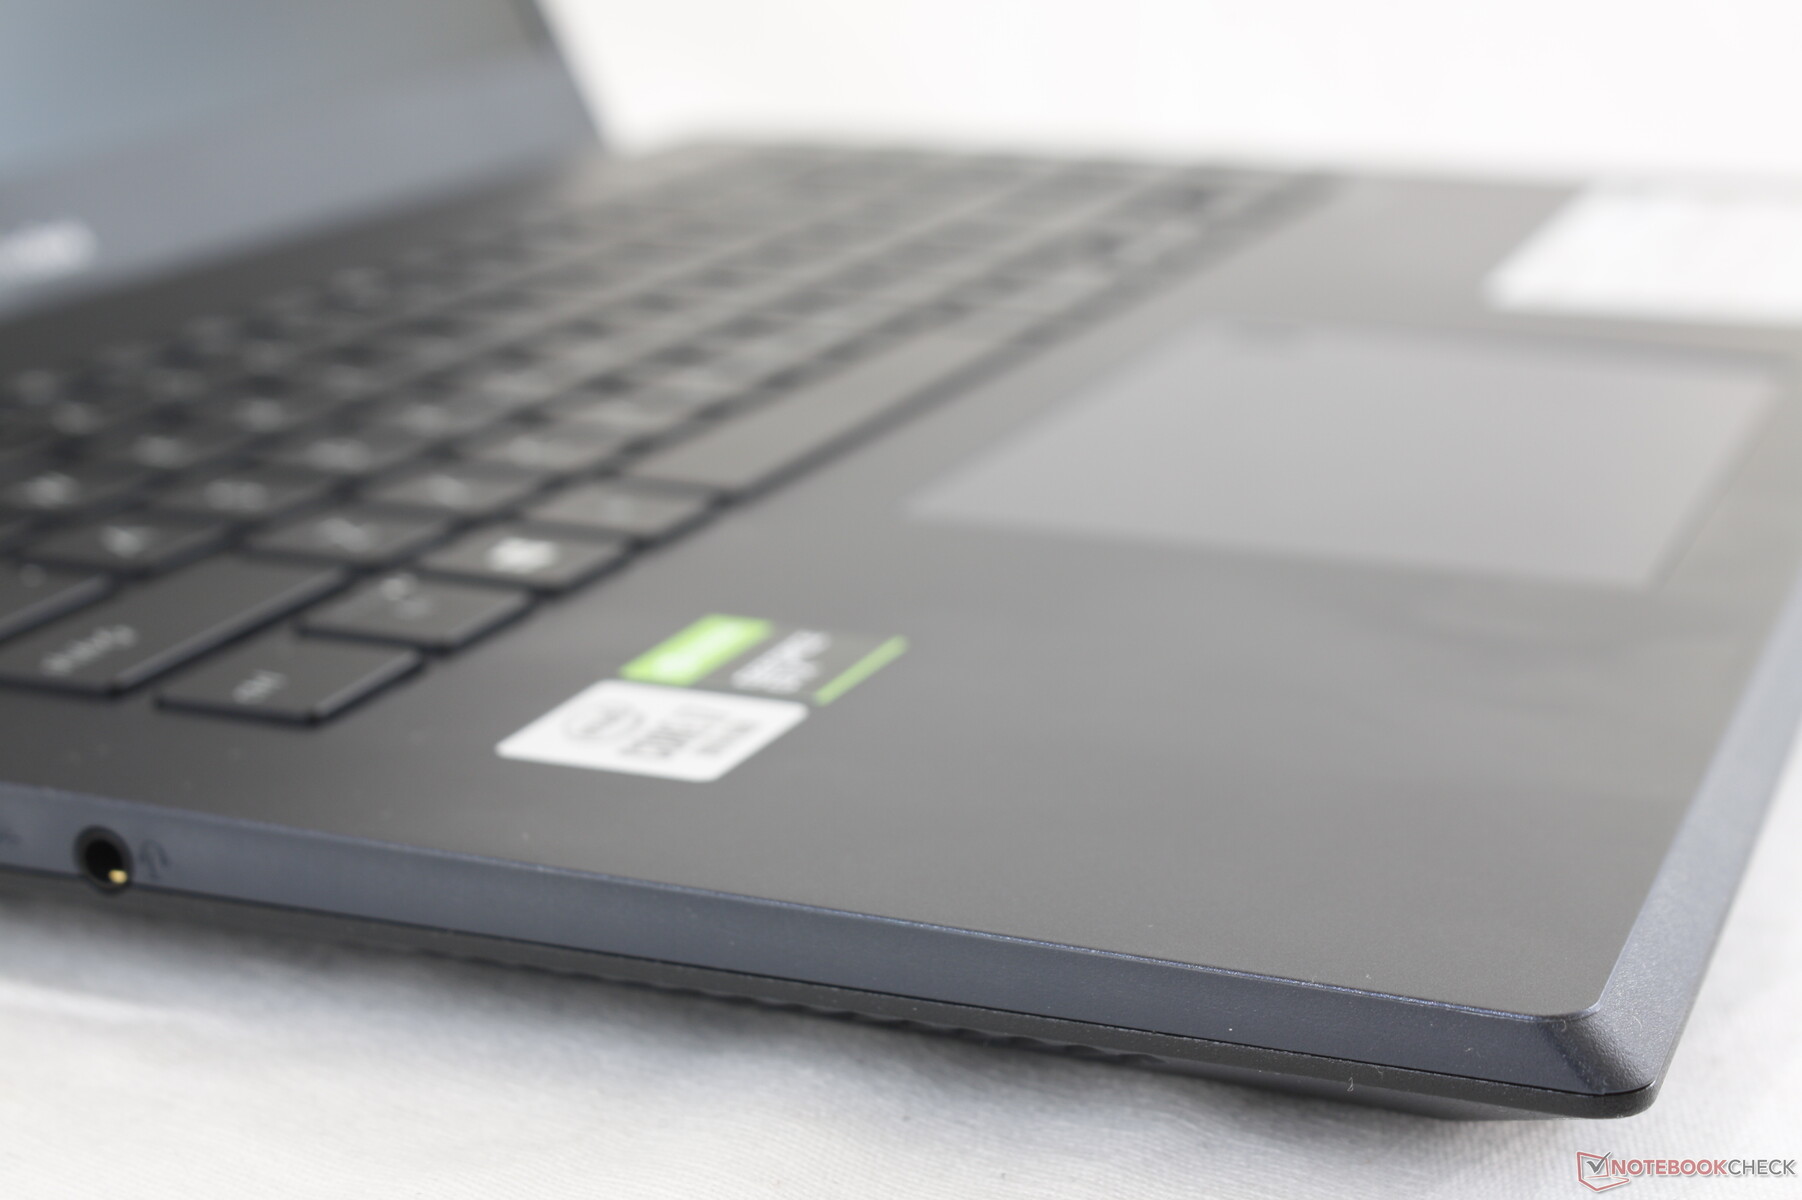
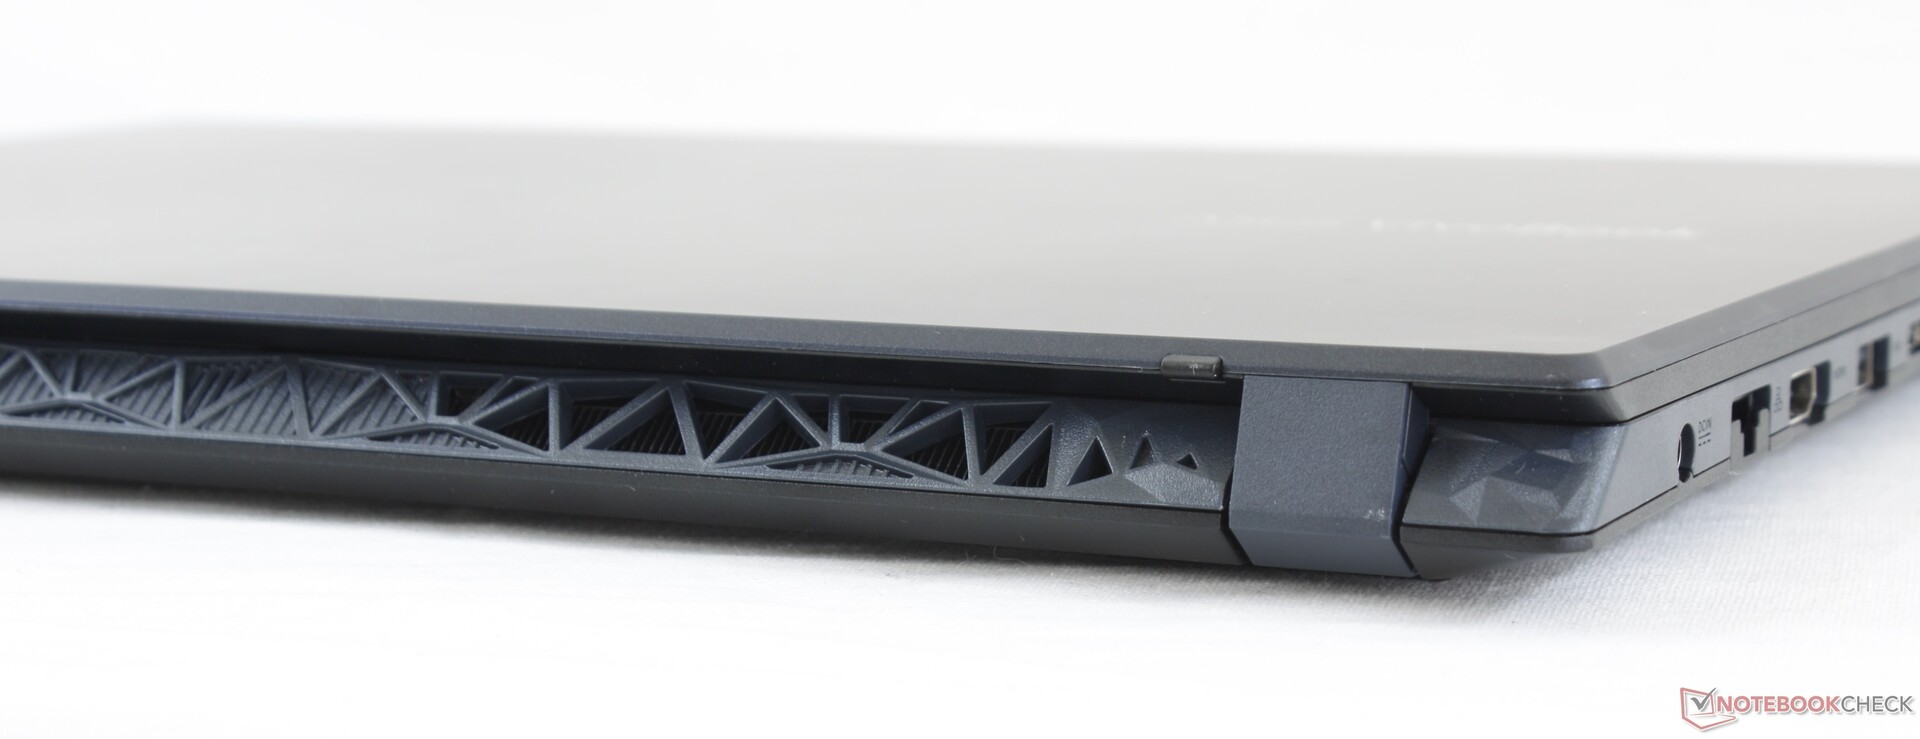
VivoBook 15 K571 serisi, daha hızlı işlemci seçeneklerini barındırmak için VivoBook 15 F512 serisinden farklı bir kasa tasarımı kullanır. Şasi sertliği, hala çoğunlukla plastik olduğu için aynı kalır. Hem taban hem de kapak, HP Pavilion Gaming serisine kıyasla baskıya daha kolay eğilirken, Lenovo Legion Y540 serisinden biraz daha serttir. Kullanıcılar Razer, MacBook veya ZenBook metal malzemeleri beklemediği sürece 1000 dolarlık bir sistem için uygun.
Kasa boyutu ve ağırlığı, kısmen daha güçlü CPU ve GPU seçeneklerinden dolayı HP Envy, ZenBook 15 veya Lenovo IdeaPad S540 dahil olmak üzere diğer birçok multimedya dizüstü bilgisayardan daha büyüktür. Performans göz önüne alındığında nispeten kompakt olması için daha geleneksel Ultrabook'lar ile MSI GP65 veya TUF A15 serisi gibi giriş seviyesi oyun dizüstü bilgisayarları arasında oturur.
Bağlantı
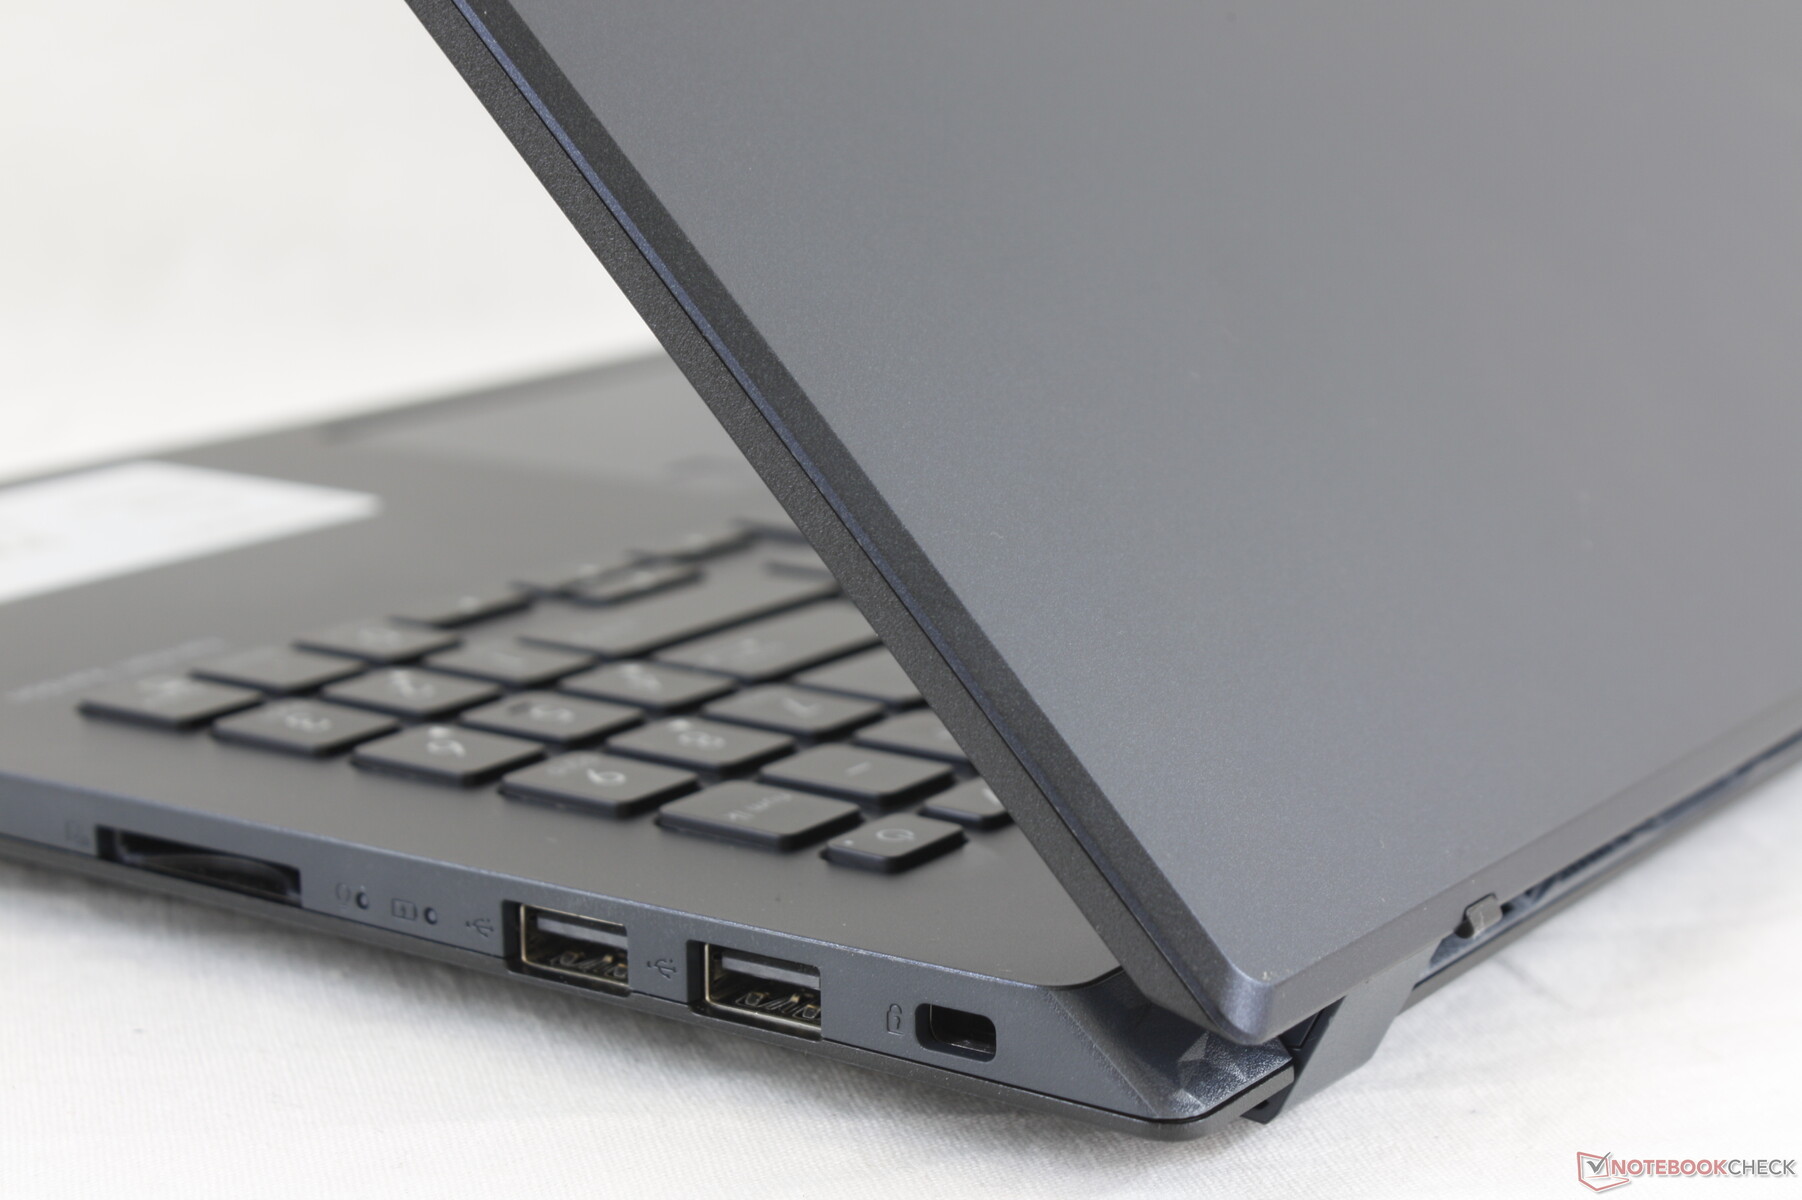
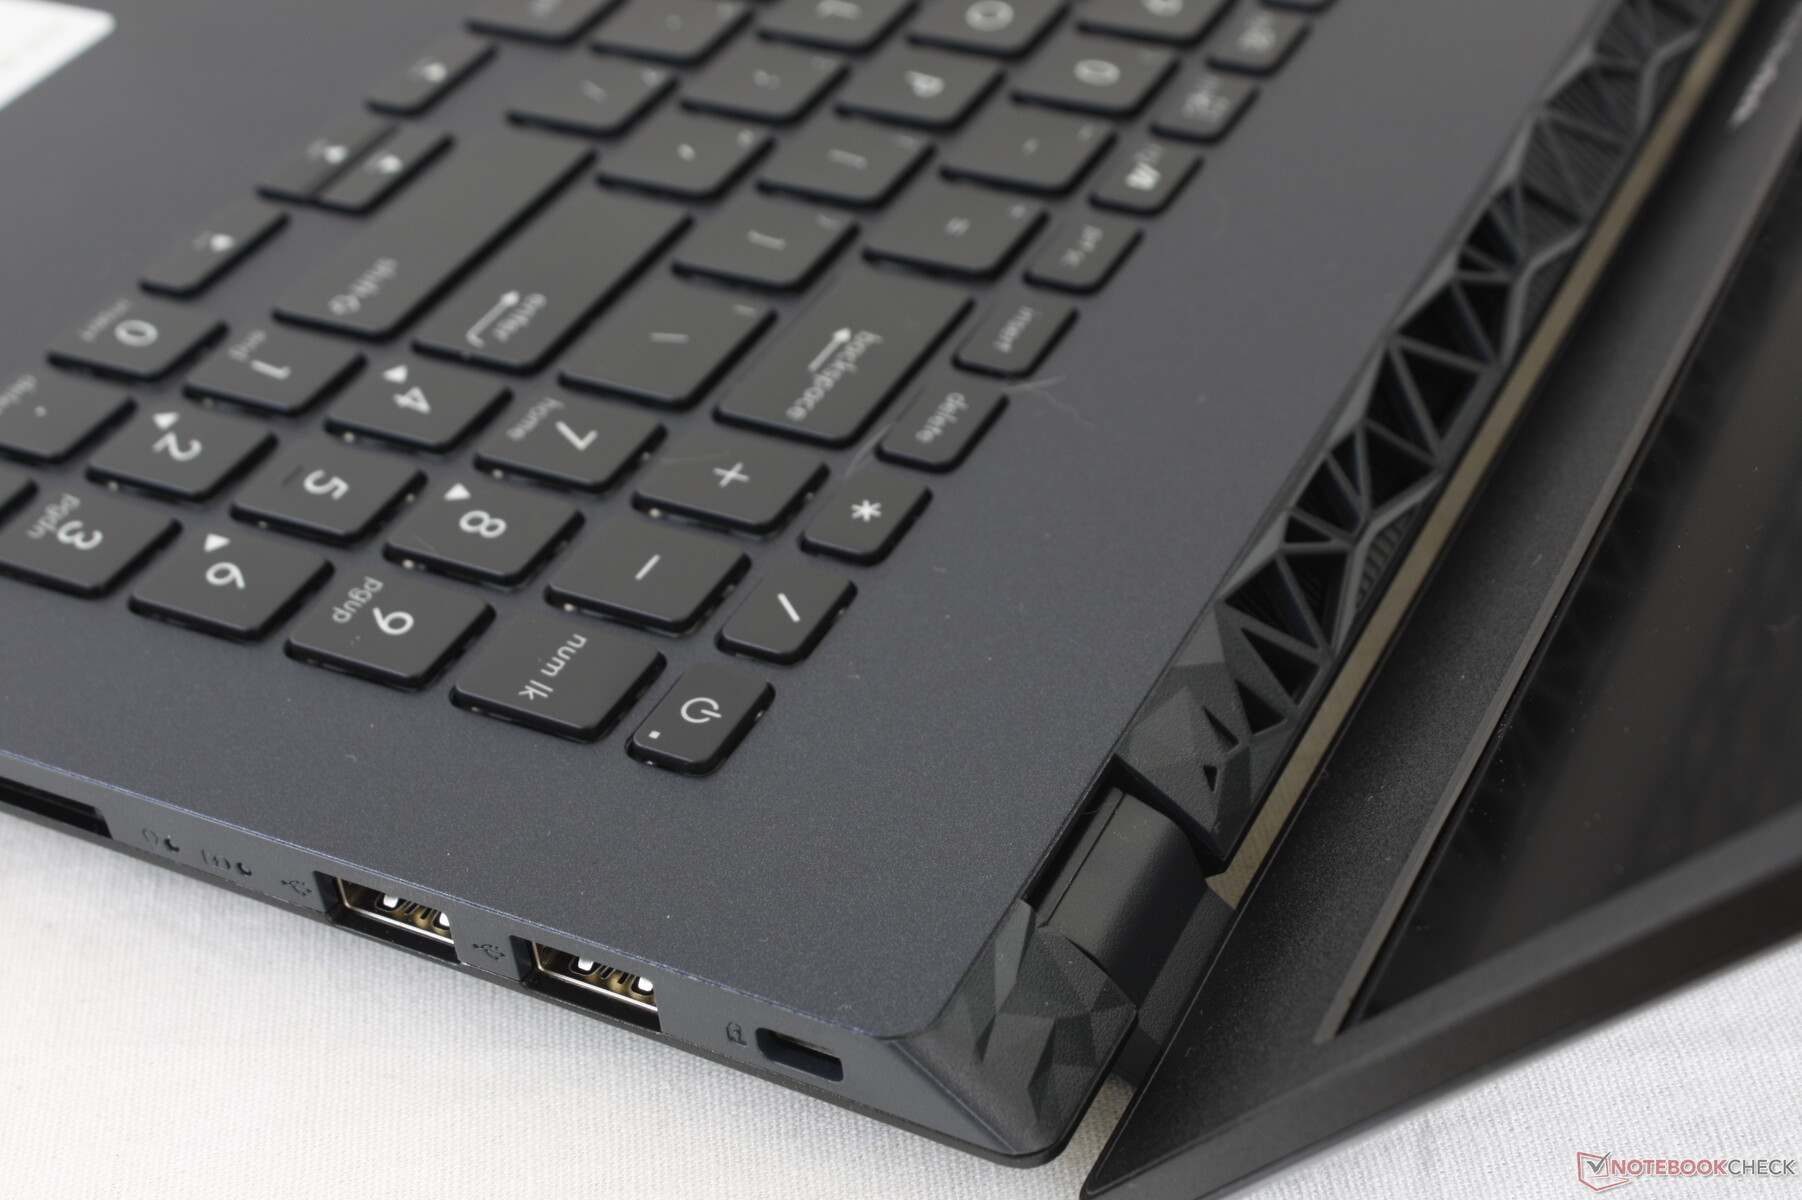
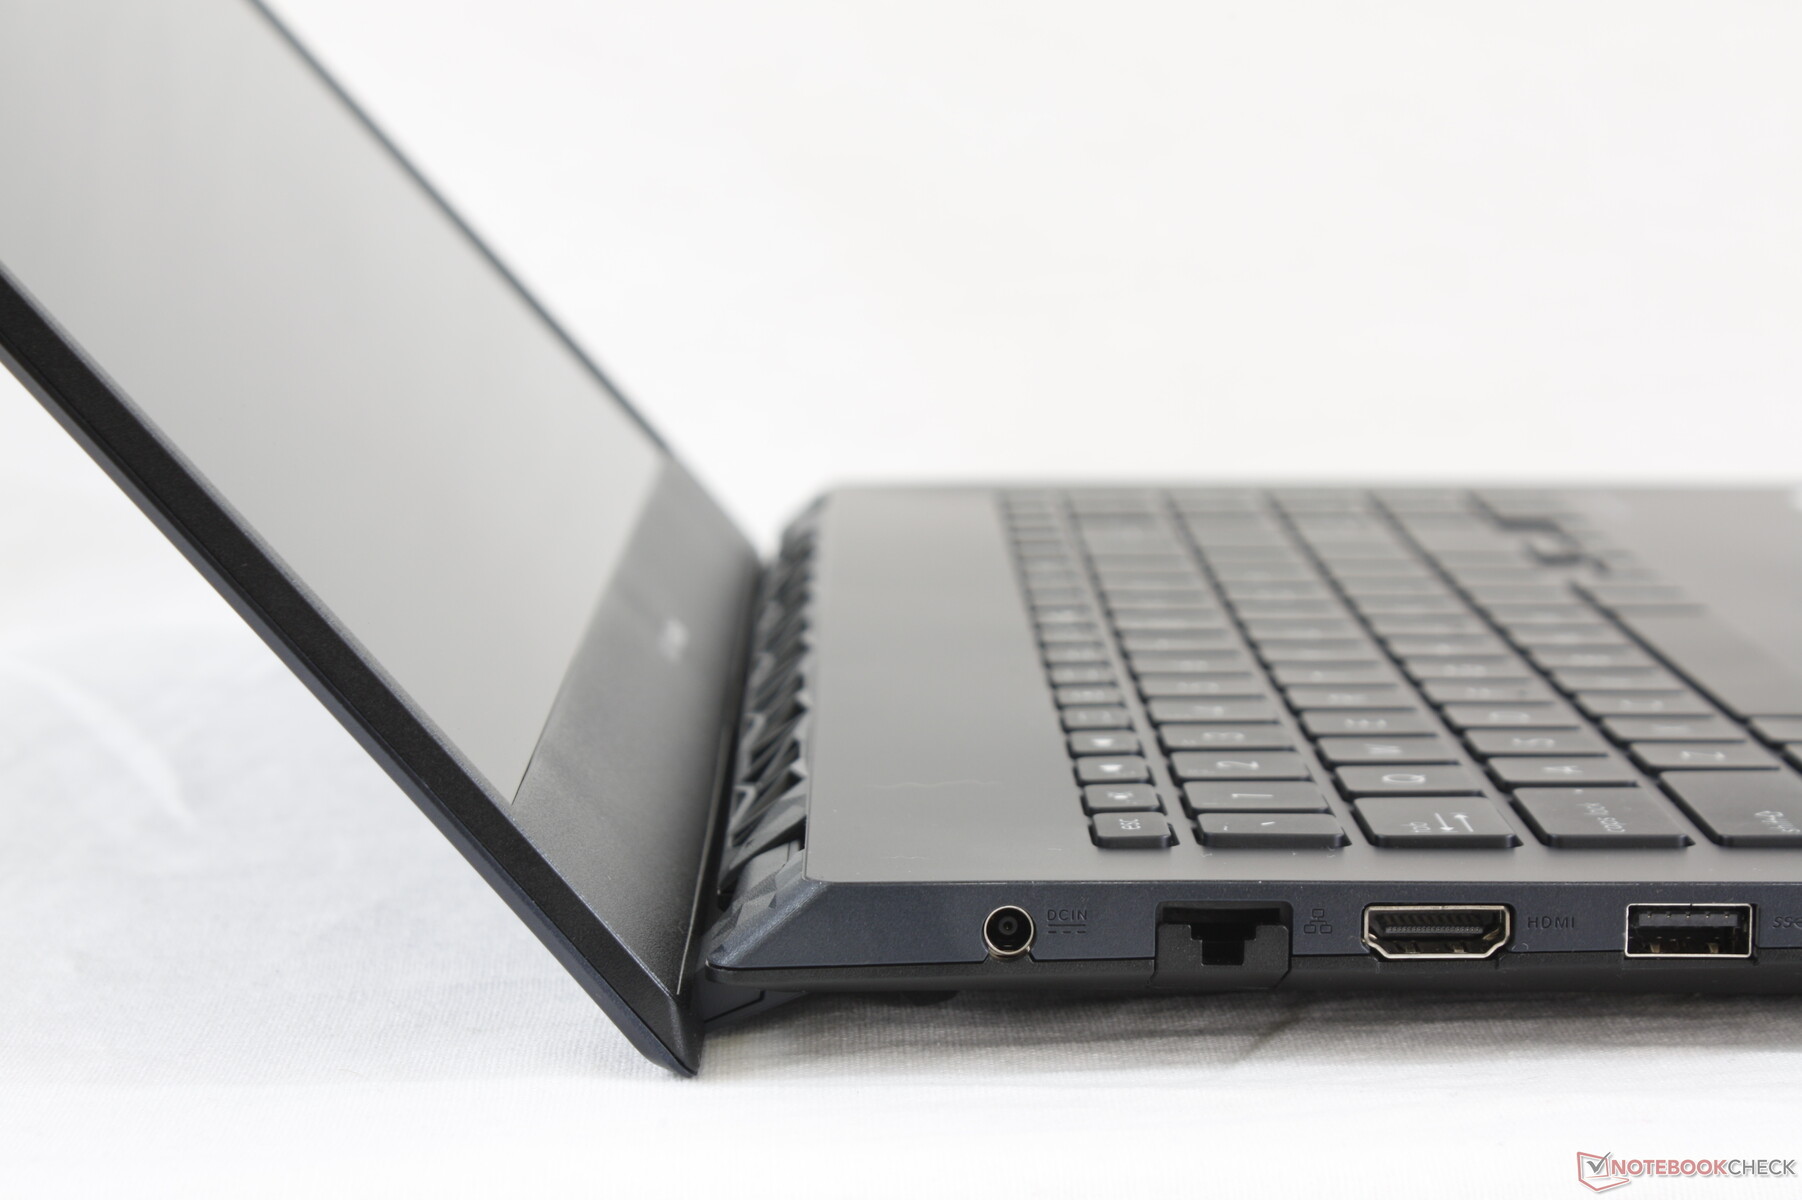
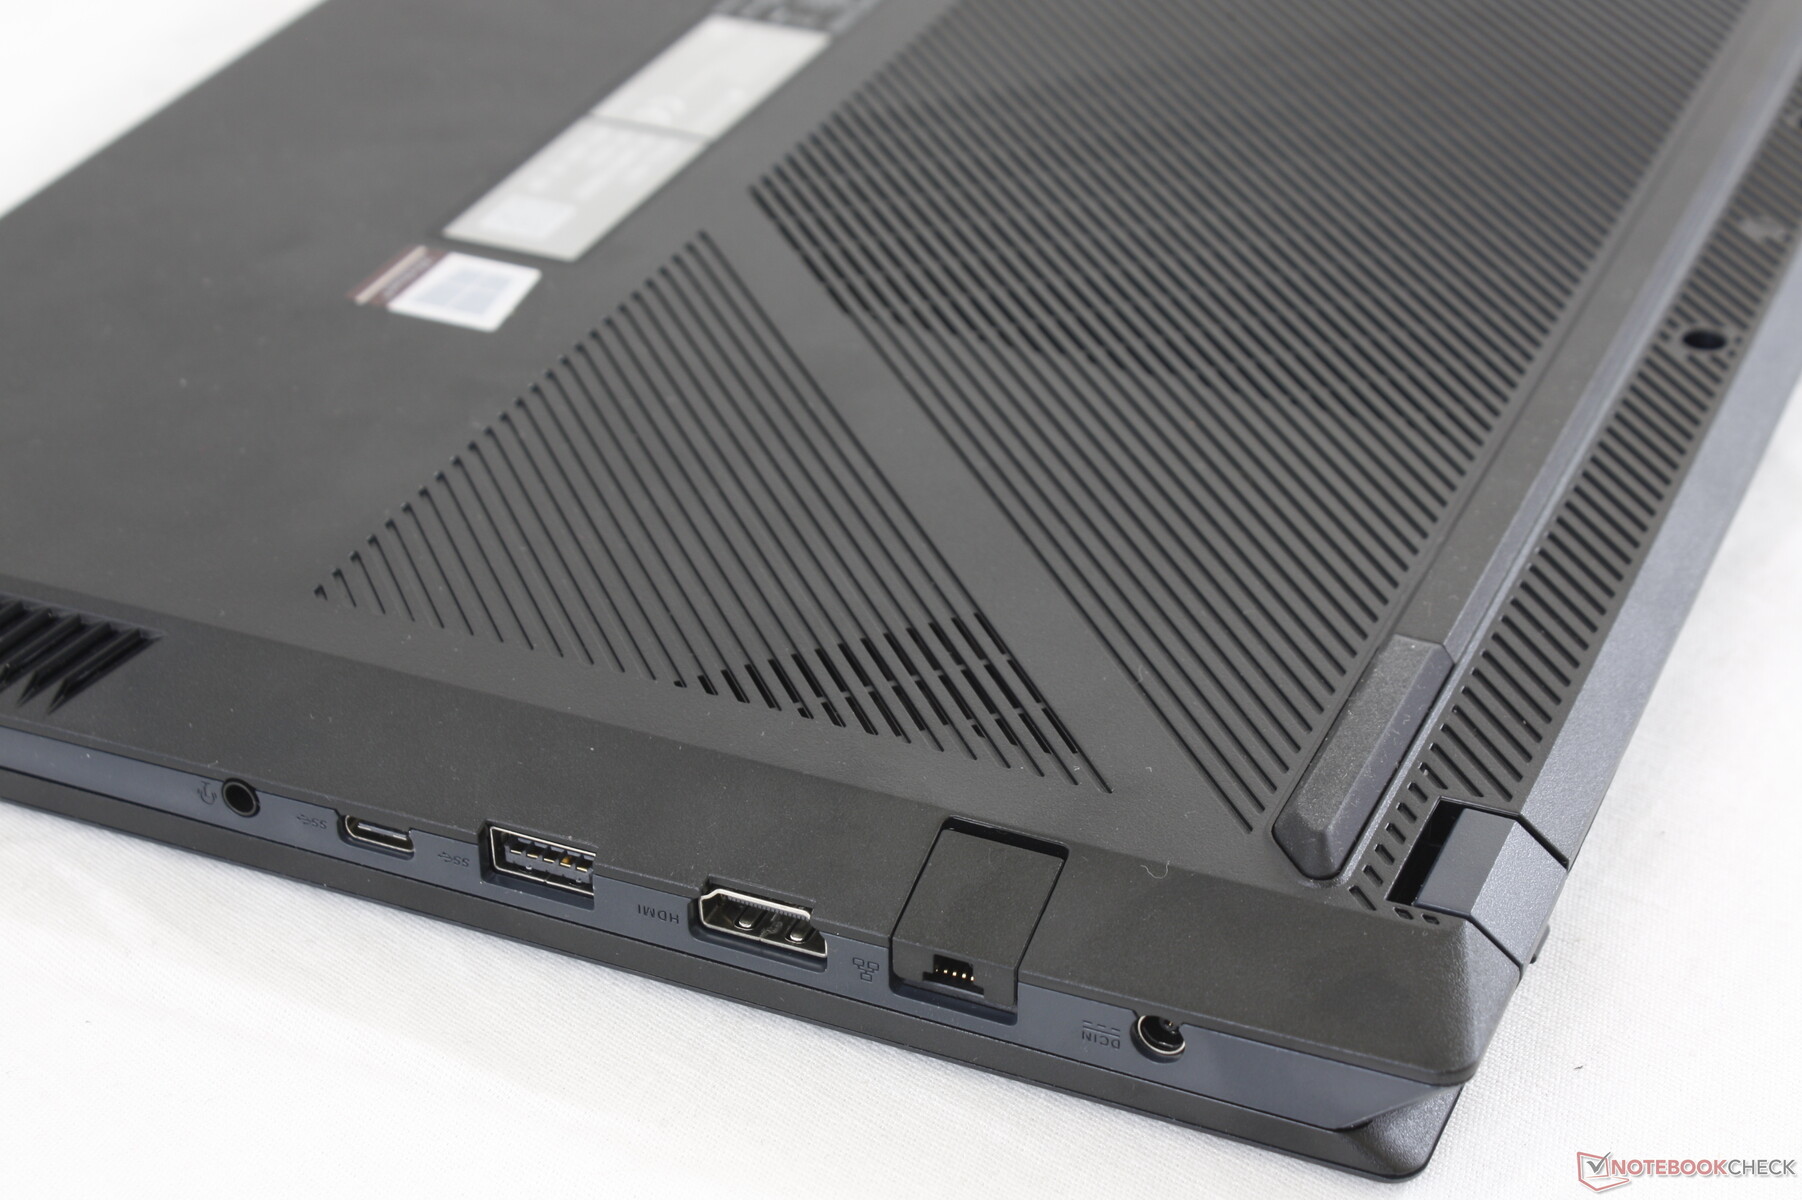
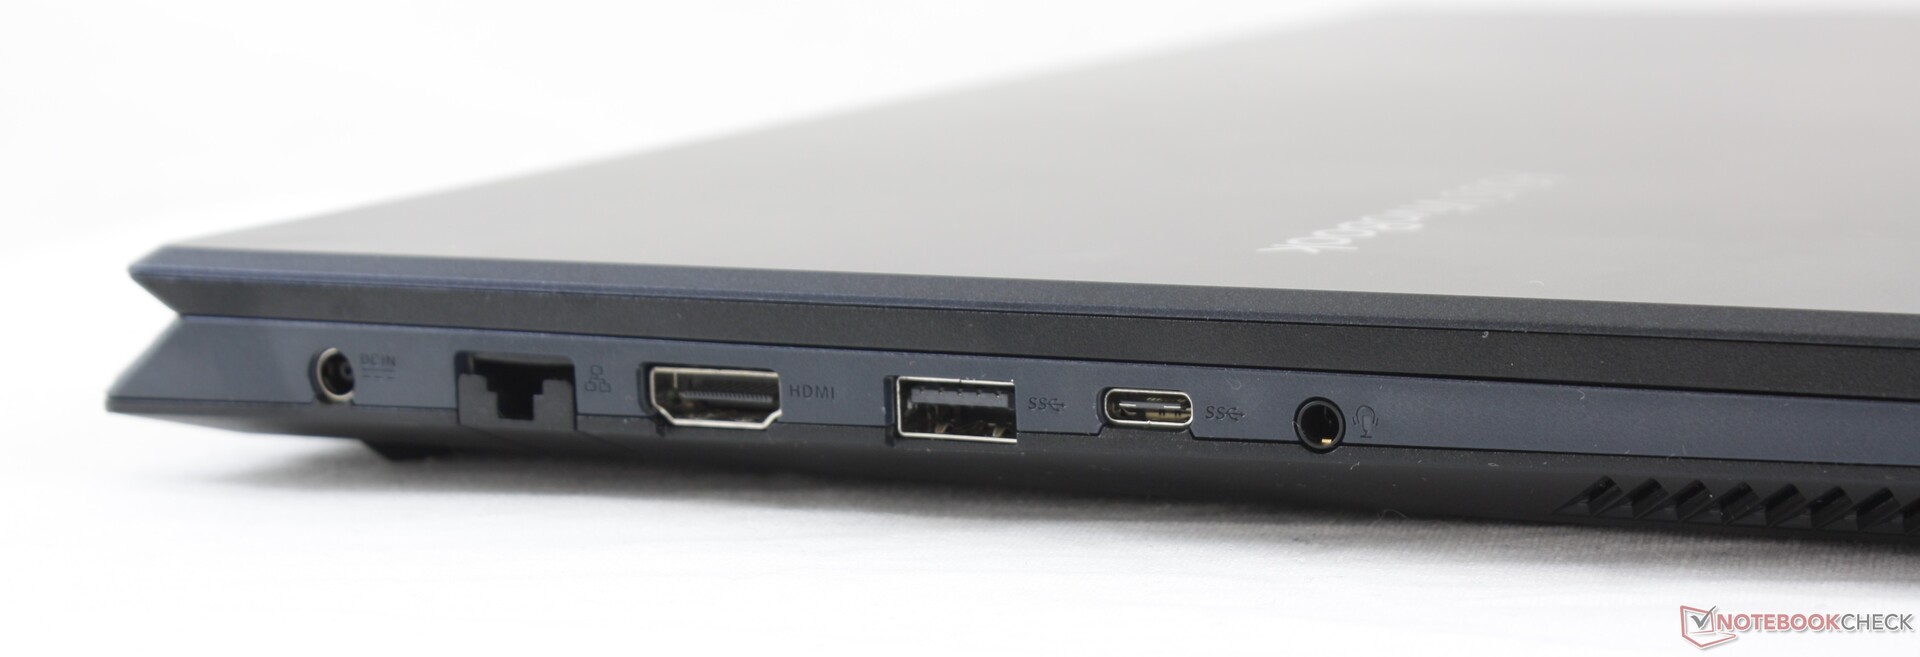
Sistem iyi bir bağlantı noktası seçimini entegre etse de, bunların sıkı bir şekilde paketlendiğini ve bu nedenle daha kalın kablolar için pek uygun olmadığını unutmayın. USB-C ile harici bir monitörü bağlamayı denedik, ancak başarısız oldu.
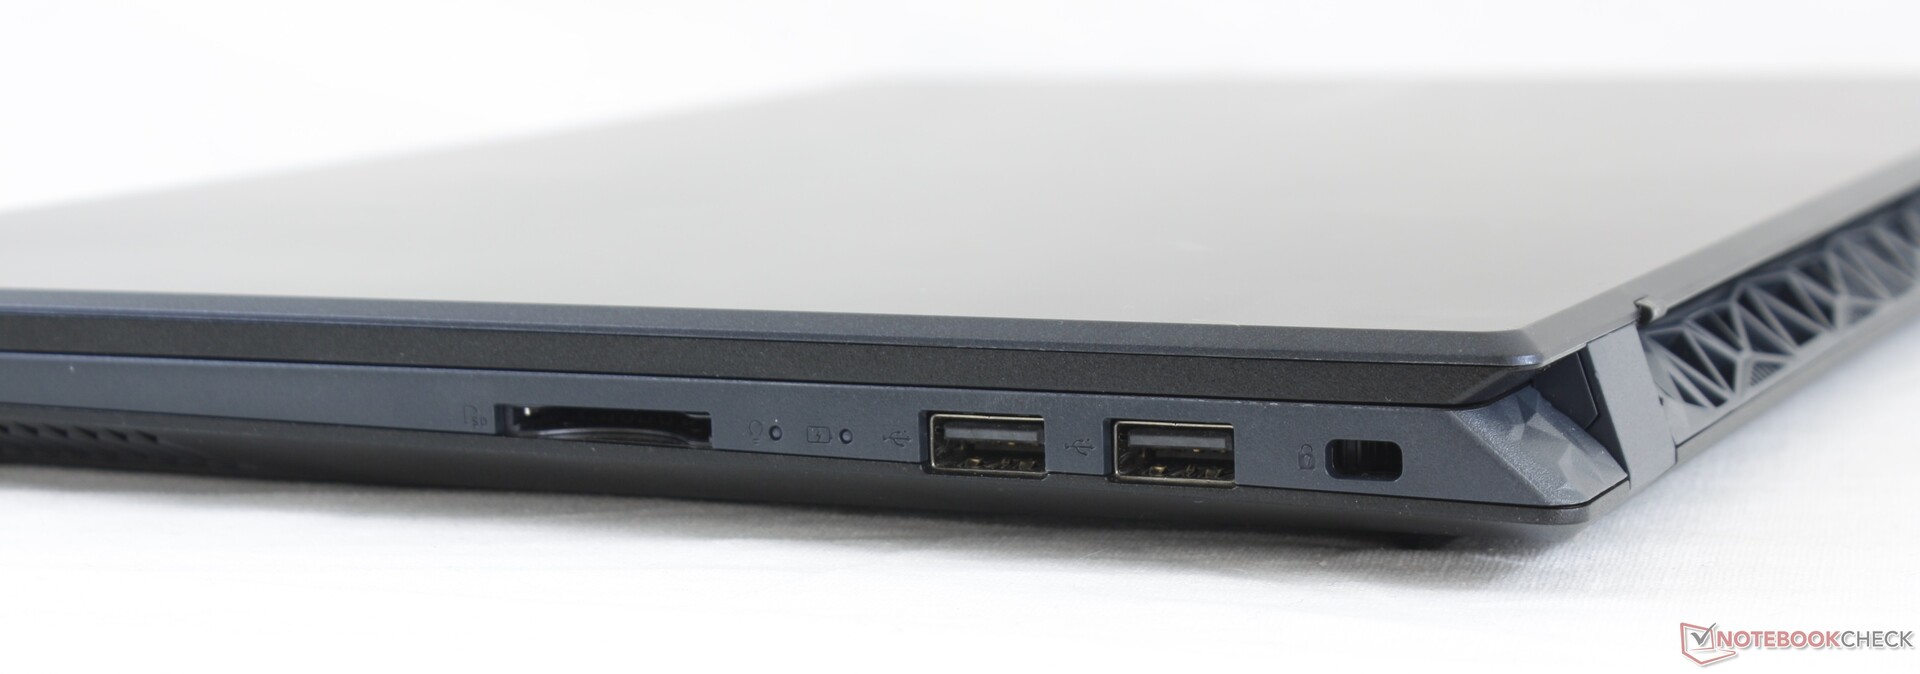
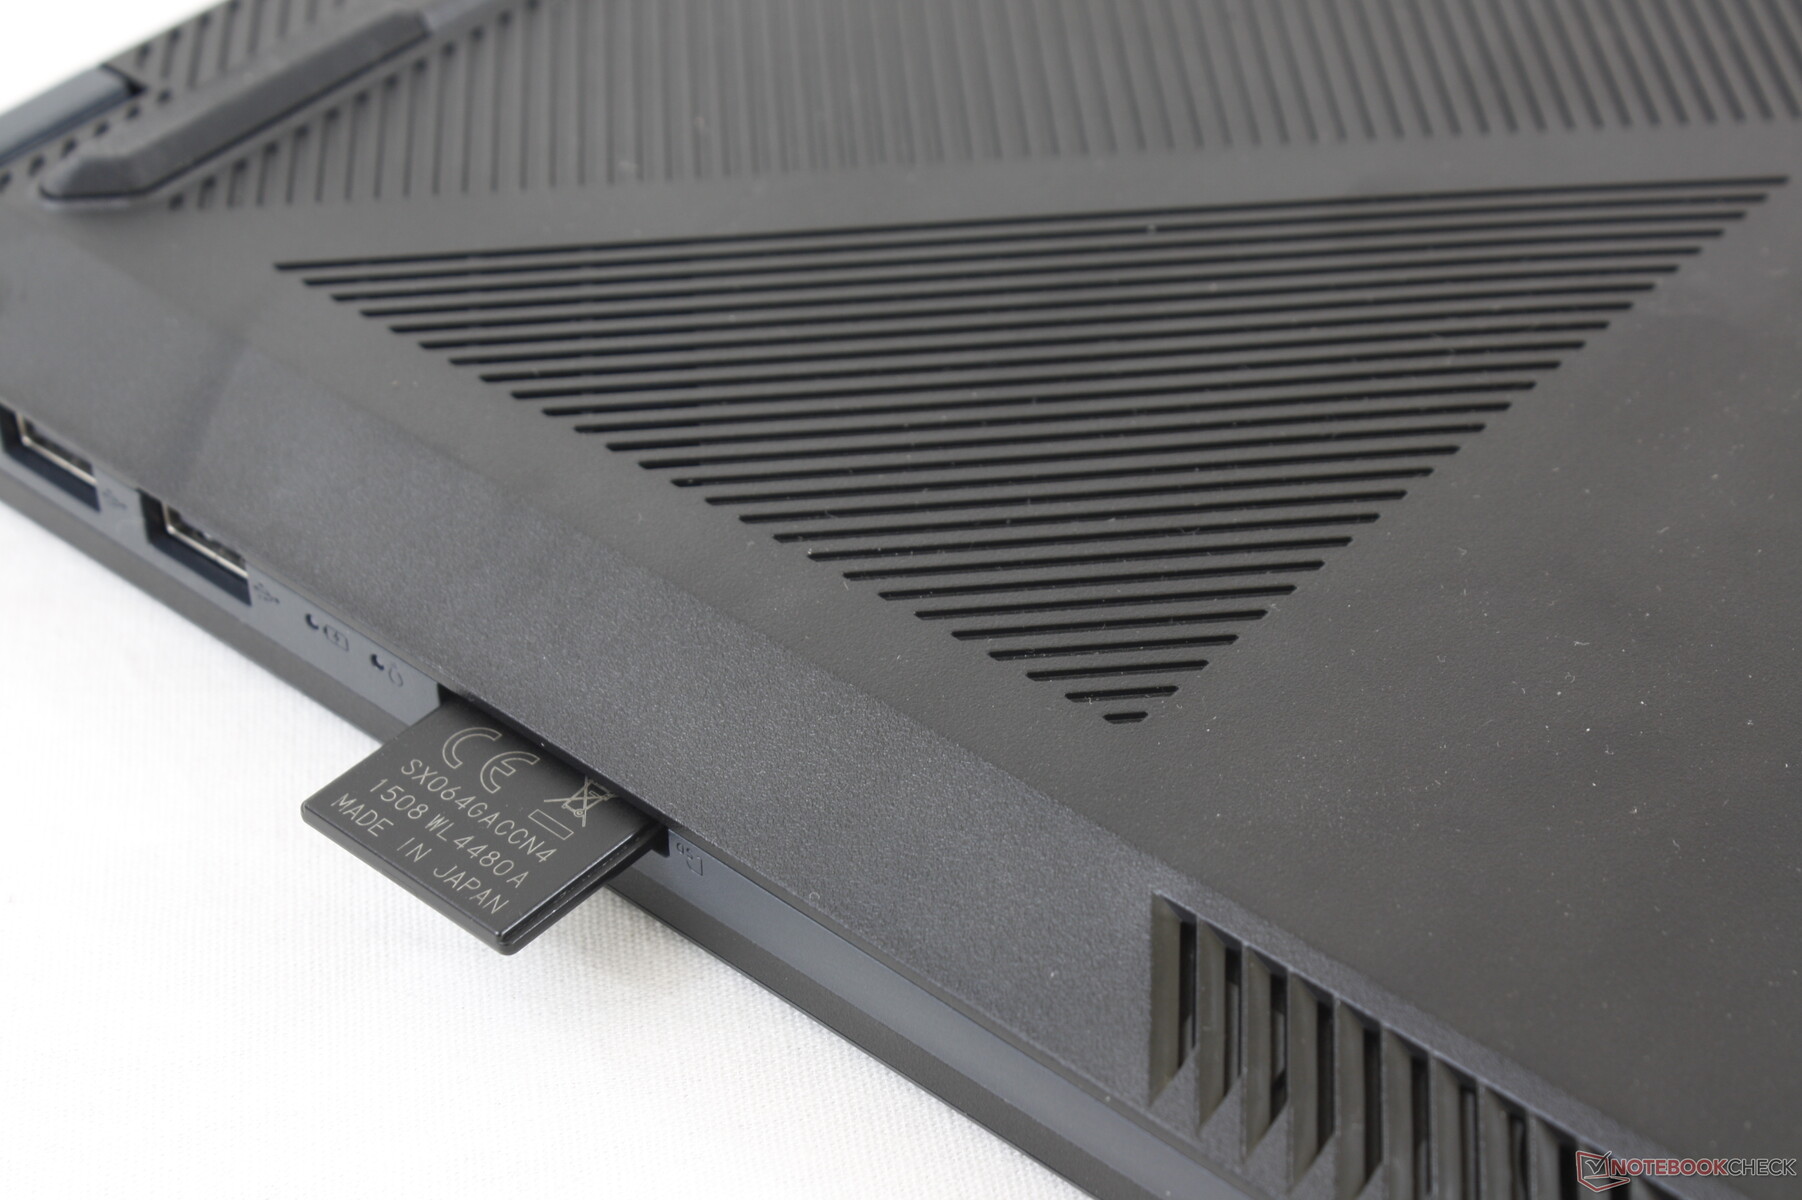
SD Kart Okuyucu
Aktarım hızları 20 MB / sn'nin biraz altında. 1 GB'lık resmi UHS-II test kartımızdan masaüstüne taşımak neredeyse tam bir dakika sürer.
| SD Card Reader | |
| average JPG Copy Test (av. of 3 runs) | |
| Lenovo Ideapad S540-15IML (Toshiba Exceria Pro SDXC 64 GB UHS-II) | |
| HP Envy 15-ep0098nr (Toshiba Exceria Pro M501 UHS-II) | |
| Dell Inspiron 15 5000 5585 (Toshiba Exceria Pro SDXC 64 GB UHS-II) | |
| Asus VivoBook 15 K571LI-PB71 (Toshiba Exceria Pro SDXC 64 GB UHS-II) | |
| maximum AS SSD Seq Read Test (1GB) | |
| HP Envy 15-ep0098nr (Toshiba Exceria Pro M501 UHS-II) | |
| Lenovo Ideapad S540-15IML (Toshiba Exceria Pro SDXC 64 GB UHS-II) | |
| Dell Inspiron 15 5000 5585 (Toshiba Exceria Pro SDXC 64 GB UHS-II) | |
| Asus VivoBook 15 K571LI-PB71 (Toshiba Exceria Pro SDXC 64 GB UHS-II) | |
İletişim
Intel AX201, Wi-Fi 6 ve Bluetooth 5.1 bağlantısı için standart olarak gelir. Netgear RAX200 test yönlendiricimize bağlanırken herhangi bir sorun yaşamadık.
| Networking | |
| iperf3 transmit AX12 | |
| HP Envy 15-ep0098nr | |
| Asus VivoBook 15 K571LI-PB71 | |
| Acer Aspire 5 A515-54G | |
| Dell Inspiron 15 5000 5585 | |
| Lenovo Ideapad S540-15IML | |
| iperf3 receive AX12 | |
| Asus VivoBook 15 K571LI-PB71 | |
| HP Envy 15-ep0098nr | |
| Acer Aspire 5 A515-54G | |
| Dell Inspiron 15 5000 5585 | |
| Lenovo Ideapad S540-15IML | |
Web kamerası


Bakım
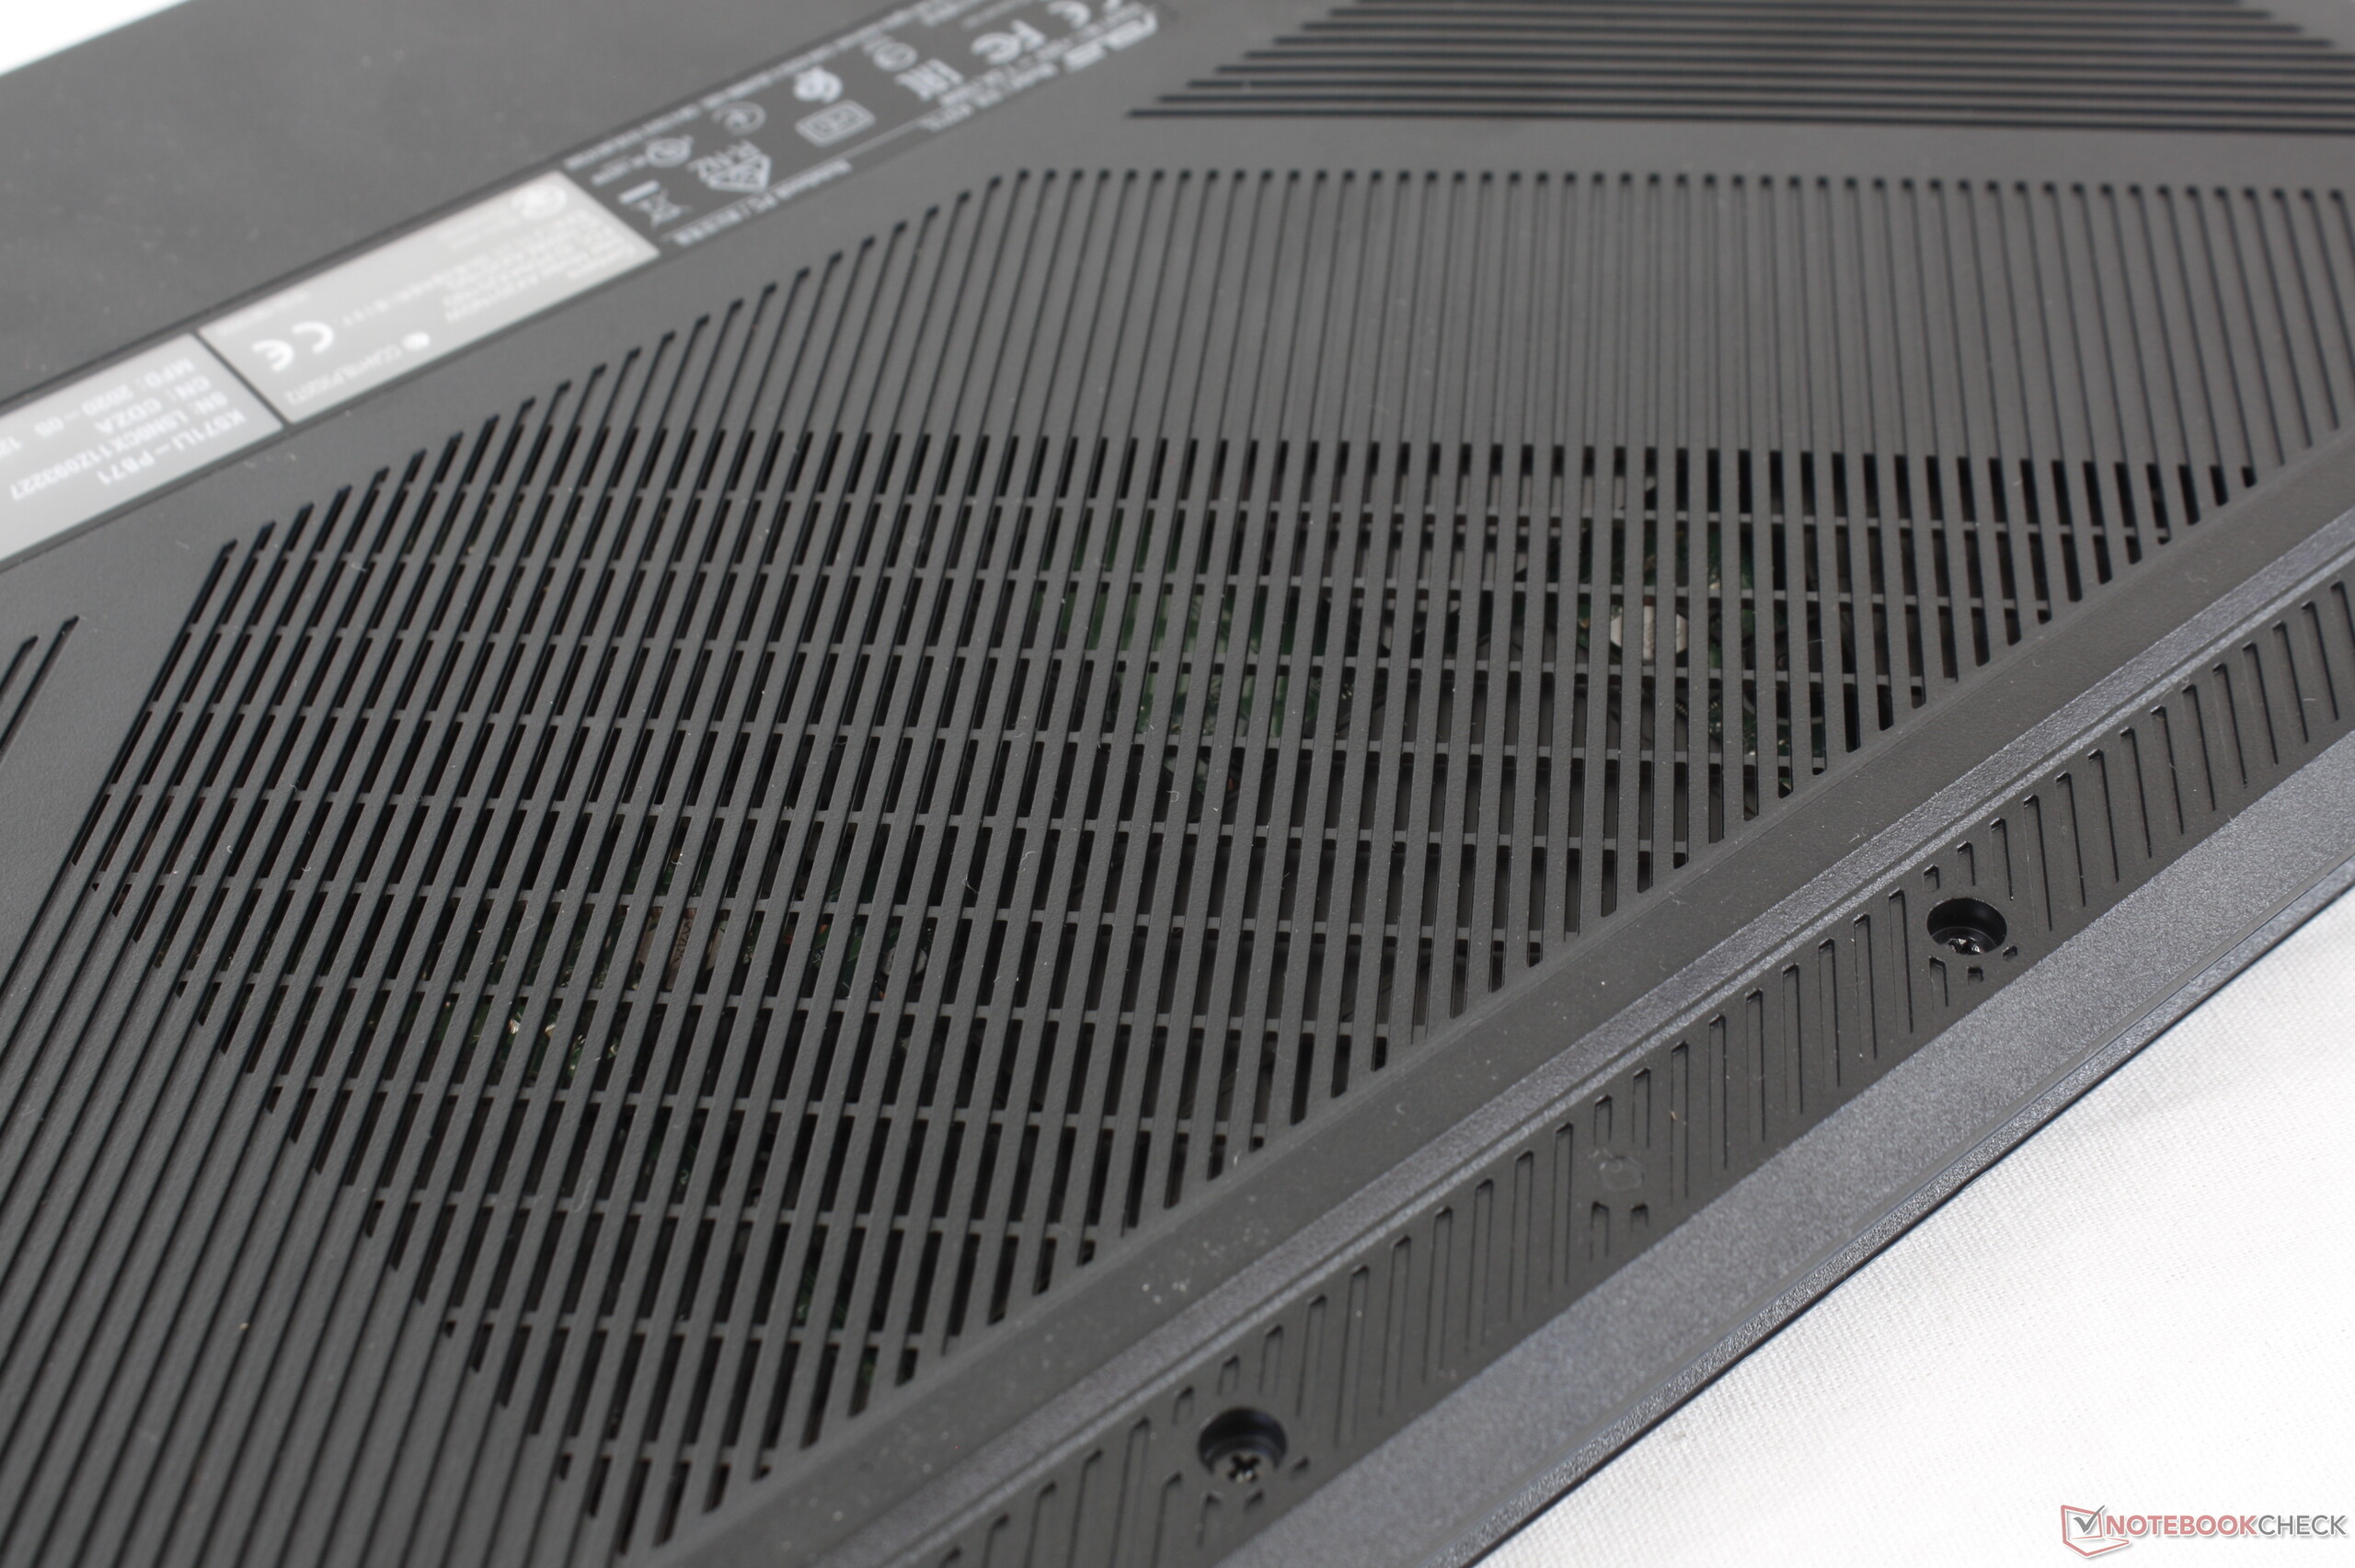
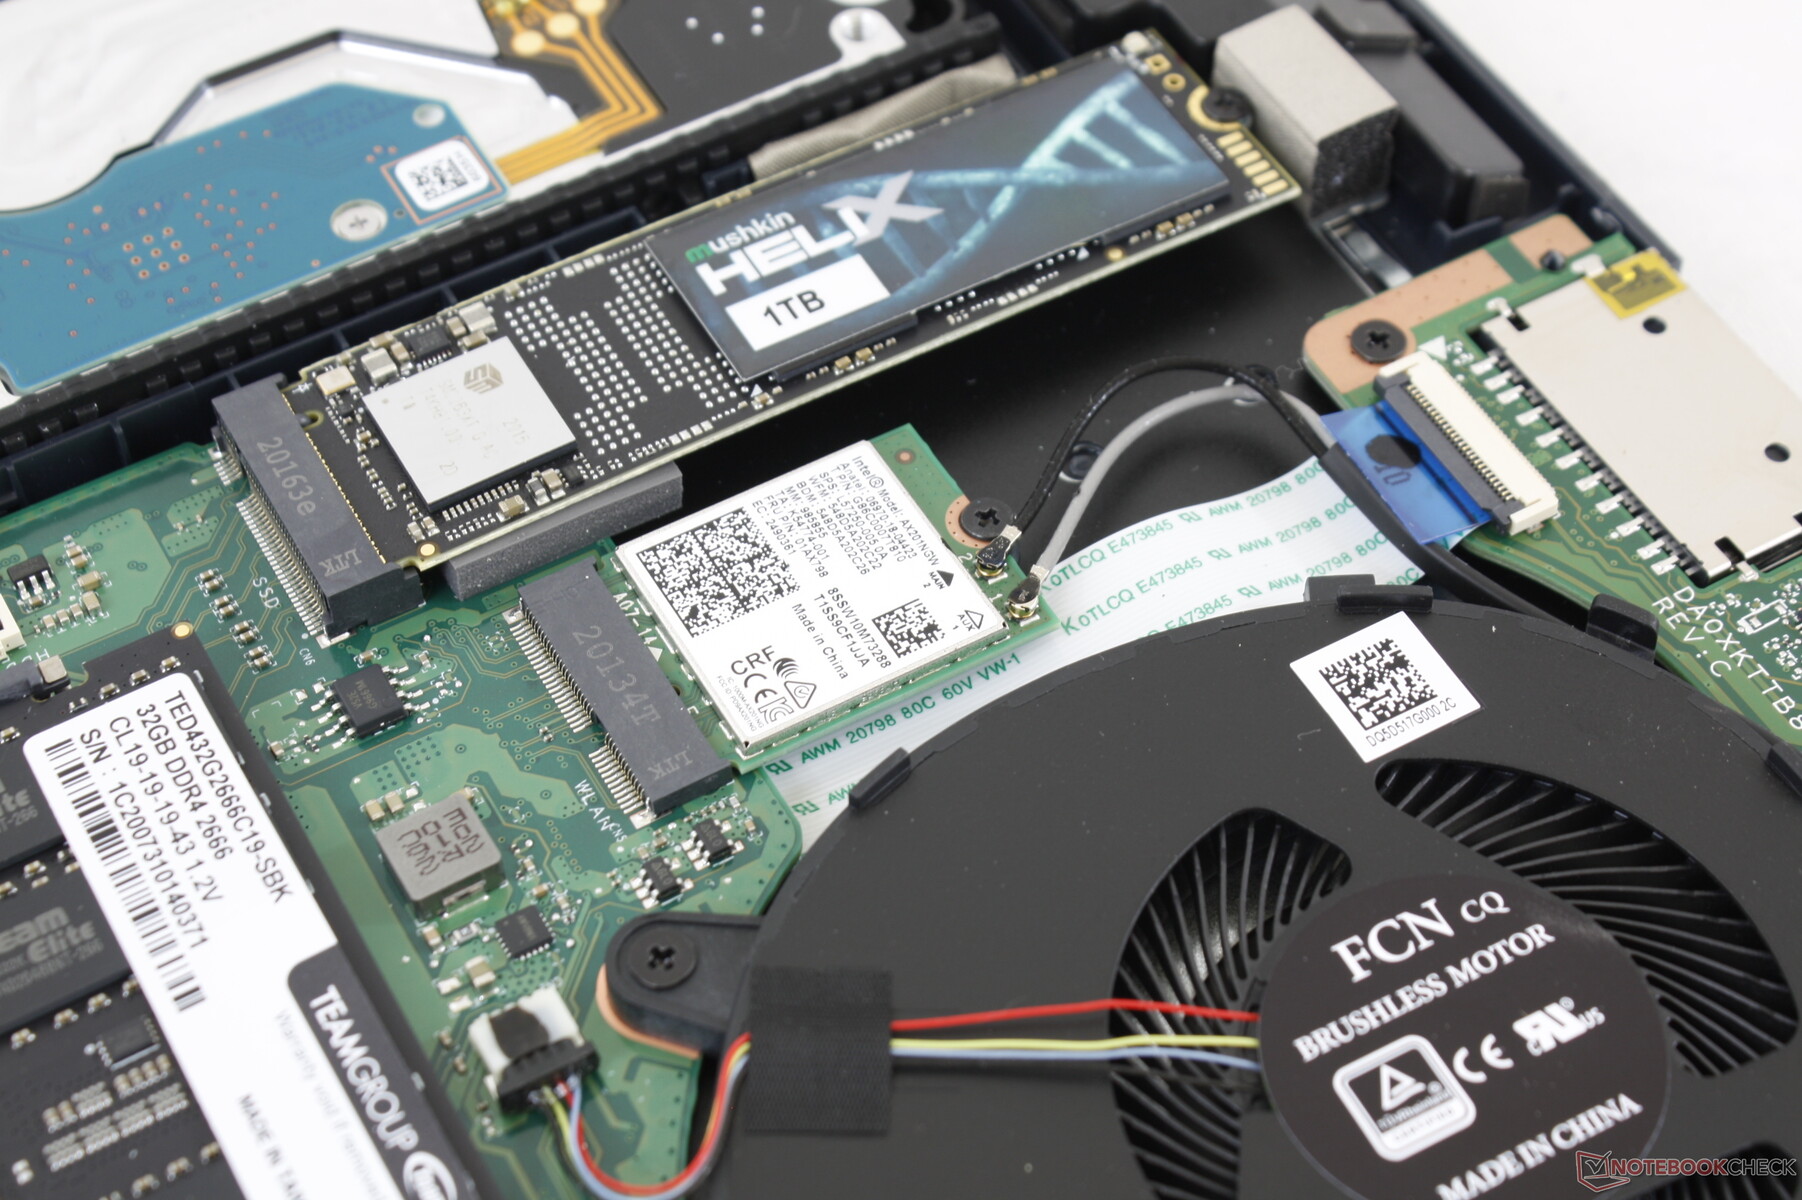
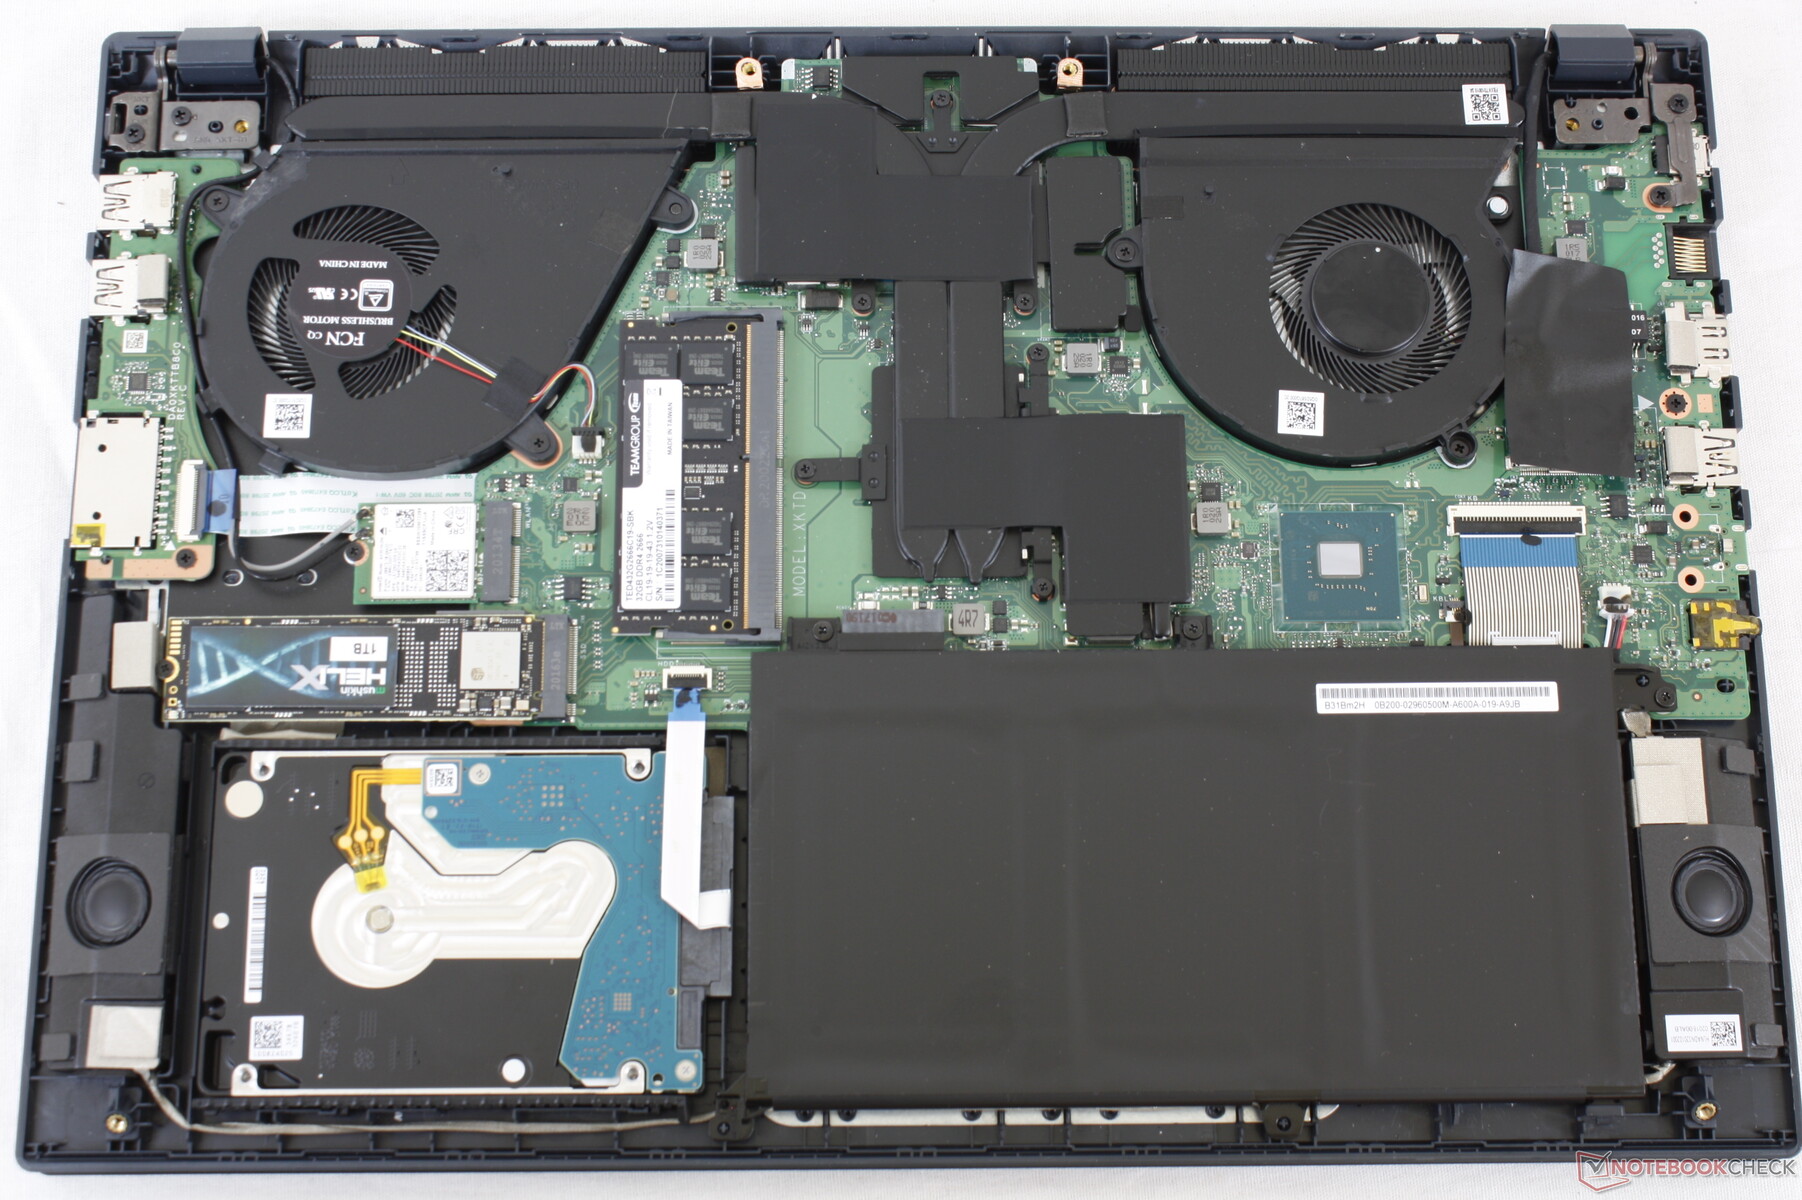
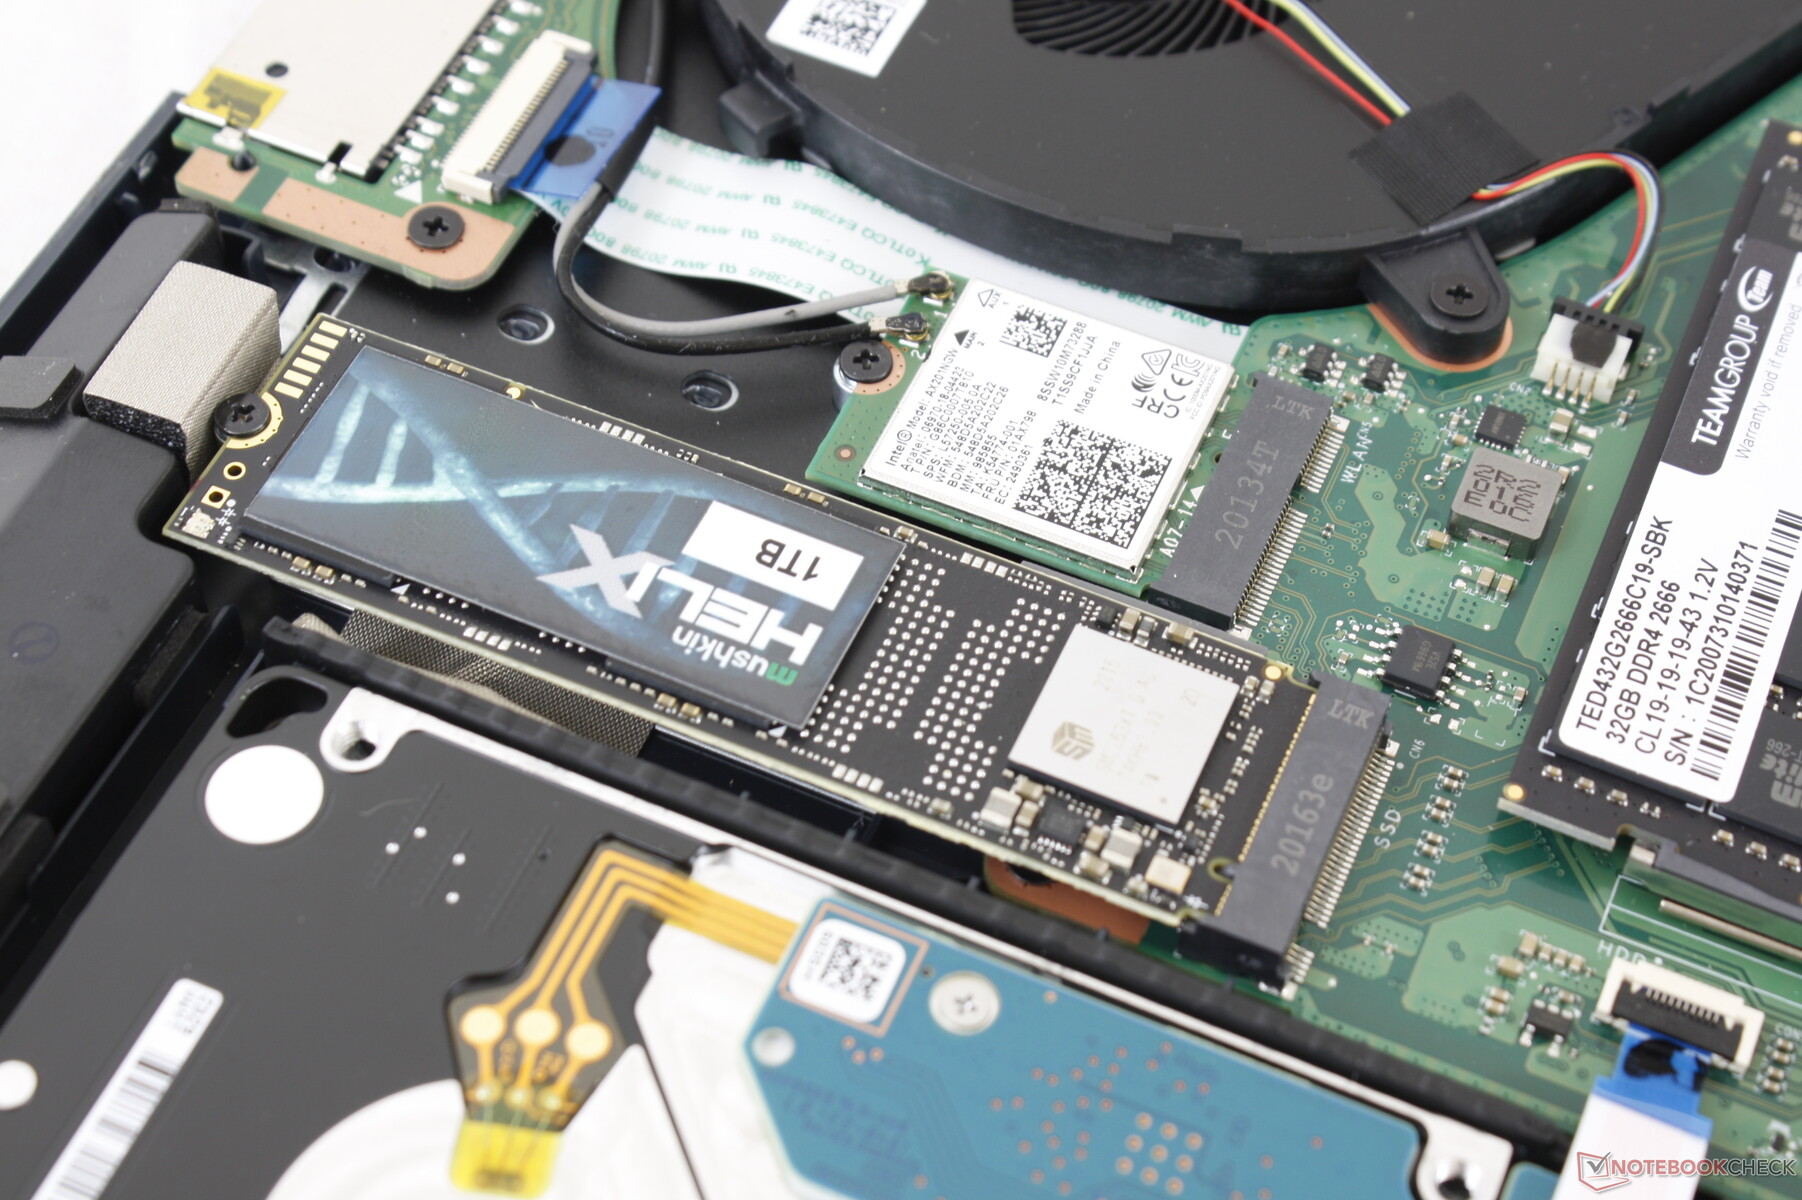
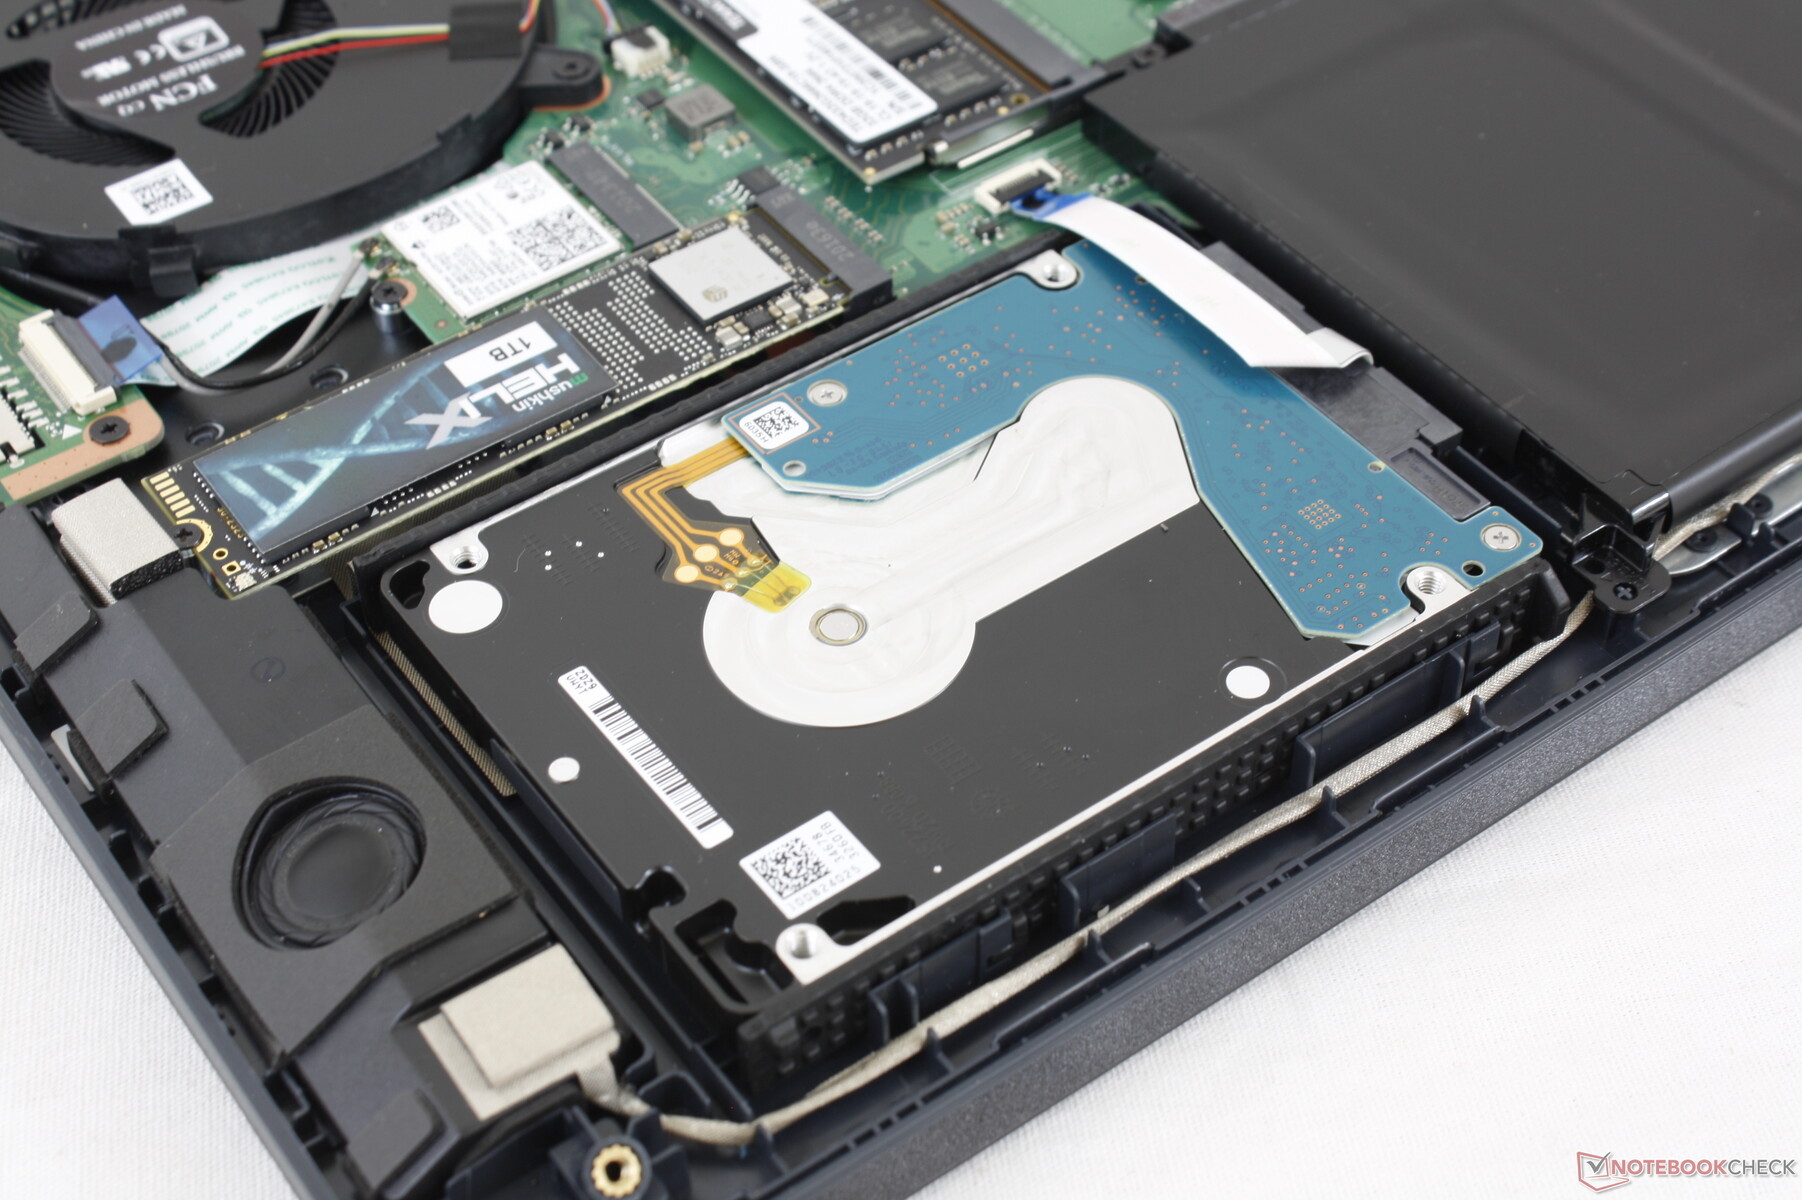
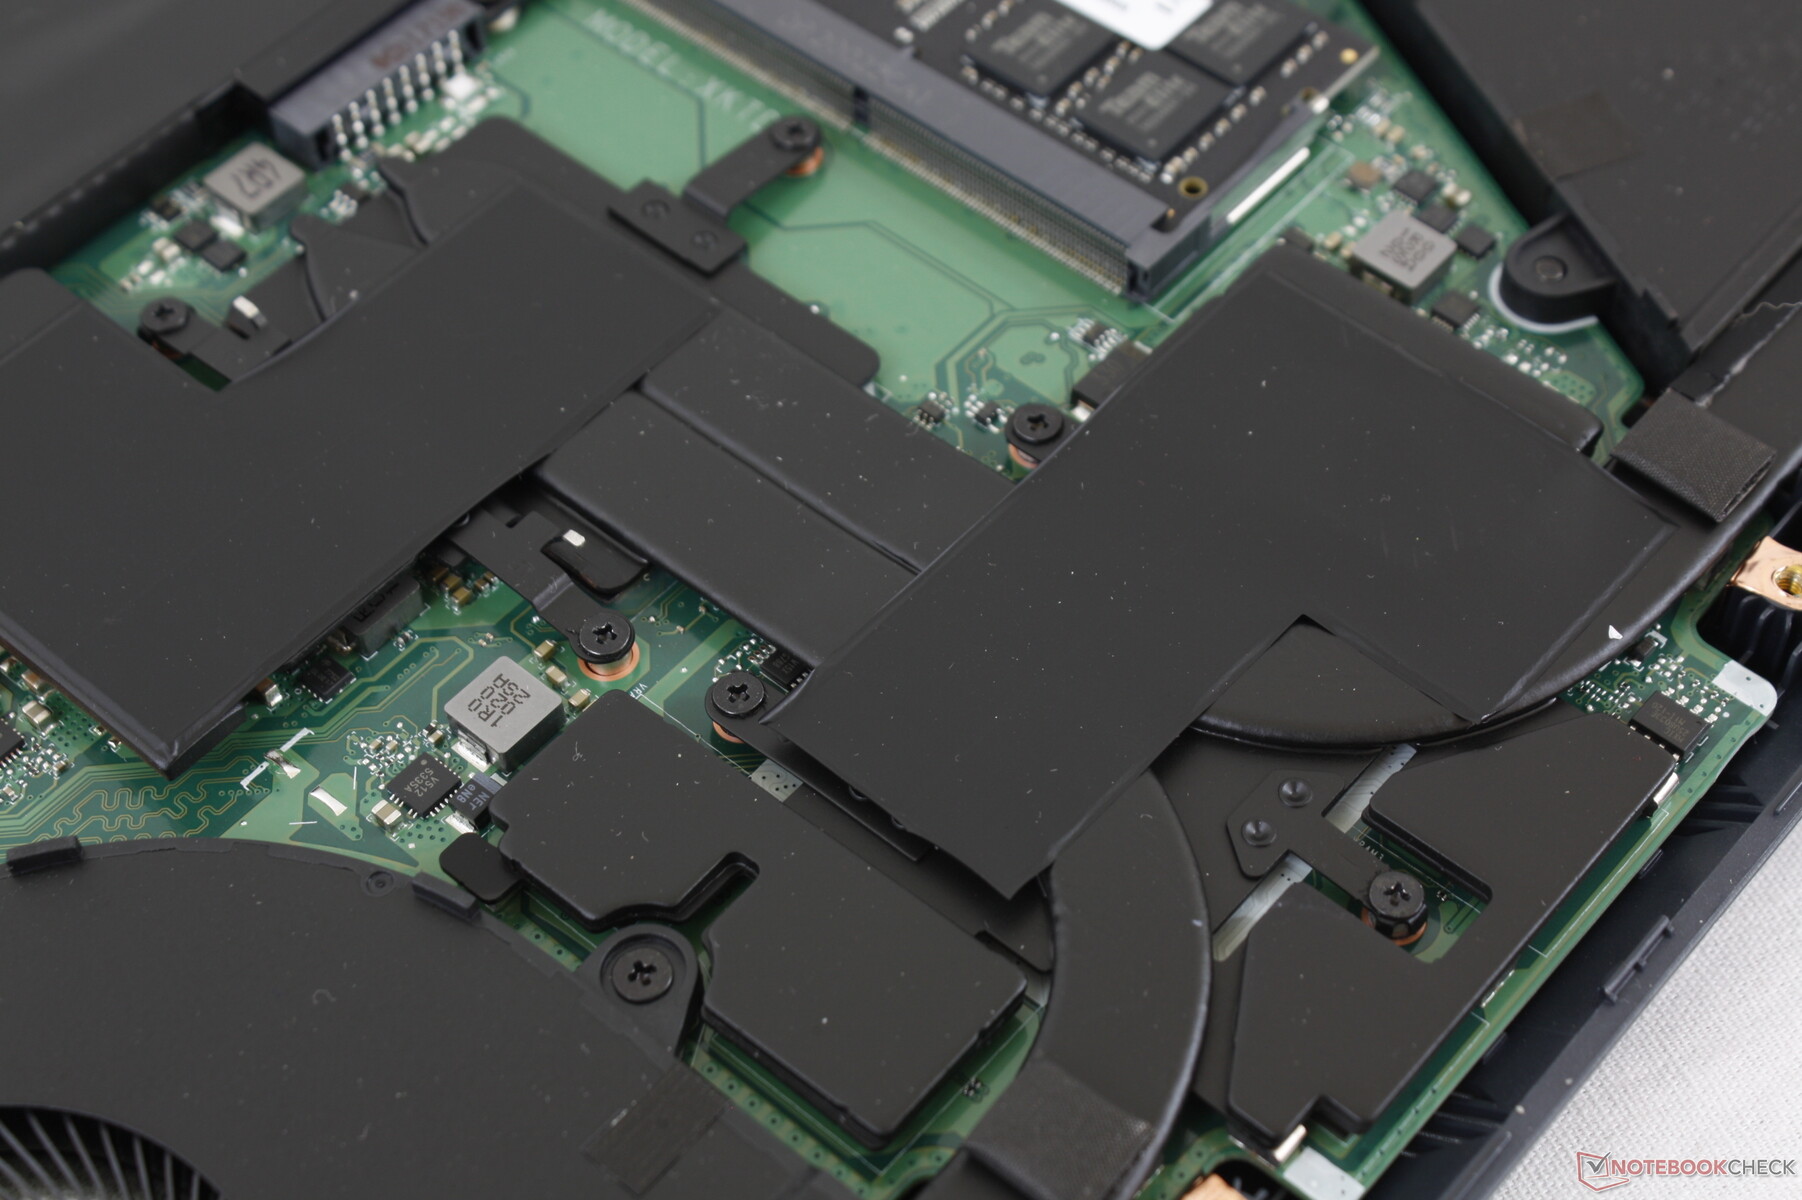
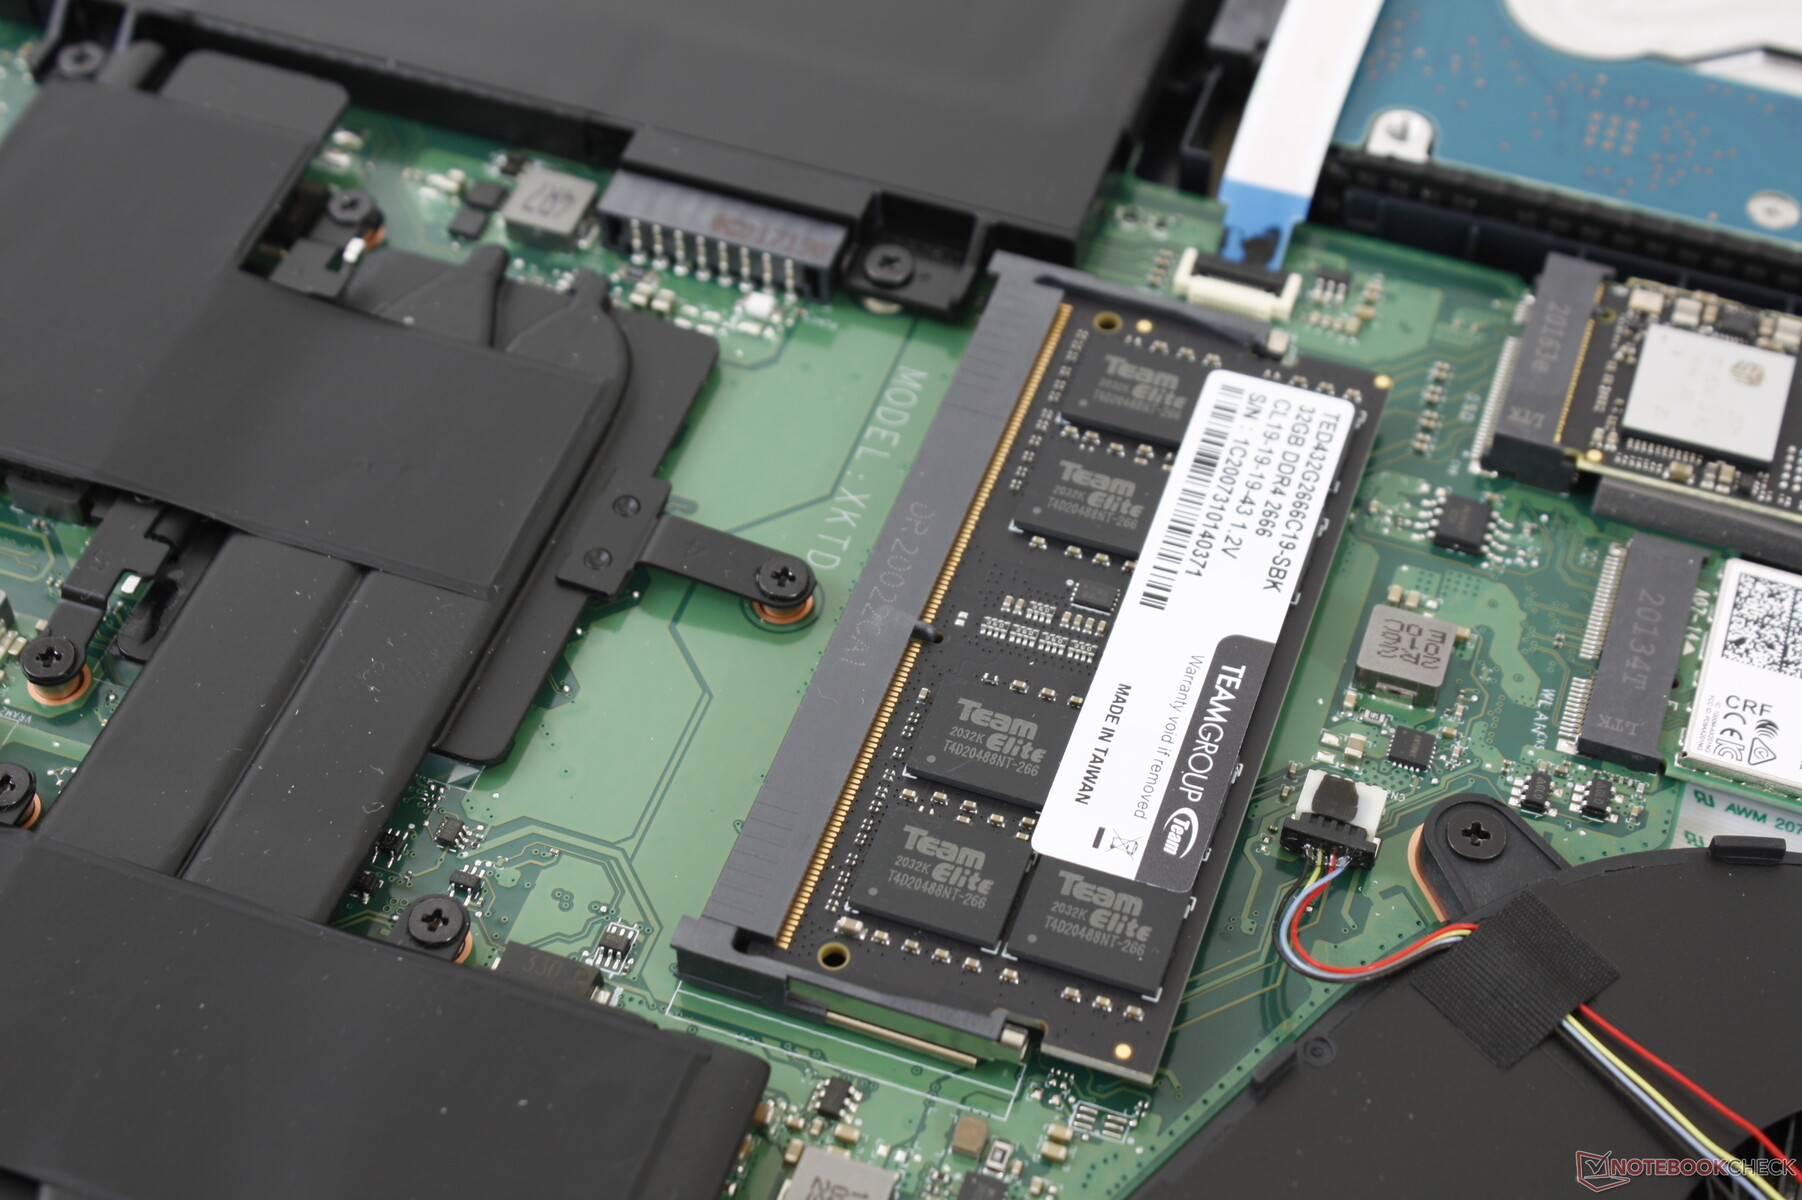
Alt panel, ikisi arka lastik ayakların altına gizlenmiş altı vidayla sabitlenmiştir. Kullanıcılar ana bataryaya, SODIMM yuvasına, WLAN modülüne ve her iki depolama bölmesine doğrudan erişime sahiptir.
Aksesuarlar ve Garanti
Kutuda AC adaptörü ve evrak dışında hiçbir ekstra yok. Standart bir yıllık sınırlı garanti, CUKUSA tarafından kurulan bağımsız bileşenler üç yıl süreyle geçerlidir.
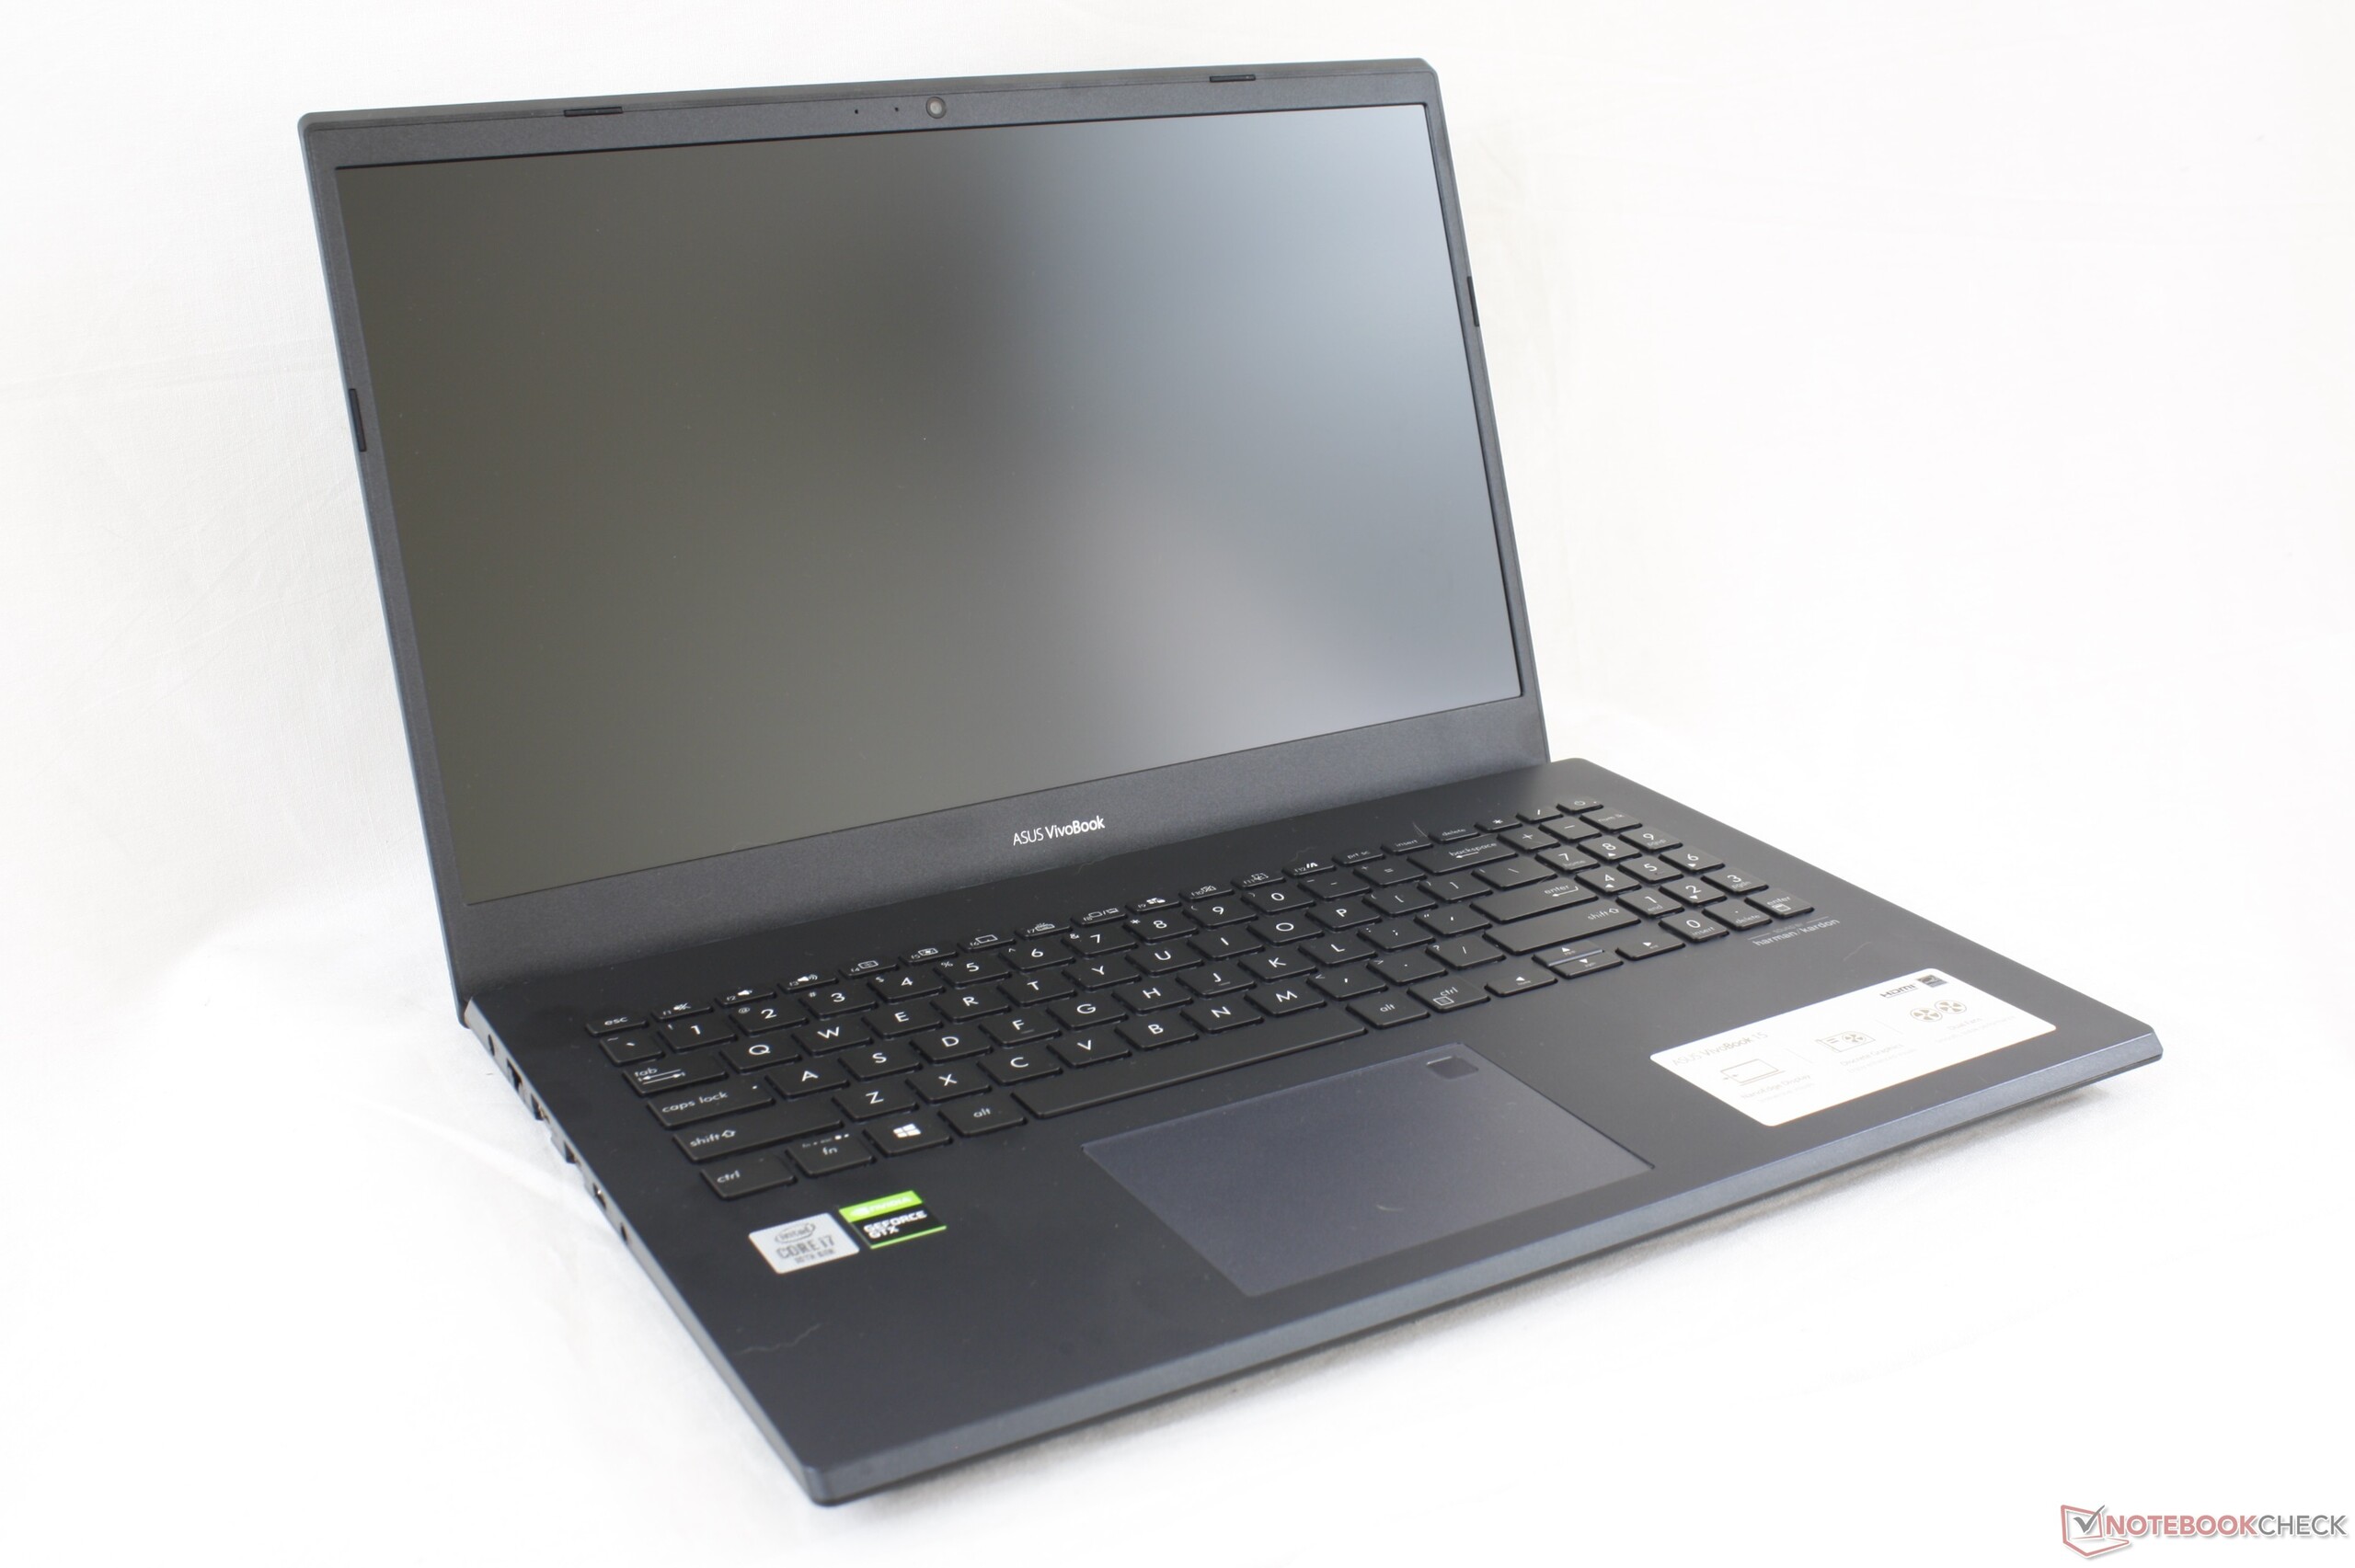
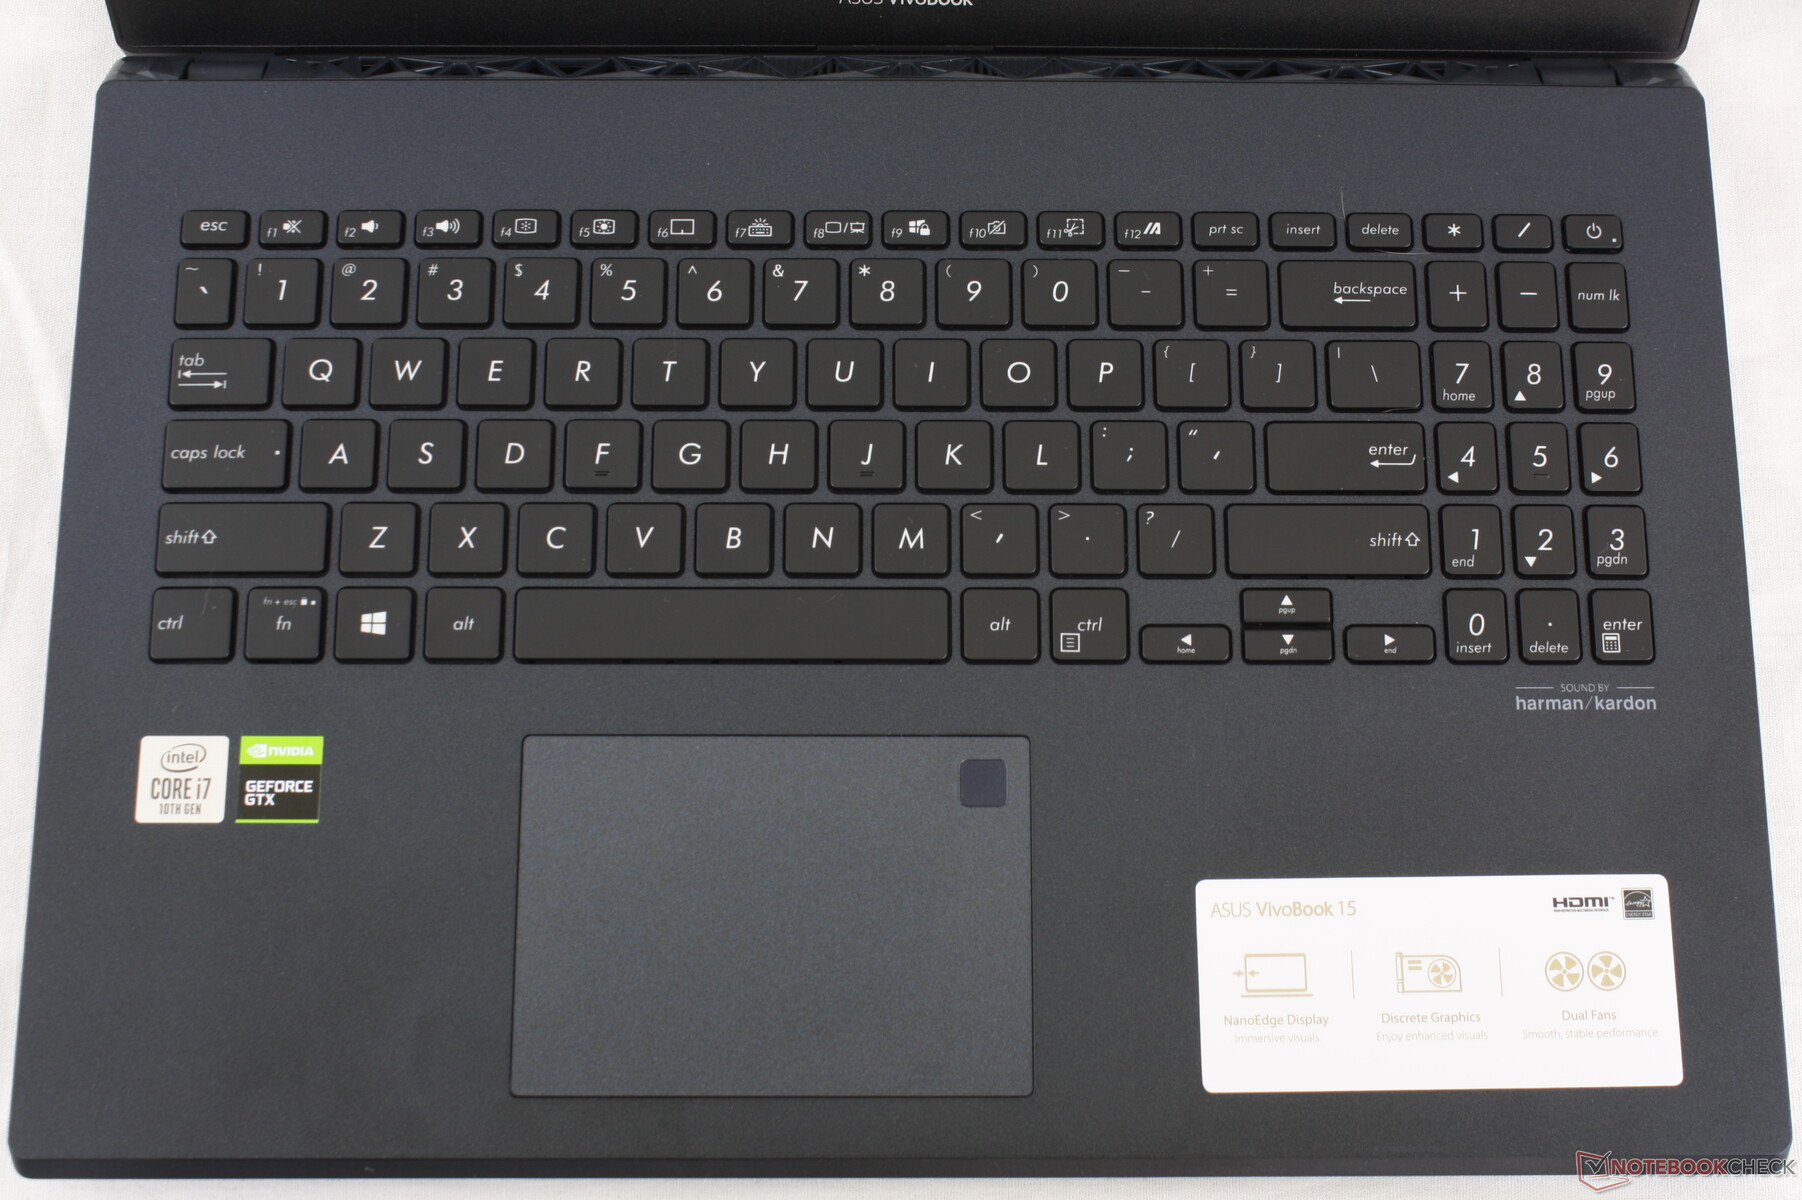
Giriş cihazları
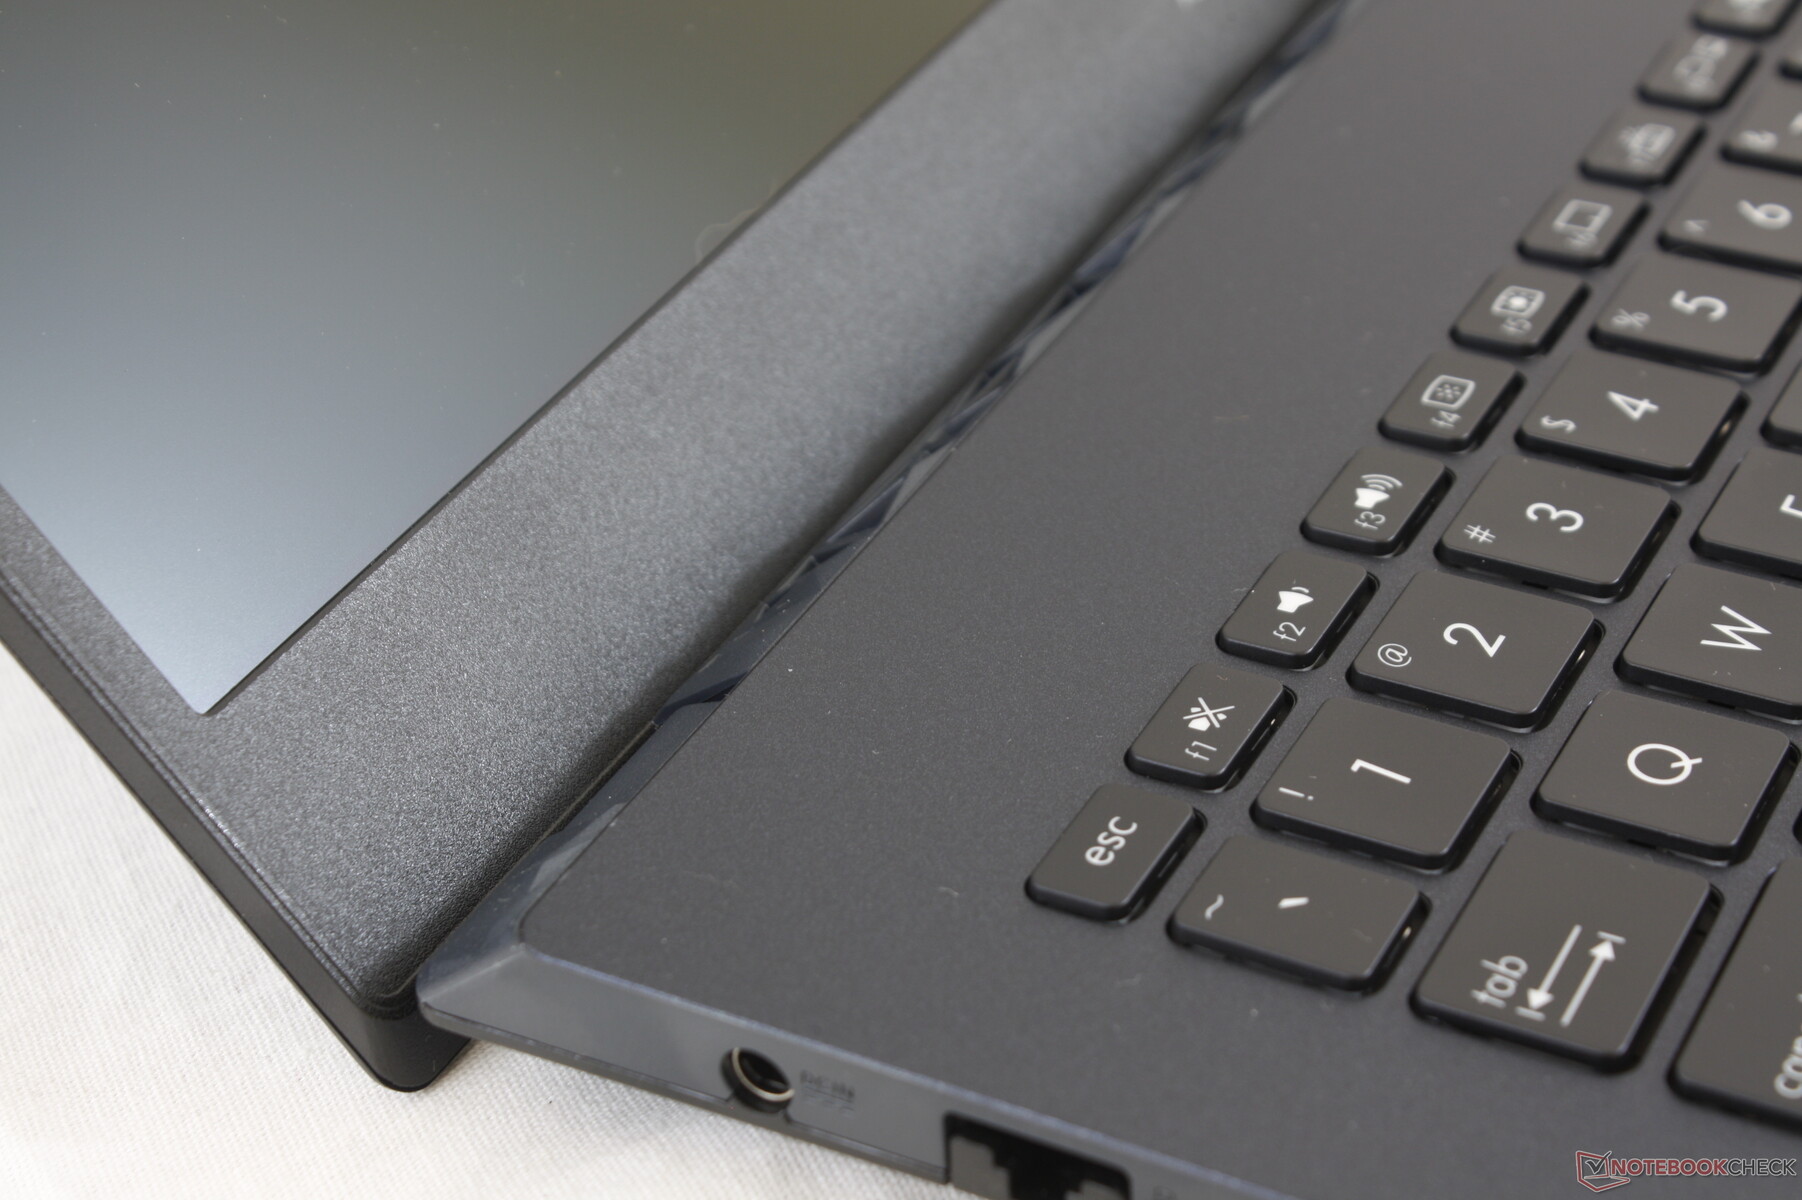
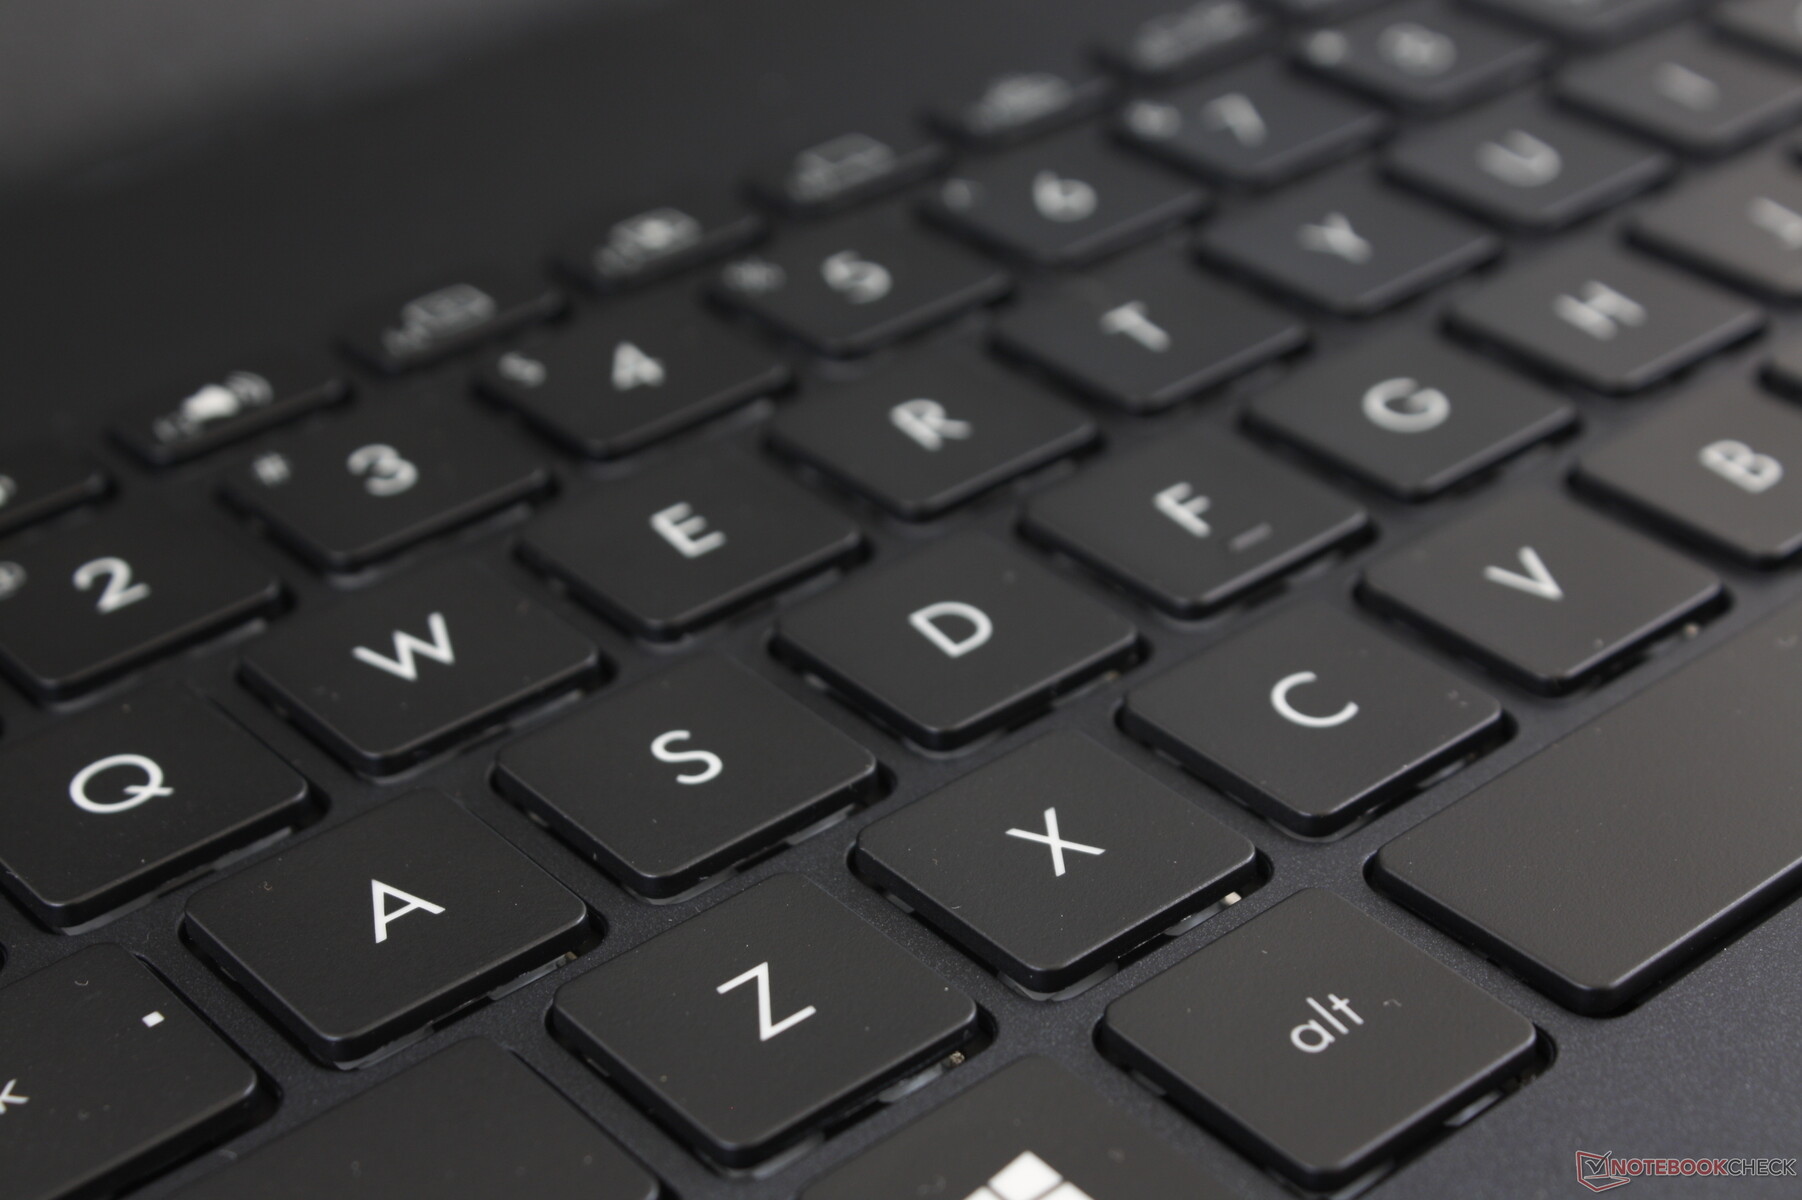
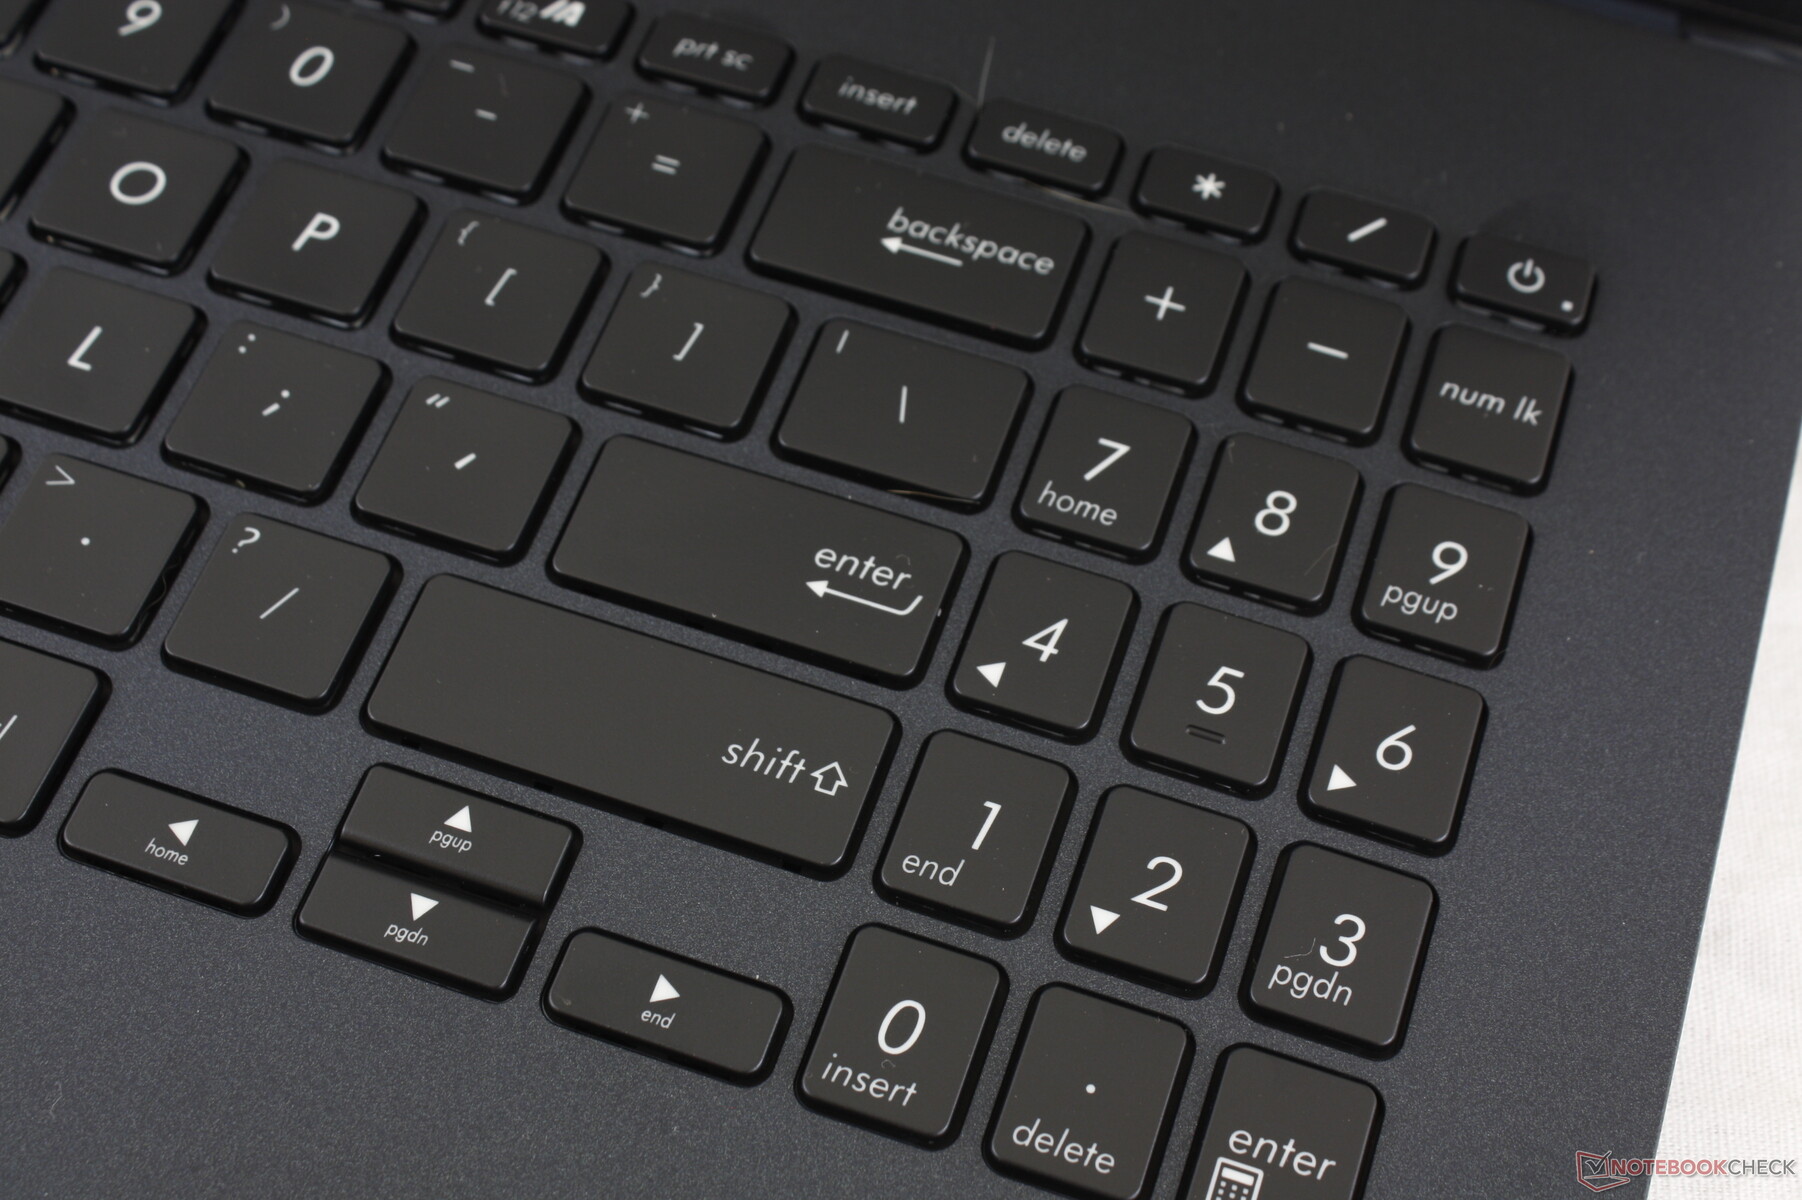
Arkadan aydınlatmalı klavyede KeyboardType, tatmin edici tuş geribildirimi ve sığ seyahatiyle rahattır. Hala HP Envy, Spectre, MSI SteelSeries veya Lenovo ThinkPad T serisinin daha sıkı ve daha derin tuşlarını tercih ediyoruz, ancak bu tür dizüstü bilgisayarlar da çok daha pahalı. Bununla birlikte, ok tuşlarına ve NumPad tuşlarına güvenirseniz, bu entegre tuşlar ana QWERTY tuşlarından daha süngerimsi ve daha küçük olduğundan, bir USB klavyeyle daha iyi durumda olursunuz.
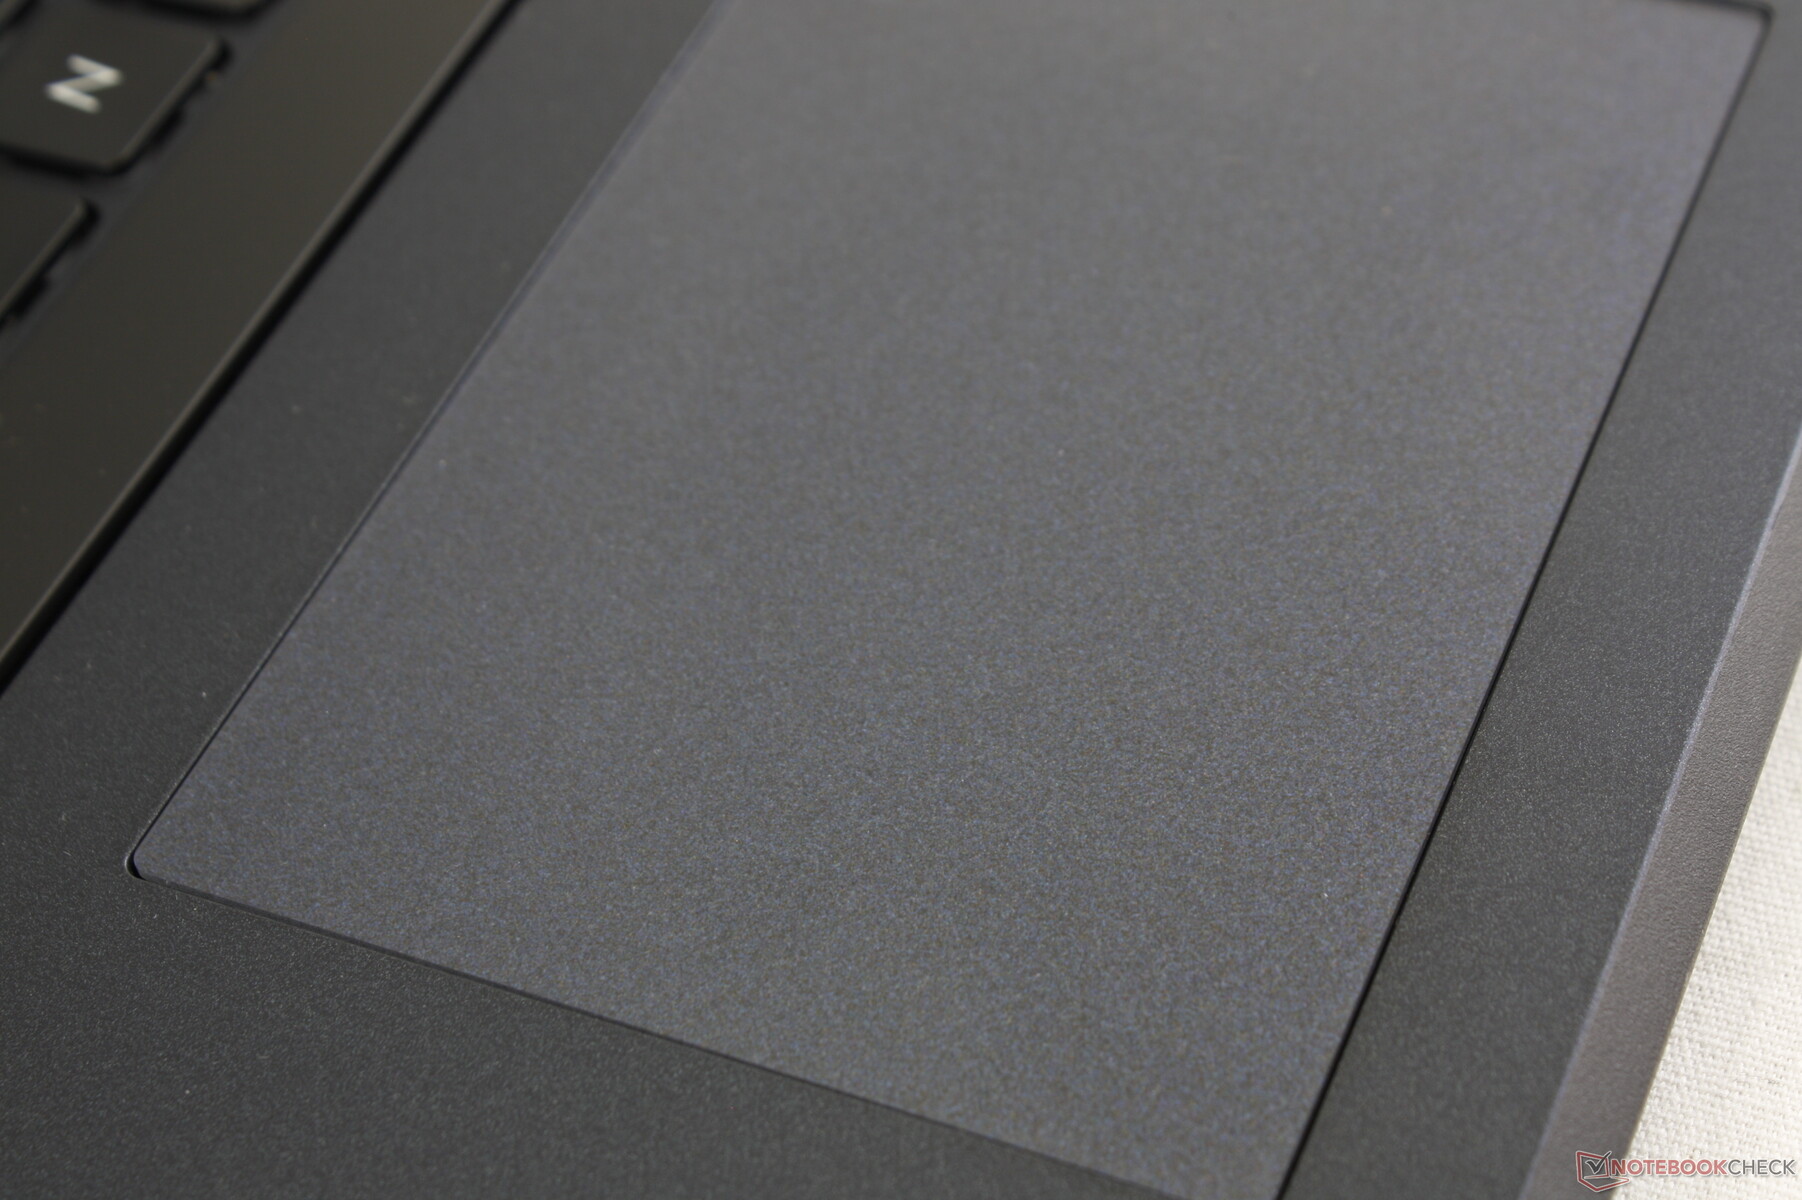
Dokunmatik yüzey
Düzgün tıklama paneli (10,5 x 7,5 cm), HP Envy 15'tekinden (12,5 x 7,5 cm) daha küçüktür. Yavaş hızlarda süzülürken doğru miktarda yapışma ile temel imleç kontrolü için yeterince iyi çalışıyor, ancak entegre fare düğmeleri daha sıkı olabilirdi. Sürükle ve bırak eylemleri, yüzeyde iki veya daha fazla parmak varken imleç bazen yerinde zıplayacağı veya donacağı için zorlaştırılır. Çoklu dokunma tanıma özelliği bu açıdan kesinlikle daha iyi olabilir.
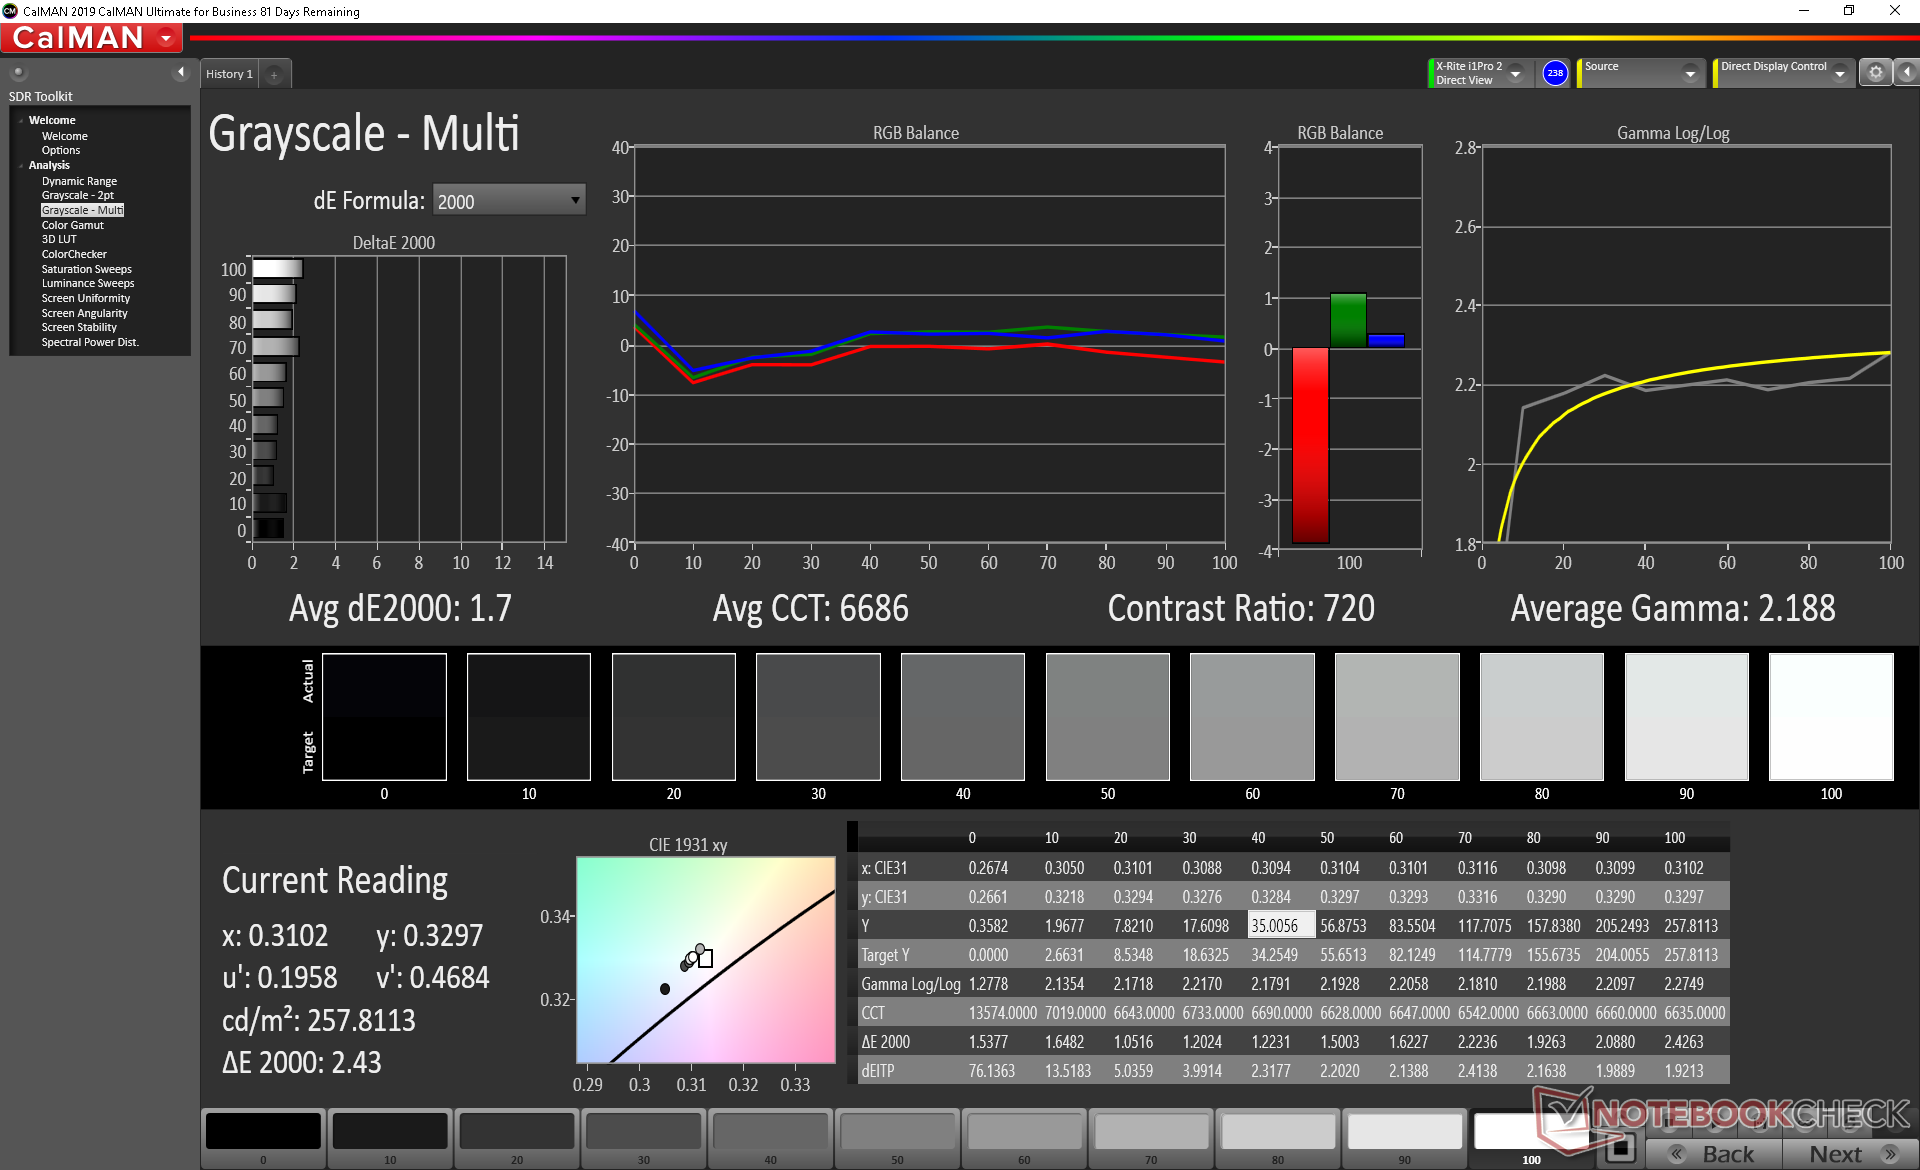
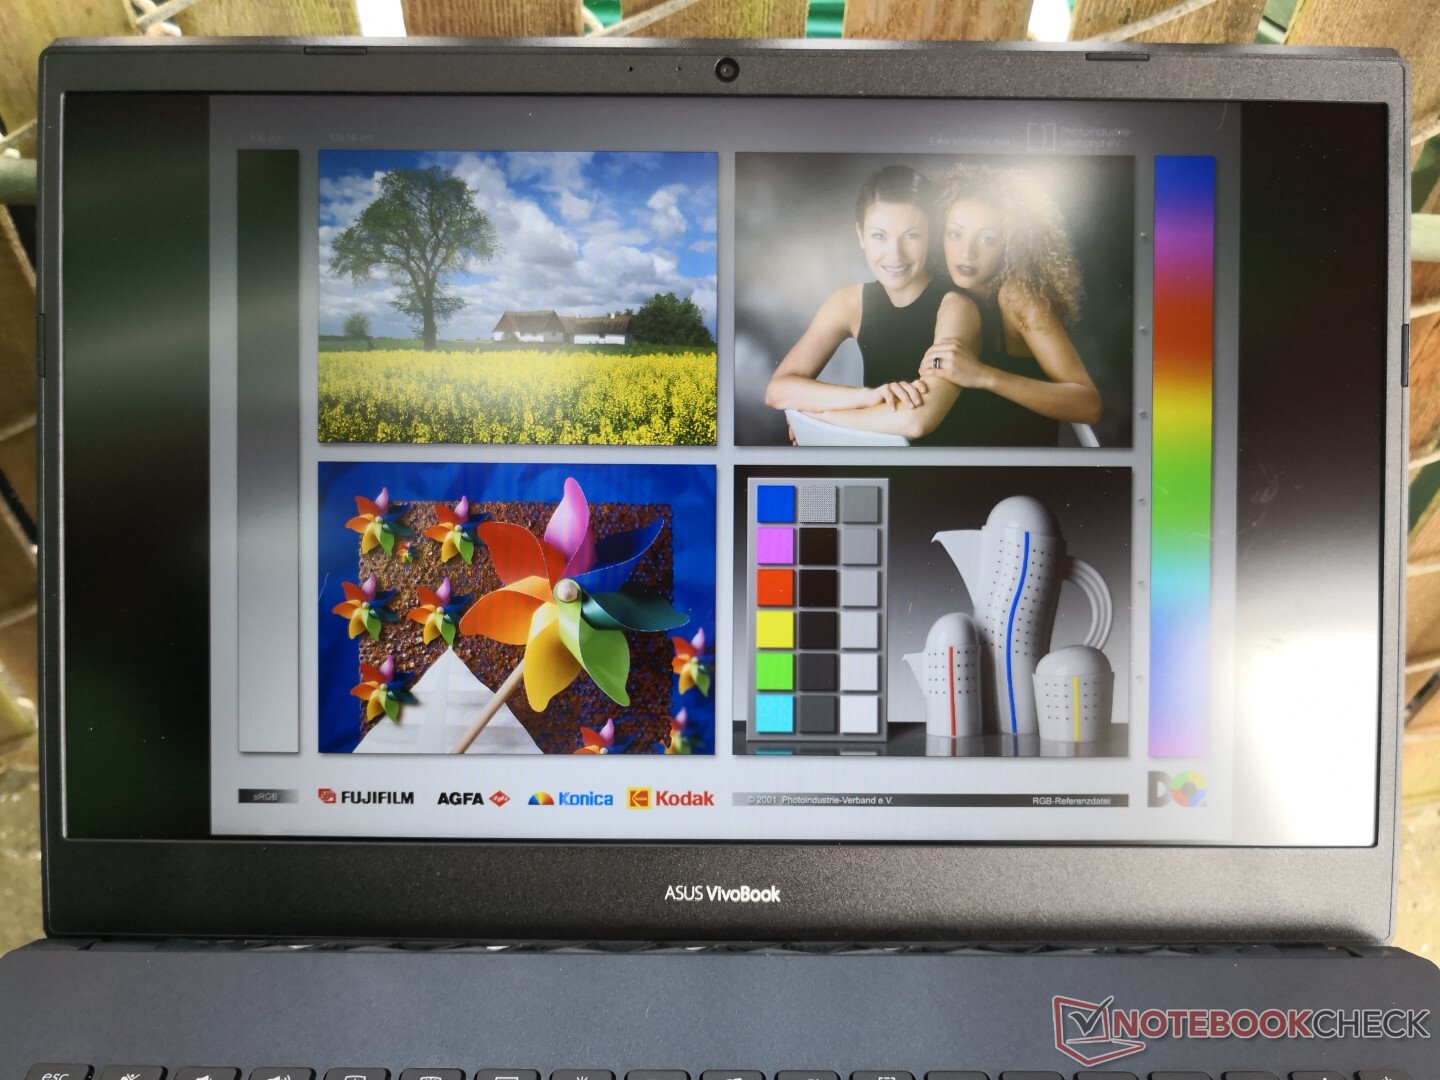
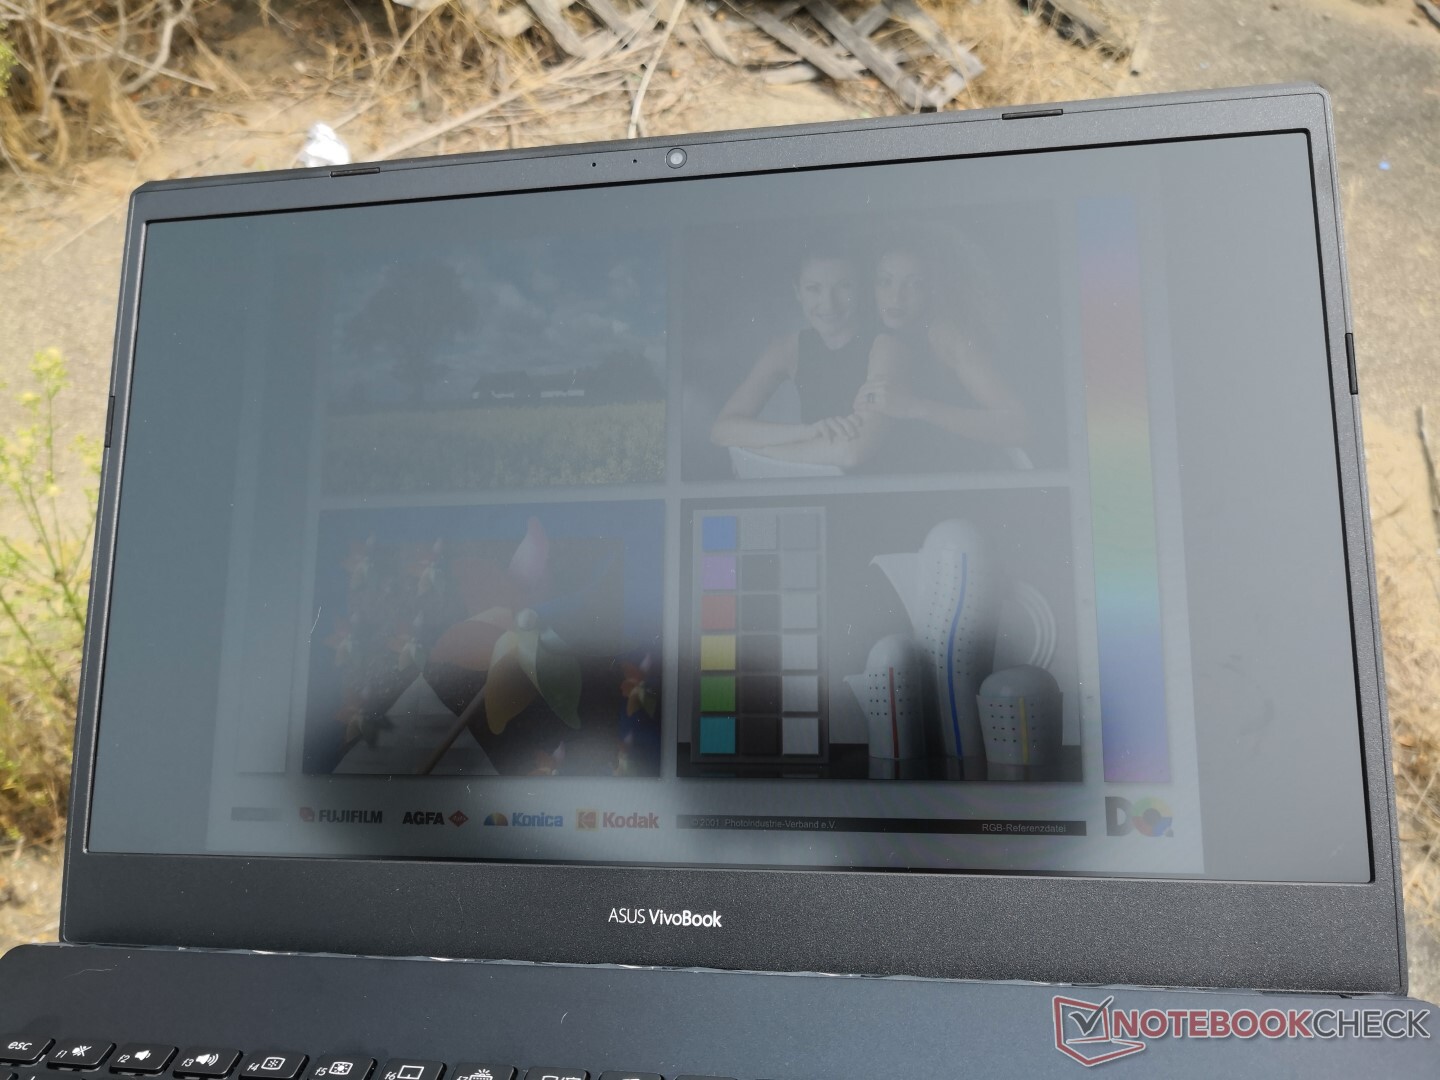
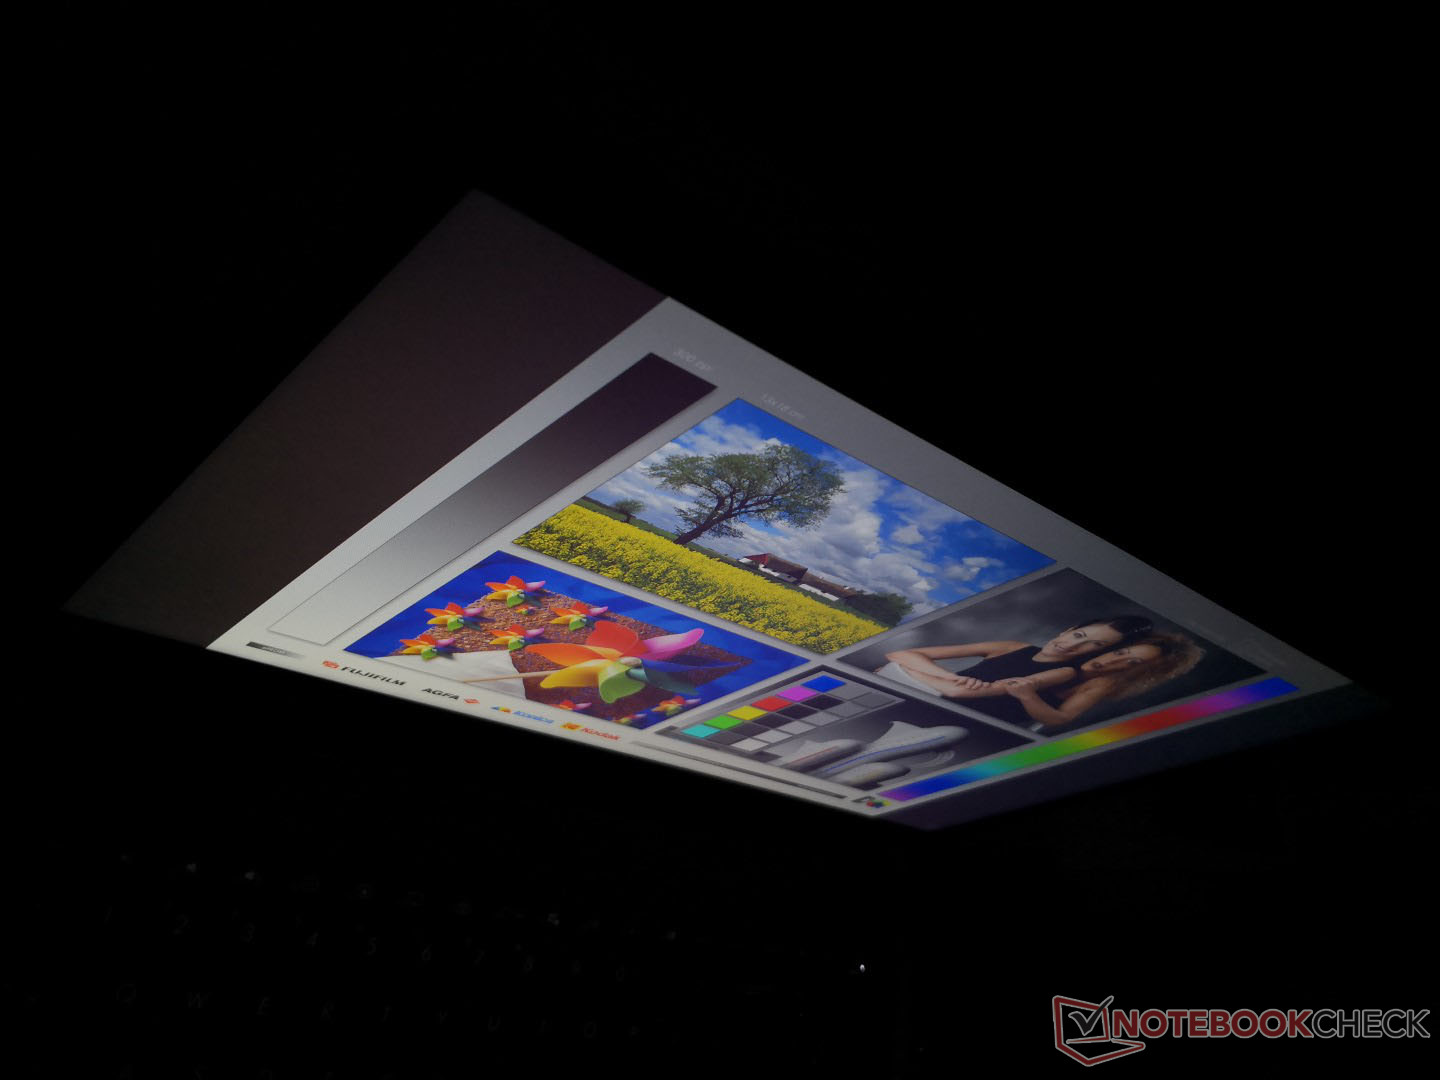
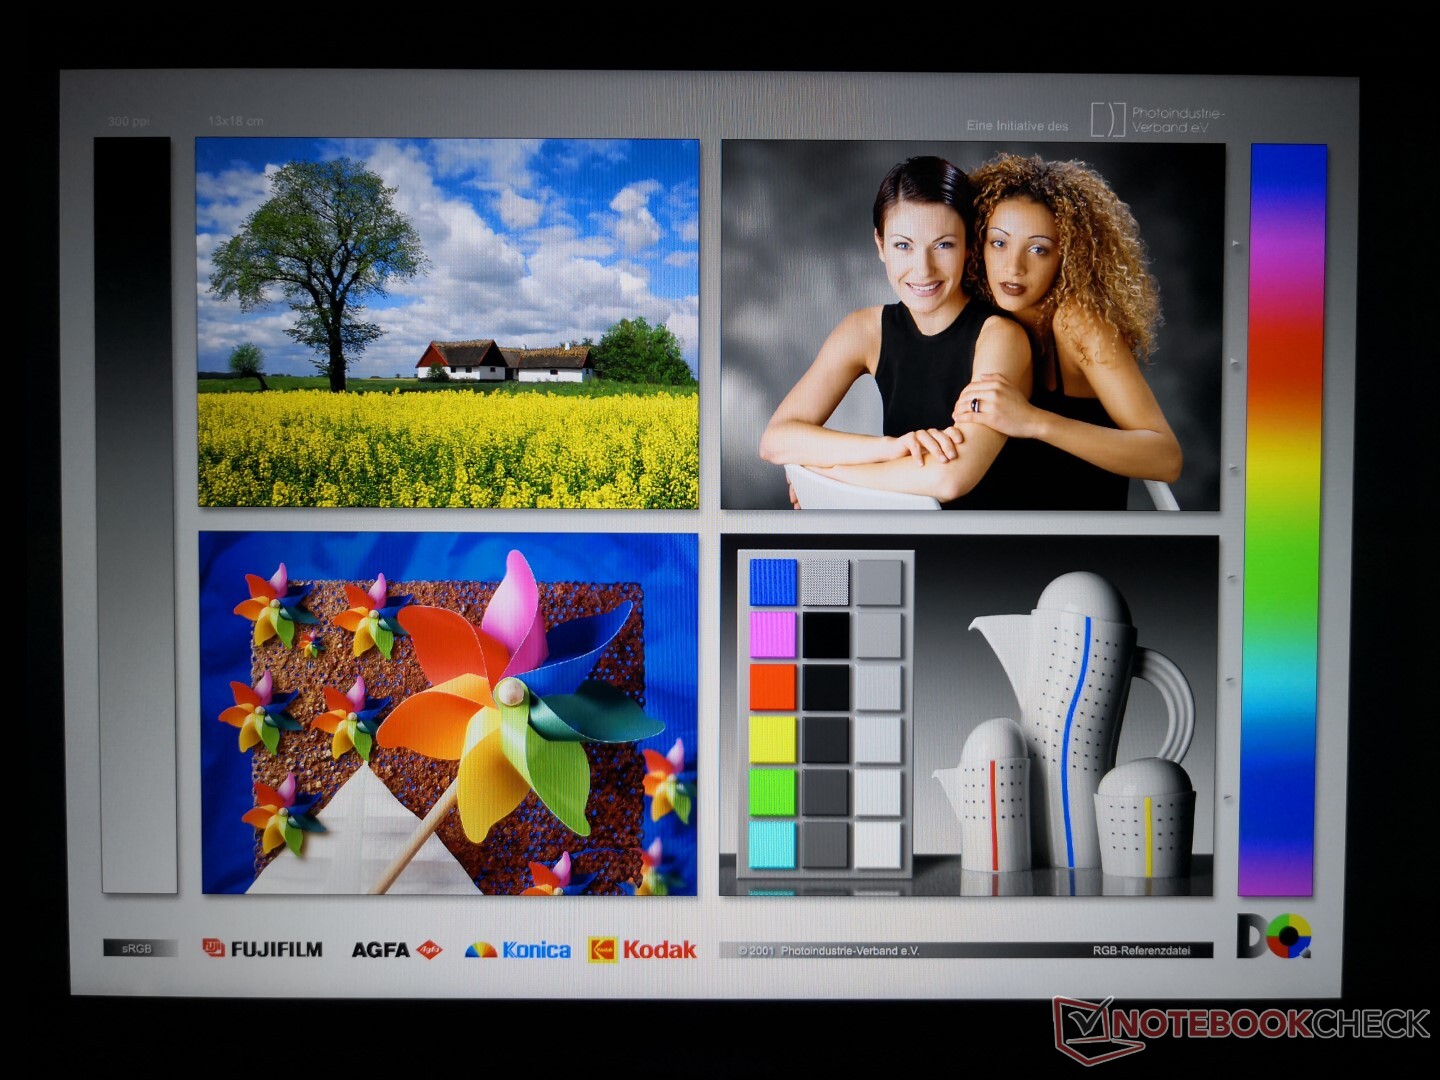
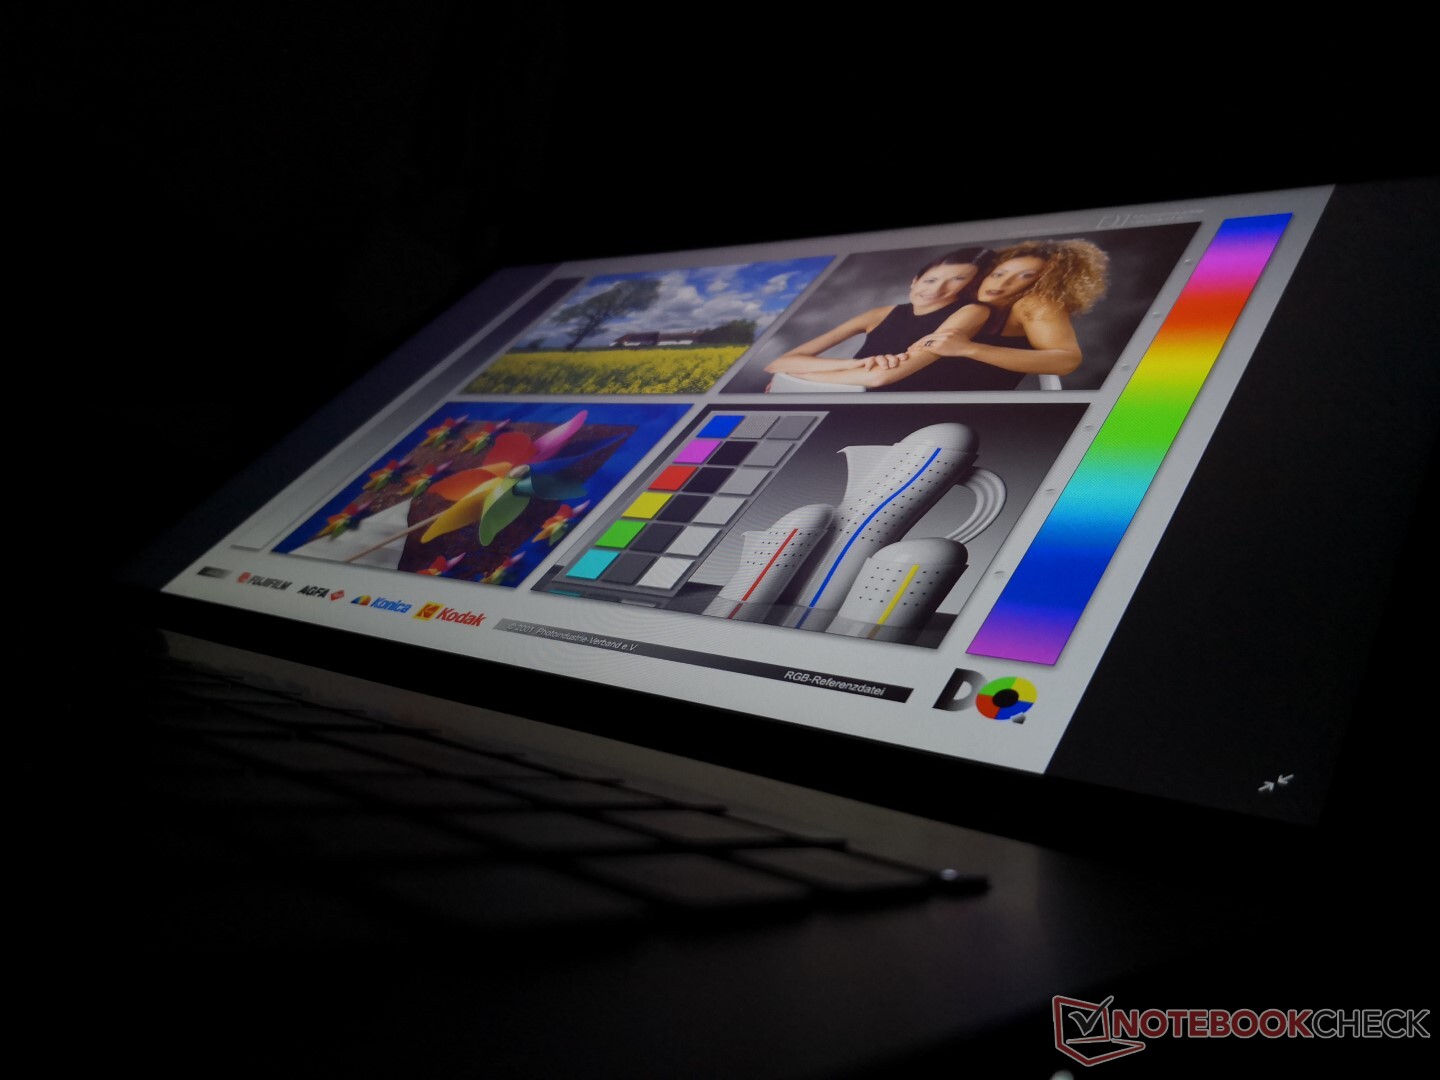
Görüntüle
Panda LM156LF IPS paneli, ROG Strix G GL531GV, TUF FX505DY, ROG Strix G15 G512LI veya Acer Nitro 5 AN515'te bulunanlara benzer. Ultra pürüzsüz imleç kontrolü ve hareketi için 120 Hz doğal yenileme hızı ile dikkat çekicidir, ancak renkleri ve yanıt süreleri LG veya BOE'nin diğer yüksek yenileme hızı ekranlarından daha düşüktür. Bu fiyat aralığındaki diğer dizüstü bilgisayarlara kıyasla gölgelenmenin daha belirgin olmasını ve renklerin o kadar canlı olmamasını bekleyin. Asus, daha geniş renk kapsamına sahip bir ekran seçeneği sunuyor, ancak 120 Hz'mizden farklı olarak 60 Hz yenileme hızı ile sınırlı olacak panel burada. Kullanıcılar, her ikisi için de seçenek olmadan birini veya diğerini seçmek zorunda kalacak.

| |||||||||||||||||||||||||
Aydınlatma: 87 %
Batarya modunda parlaklık: 263.9 cd/m²
Kontrast: 1015:1 (Siyah: 0.26 cd/m²)
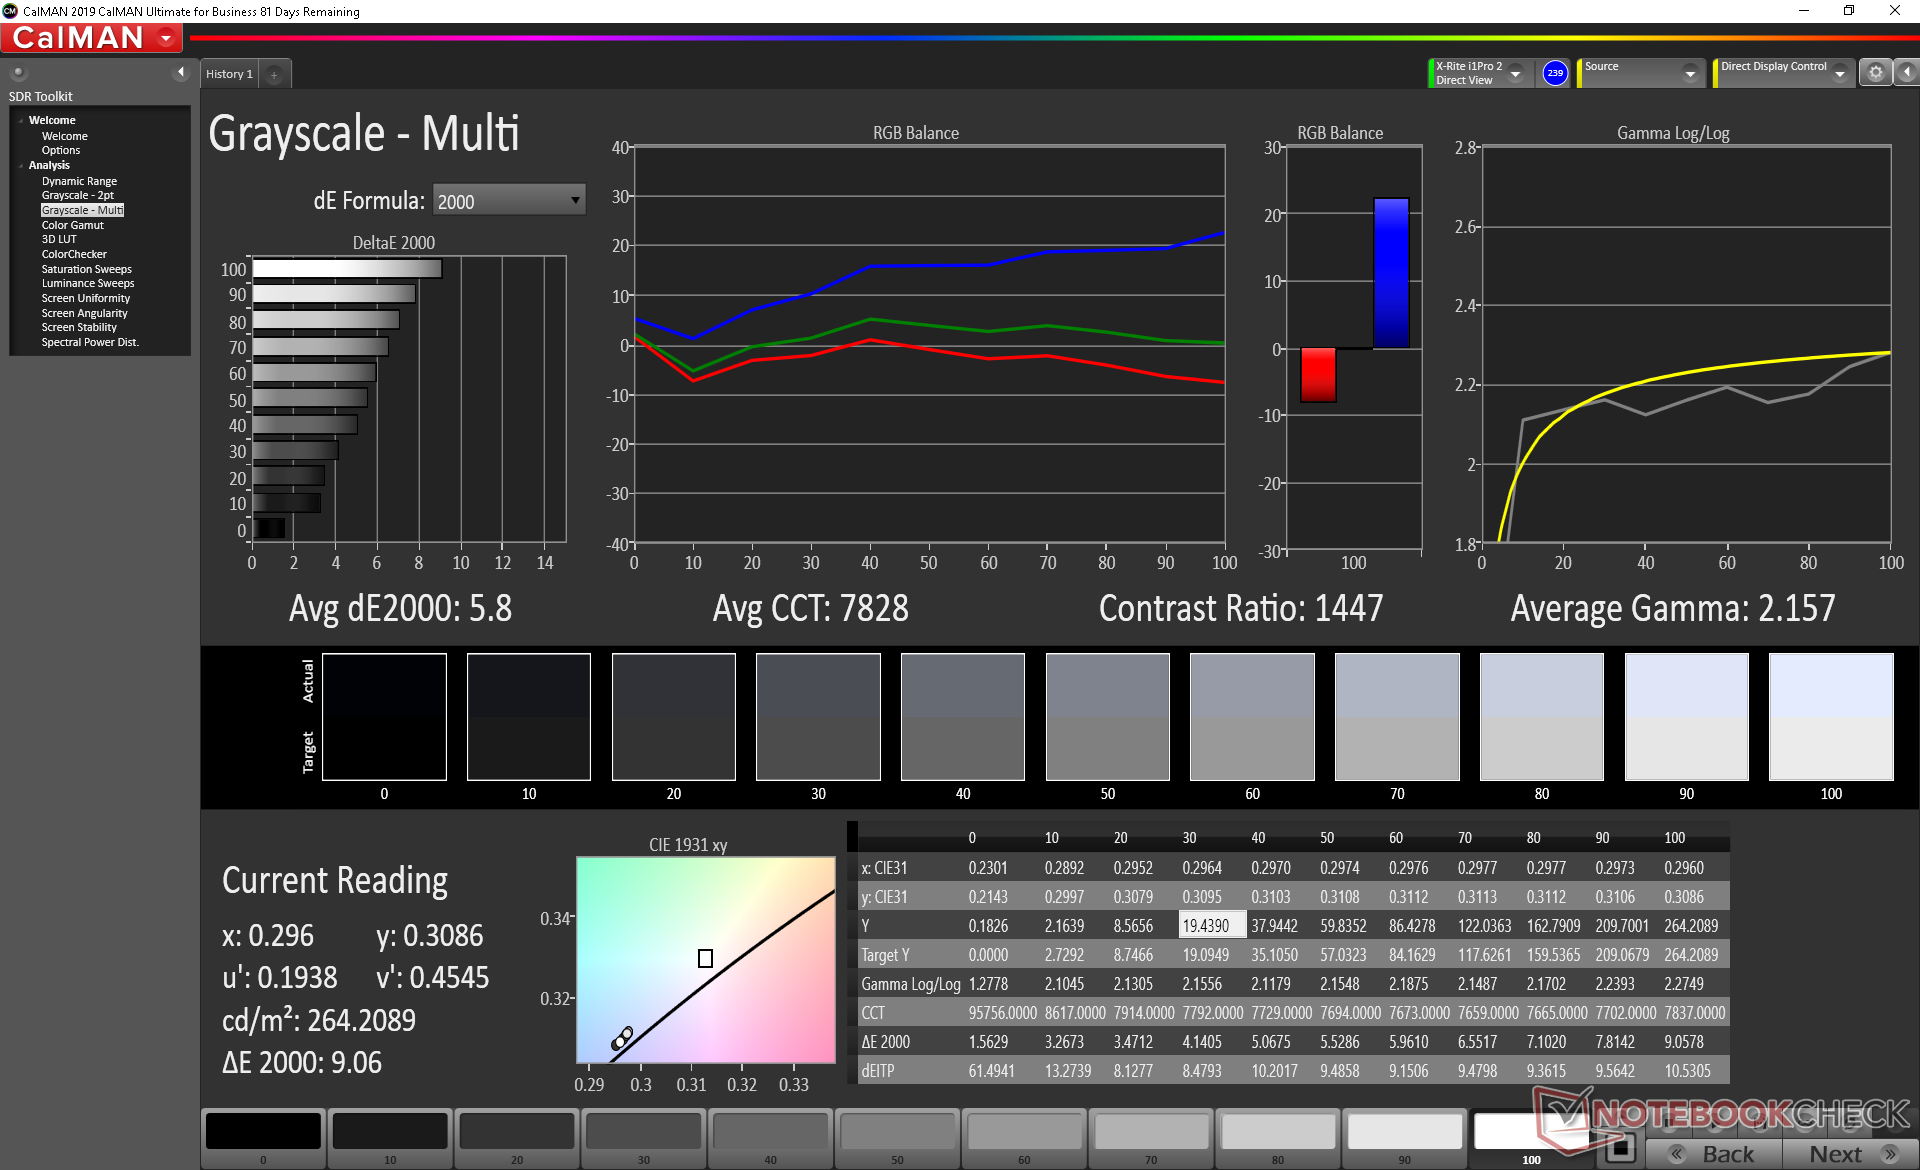
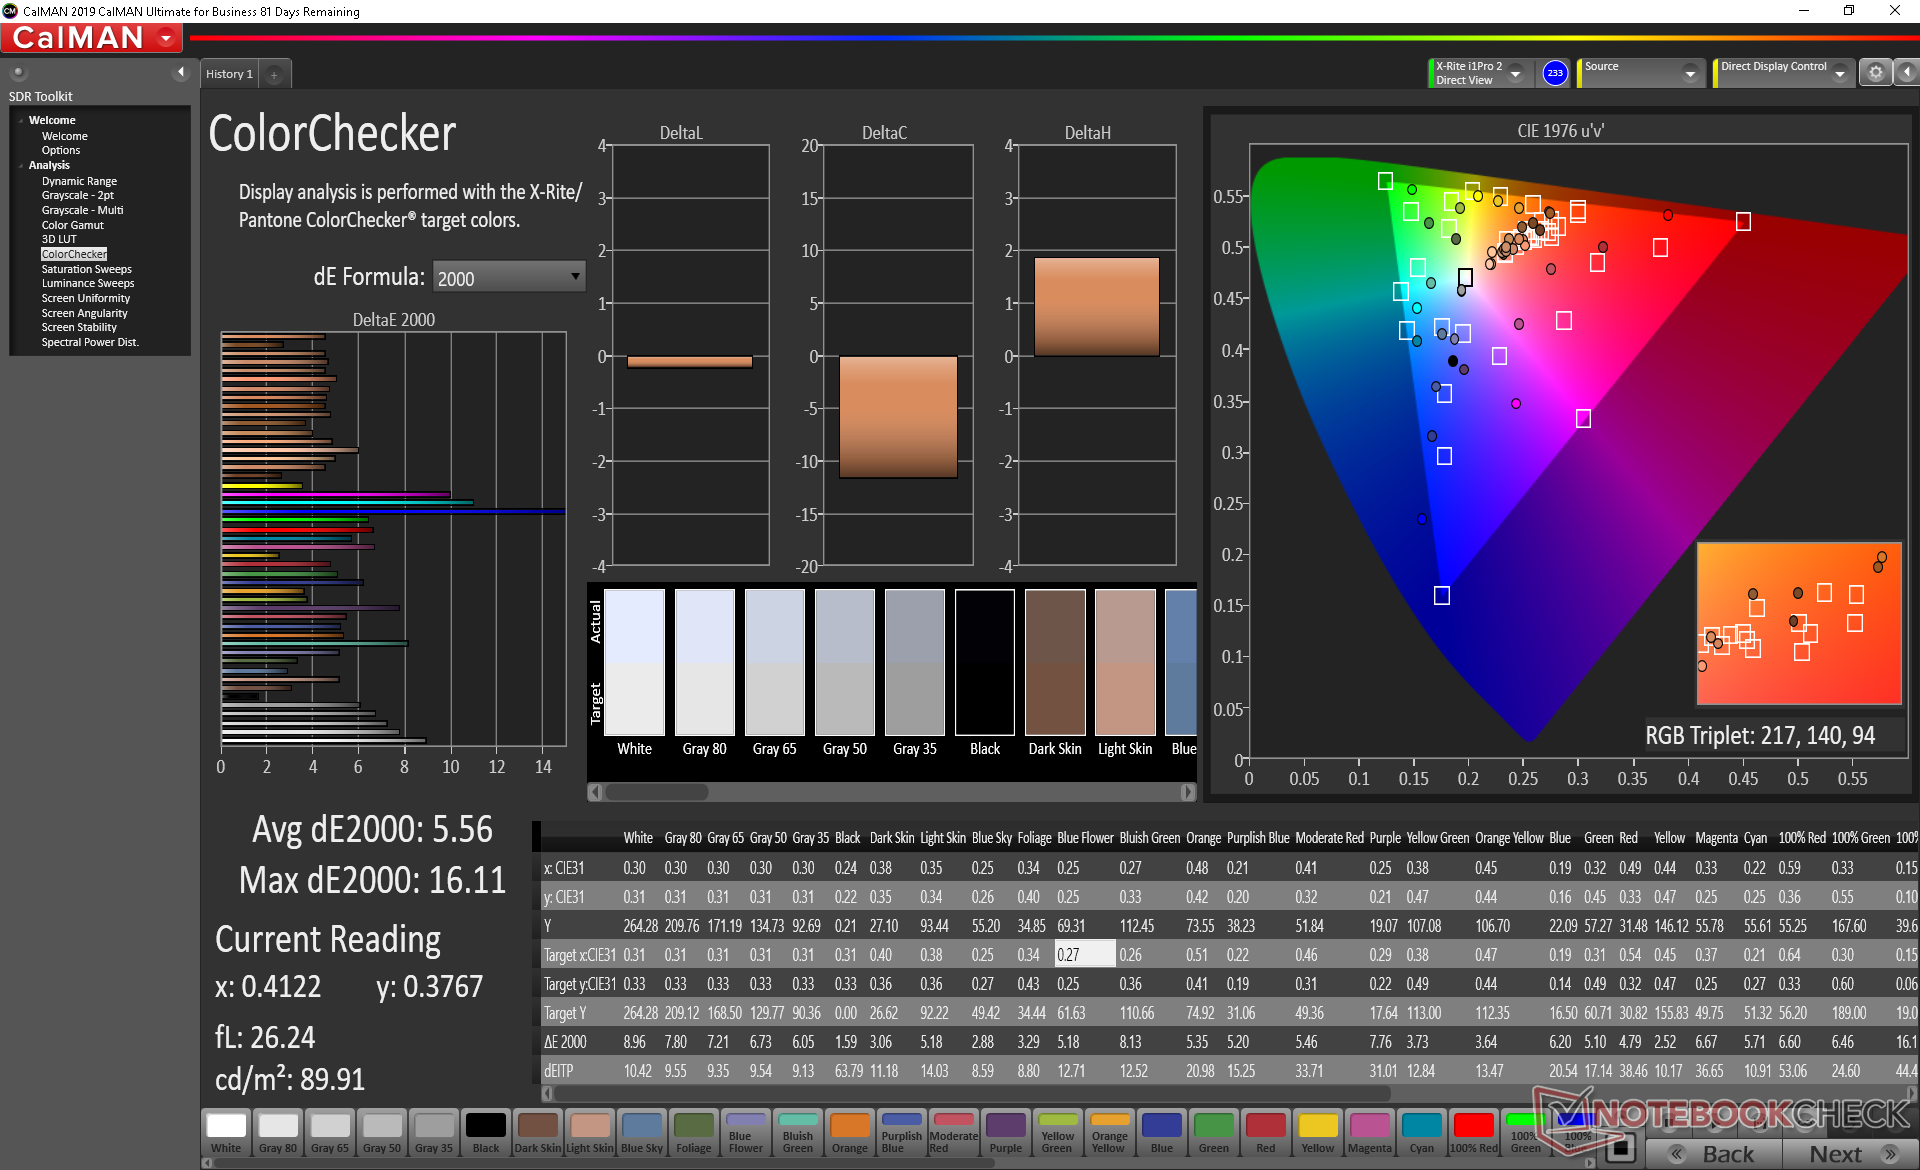
ΔE ColorChecker Calman: 5.56 | ∀{0.5-29.43 Ø4.72}
calibrated: 4.3
ΔE Greyscale Calman: 5.8 | ∀{0.09-98 Ø4.97}
60.1% sRGB (Argyll 1.6.3 3D)
38.2% AdobeRGB 1998 (Argyll 1.6.3 3D)
41.56% AdobeRGB 1998 (Argyll 3D)
60.4% sRGB (Argyll 3D)
40.2% Display P3 (Argyll 3D)
Gamma: 2.16
CCT: 7828 K
| Asus VivoBook 15 K571LI-PB71 Panda LM156LF-GL03, IPS, 15.6", 1920x1080 | HP Envy 15-ep0098nr Samsung SDC4145, AMOLED, 15.6", 3840x2160 | Acer Aspire 5 A515-54G LG Display LP156WFC SPD1, IPS, 15.6", 1920x1080 | Asus ZenBook 15 UX534FTC-A8190T BOE CQ NV156FHM-N63, IPS, 15.6", 1920x1080 | Lenovo Ideapad S540-15IML BOEhydis NV156FHM-N61 (BOE06FB), IPS, 15.6", 1920x1080 | Dell Inspiron 15 5000 5585 LG Philips 156WFC, IPS, 15.6", 1920x1080 | |
|---|---|---|---|---|---|---|
| Display | 109% | -16% | 52% | 54% | -7% | |
| Display P3 Coverage (%) | 40.2 | 88.5 120% | 33.78 -16% | 65 62% | 66.8 66% | 37.31 -7% |
| sRGB Coverage (%) | 60.4 | 100 66% | 50.8 -16% | 86.2 43% | 86.5 43% | 56.2 -7% |
| AdobeRGB 1998 Coverage (%) | 41.56 | 99.9 140% | 34.9 -16% | 62.9 51% | 63.2 52% | 38.55 -7% |
| Response Times | 93% | -16% | -46% | -60% | -7% | |
| Response Time Grey 50% / Grey 80% * (ms) | 28.4 ? | 0.8 ? 97% | 36 ? -27% | 45 ? -58% | 49.6 ? -75% | 28.4 ? -0% |
| Response Time Black / White * (ms) | 24 ? | 2.7 ? 89% | 25 ? -4% | 32 ? -33% | 34.8 ? -45% | 27.2 ? -13% |
| PWM Frequency (Hz) | 242.7 ? | 202 ? | ||||
| Screen | 45% | 6% | 28% | 25% | -1% | |
| Brightness middle (cd/m²) | 263.9 | 374.3 42% | 248 -6% | 299 13% | 299 13% | 253.6 -4% |
| Brightness (cd/m²) | 246 | 379 54% | 238 -3% | 280 14% | 278 13% | 227 -8% |
| Brightness Distribution (%) | 87 | 91 5% | 86 -1% | 89 2% | 87 0% | 84 -3% |
| Black Level * (cd/m²) | 0.26 | 0.23 12% | 0.21 19% | 0.25 4% | 0.27 -4% | |
| Contrast (:1) | 1015 | 1078 6% | 1424 40% | 1196 18% | 939 -7% | |
| Colorchecker dE 2000 * | 5.56 | 5.47 2% | 5.05 9% | 4.76 14% | 4.32 22% | 6.05 -9% |
| Colorchecker dE 2000 max. * | 16.11 | 8.22 49% | 14.34 11% | 9 44% | 9.3 42% | 14.03 13% |
| Colorchecker dE 2000 calibrated * | 4.3 | 4.61 -7% | 4.76 -11% | 2.58 40% | 4.97 -16% | |
| Greyscale dE 2000 * | 5.8 | 2.3 60% | 1.37 76% | 3.53 39% | 4.21 27% | 3.2 45% |
| Gamma | 2.16 102% | 2.09 105% | 2.4 92% | 2.3 96% | 2.39 92% | 2 110% |
| CCT | 7828 83% | 6340 103% | 6592 99% | 7228 90% | 6799 96% | 6820 95% |
| Color Space (Percent of AdobeRGB 1998) (%) | 38.2 | 87.8 130% | 32 -16% | 56 47% | 57 49% | 35.5 -7% |
| Color Space (Percent of sRGB) (%) | 60.1 | 100 66% | 51 -15% | 86 43% | 86 43% | 55.6 -7% |
| Toplam Ortalama (Program / Ayarlar) | 82% /
65% | -9% /
-1% | 11% /
23% | 6% /
20% | -5% /
-3% |
* ... daha küçük daha iyidir
Renk alanı, ucuz bir panelin göstergesi olması için sırasıyla sRGB ve AdobeRGB'nin yalnızca yüzde 60'ı ve yüzde 38'i ile sınırlıdır. Bu fiyat aralığındaki çoğu Ultrabook, daha derin ve daha doğru renkler için yüzde 95'in üzerinde sRGB kapsamı sunar.
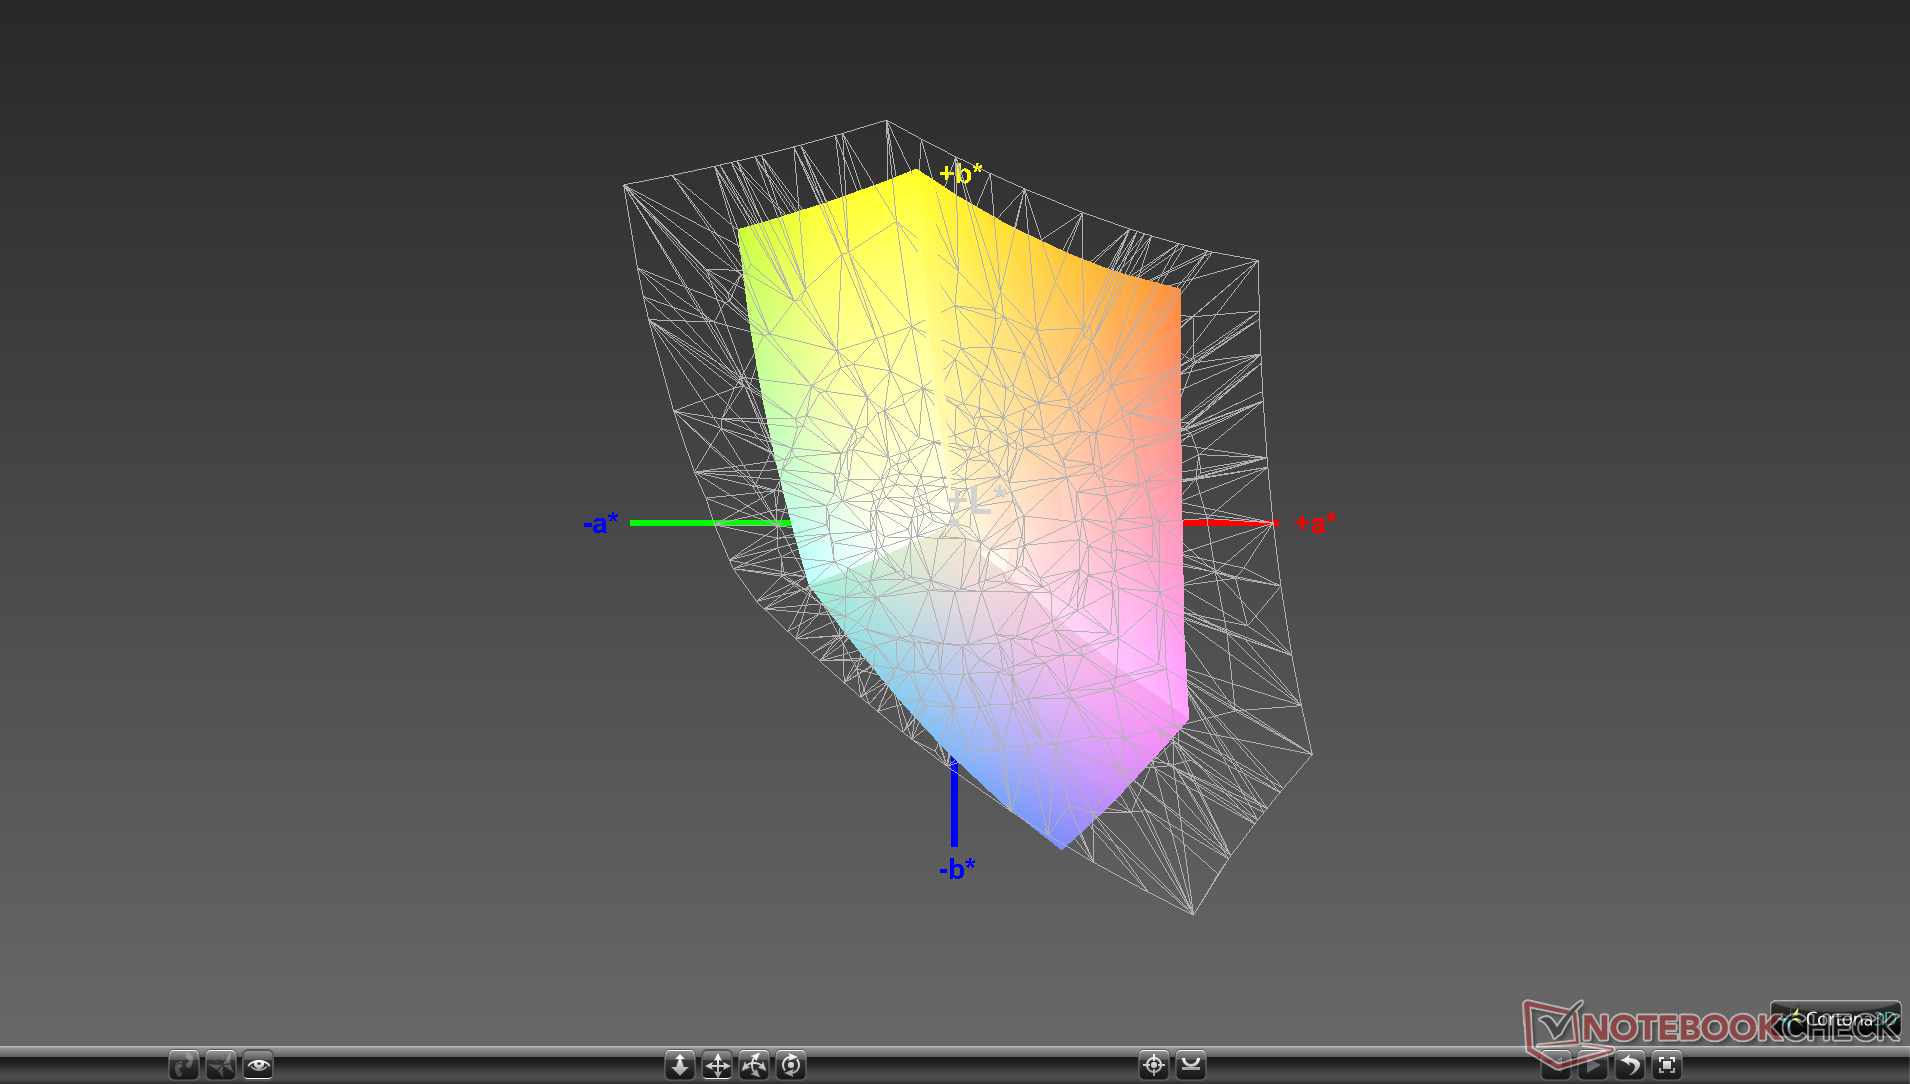
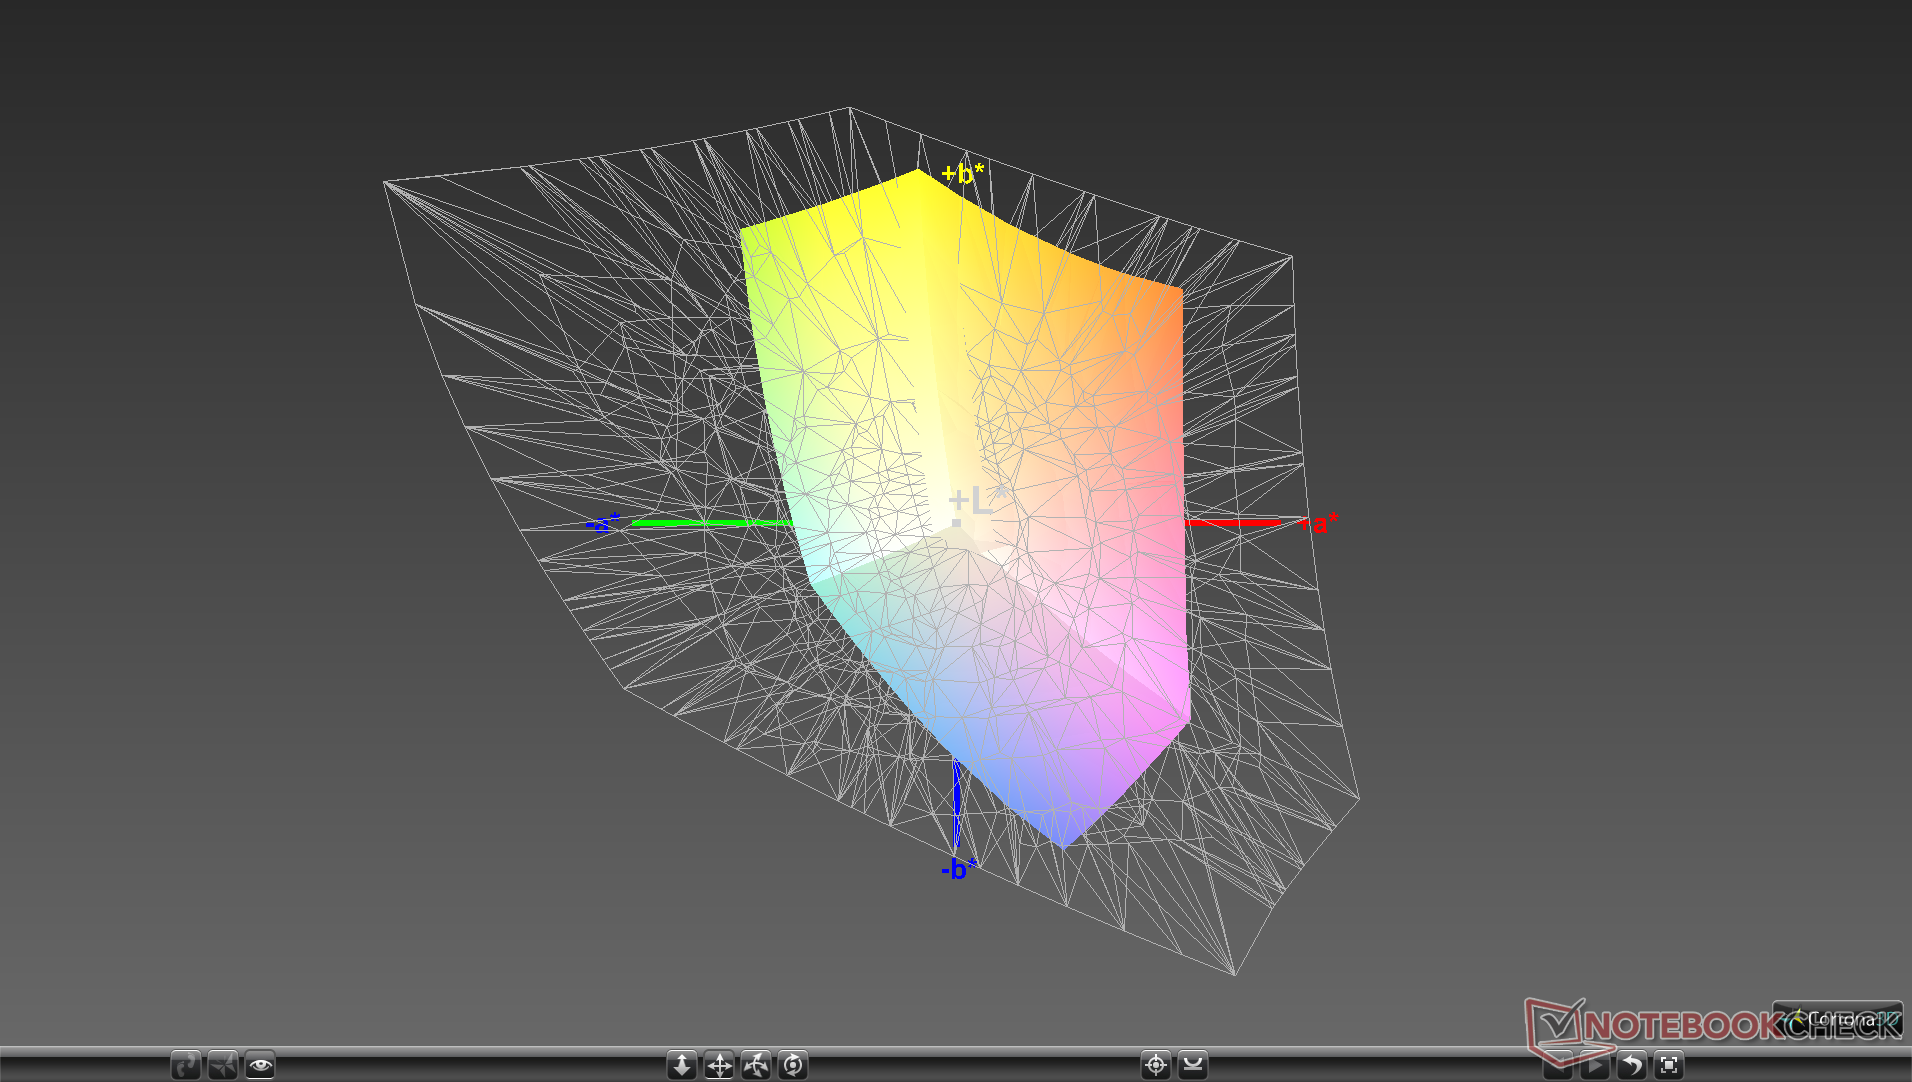
Ekran, aşırı soğuk renk sıcaklığı ve 5,8'lik nispeten yüksek gri tonlama deltaE değeri ile kutudan çıkarıldığında iyi bir şekilde kalibre edilmemiştir. Bu eksiklikler, paneli kendimiz kalibre ettikten sonra gözle görülür şekilde iyileşir, ancak yukarıda bahsedilen sınırlı renk alanı nedeniyle renkler hala daha yüksek doygunluk seviyelerinde giderek daha yanlış hale gelir.

Yanıt Sürelerini Görüntüle
| ↔ Tepki Süresi Siyahtan Beyaza | ||
|---|---|---|
| 24 ms ... yükseliş ↗ ve sonbahar↘ birleşimi | ↗ 13.2 ms yükseliş | 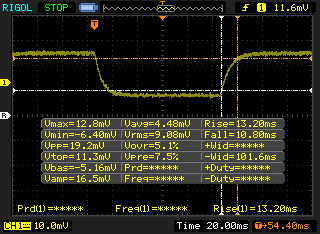 |
| ↘ 10.8 ms sonbahar | ||
| Ekran, testlerimizde iyi yanıt oranları gösteriyor ancak rekabetçi oyuncular için çok yavaş olabilir. Karşılaştırıldığında, test edilen tüm cihazlar 0.1 (minimum) ile 240 (maksimum) ms arasında değişir. » Tüm cihazların 54 %'si daha iyi. Bu, ölçülen yanıt süresinin test edilen tüm cihazların ortalamasından (19.8 ms) daha kötü olduğu anlamına gelir. | ||
| ↔ Tepki Süresi %50 Griden %80 Griye | ||
| 28.4 ms ... yükseliş ↗ ve sonbahar↘ birleşimi | ↗ 16.8 ms yükseliş | 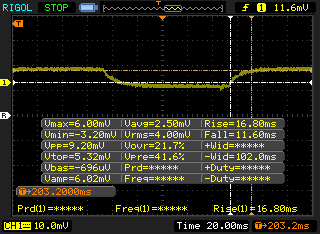 |
| ↘ 11.6 ms sonbahar | ||
| Ekran, testlerimizde nispeten yavaş yanıt oranları gösteriyor ve oyuncular için çok yavaş olabilir. Karşılaştırıldığında, test edilen tüm cihazlar 0.165 (minimum) ile 636 (maksimum) ms arasında değişir. » Tüm cihazların 38 %'si daha iyi. Bu, ölçülen yanıt süresinin test edilen tüm cihazların ortalamasına benzer olduğu anlamına gelir (31 ms). | ||
Ekran Titremesi / PWM (Darbe Genişliği Modülasyonu)
| Ekran titriyor / PWM algılanmadı | 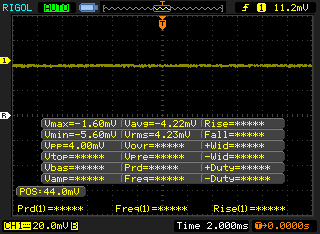 | ||
Karşılaştırıldığında: Test edilen tüm cihazların %52 %'si ekranı karartmak için PWM kullanmıyor. PWM tespit edilirse, ortalama 7781 (minimum: 5 - maksimum: 343500) Hz ölçüldü. | |||
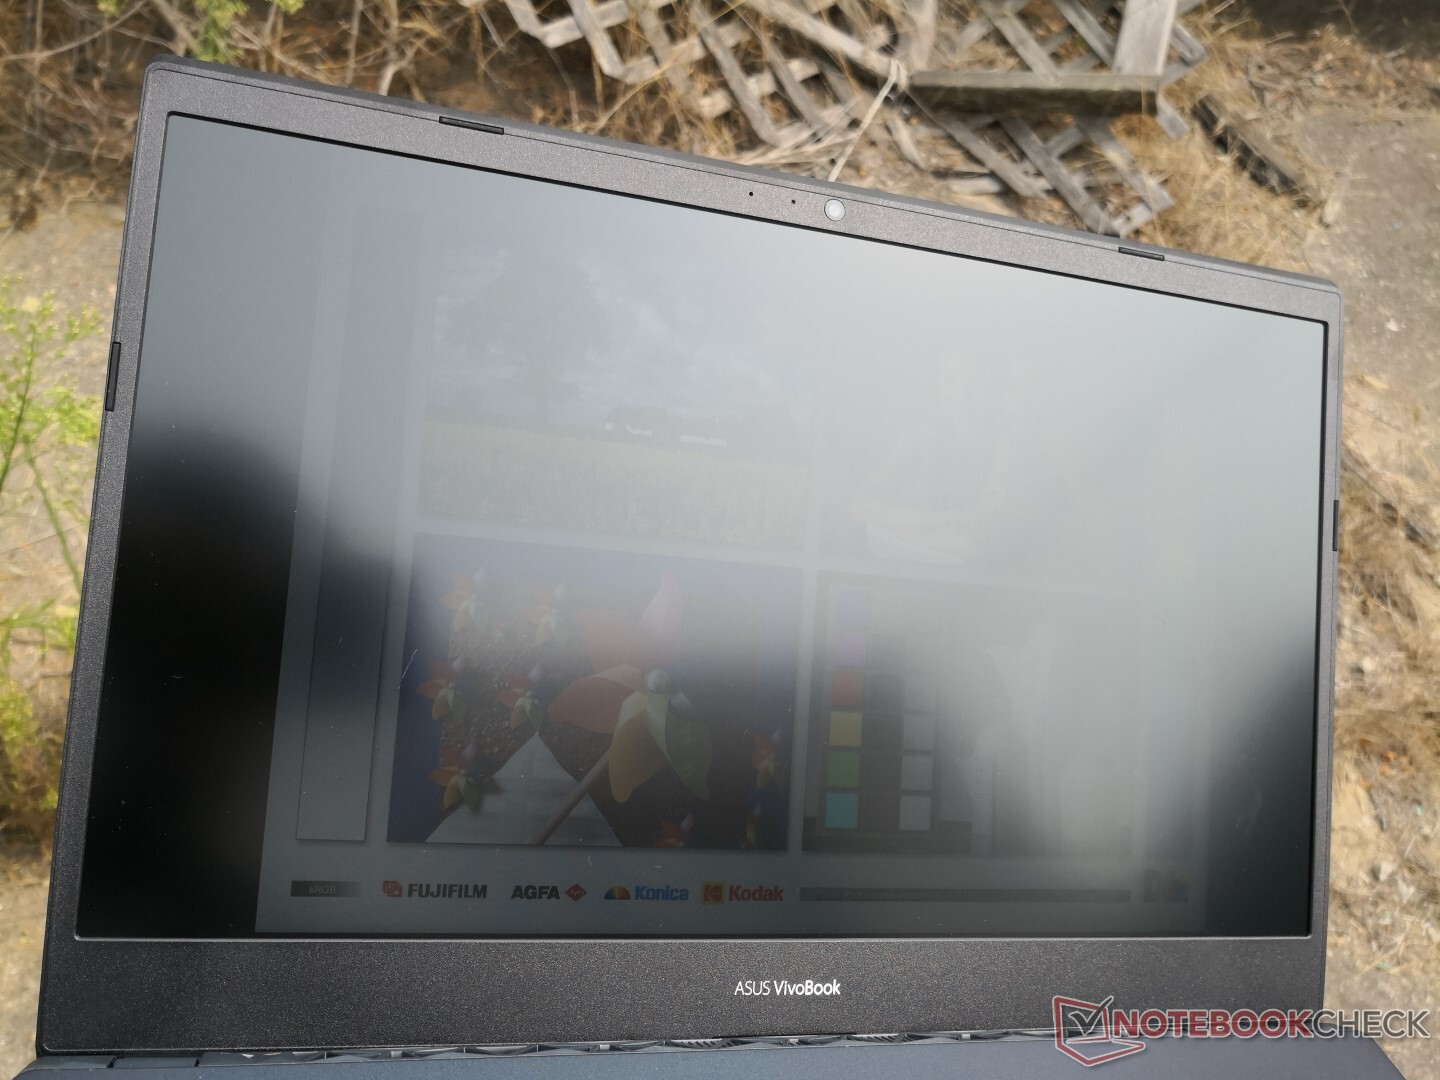
Yetersiz 250 nit arka ışık ve kaçınılmaz ortam parlaması nedeniyle dış mekan görüşü en iyi ihtimalle ortalama düzeydedir. ZenBooks ve özellikle Dell XPS 15 veya MacBook Pro 15 daha parlak ekranlara sahip olacak.
Verim
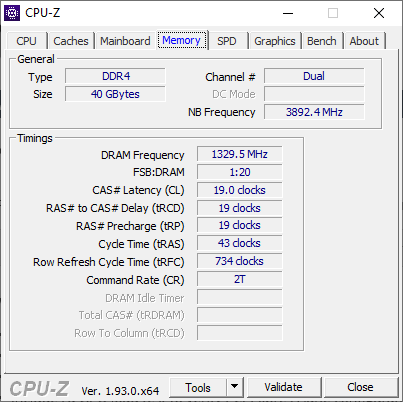
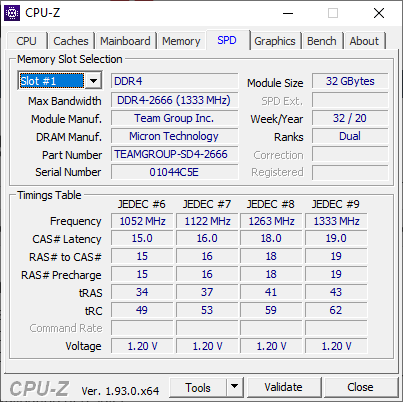
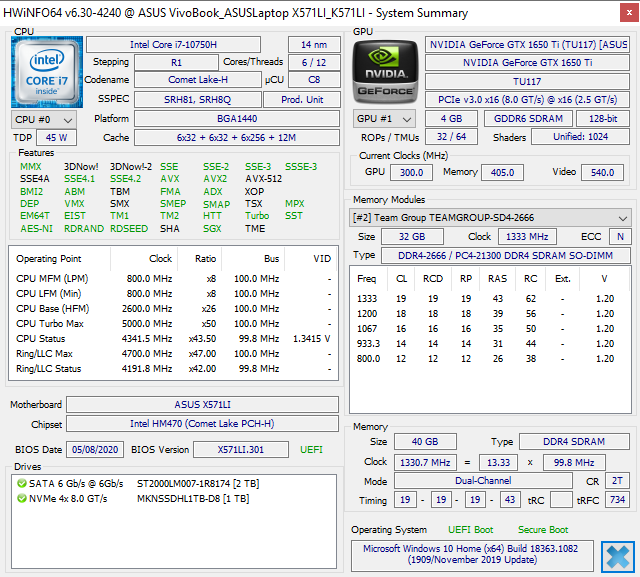
Core i7-10750H, GeForce GTX 1650 Ti ve 120 Hz ekran VivoBook 15 K571 serisinin belirleyici özellikleridir. Bu tür bileşenler giriş seviyesi oyun dizüstü bilgisayarlarında yaygın olsa da, genel amaçlı performans kullanıcıları, özellikle normal Core U serisinden veya entegre grafik çözümlerinden daha hızlı bir şey isteyenler için donanımı takdir edebilir. Hem lehimli hem de çıkarılabilir RAM, çok benzer bazı Asus ROG dizüstü bilgisayarlarda. 4 GB veya 8 GB, birleşik maksimum 40 GB için 32 GB'a kadar destekleyen tek bir SODIMM yuvasının yanı sıra yapılandırmaya bağlı olarak lehimlenmiş olarak gelir.Optimus, otomatik grafik değiştirme için standart olarak gelir. Aşağıdaki herhangi bir performans karşılaştırmasını çalıştırmadan önce ünitemiz Yüksek Performans moduna ayarlanmıştır.
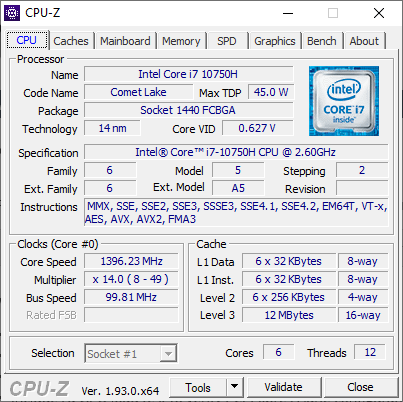
İşlemci
CPU performansı, aynı Core i7-10750H CPU ile donatılmış veritabanımızdaki ortalama dizüstü bilgisayardan yaklaşık yüzde 15 ila 20 daha yavaş olmasıyla hayal kırıklığı yaratıyor. Bu açık, Asus'umuzu Core i7-10750H'nin yerini alması gereken son nesil Core i7-9750H'nin altına koymak için yeterli. Turbo Boost potansiyeli, aşağıdaki CineBench R15 xT döngü sonuçlarımızda gösterildiği gibi zayıftır. Bununla birlikte, çoklu iş parçacığı performansı, daha düşük olan Core i5-10300H seçeneğinden yaklaşık yüzde 20 daha hızlı olacaktır.Daha fazla teknik bilgi ve kıyaslama için Core i7-10750H'deki özel sayfamıza bakın.
Cinebench R15: CPU Multi 64Bit | CPU Single 64Bit
Blender: v2.79 BMW27 CPU
7-Zip 18.03: 7z b 4 -mmt1 | 7z b 4
Geekbench 5.5: Single-Core | Multi-Core
HWBOT x265 Benchmark v2.2: 4k Preset
LibreOffice : 20 Documents To PDF
R Benchmark 2.5: Overall mean
| Cinebench R20 / CPU (Multi Core) | |
| Dell G5 15 SE 5505 P89F | |
| Asus ROG Strix Scar 15 G532LWS | |
| HP Pavilion Gaming 15-ec1206ng | |
| Dell XPS 15 9500 Core i7 4K UHD | |
| Ortalama Intel Core i7-10750H (1749 - 3325, n=43) | |
| Lenovo IdeaPad S740-15IRH | |
| Asus VivoBook 15 K571LI-PB71 | |
| Dell XPS 15 9500 Core i5 | |
| Asus ZenBook 15 UX534FTC-A8190T | |
| Dell G5 15 5590-PCNJJ | |
| Cinebench R20 / CPU (Single Core) | |
| Dell XPS 15 9500 Core i7 4K UHD | |
| Asus ROG Strix Scar 15 G532LWS | |
| Dell G5 15 SE 5505 P89F | |
| Ortalama Intel Core i7-10750H (431 - 504, n=43) | |
| Asus VivoBook 15 K571LI-PB71 | |
| Asus ZenBook 15 UX534FTC-A8190T | |
| Lenovo IdeaPad S740-15IRH | |
| Dell XPS 15 9500 Core i5 | |
| HP Pavilion Gaming 15-ec1206ng | |
| Dell G5 15 5590-PCNJJ | |
| Cinebench R15 / CPU Multi 64Bit | |
| Dell G5 15 SE 5505 P89F | |
| Asus ROG Strix Scar 15 G532LWS | |
| HP Pavilion Gaming 15-ec1206ng | |
| Dell XPS 15 9500 Core i7 4K UHD | |
| Ortalama Intel Core i7-10750H (804 - 1418, n=50) | |
| Lenovo IdeaPad S740-15IRH | |
| Asus VivoBook 15 K571LI-PB71 | |
| Dell XPS 15 9500 Core i5 | |
| Asus ZenBook 15 UX534FTC-A8190T | |
| Dell G5 15 5590-PCNJJ | |
| Cinebench R15 / CPU Single 64Bit | |
| Asus ROG Strix Scar 15 G532LWS | |
| Dell XPS 15 9500 Core i7 4K UHD | |
| Ortalama Intel Core i7-10750H (184 - 213, n=45) | |
| Asus VivoBook 15 K571LI-PB71 | |
| Lenovo IdeaPad S740-15IRH | |
| Dell G5 15 SE 5505 P89F | |
| Asus ZenBook 15 UX534FTC-A8190T | |
| Dell XPS 15 9500 Core i5 | |
| HP Pavilion Gaming 15-ec1206ng | |
| Dell G5 15 5590-PCNJJ | |
| Blender / v2.79 BMW27 CPU | |
| Dell XPS 15 9500 Core i5 | |
| Asus VivoBook 15 K571LI-PB71 | |
| Ortalama Intel Core i7-10750H (322 - 587, n=43) | |
| Dell XPS 15 9500 Core i7 4K UHD | |
| HP Pavilion Gaming 15-ec1206ng | |
| Asus ROG Strix Scar 15 G532LWS | |
| Dell G5 15 SE 5505 P89F | |
| 7-Zip 18.03 / 7z b 4 -mmt1 | |
| Asus ROG Strix Scar 15 G532LWS | |
| Dell XPS 15 9500 Core i7 4K UHD | |
| Asus VivoBook 15 K571LI-PB71 | |
| Ortalama Intel Core i7-10750H (4504 - 5470, n=43) | |
| Dell XPS 15 9500 Core i5 | |
| Dell G5 15 SE 5505 P89F | |
| HP Pavilion Gaming 15-ec1206ng | |
| 7-Zip 18.03 / 7z b 4 | |
| Dell G5 15 SE 5505 P89F | |
| Asus ROG Strix Scar 15 G532LWS | |
| HP Pavilion Gaming 15-ec1206ng | |
| Dell XPS 15 9500 Core i7 4K UHD | |
| Ortalama Intel Core i7-10750H (26040 - 37345, n=43) | |
| Asus VivoBook 15 K571LI-PB71 | |
| Dell XPS 15 9500 Core i5 | |
| Geekbench 5.5 / Single-Core | |
| Asus ROG Strix Scar 15 G532LWS | |
| Dell XPS 15 9500 Core i7 4K UHD | |
| Asus VivoBook 15 K571LI-PB71 | |
| Ortalama Intel Core i7-10750H (1114 - 1333, n=43) | |
| Asus ZenBook 15 UX534FTC-A8190T | |
| Dell XPS 15 9500 Core i5 | |
| Dell G5 15 SE 5505 P89F | |
| HP Pavilion Gaming 15-ec1206ng | |
| Geekbench 5.5 / Multi-Core | |
| Asus ROG Strix Scar 15 G532LWS | |
| Dell XPS 15 9500 Core i7 4K UHD | |
| Dell G5 15 SE 5505 P89F | |
| Asus VivoBook 15 K571LI-PB71 | |
| Ortalama Intel Core i7-10750H (4443 - 6674, n=43) | |
| HP Pavilion Gaming 15-ec1206ng | |
| Asus ZenBook 15 UX534FTC-A8190T | |
| Dell XPS 15 9500 Core i5 | |
| HWBOT x265 Benchmark v2.2 / 4k Preset | |
| Asus ROG Strix Scar 15 G532LWS | |
| Dell G5 15 SE 5505 P89F | |
| HP Pavilion Gaming 15-ec1206ng | |
| Dell XPS 15 9500 Core i7 4K UHD | |
| Ortalama Intel Core i7-10750H (5.54 - 11.6, n=43) | |
| Asus VivoBook 15 K571LI-PB71 | |
| Dell XPS 15 9500 Core i5 | |
| LibreOffice / 20 Documents To PDF | |
| HP Pavilion Gaming 15-ec1206ng | |
| Dell G5 15 SE 5505 P89F | |
| Dell XPS 15 9500 Core i5 | |
| Ortalama Intel Core i7-10750H (43.1 - 99.2, n=43) | |
| Dell XPS 15 9500 Core i7 4K UHD | |
| Asus ROG Strix Scar 15 G532LWS | |
| Asus VivoBook 15 K571LI-PB71 | |
| R Benchmark 2.5 / Overall mean | |
| Dell XPS 15 9500 Core i5 | |
| Ortalama Intel Core i7-10750H (0.578 - 0.708, n=42) | |
| HP Pavilion Gaming 15-ec1206ng | |
| Asus VivoBook 15 K571LI-PB71 | |
| Dell XPS 15 9500 Core i7 4K UHD | |
| Dell G5 15 SE 5505 P89F | |
| Asus ROG Strix Scar 15 G532LWS | |
* ... daha küçük daha iyidir
Sistem performansı
| PCMark 8 | |
| Home Score Accelerated v2 | |
| Ortalama Intel Core i7-10750H, NVIDIA GeForce GTX 1650 Ti Mobile (4090 - 4420, n=3) | |
| Asus VivoBook 15 K571LI-PB71 | |
| Asus ZenBook 15 UX534FTC-A8190T | |
| Dell Inspiron 15 5000 5585 | |
| HP Envy 15-ep0098nr | |
| Work Score Accelerated v2 | |
| Ortalama Intel Core i7-10750H, NVIDIA GeForce GTX 1650 Ti Mobile (5343 - 5610, n=3) | |
| Asus VivoBook 15 K571LI-PB71 | |
| Asus ZenBook 15 UX534FTC-A8190T | |
| HP Envy 15-ep0098nr | |
| Dell Inspiron 15 5000 5585 | |
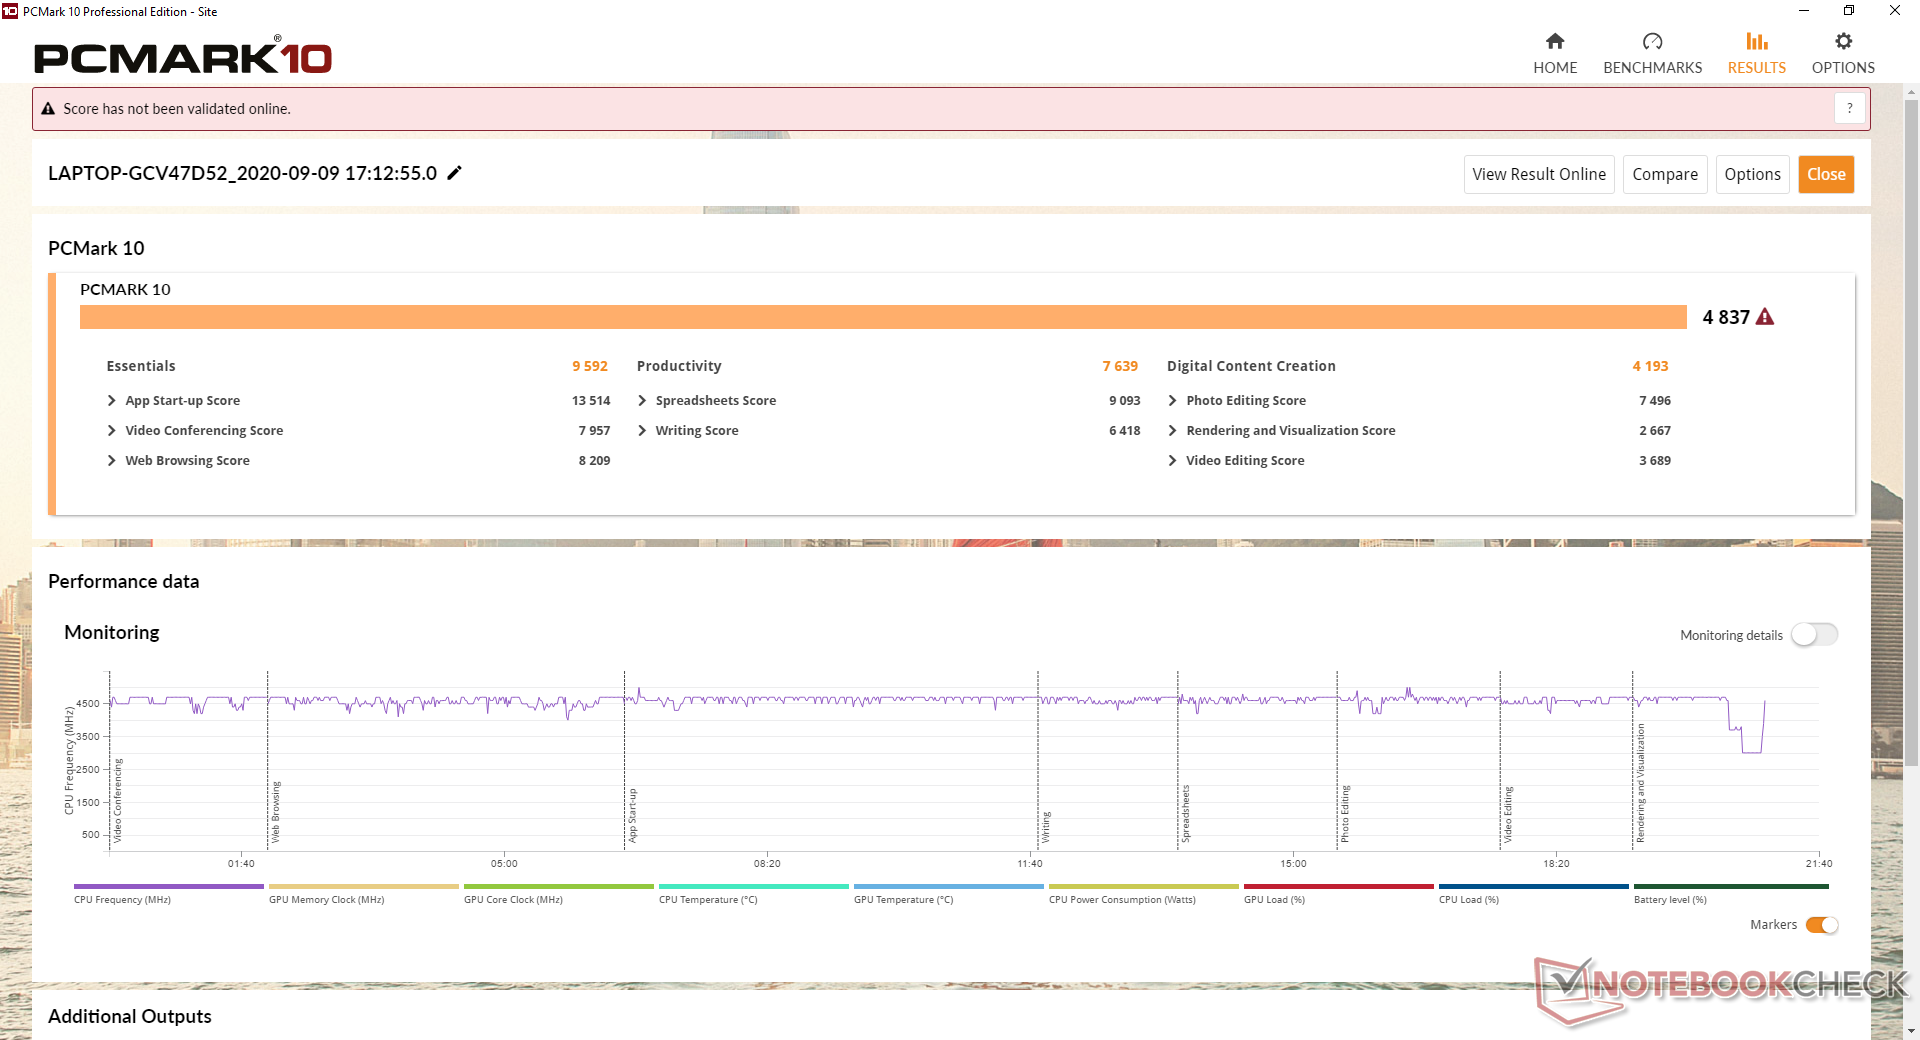
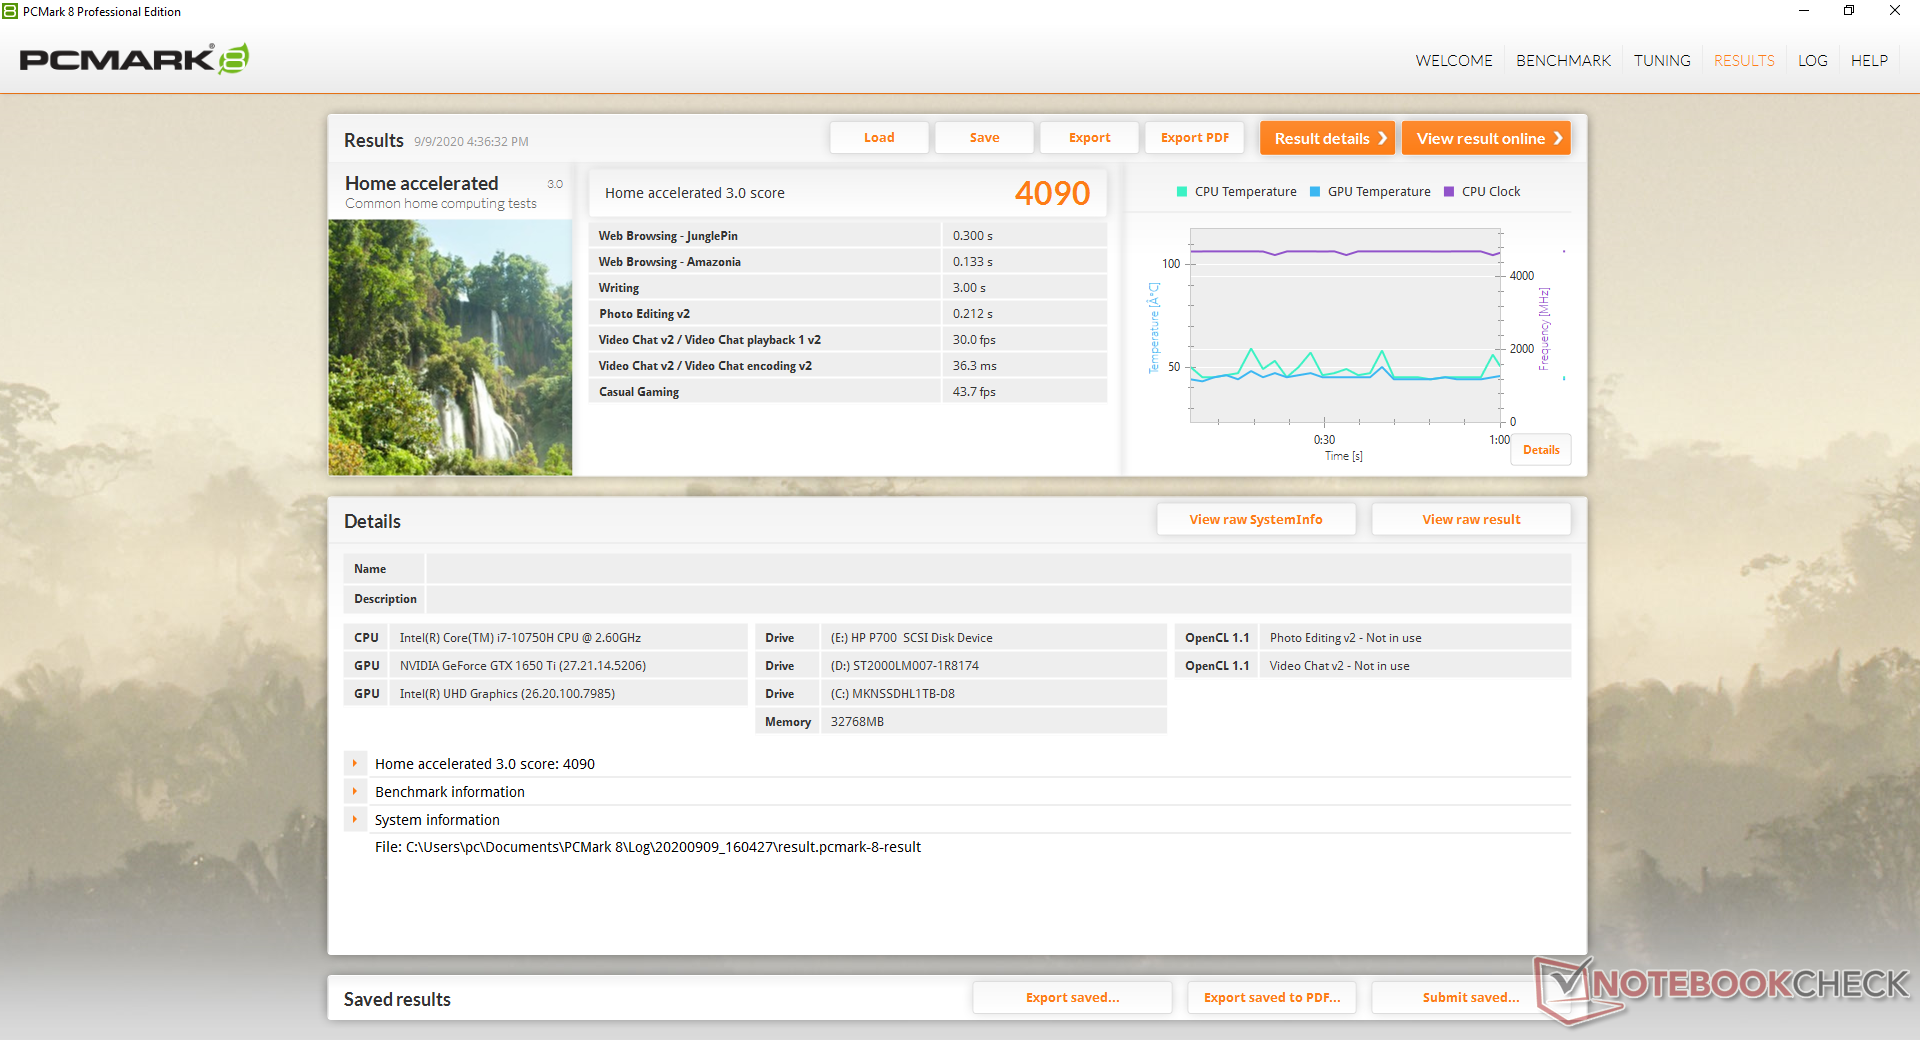
| PCMark 8 Home Score Accelerated v2 | 4090 puan | |
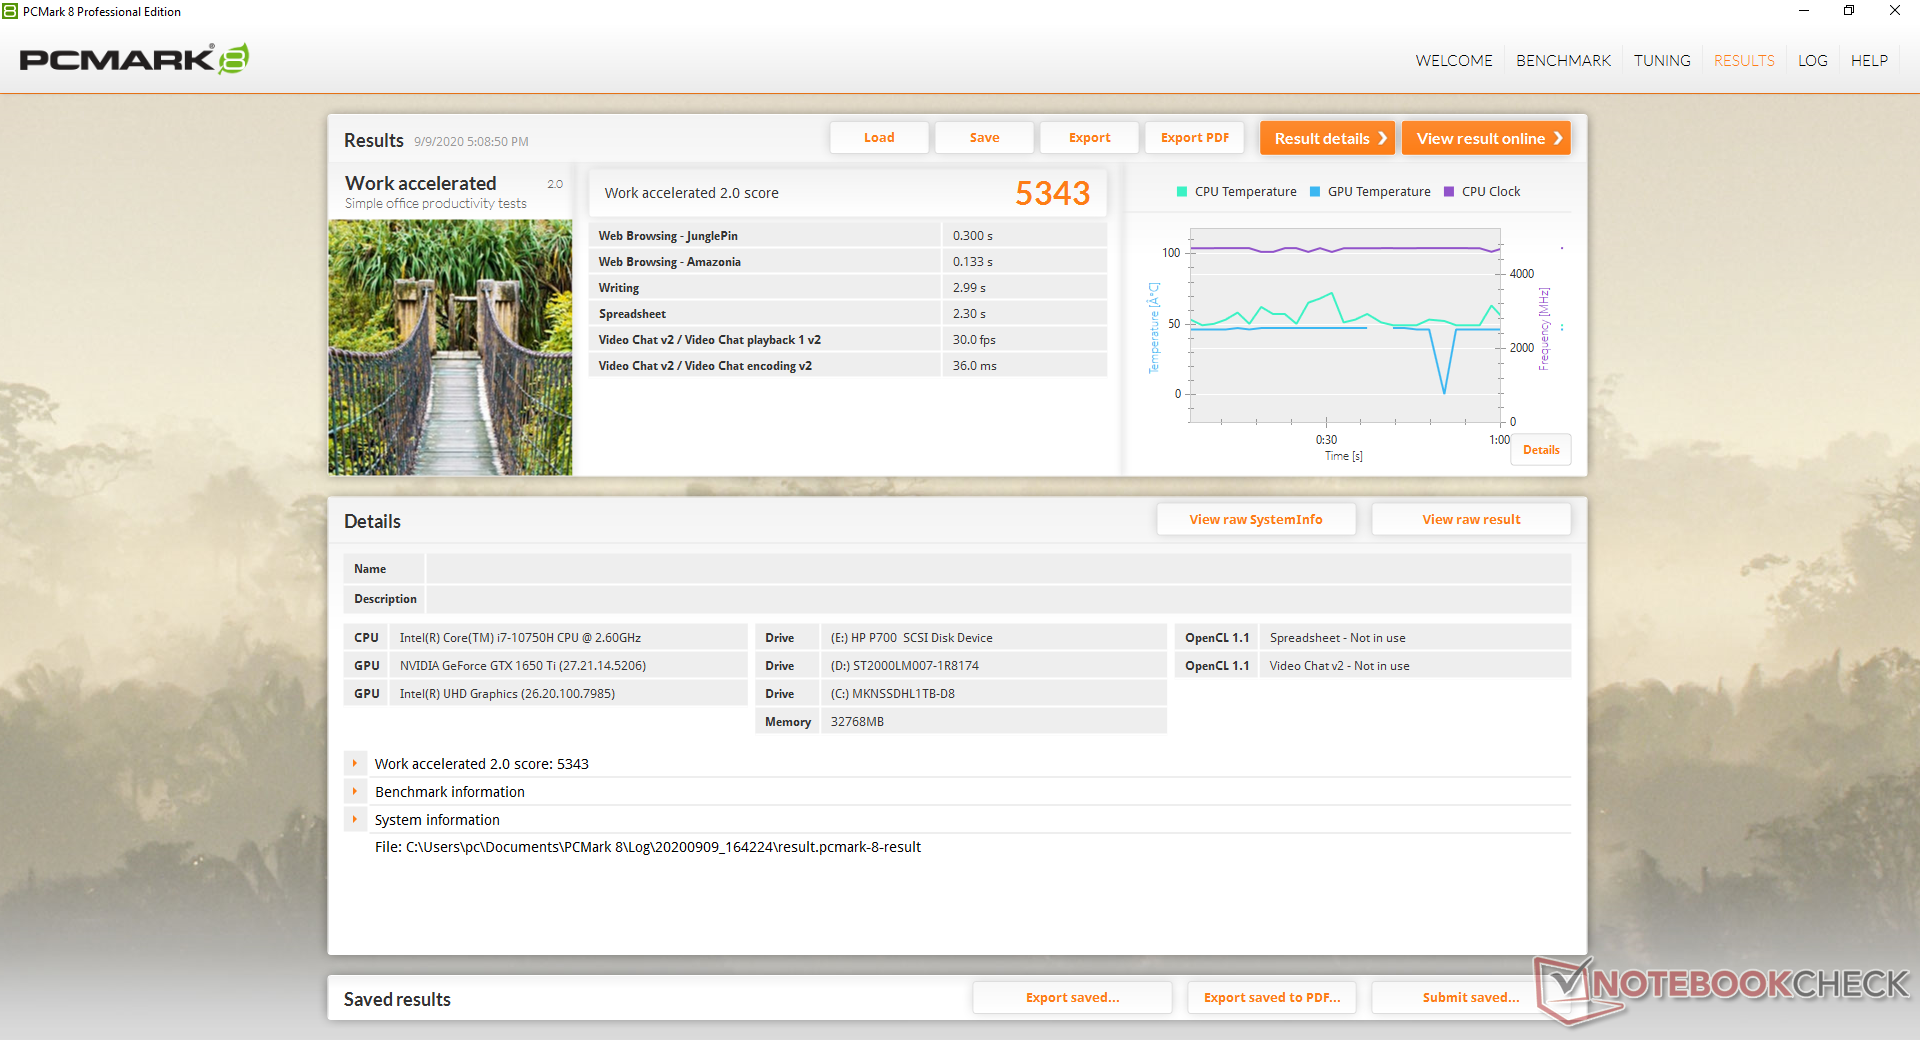
| PCMark 8 Work Score Accelerated v2 | 5343 puan | |
| PCMark 10 Score | 4837 puan | |
Yardım | ||
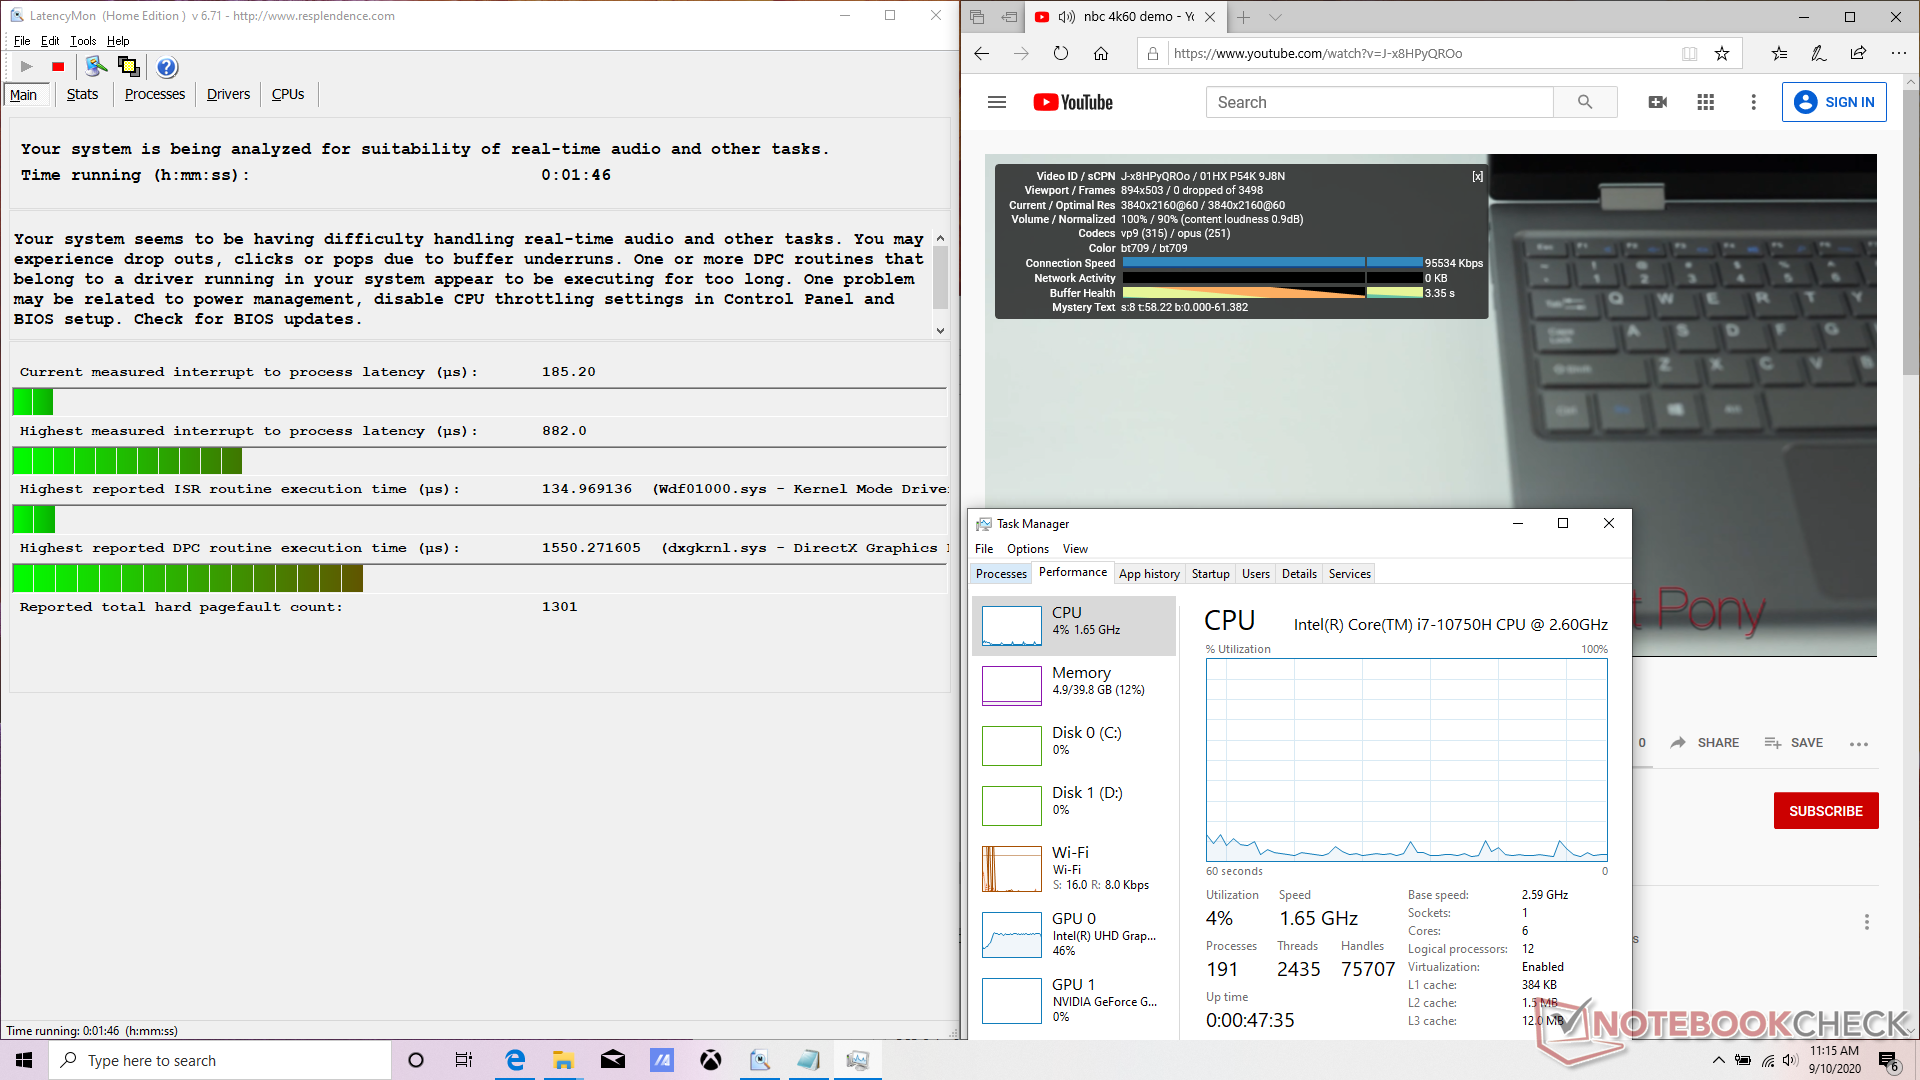
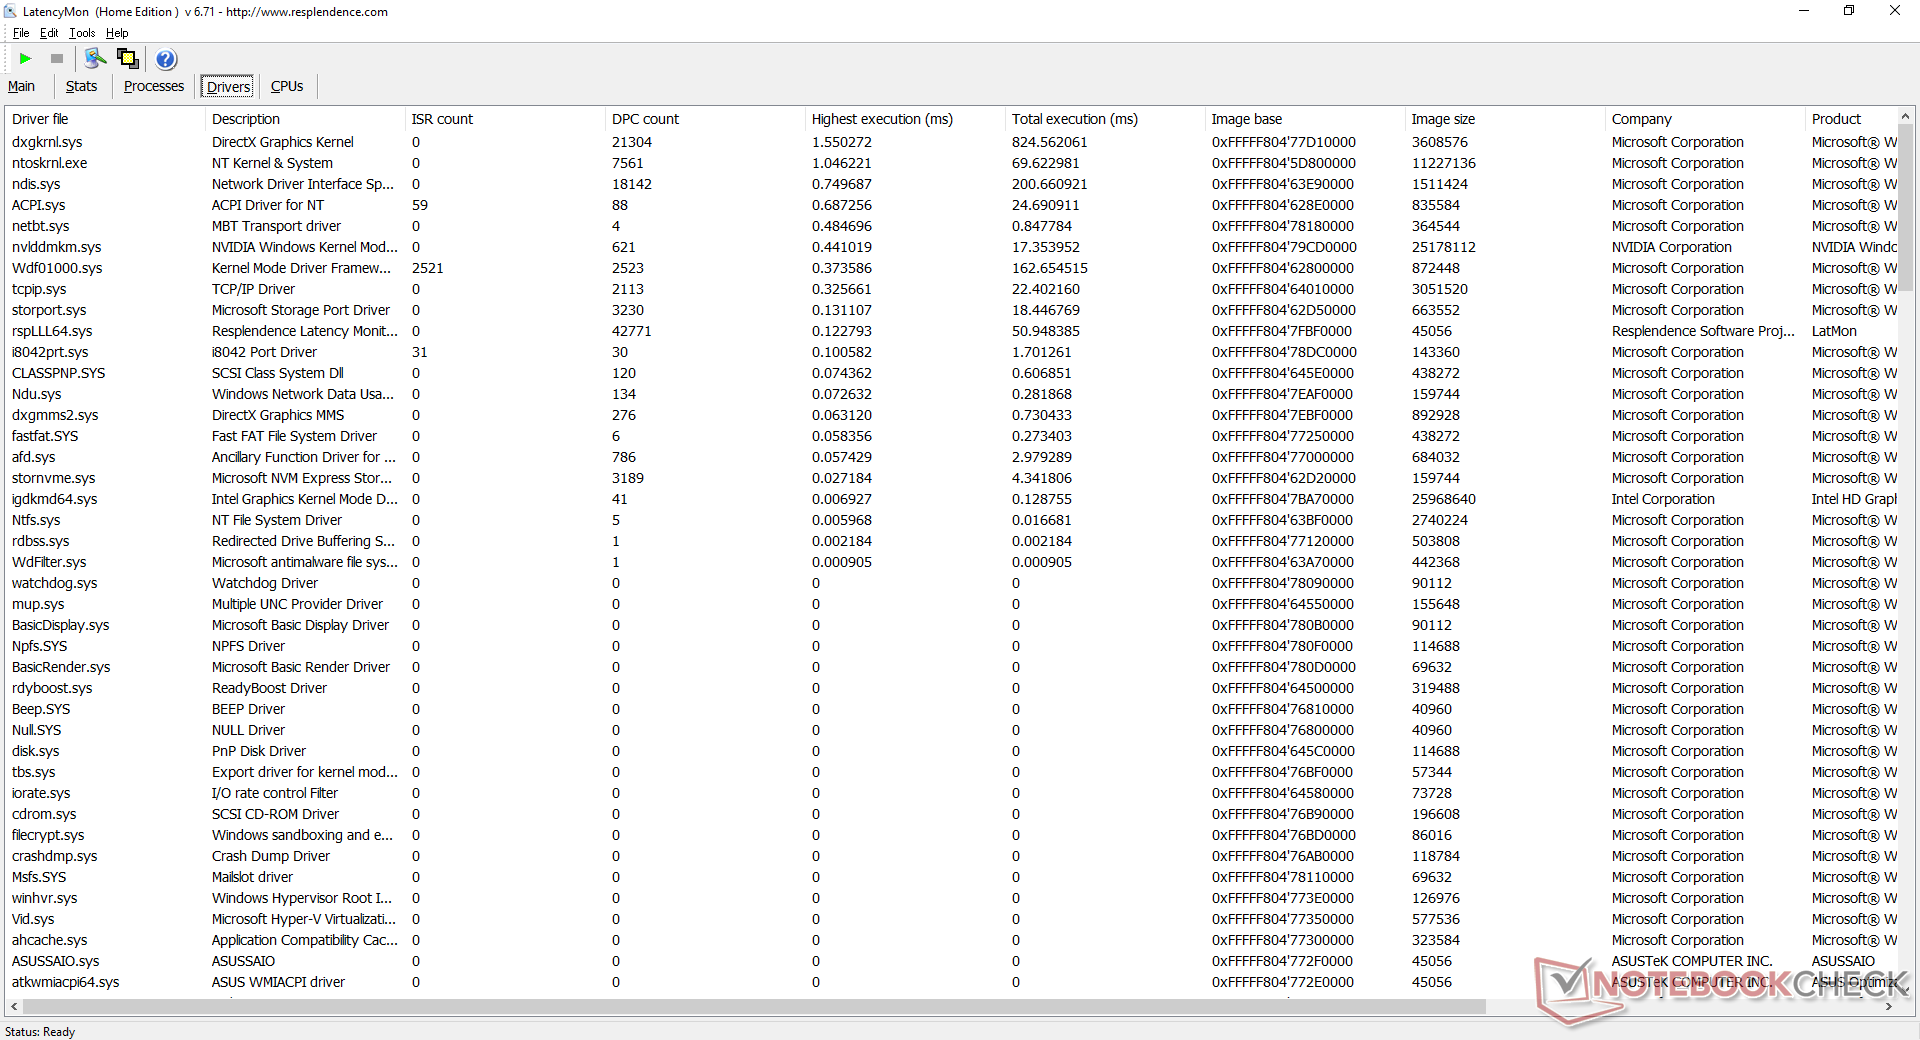
DPC Gecikmesi
LatencyMon, ana sayfamızda birden çok sekme açarken DPC gecikme sorunlarını gösteriyor. 4K60 video kayıttan yürütme başka şekilde akıcıdır ve kare atlanmadan.
| DPC Latencies / LatencyMon - interrupt to process latency (max), Web, Youtube, Prime95 | |
| Dell XPS 15 9500 Core i7 4K UHD | |
| HP Envy 15-ep0098nr | |
| Dell G5 15 SE 5505 P89F | |
| Dell XPS 15 9500 Core i5 | |
| Asus ROG Strix Scar 15 G532LWS | |
| Asus ROG Strix G15 G512LI | |
| Asus VivoBook 15 K571LI-PB71 | |
| HP Pavilion Gaming 15-ec1206ng | |
| Acer Nitro 5 AN517-52-77DS | |
* ... daha küçük daha iyidir
Storage Devices
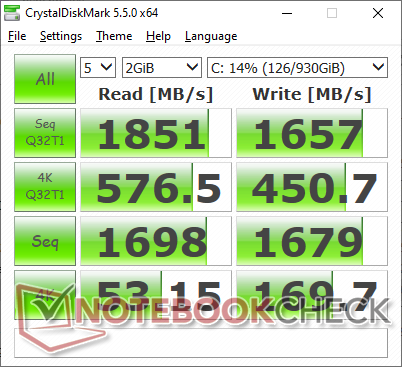
The system supports one M.2 2280 SSD and a second 2.5-inch SATA III drive which sits underneath the right palm rest. CUKUSA has configured our unit with a 1 TB Mushkin Helix MKNSSDHL1TB-08 NVMe SSD, but different drives are likely if purchased from other retailers. The Mushkin SSD is a mid-range NVMe drive with sequential read and write rates of 2110 MB/s and 1700 MB/s, respectively, to be in line with other budget to mid-range multimedia laptops like the Acer Aspire 5. Costlier laptops like Asus' own ZenBook series tend to ship with the faster Samsung PM981 drive instead.
| Asus VivoBook 15 K571LI-PB71 Mushkin Helix-L 1TB MKNSSDHL1TB-08 | HP Envy 15-ep0098nr Intel Optane Memory H10 with Solid State Storage 32GB + 512GB HBRPEKNX0202A(L/H) | Acer Aspire 5 A515-54G Kingston RBUSNS8154P3512GJ1 | Asus ZenBook 15 UX534FTC-A8190T Samsung SSD PM981 MZVLB1T0HALR | Lenovo Ideapad S540-15IML Samsung SSD PM981a MZVLB512HBJQ | Dell Inspiron 15 5000 5585 WDC PC SN520 SDAPNUW-512G | |
|---|---|---|---|---|---|---|
| AS SSD | -5% | 31% | 63% | 119% | -0% | |
| Seq Read (MB/s) | 1323 | 1005 -24% | 1405 6% | 2643 100% | 2642 100% | 398.9 -70% |
| Seq Write (MB/s) | 1572 | 436.8 -72% | 953 -39% | 1533 -2% | 2433 55% | 884 -44% |
| 4K Read (MB/s) | 38.09 | 51.5 35% | 54 42% | 49.12 29% | 58 52% | 34.54 -9% |
| 4K Write (MB/s) | 127.4 | 88 -31% | 93 -27% | 134.7 6% | 145.3 14% | 82.1 -36% |
| 4K-64 Read (MB/s) | 812 | 517 -36% | 959 18% | 1028 27% | 1431 76% | 647 -20% |
| 4K-64 Write (MB/s) | 276 | 839 204% | 772 180% | 1353 390% | 1753 535% | 985 257% |
| Access Time Read * (ms) | 0.035 | 0.088 -151% | 0.051 -46% | 0.033 6% | 0.072 -106% | 0.072 -106% |
| Access Time Write * (ms) | 0.411 | 0.151 63% | 0.044 89% | 0.028 93% | 0.027 93% | 0.047 89% |
| Score Read (Points) | 983 | 669 -32% | 1153 17% | 1342 37% | 1753 78% | 721 -27% |
| Score Write (Points) | 561 | 970 73% | 961 71% | 1641 193% | 2142 282% | 1155 106% |
| Score Total (Points) | 2066 | 1972 -5% | 2695 30% | 3622 75% | 4790 132% | 2279 10% |
| Copy ISO MB/s (MB/s) | 2846 | 1173 -59% | 2226 -22% | 862 -70% | ||
| Copy Program MB/s (MB/s) | 728 | 769 6% | 506 -30% | 457 -37% | ||
| Copy Game MB/s (MB/s) | 1610 | 1045 -35% | 1230 -24% | 902 -44% | ||
| CrystalDiskMark 5.2 / 6 | -5% | -27% | 15% | 11% | -43% | |
| Write 4K (MB/s) | 169.7 | 100.2 -41% | 100.4 -41% | 138.1 -19% | 170.7 1% | 105.9 -38% |
| Read 4K (MB/s) | 53.2 | 112.8 112% | 47.16 -11% | 45.89 -14% | 49.51 -7% | 36.56 -31% |
| Write Seq (MB/s) | 1679 | 537 -68% | 993 -41% | 2147 28% | 1156 -31% | 1165 -31% |
| Read Seq (MB/s) | 1698 | 1270 -25% | 1176 -31% | 2188 29% | 1136 -33% | 423.2 -75% |
| Write 4K Q32T1 (MB/s) | 450.7 | 480.6 7% | 354.7 -21% | 427.8 -5% | 420.5 -7% | 332.1 -26% |
| Read 4K Q32T1 (MB/s) | 577 | 364.9 -37% | 473 -18% | 404 -30% | 527 -9% | 229.3 -60% |
| Write Seq Q32T1 (MB/s) | 1657 | 1224 -26% | 1034 -38% | 2396 45% | 2984 80% | 1460 -12% |
| Read Seq Q32T1 (MB/s) | 1851 | 2635 42% | 1635 -12% | 3454 87% | 3550 92% | 472.5 -74% |
| Toplam Ortalama (Program / Ayarlar) | -5% /
-5% | 2% /
7% | 39% /
45% | 65% /
74% | -22% /
-16% |
* ... daha küçük daha iyidir

Disk Throttling: DiskSpd Read Loop, Queue Depth 8
GPU Performance
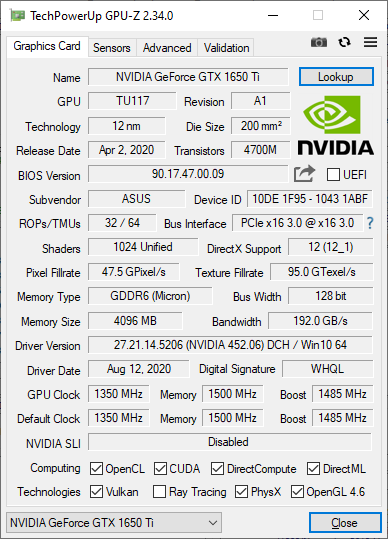
The mobile GeForce GTX 1650 Ti straddles the line between a multimedia GPU and a full-fledged gaming GPU. Overall performance is most similar to the mobile GTX 1060 especially when running DX12 titles. Graphics performance is where we expect it to be relative to other laptops with the same GPU option.
See our dedicated page on the mobile GTX 1650 Ti for more technical information and benchmarks.
| 3DMark 11 | |
| 1280x720 Performance GPU | |
| MSI RTX 2060 Gaming Z 6G | |
| Dell G5 15 SE 5505 P89F | |
| HP Envy 15-ep0098nr | |
| Schenker XMG Core 15 GK5CP6V | |
| MSI P65 8RF-451 - Creator | |
| MSI Alpha 15 A3DDK-034 | |
| Acer Aspire VN7-593G-73HP V15 Nitro BE | |
| Ortalama NVIDIA GeForce GTX 1650 Ti Mobile (12865 - 14415, n=8) | |
| Asus VivoBook 15 K571LI-PB71 | |
| HP Pavilion Gaming 15-ec1206ng | |
| Lenovo IdeaPad 5 15IIL05 | |
| Lenovo Ideapad S540-15IML | |
| HP Envy x360 15-ee0257ng | |
| 1280x720 Performance Combined | |
| MSI RTX 2060 Gaming Z 6G | |
| Dell G5 15 SE 5505 P89F | |
| HP Envy 15-ep0098nr | |
| Schenker XMG Core 15 GK5CP6V | |
| Ortalama NVIDIA GeForce GTX 1650 Ti Mobile (9749 - 13027, n=8) | |
| HP Pavilion Gaming 15-ec1206ng | |
| Asus VivoBook 15 K571LI-PB71 | |
| MSI P65 8RF-451 - Creator | |
| Acer Aspire VN7-593G-73HP V15 Nitro BE | |
| MSI Alpha 15 A3DDK-034 | |
| Lenovo IdeaPad 5 15IIL05 | |
| Lenovo Ideapad S540-15IML | |
| HP Envy x360 15-ee0257ng | |
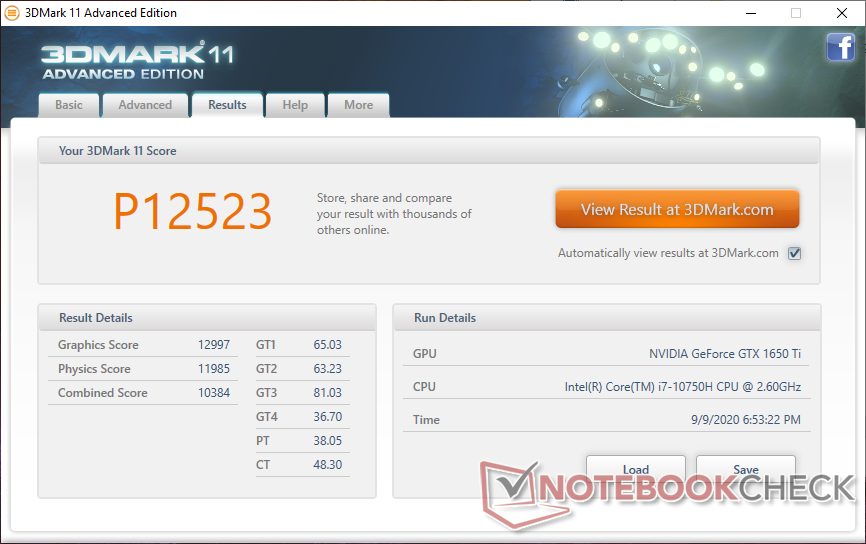
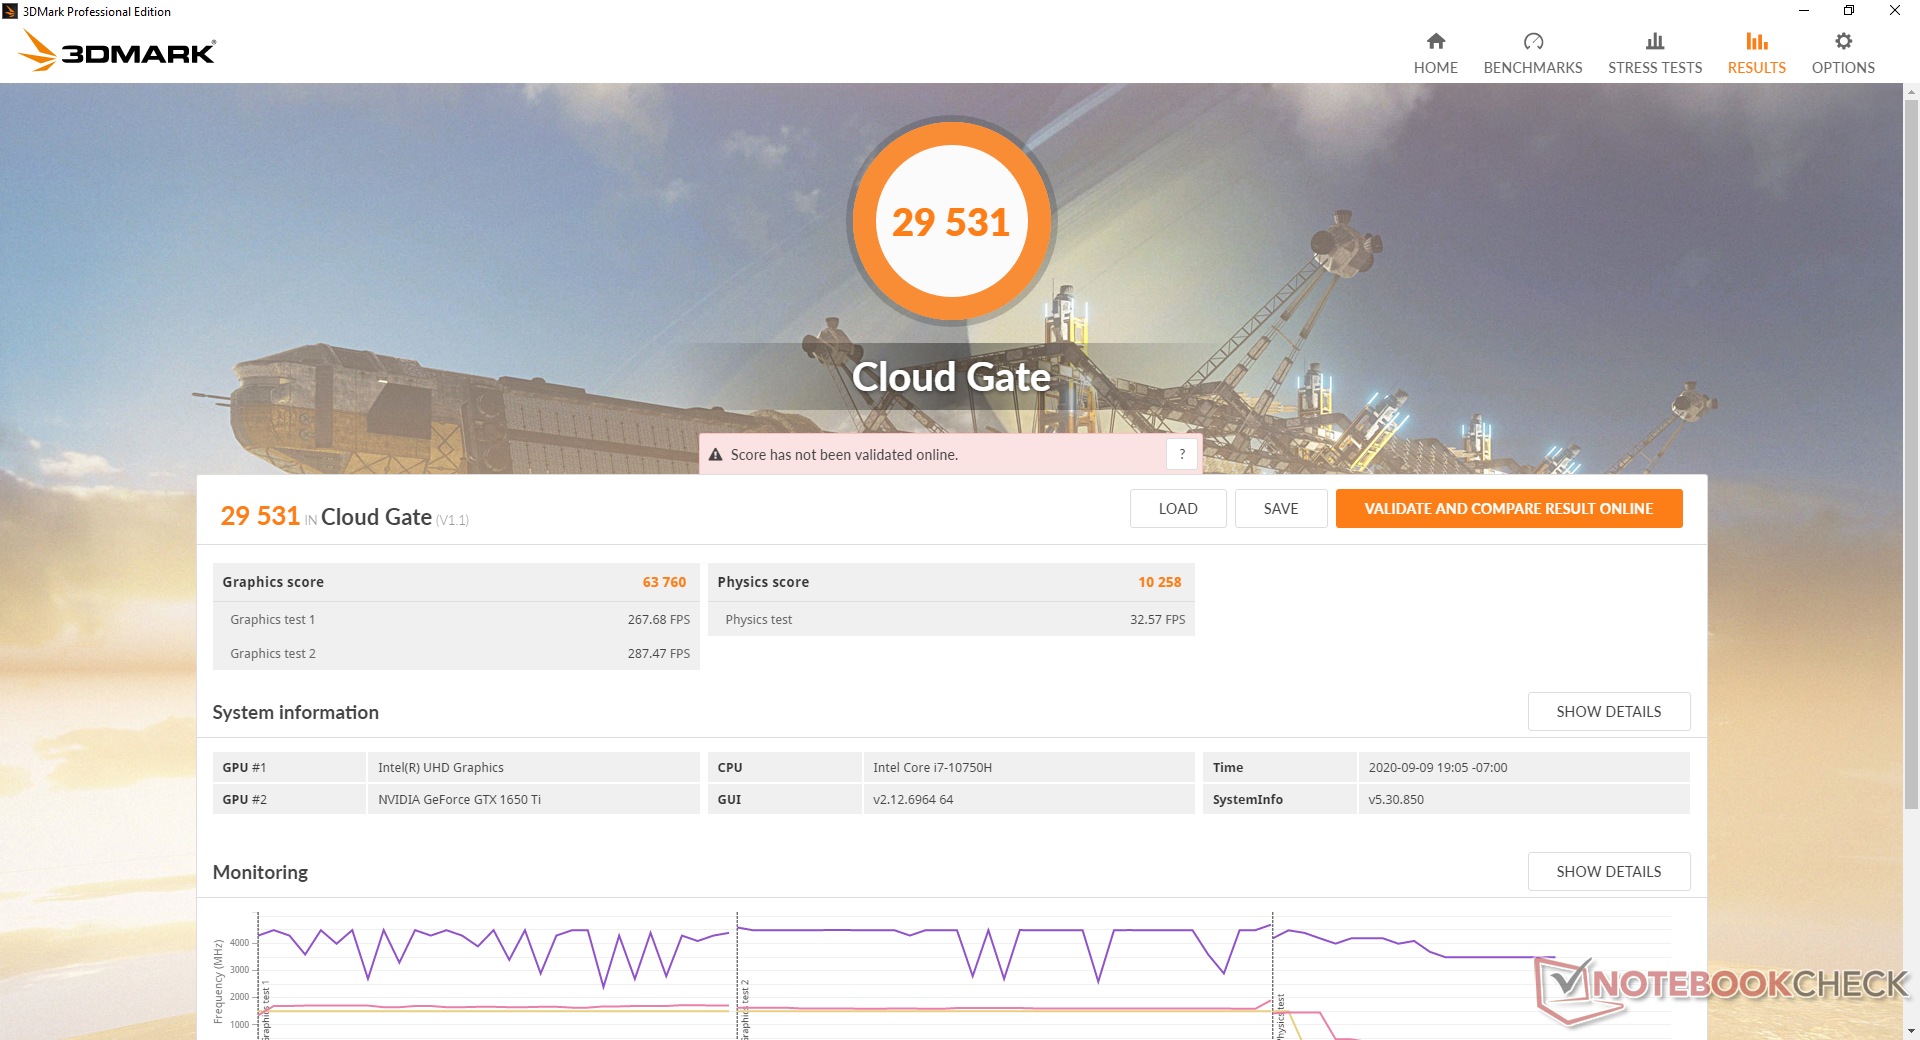
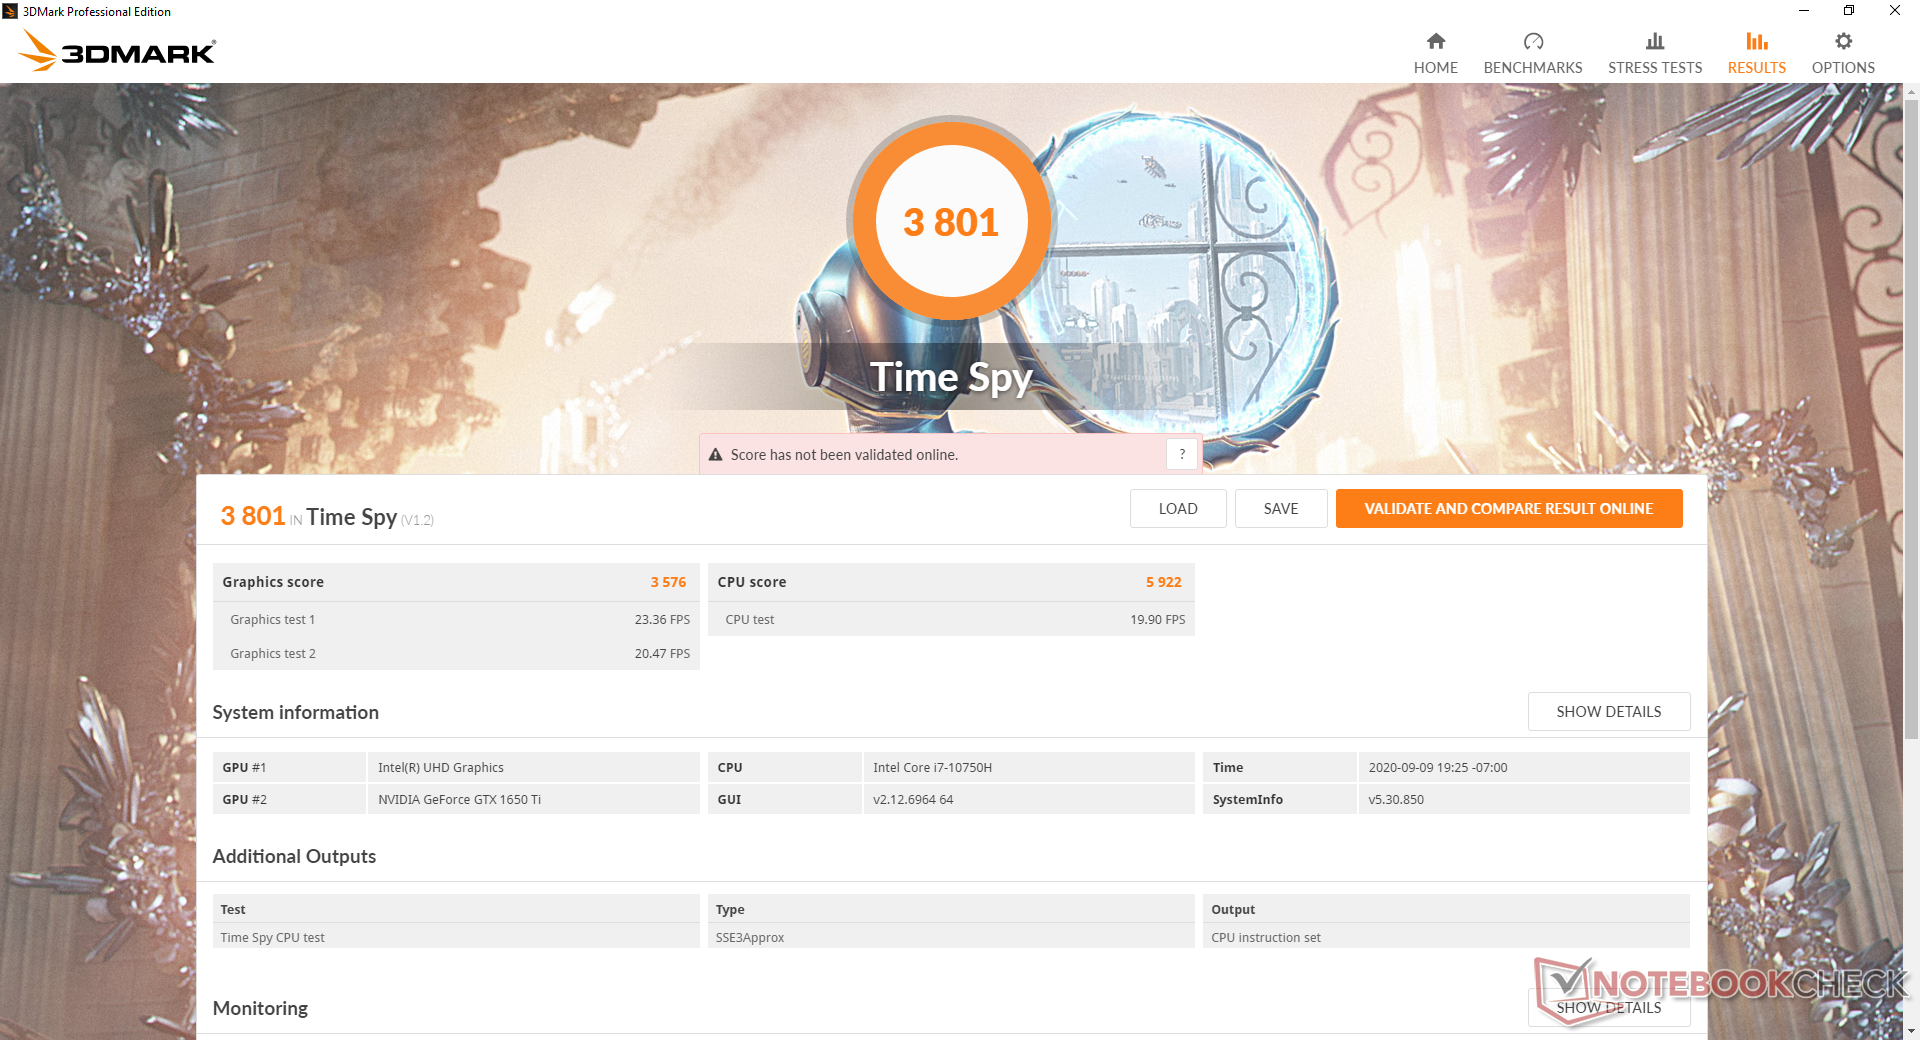
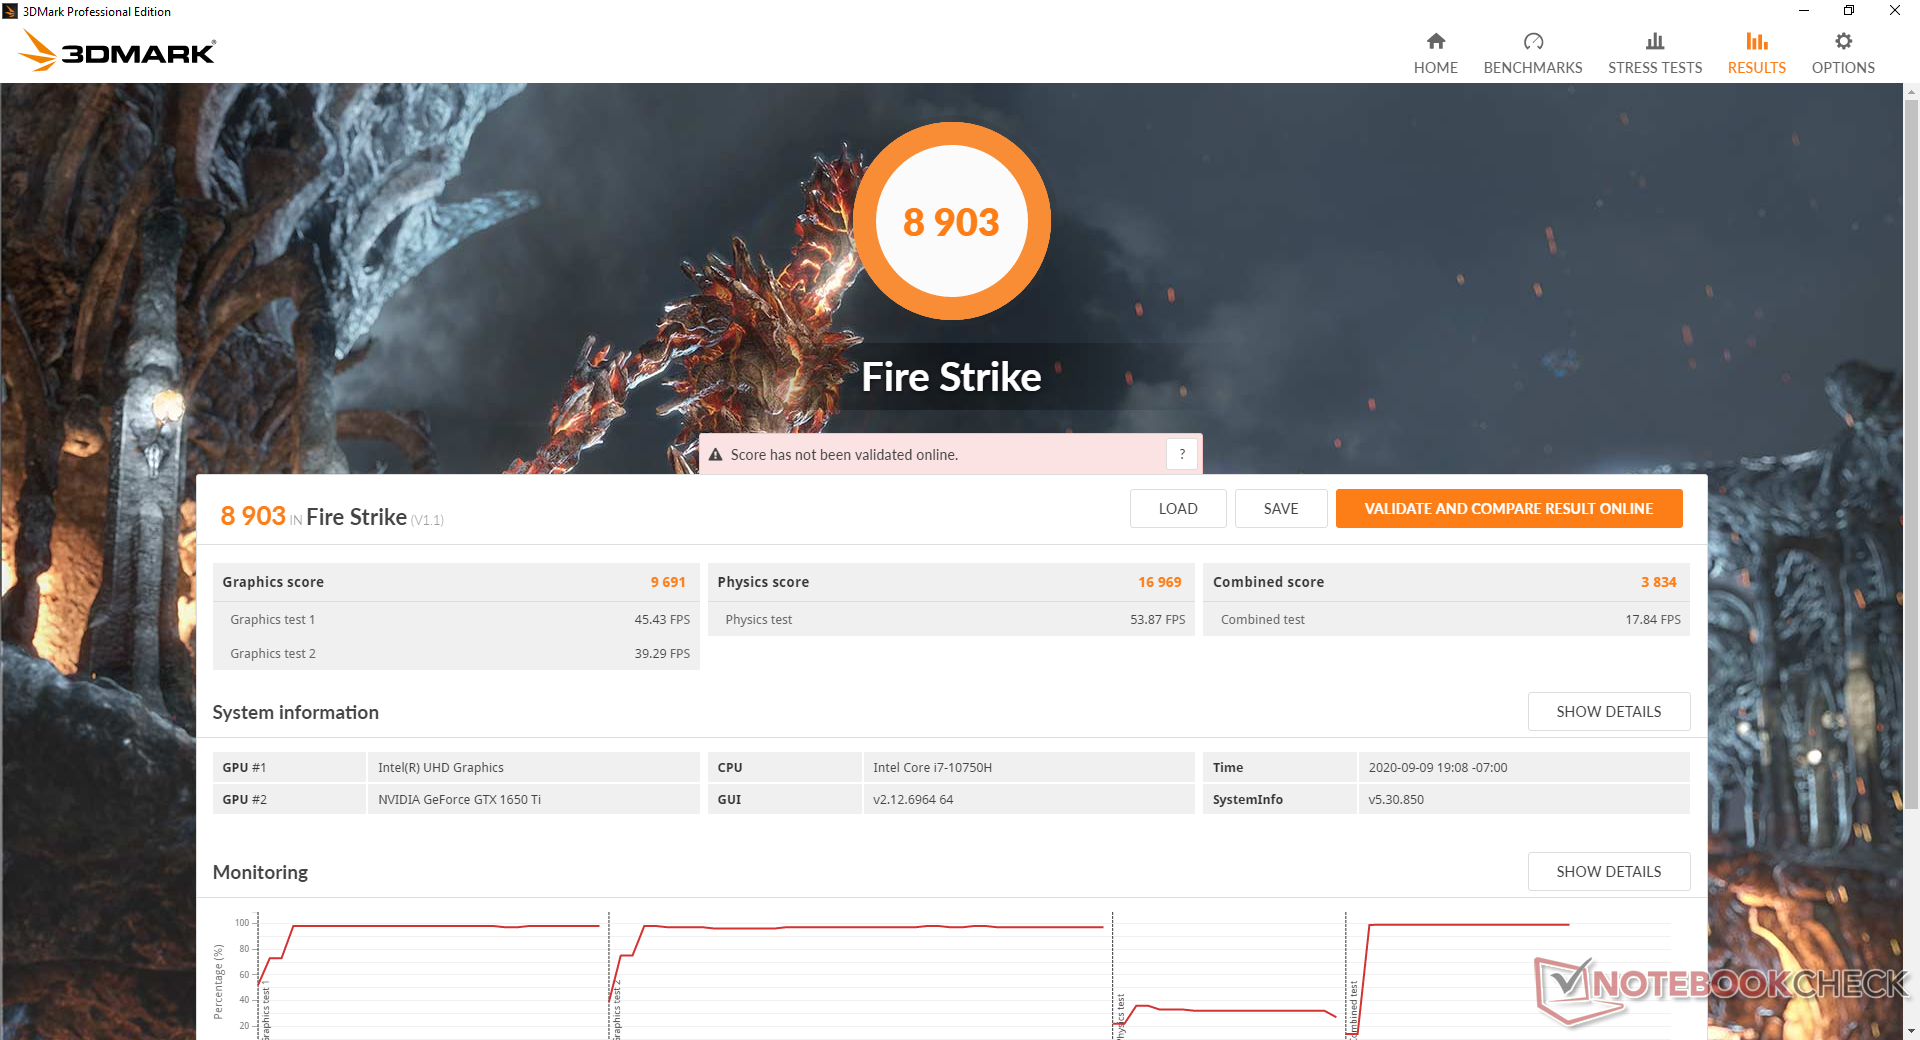
| 3DMark 11 Performance | 12523 puan | |
| 3DMark Cloud Gate Standard Score | 29531 puan | |
| 3DMark Fire Strike Score | 8903 puan | |
| 3DMark Time Spy Score | 3801 puan | |
Yardım | ||
| Final Fantasy XV Benchmark | |
| 1280x720 Lite Quality | |
| MSI RTX 2060 Gaming Z 6G | |
| HP Envy 15-ep0098nr | |
| Asus VivoBook 15 K571LI-PB71 | |
| MSI Alpha 15 A3DDK-034 | |
| 1920x1080 Standard Quality | |
| MSI RTX 2060 Gaming Z 6G | |
| HP Envy 15-ep0098nr | |
| MSI Alpha 15 A3DDK-034 | |
| Asus VivoBook 15 K571LI-PB71 | |
| 1920x1080 High Quality | |
| MSI RTX 2060 Gaming Z 6G | |
| HP Envy 15-ep0098nr | |
| Asus VivoBook 15 K571LI-PB71 | |
| MSI Alpha 15 A3DDK-034 | |
| düşük | orta | yüksek | ultra | |
|---|---|---|---|---|
| The Witcher 3 (2015) | 199.3 | 126.6 | 74.5 | 38.8 |
| Dota 2 Reborn (2015) | 138 | 124 | 115 | 109 |
| Final Fantasy XV Benchmark (2018) | 104 | 54.9 | 39.3 | |
| X-Plane 11.11 (2018) | 95.6 | 80.5 | 71 |
Emissions
System Noise
Fan noise is always active at a minimum of 31.9 dB(A) against a background of 25.7 dB(A) even when on the Power Saver profile. Though not loud enough to be bothersome, it's still audible when working in quieter environments like classrooms or libraries compared to newer Ultrabooks which are usually silent on Power Saver mode.
Running higher loads like games will induce a fan noise of 43.9 dB(A) up to even 50 dB(A) to be more like a gaming laptop than a multimedia laptop. The HP Pavilion Gaming 15 behaves similarly when under gaming loads but it is generally quieter across the board.
| Asus VivoBook 15 K571LI-PB71 GeForce GTX 1650 Ti Mobile, i7-10750H, Mushkin Helix-L 1TB MKNSSDHL1TB-08 | HP Envy 15-ep0098nr GeForce RTX 2060 Max-Q, i7-10750H, Intel Optane Memory H10 with Solid State Storage 32GB + 512GB HBRPEKNX0202A(L/H) | Acer Aspire 5 A515-54G GeForce MX250, i5-10210U, Kingston RBUSNS8154P3512GJ1 | Asus ZenBook 15 UX534FTC-A8190T GeForce GTX 1650 Max-Q, i7-10510U, Samsung SSD PM981 MZVLB1T0HALR | Lenovo Ideapad S540-15IML GeForce MX250, i5-10210U, Samsung SSD PM981a MZVLB512HBJQ | Dell Inspiron 15 5000 5585 Vega 10, R7 3700U, WDC PC SN520 SDAPNUW-512G | |
|---|---|---|---|---|---|---|
| Noise | -8% | 7% | 9% | 1% | 11% | |
| kapalı / ortam * (dB) | 25.7 | 26.4 -3% | 29.8 -16% | 30.3 -18% | 30 -17% | 28.3 -10% |
| Idle Minimum * (dB) | 31.9 | 32.2 -1% | 29.8 7% | 30.3 5% | 30 6% | 28.3 11% |
| Idle Average * (dB) | 31.9 | 32.2 -1% | 29.8 7% | 30.3 5% | 32 -0% | 28.3 11% |
| Idle Maximum * (dB) | 31.9 | 32.2 -1% | 29.8 7% | 30.9 3% | 37 -16% | 28.3 11% |
| Load Average * (dB) | 44.2 | 48.3 -9% | 37.3 16% | 31.3 29% | 41 7% | 31.4 29% |
| Witcher 3 ultra * (dB) | 43.9 | 53.7 -22% | 38.1 13% | 39 11% | 41.4 6% | |
| Load Maximum * (dB) | 50.7 | 58.8 -16% | 40.1 21% | 38.2 25% | 42 17% | 41.4 18% |
* ... daha küçük daha iyidir
Ses yüksekliği
| Boşta |
| 31.9 / 31.9 / 31.9 dB |
| Çalışırken |
| 44.2 / 50.7 dB |
 | ||
30 dB sessiz 40 dB(A) duyulabilirlik 50 dB(A) gürültülü |
||
min: | ||
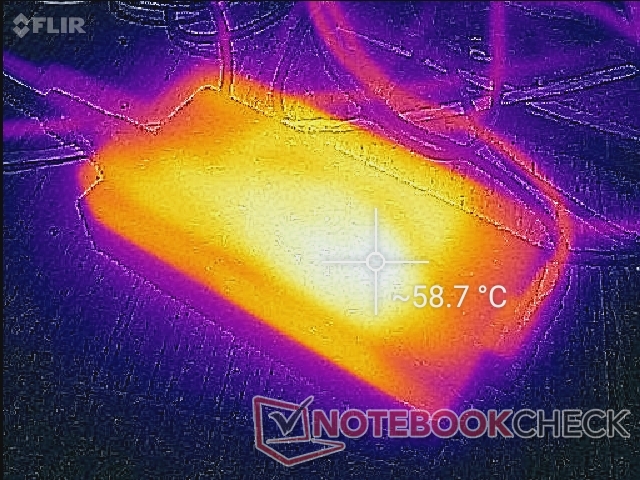
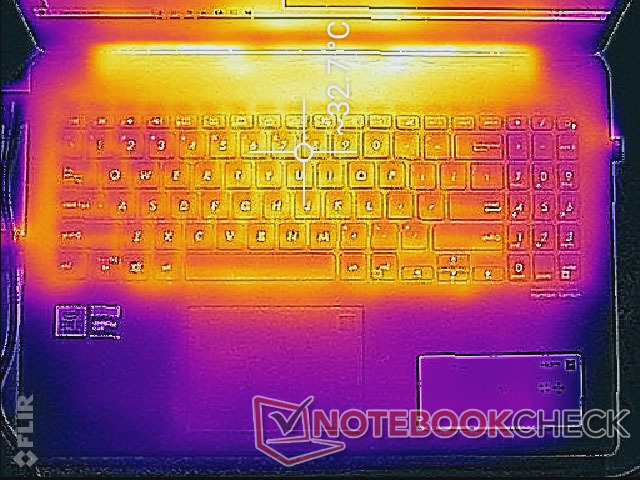
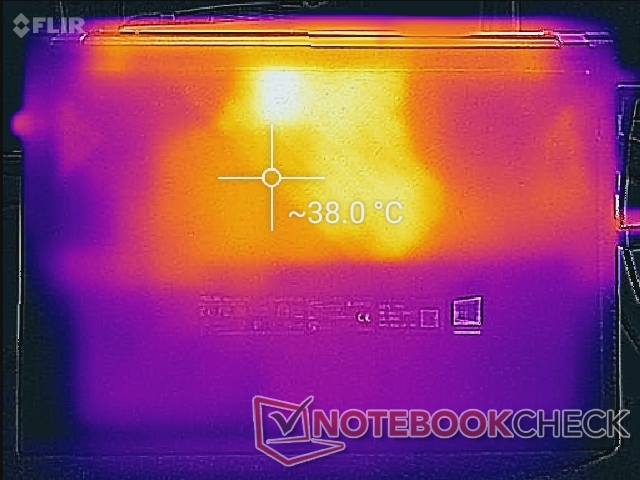
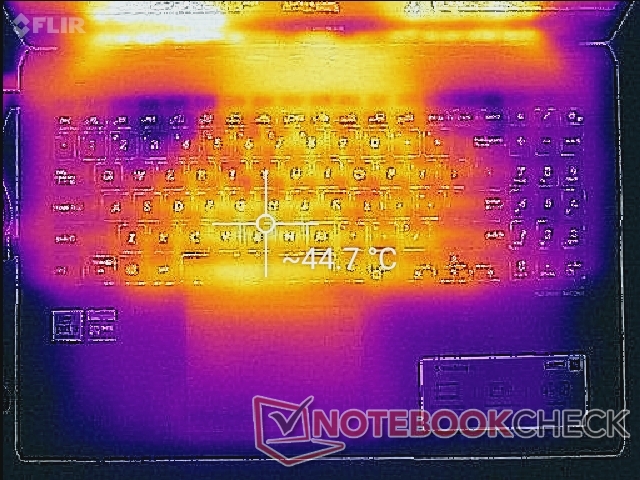
Temperature
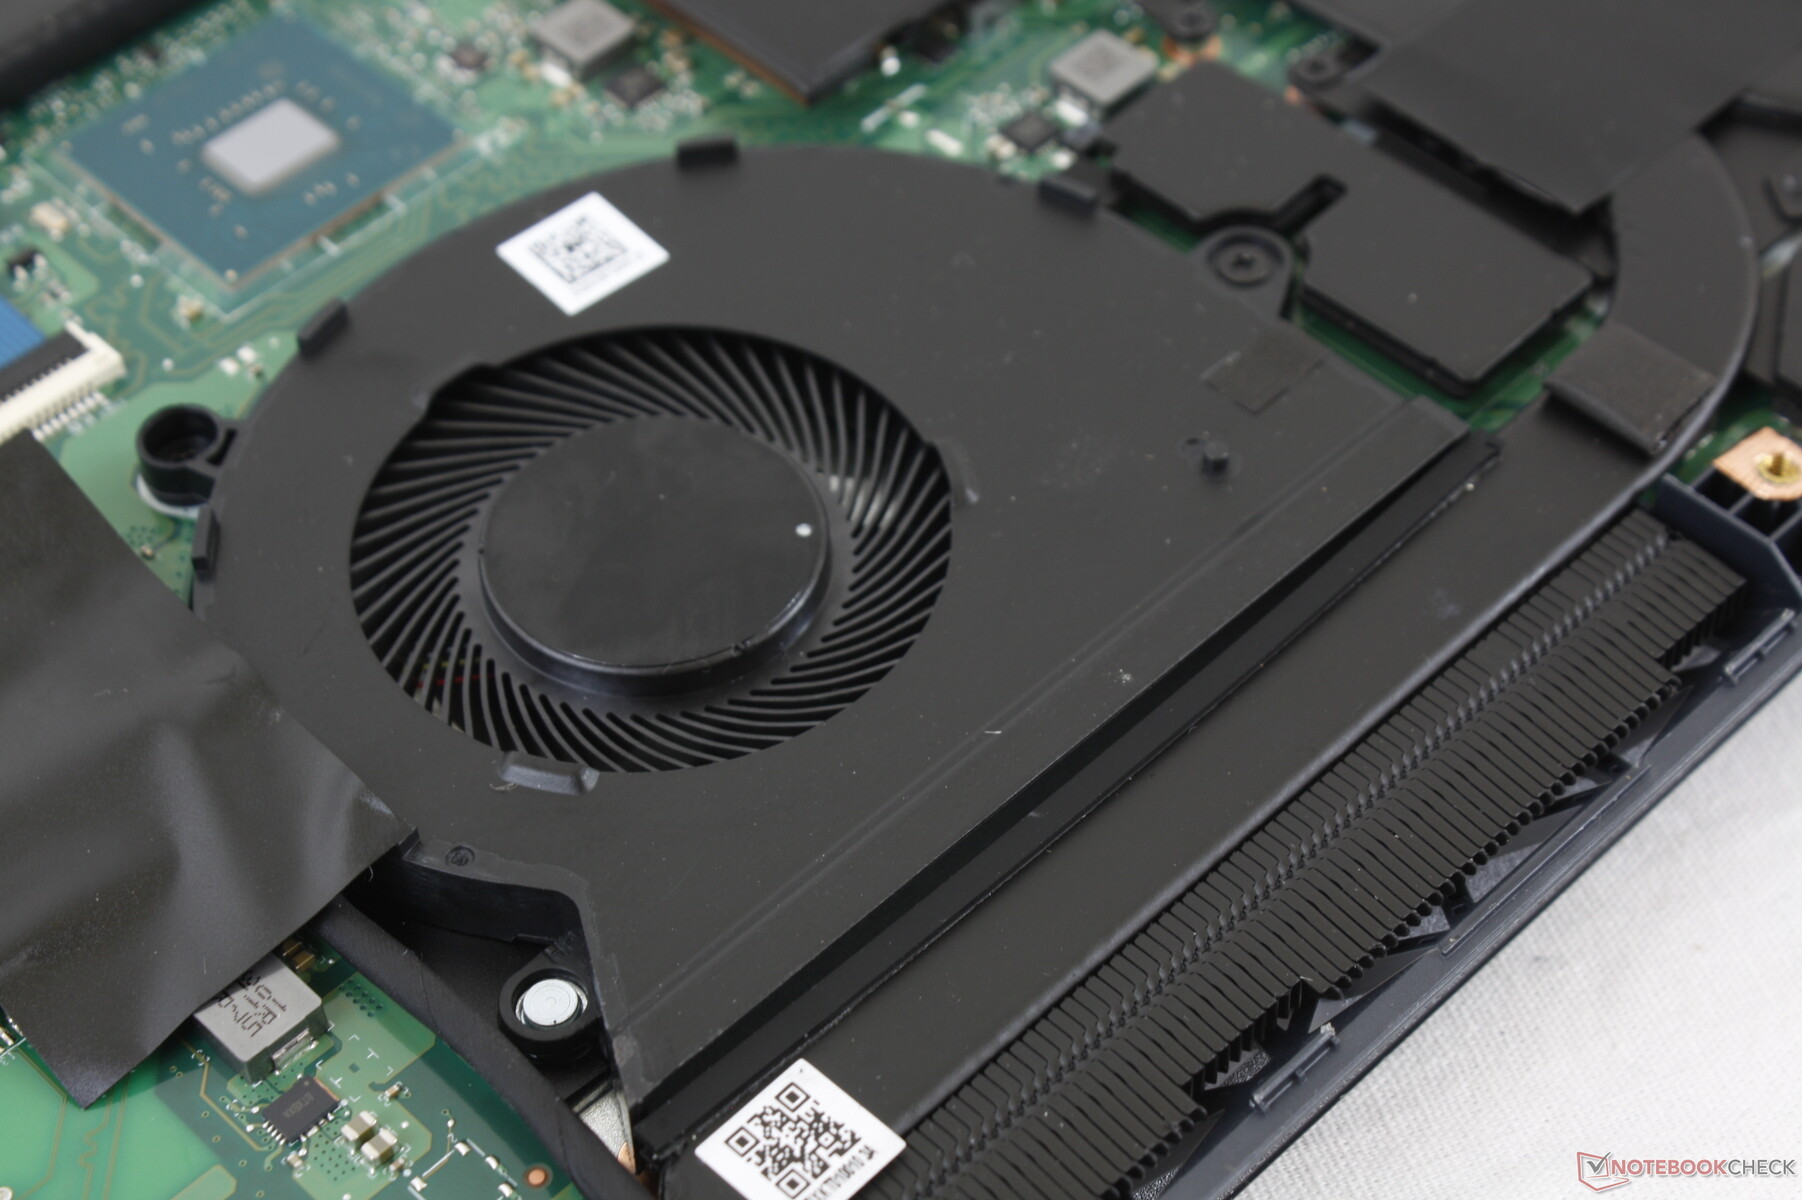
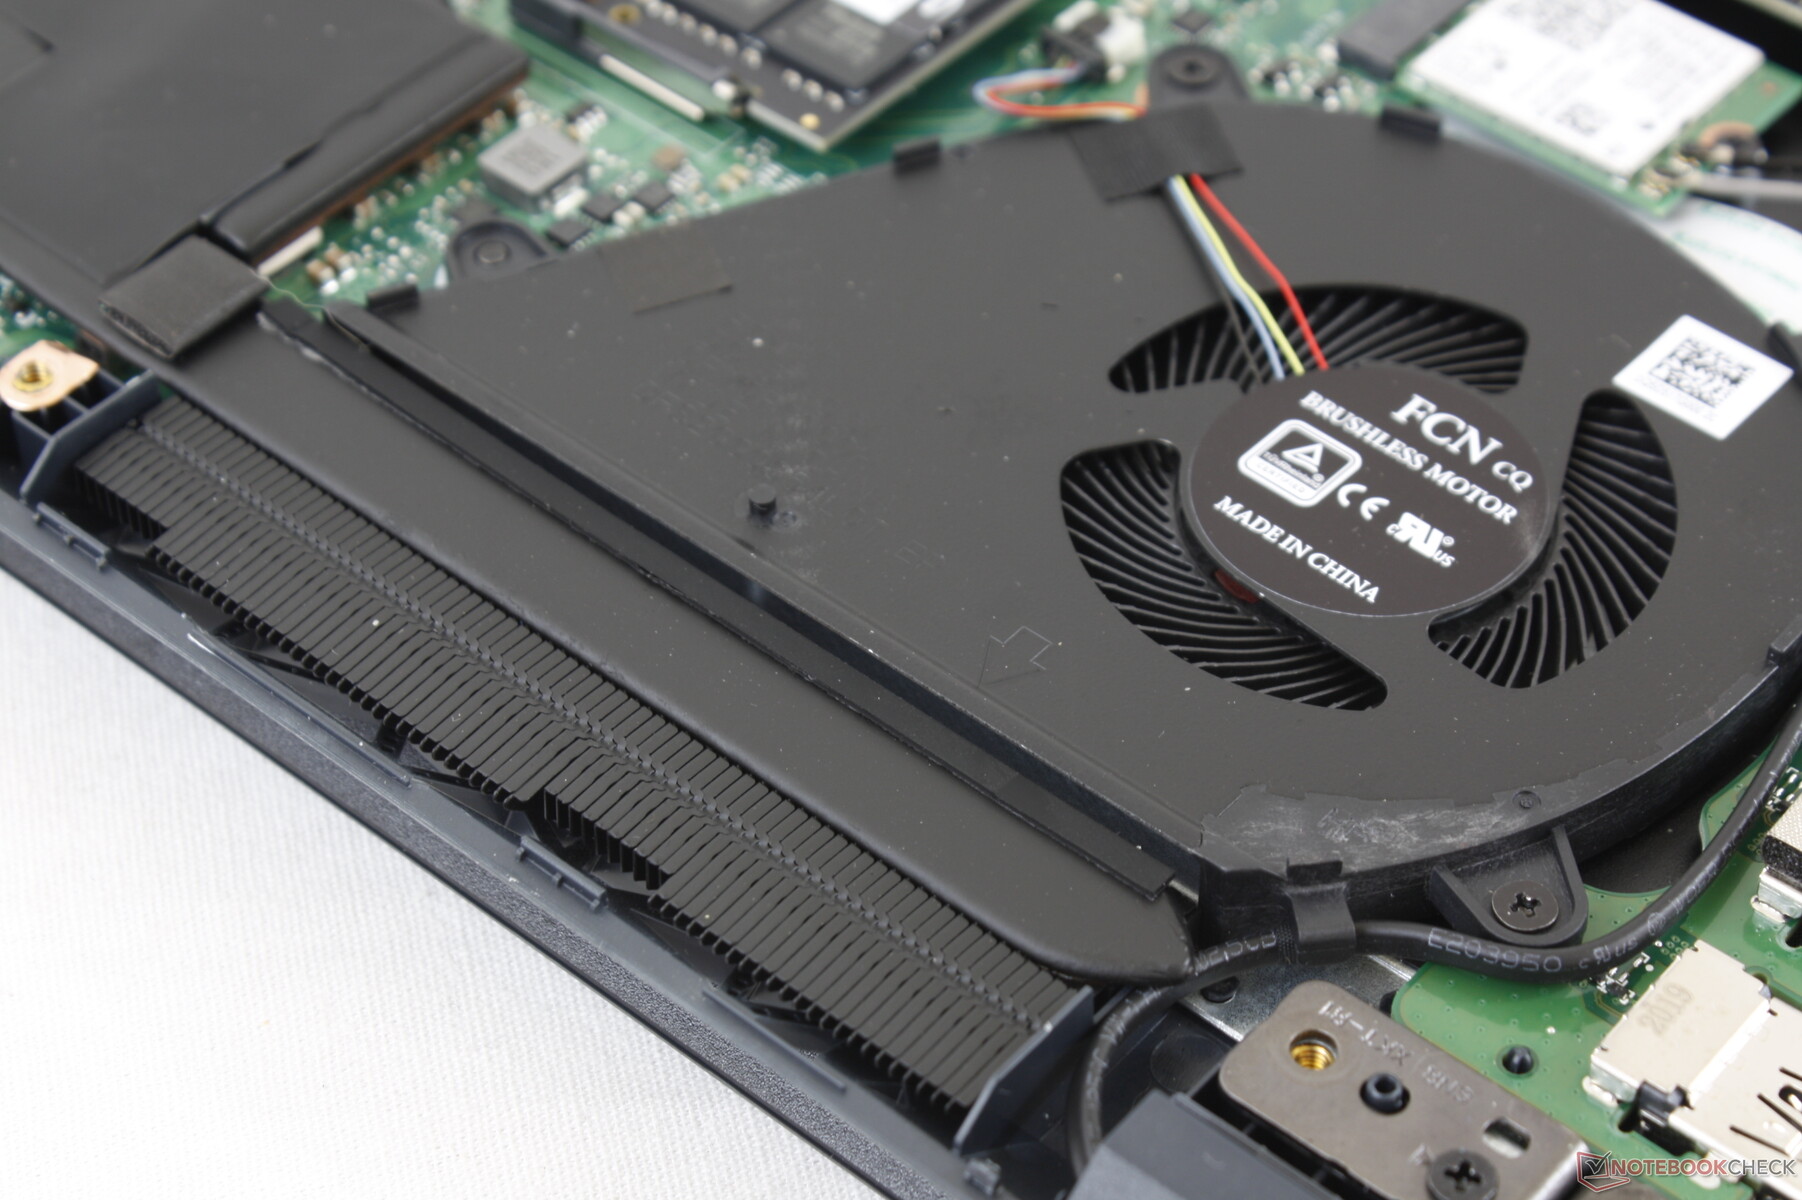
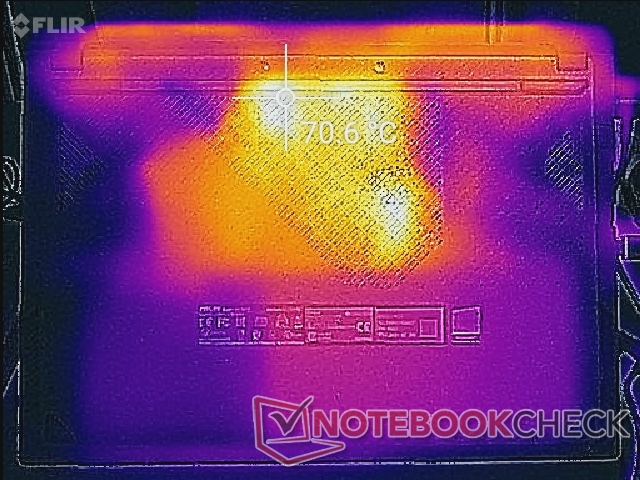
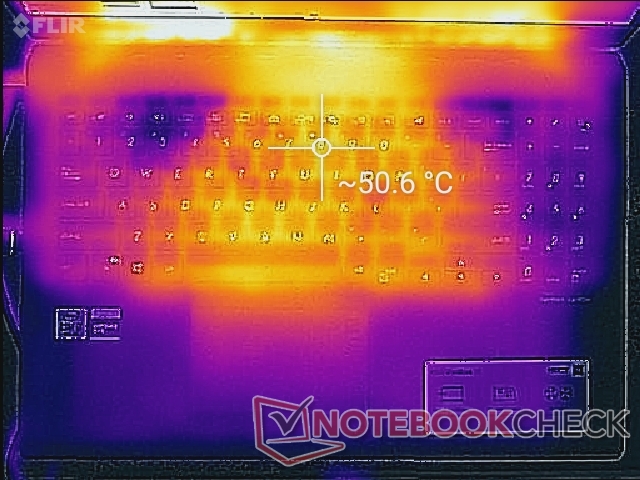
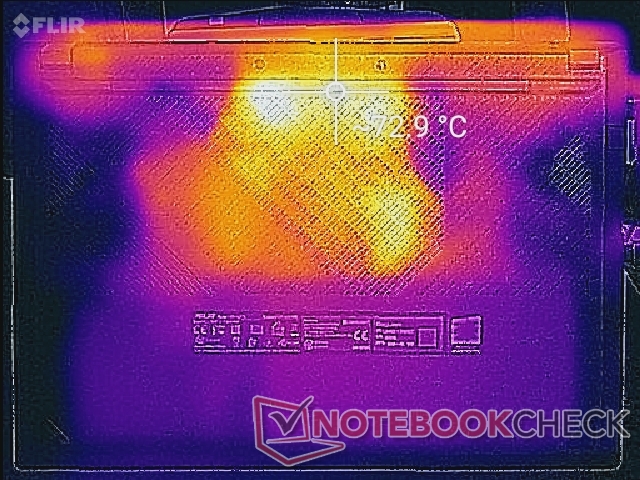
Surface temperatures are quite warm even when simply idling on desktop with hot spots reaching over 32 C and 38 C on the top and bottom, respectively. These same spots can become as warm as 44 C to even 70 C on the bottom since the heat pipes are touching the bottom plate. These areas are thankfully toward the rear of the chassis and away from the palm rests, though we still recommend using a flat desk when running such extreme loads.
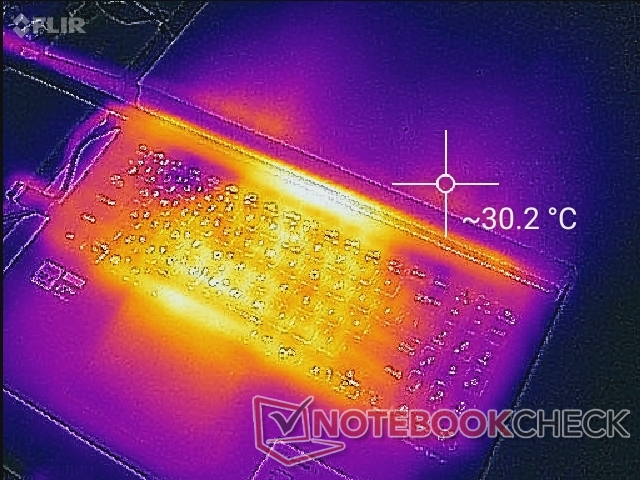
(-) Üst taraftaki maksimum sıcaklık, 36.8 °C / 98 F ortalamasına kıyasla 53 °C / 127 F'dir. , Multimedia sınıfı için 21 ile 71 °C arasında değişir.
(-) Alt kısım, 39.1 °C / 102 F ortalamasına kıyasla maksimum 72 °C / 162 F'ye kadar ısınır
(+) Boşta kullanımda, üst tarafın ortalama sıcaklığı 28.9 °C / 84 F olup, cihazın 31.3 °C / 88 F.
(±) The Witcher 3 oynarken, üst tarafın ortalama sıcaklığı 34.7 °C / 94 F olup, cihazın 31.3 °C / 88 F.
(+) Avuç içi dayanakları ve dokunmatik yüzey, maksimum 30 °C / 86 F ile cilt sıcaklığından daha soğuktur ve bu nedenle dokunulduğunda soğuktur.
(±) Benzer cihazların avuç içi dayanağı alanının ortalama sıcaklığı 28.7 °C / 83.7 F (-1.3 °C / -2.3 F) idi.
Stress Test
When running Prime95, CPU clock rates would boost to 4.2 GHz until hitting a core temperature of 95 C about 10 seconds later. Thereafter, clock rates drop to the 3.1 to 3.2 GHz range in order to maintain a cooler temperature of 76 C. The Alienware m15 R3 with the same Core i7-10750H stabilizes at a much higher 4.2 GHz when under similar conditions which explains our slower-than-average CineBench results above for the Asus.
When gaming, CPU and GPU temperatures would stabilize at 87 C and 78 C, respectively, compared to 71 C and 68 C on the HP Pavilion Gaming 15. Such temperatures are very warm to suggest that the cooling solution was tailored specifically for the TDP levels of the Core H-series CPU and GTX 1650 Ti GPU and not any higher.
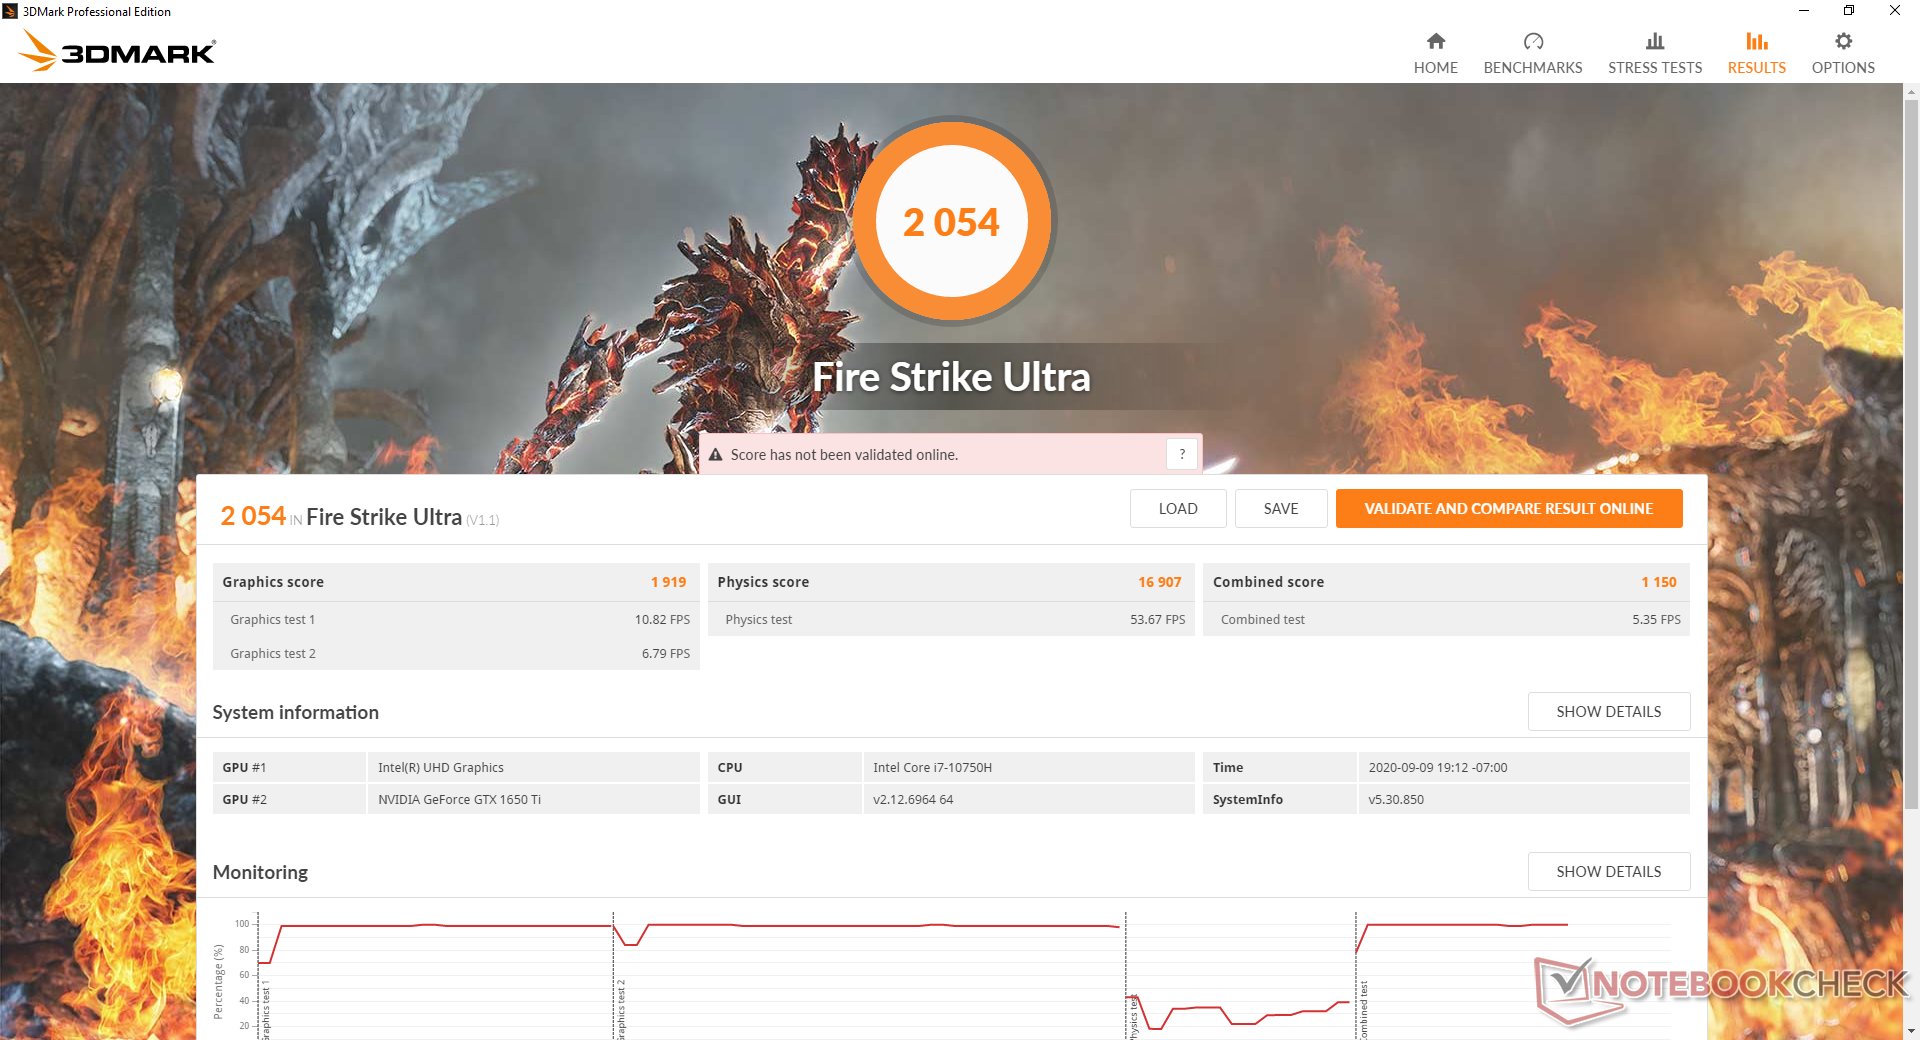
Running on batteries will limit performance. A Fire Strike test on battery power would return Physics and Graphics scores of 10274 and 7804 points, respectively, compared to 16969 and 9691 points when on mains.
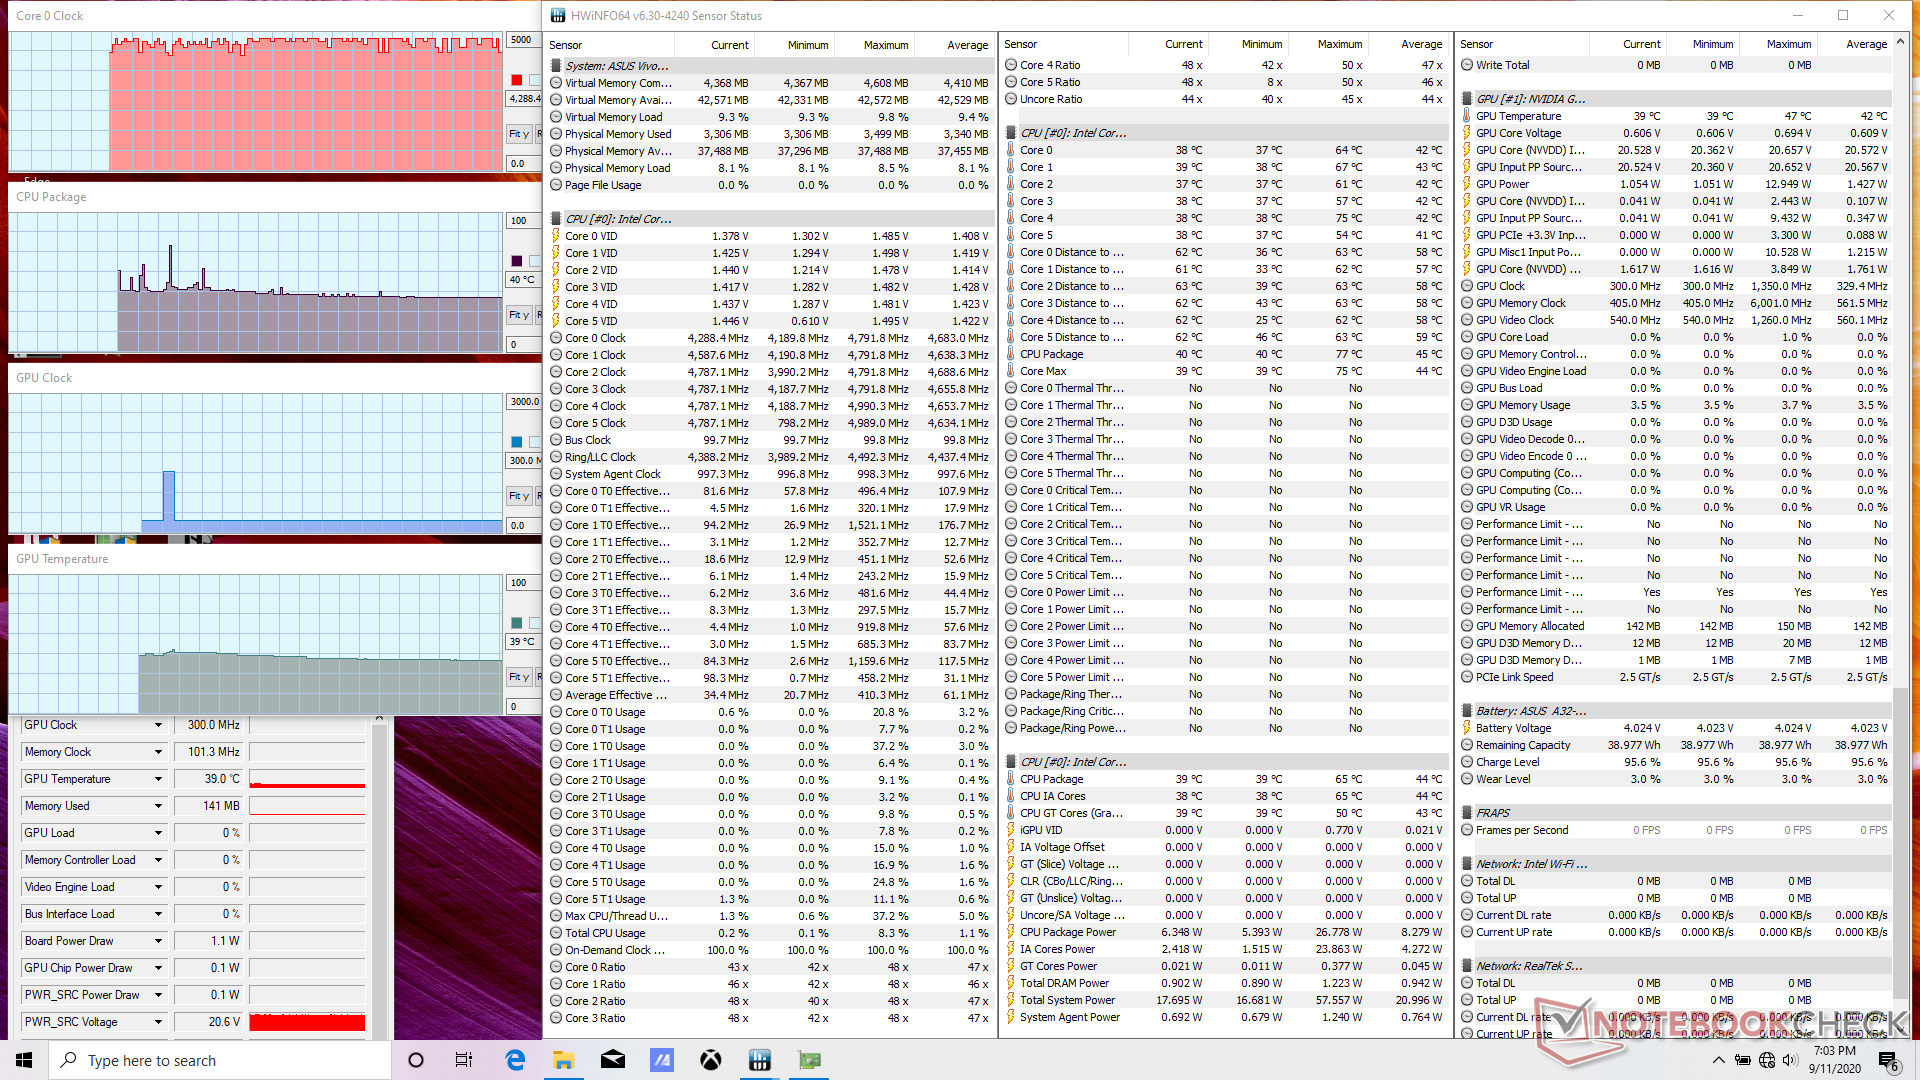
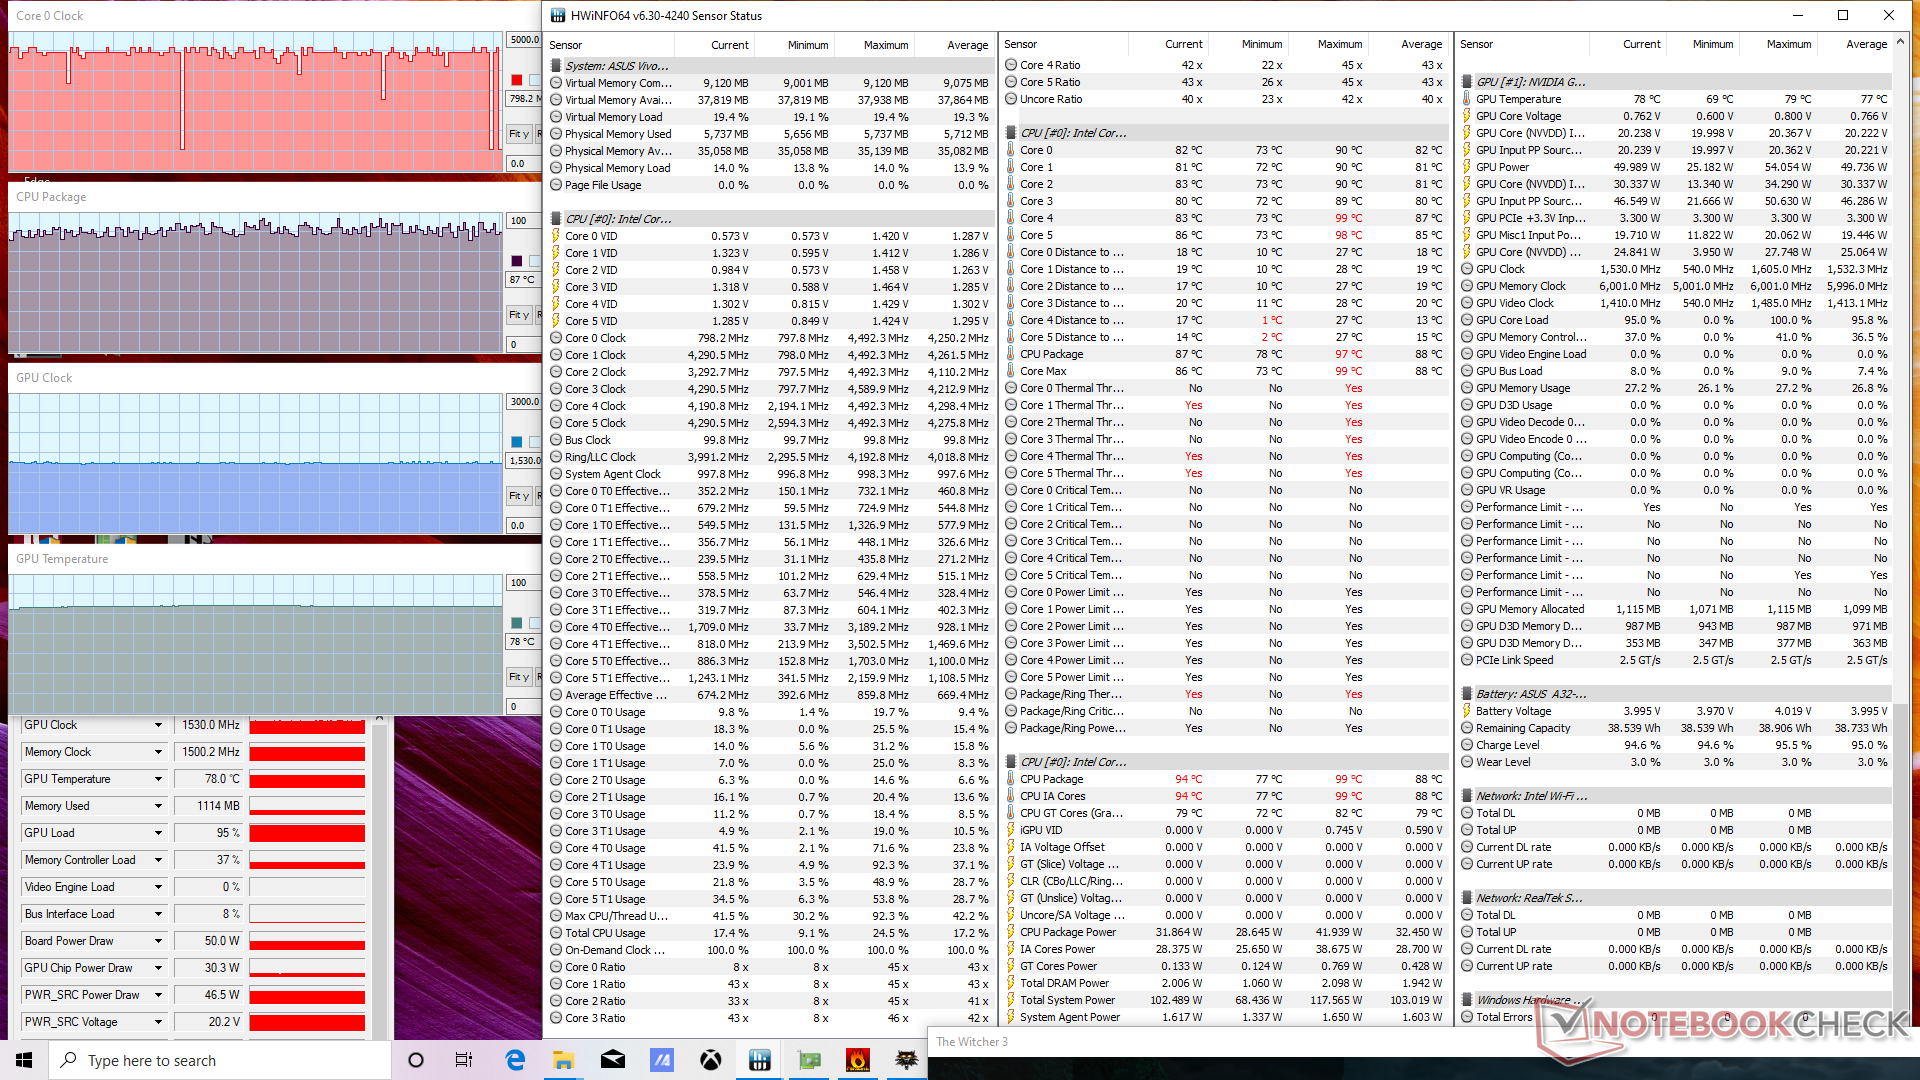
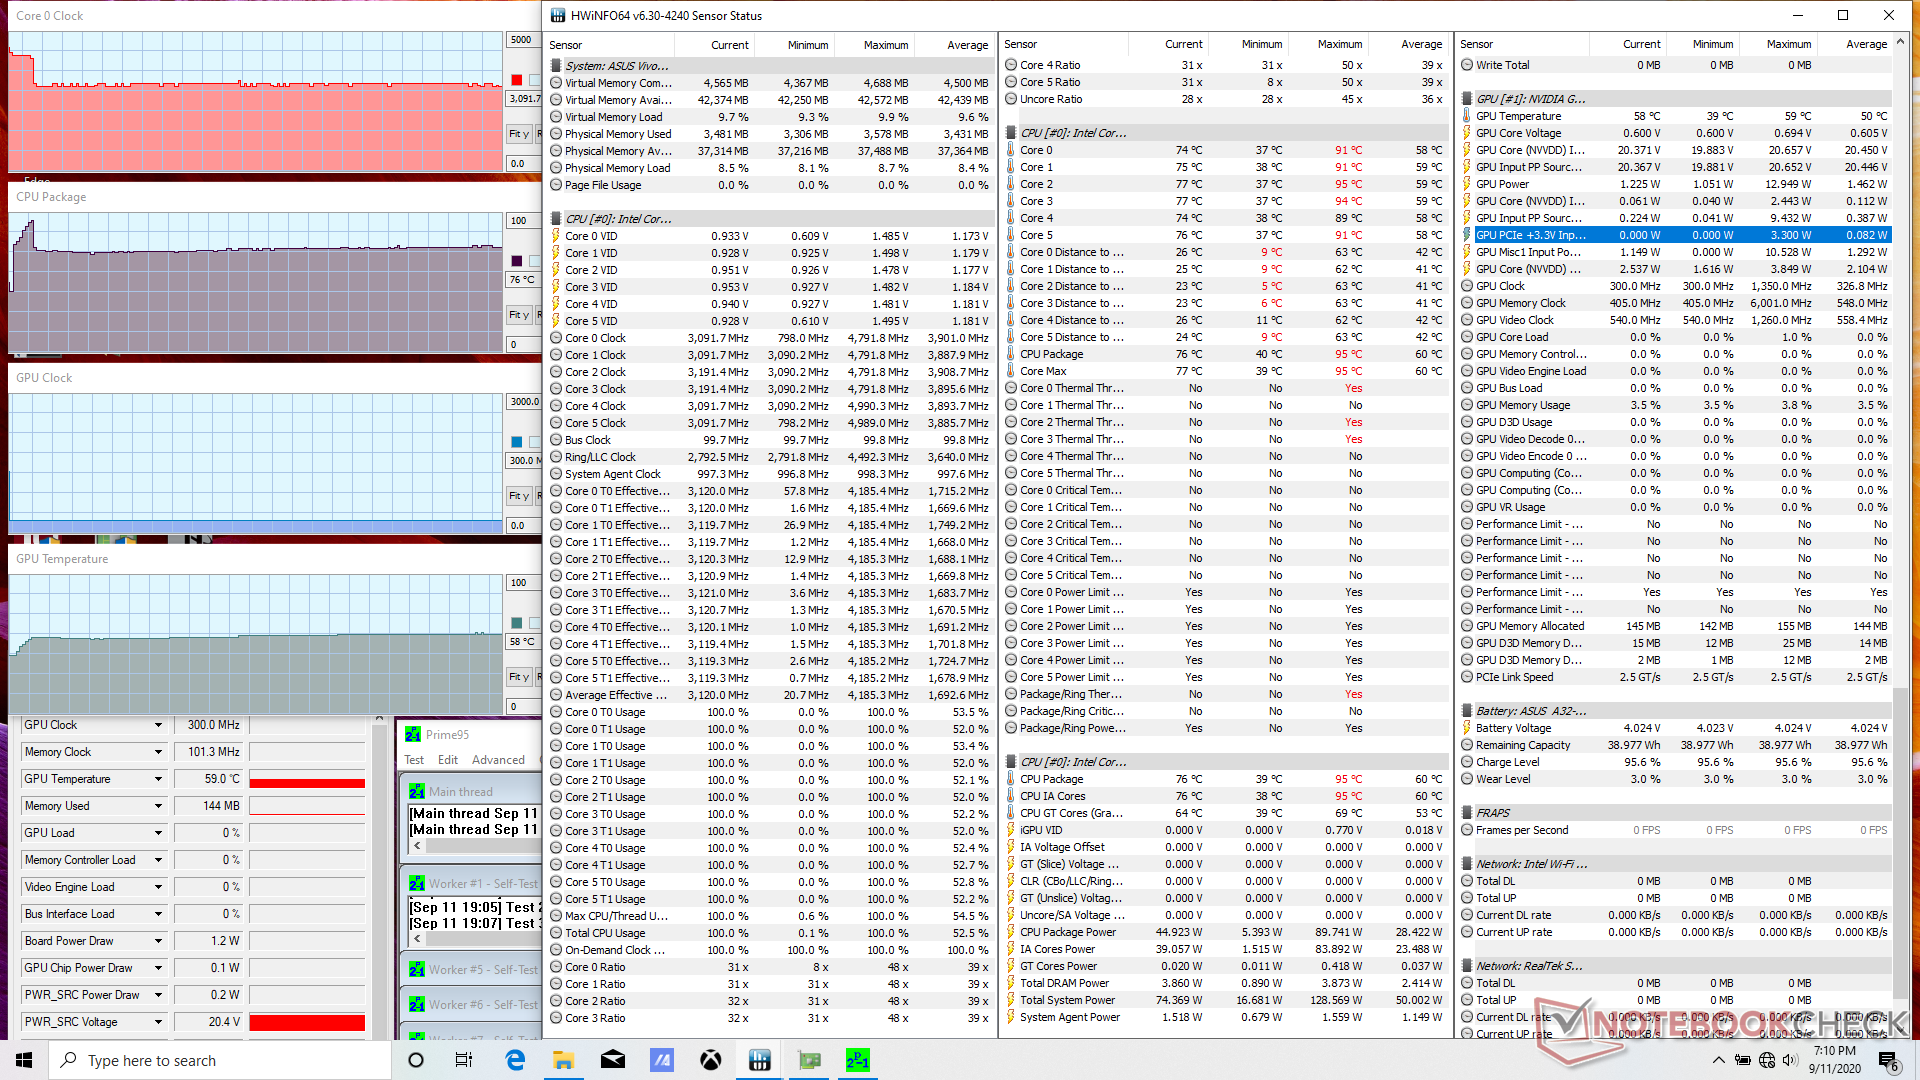
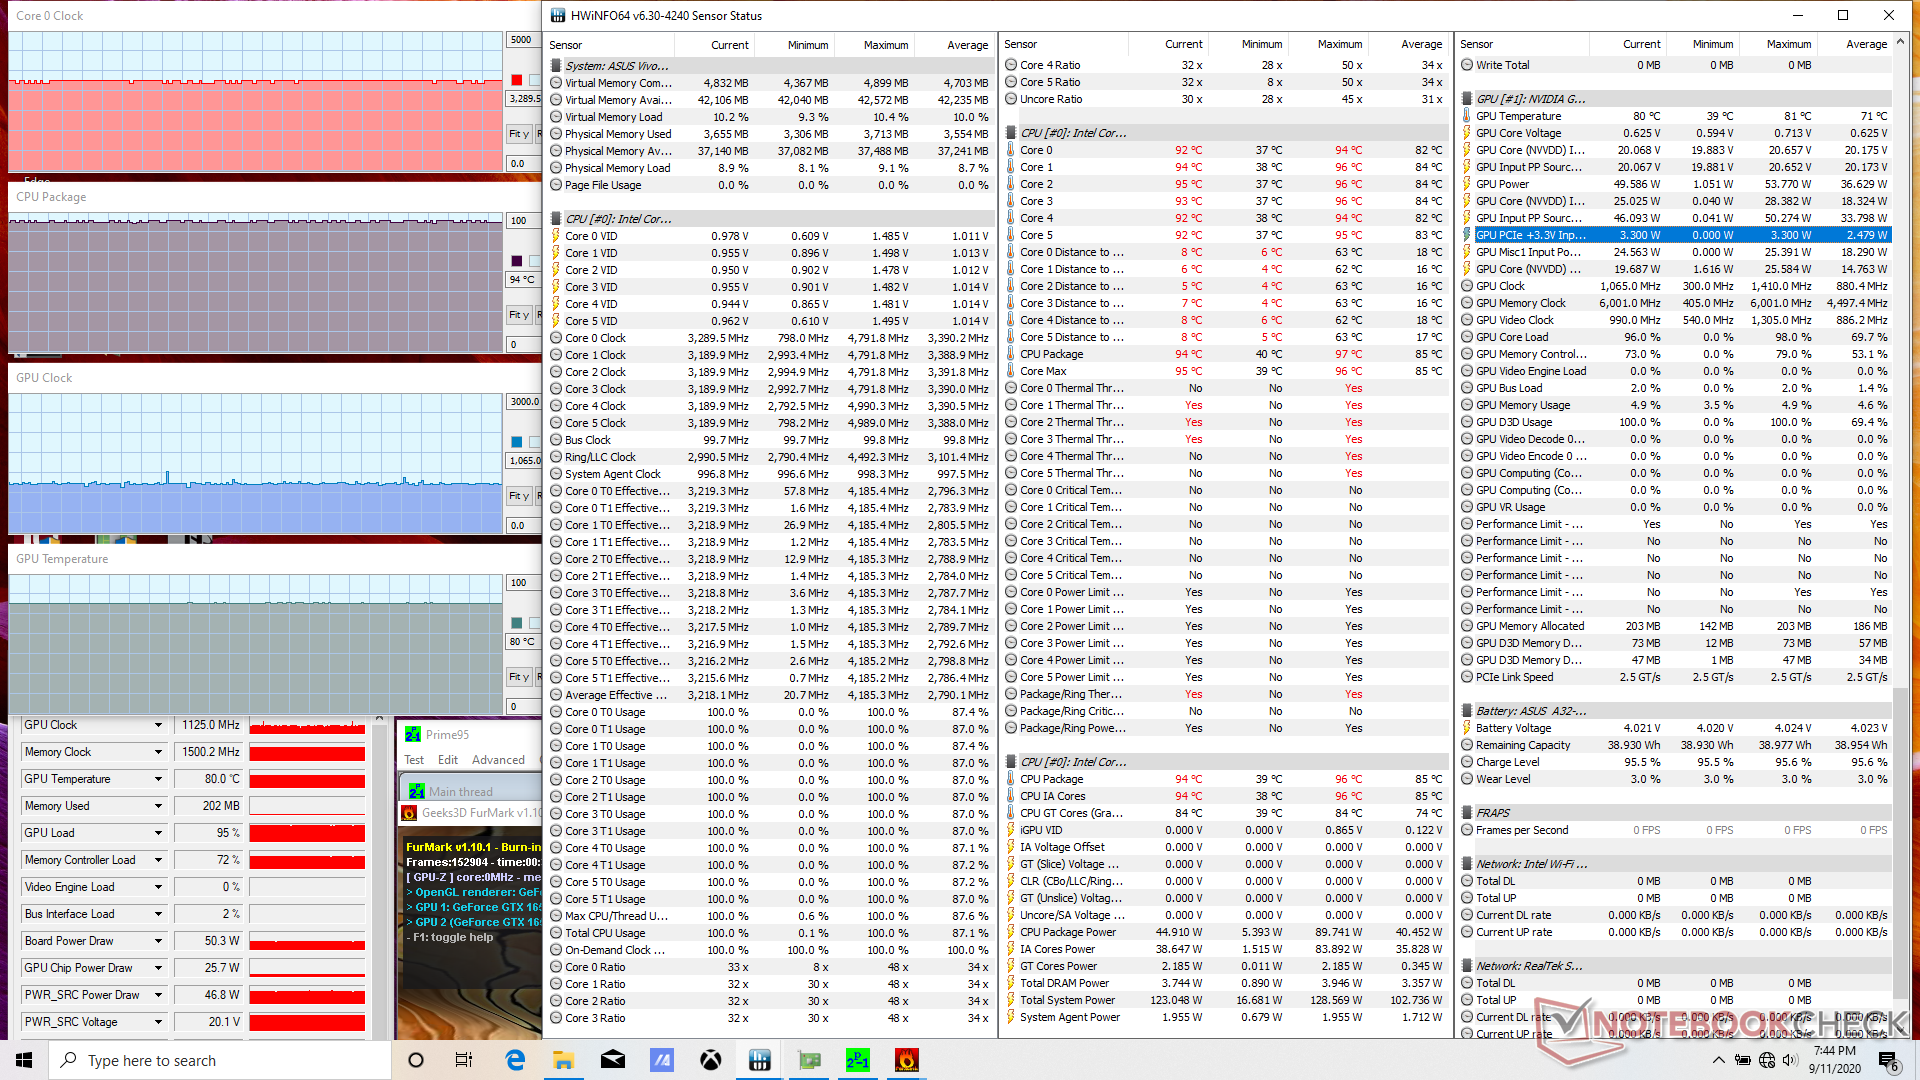
| CPU Clock (GHz) | GPU Clock (MHz) | Average CPU Temperature (°C) | Average GPU Temperature (°C) | |
| System Idle | -- | -- | 40 | 39 |
| Prime95 Stress | 3.1 - 3.2 | -- | 76 | 58 |
| Prime95 + FurMark Stress | 3.2 - 3.3 | 1125 | 94 | 80 |
| Witcher 3 Stress | ~4.2 | 1530 | ~87 | 78 |
Speakers


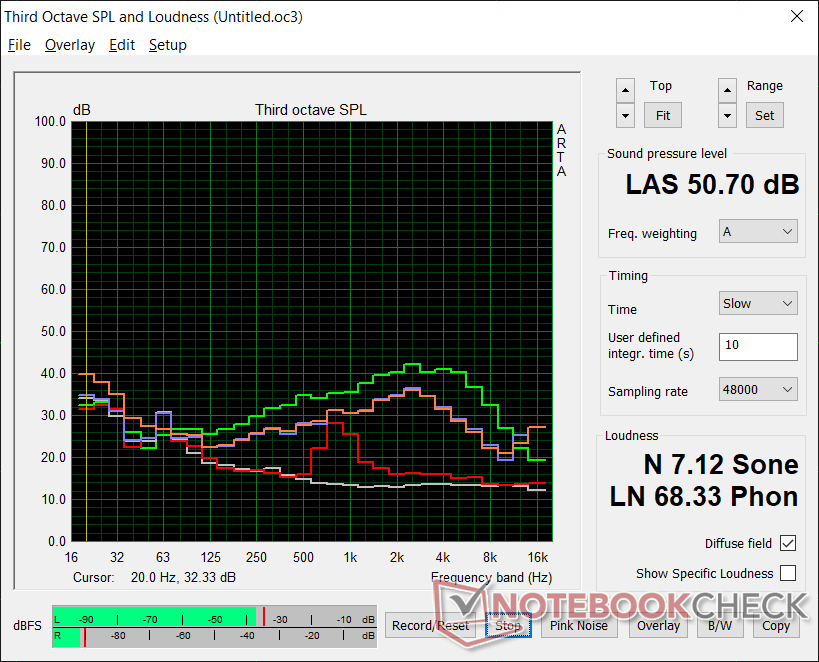
Asus VivoBook 15 K571LI-PB71 ses analizi
(±) | hoparlör ses yüksekliği ortalama ama iyi (78.7 dB)
Bas 100 - 315Hz
(-) | neredeyse hiç bas yok - ortalama olarak medyandan 20.1% daha düşük
(±) | Bas doğrusallığı ortalamadır (14.6% delta - önceki frekans)
Ortalar 400 - 2000 Hz
(±) | daha yüksek ortalar - ortalama olarak medyandan 5% daha yüksek
(+) | orta frekanslar doğrusaldır (3.9% deltadan önceki frekansa)
Yüksekler 2 - 16 kHz
(+) | dengeli yüksekler - medyandan yalnızca 1.1% uzakta
(+) | yüksekler doğrusaldır (3.4% deltadan önceki frekansa)
Toplam 100 - 16.000 Hz
(±) | Genel sesin doğrusallığı ortalamadır (17.8% ortancaya göre fark)
Aynı sınıfla karşılaştırıldığında
» Bu sınıftaki tüm test edilen cihazların %52%'si daha iyi, 7% benzer, 41% daha kötüydü
» En iyisinin deltası 5% idi, ortalama 17% idi, en kötüsü 45% idi
Test edilen tüm cihazlarla karşılaştırıldığında
» Test edilen tüm cihazların %36'si daha iyi, 8 benzer, % 56 daha kötüydü
» En iyisinin deltası 4% idi, ortalama 24% idi, en kötüsü 134% idi
Apple MacBook 12 (Early 2016) 1.1 GHz ses analizi
(+) | hoparlörler nispeten yüksek sesle çalabilir (83.6 dB)
Bas 100 - 315Hz
(±) | azaltılmış bas - ortalama olarak medyandan 11.3% daha düşük
(±) | Bas doğrusallığı ortalamadır (14.2% delta - önceki frekans)
Ortalar 400 - 2000 Hz
(+) | dengeli ortalar - medyandan yalnızca 2.4% uzakta
(+) | orta frekanslar doğrusaldır (5.5% deltadan önceki frekansa)
Yüksekler 2 - 16 kHz
(+) | dengeli yüksekler - medyandan yalnızca 2% uzakta
(+) | yüksekler doğrusaldır (4.5% deltadan önceki frekansa)
Toplam 100 - 16.000 Hz
(+) | genel ses doğrusaldır (10.2% ortancaya göre fark)
Aynı sınıfla karşılaştırıldığında
» Bu sınıftaki tüm test edilen cihazların %7%'si daha iyi, 2% benzer, 91% daha kötüydü
» En iyisinin deltası 5% idi, ortalama 18% idi, en kötüsü 53% idi
Test edilen tüm cihazlarla karşılaştırıldığında
» Test edilen tüm cihazların %5'si daha iyi, 1 benzer, % 94 daha kötüydü
» En iyisinin deltası 4% idi, ortalama 24% idi, en kötüsü 134% idi
Energy Management
Power Consumption
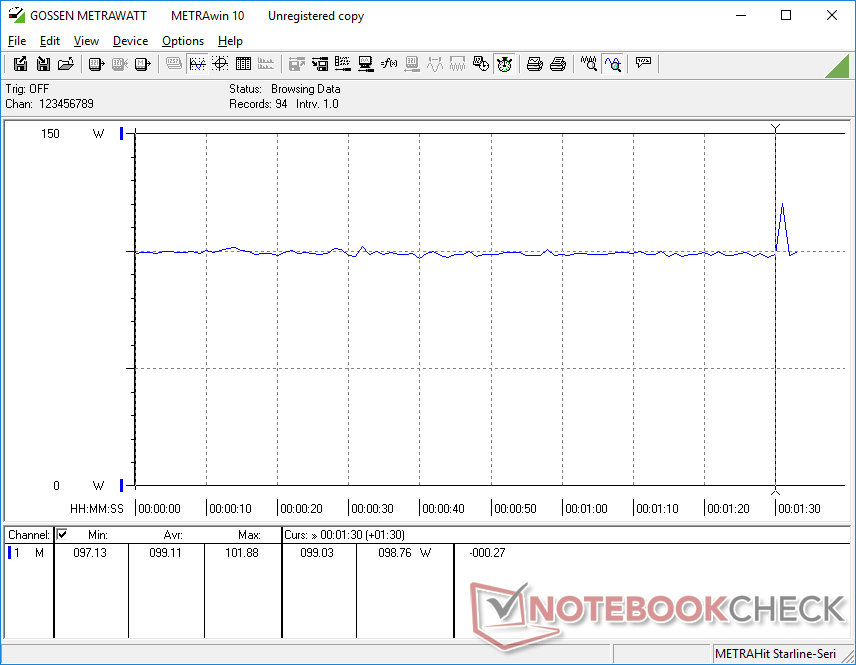
Idling on desktop would consume between 6 W and 19 W to be less power efficient than most Ultrabooks. The high consumption also explains the short battery life numbers in our next section below.
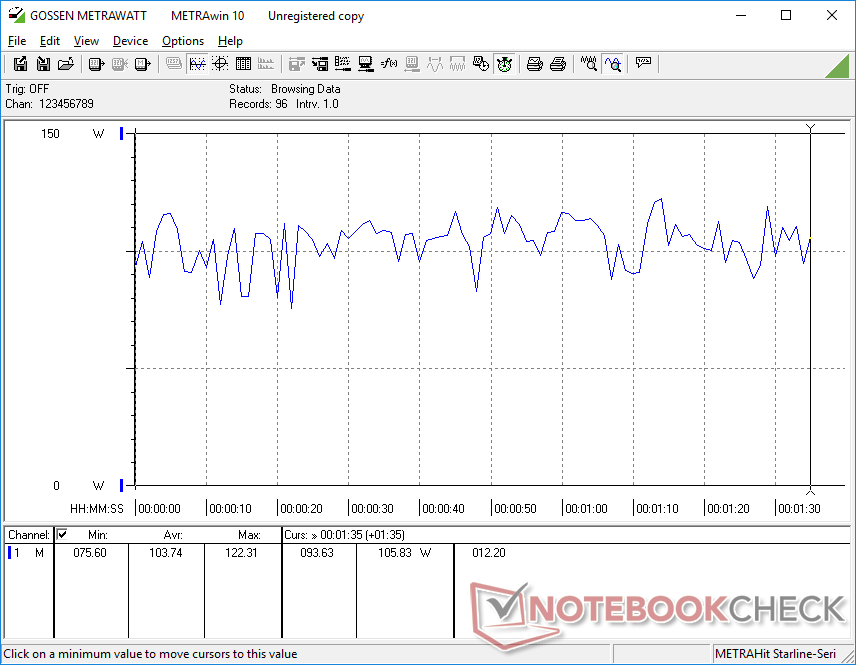
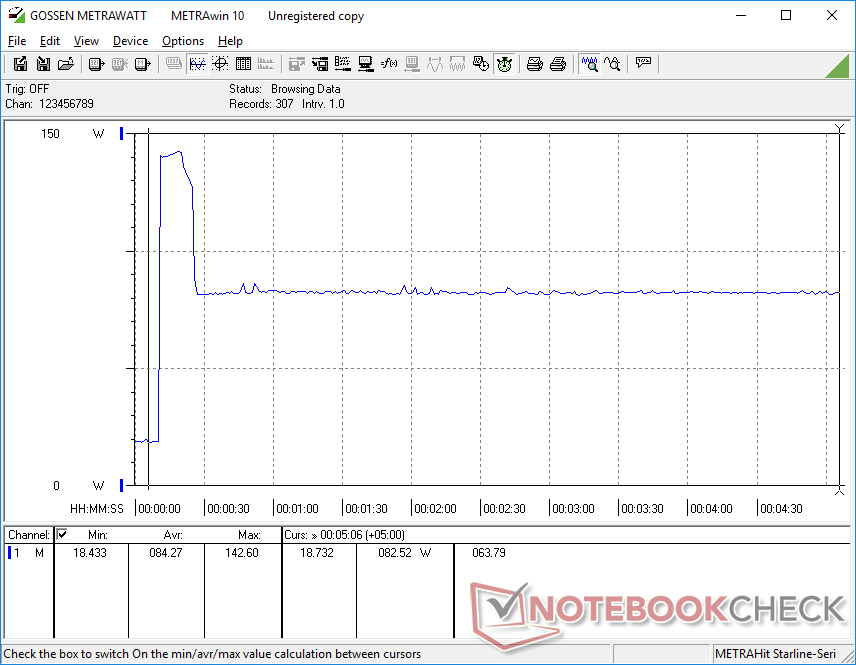
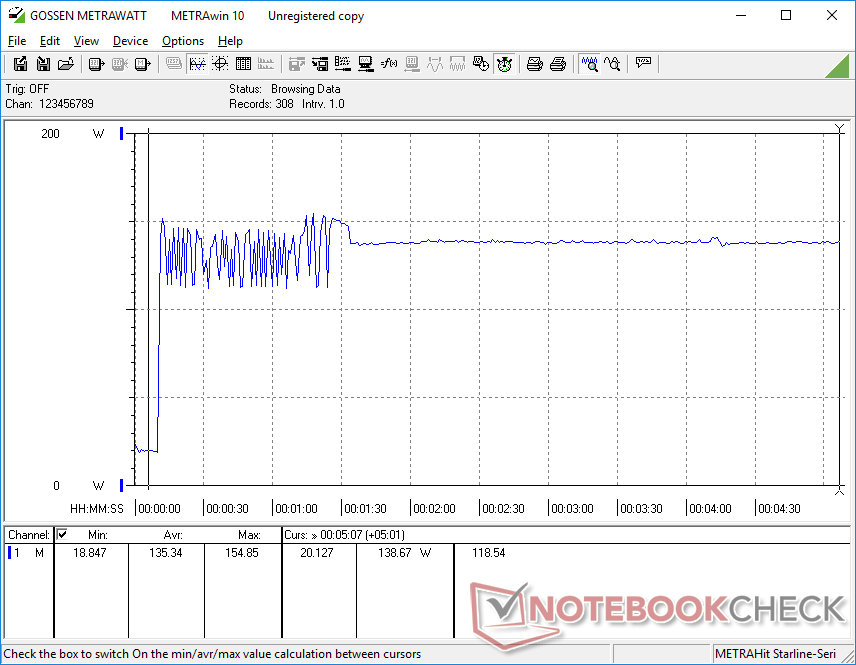
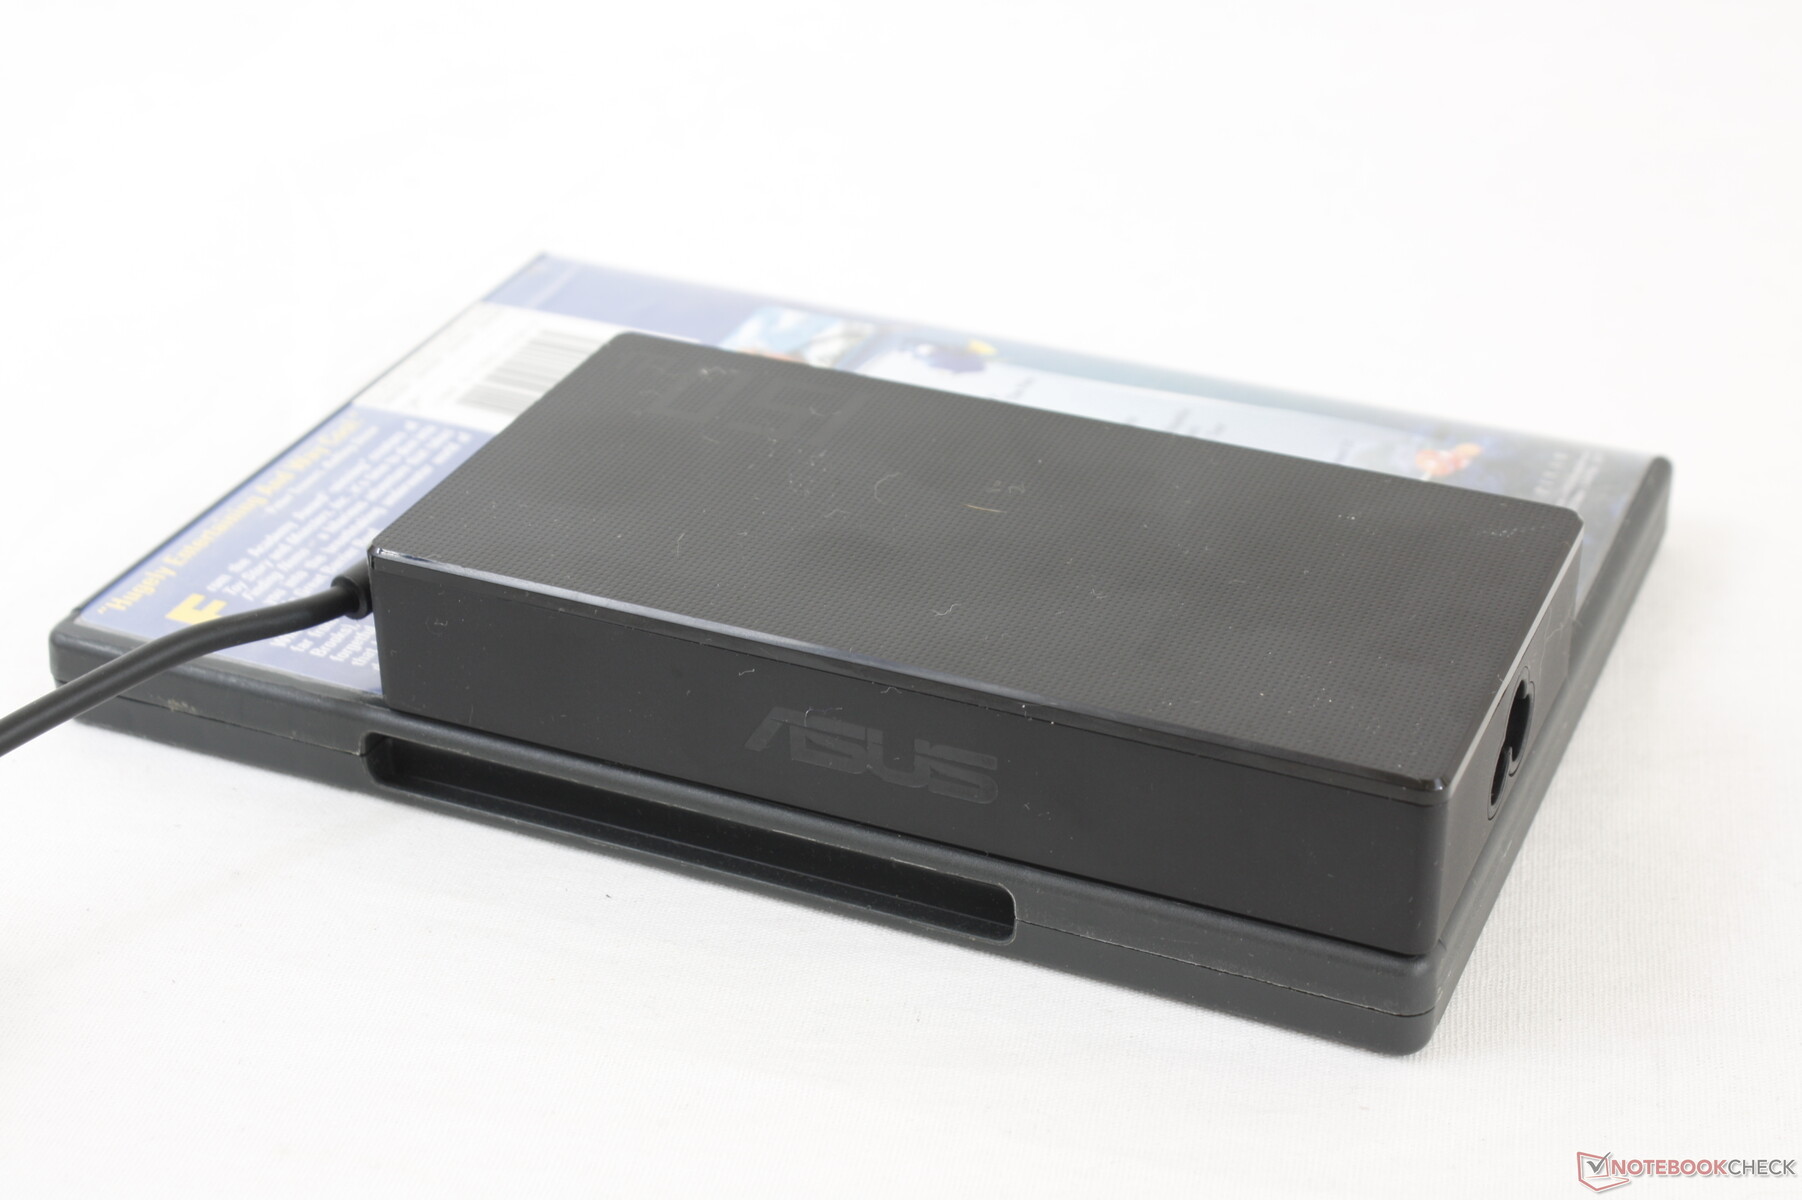
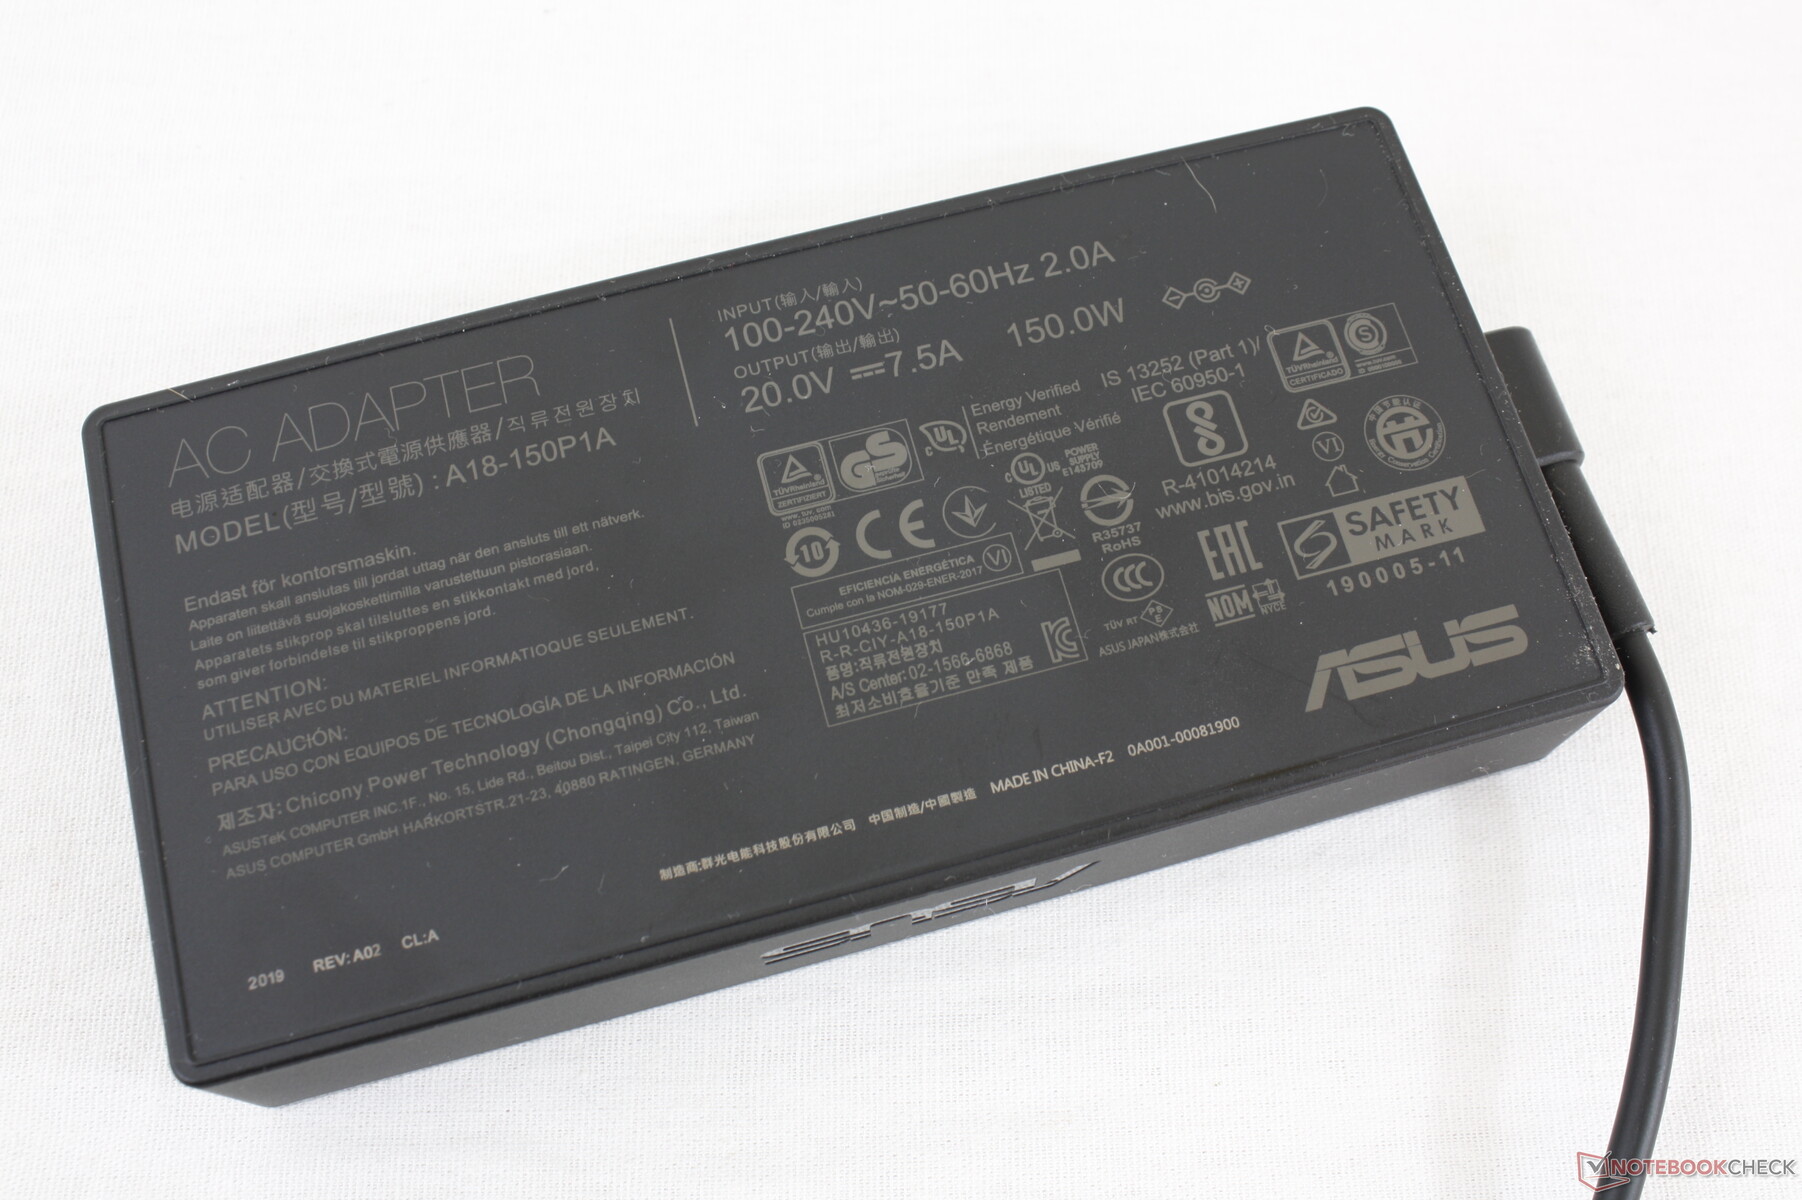
Overall power consumption is more similar to gaming machines like the ROG Strix G15 G512LI rather than other multimedia machines. Gaming will draw at least 99 W from the small-medium (~13.8 x 6.8 x 2.4 cm) 150 W AC adapter and the charging rate will slow if running more demanding loads.
| Kapalı / Bekleme modu | |
| Boşta | |
| Çalışırken |
|
Key:
min: | |
| Asus VivoBook 15 K571LI-PB71 i7-10750H, GeForce GTX 1650 Ti Mobile, Mushkin Helix-L 1TB MKNSSDHL1TB-08, IPS, 1920x1080, 15.6" | HP Envy 15-ep0098nr i7-10750H, GeForce RTX 2060 Max-Q, Intel Optane Memory H10 with Solid State Storage 32GB + 512GB HBRPEKNX0202A(L/H), AMOLED, 3840x2160, 15.6" | Acer Aspire 5 A515-54G i5-10210U, GeForce MX250, Kingston RBUSNS8154P3512GJ1, IPS, 1920x1080, 15.6" | Asus ZenBook 15 UX534FTC-A8190T i7-10510U, GeForce GTX 1650 Max-Q, Samsung SSD PM981 MZVLB1T0HALR, IPS, 1920x1080, 15.6" | Lenovo Ideapad S540-15IML i5-10210U, GeForce MX250, Samsung SSD PM981a MZVLB512HBJQ, IPS, 1920x1080, 15.6" | Dell Inspiron 15 5000 5585 R7 3700U, Vega 10, WDC PC SN520 SDAPNUW-512G, IPS, 1920x1080, 15.6" | |
|---|---|---|---|---|---|---|
| Power Consumption | -23% | 52% | 40% | 42% | 55% | |
| Idle Minimum * (Watt) | 6.4 | 9.2 -44% | 3.4 47% | 2.8 56% | 5 22% | 4.2 34% |
| Idle Average * (Watt) | 10.6 | 14.5 -37% | 6.4 40% | 7.7 27% | 7 34% | 6.8 36% |
| Idle Maximum * (Watt) | 18.4 | 18 2% | 9.2 50% | 9.4 49% | 10 46% | 7 62% |
| Load Average * (Watt) | 103.7 | 110.9 -7% | 38 63% | 57 45% | 64 38% | 36.5 65% |
| Witcher 3 ultra * (Watt) | 99.1 | 125.5 -27% | 62 37% | 44 56% | 37.9 62% | |
| Load Maximum * (Watt) | 154.9 | 194.6 -26% | 59 62% | 116 25% | 67 57% | 44 72% |
* ... daha küçük daha iyidir
Battery Life
Battery capacity is small at just 42 Wh which, when combined with the high power consumption rates above, result in short runtimes. Expect just over 3.5 hours of real-world WLAN use when set to the Balanced power profile with the integrated GPU active. Users may be able to squeeze out more from the battery if set to Power Saver mode.
Charging from empty to full capacity takes about 1.5 hours. The system cannot be recharged via USB-C.
| Asus VivoBook 15 K571LI-PB71 i7-10750H, GeForce GTX 1650 Ti Mobile, 42 Wh | HP Envy 15-ep0098nr i7-10750H, GeForce RTX 2060 Max-Q, 83 Wh | Acer Aspire 5 A515-54G i5-10210U, GeForce MX250, 48 Wh | Asus ZenBook 15 UX534FTC-A8190T i7-10510U, GeForce GTX 1650 Max-Q, 71 Wh | Lenovo Ideapad S540-15IML i5-10210U, GeForce MX250, 70 Wh | Dell Inspiron 15 5000 5585 R7 3700U, Vega 10, 42 Wh | |
|---|---|---|---|---|---|---|
| Pil Çalışma Süresi | 62% | 141% | 190% | 160% | 62% | |
| Reader / Idle (h) | 10.2 | 15 47% | 27.2 167% | 30.2 196% | 14.3 40% | |
| WiFi v1.3 (h) | 3.7 | 6 62% | 8.9 141% | 12.4 235% | 12.1 227% | 7 89% |
| Load (h) | 0.9 | 1.6 78% | 2.4 167% | 1.4 56% | 1.4 56% |
Artılar
Eksiler
Verdict

The VivoBook 15 K571 is at its best for students who want an affordable laptop for both gaming and classwork that's also relatively portable. It's powerful for the size and weight and as a middle-ground solution between a traditional Ultrabook and an entry-level gaming laptop. Very few laptops in this price range come with a 120 Hz panel option as well.
If you don't have any use for a Core H-series CPU or GTX 1650 Ti GPU, then a ZenBook would be the better option. Battery life, fan noise, and temperatures are just average at best on the VivoBook 15 due to the demanding processors within.
We recommend choosing the display carefully. Asus offers three options: 1080p120 45% NTSC, 1080p60 45% NTSC, or 1080p60 72% NTSC. The 1080p120 45% NTSC option will be best for gaming even after accounting for the average black-white response times. For editing and graphics work, the 1080p60 72% NTSC option will be better for its deeper colors.
The Asus VivoBook 15 K571 doesn't particularly excel at one singular aspect, but it balances being a multimedia machine and gaming machine fairly well for its inexpensive price.
Asus VivoBook 15 K571LI-PB71
- 09/13/2020 v7 (old)
Allen Ngo
Price comparison

