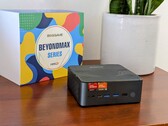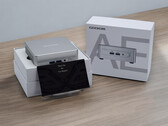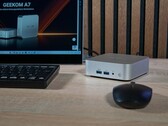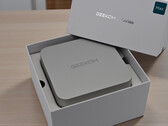
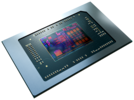
Phoenix serisi tek bir monolitik tasarım kullanır (7045HX serisinin yonga tasarımının aksine) ve TSMC'de modern 4nm sürecinde üretilir. TDP 35 ila 45 Watt arasında yapılandırılabilir.
Kod adı Phoenix-HS (Zen 4) Seriler AMD Phoenix (Zen 4) Seri: Phoenix (Zen 4) Phoenix-HS (Zen 4) Saat hızı 4000 - 5200 MHz Level 1 Cache 512 KB Level 2 Cache 8 MB Level 3 Cache 16 MB Çekirdek / Komut adedi 8 / 16 Maksimum güç tüketimi (TTG = Termal tasarım gücü) 35 Watt Üretim teknolojisi 4 nm Bağlantı sayısı 178 mm2 Maksimum sıcaklık 100 °C Soket FP7/FP7r2/FP8 Özellikler DDR5-5600/LPDDR5x-7500 RAM (incl. ECC), PCIe 4, Ryzen AI, MMX, SSE, SSE2, SSE3, SSSE3, SSE4A, SSE4.1, SSE4.2, AVX, AVX2, AVX-512, BMI2, ABM, FMA, ADX, SMEP, SMAP, SMT, CPB, AES-NI, RDRAND, RDSEED, SHA, SME Grafik kartı AMD Radeon 780M ( - 2800 MHz)64 Bit 64 Bit desteği Architecture x86 Açıklama tarihi 01/05/2023 Ürün bağlantısı (harici) www.amd.com
Performance Rating - CB R15 + R20 + 7-Zip + X265 + Blender + 3DM11 CPU
Cinebench 2024 - Cinebench 2024 CPU Single Core
min: 104 avg: 106.3 median: 107 (60%) max: 108 Points
CPU TDP ? TDP 35 W TDP 45 W TDP 54 W TDP 80 W 98% 100% 100% 97% 98%
...
Intel Core i9-12900H
Apple M1
...
Cinebench 2024 - Cinebench 2024 CPU Multi Core
min: 824 avg: 917 median: 946 (18%) max: 972 Points
CPU TDP ? TDP 35 W TDP 45 W TDP 54 W TDP 80 W 95% 97% 99% 100% 94%
Cinebench R23 - Cinebench R23 Multi Core
min: 15556 avg: 16867 median: 16946 (16%) max: 18131 Points
CPU TDP ? TDP 35 W TDP 45 W TDP 54 W TDP 60 W TDP 80 W TDP 105 W 97% 88% 91% 93% 92% 100% 96%
...
Intel Core i9-12900H
...
max:
Cinebench R23 - Cinebench R23 Single Core
min: 1733 avg: 1788 median: 1790 (76%) max: 1832 Points
CPU TDP ? TDP 35 W TDP 45 W TDP 54 W TDP 60 W TDP 80 W TDP 105 W 100% 96% 99% 96% 98% 100% 99%
...
...
max:
Intel Core Ultra 9 285K
Cinebench R20 - Cinebench R20 CPU (Single Core)
min: 680 avg: 701 median: 702 (78%) max: 714 Points
CPU TDP ? TDP 35 W TDP 45 W TDP 54 W TDP 60 W TDP 80 W TDP 105 W 99% 98% 99% 96% 99% 100% 99%
...
Intel Core i7-12800H
Intel Core i9-12900H
...
max:
Cinebench R20 - Cinebench R20 CPU (Multi Core)
min: 6277 avg: 6604 median: 6605.5 (16%) max: 7111 Points
CPU TDP ? TDP 35 W TDP 45 W TDP 54 W TDP 60 W TDP 80 W TDP 105 W 97% 91% 92% 93% 93% 100% 95%
Cinebench R15 - Cinebench R15 CPU Multi 64 Bit
min: 2470 avg: 2673 median: 2661 (17%) max: 2848 Points
CPU TDP ? TDP 35 W TDP 45 W TDP 54 W TDP 60 W TDP 80 W TDP 105 W 95% 88% 90% 94% 94% 100% 95%
0 145 290 435 580 725 870 1015 1160 1305 1450 1595 1740 1885 2030 2175 2320 2465 2610 2755 Tooltip Geekom A7: Ø2410 (2285.58-2581.81)
Geekom AE7: Ø2563 (2486.79-2630.54)
Asus ROG Flow X13 GV302XV: Ø2457 (2370.09-2632.96)
Framework Laptop 16: Ø2617 (2587.82-2652.52)
Asus ROG Zephyrus G14 GA402XY: Ø2540 (2434.72-2659.22)
Minisforum Venus Series UM790 Pro: Ø2646 (2612.16-2667.2)
Asus TUF Gaming A16 FA617XS: Ø2646 (2596.9-2666.67)
Razer Blade 14 RTX 4070: Ø2758 (2700.51-2773.16)
Asus TUF Gaming A17 FA707XI-NS94: Ø2784 (2741.98-2817.3)
Asus ROG Zephyrus G14 GA402XY: Ø2785 (2743.48-2847.79)
Cinebench R15 - Cinebench R15 CPU Single 64 Bit
min: 277 avg: 283.4 median: 283.5 (80%) max: 288 Points
CPU TDP ? TDP 35 W TDP 45 W TDP 54 W TDP 60 W TDP 80 W TDP 105 W 99% 97% 98% 97% 100% 100% 99%
...
...
max:
Intel Core Ultra 9 285K
Cinebench R11.5 - Cinebench R11.5 CPU Multi 64 Bit
min: 29.8 avg: 30.4 median: 30.5 (39%) max: 30.88 Points
CPU TDP ? TDP 35 W TDP 45 W 100% 97% 99%
Cinebench R11.5 - Cinebench R11.5 CPU Single 64 Bit
min: 3.34 avg: 3.4 median: 3.4 (80%) max: 3.46 Points
CPU TDP ? TDP 35 W TDP 45 W 100% 97% 98%
...
...
max:
Intel Core Ultra 9 285K
Cinebench R10 - Cinebench R10 Rend. Single (32bit)
min: 7798 avg: 7866 median: 7837 (47%) max: 7963 puan
CPU TDP ? TDP 35 W TDP 45 W 100% 98% 98%
AMD Ryzen 5 PRO 5650U
...
Intel Core i7-10850H
Intel Xeon E-2176M
Intel Core i5-1140G7
Intel Core i7-10875H
Intel Core i5-1130G7
Intel Xeon W-10885M
Intel Core i3-1215U
Intel Core i3-1115G4
Intel Core i5-1135G7
Intel Core i5-12450H
Intel Core i7-1160G7
...
max:
Cinebench R10 - Cinebench R10 Rend. Multi (32bit)
min: 47982 avg: 48859 median: 48751 (35%) max: 49845 puan
CPU TDP ? TDP 35 W TDP 45 W 100% 96% 98%
AMD Ryzen 5 PRO 5650U
...
Intel Core i7-1280P
Intel Core i7-11800H
Intel Core i9-11980HK
...
max:
Cinebench R10 - Cinebench R10 Rend. Multi (64bit)
min: 84721 avg: 86849 median: 87296 (56%) max: 88529 Points
CPU TDP ? TDP 35 W TDP 45 W 100% 96% 99%
...
max:
Intel Core Ultra 9 285K
Cinebench R10 - Cinebench R10 Rend. Single (64bit)
min: 14232 avg: 14421 median: 14300 (17%) max: 14731 Points
CPU TDP ? TDP 35 W TDP 45 W 100% 97% 97%
...
Intel Core i7-1265U
Intel Core i7-1280P
...
max:
Intel Core Ultra 9 285K
wPrime 2.10 - wPrime 2.0 1024m *
min: 66.801 avg: 87.3 median: 97 (1%) max: 98.222 s
CPU TDP ? TDP 35 W TDP 45 W 100% 100% 100%
AMD Ryzen 7 4800H
AMD Ryzen 7 4800HS
Intel Core i3-1215U
AMD Ryzen 9 5900HX
...
VIA C3-M C3-M-1200
wPrime 2.10 - wPrime 2.0 32m *
min: 2.648 avg: 2.7 median: 2.7 (1%) max: 2.699 s
CPU TDP ? TDP 35 W TDP 45 W 100% 100% 100%
WinRAR - WinRAR 4.0
min: 7439 avg: 7503 median: 7490 (12%) max: 7580 puan
CPU TDP ? TDP 35 W TDP 45 W 98% 99% 100%
...
Intel Core i7-4870HQ
Intel Core i7-1280P
Intel Xeon W-10885M
Intel Core i9-9980HK
Intel Core i7-10875H
AMD Ryzen 5 5600H
Intel Core i7-12650H
Intel Core i3-1215U
Intel Core i7-11800H
Intel Core i9-12900H
...
max:
7-Zip 18.03 - 7-Zip 18.03 Multi Thread 4 runs
min: 66408 avg: 70912 median: 71085.5 (41%) max: 73434 MIPS
CPU TDP ? TDP 35 W TDP 45 W TDP 54 W TDP 60 W TDP 80 W TDP 105 W 100% 98% 100% 99% 92% 100% 98%
7-Zip 18.03 - 7-Zip 18.03 Single Thread 4 runs
min: 6417 avg: 6645 median: 6651.5 (78%) max: 6776 MIPS
CPU TDP ? TDP 35 W TDP 45 W TDP 54 W TDP 60 W TDP 80 W TDP 105 W 100% 100% 99% 98% 95% 99% 98%
...
...
max:
AMD Ryzen 7 9800X3D
X264 HD Benchmark 4.0 - x264 Pass 2
min: 140.8 avg: 145.3 median: 144.2 (48%) max: 150.8 fps
CPU TDP ? TDP 35 W TDP 45 W 100% 93% 96%
...
AMD Ryzen 7 6800H
...
max:
Intel Core Ultra 9 285K
X264 HD Benchmark 4.0 - x264 Pass 1
min: 288 avg: 295 median: 292.5 (67%) max: 304.5 fps
CPU TDP ? TDP 35 W TDP 45 W 100% 96% 95%
...
Intel Core i5-12450H
AMD Ryzen 9 5900HX
...
max:
Intel Core Ultra 9 285K
HWBOT x265 Benchmark v2.2 - HWBOT x265 4k Preset
min: 20.1 avg: 21.1 median: 20.9 (37%) max: 22.6 fps
CPU TDP ? TDP 35 W TDP 45 W TDP 54 W TDP 60 W TDP 80 W TDP 105 W 95% 94% 95% 96% 92% 100% 95%
0 5 10 15 20 25 30 35 Tooltip Asus ROG Flow X13 GV302XV: Ø19.9 (0.61-23.1)
Geekom A7: Ø21.4 (2.07-35.6)
Minisforum Venus Series UM790 Pro: Ø20.3 (0.68-24.1)
Asus TUF Gaming A16 FA617XS: Ø20 (0.53-22.7)
Geekom AE7: Ø20.8 (0.75-26.4)
Framework Laptop 16: Ø19.9 (0.38-21.2)
Razer Blade 14 RTX 4070: Ø21.3 (1.28-29.6)
Asus TUF Gaming A17 FA707XI-NS94: Ø21.1 (0.6-23.8)
Asus ROG Zephyrus G14 GA402XY: Ø22.7 (1.4-32.5)
TrueCrypt - TrueCrypt Serpent
min: 1.3 avg: 1.4 median: 1.4 (41%) max: 1.4 GB/s
CPU TDP ? TDP 35 W TDP 45 W 100% 93% 100%
TrueCrypt - TrueCrypt Twofish
CPU TDP ? TDP 35 W TDP 45 W 100% 100% 100%
...
AMD Ryzen 7 4800H
Intel Core i7-1280P
...
max:
TrueCrypt - TrueCrypt AES
min: 14.8 avg: 15 median: 15.1 (39%) max: 15.2 GB/s
CPU TDP ? TDP 35 W TDP 45 W 97% 99% 100%
Blender - Blender 3.3 Classroom CPU *
min: 287 avg: 307.6 median: 308 (4%) max: 331 Seconds
CPU TDP ? TDP 35 W TDP 45 W TDP 54 W TDP 60 W TDP 80 W TDP 105 W 100% 100% 100% 100% 100% 101% 100%
...
...
Intel Celeron J4125
Blender - Blender 2.79 BMW27 CPU *
min: 182 avg: 191.1 median: 189 (1%) max: 202 Seconds
CPU TDP ? TDP 35 W TDP 45 W TDP 54 W TDP 60 W TDP 80 W TDP 105 W 100% 100% 100% 100% 100% 100% 100%
Intel Core i5-1038NG7
...
Apple M1 Pro
Apple M1 Max
...
R Benchmark 2.5 - R Benchmark 2.5 *
min: 0.4159 avg: 0.4 median: 0.4 (9%) max: 0.4467 sec
CPU TDP ? TDP 35 W TDP 45 W TDP 54 W TDP 60 W TDP 80 W TDP 105 W 101% 100% 100% 100% 100% 100% 101%
3DMark 06 - CPU - 3DMark 06 - CPU
min: 14891 avg: 15630 median: 15689 (33%) max: 16149 Points
CPU TDP ? TDP 35 W TDP 45 W TDP 65 W TDP 105 W 99% 94% 100% 98% 100%
VIA C7-M C7-M-1200
...
...
max:
Super Pi mod 1.5 XS 1M - Super Pi mod 1.5 XS 1M *
min: 7.058 avg: 7.2 median: 7.2 (2%) max: 7.442 s
CPU TDP ? TDP 35 W TDP 45 W 100% 100% 100%
...
Intel Core i7-1185G7
AMD Ryzen 5 PRO 4650U
Intel Core i3-1215U
Intel Core i7-11800H
Intel Core i5-11500B
Intel Core i9-10885H
...
VIA C3-M C3-M-1200
Super Pi mod 1.5 XS 2M - Super Pi mod 1.5 XS 2M *
min: 17.513 avg: 17.9 median: 17.9 (1%) max: 18.402 s
CPU TDP ? TDP 35 W TDP 45 W 100% 100% 100%
...
Intel Core i7-10610U
Intel Core i5-1135G7
Intel Core i7-10750H
Intel Core i7-12650H
AMD Ryzen 7 5800H
Intel Core i7-9850H
Intel Core i3-1115G4
Intel Core i5-1140G7
...
Super Pi Mod 1.5 XS 32M - Super Pi mod 1.5 XS 32M *
min: 529.929 avg: 572 median: 532.8 (2%) max: 653.976 s
CPU TDP ? TDP 35 W TDP 45 W 101% 101% 100%
...
Qualcomm Snapdragon 8cx
AMD Ryzen 7 4800H
Intel Core i5-7300U
Intel Core i5-8305G
Intel Core i7-7700HQ
AMD Ryzen 5 5500U
Intel Core i7-6600U
AMD Ryzen 5 4680U
...
VIA C3-M C3-M-1200
3DMark Vantage - 3DM Vant. Perf. CPU no Physx
min: 74246 avg: 81139 median: 81099.5 (62%) max: 86583 Points
CPU TDP ? TDP 35 W TDP 45 W TDP 65 W 99% 90% 99% 100%
...
AMD Ryzen 9 6900HS
...
max:
Intel Core Ultra 9 285K
3DMark 11 - 3DM11 Performance Physics
min: 16799 avg: 22367 median: 22422 (57%) max: 25006 Points
CPU TDP ? TDP 35 W TDP 45 W TDP 54 W TDP 60 W TDP 65 W TDP 80 W TDP 105 W 87% 92% 88% 100% 86% 100% 96% 91%
AMD E-240
...
Intel Core i7-12800H
...
max:
AMD Ryzen 7 9800X3D
3DMark - 3DMark Ice Storm Physics
min: 79935 avg: 88924 median: 89772 (73%) max: 96559 Points
CPU TDP ? TDP 35 W TDP 45 W TDP 60 W TDP 65 W 88% 88% 93% 100% 94%
...
Intel Core i5-12500H
Intel Core i9-12900H
Intel Core i5-12450H
...
max:
3DMark - 3DMark Ice Storm Extreme Physics
min: 79450 avg: 88753 median: 89602 (73%) max: 96418 Points
CPU TDP ? TDP 35 W TDP 45 W TDP 60 W TDP 65 W 88% 87% 93% 100% 94%
AMD A6-9220e
...
Intel Core i5-12500H
Intel Core i9-12900H
Intel Core i5-12450H
...
max:
3DMark - 3DMark Ice Storm Unlimited Physics
min: 85305 avg: 91061 median: 91304.5 (76%) max: 96047 Points
CPU TDP ? TDP 35 W TDP 45 W TDP 60 W TDP 65 W 93% 92% 95% 100% 96%
AMD A6-9220e
...
Intel Core i7-12650H
AMD Ryzen 9 5980HS
Intel Core i9-12900H
AMD Ryzen 9 5900HX
Intel Core i5-12450H
AMD Ryzen 9 5900HS
...
max:
Intel Core Ultra 5 245K
3DMark - 3DMark Cloud Gate Physics
min: 13400 avg: 19897 median: 20990 (53%) max: 21353 Points
CPU TDP ? TDP 35 W TDP 45 W TDP 60 W TDP 65 W TDP 105 W 81% 92% 96% 93% 100% 99%
...
AMD Ryzen 7 6800HS
...
max:
Intel Core Ultra 9 285K
3DMark - 3DMark Fire Strike Standard Physics
min: 24034 avg: 28183 median: 28247 (50%) max: 30876 Points
CPU TDP ? TDP 35 W TDP 45 W TDP 54 W TDP 60 W TDP 65 W TDP 80 W TDP 105 W 92% 87% 92% 99% 93% 96% 100% 98%
AMD A6-9220e
...
Intel Core i7-12800H
...
max:
Intel Core Ultra 9 285K
3DMark - 3DMark Time Spy CPU
min: 10388 avg: 11222 median: 11210 (47%) max: 12212 Points
CPU TDP ? TDP 35 W TDP 45 W TDP 54 W TDP 60 W TDP 65 W TDP 80 W TDP 105 W 93% 87% 95% 91% 87% 97% 97% 100%
AMD PRO A12-9800B
...
Intel Core i7-12800H
Intel Core i9-12900H
...
max:
Geekbench 6.3 - Geekbench 6.3 Single-Core
min: 2426 avg: 2628 median: 2661.5 (68%) max: 2746 puan
CPU TDP ? TDP 35 W TDP 45 W TDP 54 W TDP 60 W TDP 65 W TDP 80 W 95% 99% 99% 96% 95% 92% 100%
Intel Pentium Gold 4425Y
...
Apple M2
Intel Core Ultra 9 285H
...
Geekbench 6.3 - Geekbench 6.3 Multi-Core
min: 9899 avg: 12333 median: 12348 (48%) max: 13470 puan
CPU TDP ? TDP 35 W TDP 45 W TDP 54 W TDP 60 W TDP 65 W TDP 80 W 82% 100% 99% 98% 89% 89% 92%
Intel Celeron N4500
...
Apple M1 Pro
...
Geekbench 5.5 - Geekbench 5.1 - 5.5 64 Bit Single-Core
min: 1823 avg: 1983 median: 1986 (78%) max: 2032 puan
CPU TDP ? TDP 35 W TDP 45 W TDP 54 W TDP 60 W TDP 65 W TDP 80 W TDP 105 W 99% 99% 98% 97% 97% 90% 99% 100%
Geekbench 5.5 - Geekbench 5.1 - 5.5 64 Bit Multi-Core
min: 11207 avg: 11902 median: 12111 (22%) max: 12500 puan
CPU TDP ? TDP 35 W TDP 45 W TDP 54 W TDP 60 W TDP 65 W TDP 80 W TDP 105 W 97% 99% 99% 100% 91% 93% 95% 98%
...
Intel Core i9-12900H
Intel Core i7-12800H
...
max:
Geekbench 5.0 - Geekbench 5.0 64 Bit Single-Core
min: 1764 avg: 1880 median: 1905 (8%) max: 1918 puan
CPU TDP ? TDP 35 W TDP 45 W TDP 65 W TDP 80 W 99% 100% 99% 92% 100%
...
Intel Core i7-1365U
...
max:
Geekbench 5.0 - Geekbench 5.0 64 Bit Multi-Core
min: 11232 avg: 11682 median: 11526 (36%) max: 12141 puan
CPU TDP ? TDP 35 W TDP 45 W TDP 65 W TDP 80 W 93% 100% 100% 94% 95%
...
Intel Core i7-1280P
...
max:
AMD Ryzen Threadripper PRO 3995WX
Geekbench 4.4 - Geekbench 4.1 - 4.4 64 Bit Single-Core
min: 7410 avg: 7923 median: 8014.5 (80%) max: 8253 puan
CPU TDP ? TDP 35 W TDP 45 W TDP 65 W 96% 100% 98% 90%
...
Intel Core i7-1265U
Intel Core i7-1280P
Intel Core i9-12900H
...
max:
Geekbench 4.4 - Geekbench 4.1 - 4.4 64 Bit Multi-Core
min: 45905 avg: 47560 median: 47496.5 (47%) max: 49341 puan
CPU TDP ? TDP 35 W TDP 45 W TDP 65 W 94% 99% 100% 93%
...
Intel Core i7-1280P
...
max:
Mozilla Kraken 1.1 - Kraken 1.1 Total Score *
min: 481 avg: 498.5 median: 501 (1%) max: 515 ms
CPU TDP ? TDP 35 W TDP 45 W TDP 54 W TDP 60 W TDP 80 W TDP 105 W 100% 100% 100% 100% 100% 100% 100%
...
Intel Core i7-1365U
...
max:
Apple S7
Octane V2 - Octane V2 Total Score
Model CPU Grafik kartı RAM Değer Asus TUF Gaming A16 FA617XS R9 7940HS 114 W / 105 W Radeon RX 7600S 95 W 2207 / 2000 MHz 8 GB Edge 11316 GB 89067
unknown
...
Intel Core i9-12900H
Intel Core i7-12650H
...
WebXPRT 4 - WebXPRT 4 Score
min: 234 avg: 261.2 median: 263 (74%) max: 271 Points
CPU TDP ? TDP 35 W TDP 54 W TDP 60 W TDP 80 W TDP 105 W 93% 100% 99% 99% 99% 98%