AMD Ryzen 7 4800HS İlk Çıkışı: Asus Zephyrus G15 GA502IU Dizüstü Bilgisayar İncelemesi
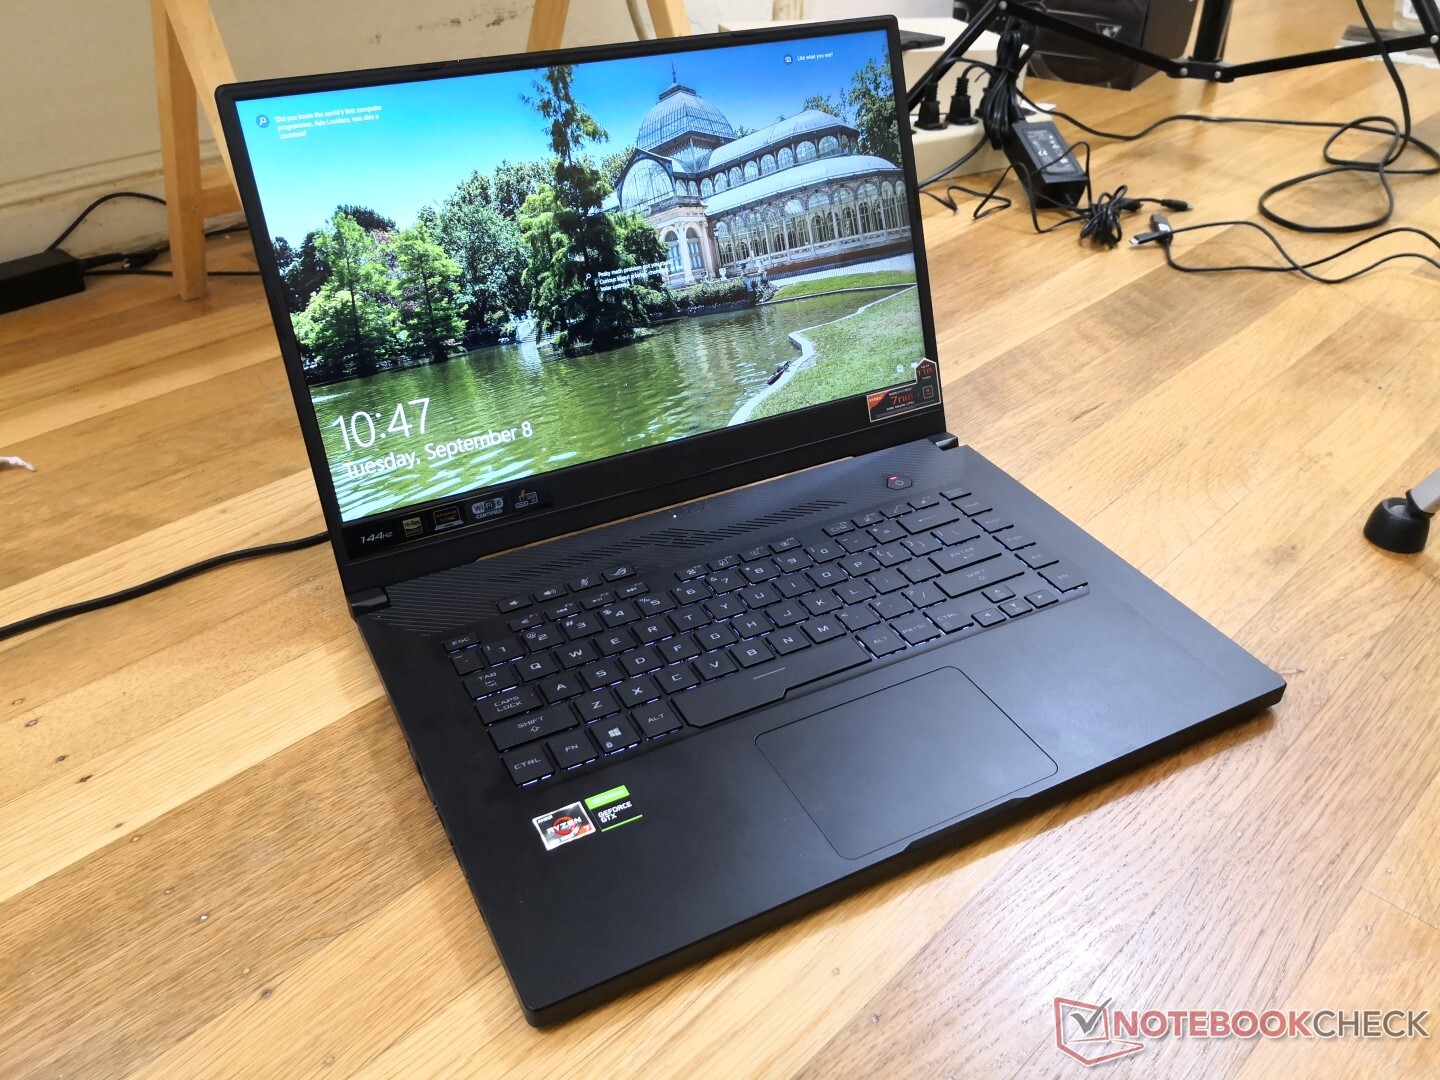
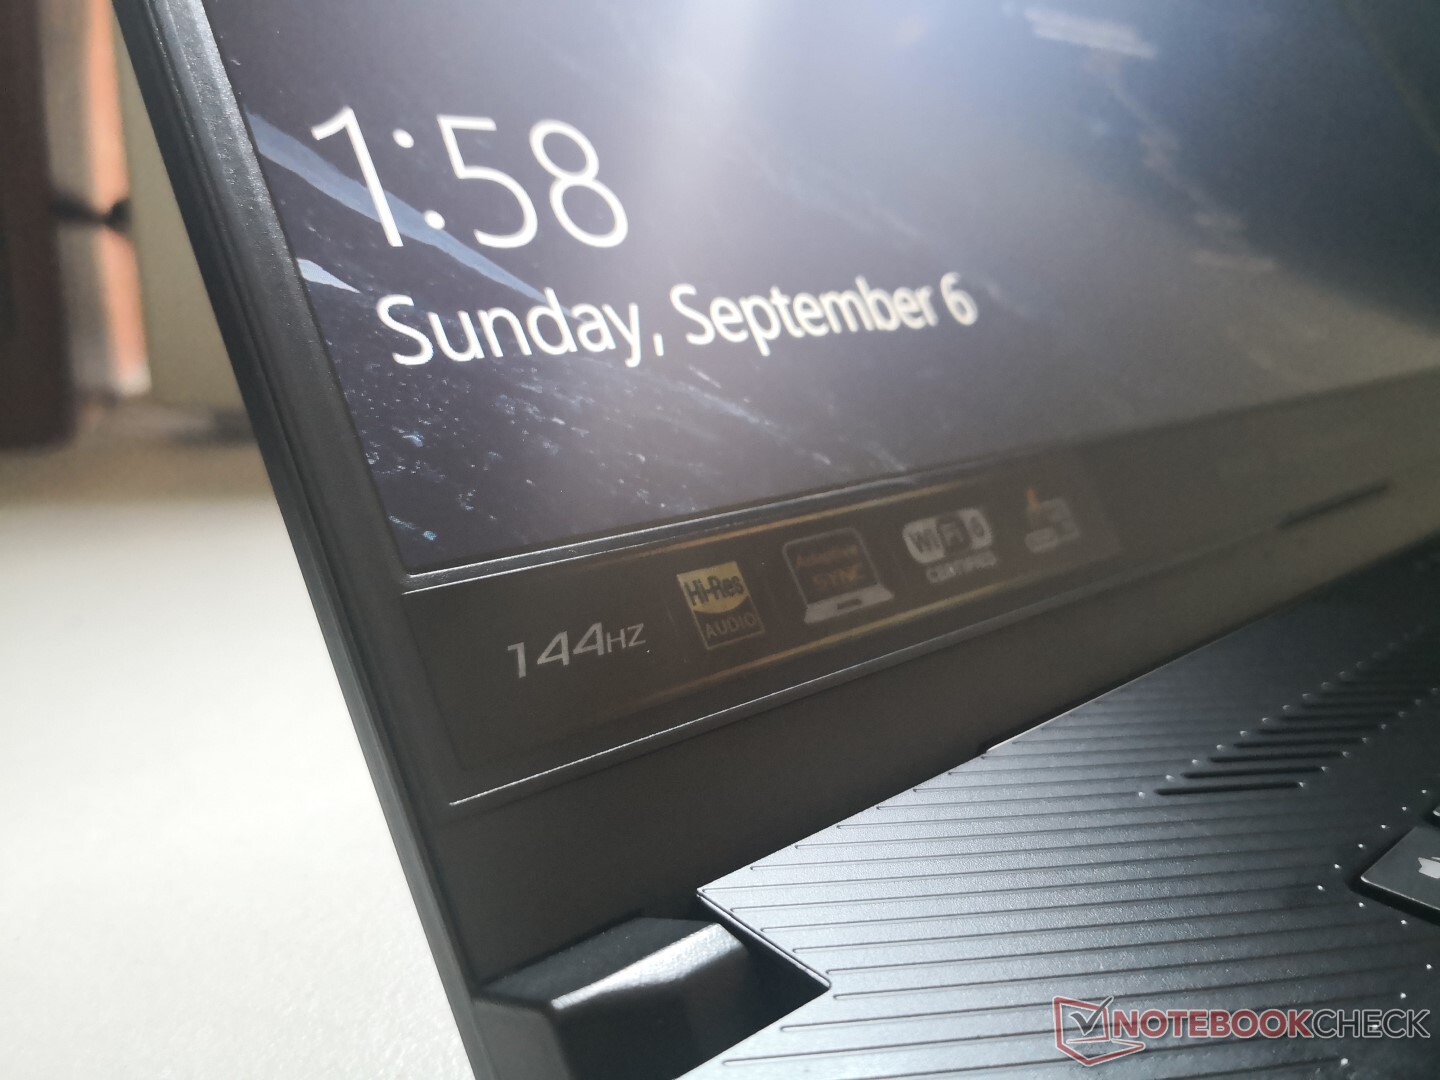
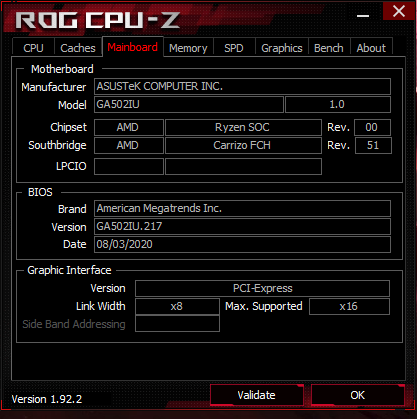
Asus Zephyrus G15 GA502IU, geçen yılki GA502DU için bir güncellemedir. Neredeyse her şeyi aynı tutarken eski 12 nm Zen Ryzen 7 3750H'yi daha yeni 7 nm Zen 2 Ryzen 7 4800HS ile değiştirir. Bu nedenle, GA502DU'nun şasi ve fiziksel özellikleri hakkındaki yorumlarımız burada GA502IU'da geçerli olacaktır. Test ünitemiz Xotic PC'de yaklaşık 1300 USD, üst düzey GeForce RTX 2060 konfigürasyonu ise 1400 USD (GA502IV) fiyatla satılıyor. Ryzen 7 4800HS CPU sabit olsa da, kullanıcılar her biri uyarlanabilir senkronizasyona sahip 144 Hz veya 240 Hz 1080p mat ekran arasında seçim yapabilir. Rakipler arasında, Razer Blade 15 Base Model, Gigabyte Aorus 15, MSI GL65 veya 2020 HP Omen 15 gibi orta seviye 15.6 inçlik oyun dizüstü bilgisayarları arasında diğer bütçeye yer veriliyor. Daha fazla harcamaya istekli oyuncular, üst düzey Asus ROG'yi düşünmek isteyebilir. Zephyrus S serisi veya Strix Scar serisi Daha fazla Asus incelemesi: VivoBook Flip 14ROG Phone 3ZenBook 13Zephyrus Duo 15Strix Scar 15
Derecelendirme | Tarih | Modeli | Ağırlık | Yükseklik | Boyut | Çözünürlük | Fiyat |
|---|---|---|---|---|---|---|---|
| 81.2 % v7 (old) | 10/2020 | Asus ROG Zephyrus G15 GA502IU-ES76 R7 4800HS, GeForce GTX 1660 Ti Max-Q | 2.1 kg | 19.9 mm | 15.60" | 1920x1080 | |
| 84.5 % v7 (old) | 07/2020 | Asus ROG Zephyrus Duo 15 GX550LXS i9-10980HK, GeForce RTX 2080 Super Max-Q | 2.5 kg | 20 mm | 15.60" | 3840x2160 | |
| 83.3 % v6 (old) | Asus ROG Zephyrus G15 GA502DU R7 3750H, GeForce GTX 1660 Ti Max-Q | 2.1 kg | 20.4 mm | 15.60" | 1920x1080 | ||
| 86.9 % v7 (old) | Razer Blade 15 RTX 2070 Super Max-Q i7-10875H, GeForce RTX 2070 Super Max-Q | 2.1 kg | 17.8 mm | 15.60" | 1920x1080 | ||
| 83.3 % v7 (old) | 07/2020 | Lenovo Legion 5 15IMH05H i5-10300H, GeForce RTX 2060 Mobile | 2.5 kg | 26.1 mm | 15.60" | 1920x1080 | |
| 82.5 % v7 (old) | 08/2020 | MSI GS66 Stealth 10SE-045 i7-10750H, GeForce RTX 2060 Mobile | 2.2 kg | 19.8 mm | 15.60" | 1920x1080 | |
| 82.6 % v7 (old) | Eluktronics RP-15 R7 4800H, GeForce RTX 2060 Mobile | 1.9 kg | 20 mm | 15.60" | 1920x1080 |
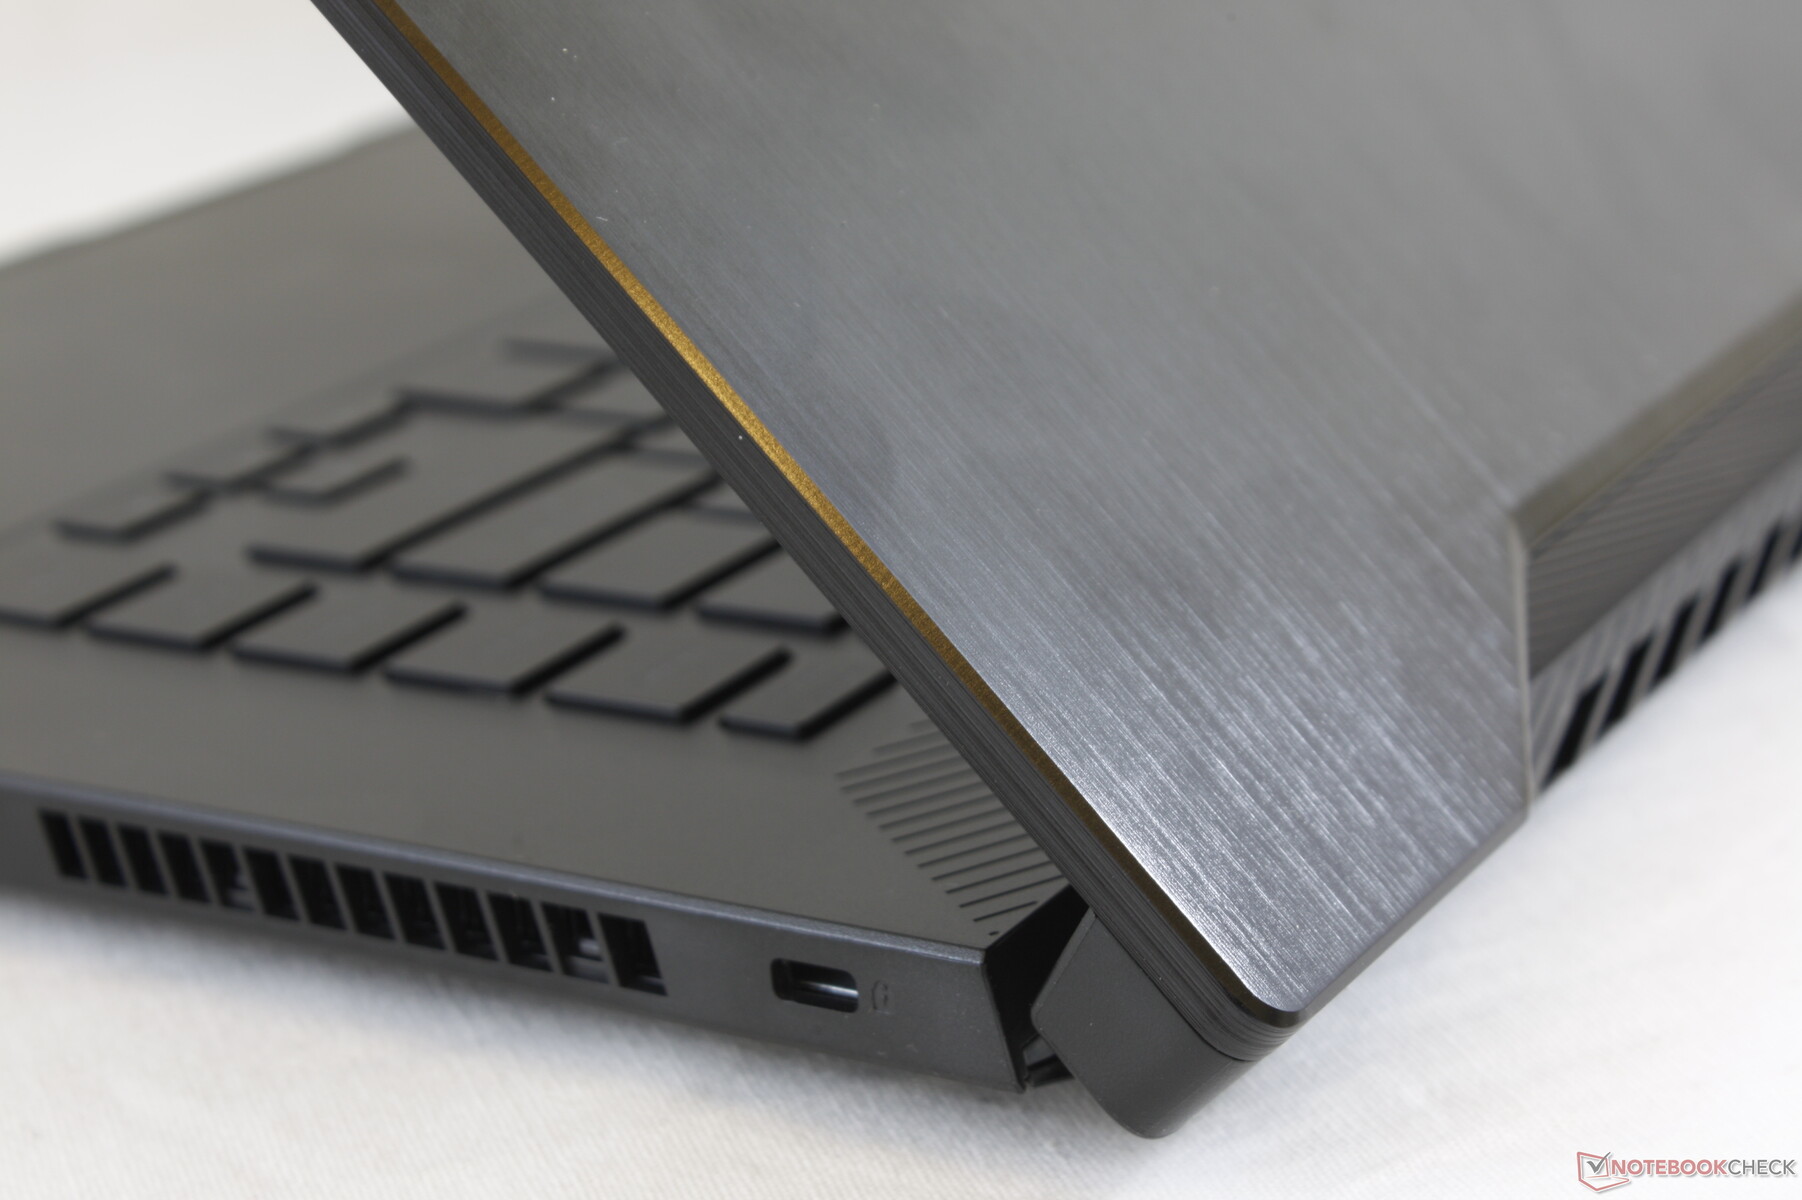
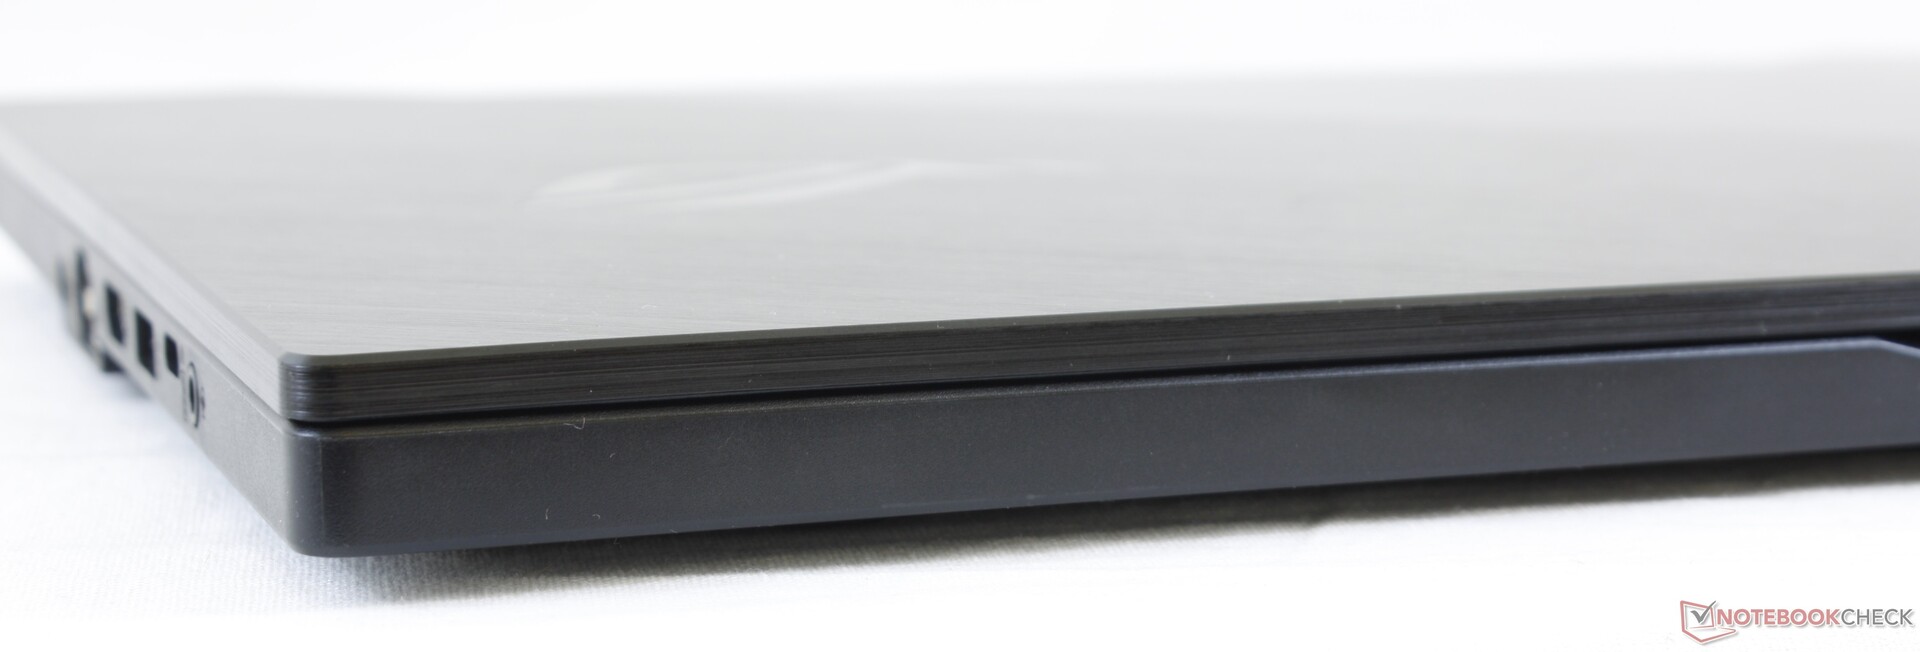
Durum
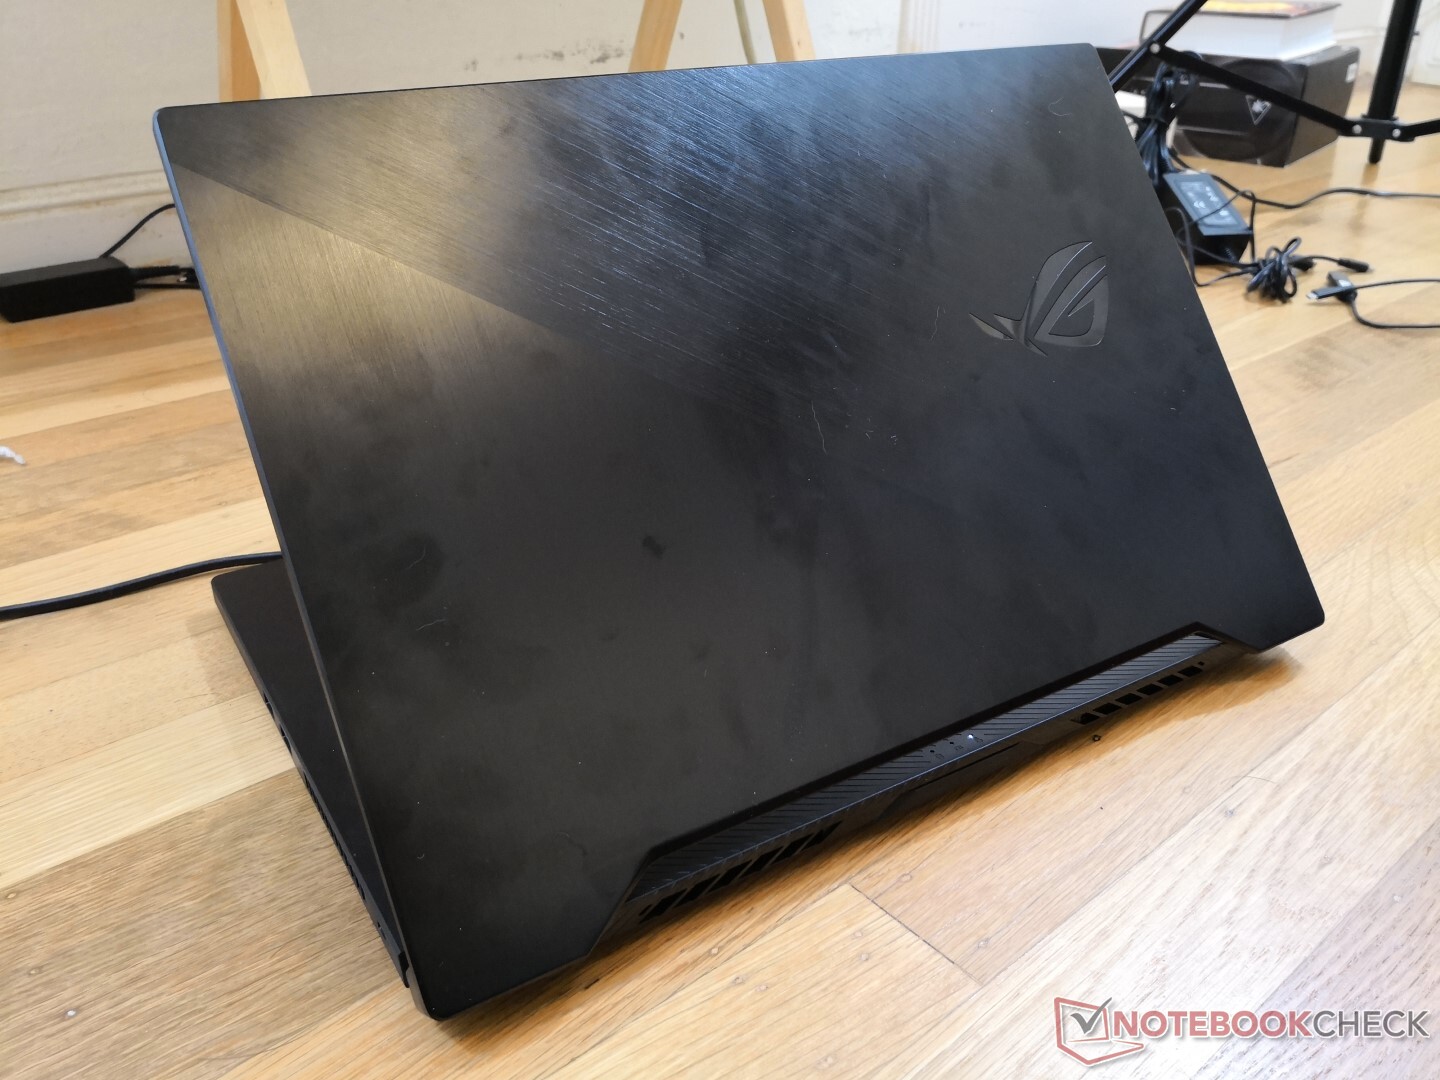
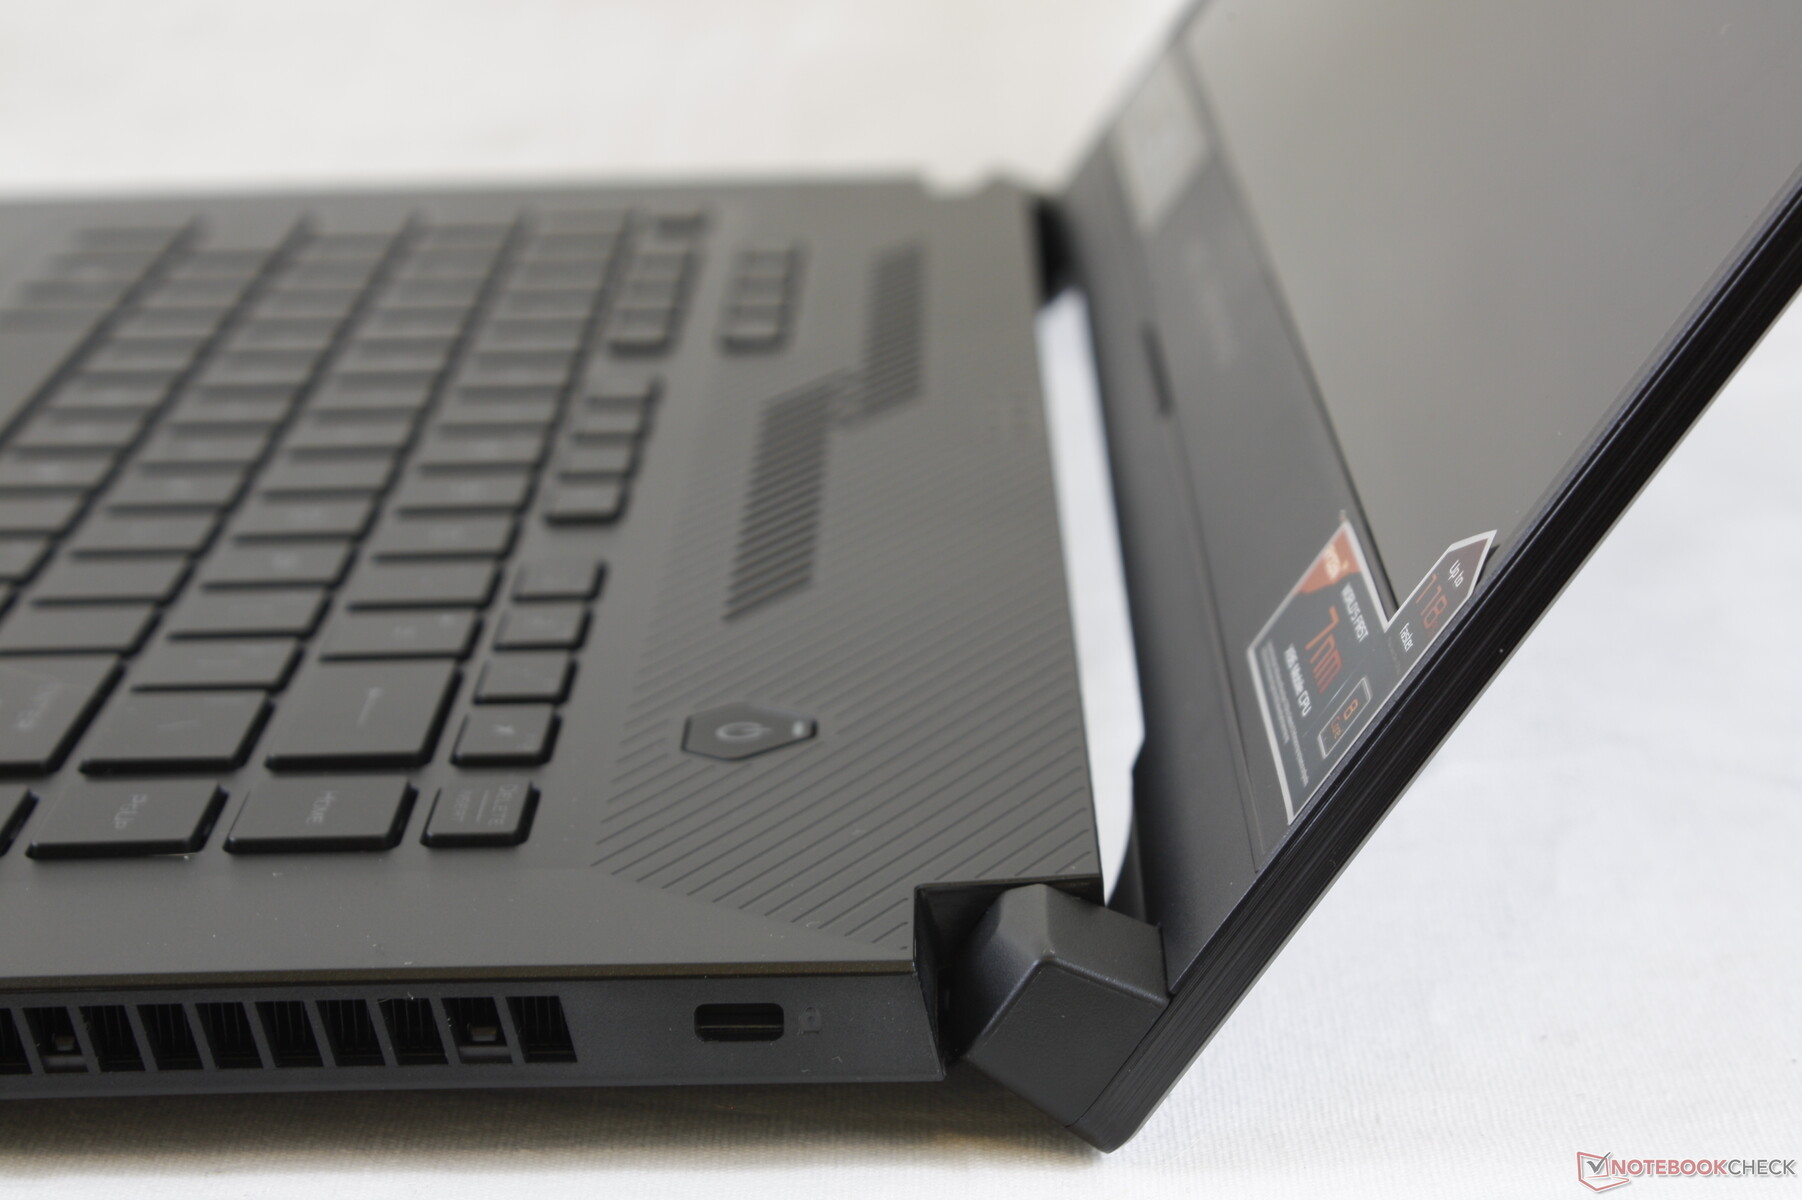
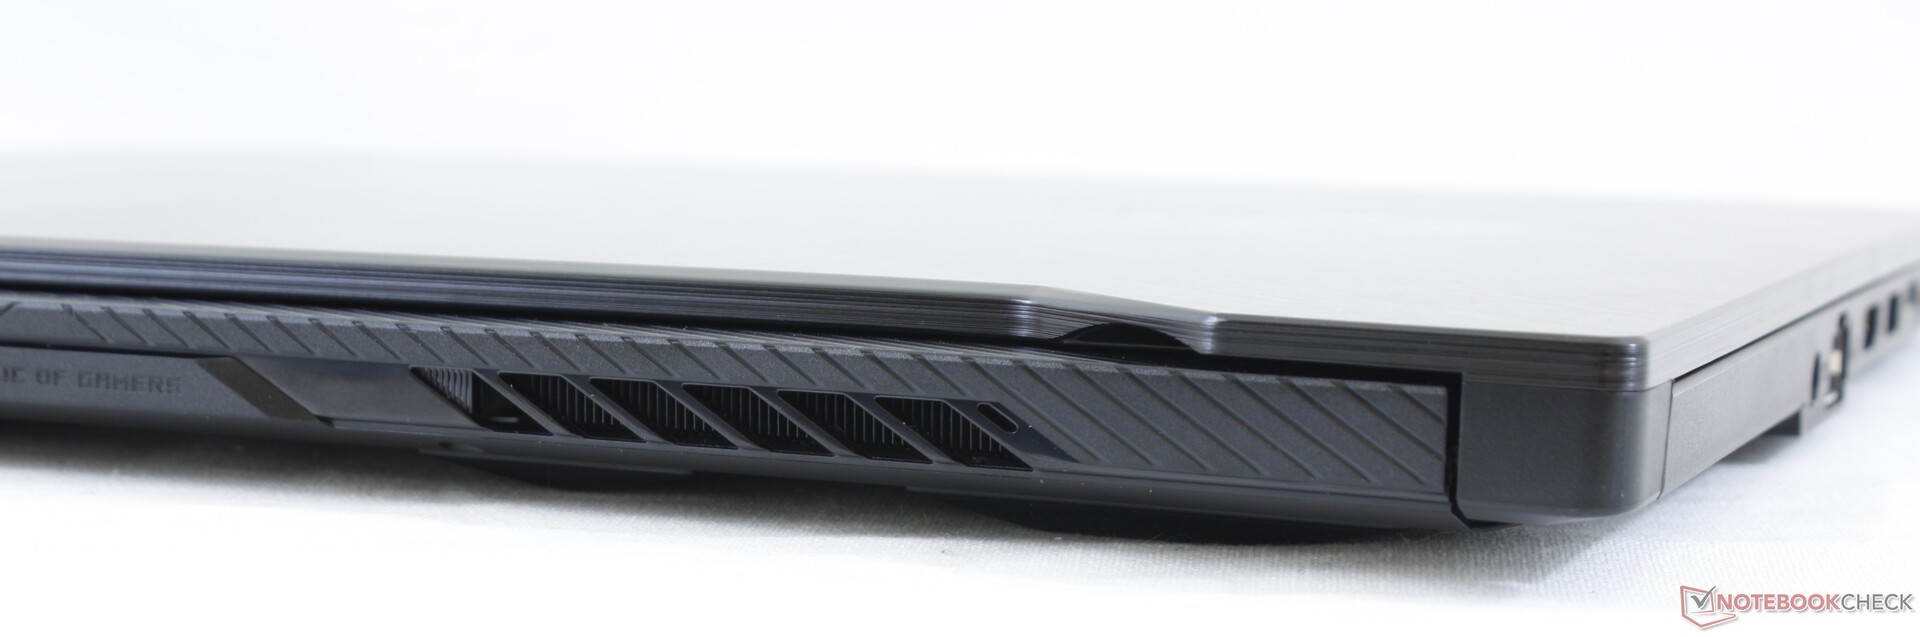
Kasa, daha kalın ve daha ağır olma eğiliminde olan diğer 1000 dolarlık oyun dizüstü bilgisayarlarına kıyasla şık, hafif ve çok incedir. Örneğin Acer Nitro 5 ve MSI GL serisi, Asus'umuzla aynı donanım özelliklerinin birçoğuyla birlikte gelir ve yine de tartışmasız daha az çekici ve daha ucuza üretilmiştir. GA502 serisi benzer plastik malzemeler kullanır ancak genel plastik görünümü aynı fiyat kategorisindeki diğerlerine göre daha iyi gizleyebilir. Diğer bir deyişle, pahalı metal alaşımlara başvurmaya gerek kalmadan üst düzey bir oyun makinesine benziyor.Şasi sağlamlığı, Razer Blade 15, MSI GS66 veya Asus'un kendi Zephyrus gibi diğer ince ve hafif oyun dizüstü bilgisayarlarından daha zayıf. S serisi. Örneğin kapak ve klavye merkezi, baskı uygulayarak daha kolay bükülür ve bastırılır.
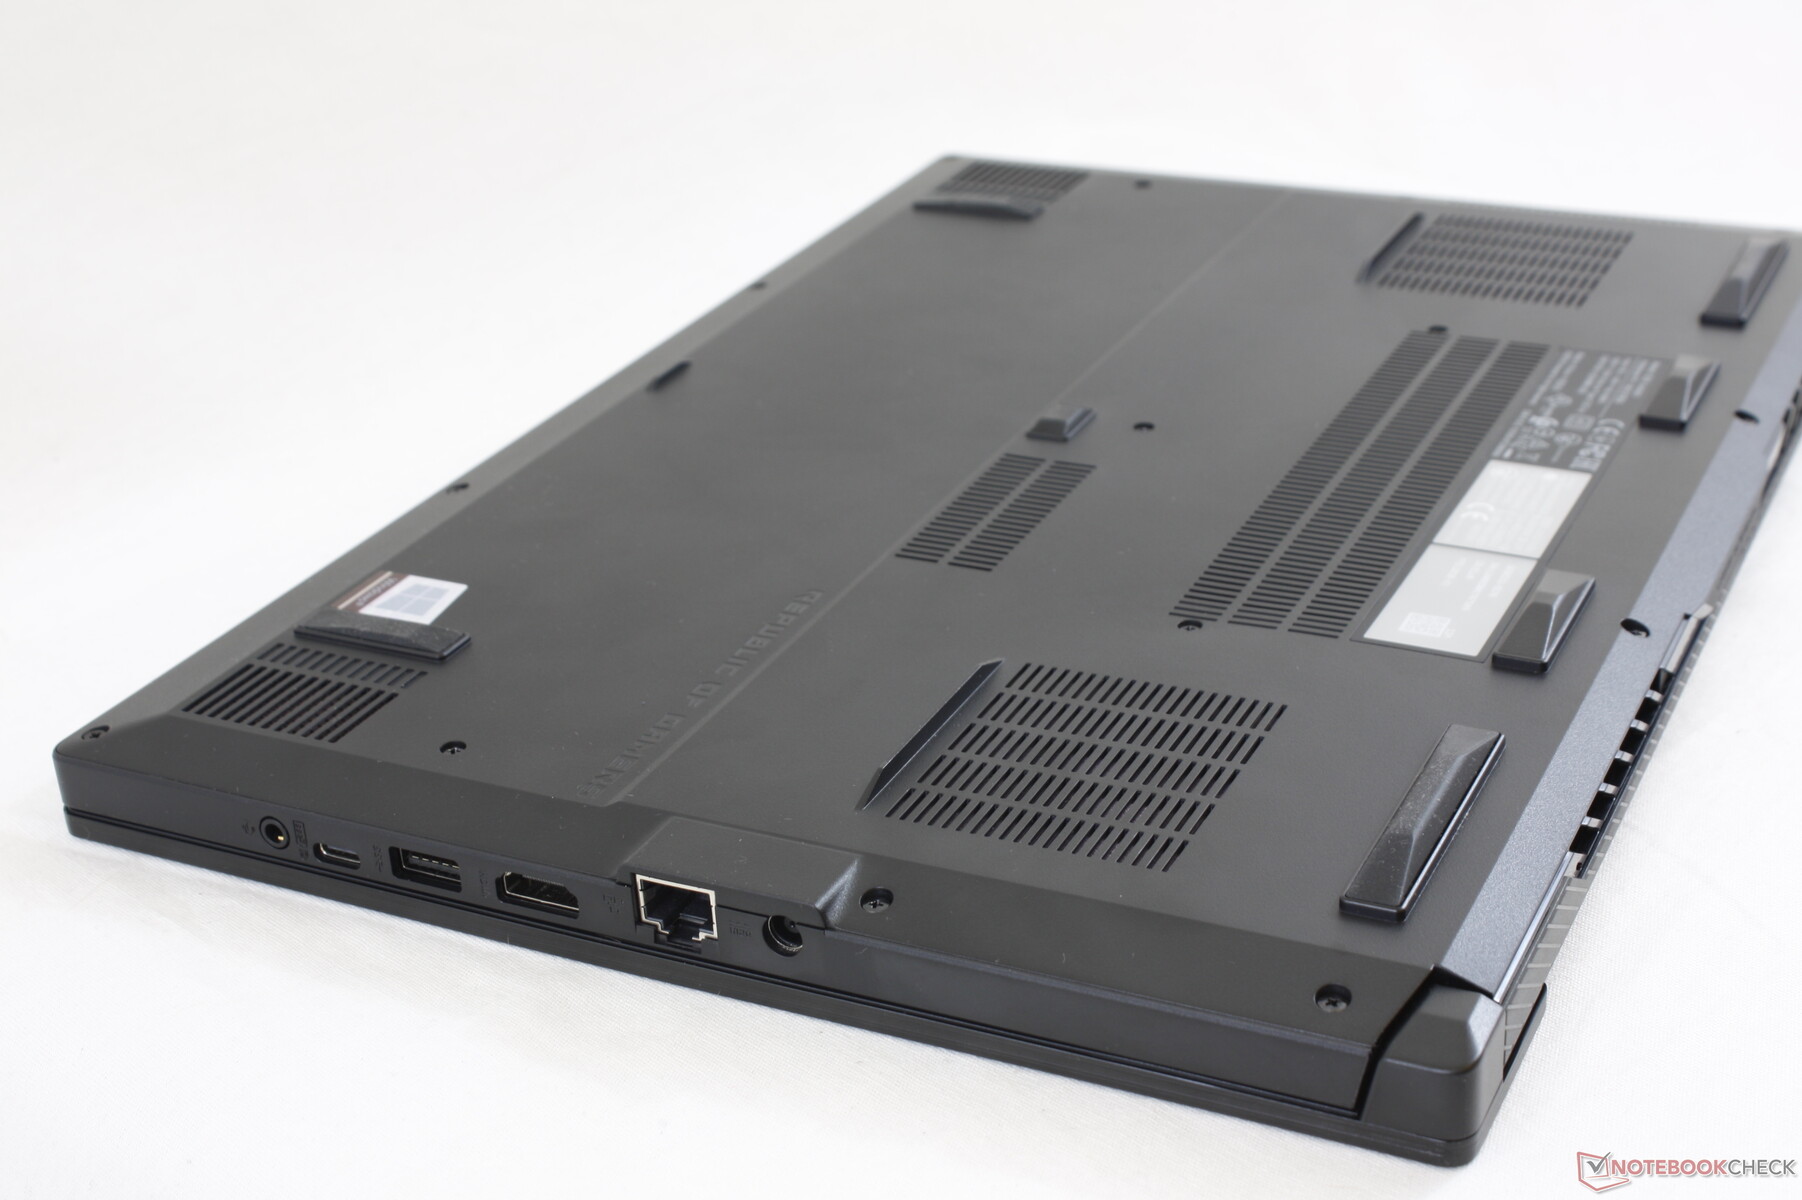
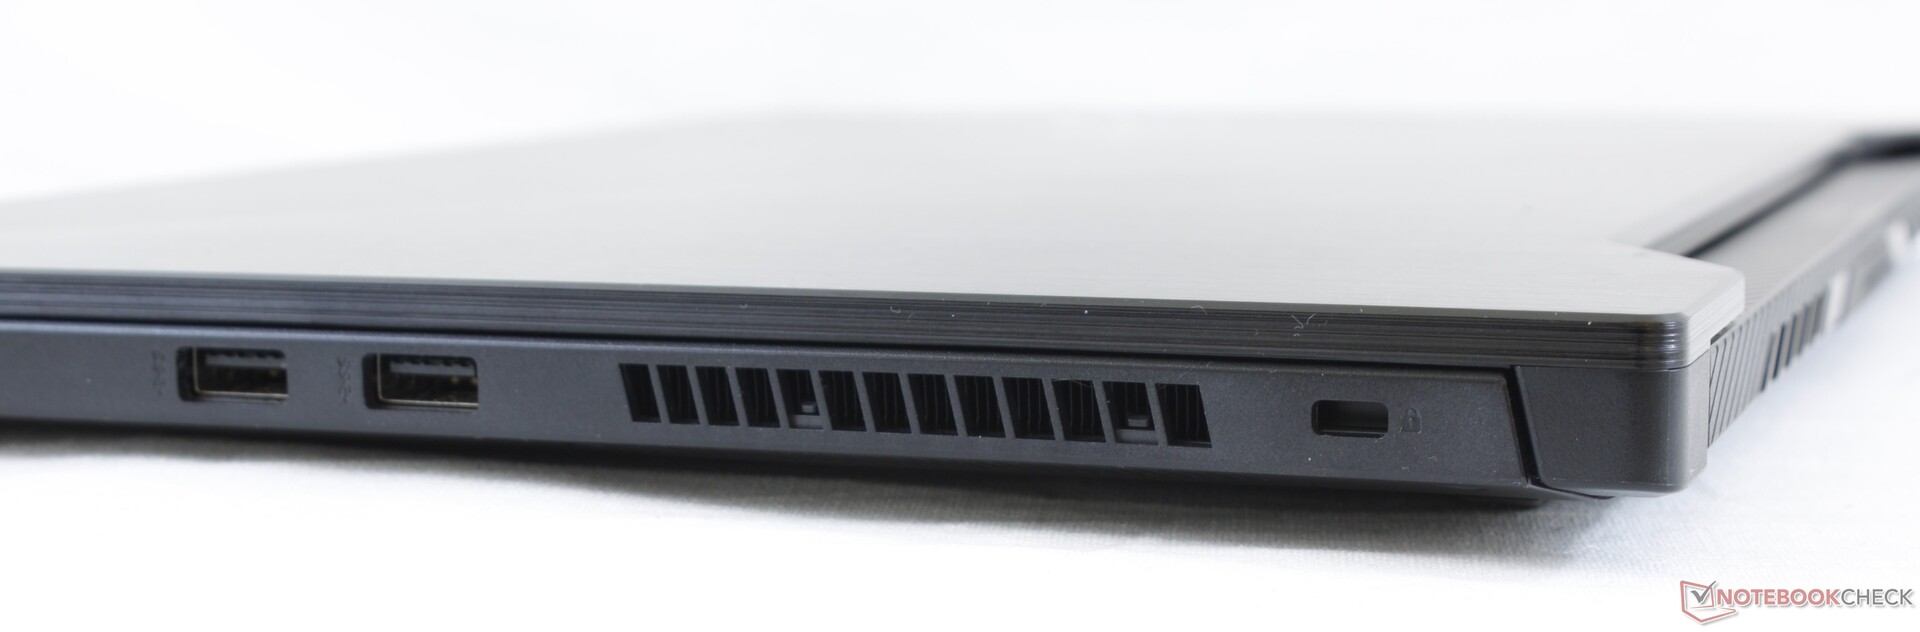
Bağlantı
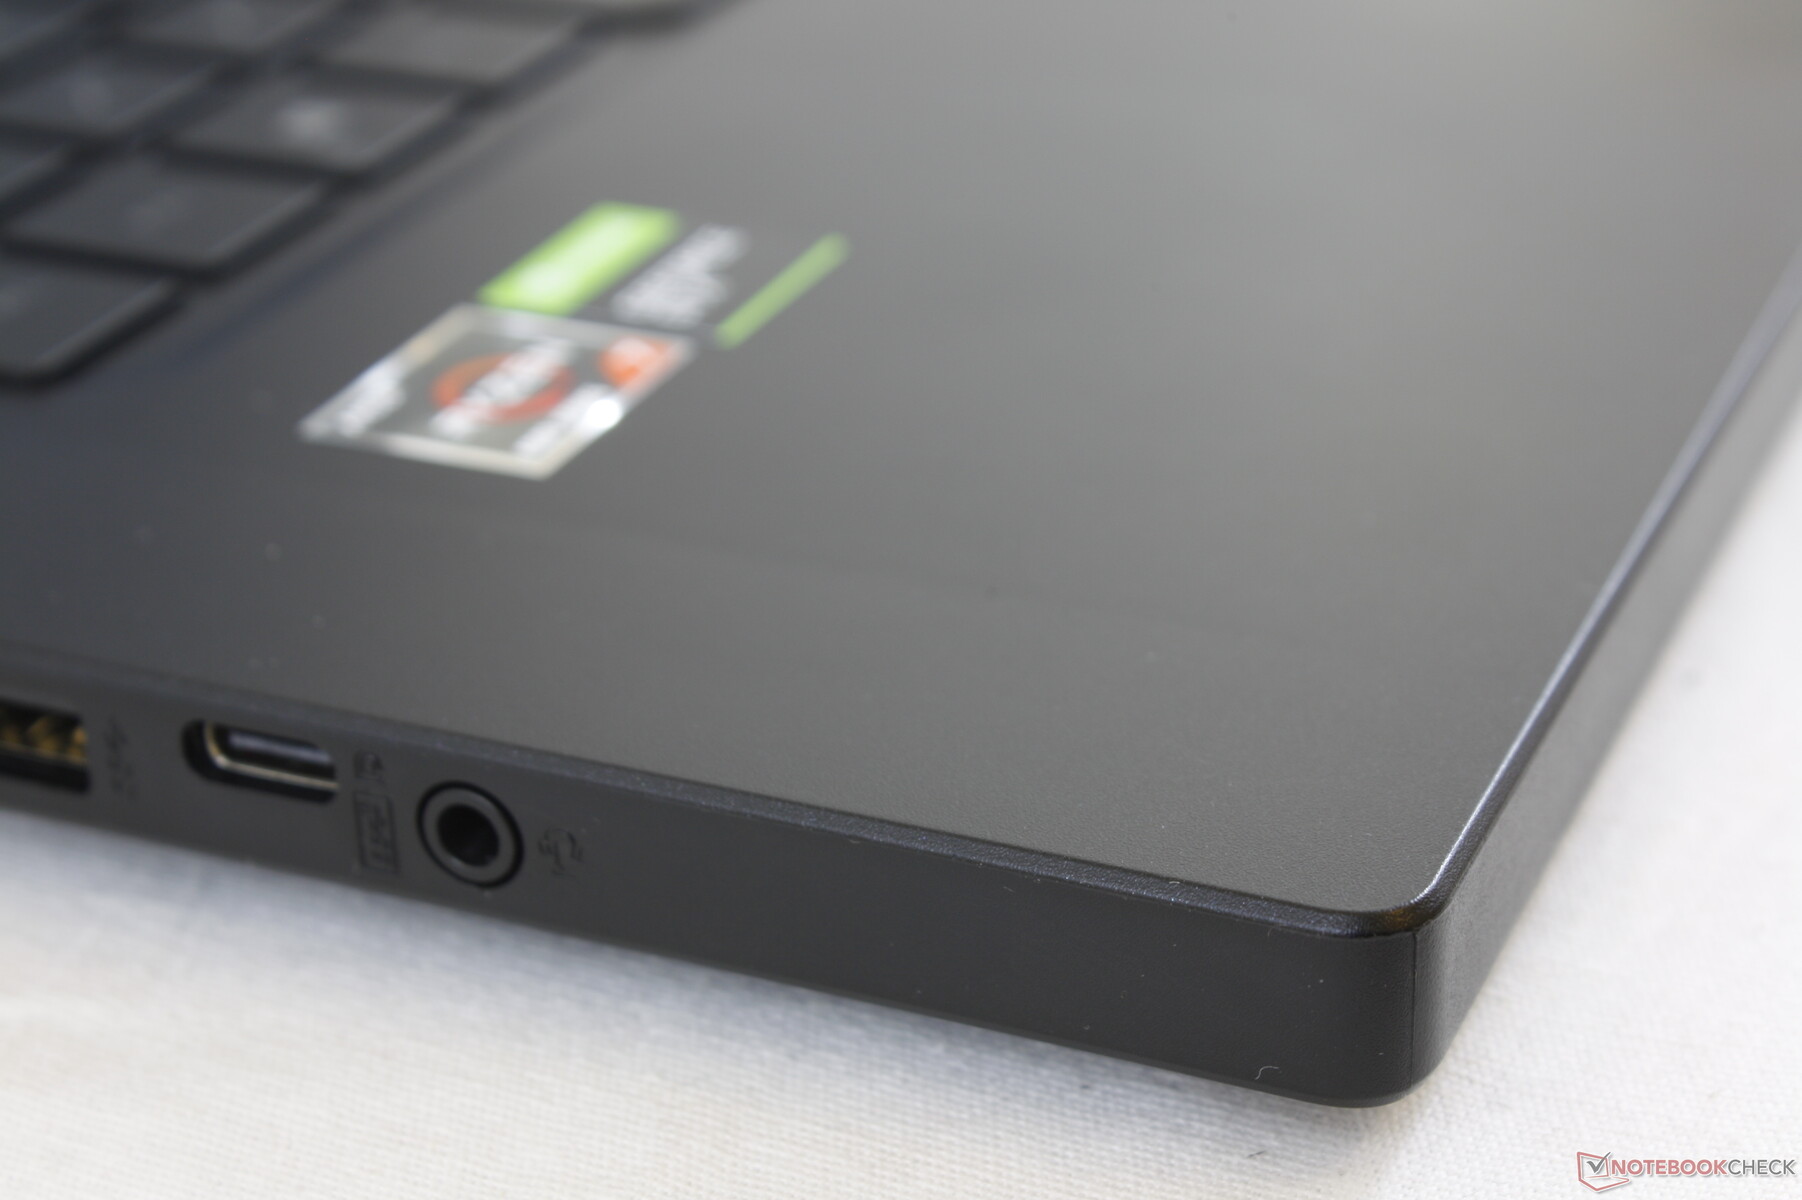
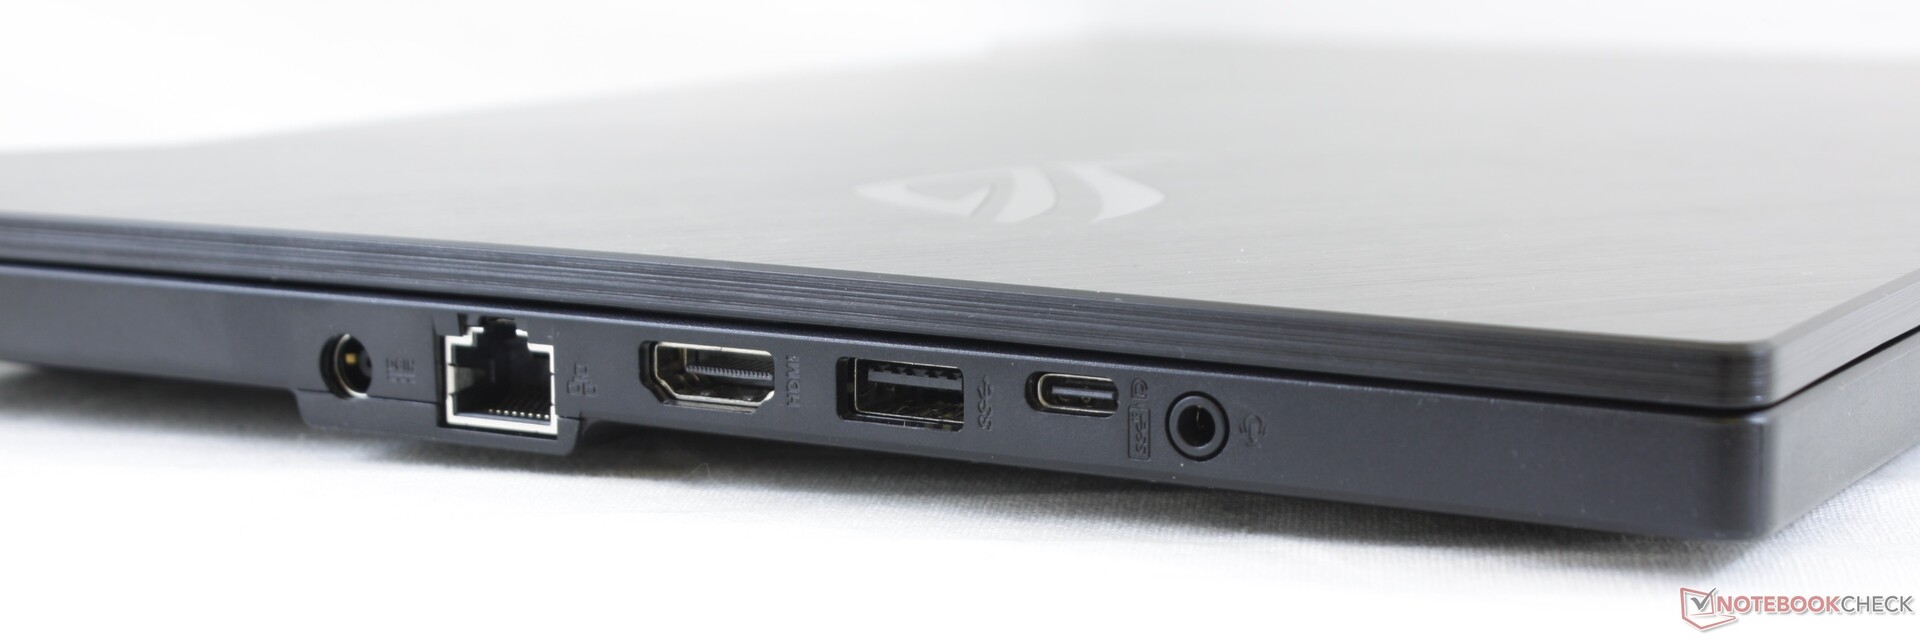
RJ-45, HDMI ve DisplayPort destekli USB-C dahil olmak üzere sağlıklı bir entegre bağlantı noktası seçimi vardır. Thunderbolt 3 desteklenmez ve SD kart okuyucu yoktur. Port konumlandırma, sol elini kullanan kullanıcılar için elverişsizdir çünkü bağlantı noktaları çok yakındır.
İletişim
Intel AX200, geçen yılki GA502DU'daki daha yavaş RealTek Wi-Fi 5 modülünün aksine Wi-Fi 6 ve Bluetooth 5.1 bağlantısı için standart olarak geliyor. Netgear RAX200 test yönlendiricimizle eşleştirildiğinde hiçbir sorun yaşamadık.
| Networking | |
| iperf3 transmit AX12 | |
| Eluktronics RP-15 | |
| MSI GS66 Stealth 10SE-045 | |
| Asus ROG Zephyrus Duo 15 GX550LXS | |
| Razer Blade 15 RTX 2070 Super Max-Q | |
| Asus ROG Zephyrus G15 GA502IU-ES76 | |
| Lenovo Legion 5 15IMH05H | |
| iperf3 receive AX12 | |
| Eluktronics RP-15 | |
| Razer Blade 15 RTX 2070 Super Max-Q | |
| MSI GS66 Stealth 10SE-045 | |
| Asus ROG Zephyrus Duo 15 GX550LXS | |
| Asus ROG Zephyrus G15 GA502IU-ES76 | |
| Lenovo Legion 5 15IMH05H | |
Web kamerası
Asus'un söylediği gibi ekranın etrafındaki çok dar çerçevelerden kaynaklanan entegre bir web kamerası yok. Ancak, en yeni XPS 15, XPS 17 veya 2020 HP Spectre gibi daha yeni Ultrabook'lar, dar çerçevelerden veya konumlandırmadan ödün vermeden entegre bir web kamerasına sahip olmanın mümkün olduğunu kanıtladı.
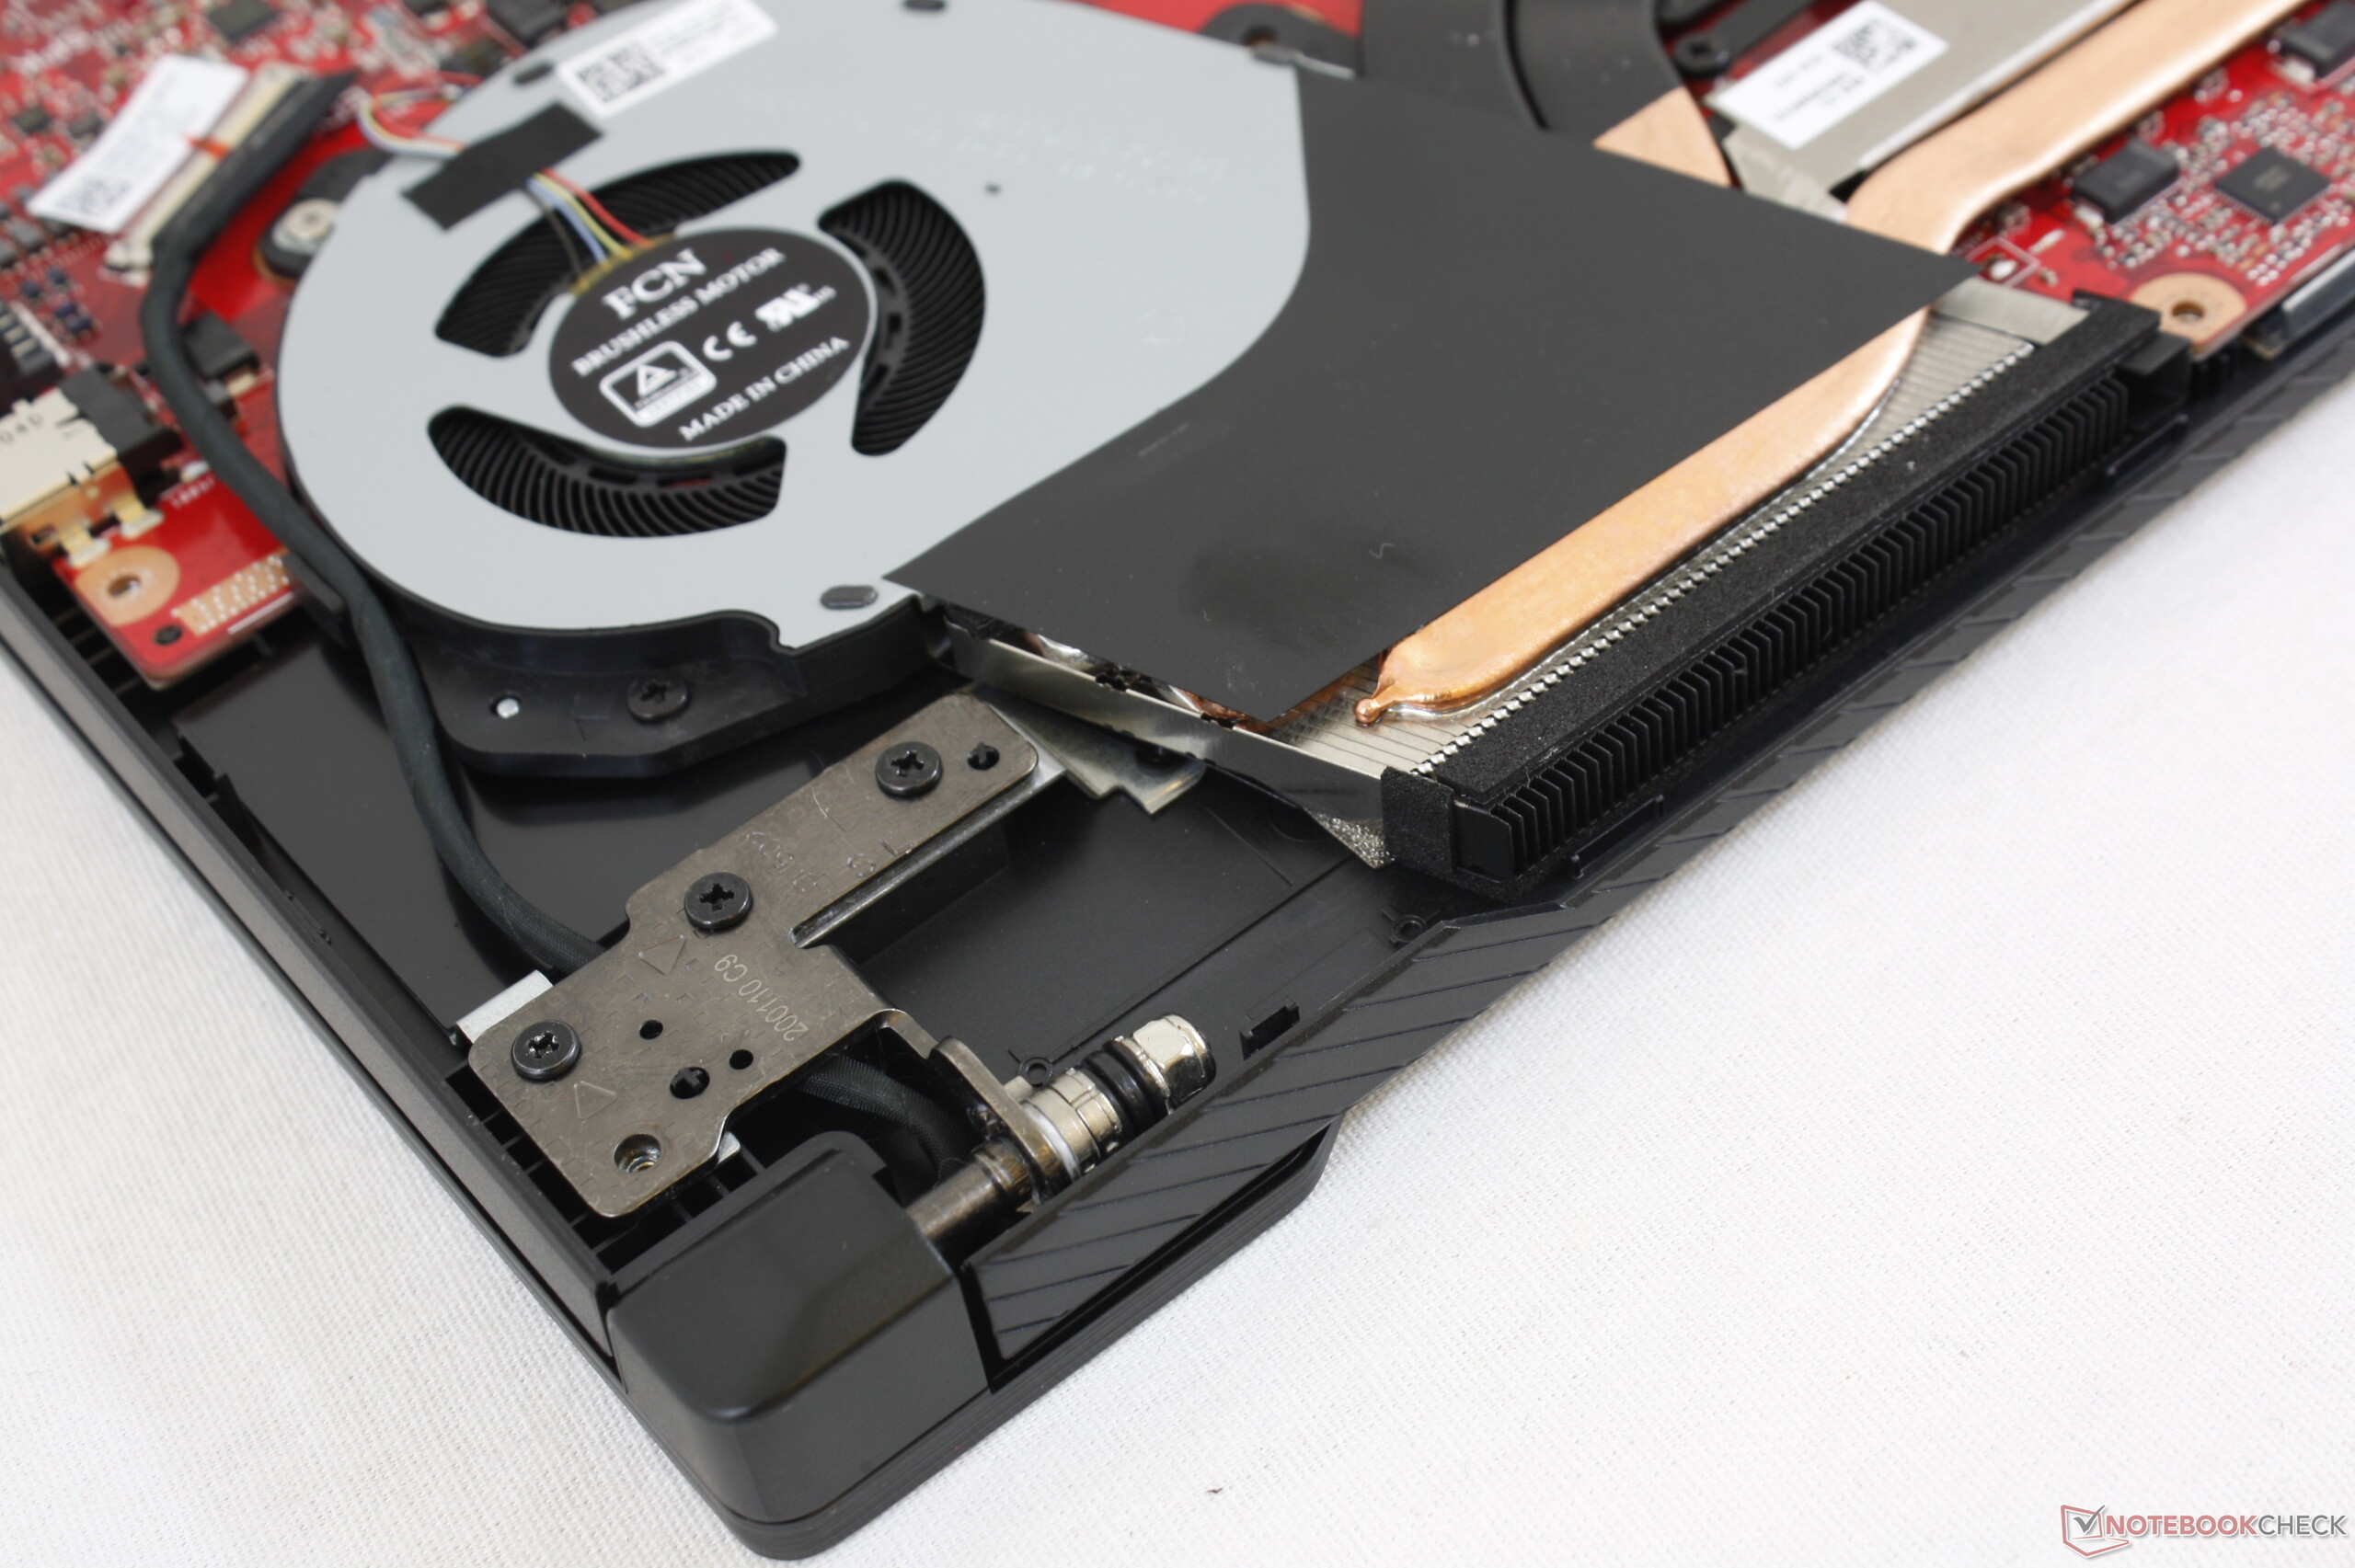
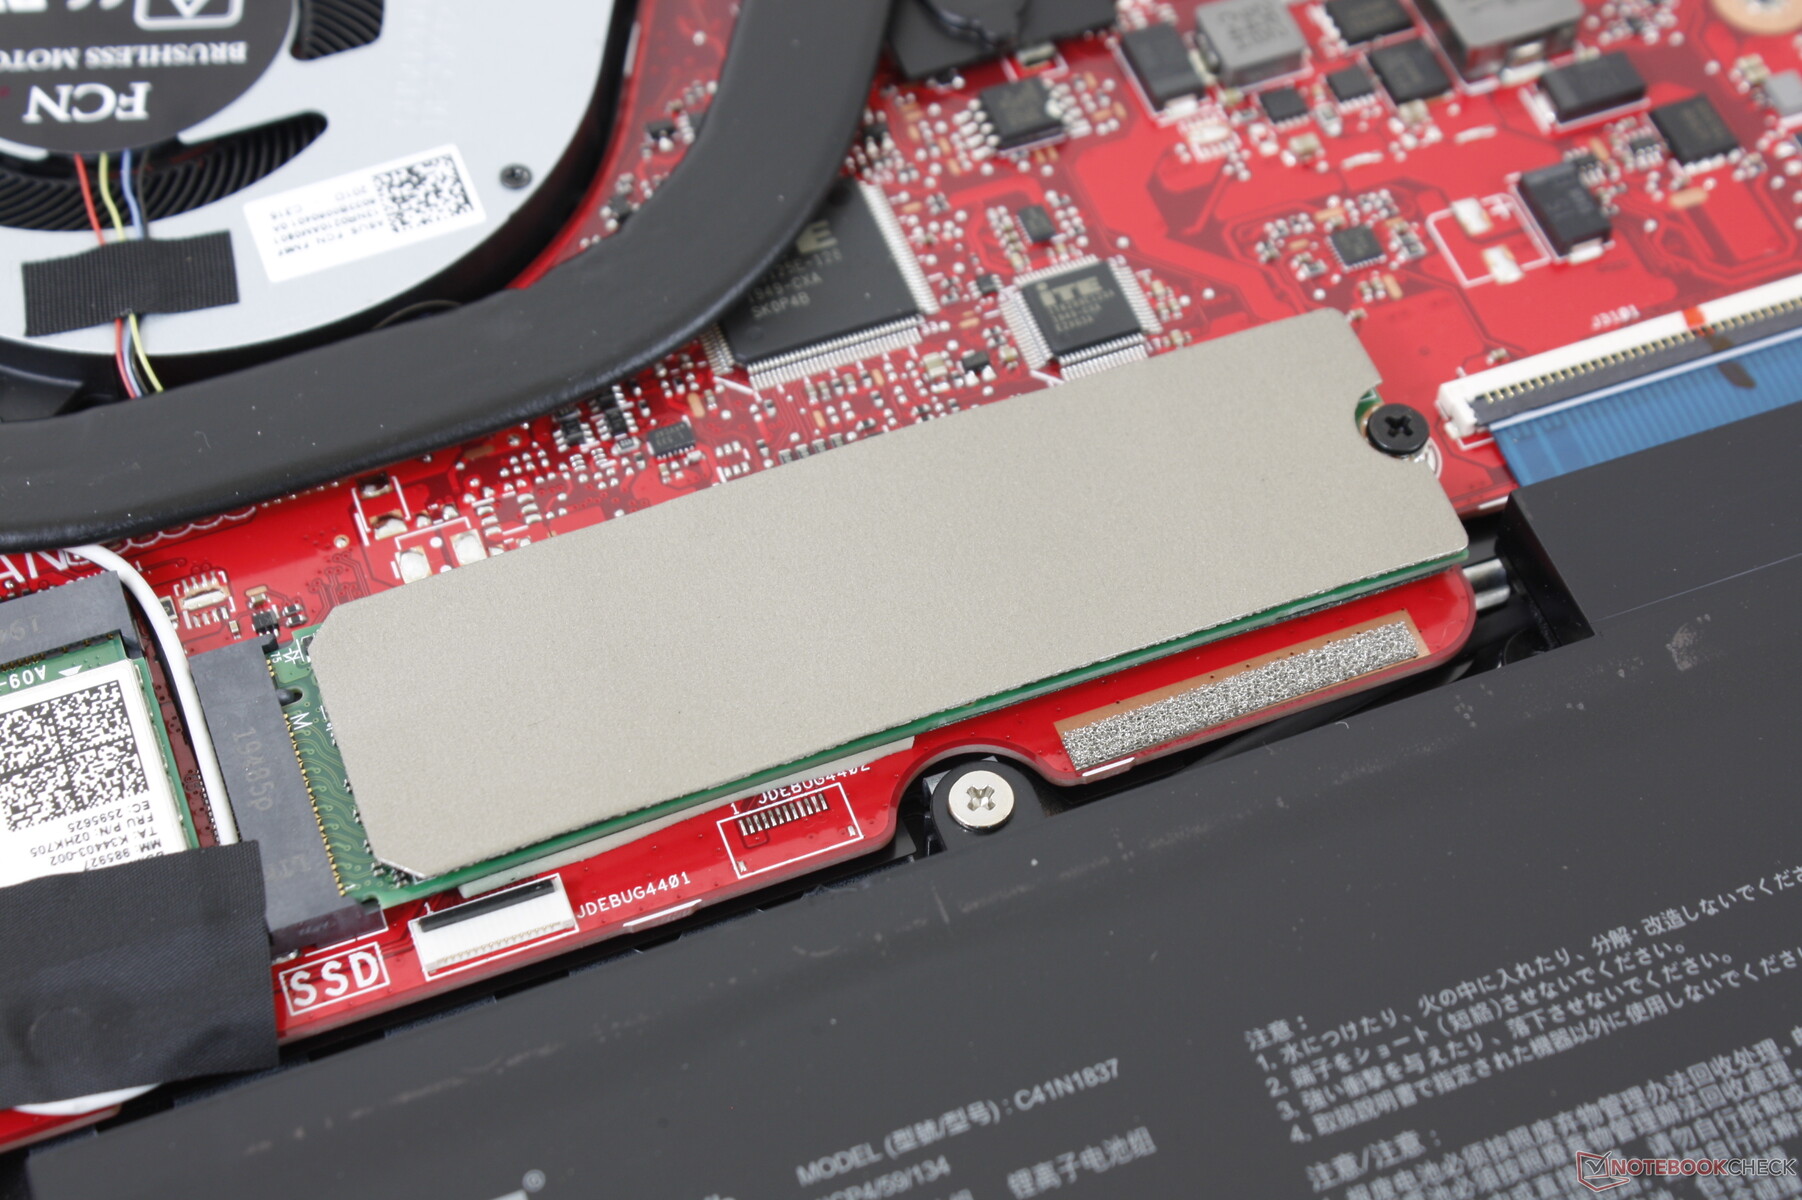
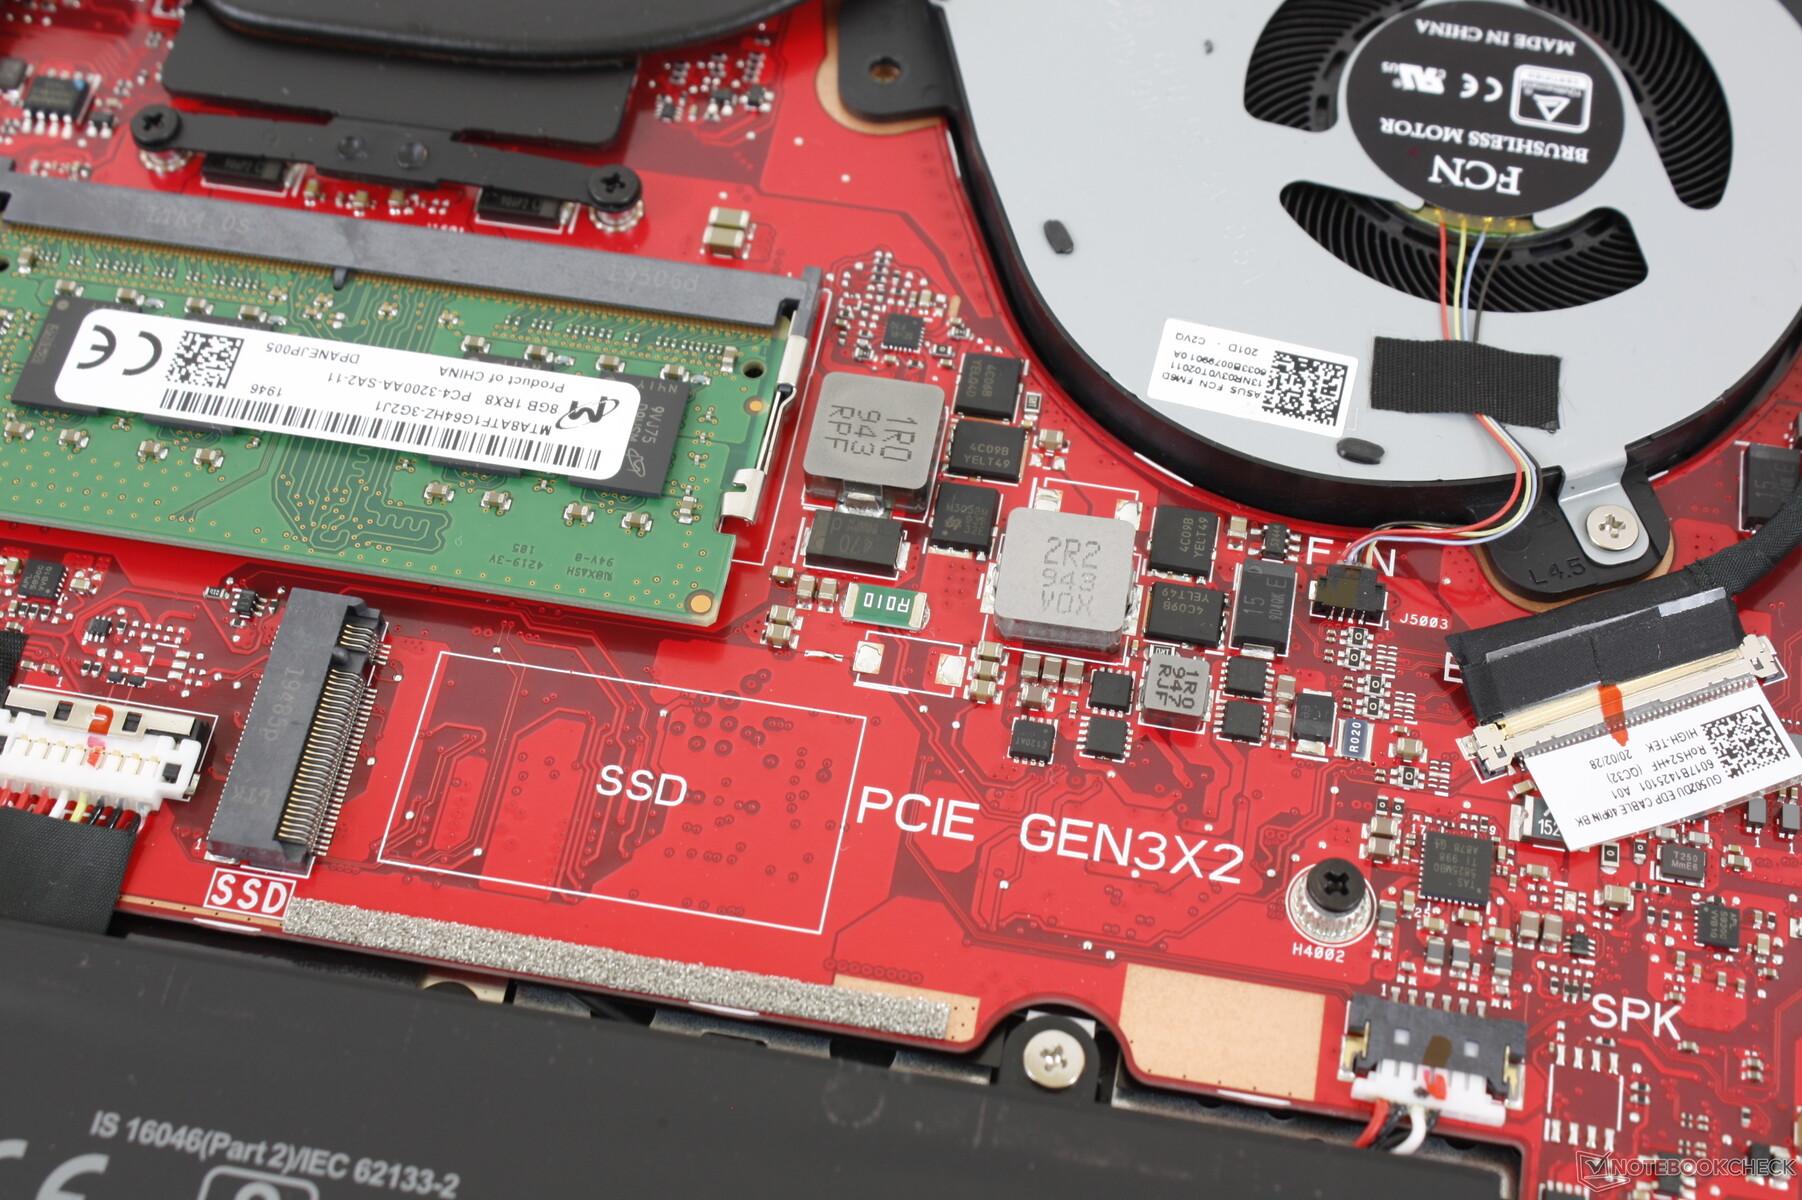
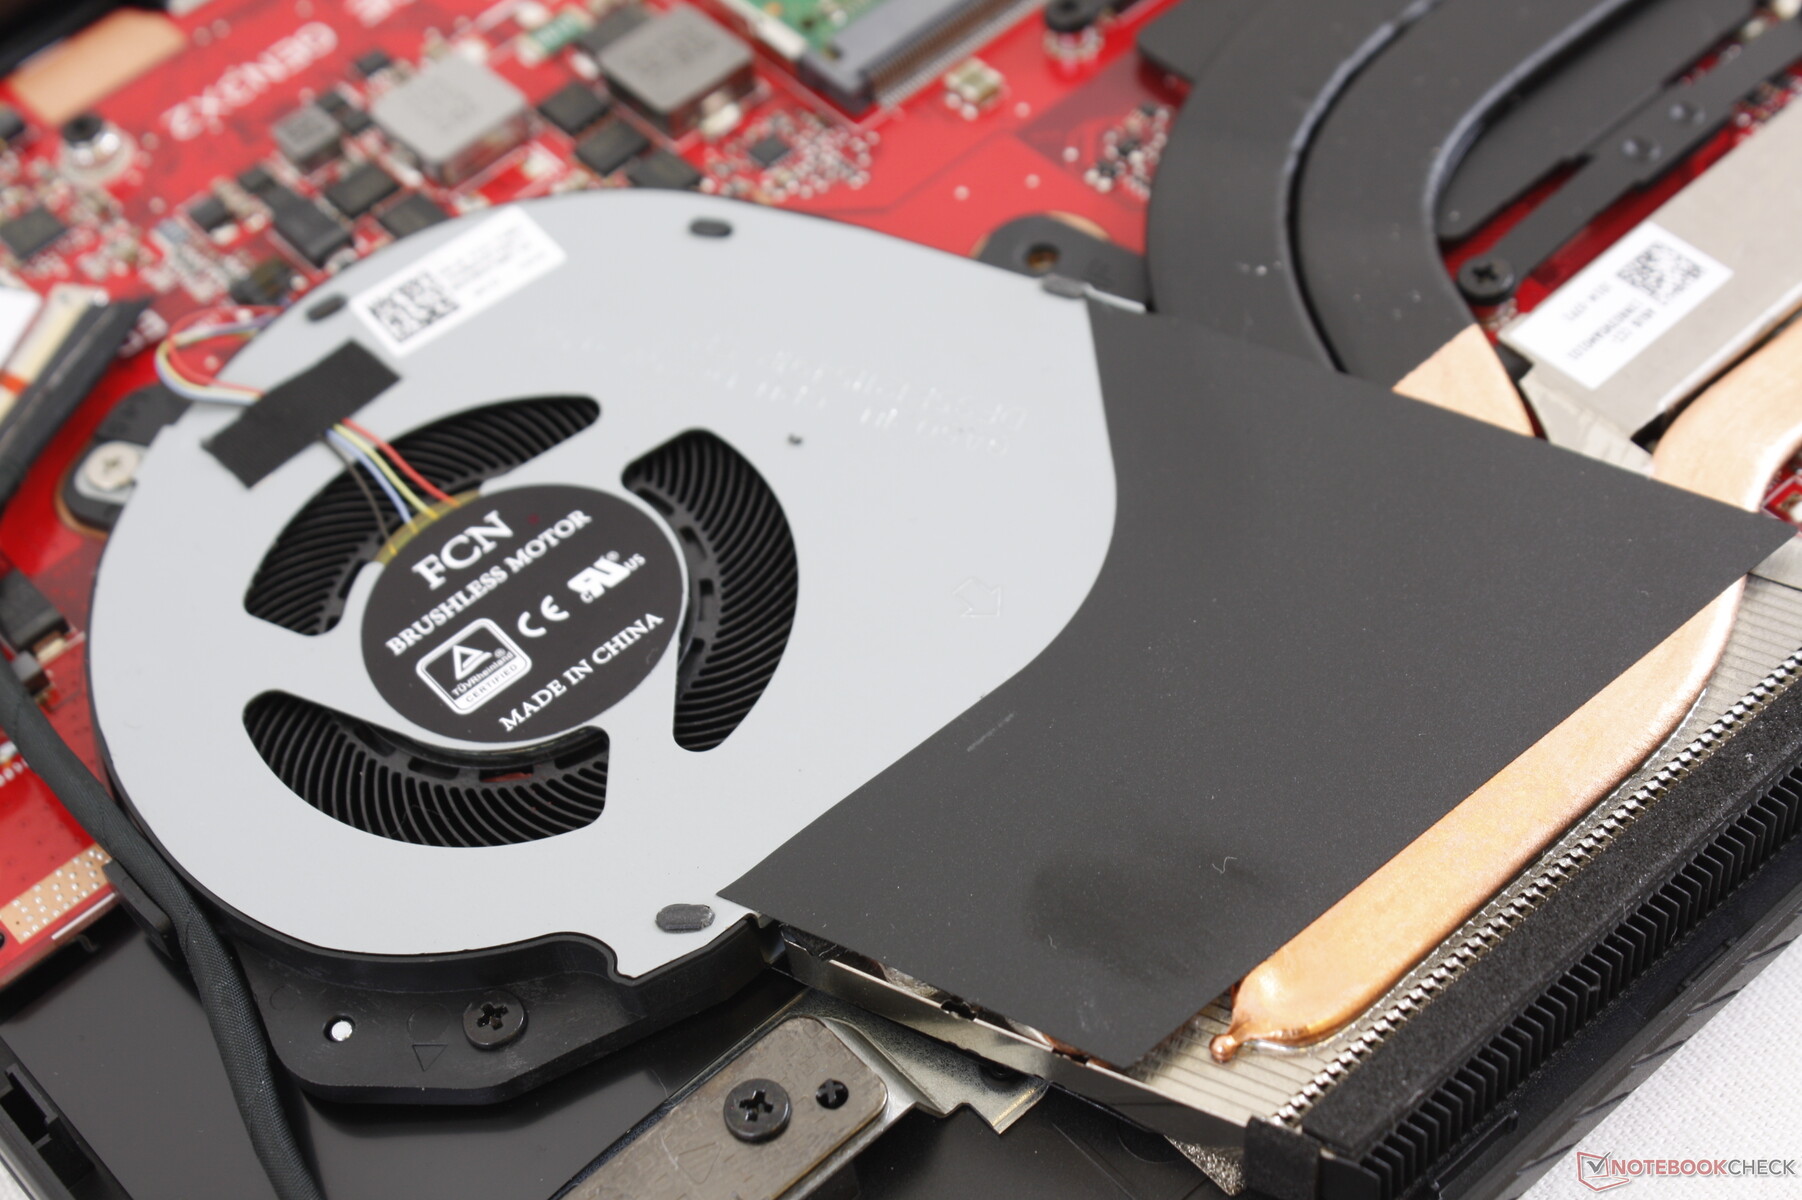
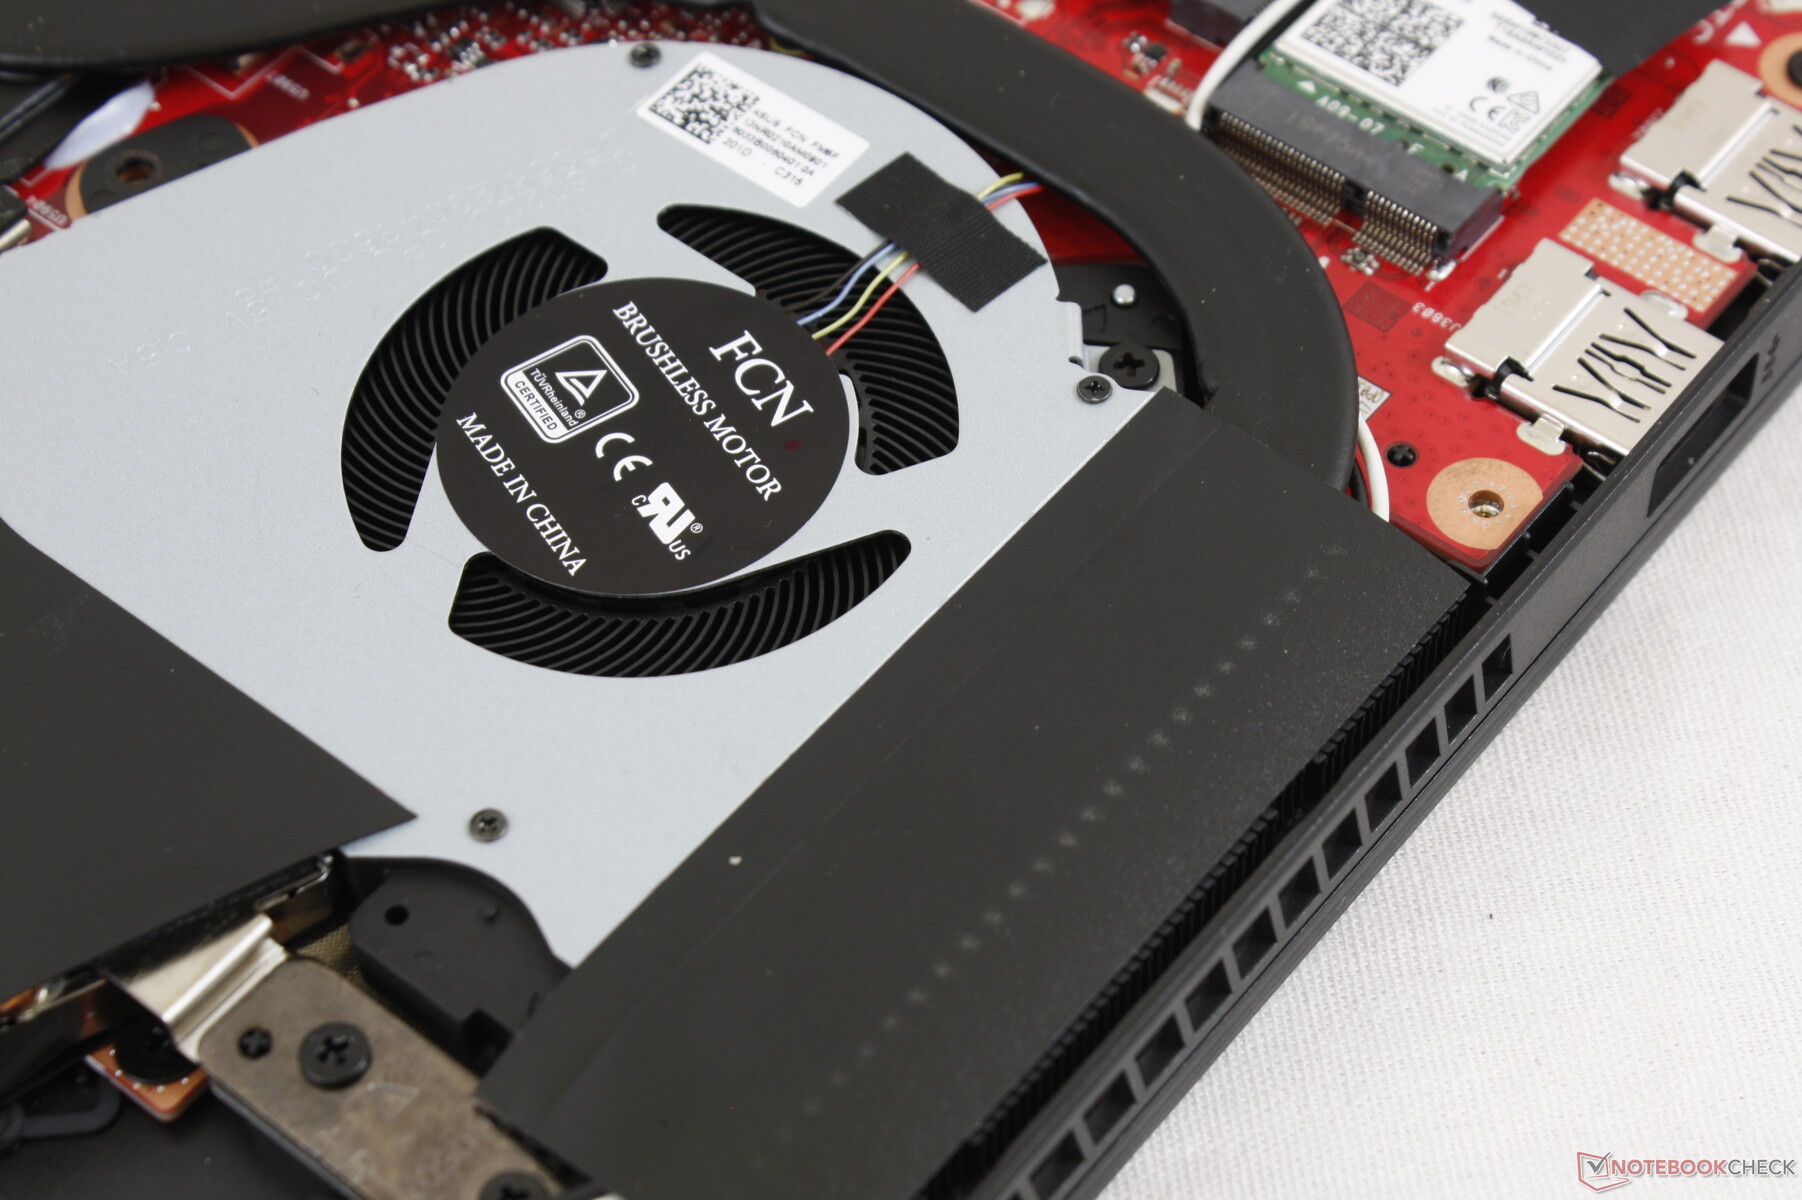
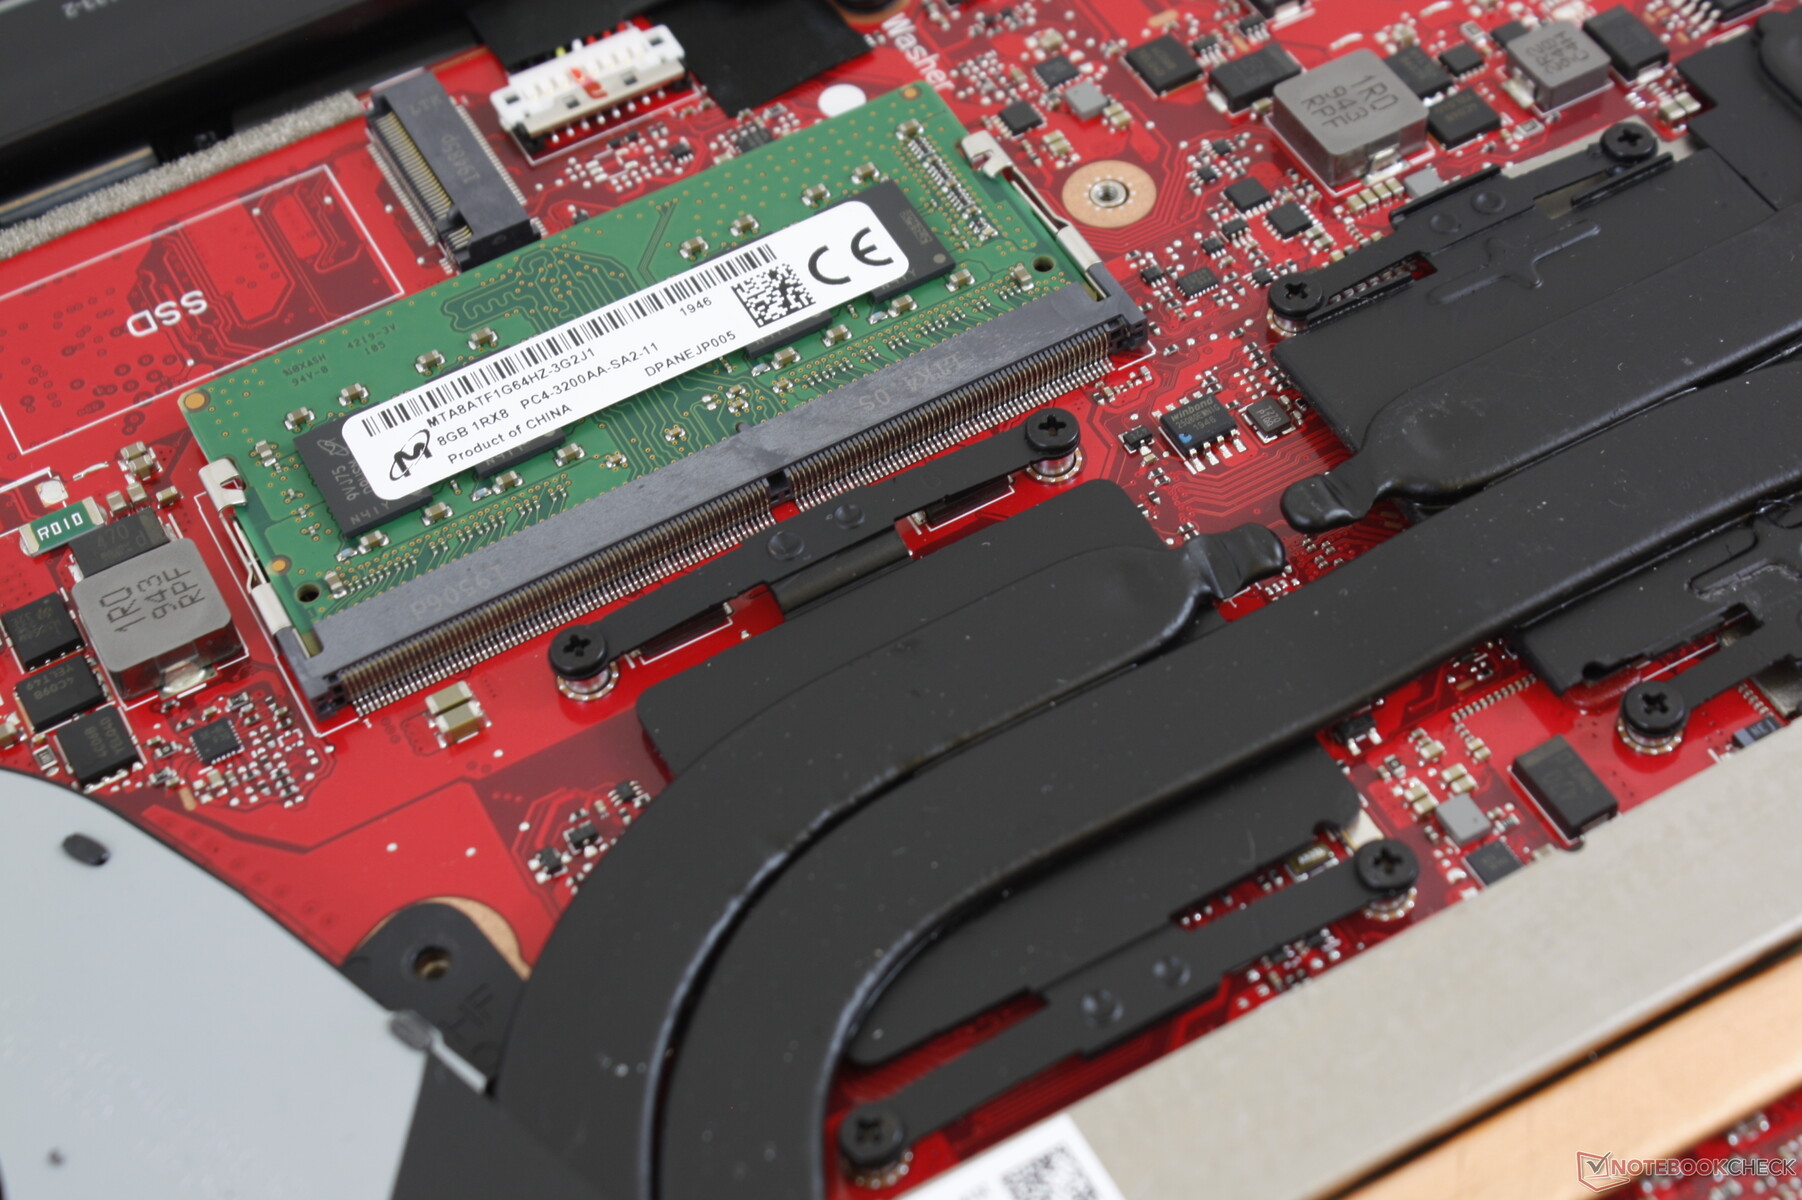
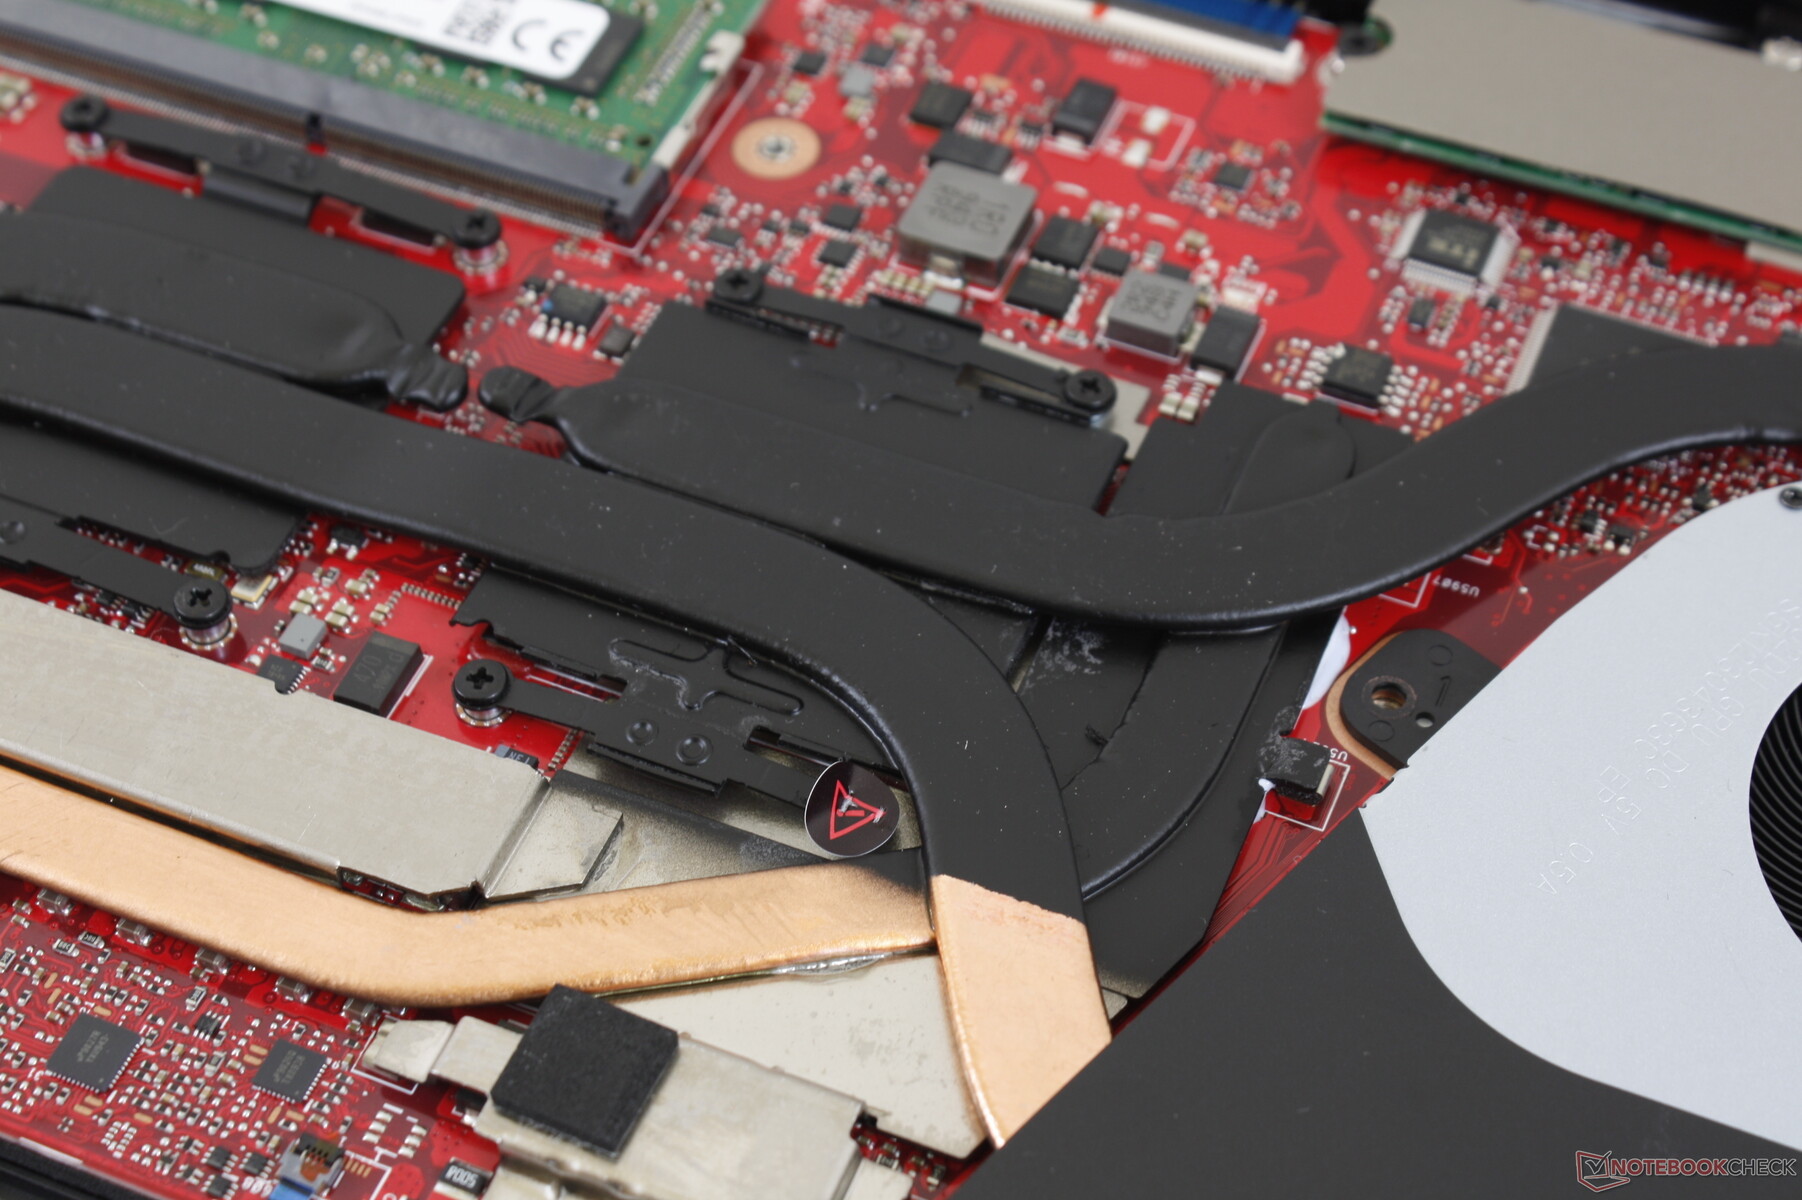
Bakım
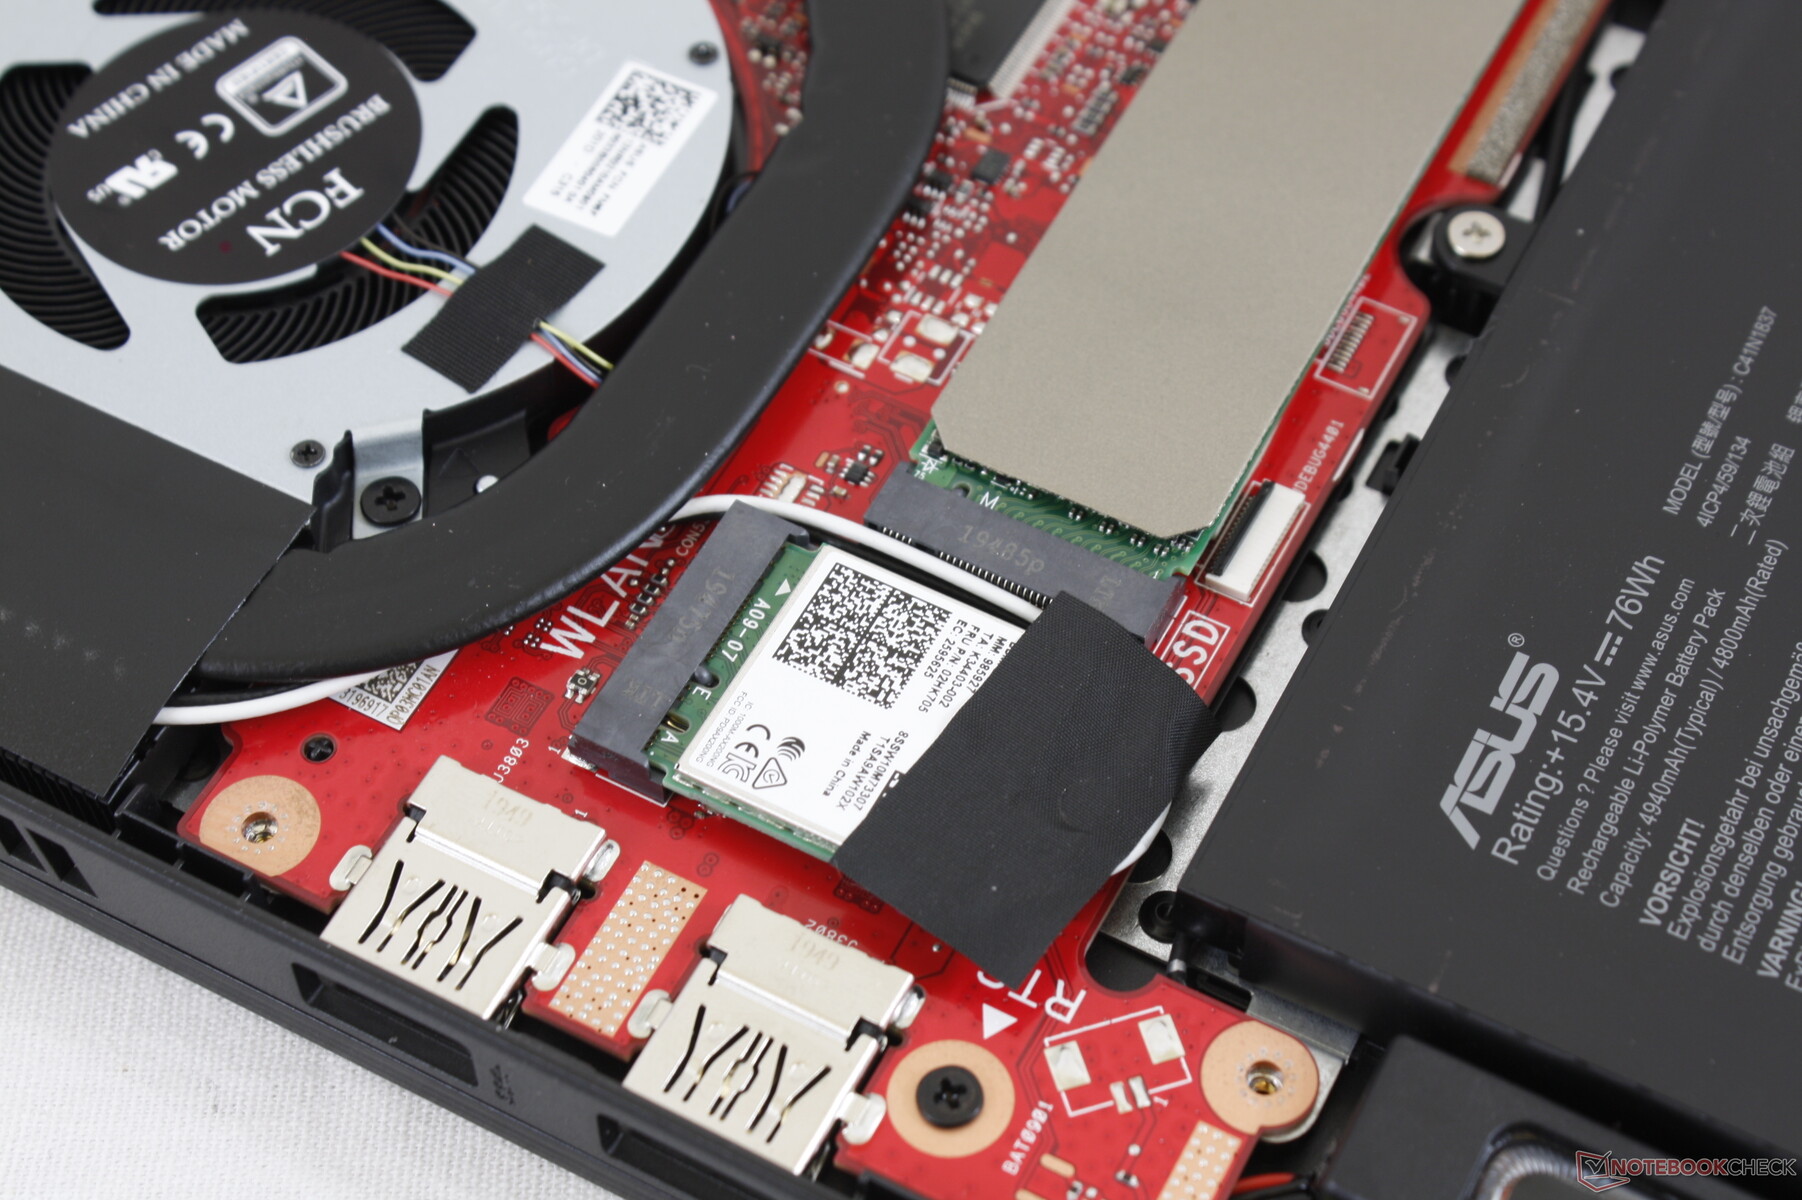
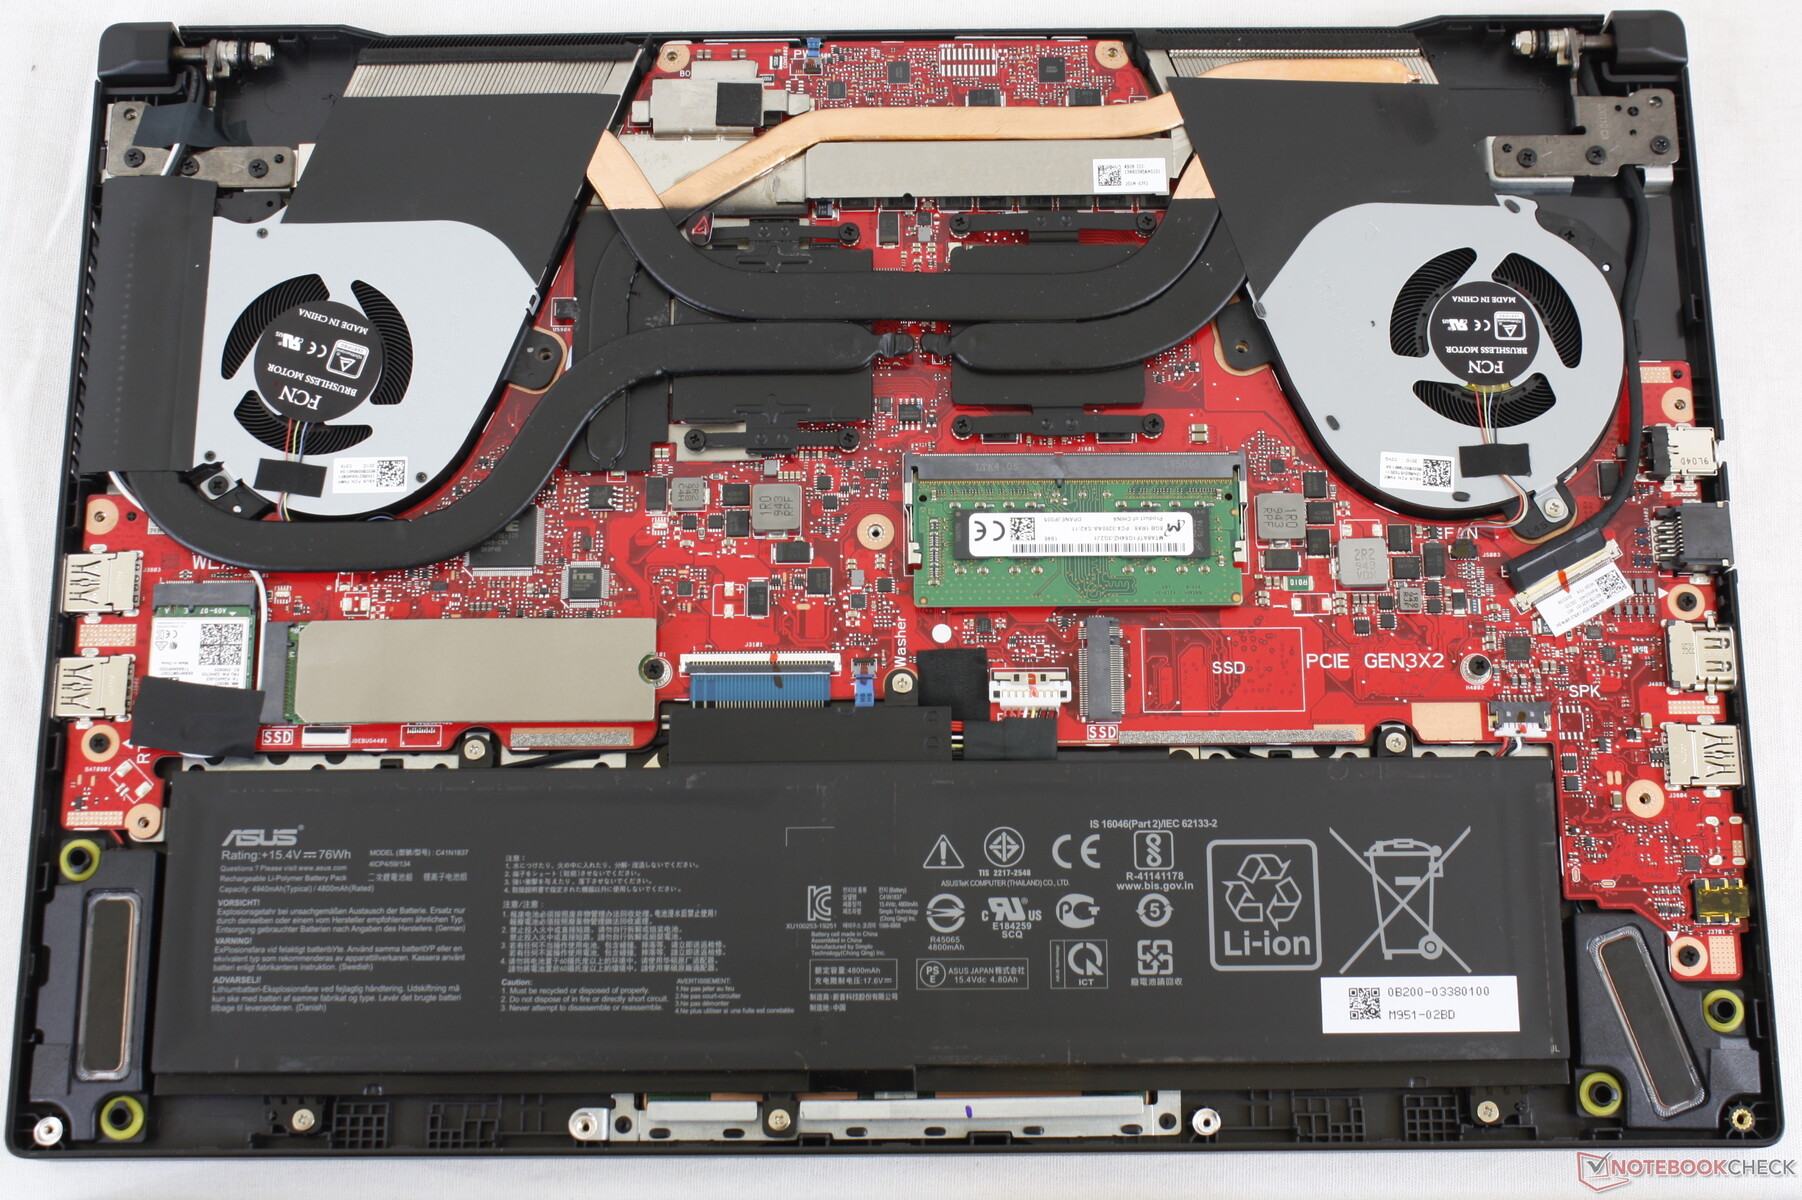
Toplam 15 vida olduğundan alt panelin çıkarılması sabır ister. İç kısımlar, ısı borularında bazı küçük değişiklikler dışında geçen yılki GA502DU ile aynıdır.
Aksesuarlar ve Garanti
Kutuda AC adaptörü ve evrak dışında hiçbir ekstra yok. Standart bir yıllık sınırlı garanti, Xotic PC'den dört yıla kadar uzatma seçenekleri için geçerlidir. Kullanıcılar, satın alma tarihinden itibaren 60 gün içinde kaydolmalıdır ve nakliye ücretleri yalnızca tek yönde karşılanır.
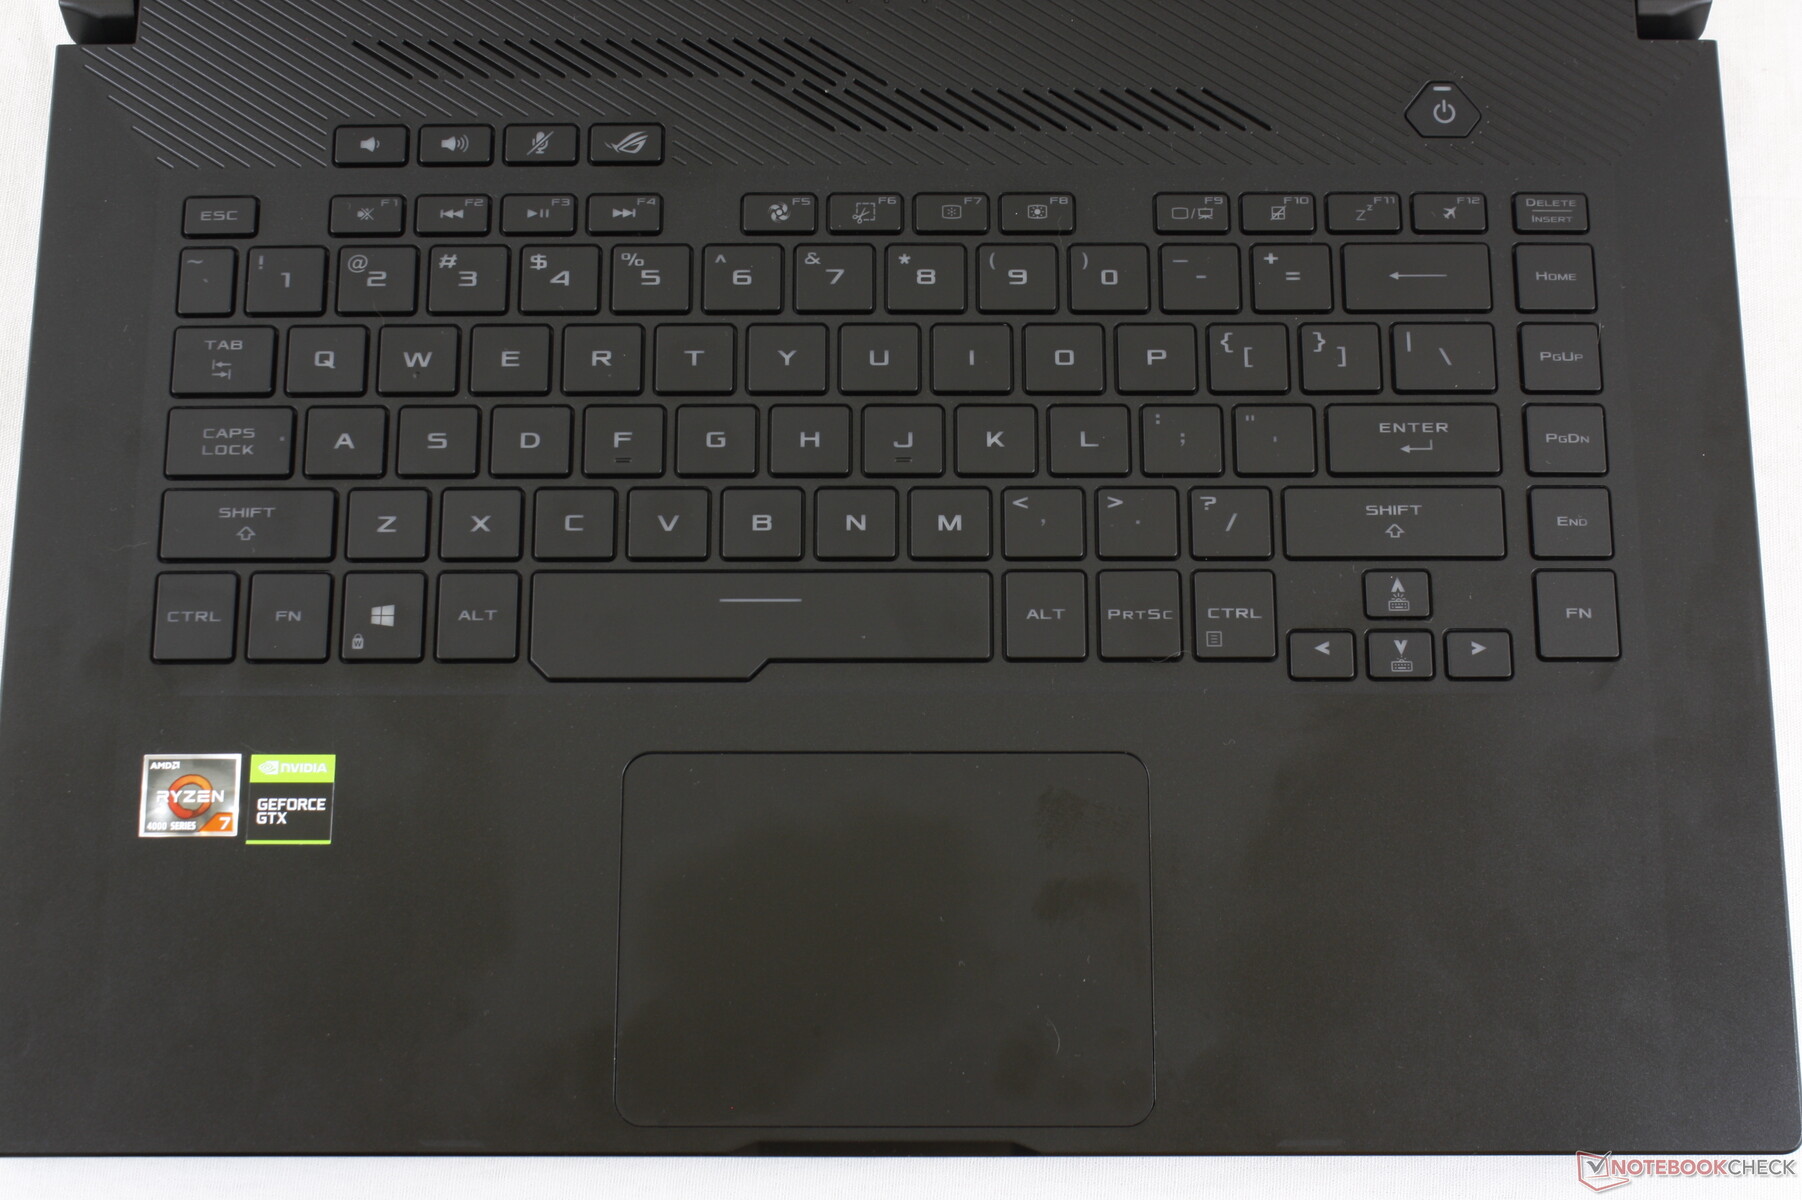
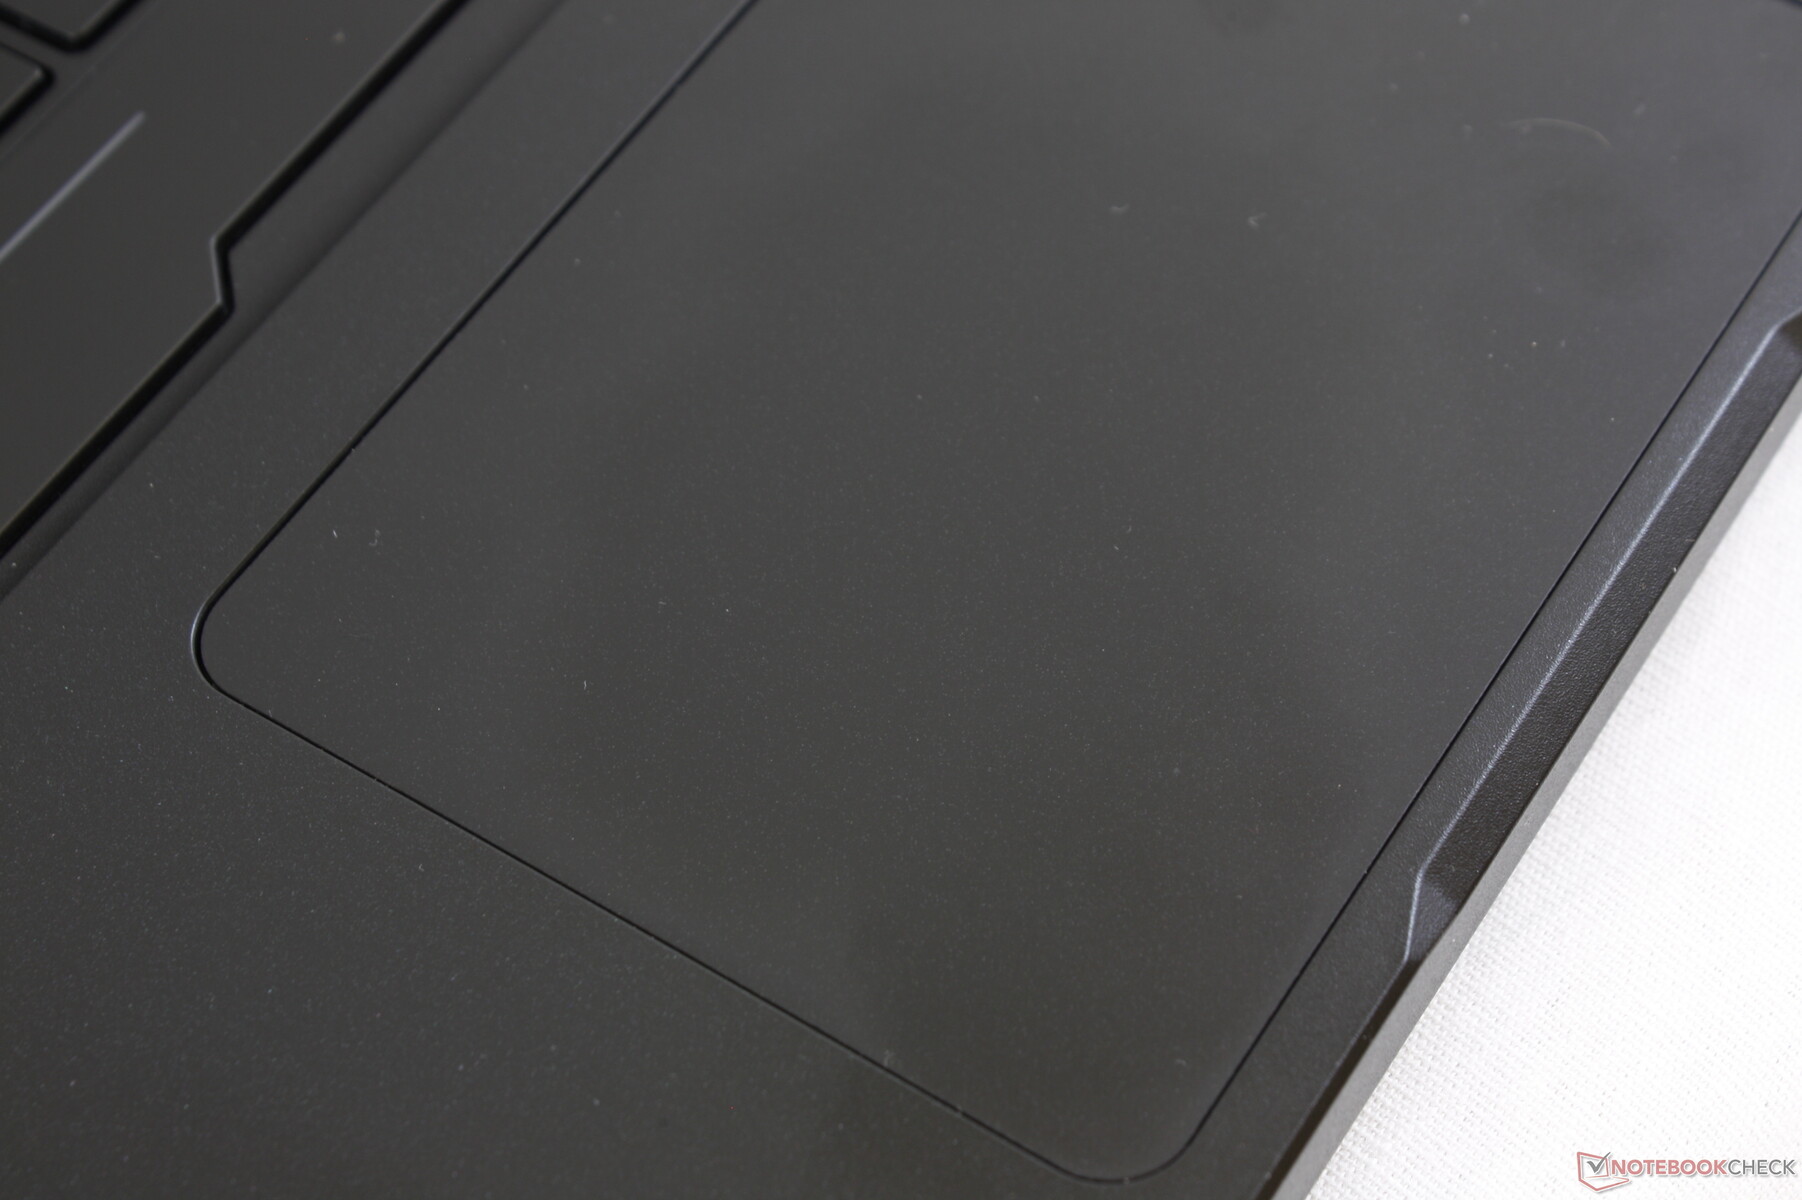
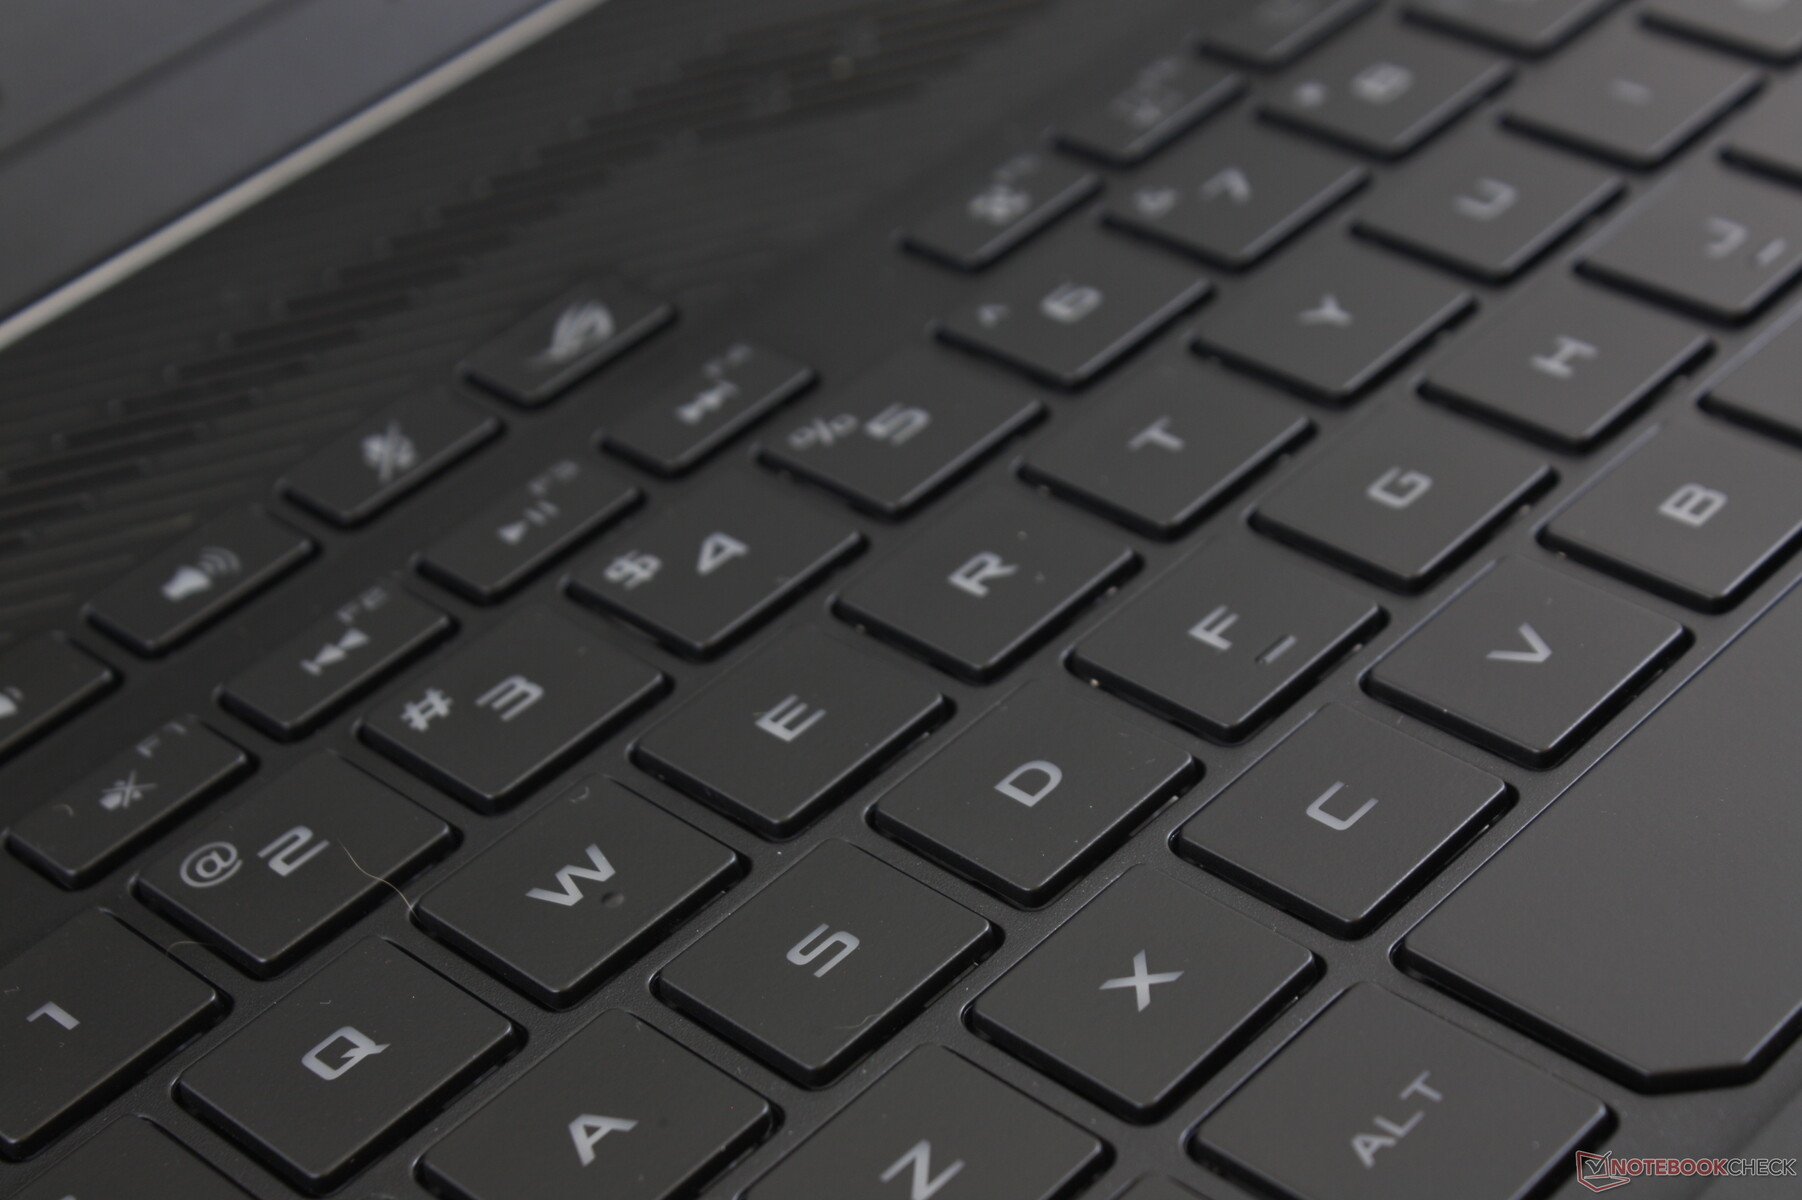
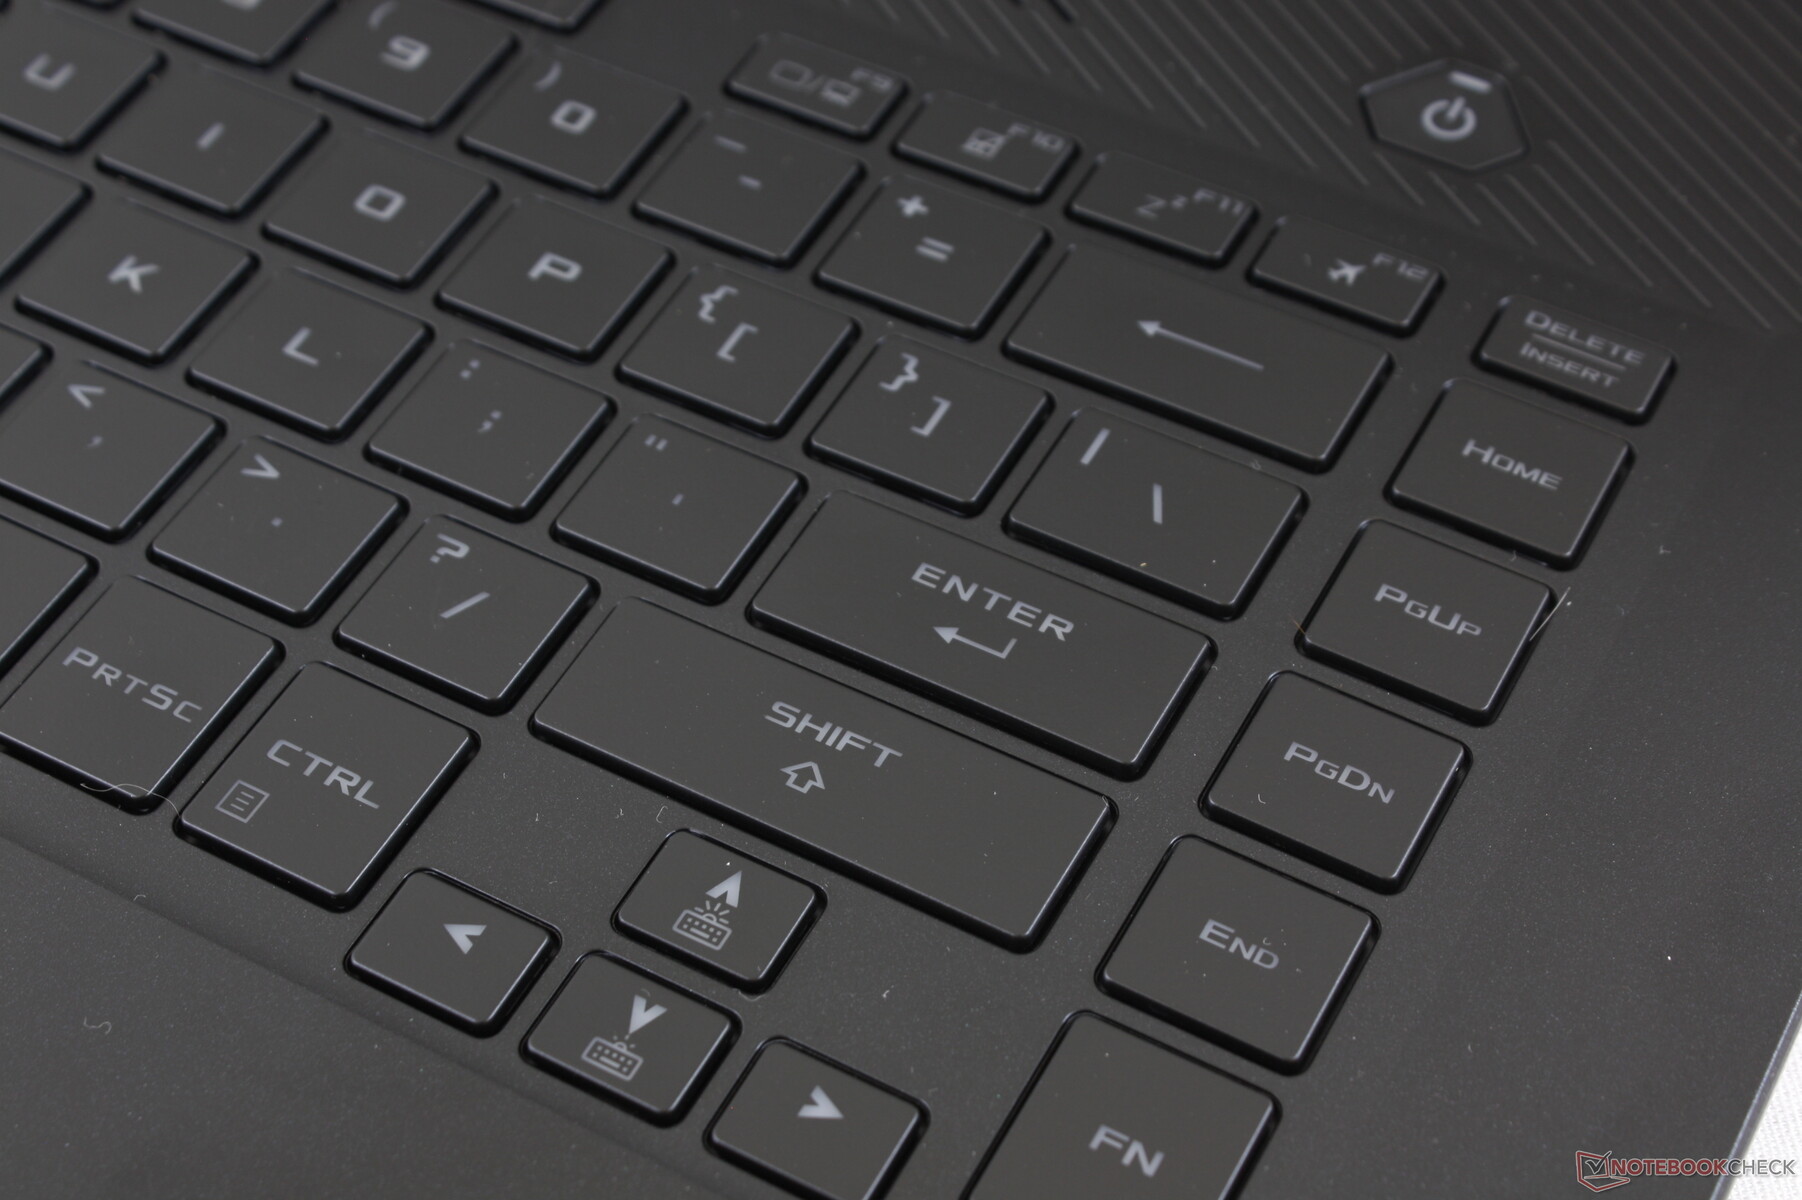
Giriş cihazları
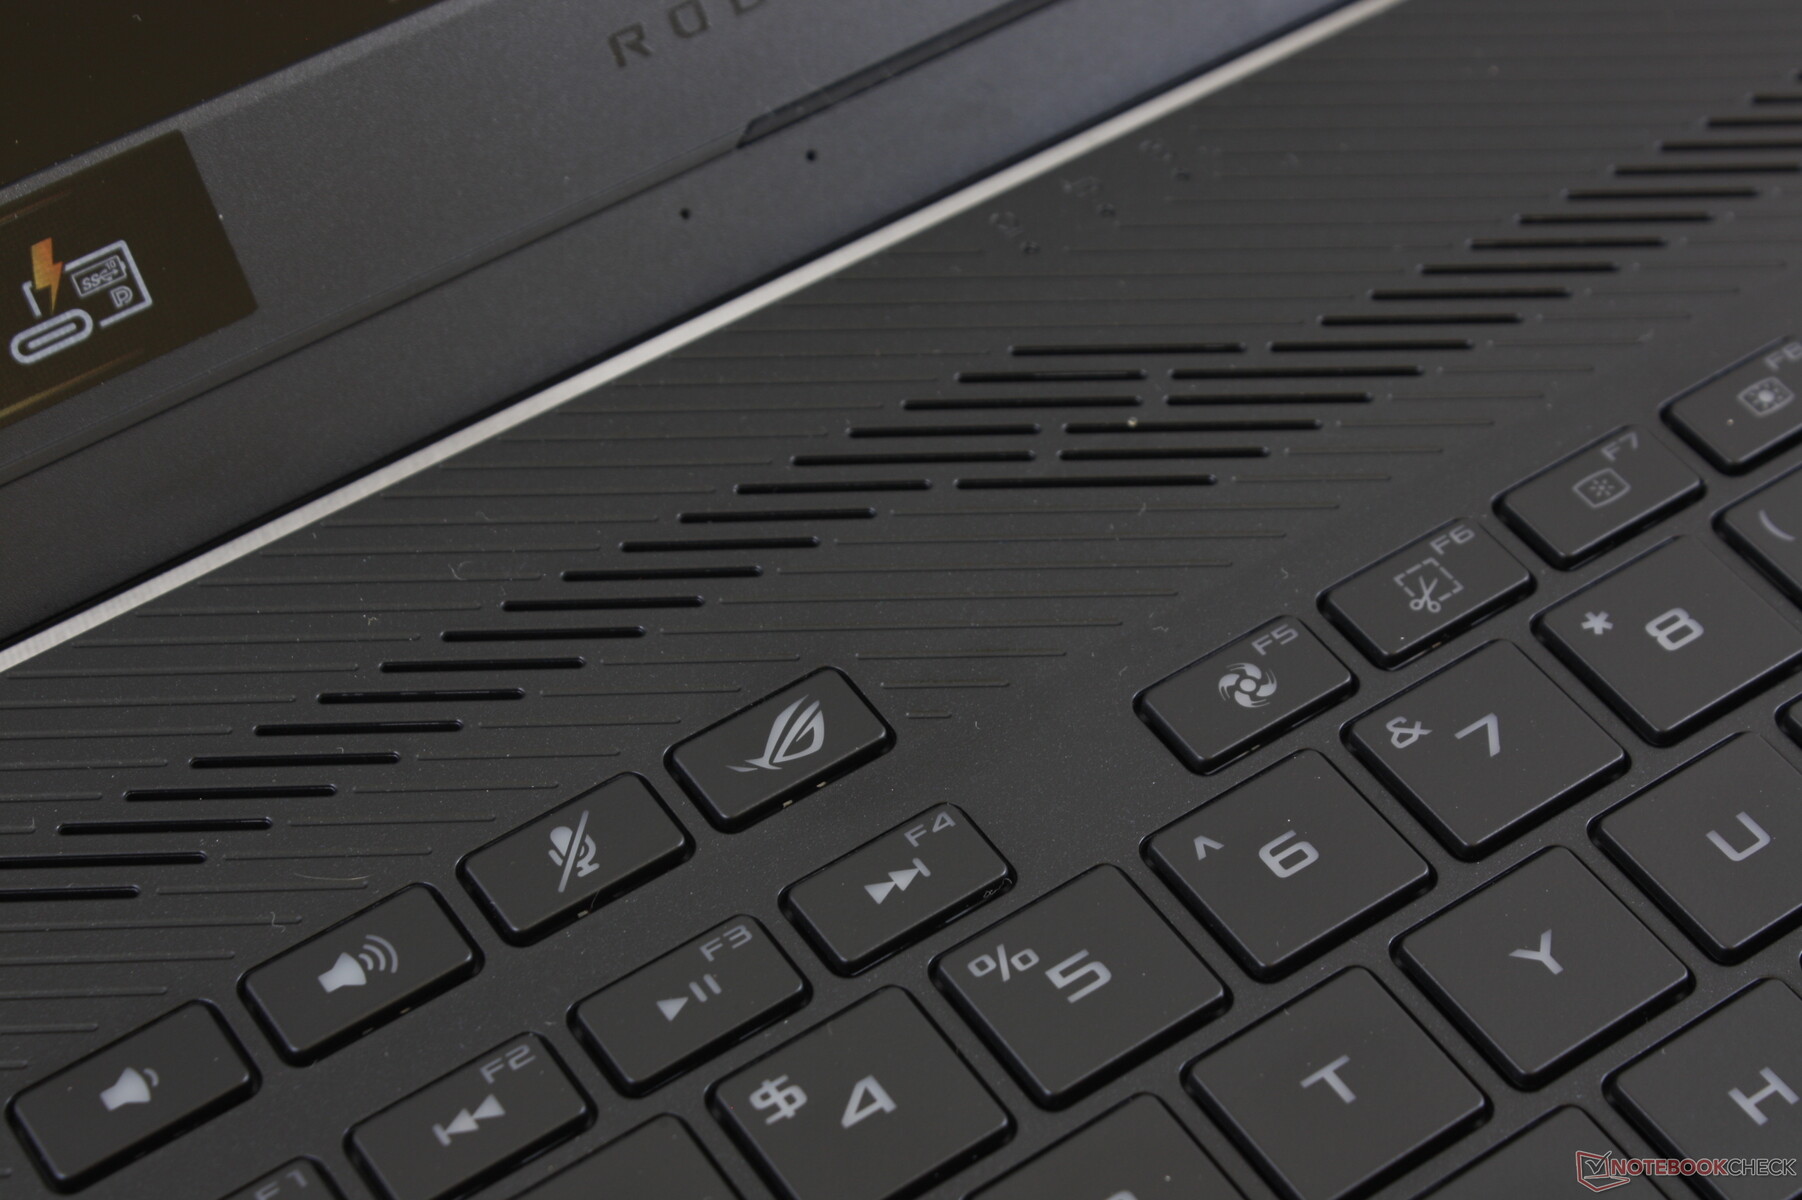
Klavye ve Dokunmatik Yüzey GA502DU'da klavye ve tıklama paneli hayranı değildik ve bu nedenle GA502IU'da bunların değişmemiş olduğunu görmek hayal kırıklığı yaratıyor. Geri bildirim, MSI SteelSeries klavyelere göre daha süngerimsi ve daha sığ bir hareketle kalırken, koyu gri yazı tipi koyu tuş başlıklarıyla zayıf bir kontrast oluşturuyor. Bununla birlikte, üstteki yararlı yardımcı tuşlar satırını ve sağ kenardaki ekstra anahtar sütunu gibi yapıyoruz. Ancak genel yazım için, bir ZenBook sizi daha iyi yapacaktır. Precision tıklama paneli (10,5 x 7,5 cm) boyunca kaymak, daha düşük hızlarda kayarken yapışma eğilimindeyken orta ila yüksek hızlarda pürüzsüzdür. Entegre fare tuşları, zayıf ve süngerimsi geribildirim nedeniyle basmaktan tatmin edici değil.
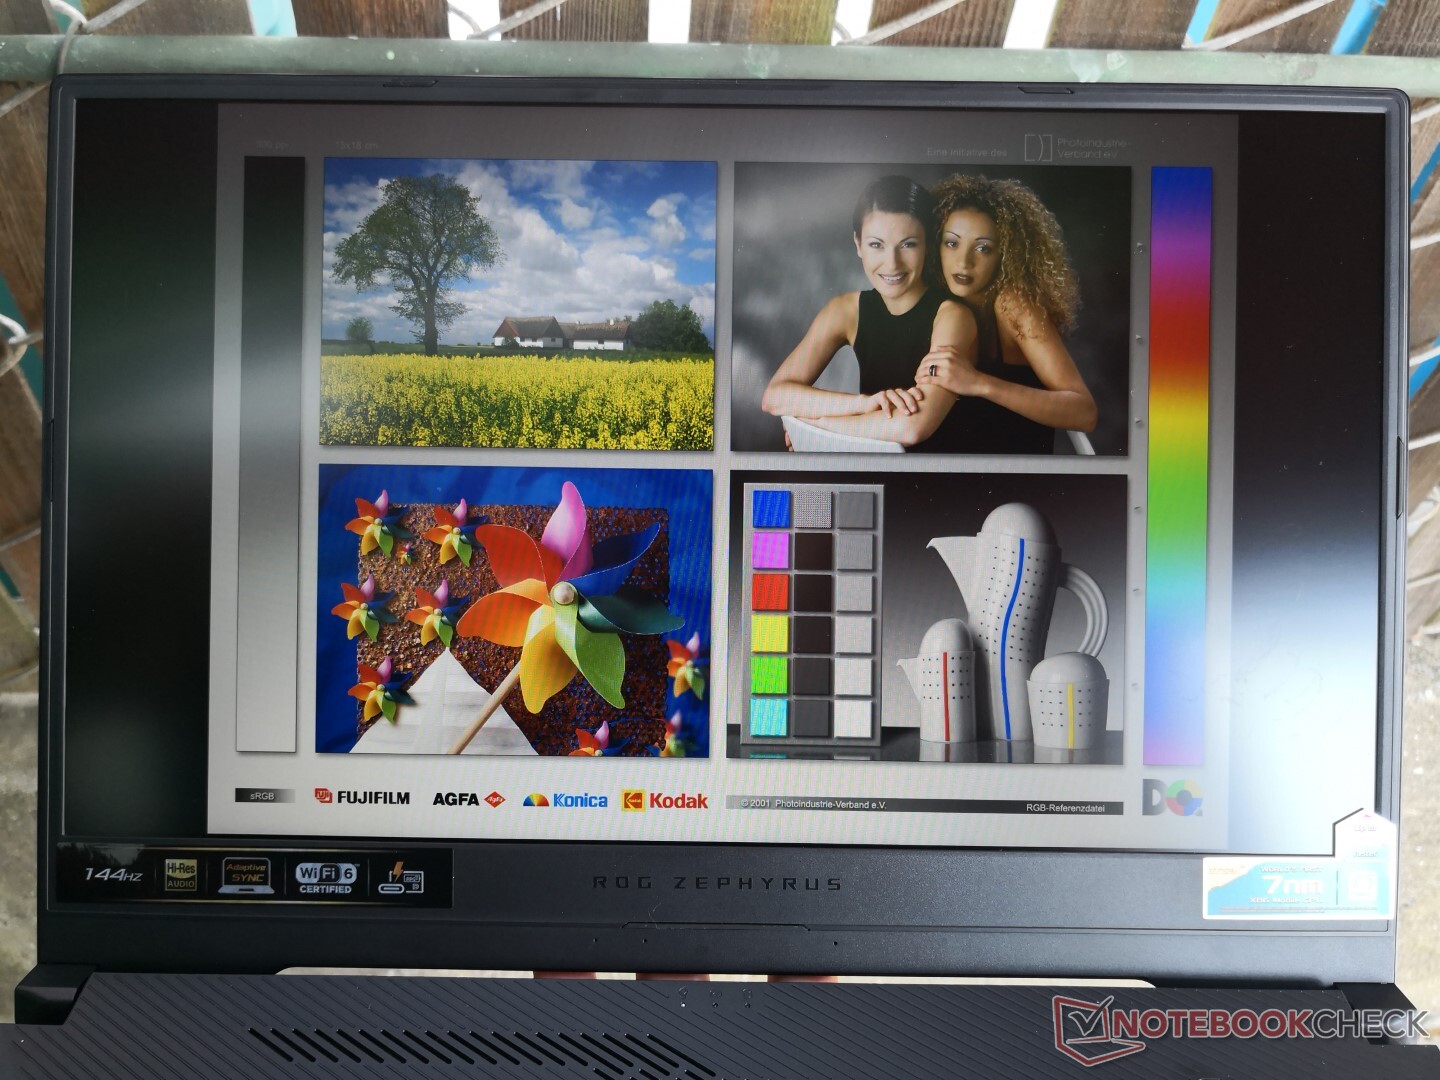
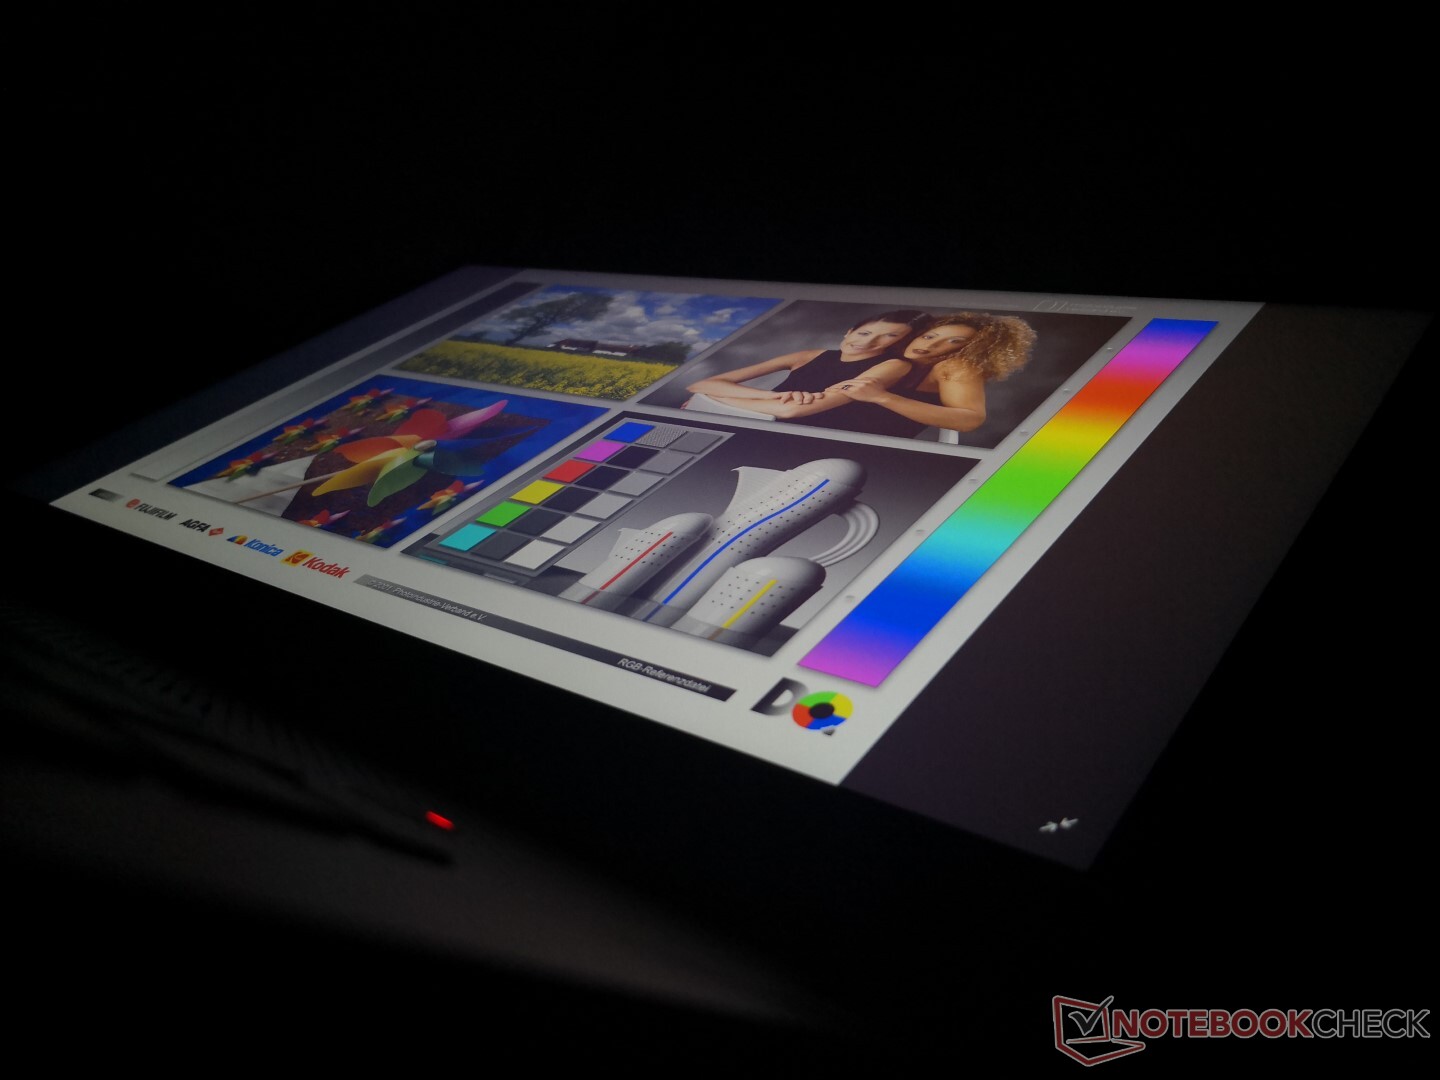
Görüntüle
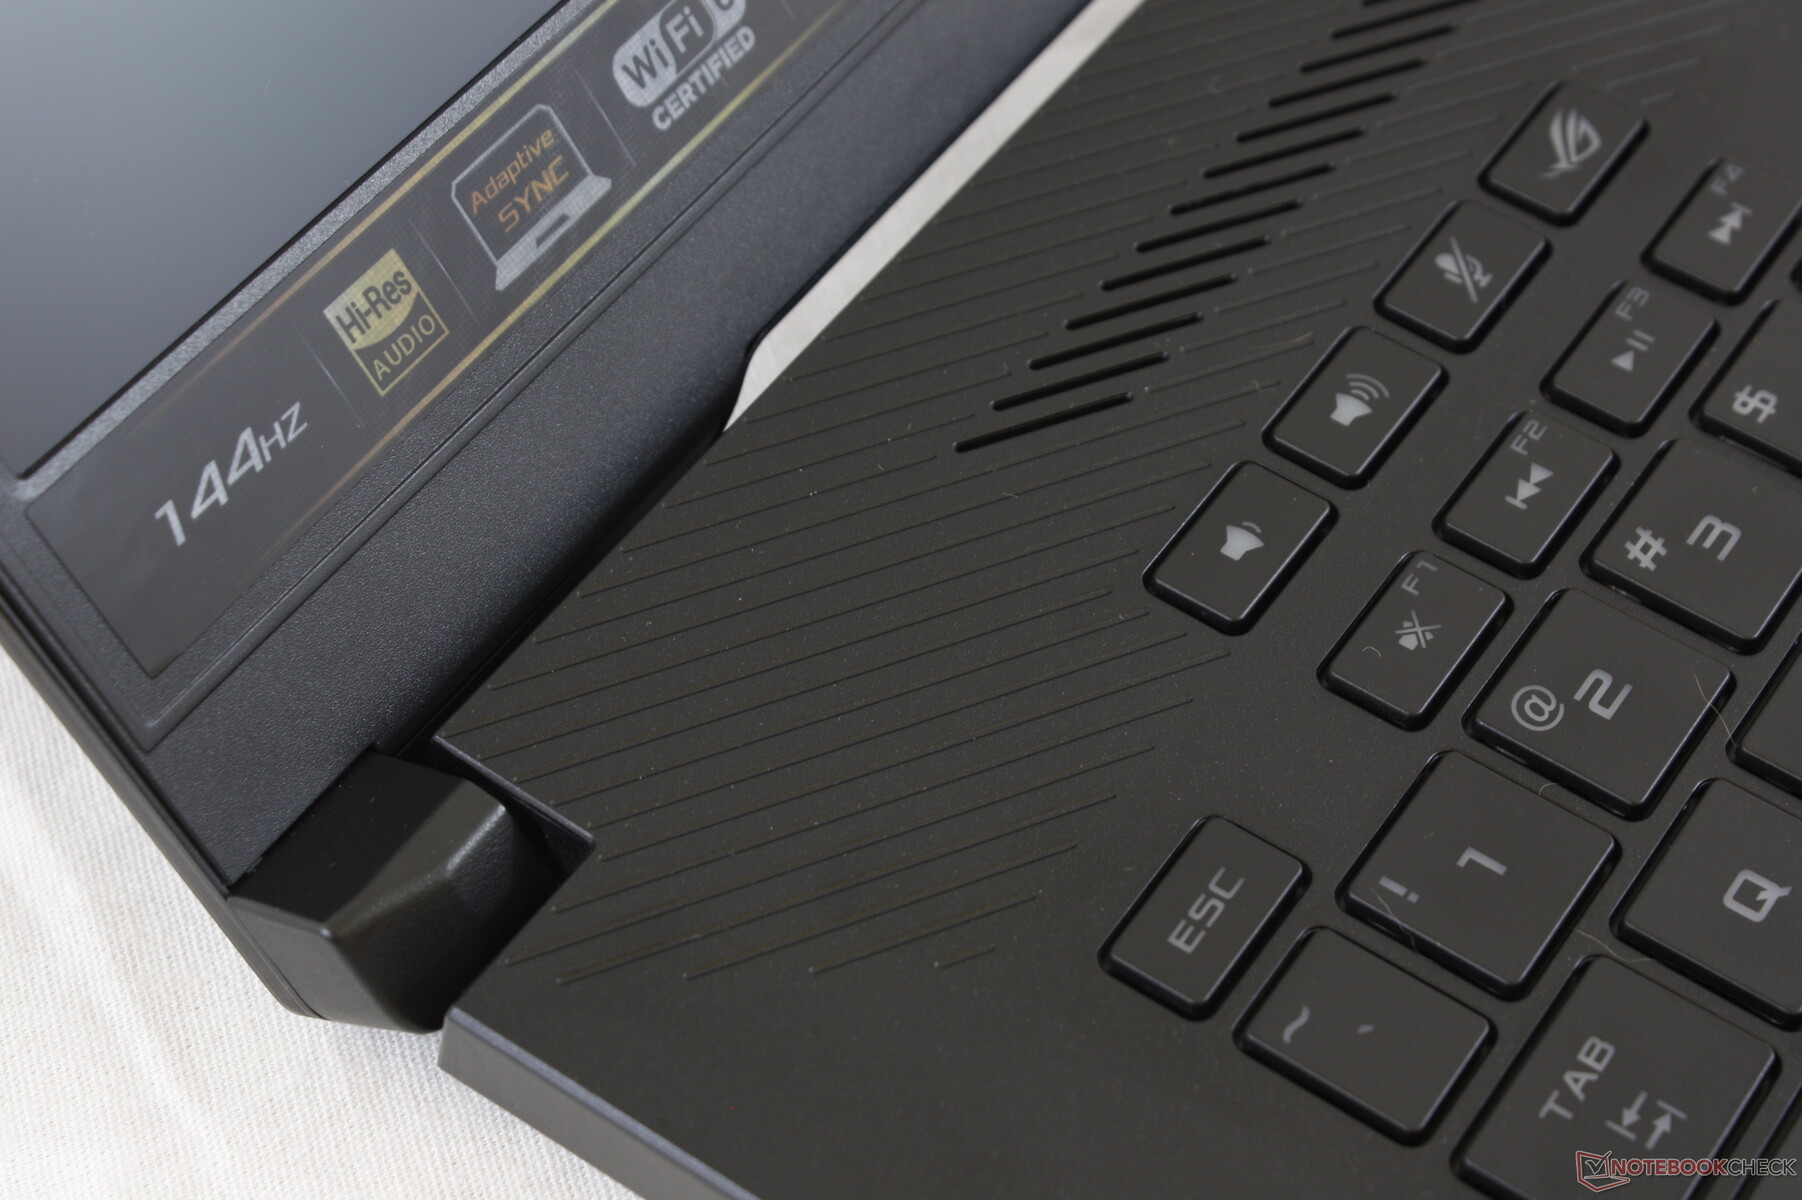
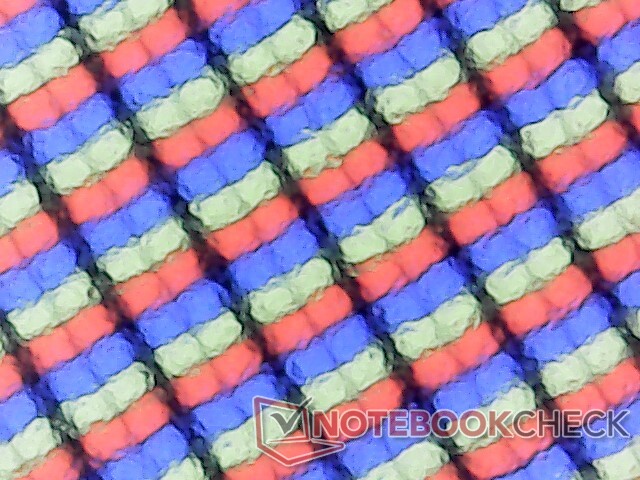
Geçen yılki GA502DU ile ilgili temel eleştirilerimizden biri ortalama 60 Hz ekranıydı. Asus, bu yıl için hem 60 Hz hem de 120 Hz seçeneklerini düşürerek 144 Hz ve 240 Hz'yi yeni standartlar haline getirdi. Ne yazık ki, 144 Hz panel, sırasıyla daha sığ renkler ve daha belirgin gölgelenme için diğer 144 Hz panellerin çoğundan hem belirgin şekilde daha yavaş yanıt sürelerine hem de daha dar bir renk alanına sahiptir. Bunun nedeni, GA502IU'nun, AU Optronics veya Sharp'ın üstün panelleri yerine hala Panda kaynaklı IPS panelleri kullanmasıdır. 240 Hz seçeneği, Asus'un hem 3 ms yanıt süreleri hem de yüzde 100 sRGB vaat ettiği için 144 Hz panelin ana sorunlarına değiniyor. kapsama, 144 Hz ünitemizde sırasıyla 15 ms ve yüzde 58 kapsama ile karşılaştırıldı. Aşağıdaki sonuçlarımız yalnızca 144 Hz panel seçeneğini yansıtmaktadır.
| |||||||||||||||||||||||||
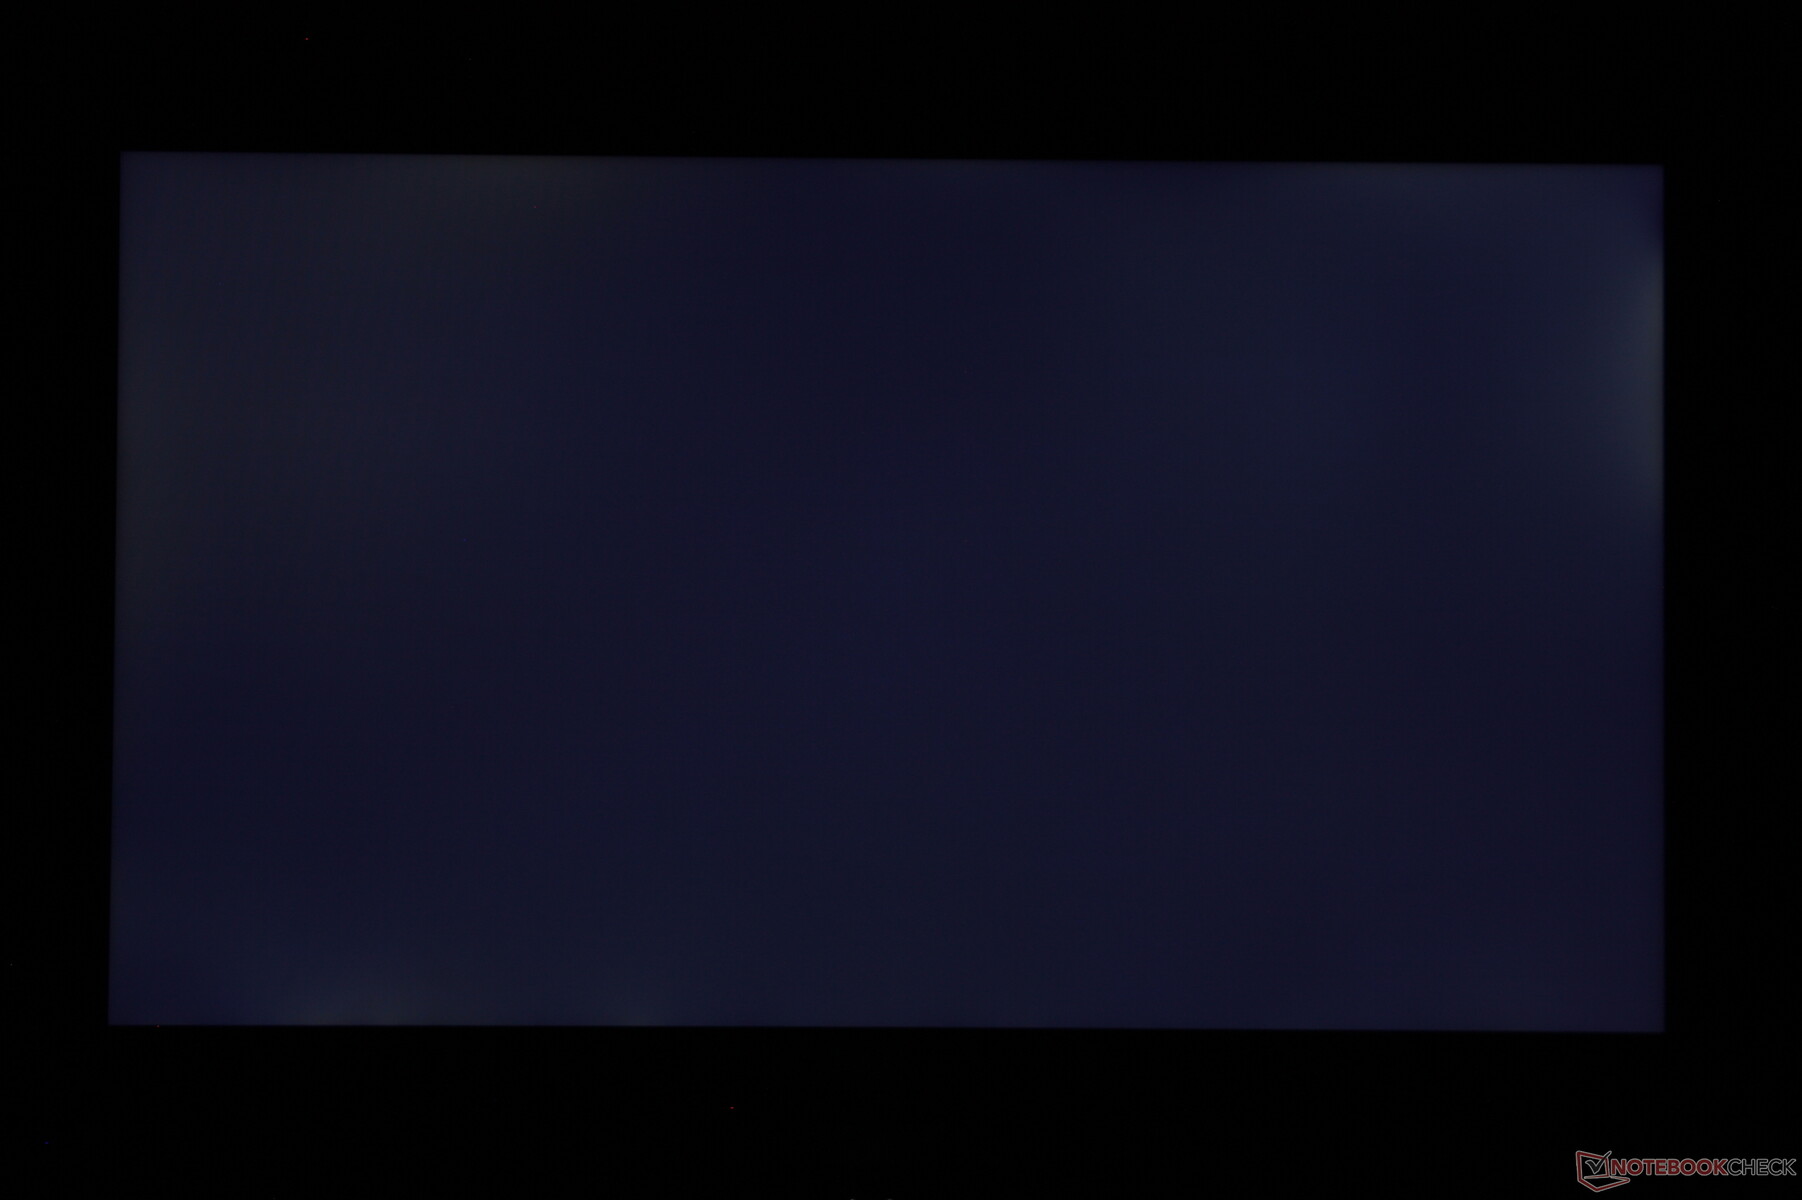
Aydınlatma: 89 %
Batarya modunda parlaklık: 255.9 cd/m²
Kontrast: 1163:1 (Siyah: 0.22 cd/m²)
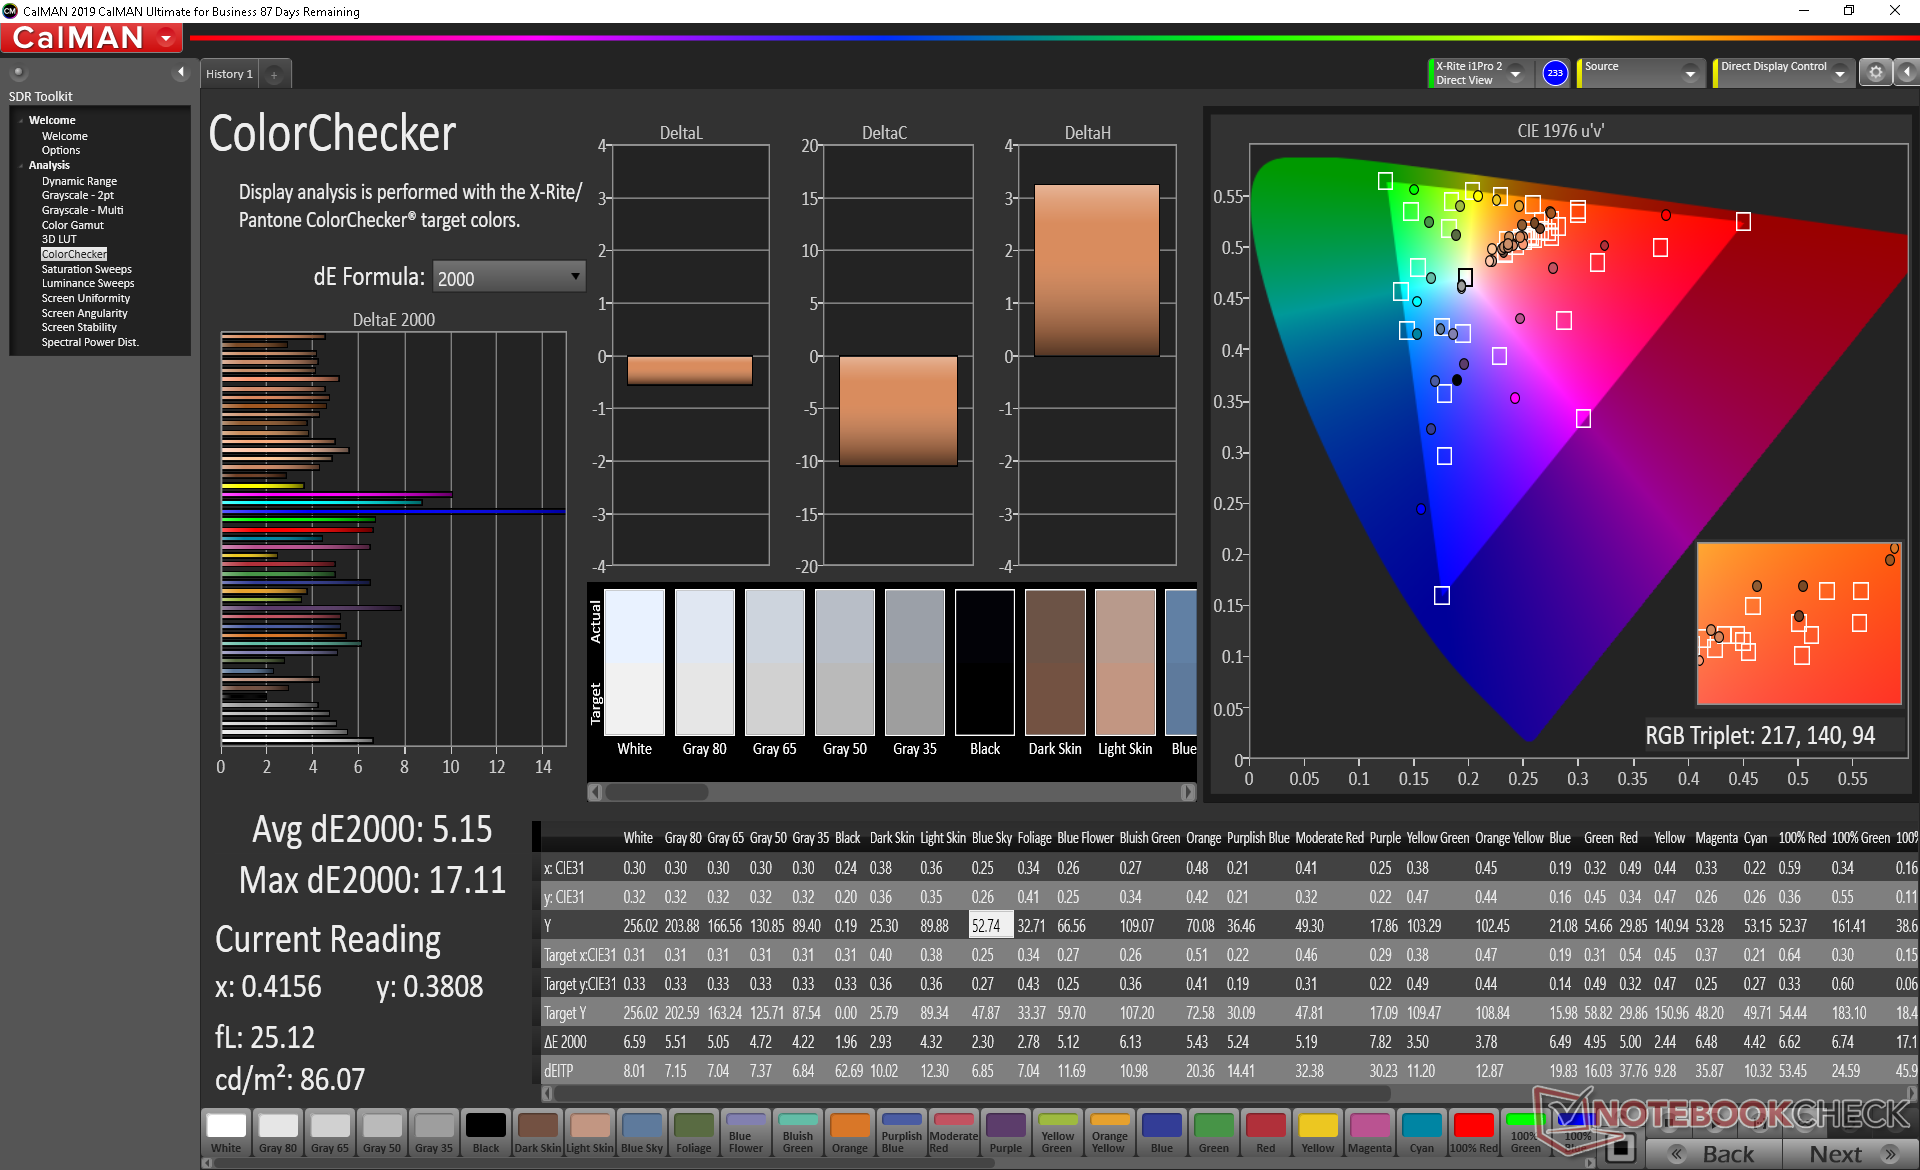
ΔE ColorChecker Calman: 5.15 | ∀{0.5-29.43 Ø4.72}
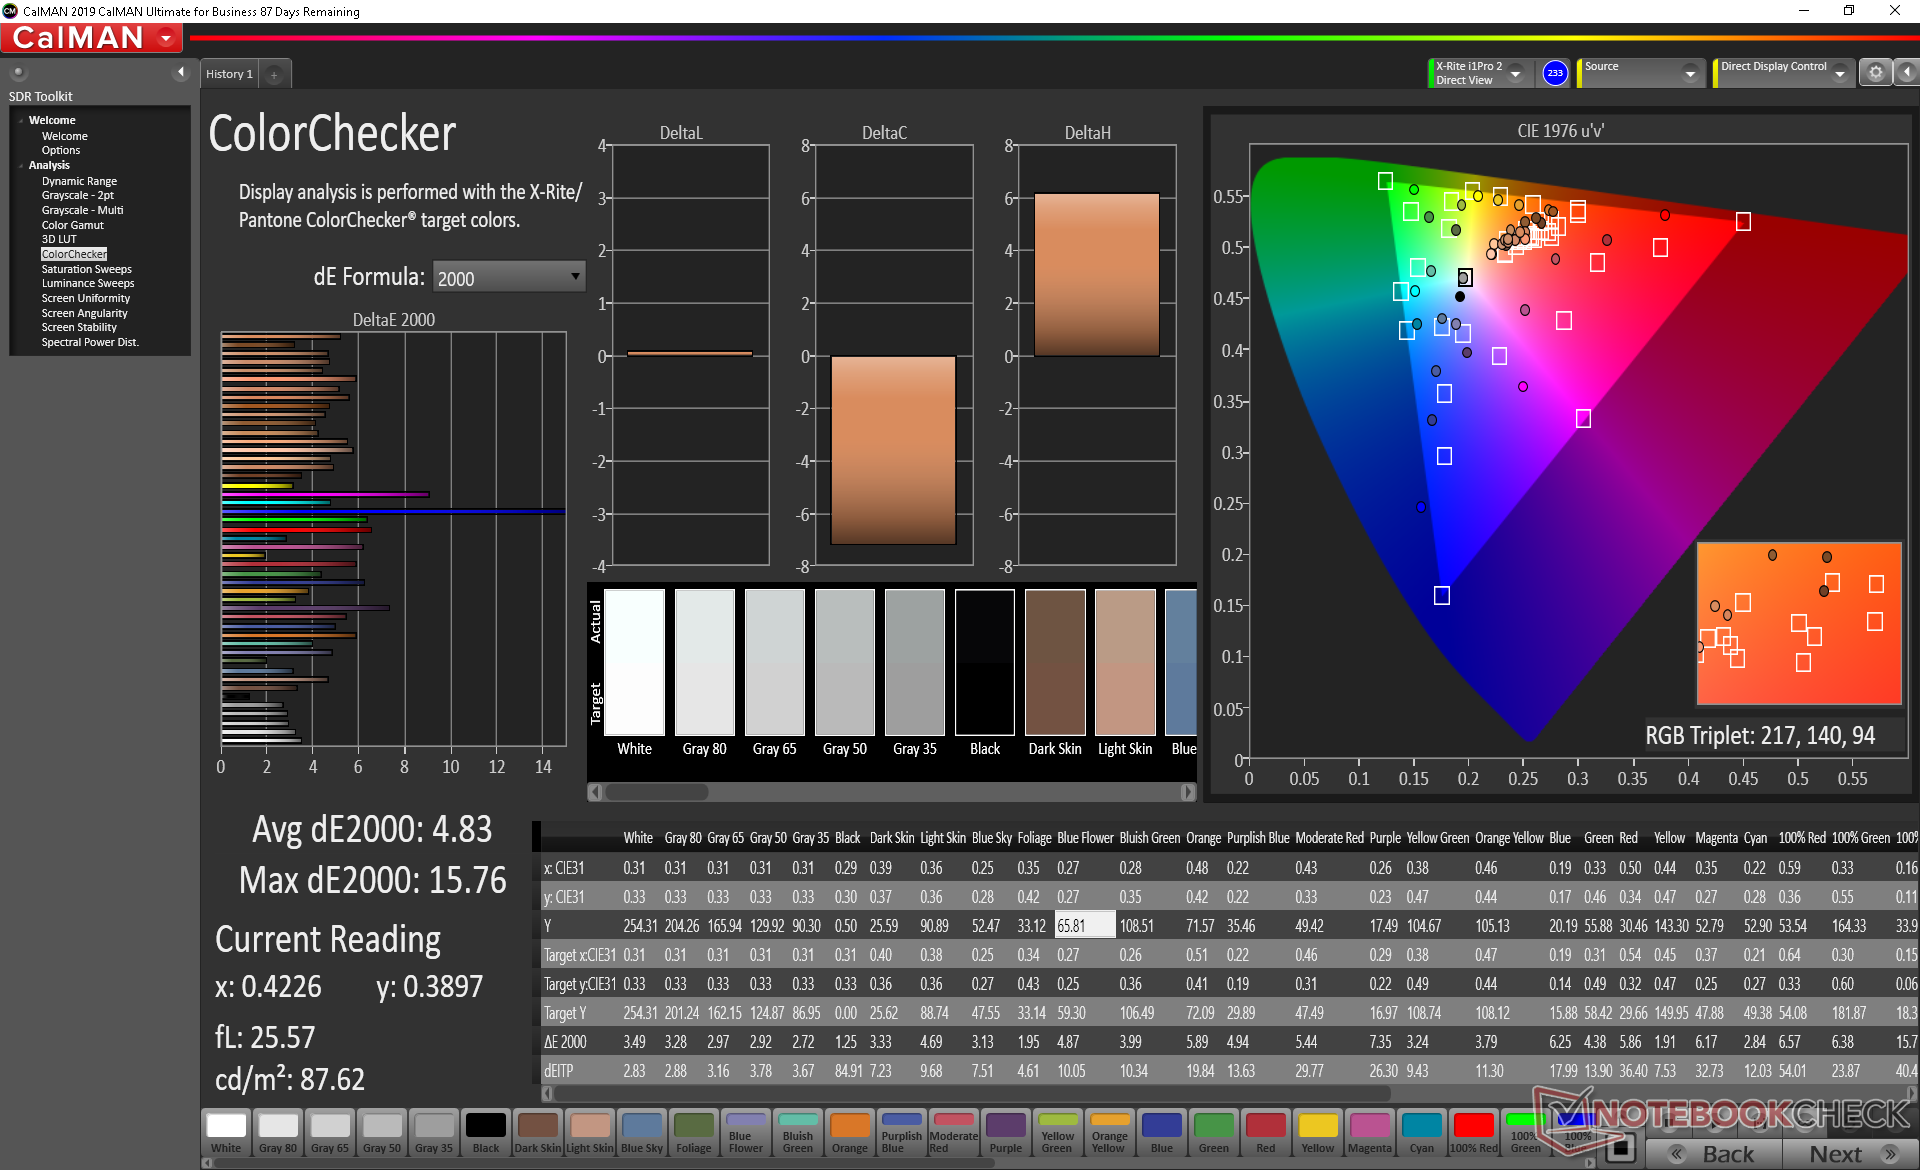
calibrated: 4.83
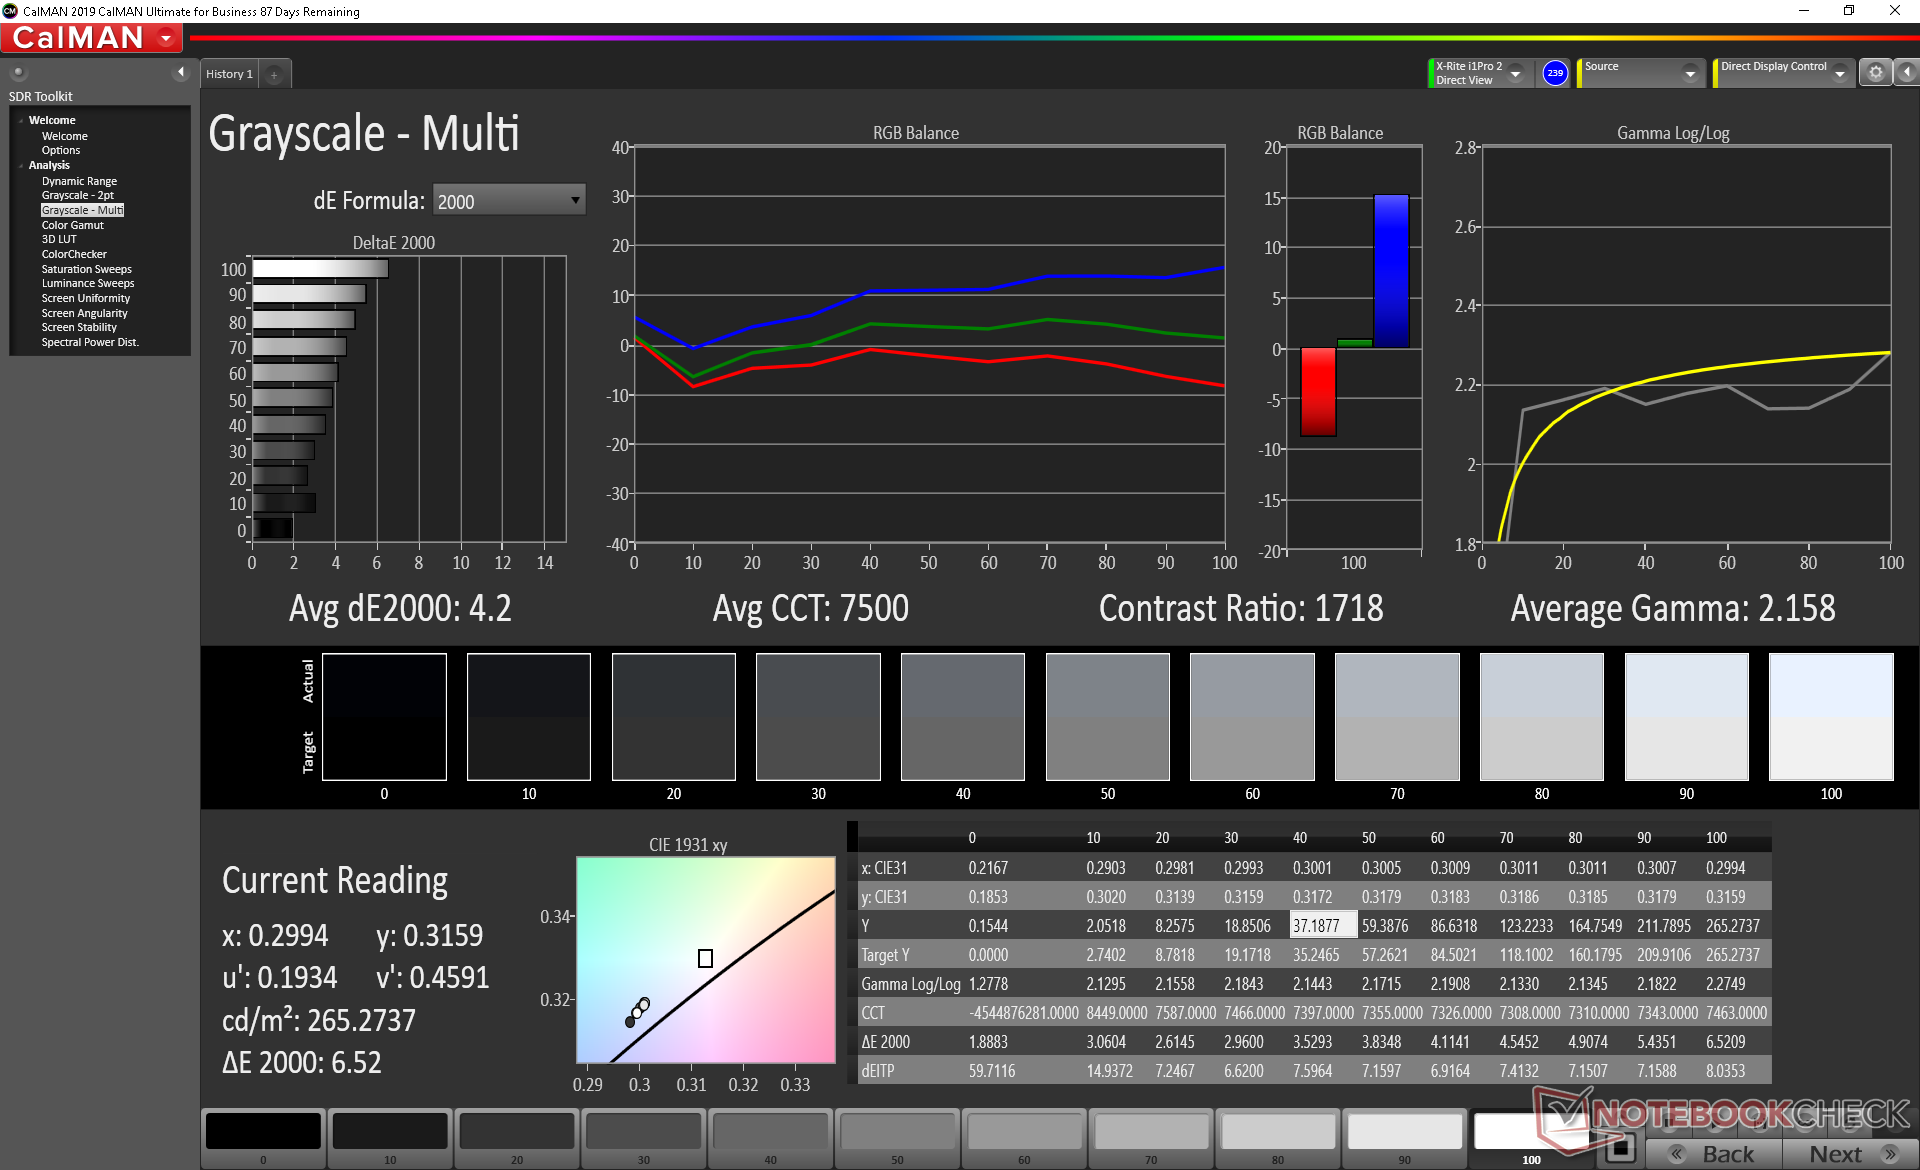
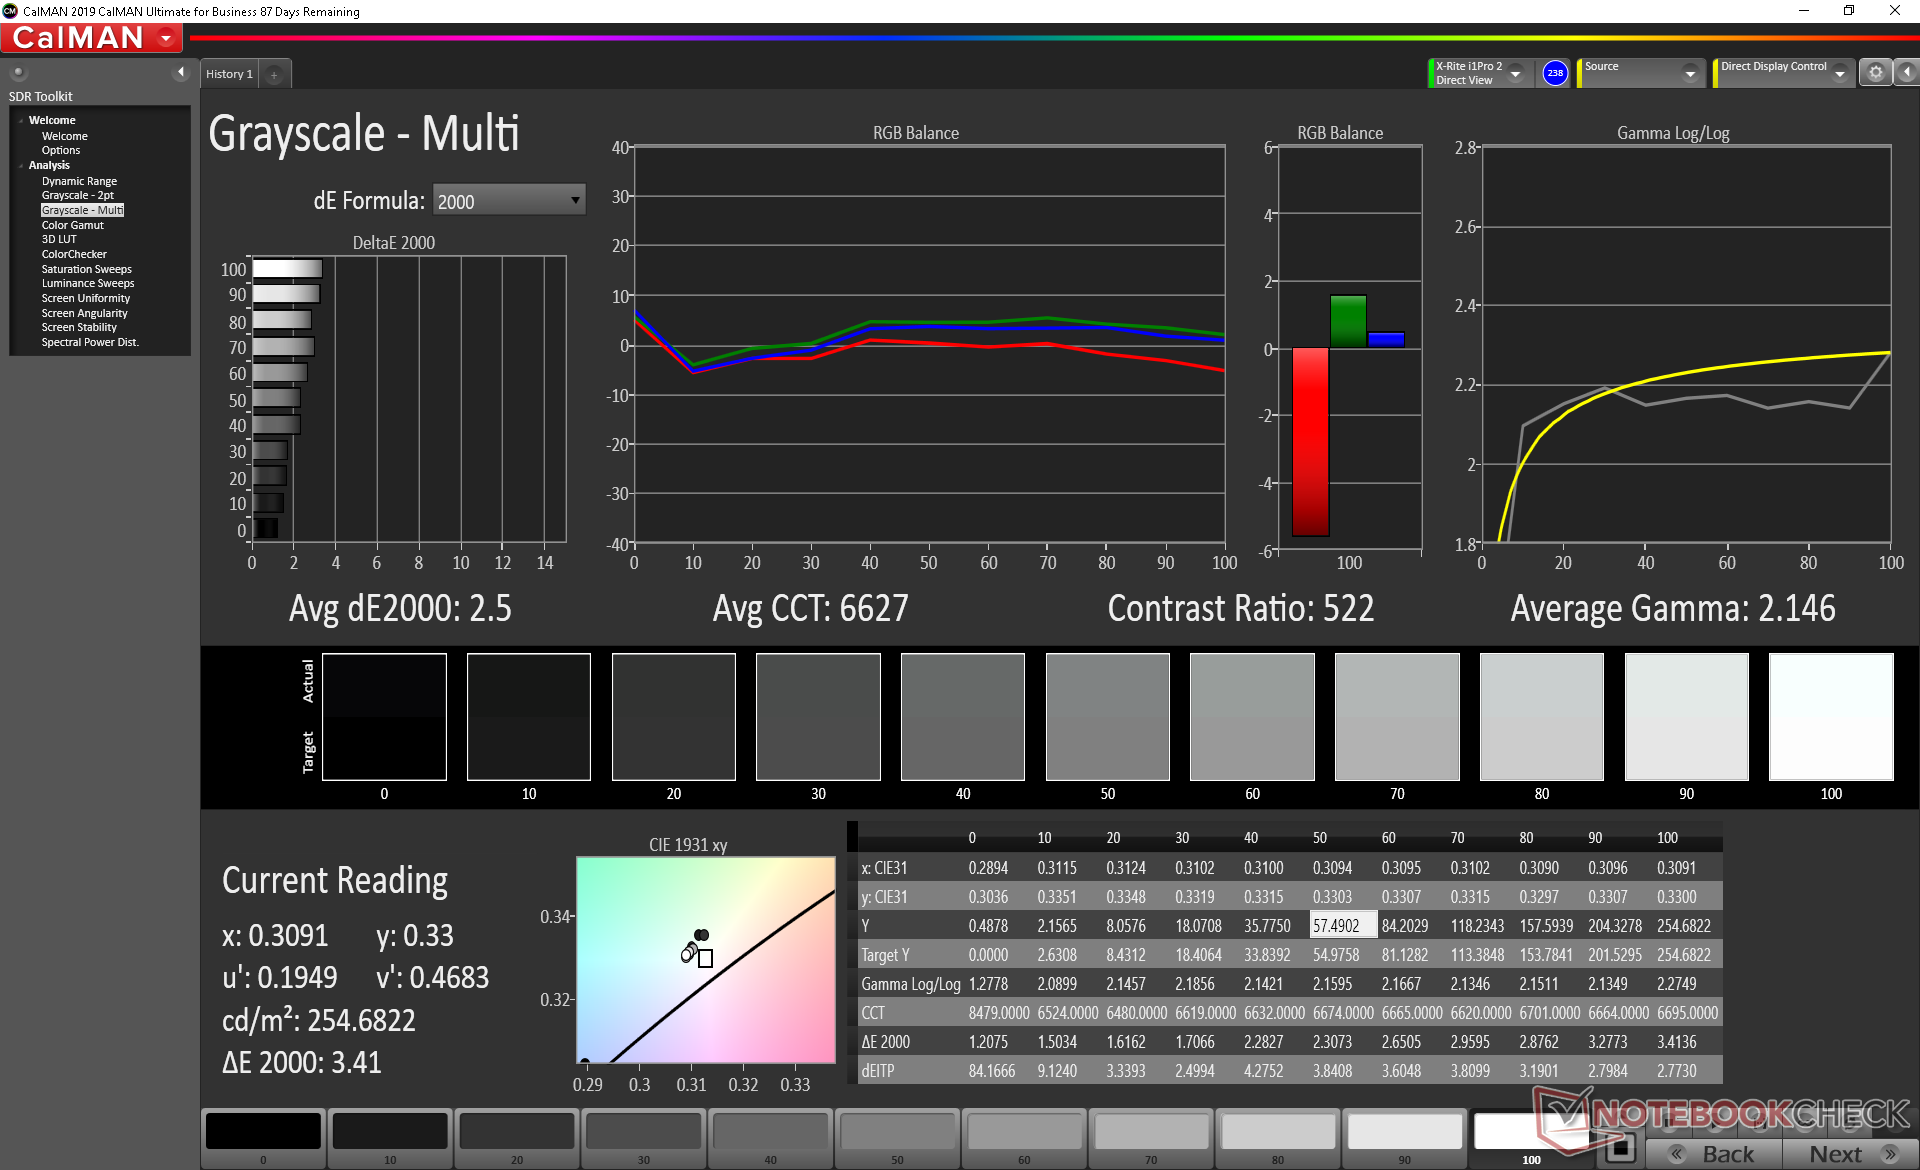
ΔE Greyscale Calman: 4.2 | ∀{0.09-98 Ø4.97}
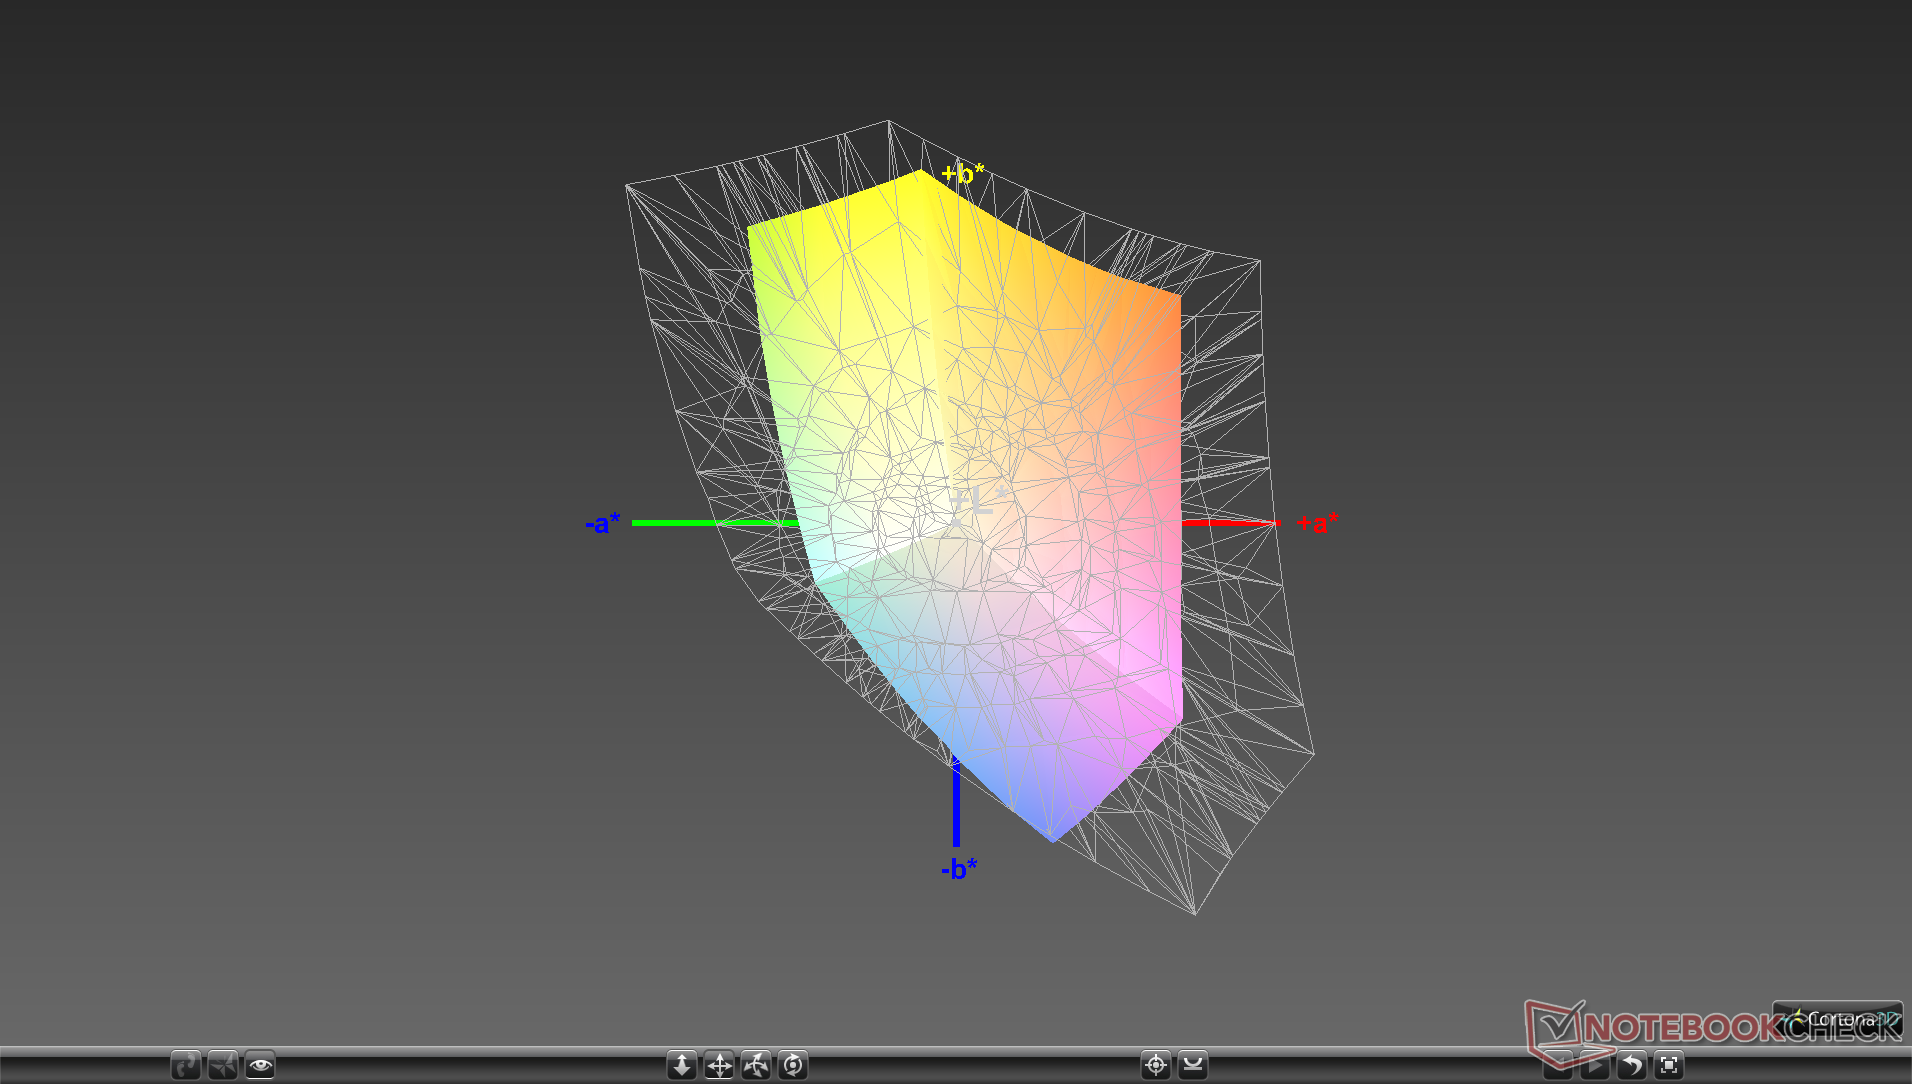
58% sRGB (Argyll 1.6.3 3D)
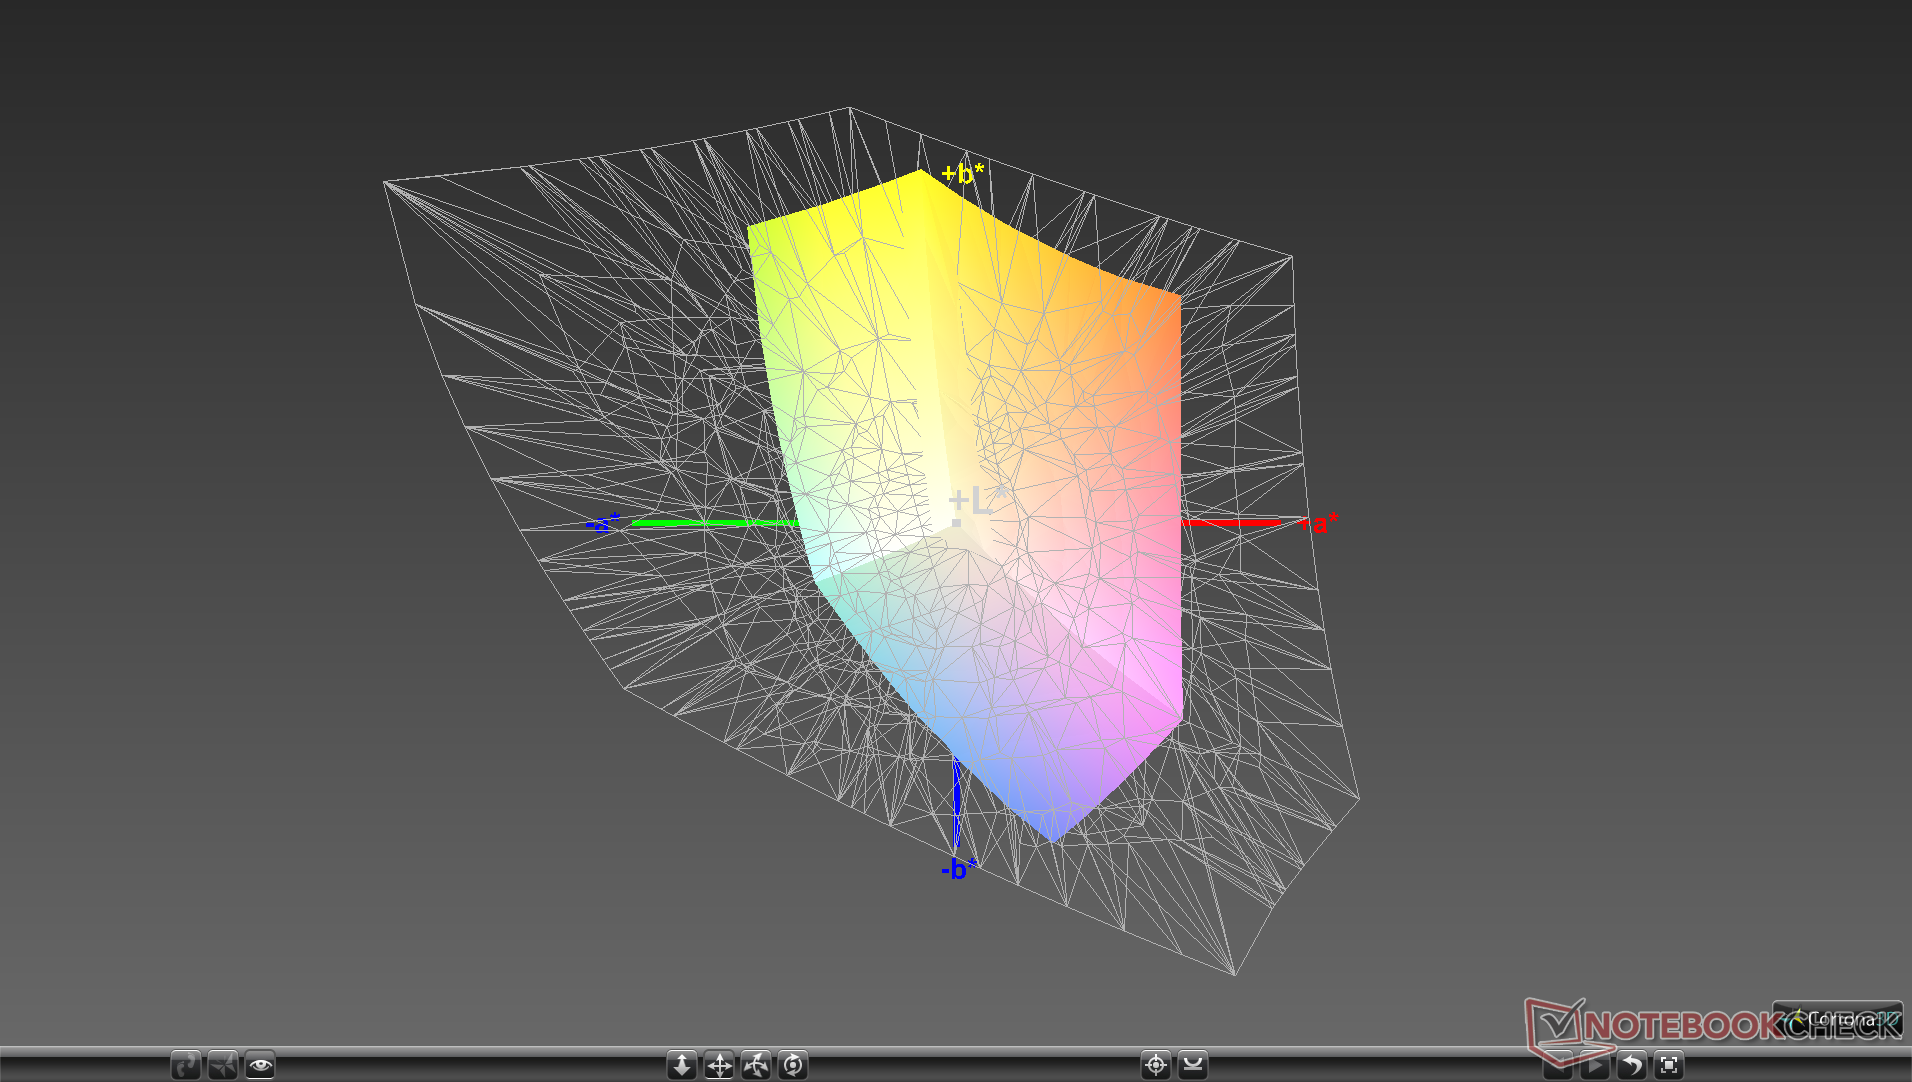
36.9% AdobeRGB 1998 (Argyll 1.6.3 3D)
40.22% AdobeRGB 1998 (Argyll 3D)
58.5% sRGB (Argyll 3D)
38.9% Display P3 (Argyll 3D)
Gamma: 2.16
CCT: 7500 K
| Asus ROG Zephyrus G15 GA502IU-ES76 Panda LM156LF-2F01, IPS, 15.6", 1920x1080 | Asus ROG Zephyrus Duo 15 GX550LXS AU Optronics B156ZAN03.1, IPS, 15.6", 3840x2160 | Asus ROG Zephyrus G15 GA502DU Panda LM156LF-CL03, IPS, 15.6", 1920x1080 | Razer Blade 15 RTX 2070 Super Max-Q AU Optronics B156HAN12.0, IPS, 15.6", 1920x1080 | Lenovo Legion 5 15IMH05H BOE CQ NV156FHM-NX1, IPS, 15.6", 1920x1080 | MSI GS66 Stealth 10SE-045 Sharp LQ156M1JW03, IPS, 15.6", 1920x1080 | Eluktronics RP-15 BOE NV156FHM-N4G, IPS, 15.6", 1920x1080 | |
|---|---|---|---|---|---|---|---|
| Display | 114% | 4% | 74% | -0% | 71% | 61% | |
| Display P3 Coverage (%) | 38.9 | 87 124% | 40.33 4% | 69.4 78% | 38.8 0% | 67.5 74% | 63.7 64% |
| sRGB Coverage (%) | 58.5 | 100 71% | 60.6 4% | 98.8 69% | 57.8 -1% | 98.3 68% | 92 57% |
| AdobeRGB 1998 Coverage (%) | 40.22 | 99.9 148% | 41.69 4% | 70.5 75% | 40.09 0% | 68.9 71% | 65.2 62% |
| Response Times | -63% | -24% | 78% | 14% | 55% | 45% | |
| Response Time Grey 50% / Grey 80% * (ms) | 24.4 ? | 56.4 ? -131% | 34 ? -39% | 3.2 ? 87% | 26 ? -7% | 12 ? 51% | 17.2 ? 30% |
| Response Time Black / White * (ms) | 25.6 ? | 24.4 ? 5% | 28 ? -9% | 8 ? 69% | 17 ? 34% | 10.4 ? 59% | 10.4 ? 59% |
| PWM Frequency (Hz) | 21280 ? | 23580 ? | |||||
| Screen | 57% | -4% | 30% | 6% | 28% | 13% | |
| Brightness middle (cd/m²) | 255.9 | 398 56% | 240.1 -6% | 345.4 35% | 301 18% | 272 6% | 298.6 17% |
| Brightness (cd/m²) | 246 | 385 57% | 231 -6% | 342 39% | 277 13% | 259 5% | 289 17% |
| Brightness Distribution (%) | 89 | 90 1% | 85 -4% | 90 1% | 77 -13% | 91 2% | 90 1% |
| Black Level * (cd/m²) | 0.22 | 0.28 -27% | 0.34 -55% | 0.34 -55% | 0.26 -18% | 0.27 -23% | 0.35 -59% |
| Contrast (:1) | 1163 | 1421 22% | 706 -39% | 1016 -13% | 1158 0% | 1007 -13% | 853 -27% |
| Colorchecker dE 2000 * | 5.15 | 1.53 70% | 4.2 18% | 3.18 38% | 5.12 1% | 2.42 53% | 5.01 3% |
| Colorchecker dE 2000 max. * | 17.11 | 3.69 78% | 17.8 -4% | 6.57 62% | 8.86 48% | 6.93 59% | 7.06 59% |
| Colorchecker dE 2000 calibrated * | 4.83 | 0.77 84% | 4.09 15% | 1.77 63% | 4.88 -1% | 0.88 82% | 2.52 48% |
| Greyscale dE 2000 * | 4.2 | 2.4 43% | 2.8 33% | 3.8 10% | 3.47 17% | 4.5 -7% | 5.4 -29% |
| Gamma | 2.16 102% | 2.19 100% | 2.2 100% | 2.15 102% | 2.37 93% | 2.188 101% | 2.54 87% |
| CCT | 7500 87% | 6996 93% | 6925 94% | 7109 91% | 7062 92% | 7369 88% | 7461 87% |
| Color Space (Percent of AdobeRGB 1998) (%) | 36.9 | 100 171% | 38.4 4% | 64.3 74% | 37 0% | 69 87% | 59.1 60% |
| Color Space (Percent of sRGB) (%) | 58 | 100 72% | 60.4 4% | 99 71% | 57 -2% | 91 57% | 91.6 58% |
| Toplam Ortalama (Program / Ayarlar) | 36% /
53% | -8% /
-5% | 61% /
44% | 7% /
6% | 51% /
39% | 40% /
26% |
* ... daha küçük daha iyidir
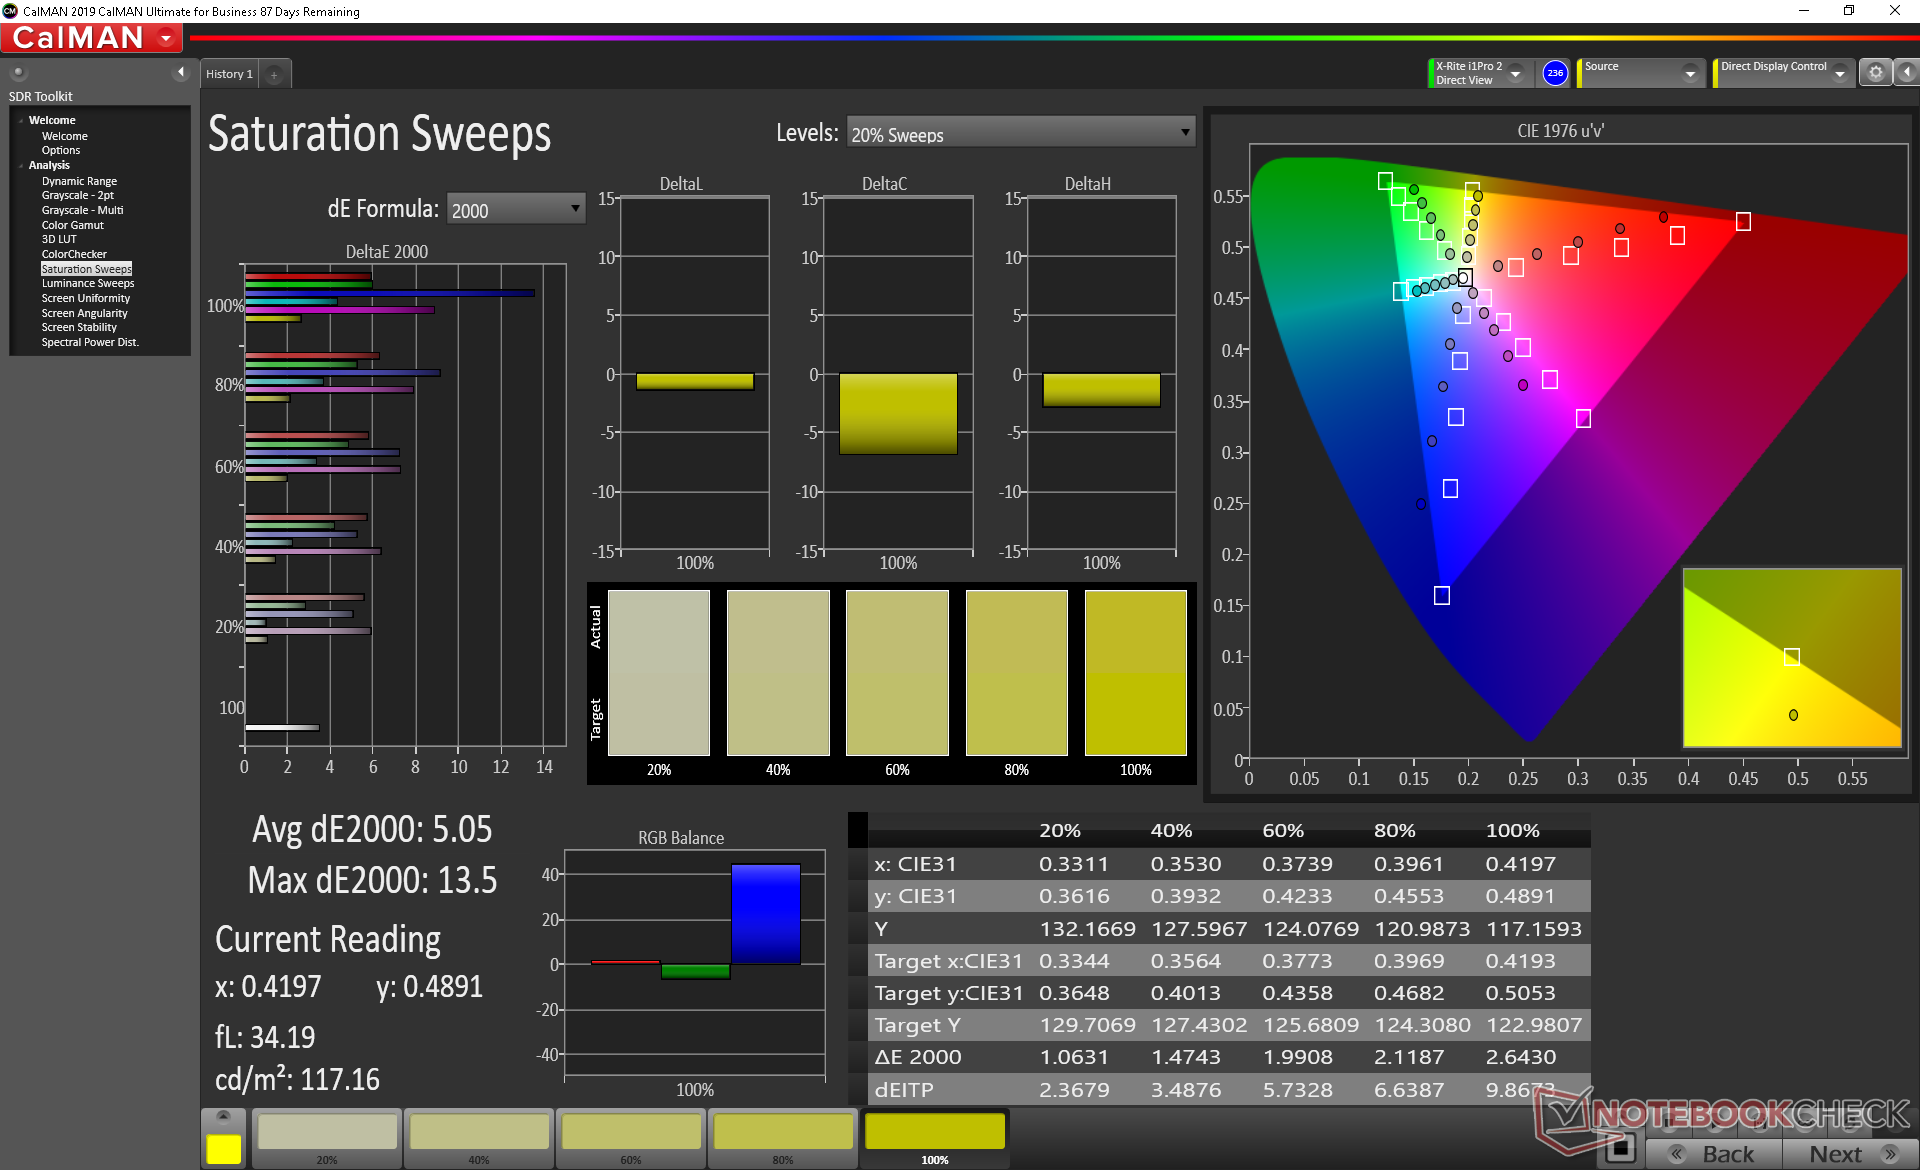
Bir oyun dizüstü bilgisayarı için renk alanı, MSI GS66 veya Razer Blade 15 gibi orta ve üst düzey birçok alternatifte tam sRGB kapsamına kıyasla, sRGB'nin yalnızca yüzde 58'i veya AdobeRGB'nin yüzde 37'si ile dar.
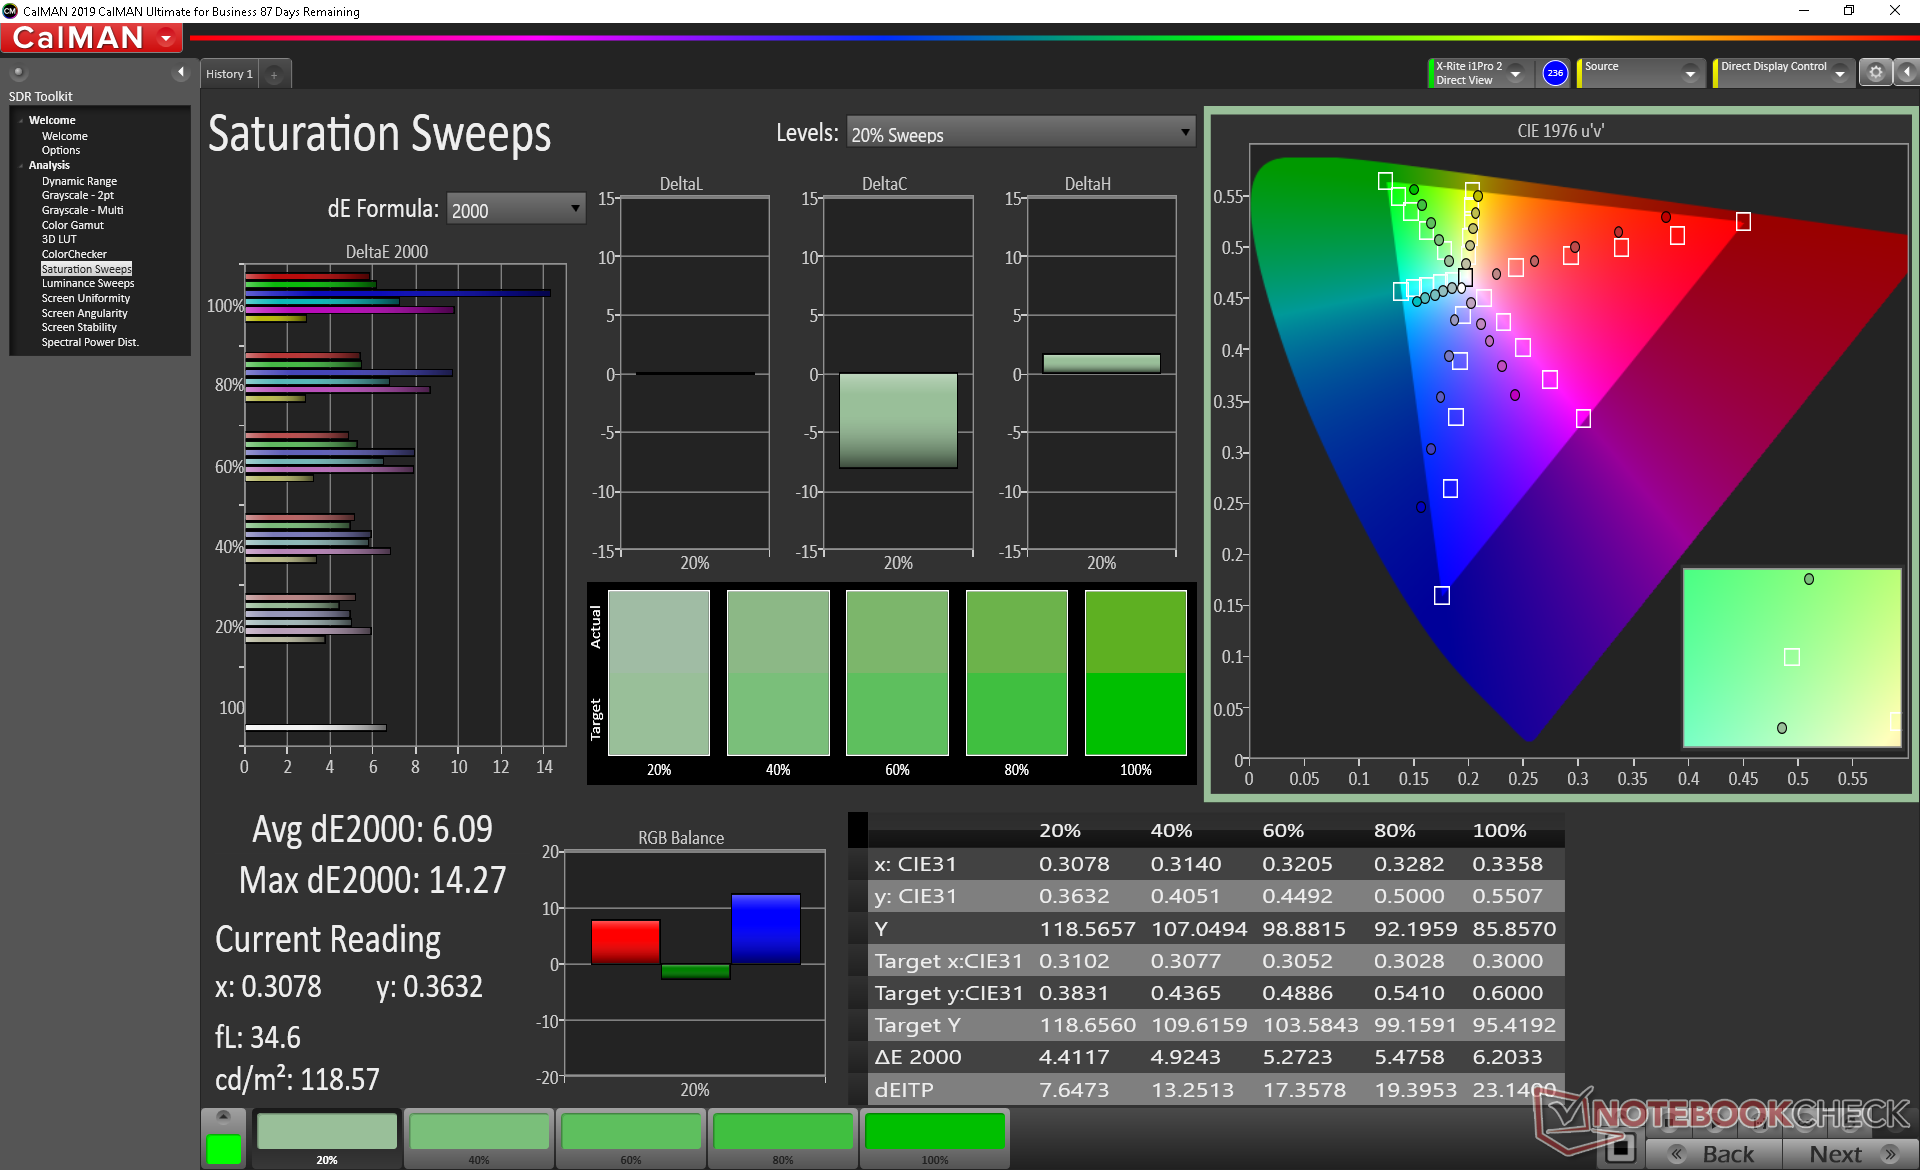
X-Rite ölçümleri, sırasıyla 4,2 ve 5,15 ortalama gri tonlama ve renkli DeltaE değerleri ile kutudan çıkar çıkmaz düzgün bir şekilde kalibre edilmiş bir ekran gösterir. Ancak renk sıcaklığı çok düşük. Ekranı kendimiz kalibre etmek, pano boyunca renkleri ve gri tonlamayı iyileştirir. Yukarıda bahsedilen dar renk alanı nedeniyle renklerin kalibrasyondan sonra bile daha yüksek doygunluk seviyelerinde giderek daha hatalı hale geldiğine dikkat edin.
Yanıt Sürelerini Görüntüle
| ↔ Tepki Süresi Siyahtan Beyaza | ||
|---|---|---|
| 25.6 ms ... yükseliş ↗ ve sonbahar↘ birleşimi | ↗ 15.2 ms yükseliş | 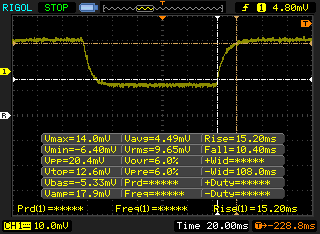 |
| ↘ 10.4 ms sonbahar | ||
| Ekran, testlerimizde nispeten yavaş yanıt oranları gösteriyor ve oyuncular için çok yavaş olabilir. Karşılaştırıldığında, test edilen tüm cihazlar 0.1 (minimum) ile 240 (maksimum) ms arasında değişir. » Tüm cihazların 61 %'si daha iyi. Bu, ölçülen yanıt süresinin test edilen tüm cihazların ortalamasından (19.8 ms) daha kötü olduğu anlamına gelir. | ||
| ↔ Tepki Süresi %50 Griden %80 Griye | ||
| 24.4 ms ... yükseliş ↗ ve sonbahar↘ birleşimi | ↗ 11.6 ms yükseliş | 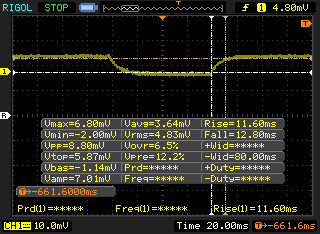 |
| ↘ 12.8 ms sonbahar | ||
| Ekran, testlerimizde iyi yanıt oranları gösteriyor ancak rekabetçi oyuncular için çok yavaş olabilir. Karşılaştırıldığında, test edilen tüm cihazlar 0.165 (minimum) ile 636 (maksimum) ms arasında değişir. » Tüm cihazların 35 %'si daha iyi. Bu, ölçülen yanıt süresinin test edilen tüm cihazların ortalamasından (31 ms) daha iyi olduğu anlamına gelir. | ||
Ekran Titremesi / PWM (Darbe Genişliği Modülasyonu)
| Ekran titriyor / PWM algılanmadı | 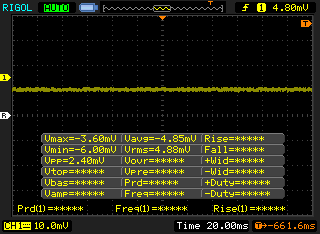 | ||
Karşılaştırıldığında: Test edilen tüm cihazların %52 %'si ekranı karartmak için PWM kullanmıyor. PWM tespit edilirse, ortalama 7772 (minimum: 5 - maksimum: 343500) Hz ölçüldü. | |||
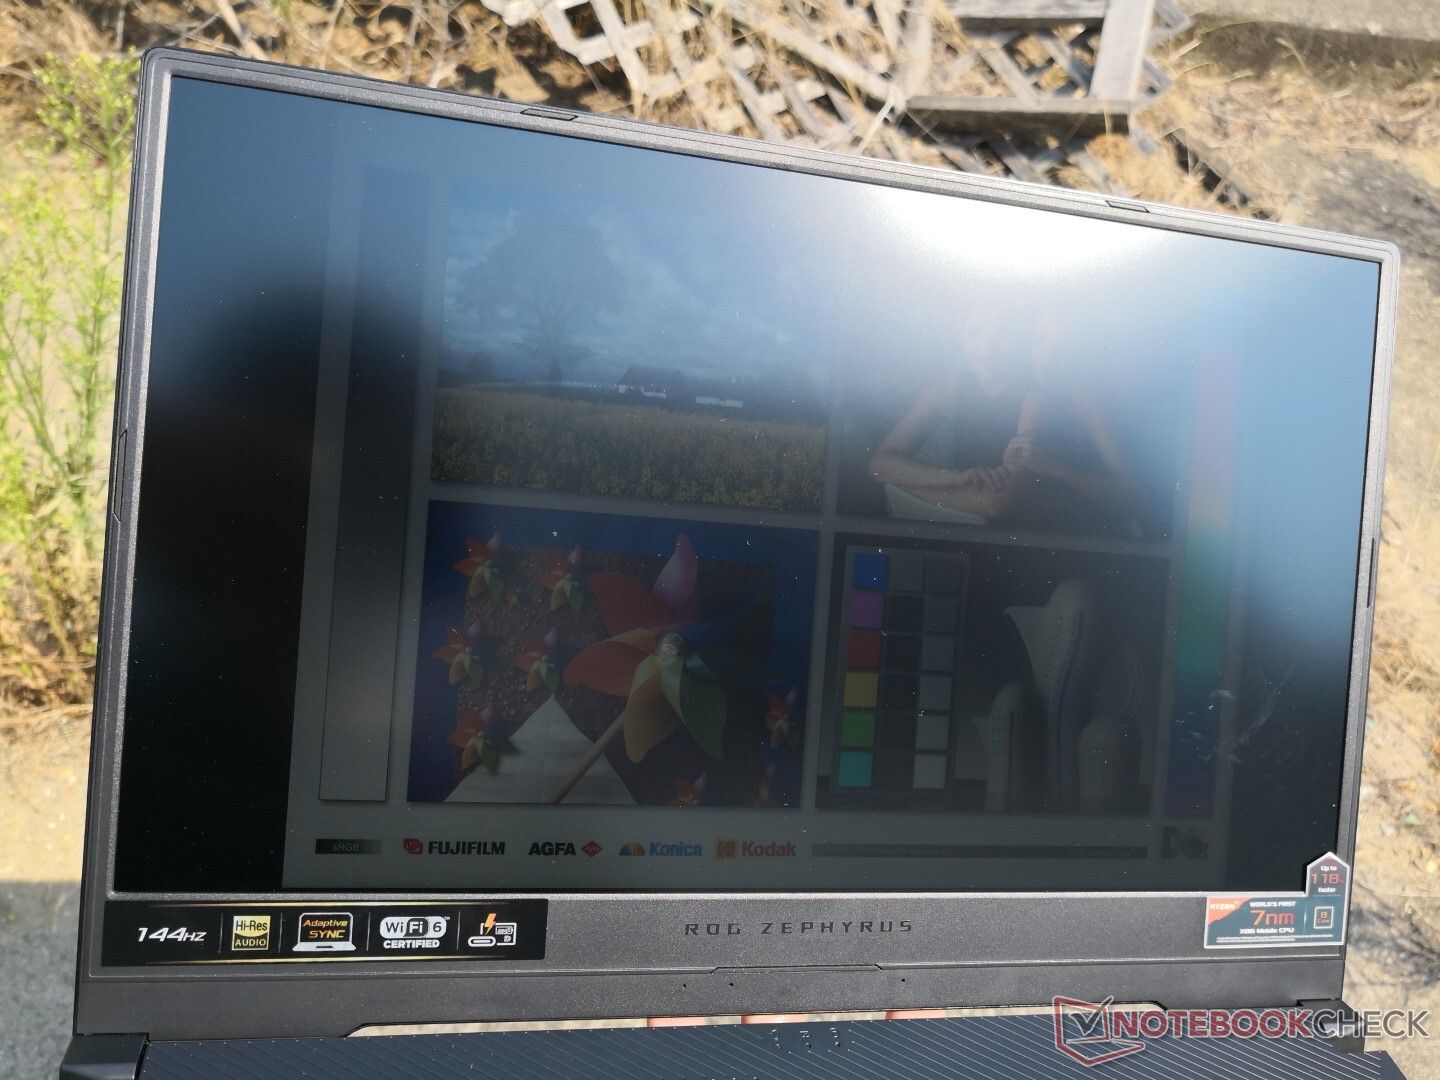
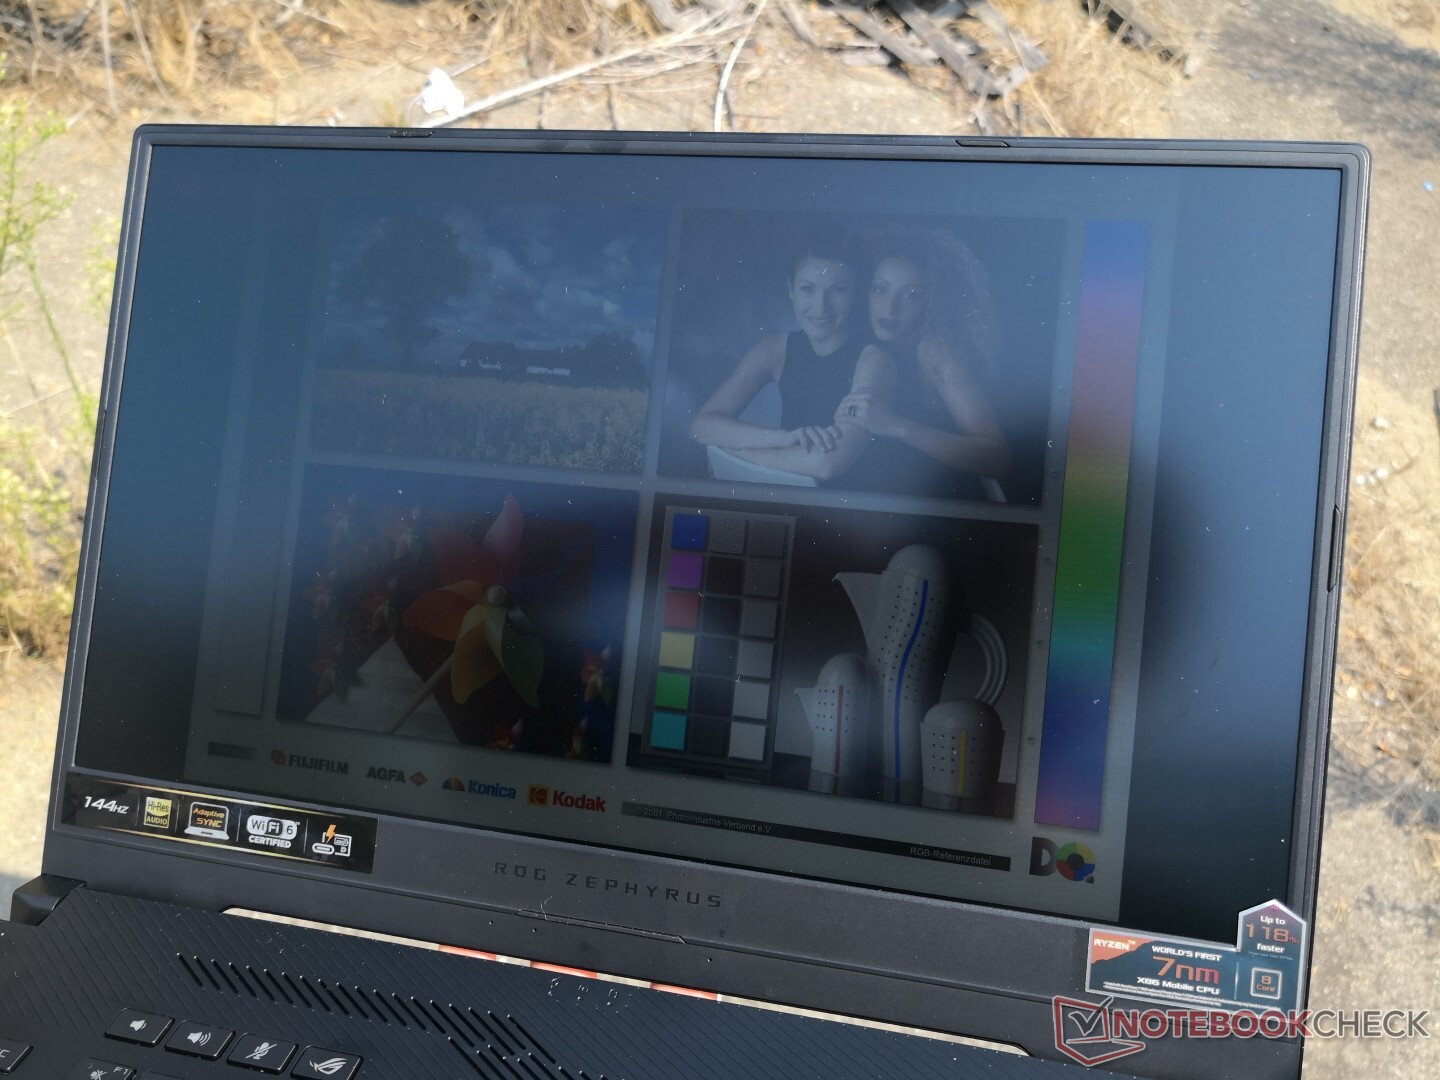
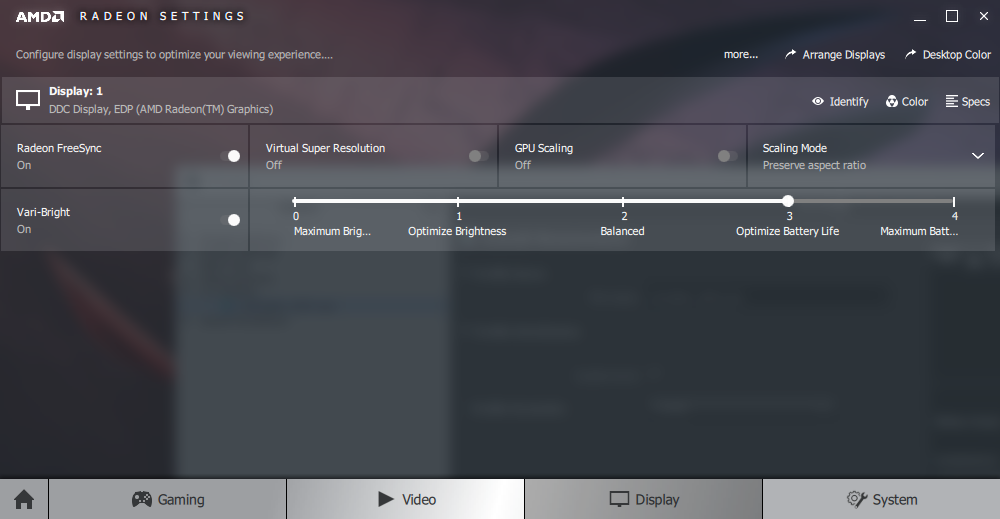
Dış mekan görünürlüğü, diğer 15.6 inçlik oyun dizüstü bilgisayarlarının çoğundan daha kötüdür çünkü buradaki maksimum ekran parlaklığı, kategori için 300 nit ortalamasına kıyasla yalnızca yaklaşık 250 nittir. Ayrıca, kullanıcılar AMD Vari-Bright'ı devre dışı bırakmayı unutmamalı, aksi takdirde maksimum parlaklık, görünürlüğü daha da fazla etkilemek için pille çalışırken yalnızca 152 nit'e düşecektir. ZenBook Pro 15 veya XPS 15 gibi özel Ultrabook'lar, dışarıda daha kolay görüntüleme için daha parlak ekranlara sahiptir.
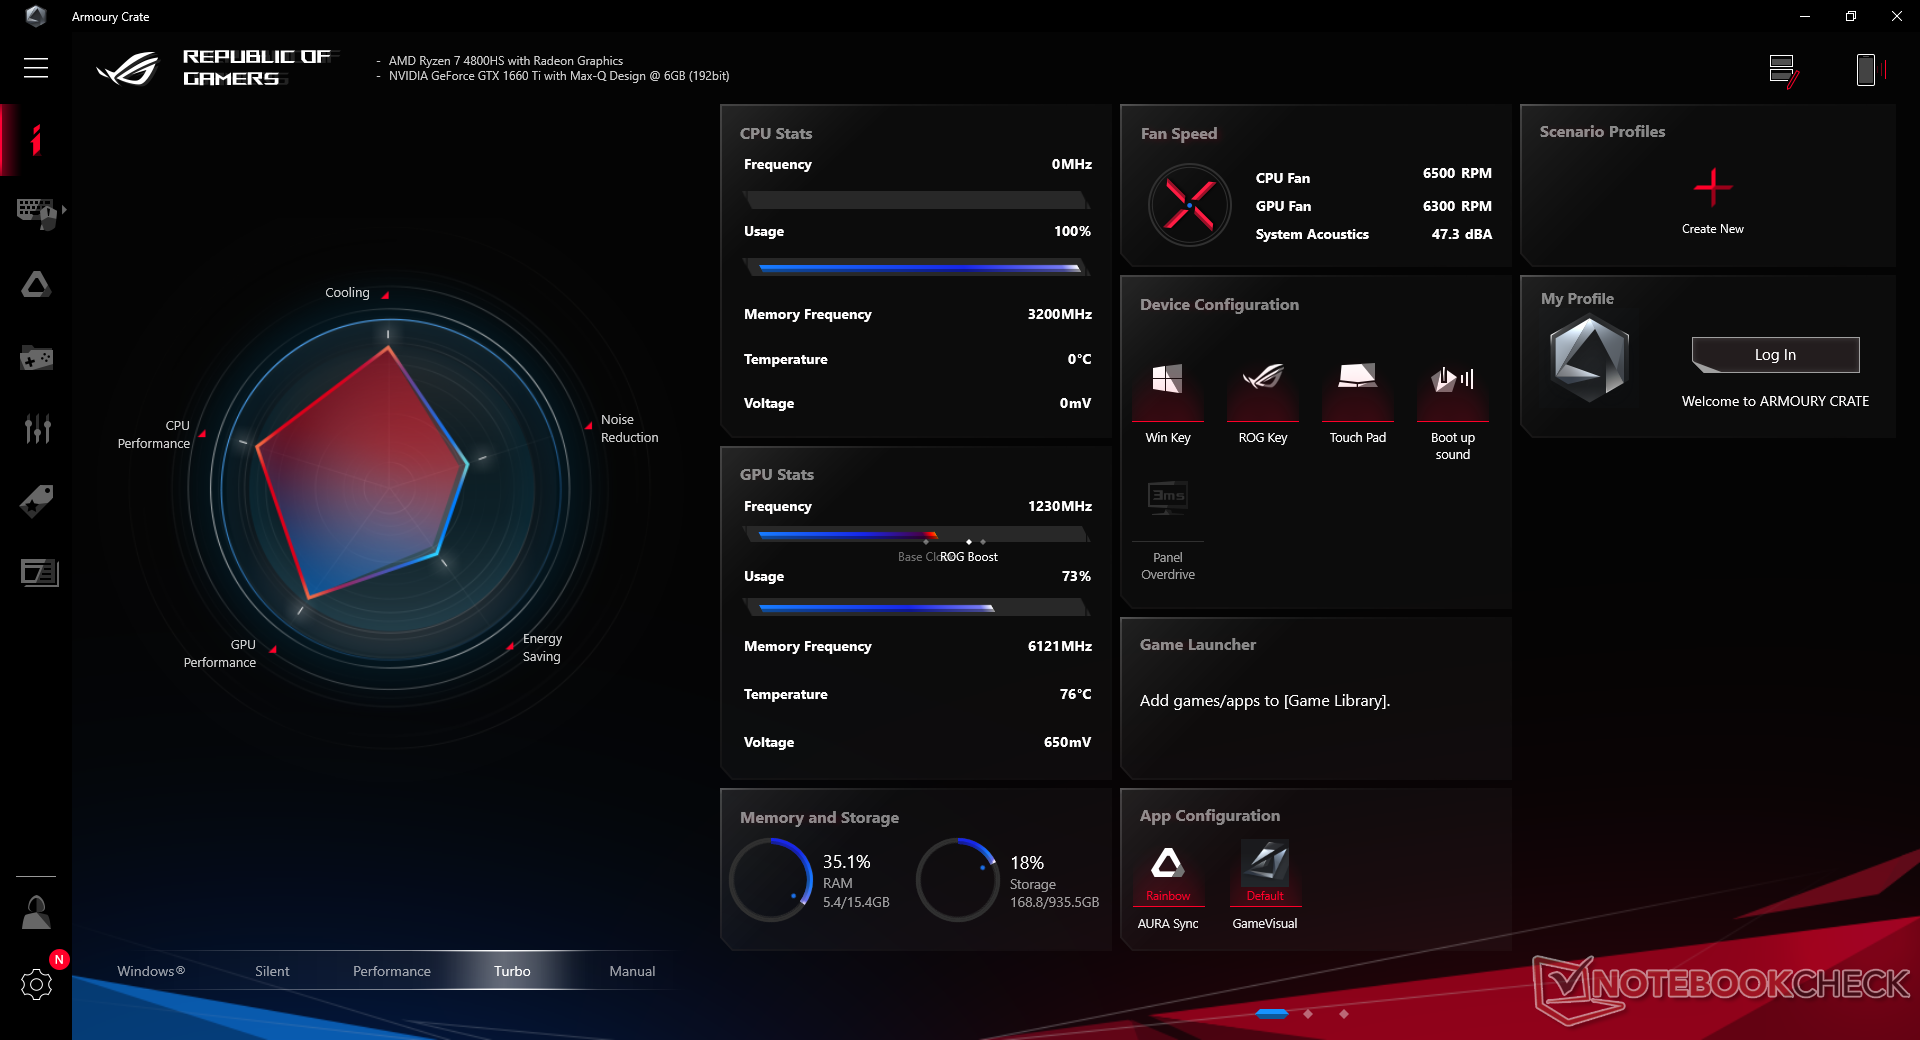
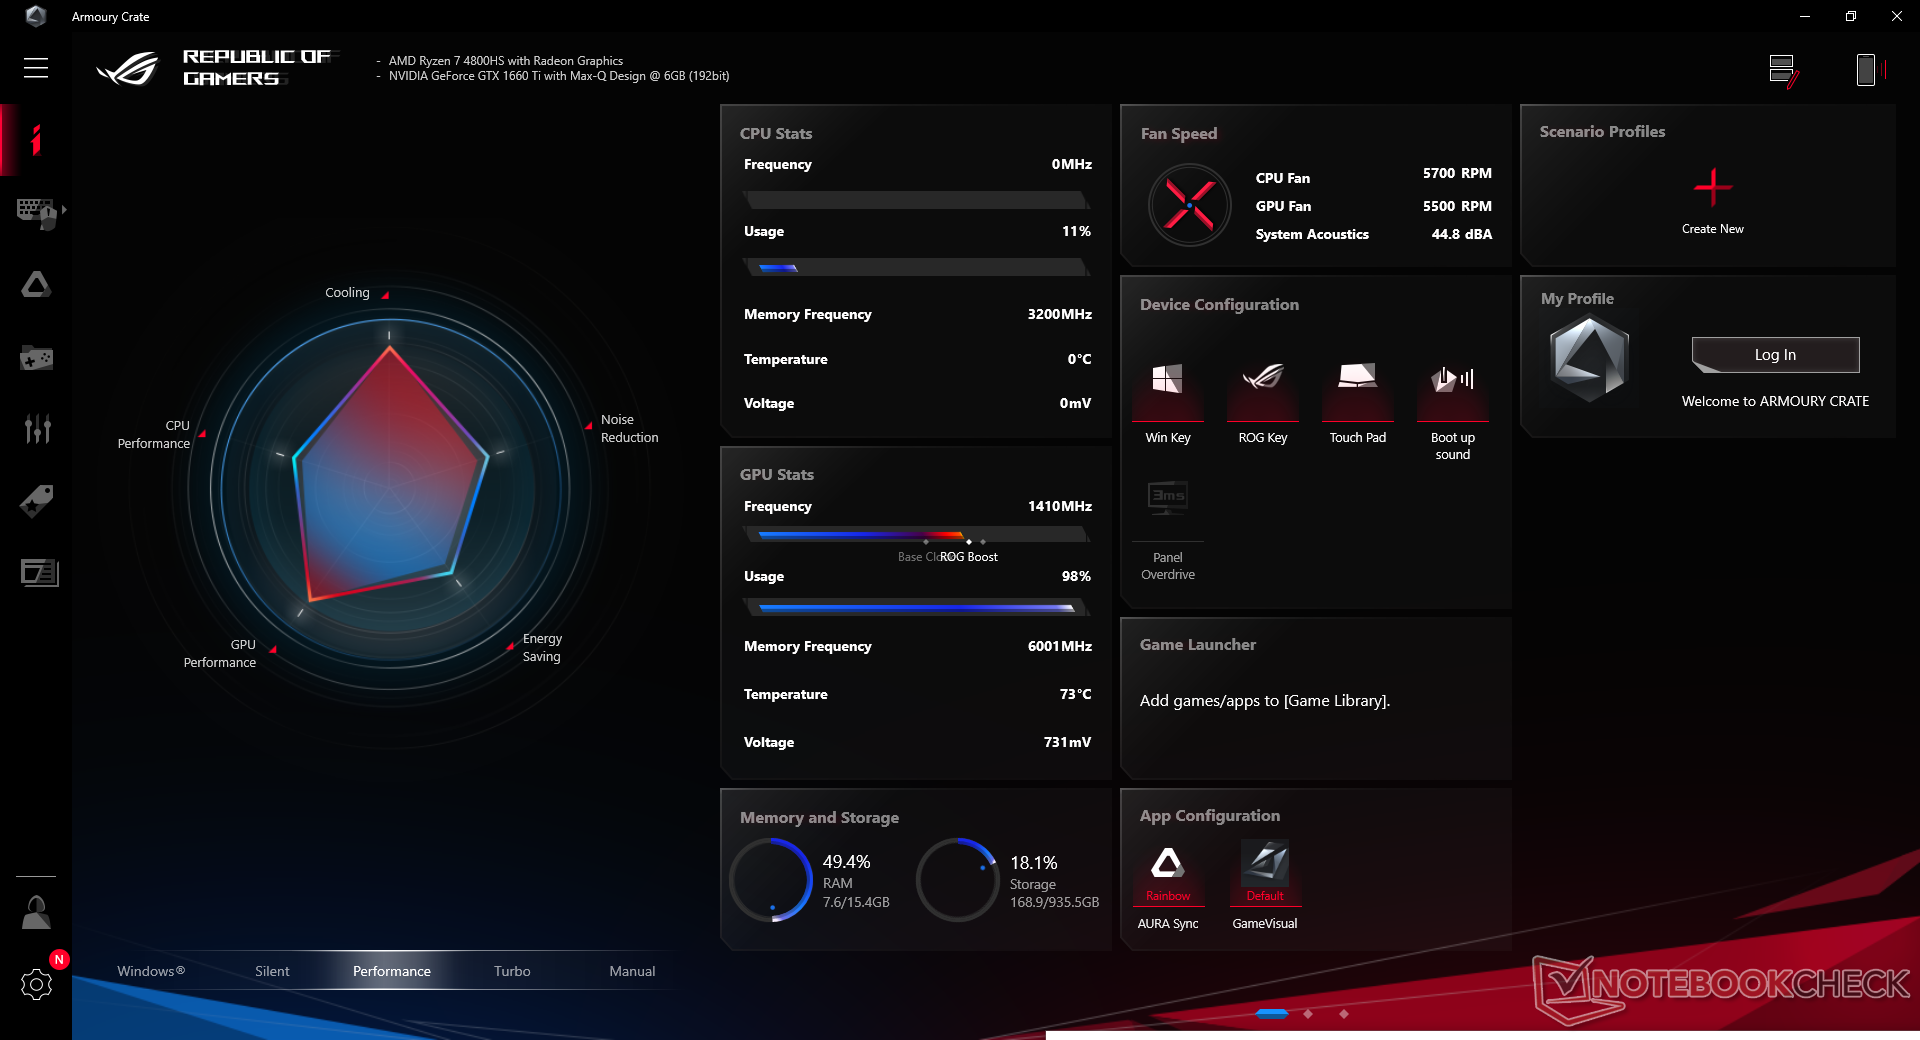
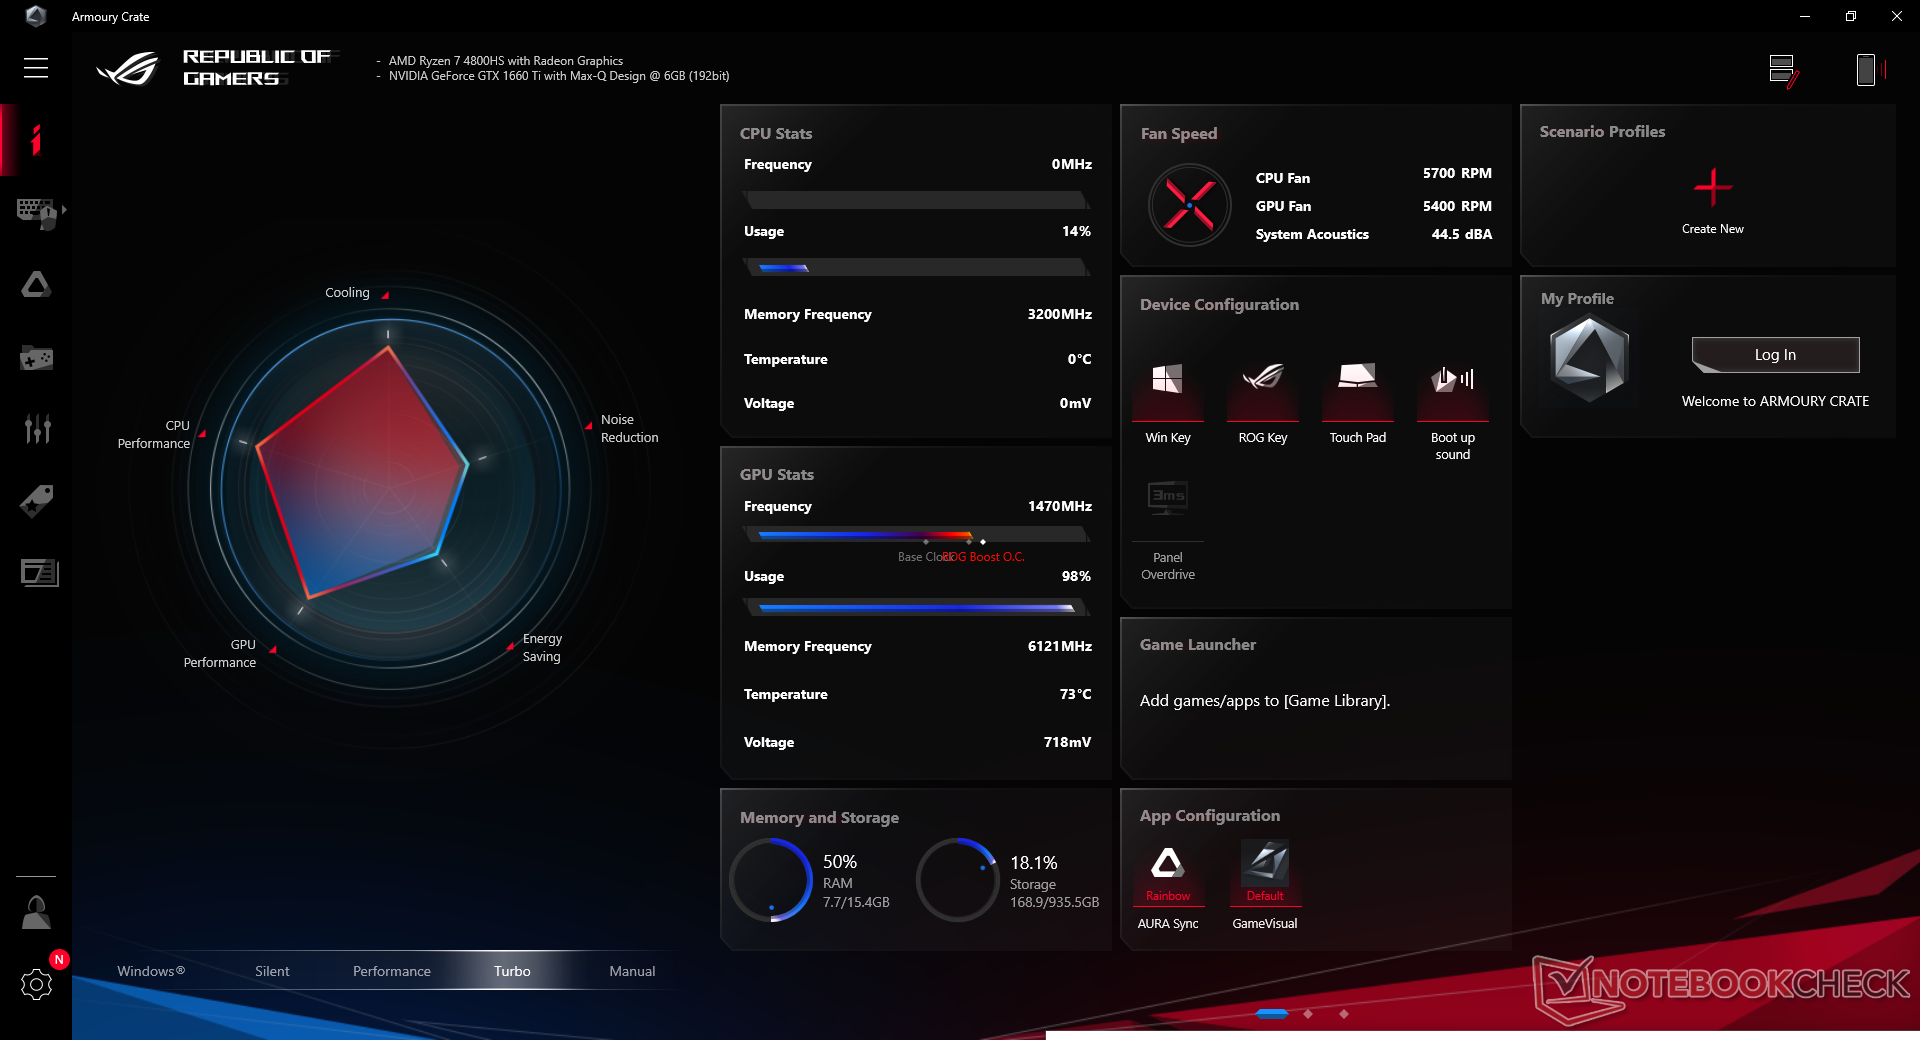
Verim
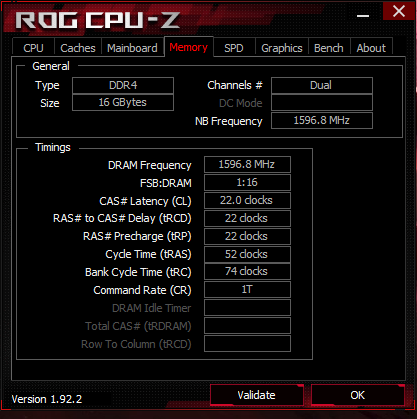
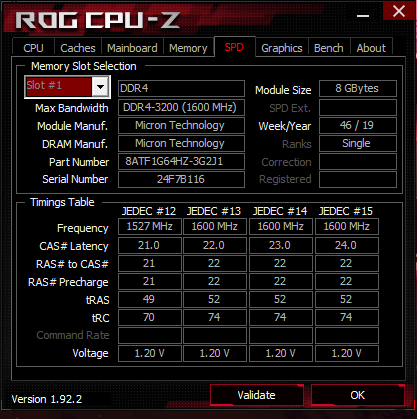
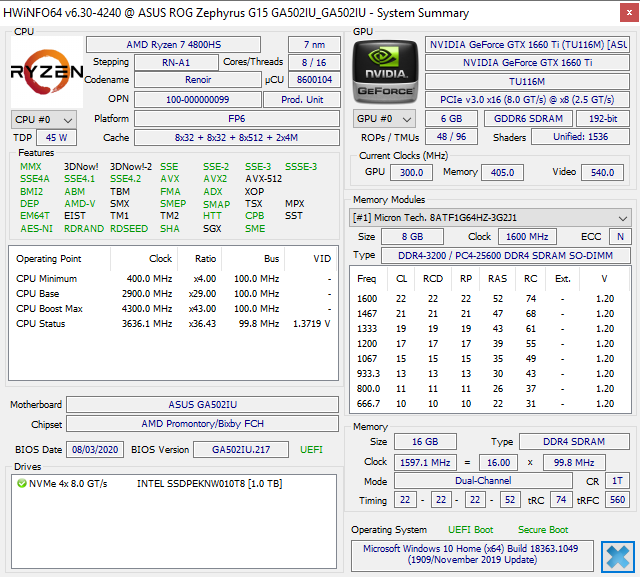
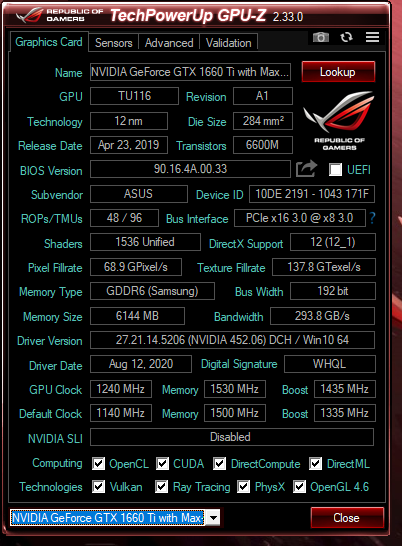
Asus GA502 serisi, 8 çekirdekli Ryzen 7 4800HS ile birlikte gönderilen ilk dizüstü bilgisayarlardan biri olmasıyla dikkat çekiyor. Tam güçlü 45 W Ryzen 7 4800H'nin aksine 4800HS, GA502 gibi daha küçük kasa tasarımlarına sığması için daha düşük bir 35 W TDP hedefliyor. Hala son nesil 4 çekirdekli Ryzen 7 3750H üzerinde muazzam bir yükseltme ve AMD hala popüler 8 çekirdekli Core i9-9880H veya i7-10875H'ye rakip olarak pazarlıyor. Grafik seçenekleri GeForce GTX 1660 Ti ile sınırlıdır Max-Q veya RTX 2060. Radeon RX 5500M veya 5600M'yi Dell G5 15 SE yerine AMD SmartShift desteği ile görmek ilginç olurdu, ancak Nvidia GPU'lar uyumluluk ve sürücüler söz konusu olduğunda tartışmasız "daha güvenli" seçeneklerdir. FreeSync, tüm SKU'larda standart olarak gelir.Mümkün olan en iyi skorlar için aşağıdaki tüm performans karşılaştırmalarını çalıştırmak için Asus'un Turbo modunu kullandık. Hem fan gürültüsü hem de performans ona yakından bağlı olduğundan Asus Armory Crate yazılımına aşina olmanızı öneririz. 8 GB RAM, toplam 40 GB'a kadar bir SODIMM genişletme yuvası ile lehimlenmiştir.
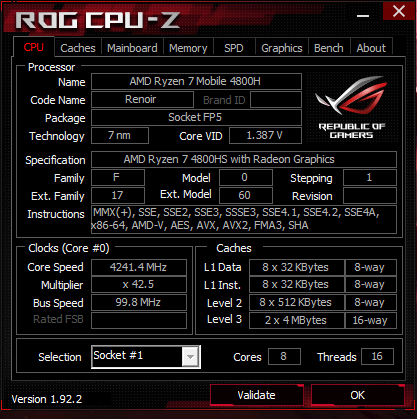
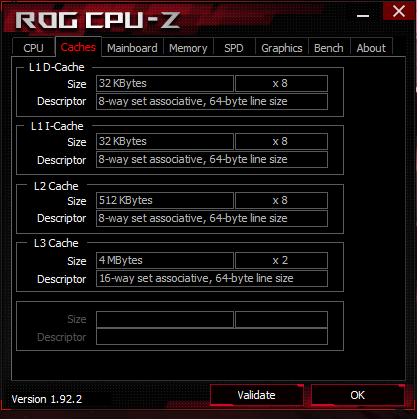
İşlemci
Ryzen 7 4800HS, 35 W'lık bir parça olmasına rağmen, 45 W Core i7-10875H ile CPU performansı hem tek iş parçacıklı hem de çok iş parçacıklı performansta baştan sona. Aşağıdaki grafikte gösterildiği gibi, CineBench R15 xT'yi bir döngüde çalıştırırken de performans sürdürülebilirliği iyidir. En önemlisi, Zephyrus G14'teki Ryzen 9 4900HS, herhangi bir performans azaltmayı hesaba katmadan önce en iyi ihtimalle yalnızca yaklaşık yüzde 10 daha hızlıdır.Daha fazla teknik bilgi ve kıyaslama karşılaştırmaları için Ryzen 7 4800HS'deki özel sayfamıza bakın.
Cinebench R15: CPU Multi 64Bit | CPU Single 64Bit
Blender: v2.79 BMW27 CPU
7-Zip 18.03: 7z b 4 -mmt1 | 7z b 4
Geekbench 5.5: Single-Core | Multi-Core
HWBOT x265 Benchmark v2.2: 4k Preset
LibreOffice : 20 Documents To PDF
R Benchmark 2.5: Overall mean
| Cinebench R20 / CPU (Multi Core) | |
| Eluktronics RP-17 | |
| Alienware m17 R3 P45E | |
| Eurocom Sky X4C i9-9900KS | |
| Asus Zephyrus G14 GA401IV | |
| MSI GS75 10SF-609US | |
| Asus ROG Zephyrus G15 GA502IU-ES76 | |
| Alienware m15 R3 P87F | |
| HP Pavilion Gaming 15-ec1206ng | |
| Walmart EVOO Gaming 17 | |
| Dell G5 15 5590 | |
| Asus ROG Zephyrus G15 GA502DU | |
| Cinebench R20 / CPU (Single Core) | |
| Eurocom Sky X4C i9-9900KS | |
| Asus Zephyrus G14 GA401IV | |
| Eluktronics RP-17 | |
| Asus ROG Zephyrus G15 GA502IU-ES76 | |
| Alienware m15 R3 P87F | |
| MSI GS75 10SF-609US | |
| Alienware m17 R3 P45E | |
| Walmart EVOO Gaming 17 | |
| HP Pavilion Gaming 15-ec1206ng | |
| Dell G5 15 5590 | |
| Asus ROG Zephyrus G15 GA502DU | |
| Cinebench R15 / CPU Multi 64Bit | |
| Eurocom Sky X4C i9-9900KS | |
| Eluktronics RP-17 | |
| Asus Zephyrus G14 GA401IV | |
| Alienware m17 R3 P45E | |
| MSI GS75 10SF-609US | |
| Asus ROG Zephyrus G15 GA502IU-ES76 | |
| HP Pavilion Gaming 15-ec1206ng | |
| Alienware m15 R3 P87F | |
| Walmart EVOO Gaming 17 | |
| Dell G5 15 5590 | |
| Asus ROG Zephyrus G15 GA502DU | |
| Cinebench R15 / CPU Single 64Bit | |
| Eurocom Sky X4C i9-9900KS | |
| Alienware m17 R3 P45E | |
| Alienware m15 R3 P87F | |
| MSI GS75 10SF-609US | |
| Asus Zephyrus G14 GA401IV | |
| Eluktronics RP-17 | |
| Asus ROG Zephyrus G15 GA502IU-ES76 | |
| Walmart EVOO Gaming 17 | |
| HP Pavilion Gaming 15-ec1206ng | |
| Dell G5 15 5590 | |
| Asus ROG Zephyrus G15 GA502DU | |
| Blender / v2.79 BMW27 CPU | |
| Asus ROG Zephyrus G15 GA502DU | |
| HP Pavilion Gaming 15-ec1206ng | |
| Alienware m15 R3 P87F | |
| Asus Zephyrus G14 GA401IV | |
| Asus ROG Zephyrus G15 GA502IU-ES76 | |
| MSI GS75 10SF-609US | |
| Eluktronics RP-17 | |
| Eurocom Sky X4C i9-9900KS | |
| Alienware m17 R3 P45E | |
| 7-Zip 18.03 / 7z b 4 -mmt1 | |
| Eurocom Sky X4C i9-9900KS | |
| Alienware m17 R3 P45E | |
| MSI GS75 10SF-609US | |
| Asus ROG Zephyrus G15 GA502IU-ES76 | |
| Asus Zephyrus G14 GA401IV | |
| Eluktronics RP-17 | |
| Alienware m15 R3 P87F | |
| HP Pavilion Gaming 15-ec1206ng | |
| Asus ROG Zephyrus G15 GA502DU | |
| 7-Zip 18.03 / 7z b 4 | |
| Eurocom Sky X4C i9-9900KS | |
| Eluktronics RP-17 | |
| Asus Zephyrus G14 GA401IV | |
| MSI GS75 10SF-609US | |
| Asus ROG Zephyrus G15 GA502IU-ES76 | |
| Alienware m17 R3 P45E | |
| HP Pavilion Gaming 15-ec1206ng | |
| Alienware m15 R3 P87F | |
| Asus ROG Zephyrus G15 GA502DU | |
| Geekbench 5.5 / Single-Core | |
| Eurocom Sky X4C i9-9900KS | |
| Alienware m17 R3 P45E | |
| MSI GS75 10SF-609US | |
| Alienware m15 R3 P87F | |
| Asus Zephyrus G14 GA401IV | |
| Asus ROG Zephyrus G15 GA502IU-ES76 | |
| Eluktronics RP-17 | |
| HP Pavilion Gaming 15-ec1206ng | |
| Geekbench 5.5 / Multi-Core | |
| Eurocom Sky X4C i9-9900KS | |
| MSI GS75 10SF-609US | |
| Alienware m17 R3 P45E | |
| Eluktronics RP-17 | |
| Asus ROG Zephyrus G15 GA502IU-ES76 | |
| Asus Zephyrus G14 GA401IV | |
| Alienware m15 R3 P87F | |
| HP Pavilion Gaming 15-ec1206ng | |
| HWBOT x265 Benchmark v2.2 / 4k Preset | |
| Eurocom Sky X4C i9-9900KS | |
| Alienware m17 R3 P45E | |
| Eluktronics RP-17 | |
| MSI GS75 10SF-609US | |
| Asus Zephyrus G14 GA401IV | |
| Asus ROG Zephyrus G15 GA502IU-ES76 | |
| Alienware m15 R3 P87F | |
| HP Pavilion Gaming 15-ec1206ng | |
| Asus ROG Zephyrus G15 GA502DU | |
| LibreOffice / 20 Documents To PDF | |
| HP Pavilion Gaming 15-ec1206ng | |
| Alienware m15 R3 P87F | |
| Eluktronics RP-17 | |
| Asus ROG Zephyrus G15 GA502IU-ES76 | |
| MSI GS75 10SF-609US | |
| Alienware m17 R3 P45E | |
| R Benchmark 2.5 / Overall mean | |
| Alienware m15 R3 P87F | |
| HP Pavilion Gaming 15-ec1206ng | |
| MSI GS75 10SF-609US | |
| Eluktronics RP-17 | |
| Asus ROG Zephyrus G15 GA502IU-ES76 | |
| Alienware m17 R3 P45E | |
* ... daha küçük daha iyidir
Sistem performansı
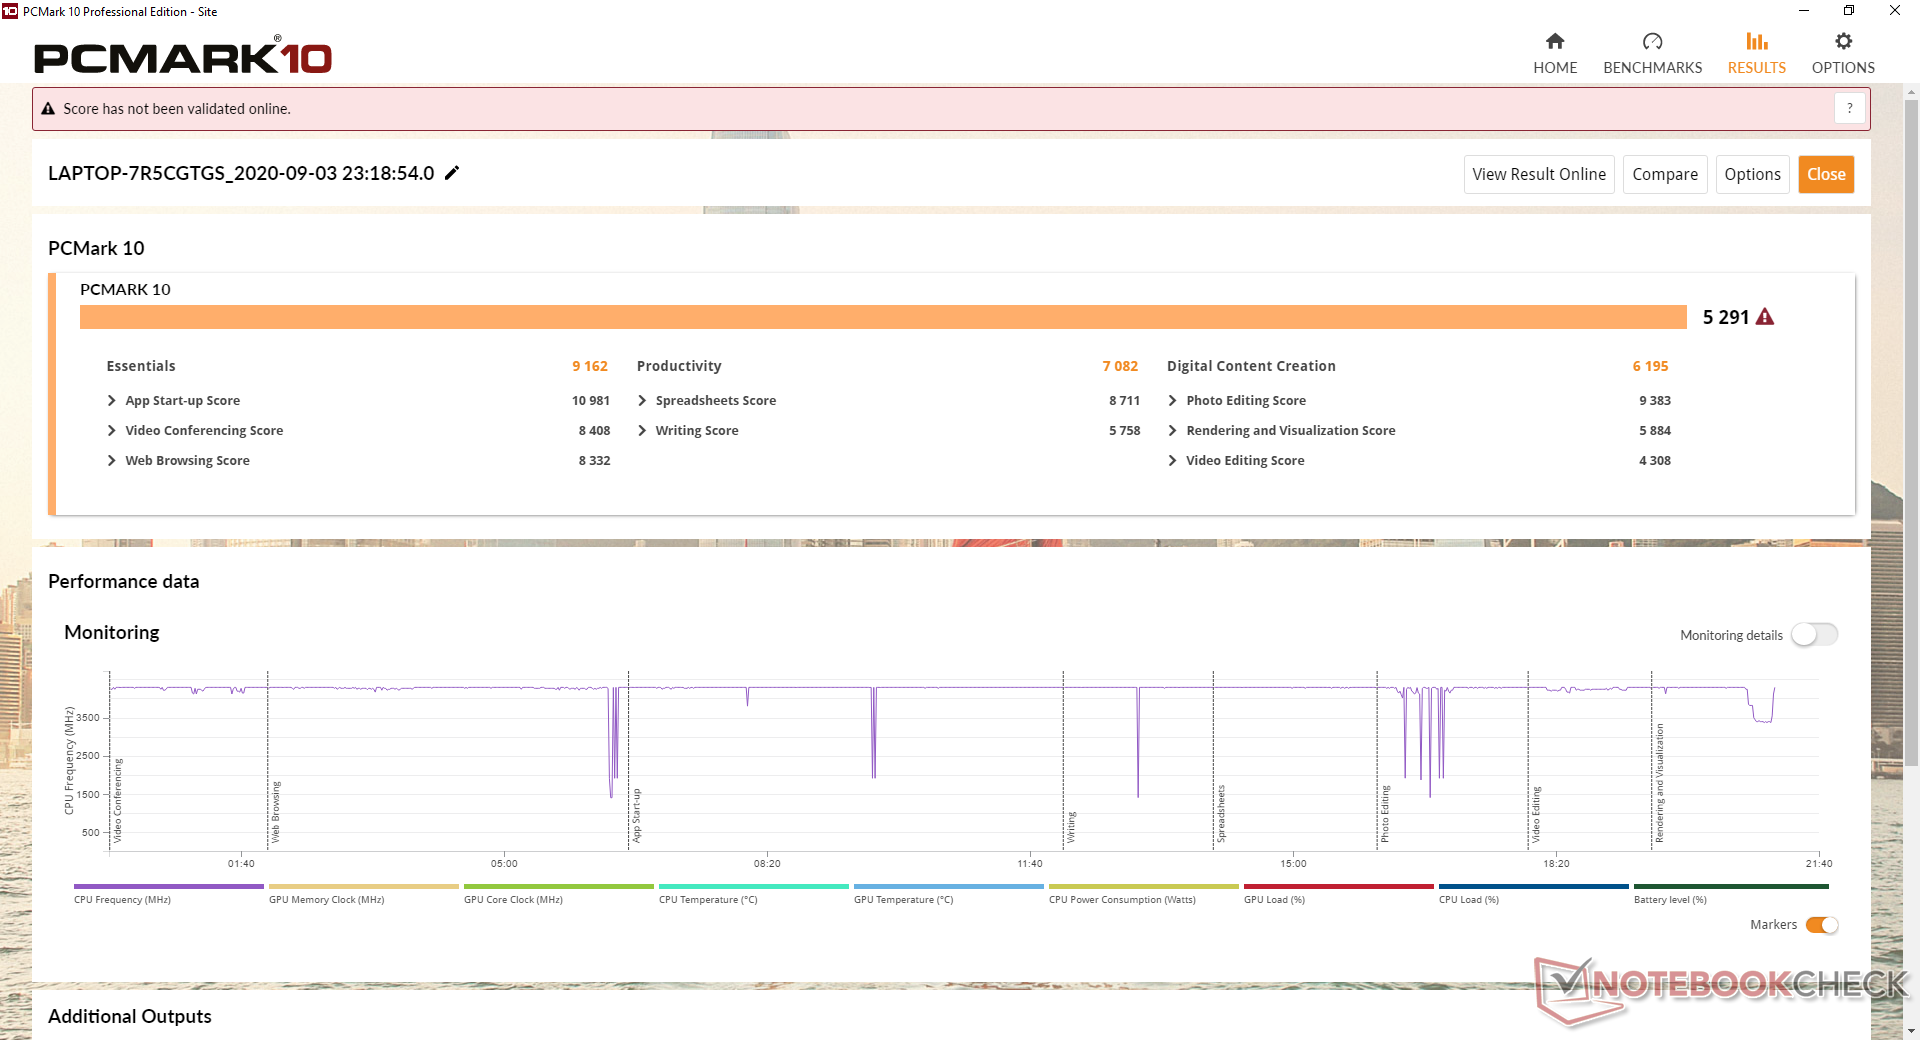
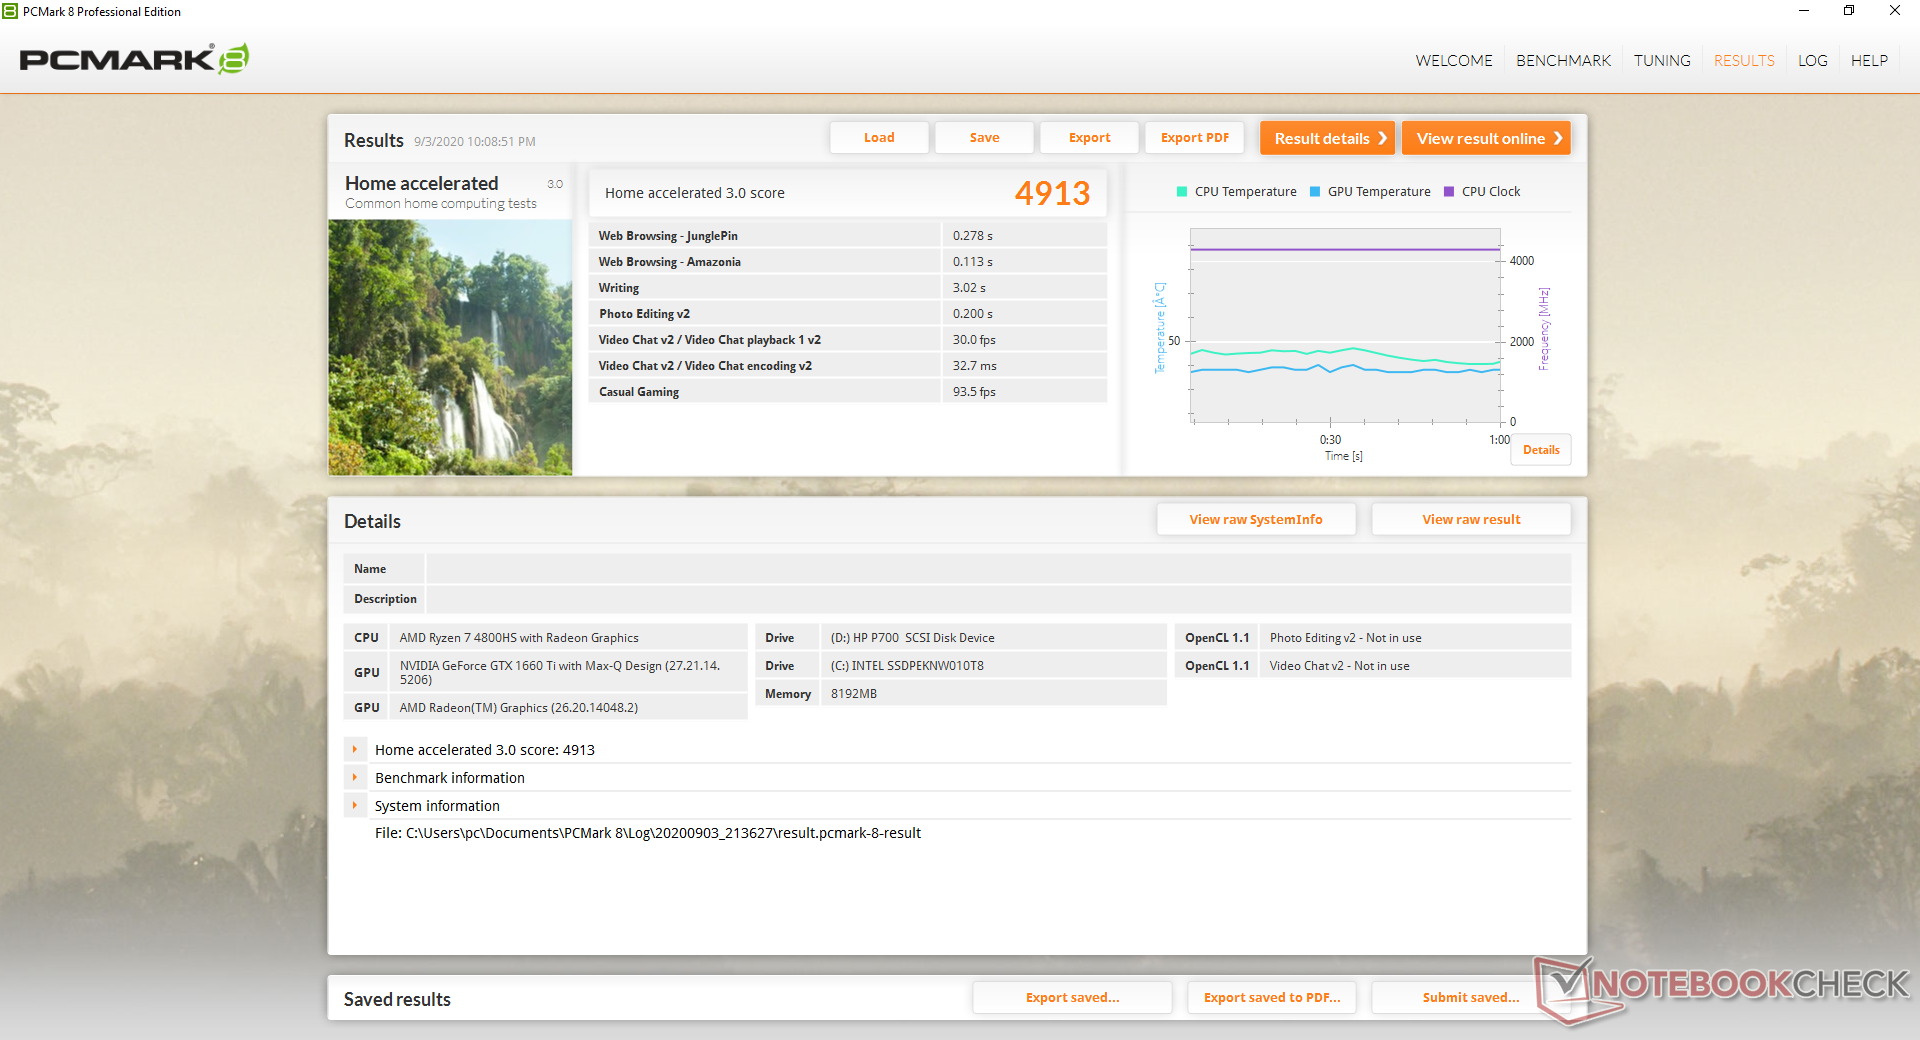
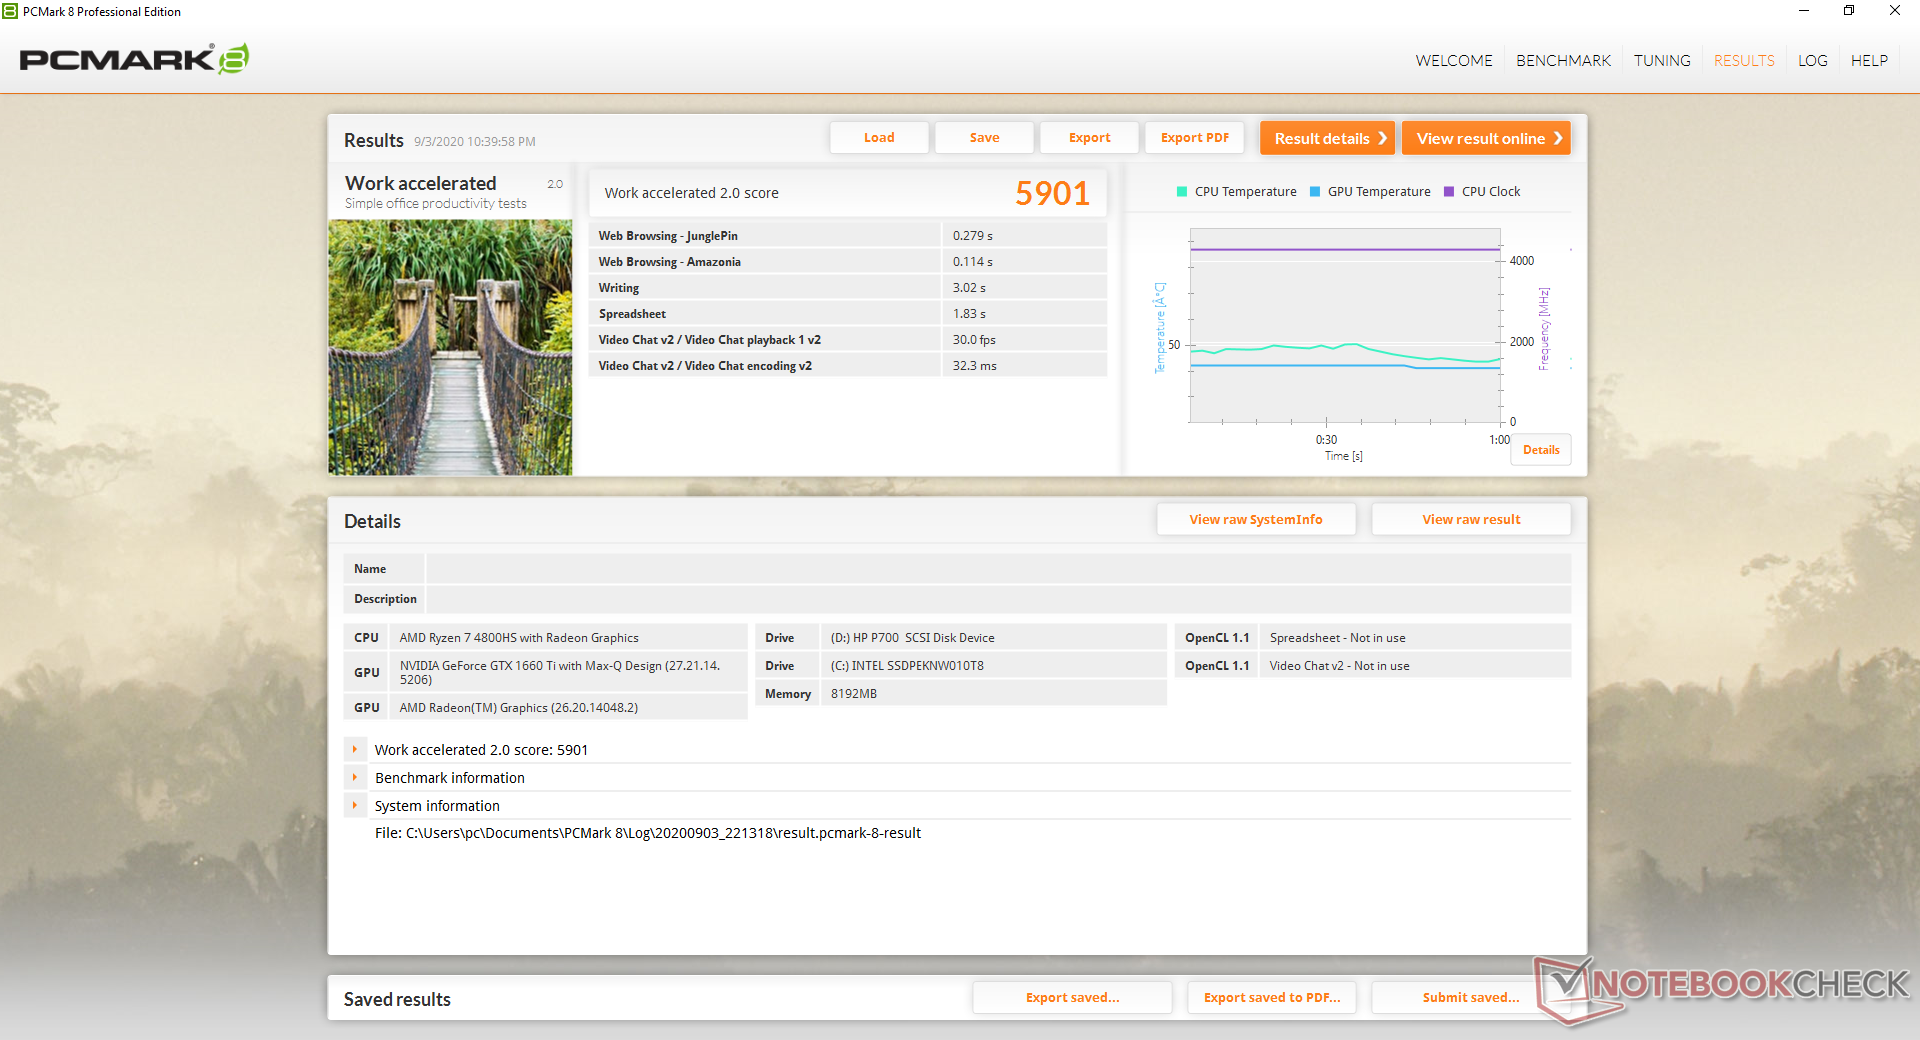
PCMark kriterleri, son nesil Ryzen 7 3750H tarafından desteklenen eski GA502DU'nun çok üstündeyken, tam güç Ryzen 7 4800H'de çalışan Eluktronics RP-15'ten sadece utangaçtır. Armory Crate yazılımı biraz iş kullanabilse de, birimle geçirdiğimiz süre boyunca hiçbir yazılım veya donanım sorunu yaşamadık.
| PCMark 10 | |
| Score | |
| Razer Blade 15 RTX 2070 Super Max-Q | |
| Eluktronics RP-15 | |
| Asus ROG Zephyrus G15 GA502IU-ES76 | |
| Asus ROG Zephyrus Duo 15 GX550LXS | |
| MSI GS66 Stealth 10SE-045 | |
| Lenovo Legion 5 15IMH05H | |
| Asus ROG Zephyrus G15 GA502DU | |
| Essentials | |
| Razer Blade 15 RTX 2070 Super Max-Q | |
| Eluktronics RP-15 | |
| MSI GS66 Stealth 10SE-045 | |
| Asus ROG Zephyrus Duo 15 GX550LXS | |
| Asus ROG Zephyrus G15 GA502IU-ES76 | |
| Lenovo Legion 5 15IMH05H | |
| Asus ROG Zephyrus G15 GA502DU | |
| Productivity | |
| Razer Blade 15 RTX 2070 Super Max-Q | |
| Lenovo Legion 5 15IMH05H | |
| Asus ROG Zephyrus Duo 15 GX550LXS | |
| MSI GS66 Stealth 10SE-045 | |
| Eluktronics RP-15 | |
| Asus ROG Zephyrus G15 GA502IU-ES76 | |
| Asus ROG Zephyrus G15 GA502DU | |
| Digital Content Creation | |
| Razer Blade 15 RTX 2070 Super Max-Q | |
| Eluktronics RP-15 | |
| Asus ROG Zephyrus G15 GA502IU-ES76 | |
| Asus ROG Zephyrus Duo 15 GX550LXS | |
| Asus ROG Zephyrus G15 GA502DU | |
| MSI GS66 Stealth 10SE-045 | |
| Lenovo Legion 5 15IMH05H | |
| PCMark 8 | |
| Home Score Accelerated v2 | |
| Razer Blade 15 RTX 2070 Super Max-Q | |
| Eluktronics RP-15 | |
| Asus ROG Zephyrus G15 GA502IU-ES76 | |
| MSI GS66 Stealth 10SE-045 | |
| Lenovo Legion 5 15IMH05H | |
| Asus ROG Zephyrus Duo 15 GX550LXS | |
| Asus ROG Zephyrus G15 GA502DU | |
| Work Score Accelerated v2 | |
| Razer Blade 15 RTX 2070 Super Max-Q | |
| Eluktronics RP-15 | |
| MSI GS66 Stealth 10SE-045 | |
| Asus ROG Zephyrus G15 GA502IU-ES76 | |
| Lenovo Legion 5 15IMH05H | |
| Asus ROG Zephyrus G15 GA502DU | |
| Asus ROG Zephyrus Duo 15 GX550LXS | |
| PCMark 8 Home Score Accelerated v2 | 4913 puan | |
| PCMark 8 Work Score Accelerated v2 | 5901 puan | |
| PCMark 10 Score | 5291 puan | |
Yardım | ||
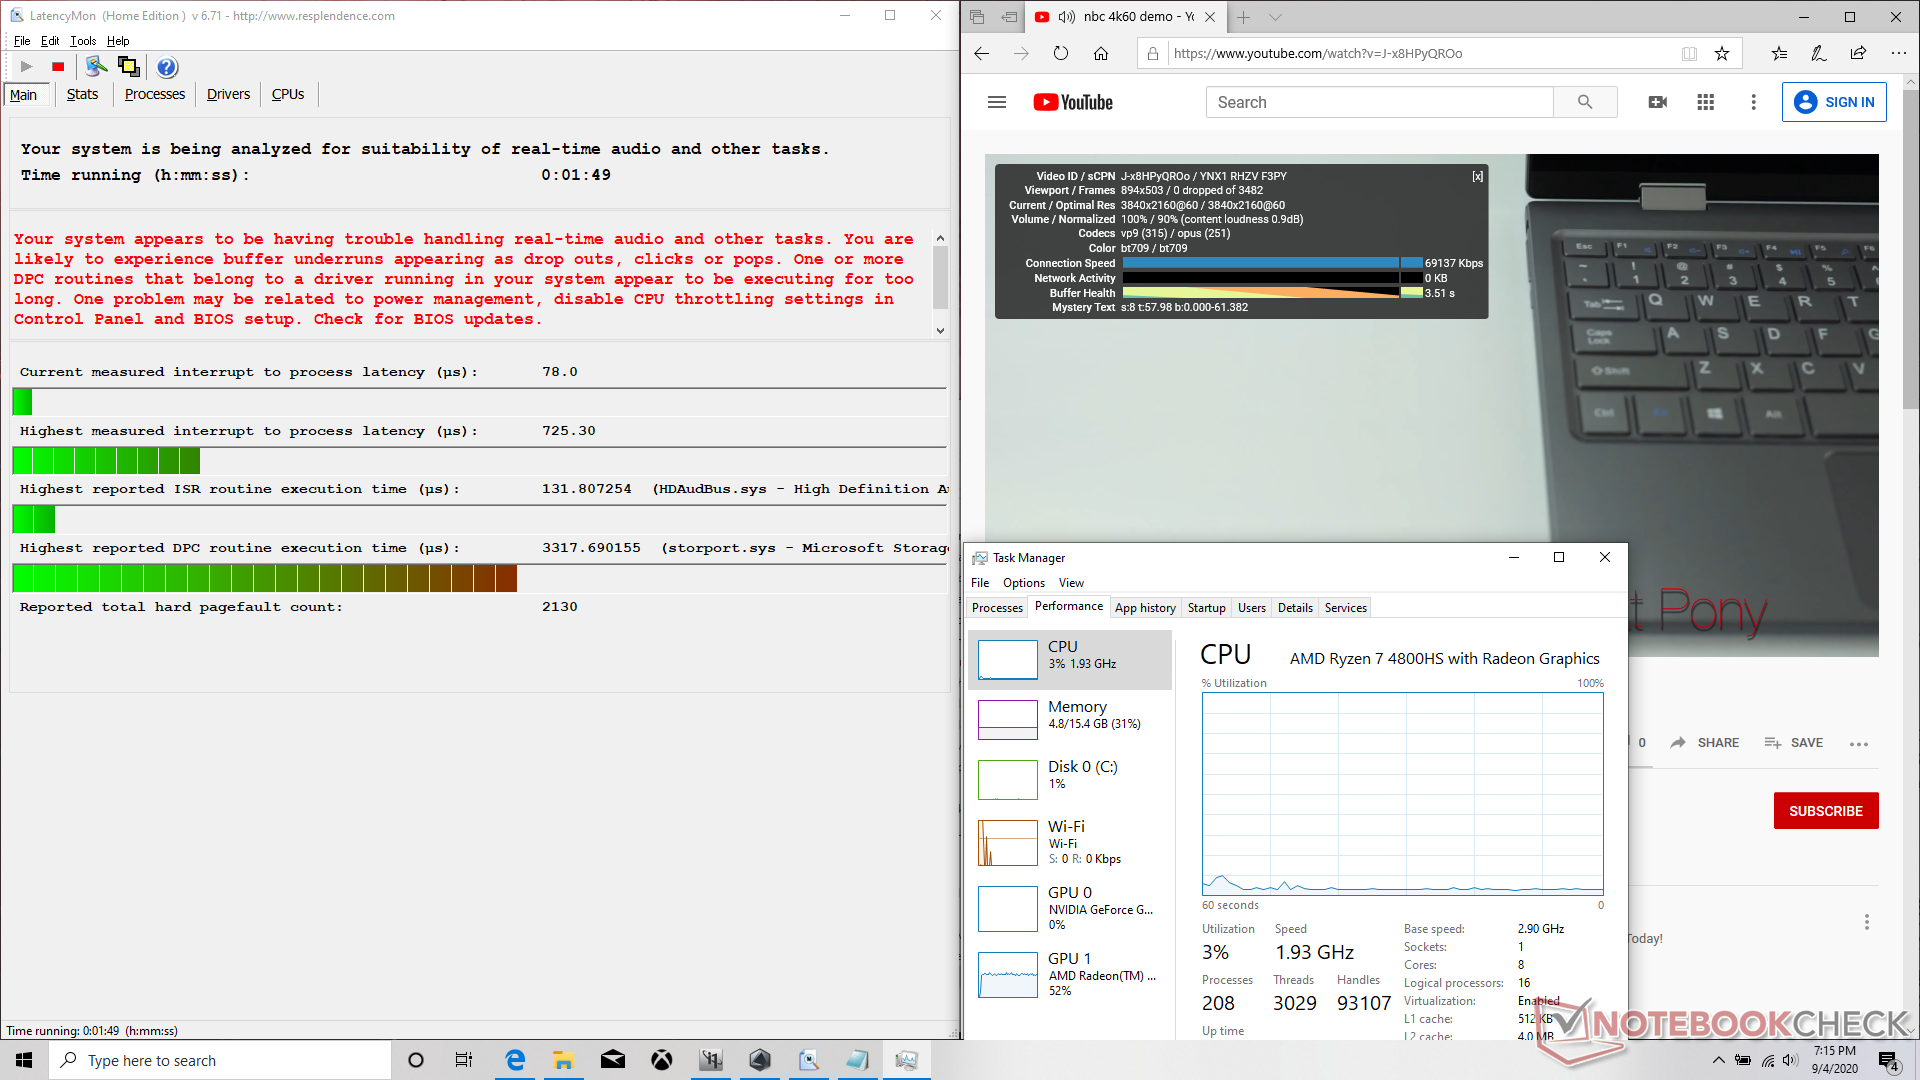
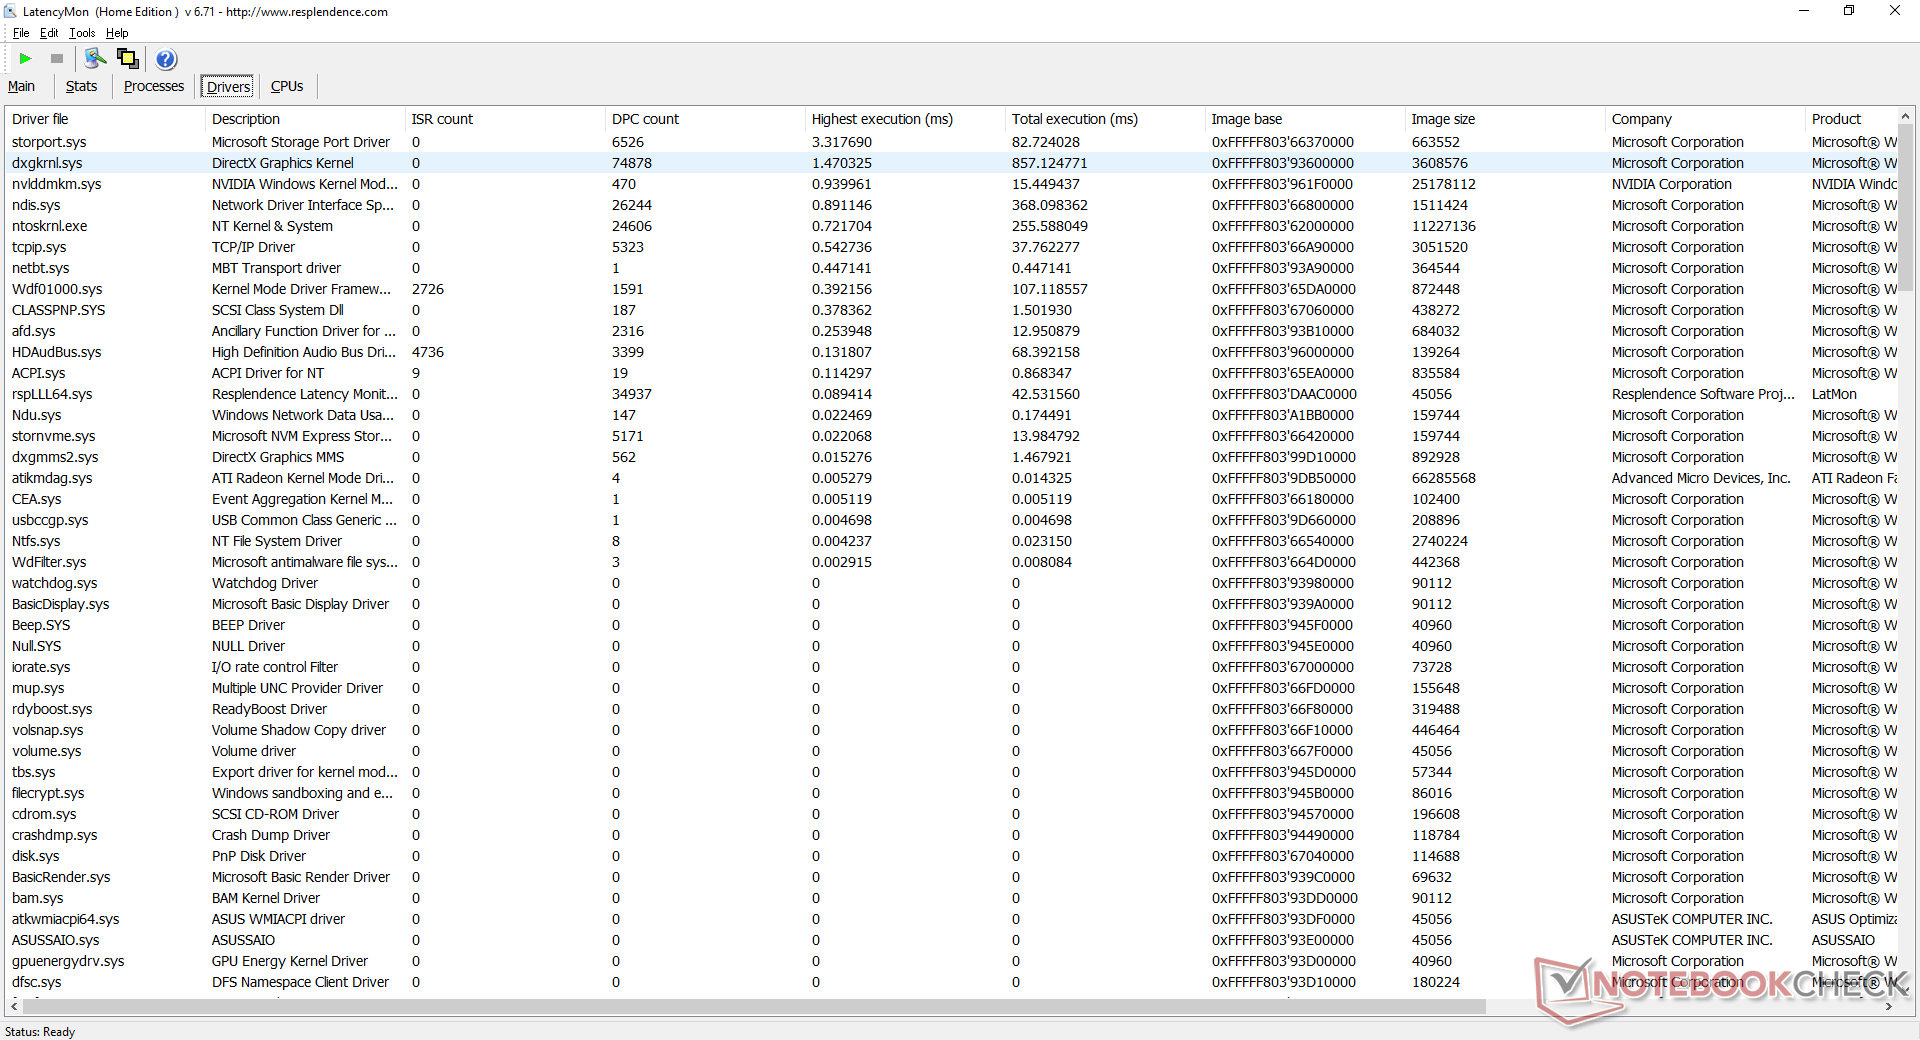
DPC Gecikmesi
LatencyMon, storport.sys ile ilgili DPC gecikme sorunlarını ortaya çıkarır. 60 FPS'de 4K video oynatma, aksi takdirde akıcıdır ve kare atlanmadan.
| DPC Latencies / LatencyMon - interrupt to process latency (max), Web, Youtube, Prime95 | |
| Asus ROG Zephyrus Duo 15 GX550LXS | |
| Razer Blade 15 RTX 2070 Super Max-Q | |
| MSI GS66 Stealth 10SE-045 | |
| Asus ROG Zephyrus G15 GA502IU-ES76 | |
| Lenovo Legion 5 15IMH05H | |
| Eluktronics RP-15 | |
* ... daha küçük daha iyidir
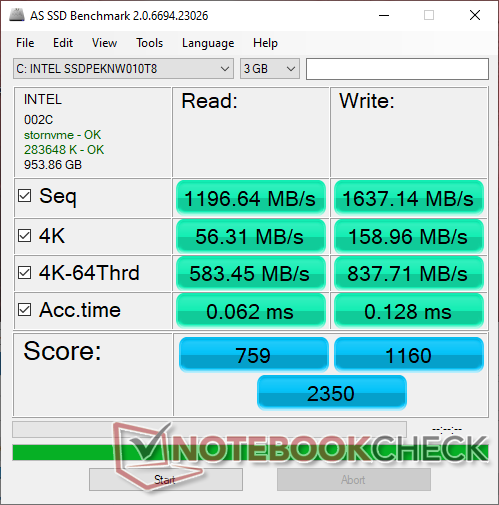
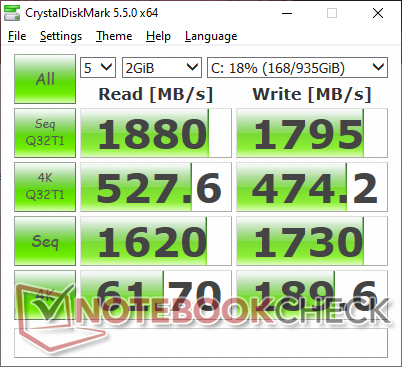
Depolama aygıtları
Asus, orta sınıf GA502 serisi için orta sınıf Intel 660p NVMe SSD'lere sadık kalırken, Zephyrus Duo gibi daha pahalı Asus ROG dizüstü bilgisayarlar bunun yerine daha hızlı Samsung sürücülerle gelebilir. Ünitemizdeki 1 TB Intel SSD, Samsung PM981 serisinde 3000 MB / sn veya daha yüksek olan her biri 1800 MB / sn maksimum okuma ve yazma oranları için derecelendirilmiştir.Kullanıcılar iki dahili depolama yuvasına erişebilir (M.2 2280 M .2 2242). Daha küçük M.2 2242 yuvasının yalnızca PCIe x2 olduğunu unutmayın.
| Asus ROG Zephyrus G15 GA502IU-ES76 Intel SSD 660p 1TB SSDPEKNW010T8 | Asus ROG Zephyrus Duo 15 GX550LXS 2x Samsung PM981a MZVLB1T0HBLR (RAID 0) | Asus ROG Zephyrus G15 GA502DU Intel SSD 660p SSDPEKNW512G8 | Razer Blade 15 RTX 2070 Super Max-Q Samsung SSD PM981a MZVLB512HBJQ | Lenovo Legion 5 15IMH05H Samsung PM991 MZALQ512HALU | MSI GS66 Stealth 10SE-045 Samsung SSD PM981 MZVLB1T0HALR | |
|---|---|---|---|---|---|---|
| AS SSD | 60% | -20% | 56% | 1% | 72% | |
| Seq Read (MB/s) | 1197 | 2981 149% | 907 -24% | 1957 63% | 2012 68% | 2612 118% |
| Seq Write (MB/s) | 1637 | 2783 70% | 926 -43% | 2092 28% | 1261 -23% | 2368 45% |
| 4K Read (MB/s) | 56.3 | 43.98 -22% | 47.26 -16% | 50.2 -11% | 43.66 -22% | 51.1 -9% |
| 4K Write (MB/s) | 159 | 113.9 -28% | 98.7 -38% | 96.5 -39% | 109.3 -31% | 135.9 -15% |
| 4K-64 Read (MB/s) | 583 | 1519 161% | 321.5 -45% | 1594 173% | 851 46% | 1635 180% |
| 4K-64 Write (MB/s) | 838 | 1296 55% | 736 -12% | 2005 139% | 780 -7% | 1831 118% |
| Access Time Read * (ms) | 0.062 | 0.062 -0% | 0.064 -3% | 0.057 8% | 0.117 -89% | 0.042 32% |
| Access Time Write * (ms) | 0.128 | 0.033 74% | 0.045 65% | 0.112 12% | 0.036 72% | 0.028 78% |
| Score Read (Points) | 759 | 1861 145% | 459 -40% | 1840 142% | 1096 44% | 1947 157% |
| Score Write (Points) | 1160 | 1688 46% | 927 -20% | 2310 99% | 1016 -12% | 2204 90% |
| Score Total (Points) | 2350 | 4492 91% | 1641 -30% | 5103 117% | 2643 12% | 5138 119% |
| Copy ISO MB/s (MB/s) | 1376 | 2438 77% | 905 -34% | 1793 30% | 1481 8% | 2334 70% |
| Copy Program MB/s (MB/s) | 568 | 604 6% | 496.9 -13% | 573 1% | 467.5 -18% | 569 0% |
| Copy Game MB/s (MB/s) | 1180 | 1404 19% | 819 -31% | 1418 20% | 734 -38% | 1401 19% |
| CrystalDiskMark 5.2 / 6 | 35% | -33% | 21% | -14% | 16% | |
| Write 4K (MB/s) | 189.6 | 127.6 -33% | 132.2 -30% | 139.8 -26% | 145.4 -23% | 156.3 -18% |
| Read 4K (MB/s) | 61.7 | 48.4 -22% | 55.5 -10% | 48.62 -21% | 51.6 -16% | 47.65 -23% |
| Write Seq (MB/s) | 1730 | 2958 71% | 986 -43% | 2260 31% | 1007 -42% | 2374 37% |
| Read Seq (MB/s) | 1620 | 2984 84% | 1318 -19% | 2135 32% | 1145 -29% | 2045 26% |
| Write 4K Q32T1 (MB/s) | 474.2 | 472.7 0% | 220.3 -54% | 499.3 5% | 468.4 -1% | 431.3 -9% |
| Read 4K Q32T1 (MB/s) | 528 | 529 0% | 315.5 -40% | 552 5% | 528 0% | 509 -4% |
| Write Seq Q32T1 (MB/s) | 1795 | 3431 91% | 987 -45% | 2960 65% | 1381 -23% | 2385 33% |
| Read Seq Q32T1 (MB/s) | 1880 | 3536 88% | 1416 -25% | 3269 74% | 2291 22% | 3505 86% |
| Toplam Ortalama (Program / Ayarlar) | 48% /
51% | -27% /
-25% | 39% /
43% | -7% /
-5% | 44% /
51% |
* ... daha küçük daha iyidir

Disk Throttling: DiskSpd Read Loop, Queue Depth 8
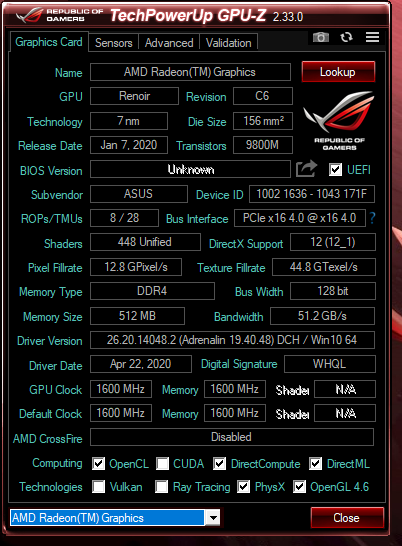
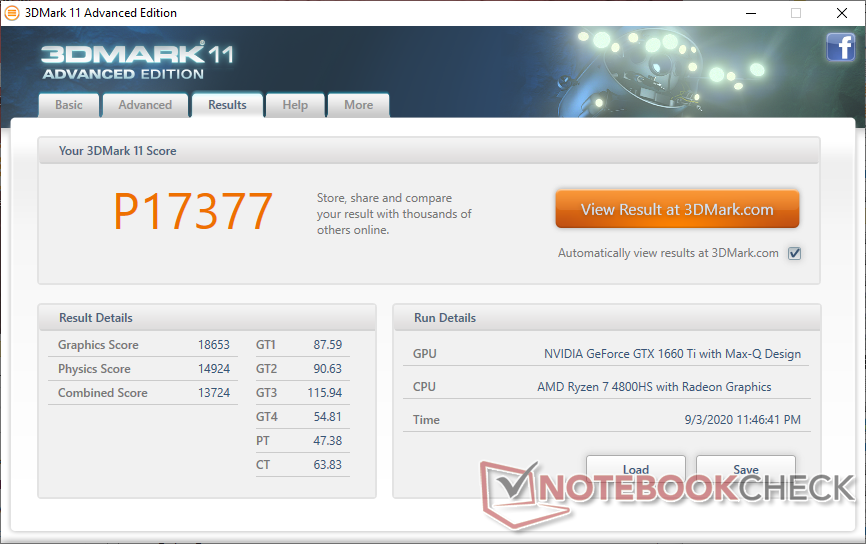
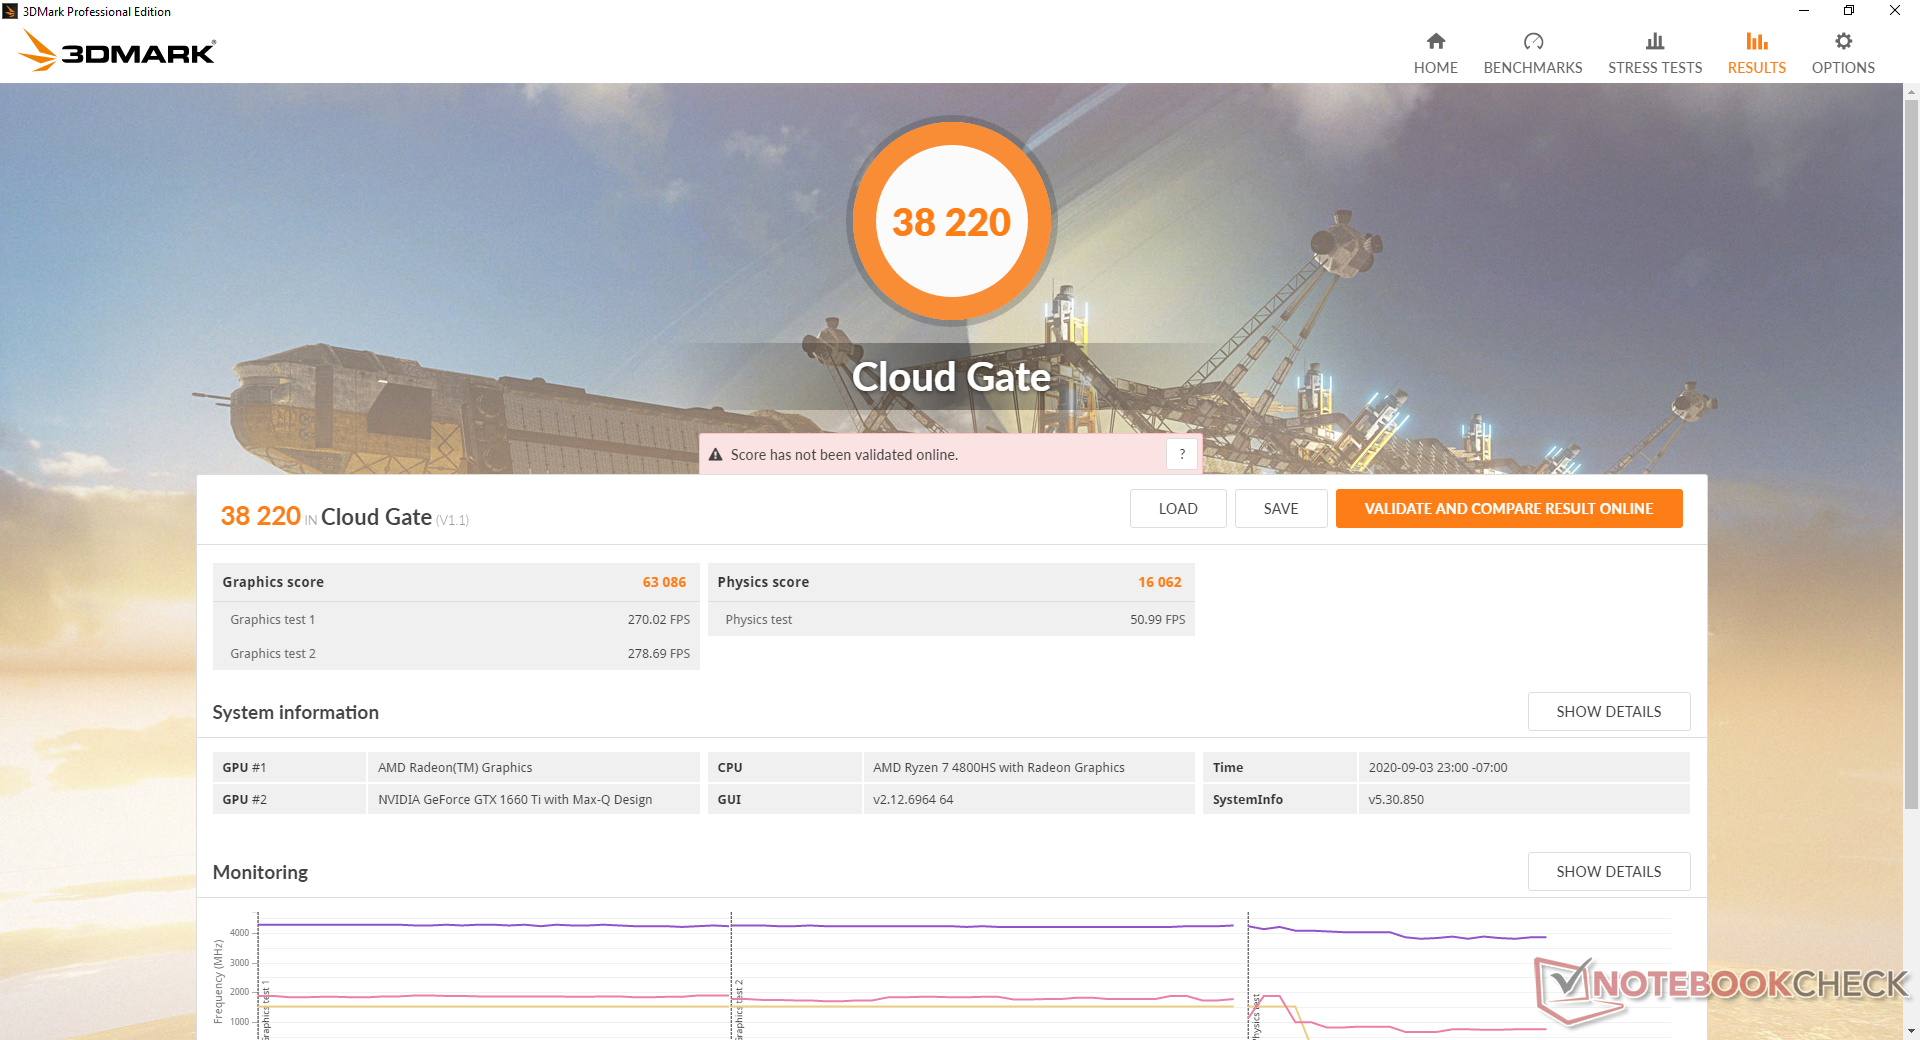
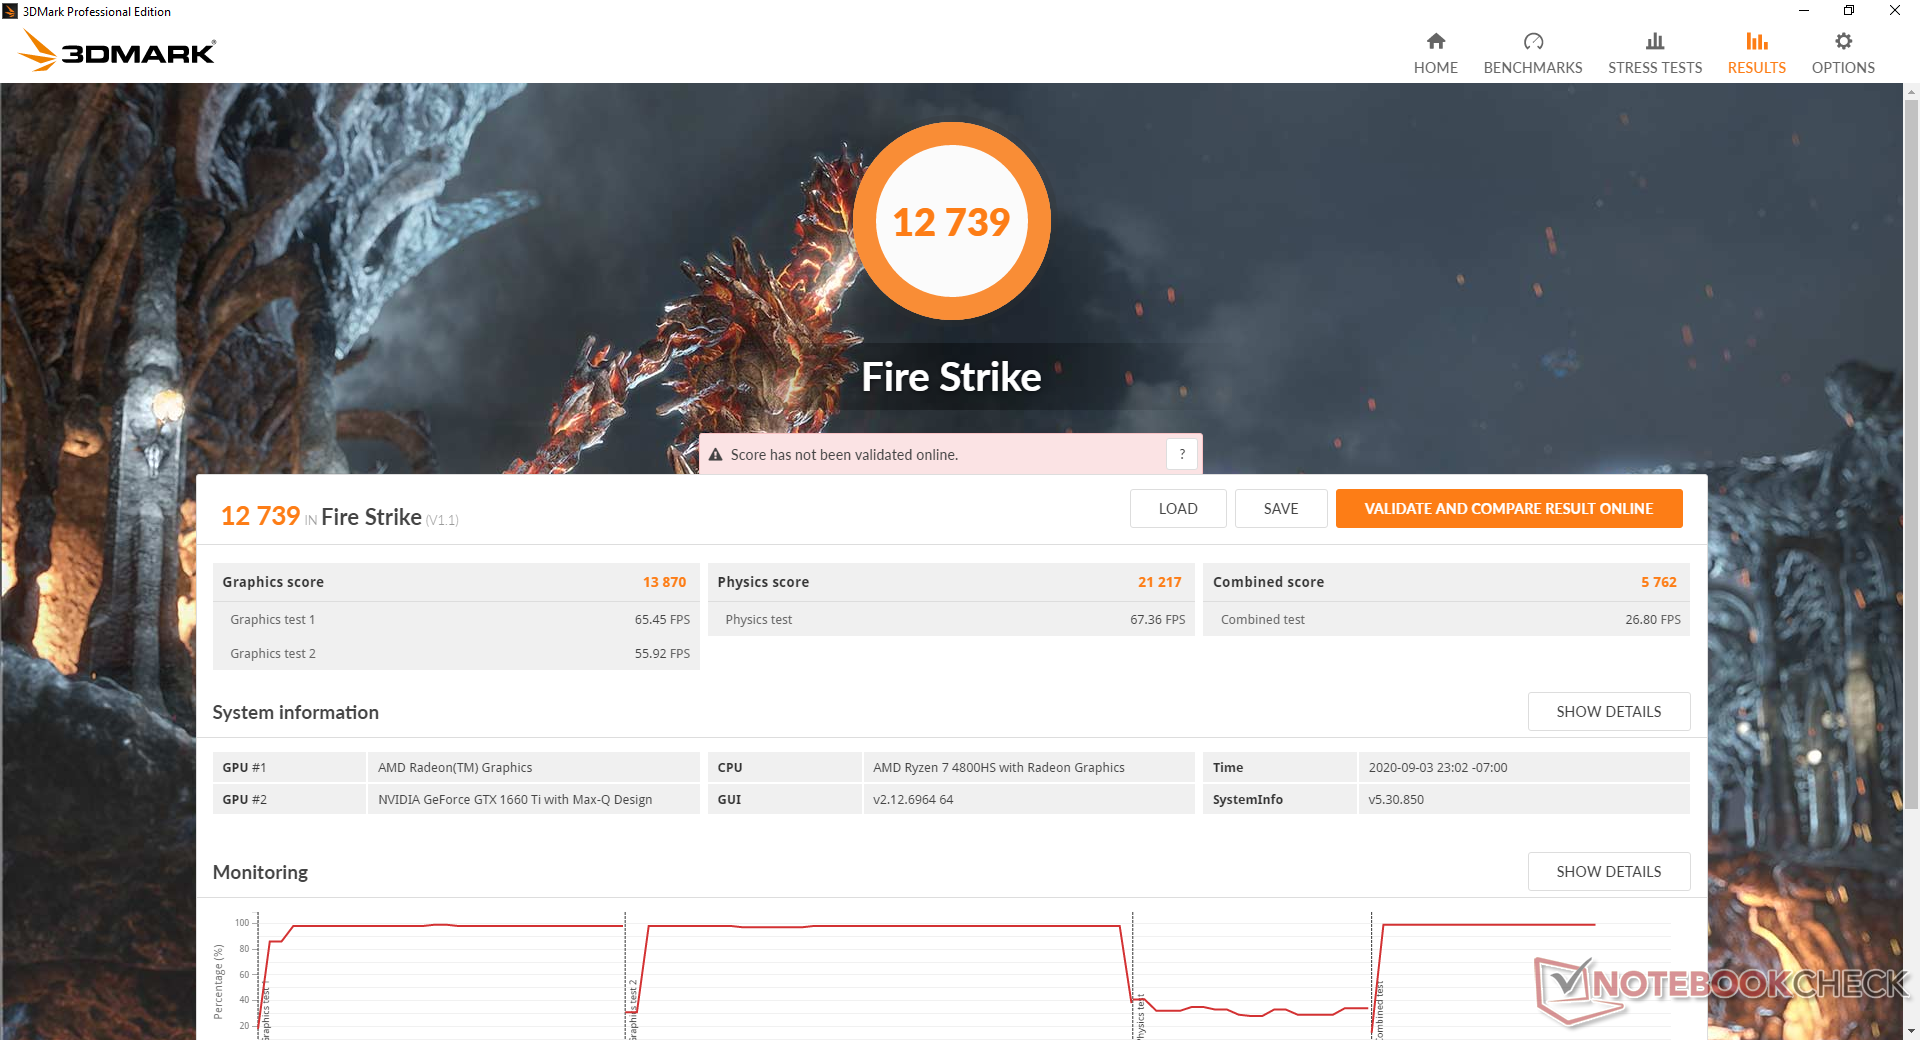
GPU Performansı
GTX 1660 Ti Max-Q, standart mobil GTX 1660 Ti'den yalnızca yüzde 10 daha yavaştır. Mobil RTX 2060 SKU'ya yükseltme, yerel RT faydalarını hesaba katmadan önce yaklaşık yüzde 15 ila 20 daha hızlı performans getirecektir. Daha fazla teknik bilgi ve kıyaslama karşılaştırmaları için GeForce GTX 1660 Ti Max-Q'daki özel sayfamıza bakın.
| 3DMark 11 | |
| 1280x720 Performance GPU | |
| Razer Blade 15 RTX 2080 Super Max-Q | |
| Aorus 15G XB | |
| MSI RTX 2060 Gaming Z 6G | |
| Dell G5 15 SE 5505 P89F | |
| MSI GS66 Stealth 10SE-045 | |
| Asus TUF A17 FA706IU-AS76 | |
| Asus ROG Zephyrus G15 GA502IU-ES76 | |
| Ortalama NVIDIA GeForce GTX 1660 Ti Max-Q (17010 - 18653, n=8) | |
| Asus ROG Zephyrus G15 GA502DU | |
| MSI Bravo 17 A4DDR | |
| Asus ROG Strix G15 G512LI | |
| Asus Zephyrus S GX531GM | |
| Lenovo IdeaPad Gaming 3i 15IMH05 | |
| 1280x720 Performance Combined | |
| MSI RTX 2060 Gaming Z 6G | |
| Asus ROG Zephyrus G15 GA502IU-ES76 | |
| Asus TUF A17 FA706IU-AS76 | |
| MSI Bravo 17 A4DDR | |
| Dell G5 15 SE 5505 P89F | |
| Asus ROG Strix G15 G512LI | |
| MSI GS66 Stealth 10SE-045 | |
| Razer Blade 15 RTX 2080 Super Max-Q | |
| Ortalama NVIDIA GeForce GTX 1660 Ti Max-Q (6644 - 14112, n=7) | |
| Lenovo IdeaPad Gaming 3i 15IMH05 | |
| Asus Zephyrus S GX531GM | |
| Asus ROG Zephyrus G15 GA502DU | |
| 3DMark 06 Standard Score | 25384 puan | |
| 3DMark 11 Performance | 17377 puan | |
| 3DMark Cloud Gate Standard Score | 38220 puan | |
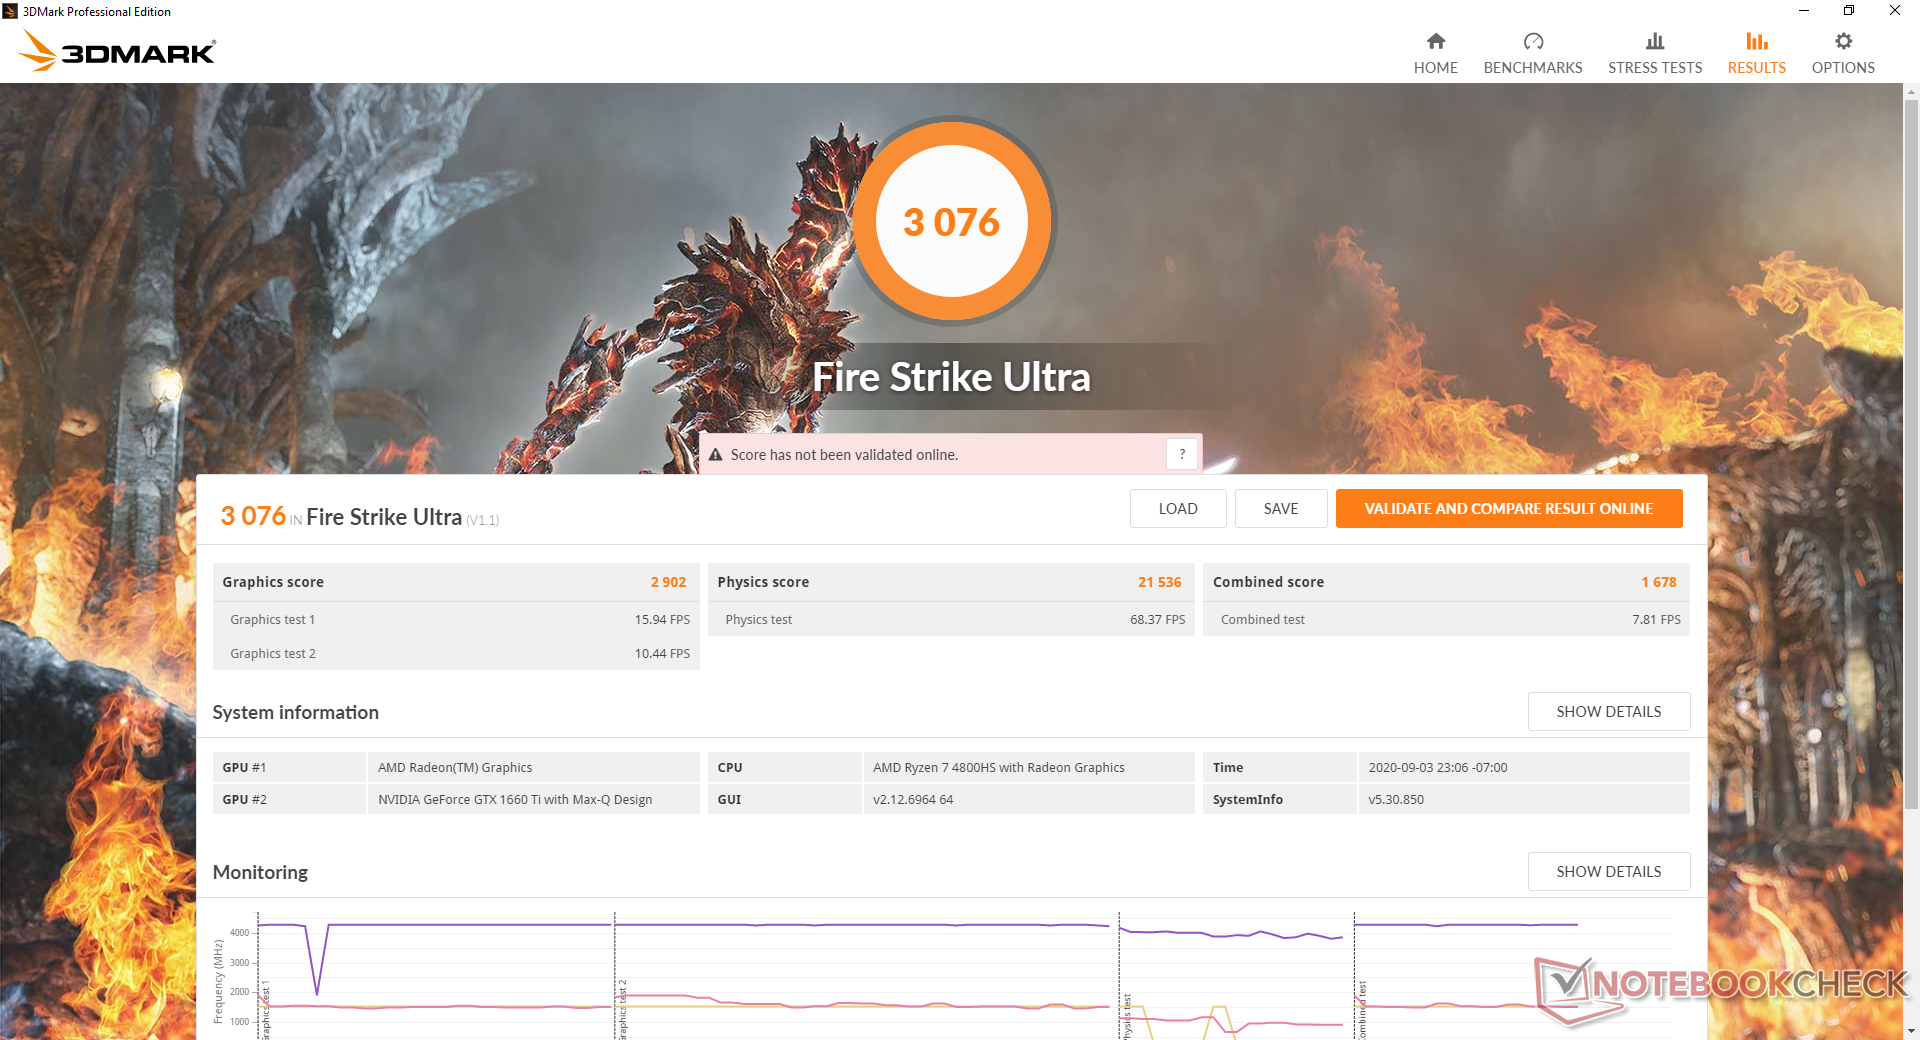
| 3DMark Fire Strike Score | 12739 puan | |
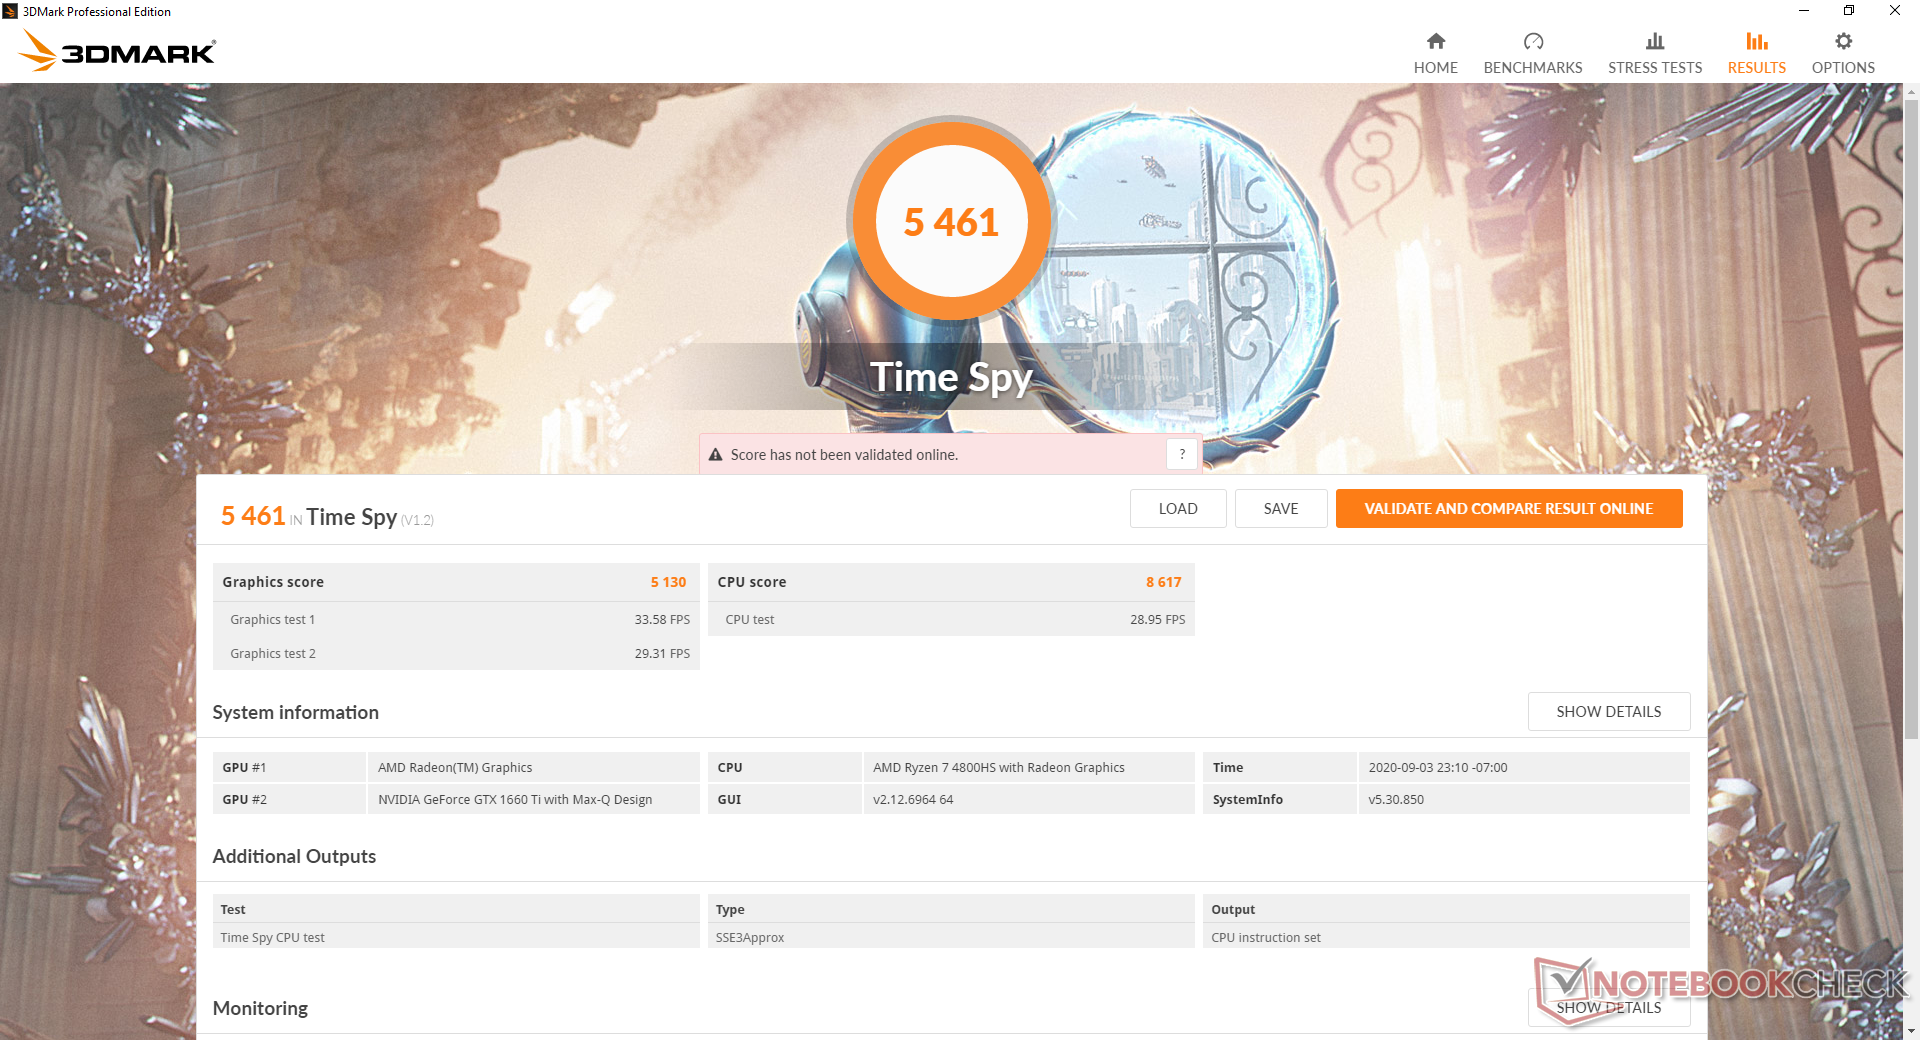
| 3DMark Time Spy Score | 5461 puan | |
Yardım | ||
Oyun Performansı
Radeon RX 5600M ile daha ucuz Dell G5 15 SE, çok daha yüksek güç tüketimi seviyelerinde de olsa oyun oynarken Asus'umuzdan yaklaşık yüzde 10 ila 20 daha hızlıdır. Kare hızları, DA502IU'muz aynı GPU'yu kullansa bile oyunun CPU yoğunluğuna bağlı olarak eski DA502DU'dan yüzde 5 ila 35 daha hızlı olabilir. Örneğin düşük 720p ayarlarında Metro Exodus, DA502IU'da yüzde 26 daha hızlıdır ve bu kesinlikle yüksek yenileme hızı ekranından en iyi şekilde yararlanmaya yardımcı olacaktır.
| düşük | orta | yüksek | ultra | |
|---|---|---|---|---|
| The Witcher 3 (2015) | 257.5 | 166.5 | 94.5 | 51.3 |
| Dota 2 Reborn (2015) | 119 | 112 | 106 | 103 |
| Final Fantasy XV Benchmark (2018) | 131 | 74.1 | 54.6 | |
| X-Plane 11.11 (2018) | 93.7 | 80.4 | 67.8 | |
| Shadow of the Tomb Raider (2018) | 113 | 85 | 75 | 67 |
| Metro Exodus (2019) | 129.5 | 66.5 | 49.1 | 38.3 |
| Borderlands 3 (2019) | 116.5 | 81.5 | 54.9 | 42.3 |
Emisyonlar
Sistem Gürültüsü
Fan gürültüsü, CPU öncekinden çok daha hızlı olmasına rağmen, GA502DU'daki ile hemen hemen aynıdır. Oyun, sistem Performans moduna veya Turbo moduna ayarlandığında, diğer birçok 15,6 inç oyun dizüstü bilgisayarından biraz daha yüksek bir fan gürültüsüne neden olur. Bu dizüstü bilgisayarda itme, istediğimizden daha sıktır. Güç Tasarrufu dışında herhangi bir güç profilindeyse, fanlar bazen görünüşte sebepsiz yere 33.3 dB (A) 'ya kadar titreşir. Güç Tasarrufu açıkken, çok sık veya yüksek sesle olmasa da darbe oluşur. Her iki durumda da, Razer Blade 15 gibi dizüstü bilgisayarlar fan davranışını Asus'umuzdan daha iyi idare ediyor.
| Asus ROG Zephyrus G15 GA502IU-ES76 GeForce GTX 1660 Ti Max-Q, R7 4800HS, Intel SSD 660p 1TB SSDPEKNW010T8 | Asus ROG Zephyrus Duo 15 GX550LXS GeForce RTX 2080 Super Max-Q, i9-10980HK, 2x Samsung PM981a MZVLB1T0HBLR (RAID 0) | Asus ROG Zephyrus G15 GA502DU GeForce GTX 1660 Ti Max-Q, R7 3750H, Intel SSD 660p SSDPEKNW512G8 | Razer Blade 15 RTX 2070 Super Max-Q GeForce RTX 2070 Super Max-Q, i7-10875H, Samsung SSD PM981a MZVLB512HBJQ | Lenovo Legion 5 15IMH05H GeForce RTX 2060 Mobile, i5-10300H, Samsung PM991 MZALQ512HALU | MSI GS66 Stealth 10SE-045 GeForce RTX 2060 Mobile, i7-10750H, Samsung SSD PM981 MZVLB1T0HALR | Eluktronics RP-15 GeForce RTX 2060 Mobile, R7 4800H, Phison PM81000GPMQCN28BTF-E12S4 M.2 NVM SSD | |
|---|---|---|---|---|---|---|---|
| Noise | -12% | -7% | -0% | -3% | -9% | -3% | |
| kapalı / ortam * (dB) | 26.3 | 30 -14% | 28 -6% | 27 -3% | 30.7 -17% | 25 5% | 28 -6% |
| Idle Minimum * (dB) | 26.7 | 33 -24% | 29.4 -10% | 27 -1% | 30.7 -15% | 29 -9% | 28 -5% |
| Idle Average * (dB) | 26.7 | 34 -27% | 31.9 -19% | 27 -1% | 30.7 -15% | 30 -12% | 28 -5% |
| Idle Maximum * (dB) | 31.9 | 35 -10% | 33 -3% | 27 15% | 30.7 4% | 40 -25% | 31.5 1% |
| Load Average * (dB) | 38.9 | 48 -23% | 41.2 -6% | 44.7 -15% | 36.6 6% | 51 -31% | 44 -13% |
| Witcher 3 ultra * (dB) | 51 | 48 6% | 53.8 -5% | 51.2 -0% | 47 8% | 48 6% | 48.8 4% |
| Load Maximum * (dB) | 54.9 | 49 11% | 55.7 -1% | 54 2% | 50.9 7% | 54 2% | 54.1 1% |
* ... daha küçük daha iyidir
Ses yüksekliği
| Boşta |
| 26.7 / 26.7 / 31.9 dB |
| Çalışırken |
| 38.9 / 54.9 dB |
 | ||
30 dB sessiz 40 dB(A) duyulabilirlik 50 dB(A) gürültülü |
||
min: | ||
Sıcaklık
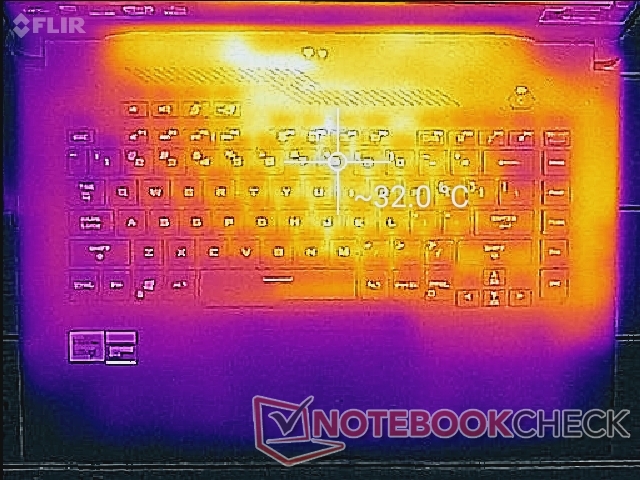
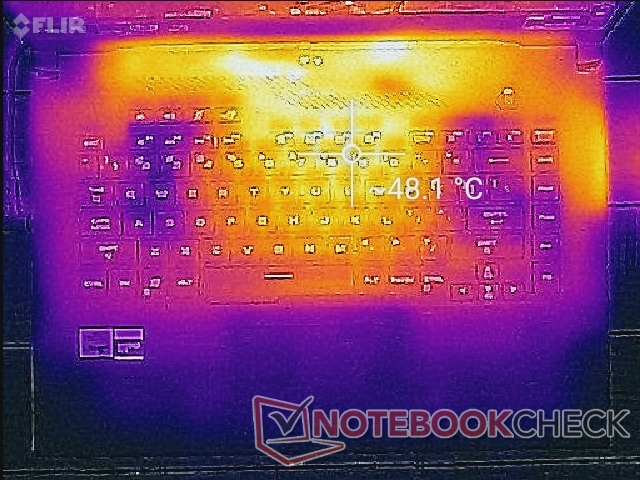
Daha hızlı ve daha yeni nesil Ryzen 7 CPU'ya rağmen yüzey sıcaklıkları geçen yılki GA502DU'dan belirgin şekilde daha sıcak değil. Kullanıcılar, herhangi bir önemli sıcaklık dezavantajına maruz kalmadan çok iş parçacıklı performansın 2 katından fazlasını elde ediyorlar.Razer Blade 15 ile karşılaştırıldığında, oyun oynarken her dizüstü bilgisayarda yaklaşık 50 C sıcaklıkta sıcak noktalar yaklaşık aynıdır, ancak avuç içi Razer sistemine dayanır. çok daha sıcak hale gelir.
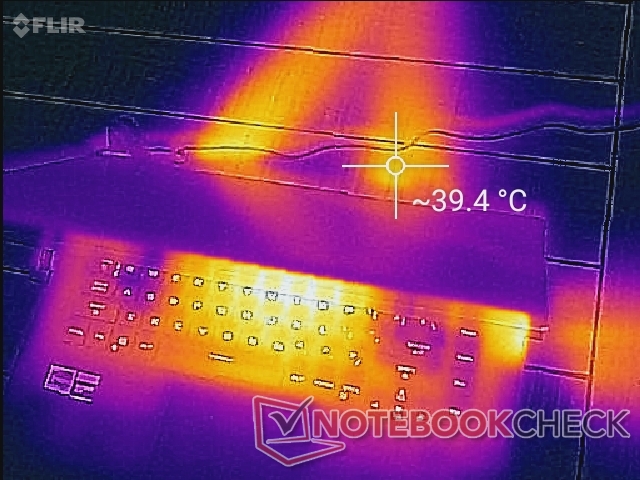
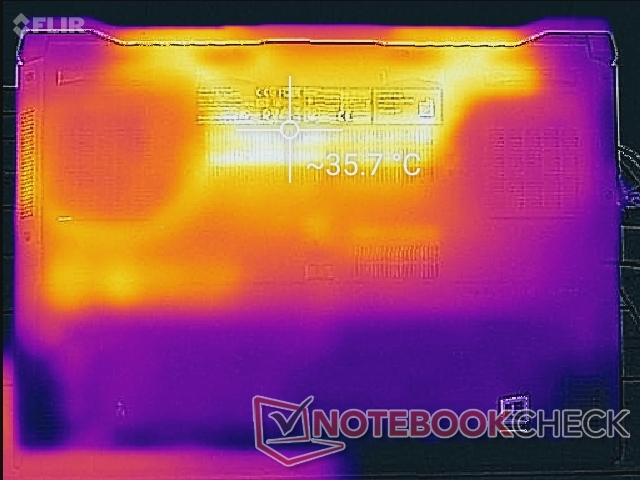
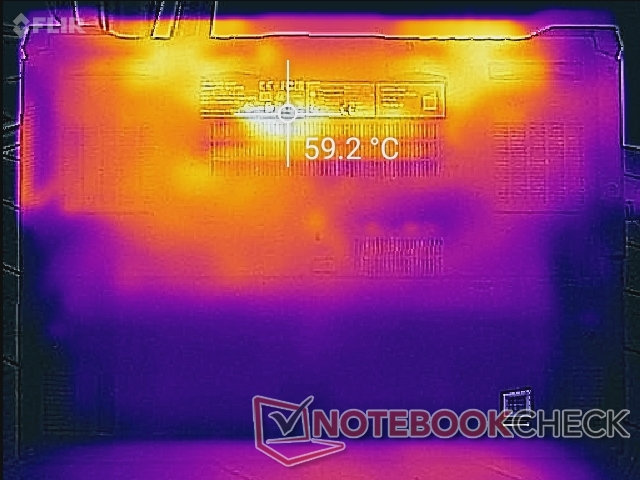
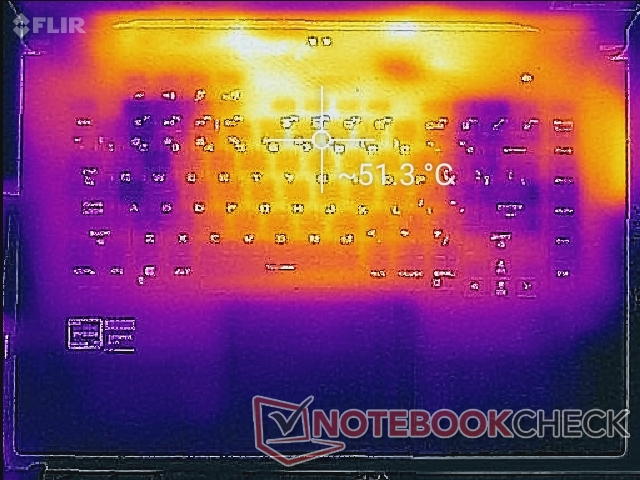
(-) Üst taraftaki maksimum sıcaklık, 40.4 °C / 105 F ortalamasına kıyasla 52.2 °C / 126 F'dir. , Gaming sınıfı için 21.2 ile 68.8 °C arasında değişir.
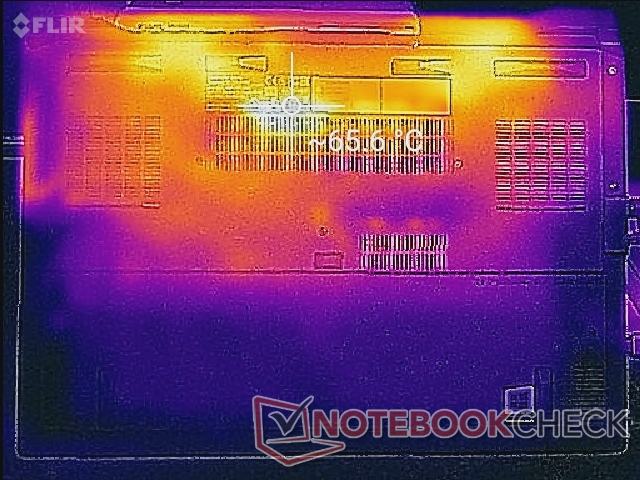
(-) Alt kısım, 43.2 °C / 110 F ortalamasına kıyasla maksimum 65 °C / 149 F'ye kadar ısınır
(+) Boşta kullanımda, üst tarafın ortalama sıcaklığı 27.2 °C / 81 F olup, cihazın 33.9 °C / 93 F.
(±) The Witcher 3 oynarken, üst tarafın ortalama sıcaklığı 35.8 °C / 96 F olup, cihazın 33.9 °C / 93 F.
(+) Avuç içi dayanakları ve dokunmatik yüzey, maksimum 25.4 °C / 77.7 F ile cilt sıcaklığından daha soğuktur ve bu nedenle dokunulduğunda soğuktur.
(+) Benzer cihazların avuç içi dayanağı alanının ortalama sıcaklığı 28.8 °C / 83.8 F (+3.4 °C / 6.1 F) idi.
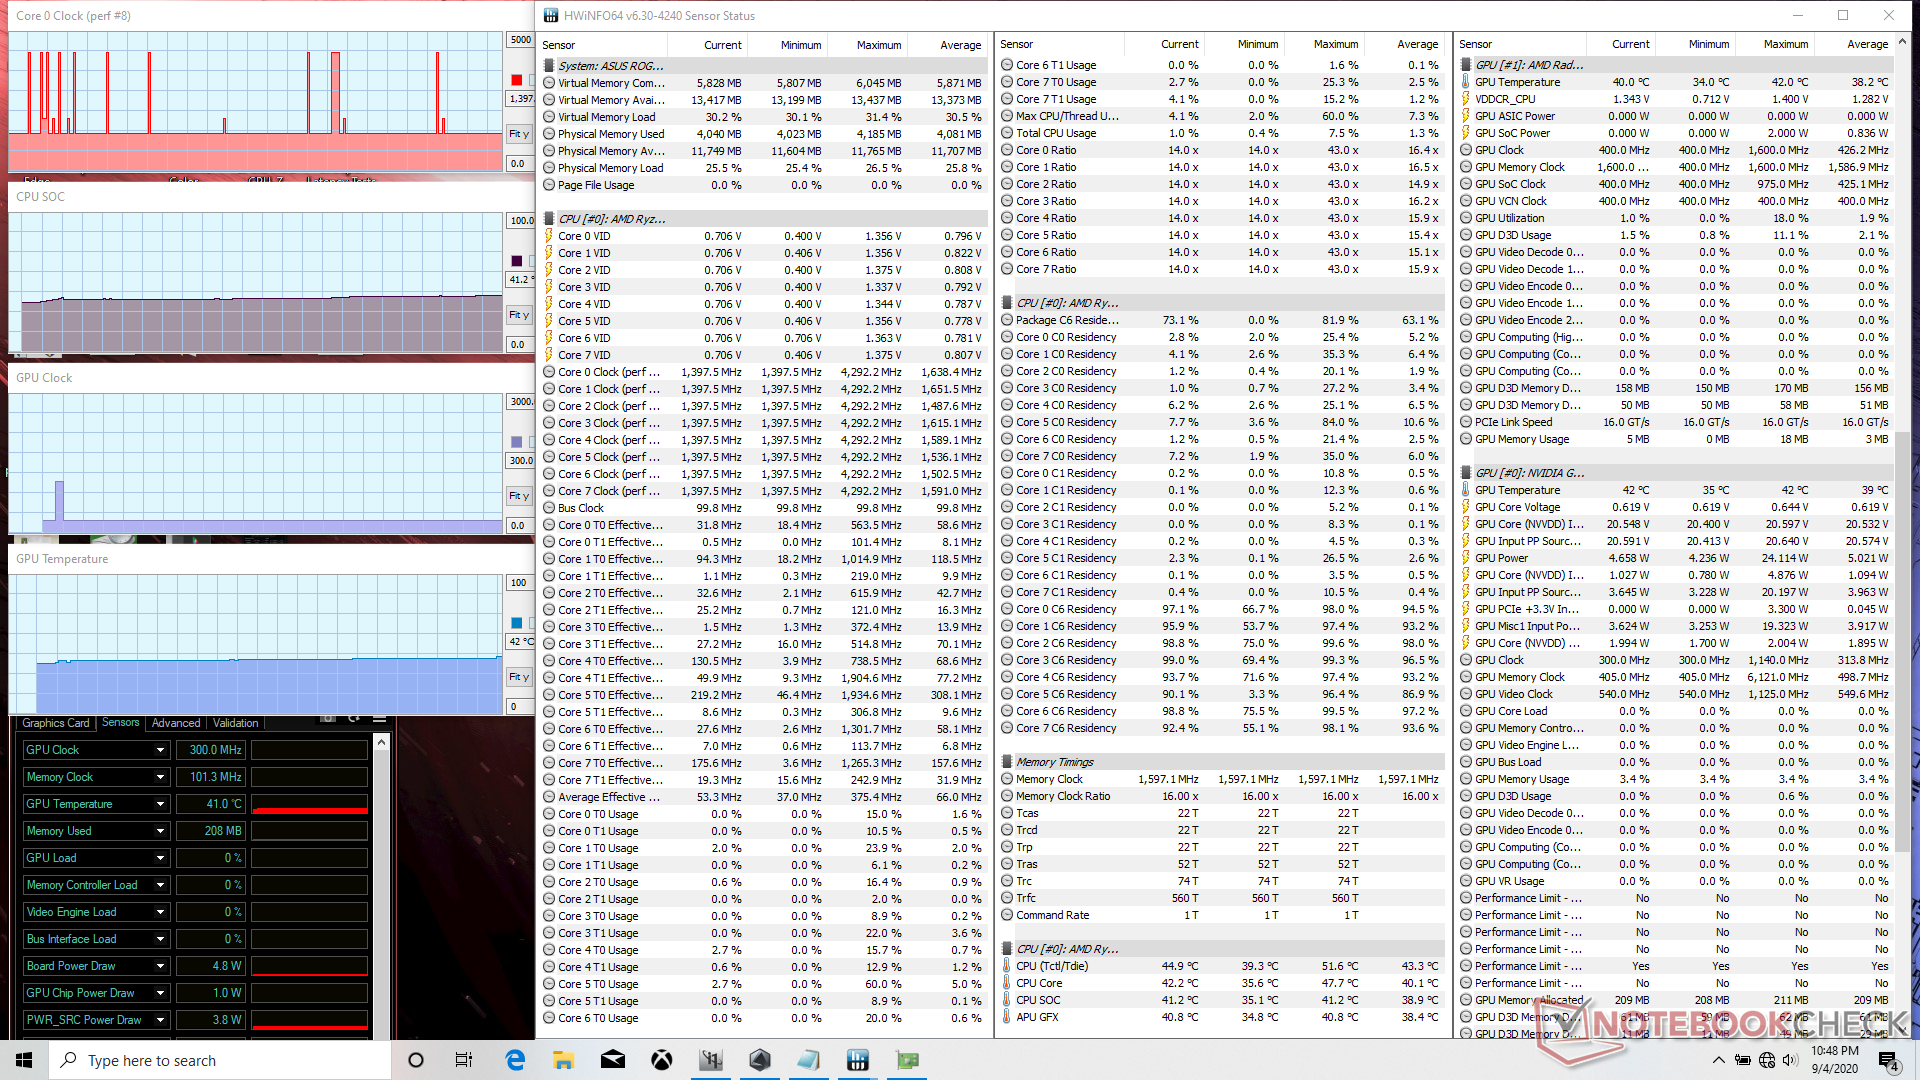
Stres testi
Prime95'i CPU'yu zorlamak için çalıştırırken, saat hızları, birkaç dakika boyunca 3,7 GHz ve 73 C'de sabitlenene kadar sadece birkaç saniye için 4,1 GHz'e yükselir. Ancak çekirdek sıcaklığı 79 ° C'ye ulaştığında, çekirdek sıcaklığı 74 ° C'yi korumak için saat hızları 3.3 ila 3.4 GHz aralığına daha da düşecektir. Bu davranış, yukarıdaki CineBench döngü testi sonuçlarımızla eşleşir. Prime95 ve FurMark'ı aynı anda çalıştırırken CPU sıcaklığı 88 C'de maksimuma çıkar. Witcher 3 çalıştırılırken, geçen yılki DA502DU'daki 74 C ve 71 C ile karşılaştırıldığında, CPU ve GPU sıcaklıkları sırasıyla 77 C ve 75 C'de sabitlenir.
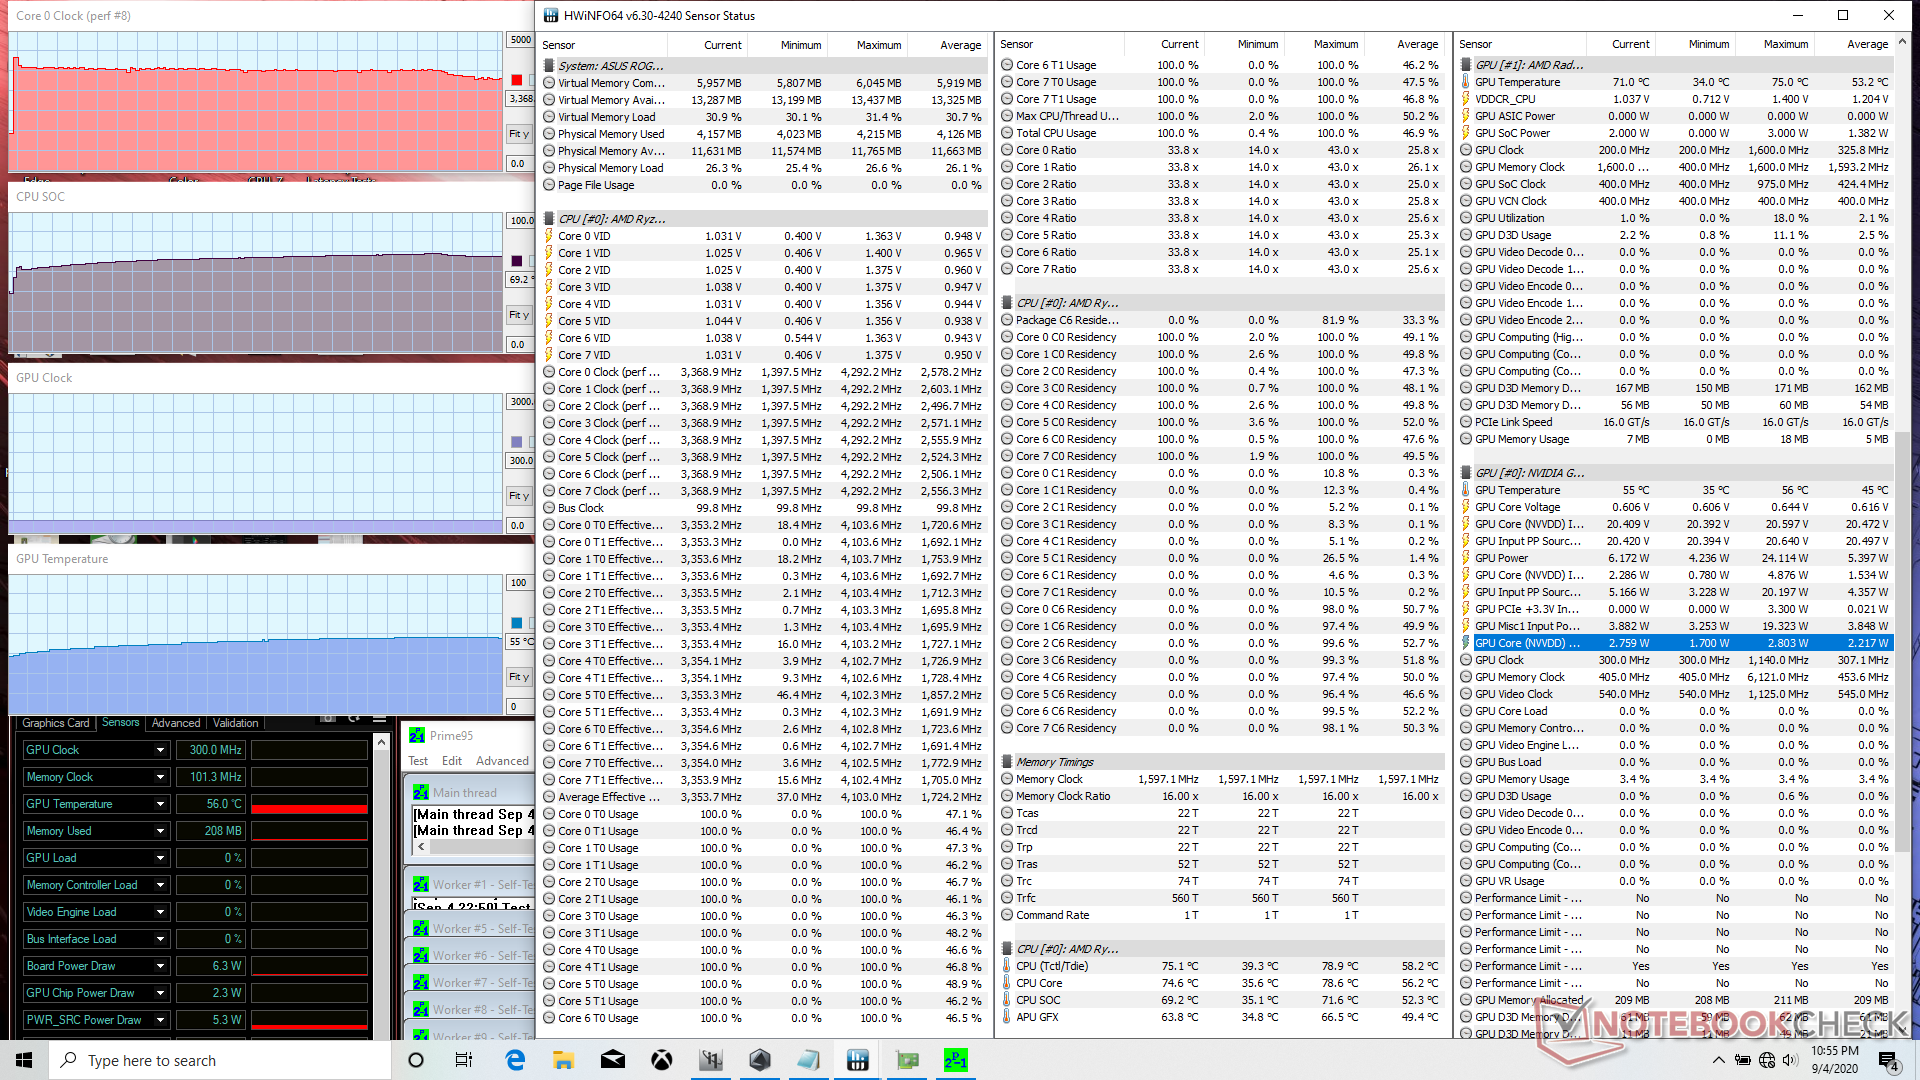
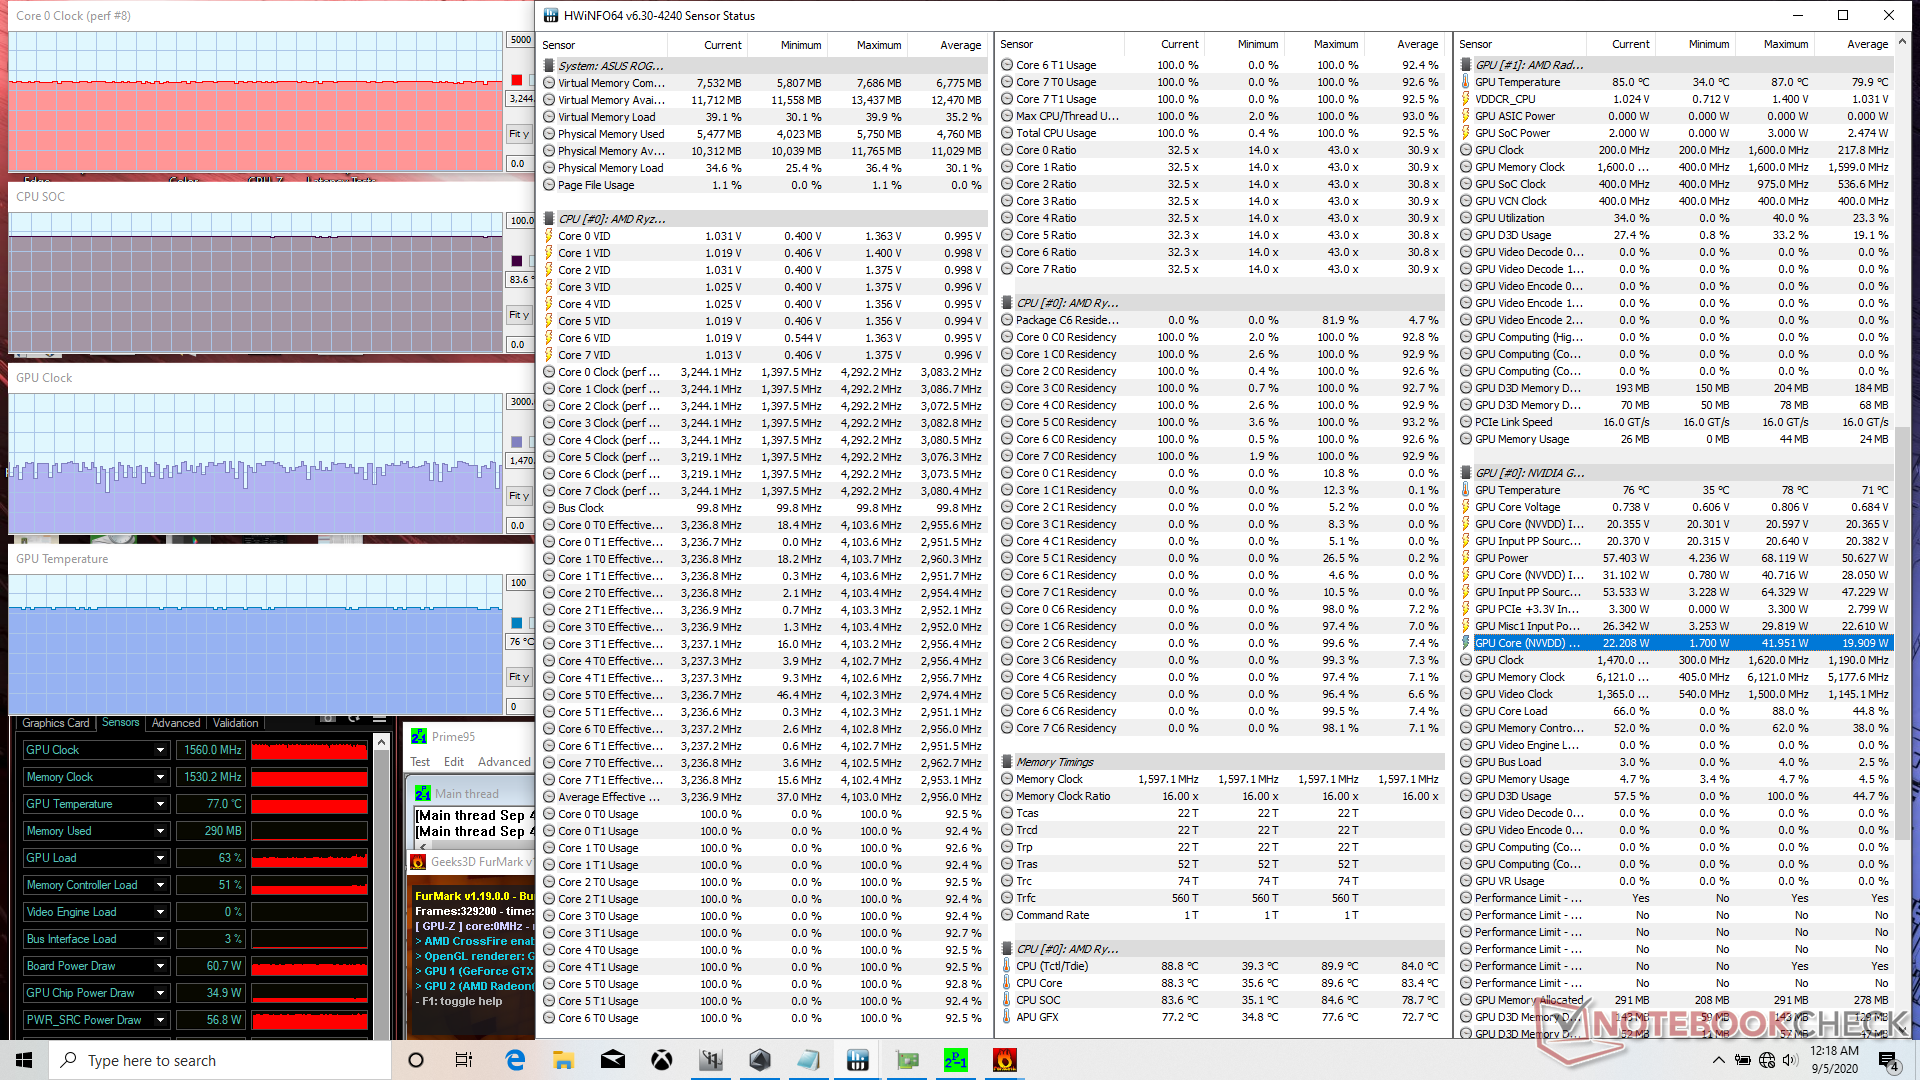

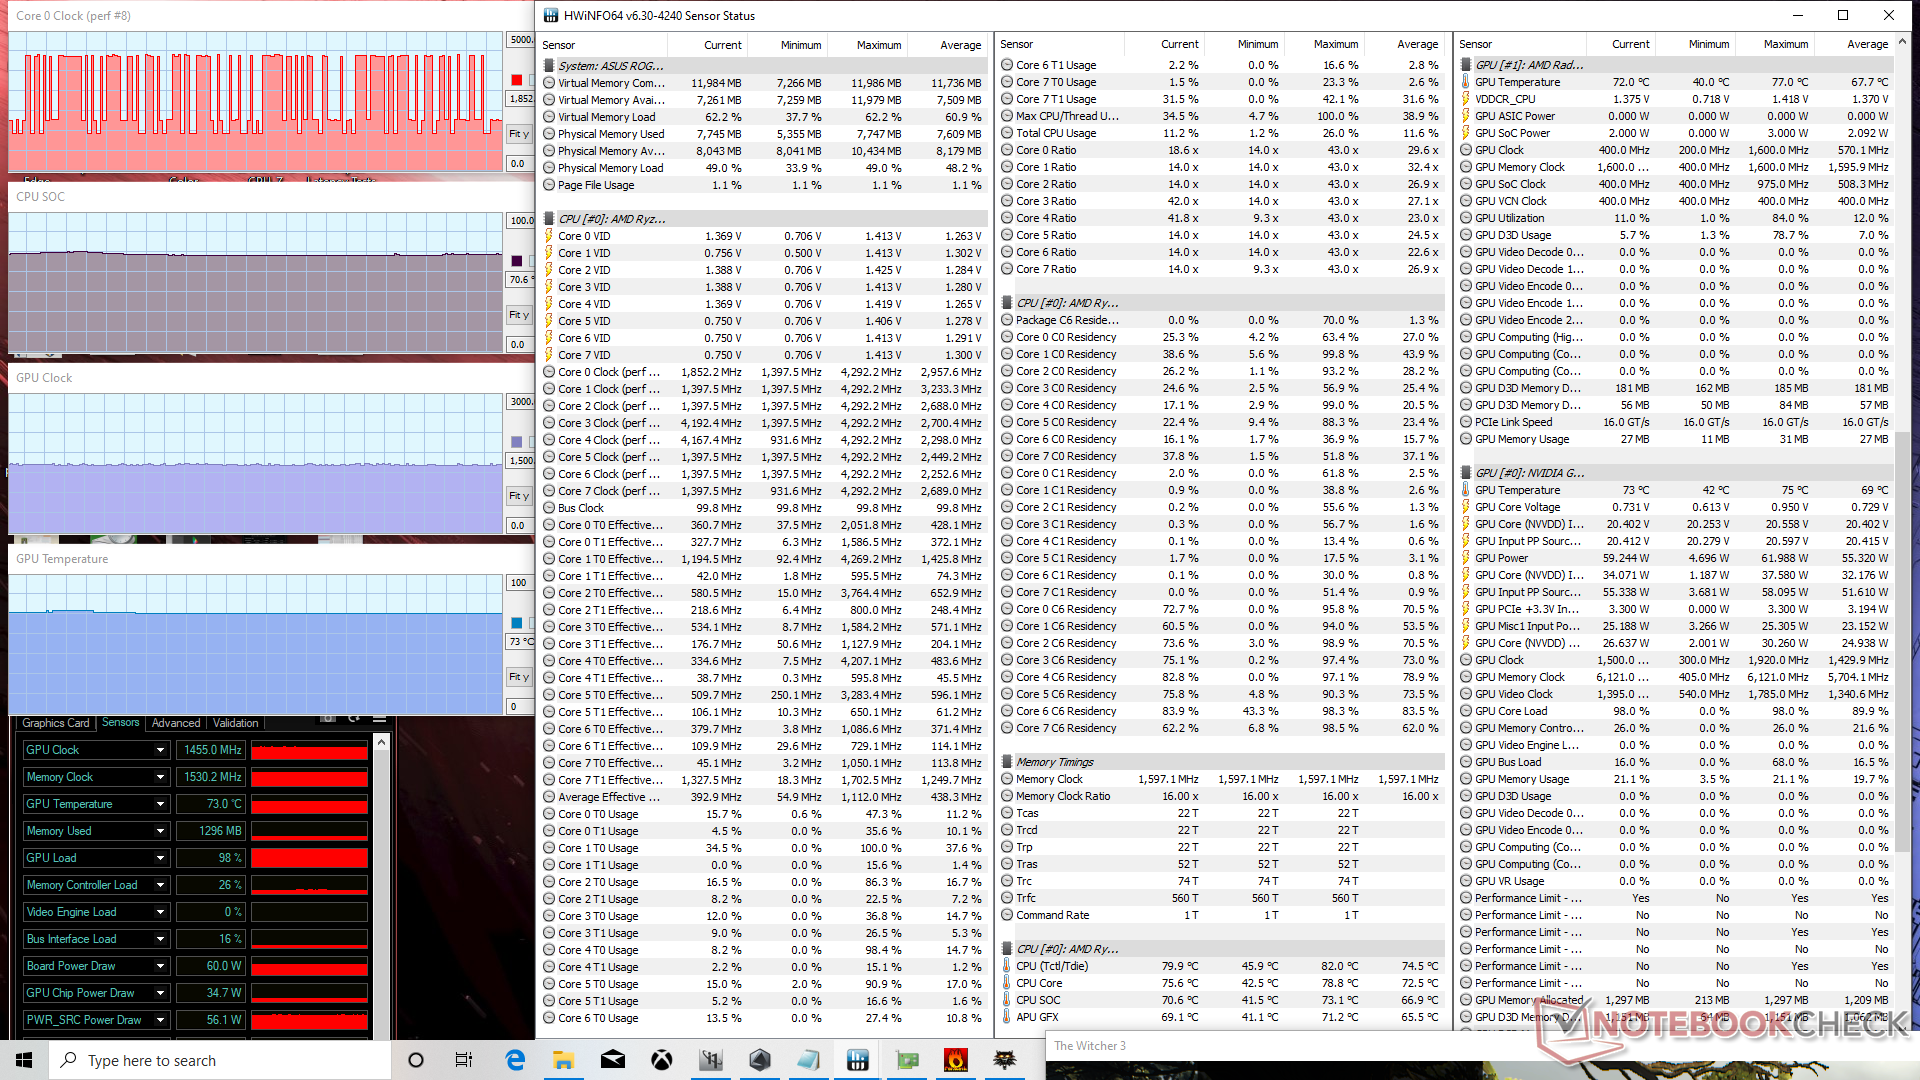
| CPU Clock (GHz) | GPU Clock (MHz) | Average CPU Temperature (°C) | Average GPU Temperature (°C) | |
| System Idle | -- | -- | 42 | 42 |
| Prime95 Stress | 3.3 - 3.4 | -- | 74 | 55 |
| Prime95 + FurMark Stress | 3.2 | 860 - 1560 | 88 | 76 |
| Witcher 3 Stress (Performance mode) | 1.8 - 4.2 | 1410 | 77 | 75 |
| Witcher 3 Stress (Turbo mode) | 1.8 - 4.2 | 1455 | 76 | 73 |
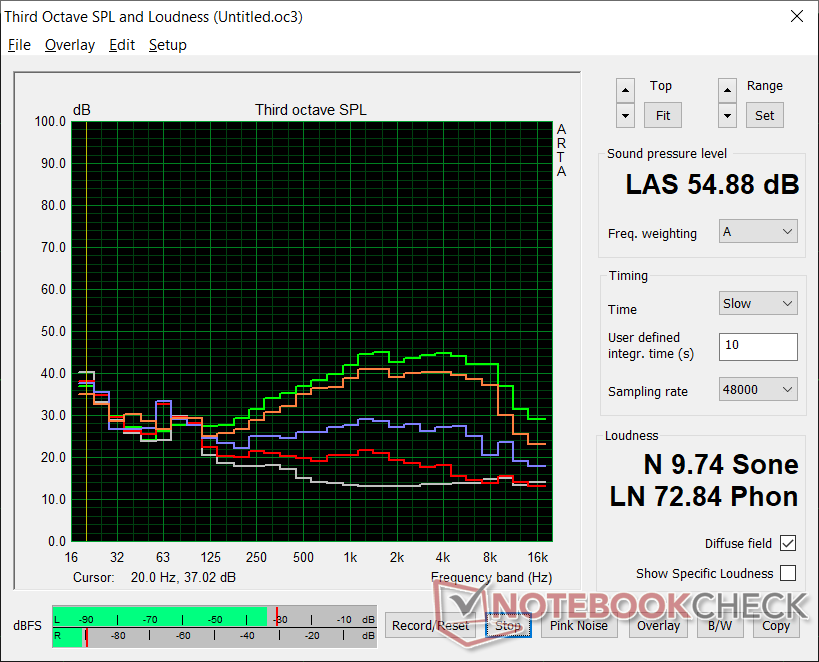
Hoparlörler


Asus ROG Zephyrus G15 GA502IU-ES76 ses analizi
(±) | hoparlör ses yüksekliği ortalama ama iyi (81 dB)
Bas 100 - 315Hz
(±) | azaltılmış bas - ortalama olarak medyandan 5.9% daha düşük
(±) | Bas doğrusallığı ortalamadır (11.4% delta - önceki frekans)
Ortalar 400 - 2000 Hz
(+) | dengeli ortalar - medyandan yalnızca 2.2% uzakta
(+) | orta frekanslar doğrusaldır (4% deltadan önceki frekansa)
Yüksekler 2 - 16 kHz
(±) | daha yüksek en yüksekler - ortalama olarak medyandan 6.5% daha yüksek
(+) | yüksekler doğrusaldır (6.5% deltadan önceki frekansa)
Toplam 100 - 16.000 Hz
(+) | genel ses doğrusaldır (13.1% ortancaya göre fark)
Aynı sınıfla karşılaştırıldığında
» Bu sınıftaki tüm test edilen cihazların %18%'si daha iyi, 4% benzer, 78% daha kötüydü
» En iyisinin deltası 6% idi, ortalama 18% idi, en kötüsü 132% idi
Test edilen tüm cihazlarla karşılaştırıldığında
» Test edilen tüm cihazların %13'si daha iyi, 3 benzer, % 84 daha kötüydü
» En iyisinin deltası 4% idi, ortalama 24% idi, en kötüsü 134% idi
Apple MacBook 12 (Early 2016) 1.1 GHz ses analizi
(+) | hoparlörler nispeten yüksek sesle çalabilir (83.6 dB)
Bas 100 - 315Hz
(±) | azaltılmış bas - ortalama olarak medyandan 11.3% daha düşük
(±) | Bas doğrusallığı ortalamadır (14.2% delta - önceki frekans)
Ortalar 400 - 2000 Hz
(+) | dengeli ortalar - medyandan yalnızca 2.4% uzakta
(+) | orta frekanslar doğrusaldır (5.5% deltadan önceki frekansa)
Yüksekler 2 - 16 kHz
(+) | dengeli yüksekler - medyandan yalnızca 2% uzakta
(+) | yüksekler doğrusaldır (4.5% deltadan önceki frekansa)
Toplam 100 - 16.000 Hz
(+) | genel ses doğrusaldır (10.2% ortancaya göre fark)
Aynı sınıfla karşılaştırıldığında
» Bu sınıftaki tüm test edilen cihazların %7%'si daha iyi, 2% benzer, 91% daha kötüydü
» En iyisinin deltası 5% idi, ortalama 18% idi, en kötüsü 53% idi
Test edilen tüm cihazlarla karşılaştırıldığında
» Test edilen tüm cihazların %5'si daha iyi, 1 benzer, % 94 daha kötüydü
» En iyisinin deltası 4% idi, ortalama 24% idi, en kötüsü 134% idi
Enerji yönetimi
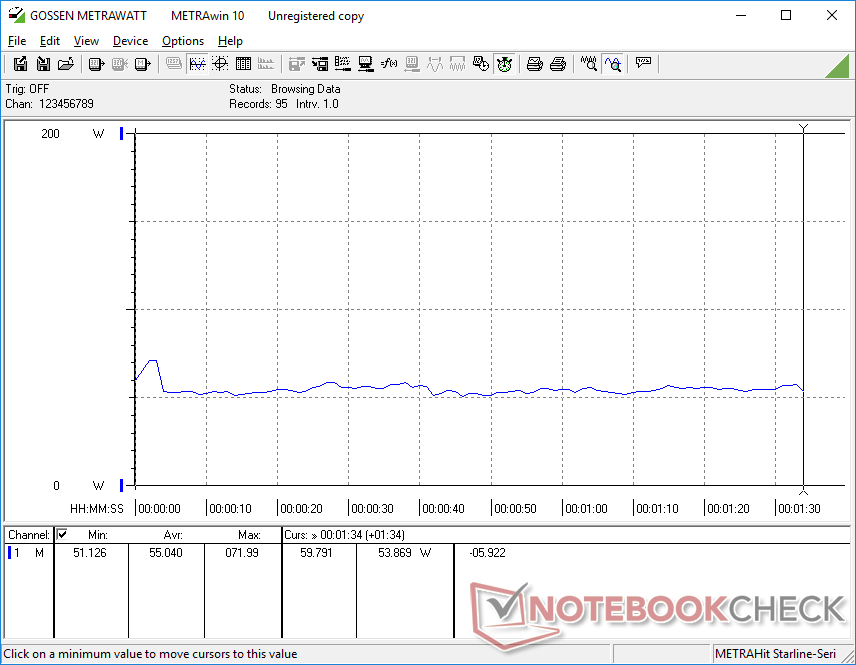
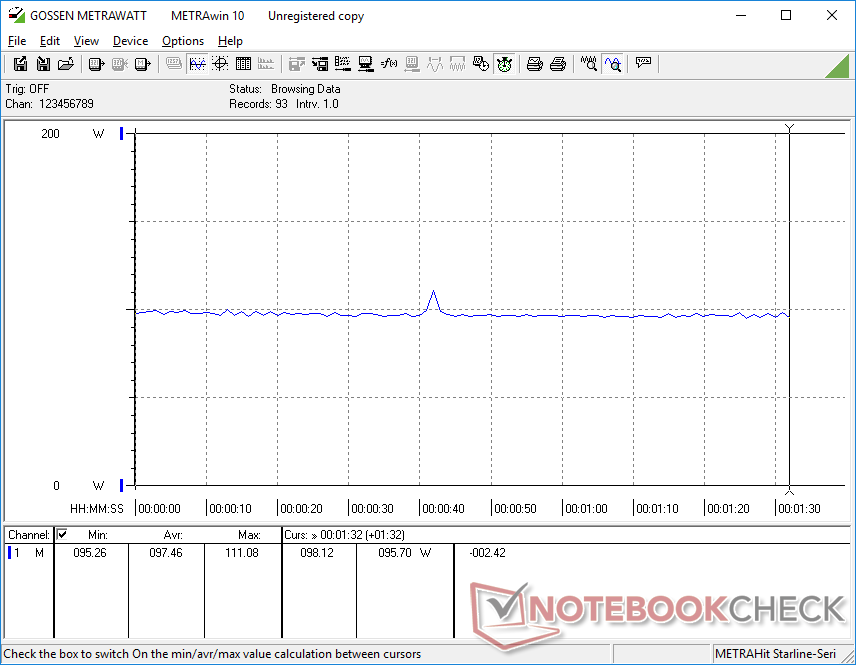
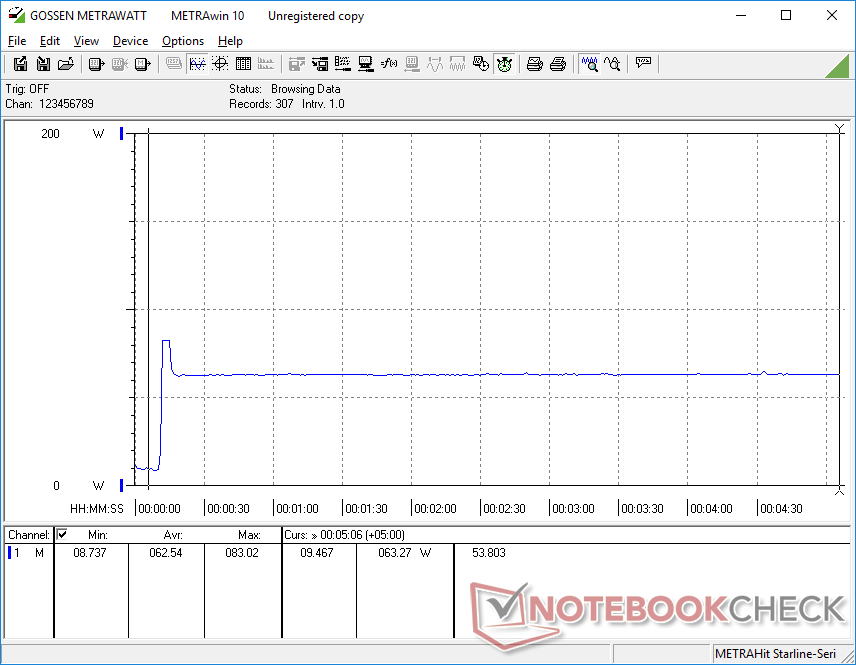
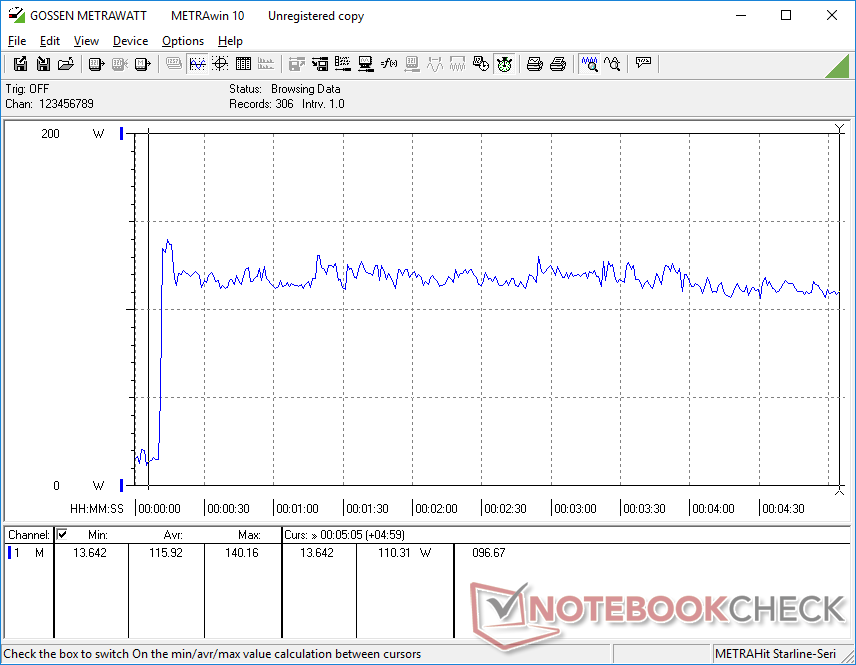
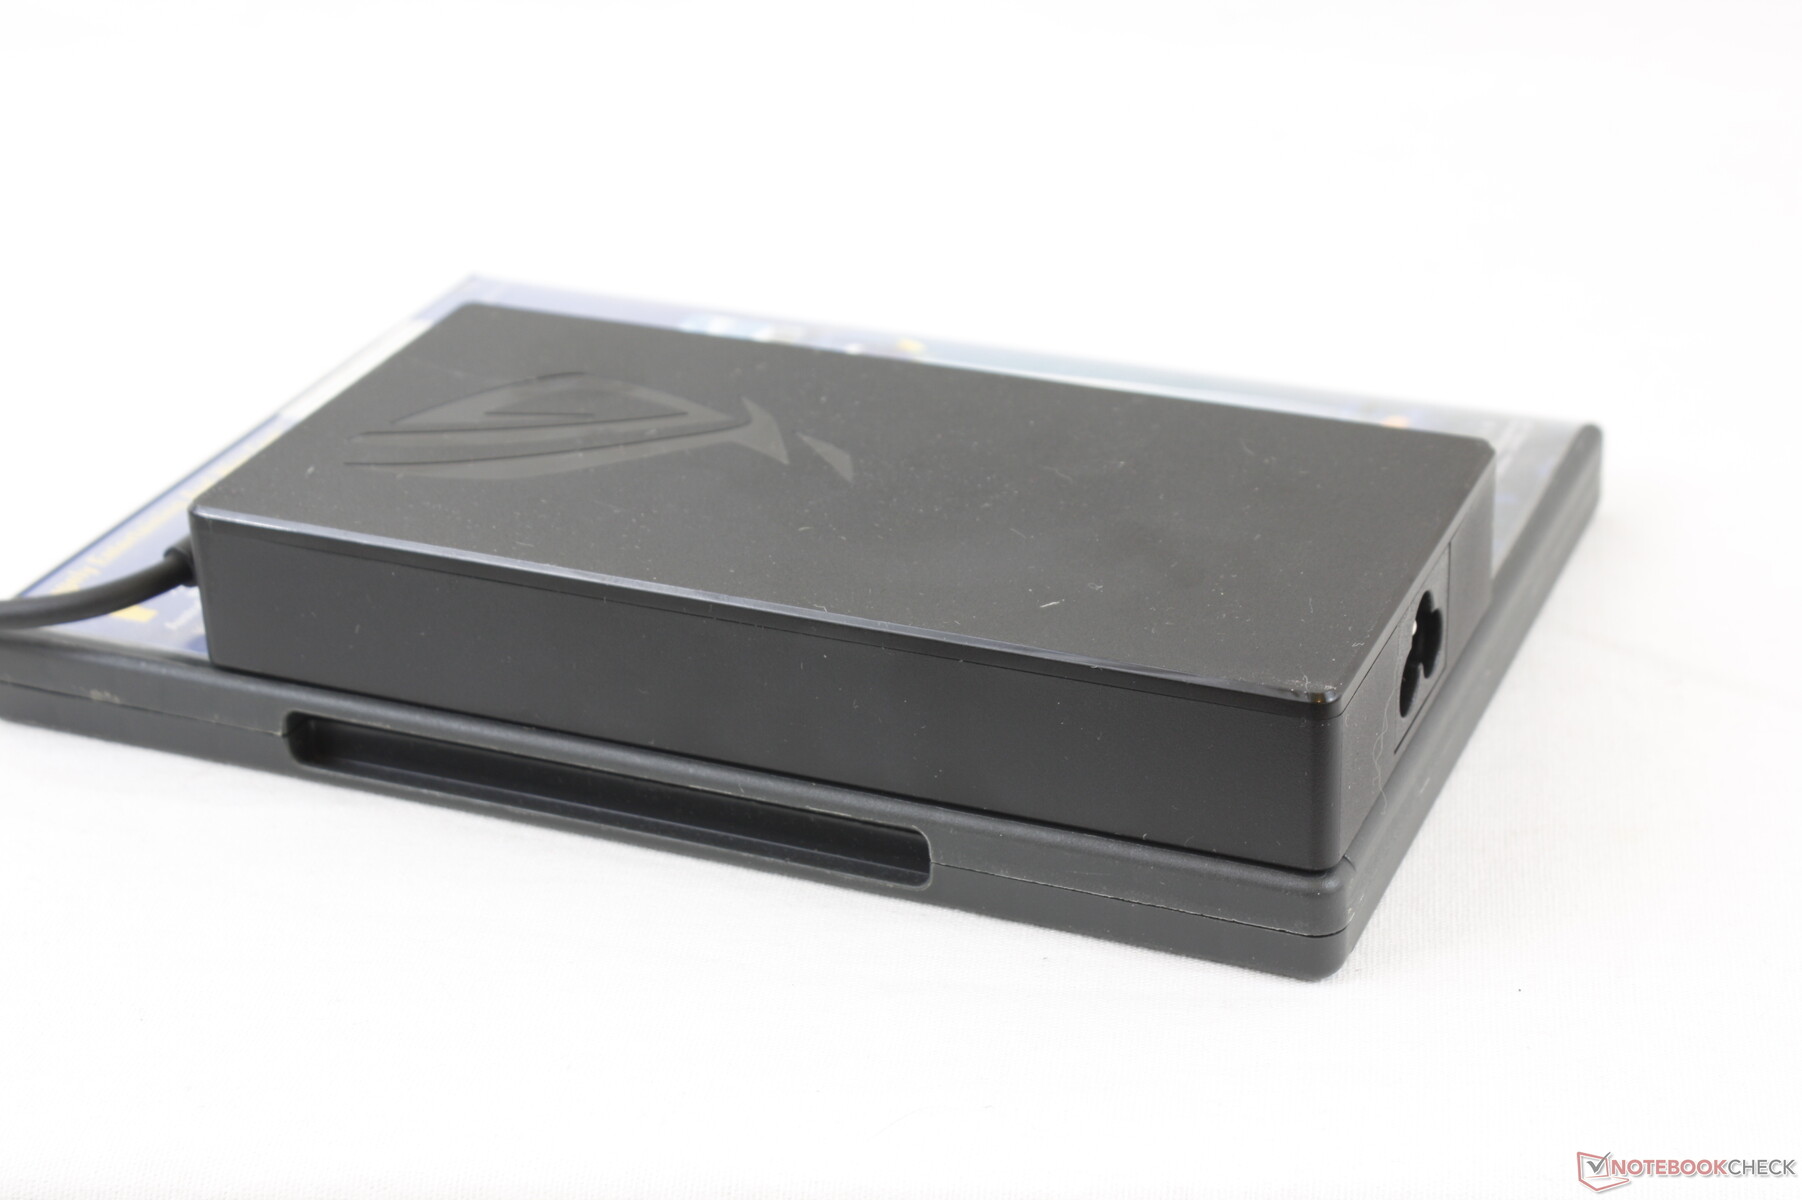
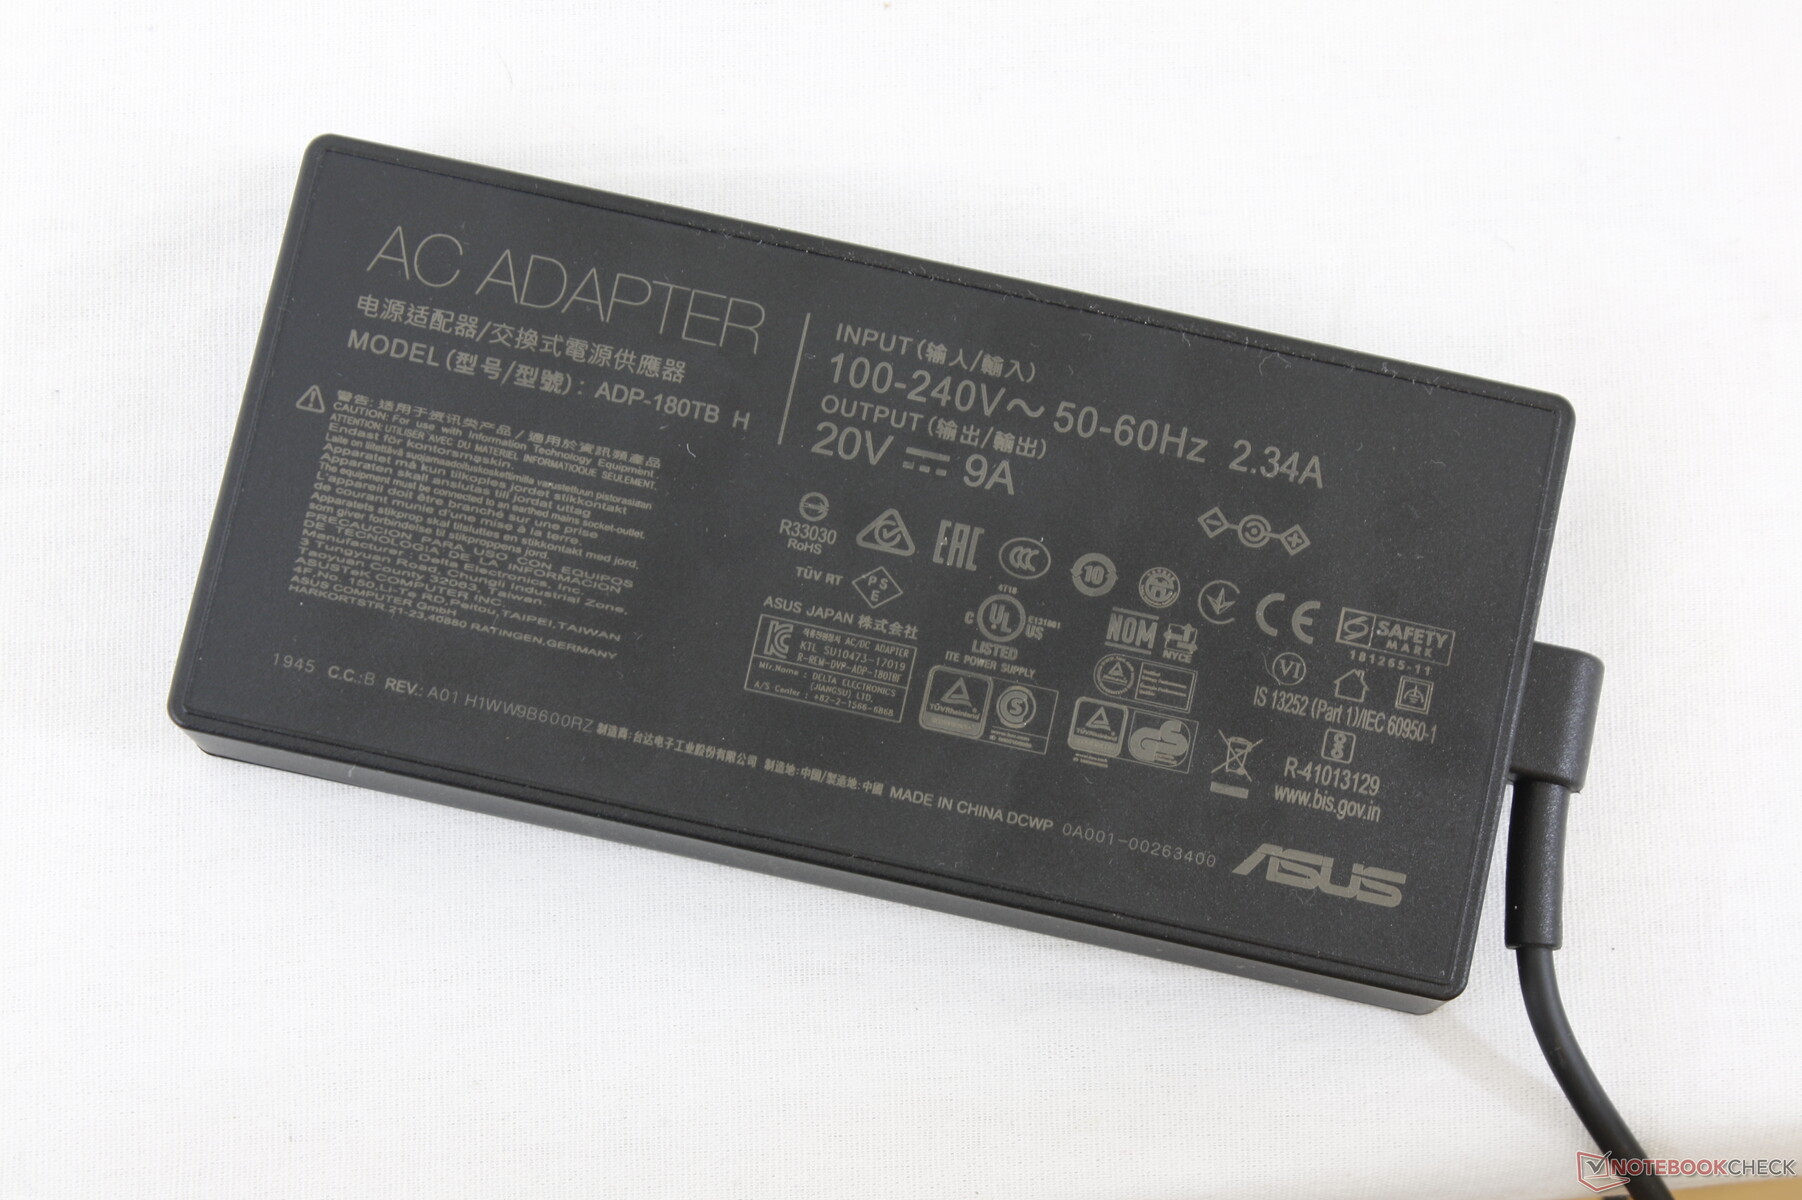
Güç tüketimi
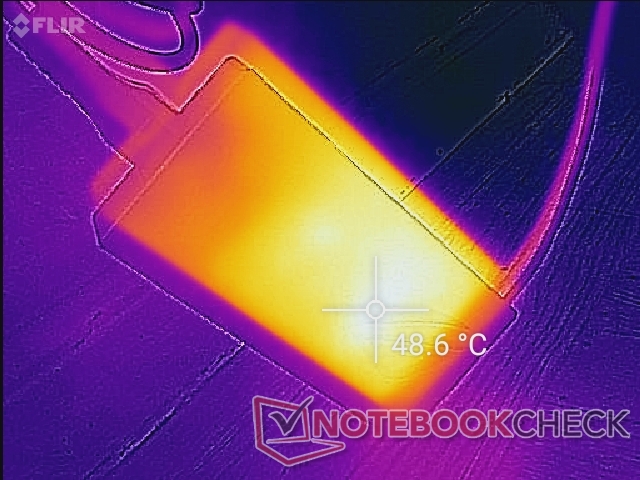
Masaüstünde boşta çalışma, eski GA502DU'da 7 W ve 39 W ile karşılaştırıldığında yalnızca 5 W ile 10 W arasında veya daha güçlü Eluktronics RP-15'te 21 W ile 35 W arasında tüketir. Oyunları temsil etmek için Witcher 3'ü çalıştırmak, tüketim yukarıda bahsedilen GA502DU ve RP-15'ten sırasıyla yaklaşık yüzde 8 ve yüzde 27 daha düşük olduğundan, bu sistemin ne kadar güç verimli olabileceğini gösteriyor. Core i7 ve RTX 2060 grafik kartıyla desteklenen oyun dizüstü bilgisayarları, oyun performansı anlamında GA502IU'muzdaki ~ 50 W tasarruftan oyun performansındaki yüzde 15'lik daha küçük düşüşe göre önemli olduğunda yaklaşık 140 W ila 150 W tüketir. küçük-orta (~ 15,1 x 7,1 x 2,3 cm) 180 W AC adaptöründen maksimum 140,2 W çekiş. Bu maksimum, termal sınırlamalar nedeniyle aşağıdaki grafiklerimizde gösterildiği gibi zamanla yaklaşık 110 W'a düşer. Oyun oynarken şarj oranı etkilenmez.
| Kapalı / Bekleme modu | |
| Boşta | |
| Çalışırken |
|
Key:
min: | |
| Asus ROG Zephyrus G15 GA502IU-ES76 R7 4800HS, GeForce GTX 1660 Ti Max-Q, Intel SSD 660p 1TB SSDPEKNW010T8, IPS, 1920x1080, 15.6" | Asus ROG Zephyrus Duo 15 GX550LXS i9-10980HK, GeForce RTX 2080 Super Max-Q, 2x Samsung PM981a MZVLB1T0HBLR (RAID 0), IPS, 3840x2160, 15.6" | Asus ROG Zephyrus G15 GA502DU R7 3750H, GeForce GTX 1660 Ti Max-Q, Intel SSD 660p SSDPEKNW512G8, IPS, 1920x1080, 15.6" | Razer Blade 15 RTX 2070 Super Max-Q i7-10875H, GeForce RTX 2070 Super Max-Q, Samsung SSD PM981a MZVLB512HBJQ, IPS, 1920x1080, 15.6" | Lenovo Legion 5 15IMH05H i5-10300H, GeForce RTX 2060 Mobile, Samsung PM991 MZALQ512HALU, IPS, 1920x1080, 15.6" | MSI GS66 Stealth 10SE-045 i7-10750H, GeForce RTX 2060 Mobile, Samsung SSD PM981 MZVLB1T0HALR, IPS, 1920x1080, 15.6" | Eluktronics RP-15 R7 4800H, GeForce RTX 2060 Mobile, Phison PM81000GPMQCN28BTF-E12S4 M.2 NVM SSD, IPS, 1920x1080, 15.6" | |
|---|---|---|---|---|---|---|---|
| Power Consumption | -204% | -68% | -147% | -17% | -95% | -176% | |
| Idle Minimum * (Watt) | 5.1 | 23 -351% | 7.4 -45% | 14.3 -180% | 3.2 37% | 7 -37% | 21.7 -325% |
| Idle Average * (Watt) | 8.4 | 30 -257% | 8.6 -2% | 22.3 -165% | 8.3 1% | 18 -114% | 30.1 -258% |
| Idle Maximum * (Watt) | 9.1 | 39 -329% | 39.1 -330% | 36.9 -305% | 8.7 4% | 31 -241% | 35 -285% |
| Load Average * (Watt) | 55.1 | 156 -183% | 65.9 -20% | 118.4 -115% | 82 -49% | 107 -94% | 112.6 -104% |
| Witcher 3 ultra * (Watt) | 97.5 | 152 -56% | 106.9 -10% | 153.7 -58% | 151 -55% | 146 -50% | 134.4 -38% |
| Load Maximum * (Watt) | 140.2 | 208 -48% | 141.3 -1% | 220.8 -57% | 195 -39% | 186 -33% | 201.5 -44% |
* ... daha küçük daha iyidir
Pil ömrü
Çalışma süreleri, yukarıda bahsedilen daha yüksek güç verimliliğine rağmen geçen yıl GA502DU'da kaydettiğimizden daha kötü. Kullanıcılar, Dengeli güç profilindeyken iGPU için Optimus etkinken 5 saatin biraz üzerinde gerçek dünya WLAN kullanımını bekleyebilirler. Sonuçların neden beklediğimiz gibi olmadığından emin değiliz, ancak suçu önceden ayarlanmış Windows güç profilleriyle çakışabilecek kafa karıştırıcı Asus güç profillerine atmak istiyoruz. 2 saat. Sistem aynı zamanda USB-C ile de şarj edilebilir.
| Asus ROG Zephyrus G15 GA502IU-ES76 R7 4800HS, GeForce GTX 1660 Ti Max-Q, 76 Wh | Asus ROG Zephyrus Duo 15 GX550LXS i9-10980HK, GeForce RTX 2080 Super Max-Q, 90 Wh | Asus ROG Zephyrus G15 GA502DU R7 3750H, GeForce GTX 1660 Ti Max-Q, 76 Wh | Razer Blade 15 RTX 2070 Super Max-Q i7-10875H, GeForce RTX 2070 Super Max-Q, 80 Wh | Lenovo Legion 5 15IMH05H i5-10300H, GeForce RTX 2060 Mobile, 60 Wh | MSI GS66 Stealth 10SE-045 i7-10750H, GeForce RTX 2060 Mobile, 99.9 Wh | Eluktronics RP-15 R7 4800H, GeForce RTX 2060 Mobile, 46.7 Wh | |
|---|---|---|---|---|---|---|---|
| Pil Çalışma Süresi | -22% | 59% | 19% | 36% | 4% | -32% | |
| Reader / Idle (h) | 7.1 | 8 13% | 15.3 115% | 14.1 99% | 9 27% | ||
| WiFi v1.3 (h) | 5.3 | 3.1 -42% | 8 51% | 6.3 19% | 7.2 36% | 6.4 21% | 3.6 -32% |
| Load (h) | 1.9 | 1.2 -37% | 2.1 11% | 1.4 -26% | 1.2 -37% |
Artılar
Eksiler
Karar

Hiç şüphe yok ki, Zephyrus G15 GA502IU işlemci beygir gücü açısından GA502DU'ya göre çok büyük bir gelişme. Watt başına performans, 7 nm Ryzen CPU ve GeForce Max-Q GPU'nun birleşimi nedeniyle şaşırtıcı iken, kasa hem küçük hem de fiyat açısından cazip. Acer Nitro 5, MSI GL / GF serisi, Dell G serisi veya Aorus G serisi gibi bütçe rakipleriyle karşı karşıya kaldığınızda, Zephyrus G15 kesinlikle öne çıkacak. GA502IU'nun ana dezavantajları fiyatı ve ekranıdır. 1300 ABD Doları karşılığında, sistem aynı GeForce GTX 1660 Ti GPU'ya sahip diğer alternatiflerin çoğundan daha pahalıdır. Esasen yeni AMD CPU ve birçok uygun fiyatlı oyun dizüstü bilgisayarının sahip olmadığı şık kasa tasarımı için fazladan ödeme yapıyorsunuz. Bu arada, 144 Hz panelin ortalama renk alanı ve tepki süreleri biraz hayal kırıklığı yaratıyor. Üst düzey 240 Hz yapılandırma, sözde bu endişeleri giderir, ancak böyle bir seçenek, cüzdanınızdan daha fazlasını gerektirecektir. Bu, özellikle satışta bir tane bulabilirseniz, hala harika bir orta sınıf oyun dizüstü bilgisayarıdır. Asus Zephyrus G15 GA502IU, fiyat için yenilmesi zor çekici bir kasa tasarımında mükemmel işlemci performansı sunar. Bununla birlikte, grafik beygir gücü, klavye geri bildirimi, ekran yanıt süreleri ve renk doğruluğu biraz yetersiz kalıyor. Bu kadar harika bir işlemcinin şu anda diğer modellerde daha yaygın olarak bulunmaması utanç verici.
Asus ROG Zephyrus G15 GA502IU-ES76
- 09/10/2020 v7 (old)
Allen Ngo
Price comparison

