Razer Blade 18 2024 incelemesi: Hem mini LED hem de Thunderbolt 5 ile piyasaya çıkan ilk dizüstü bilgisayar
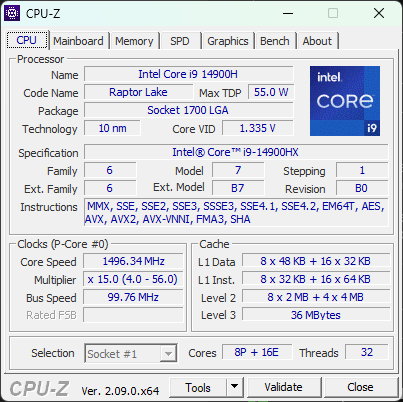
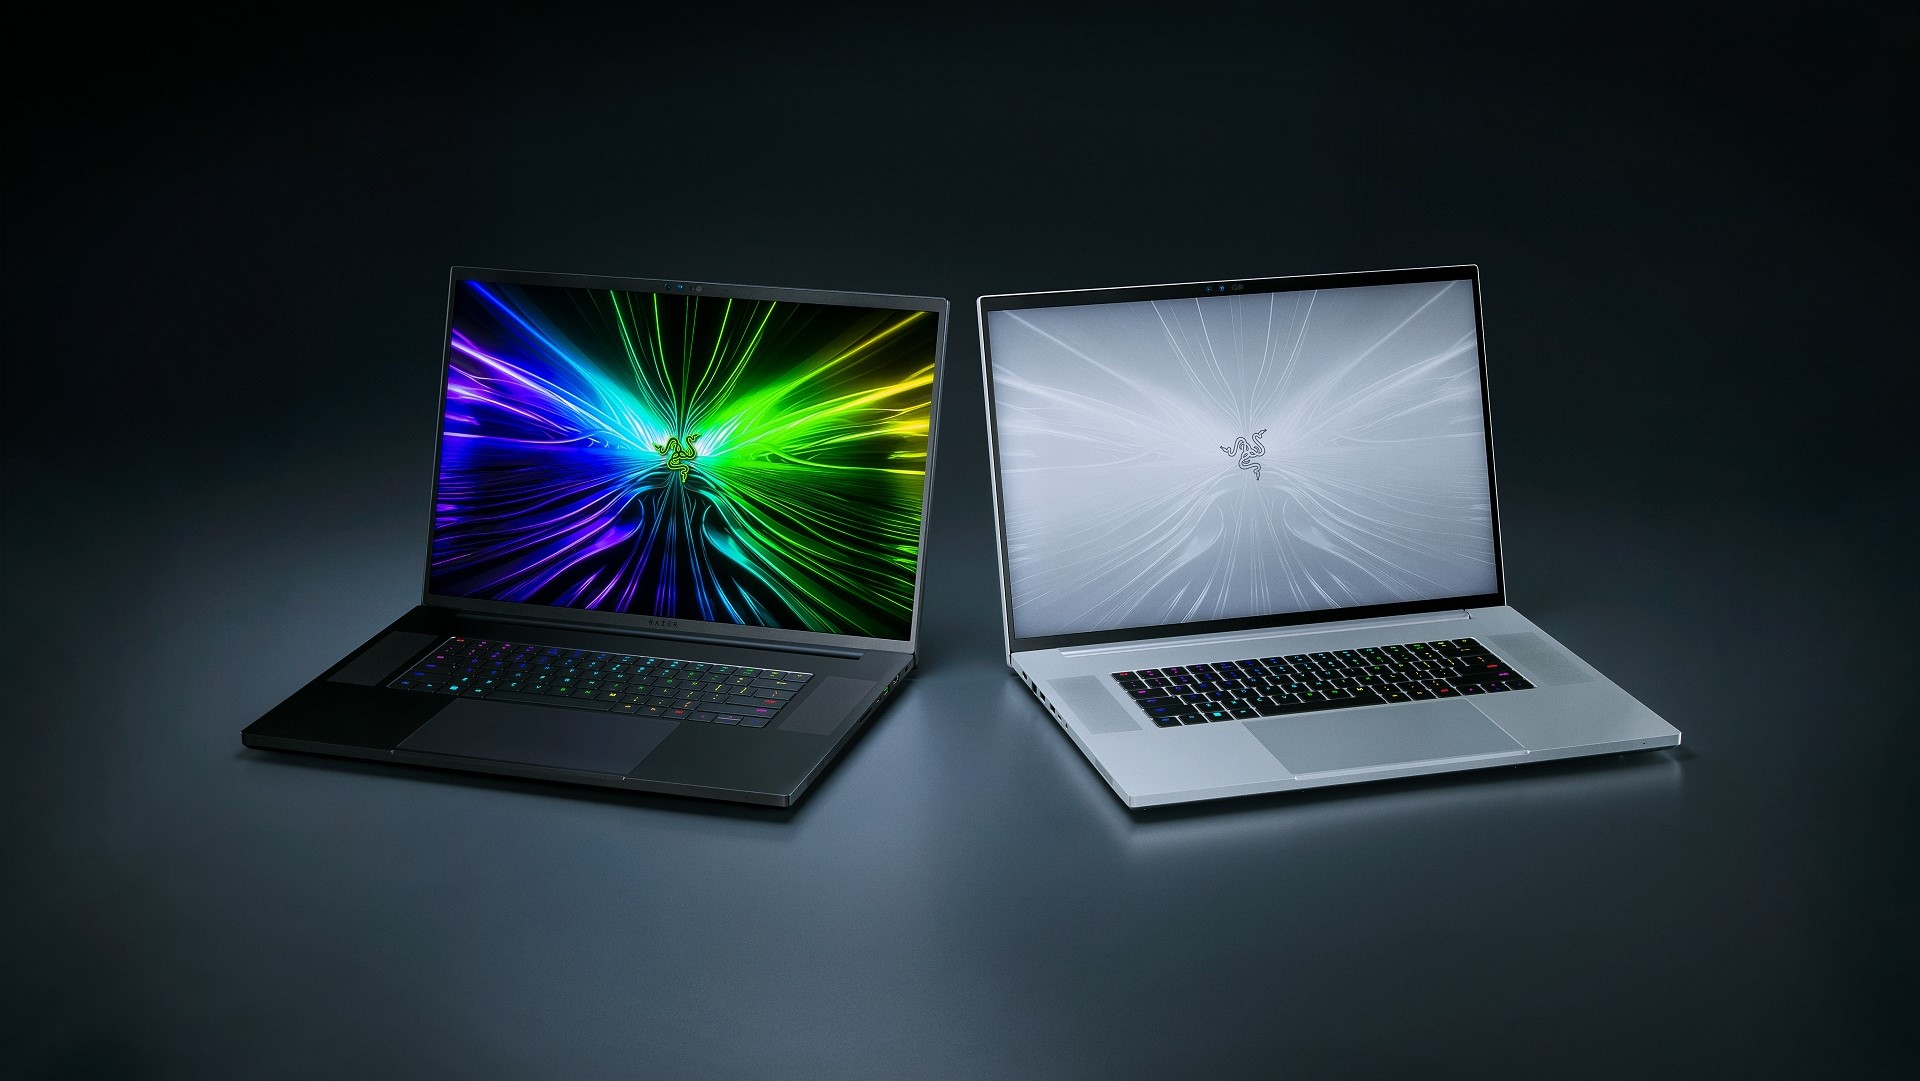
Razer Blade 18, yaşlanan Blade 17'den büyük ölçüde ilham alan bir tasarımla 2023'te piyasaya çıktı. 2024 için, en son revizyon, önceki yılla aynı kasa tasarımını kullanıyor, ancak performans avcılarını ve meraklılarını çekmek için ek üst düzey özellikler içeriyor. Bu yeni seçenekler arasında Core i9-14900HX Raptor Lake CPU, Thunderbolt 5 bağlantısı ve isteğe bağlı 4K 16:10 200 Hz IPS ekran yer alıyor. Özellikle son ikisi, önce Razer sisteminde, ardından da diğer üreticilerde görücüye çıkıyor.
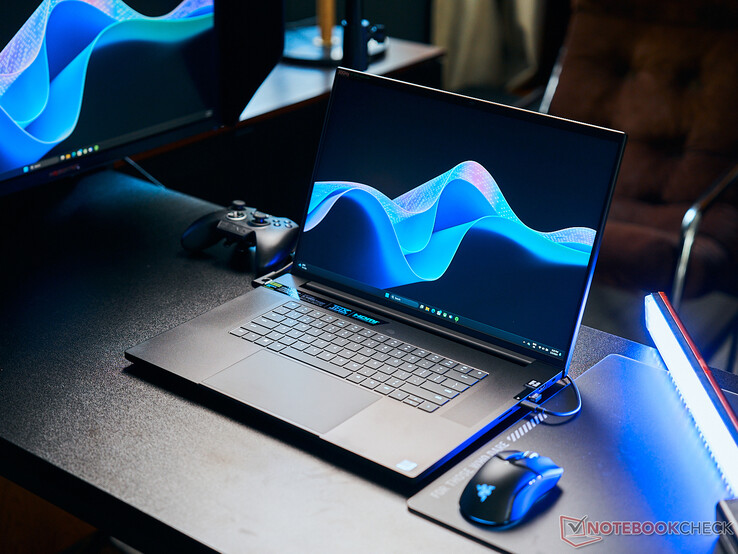
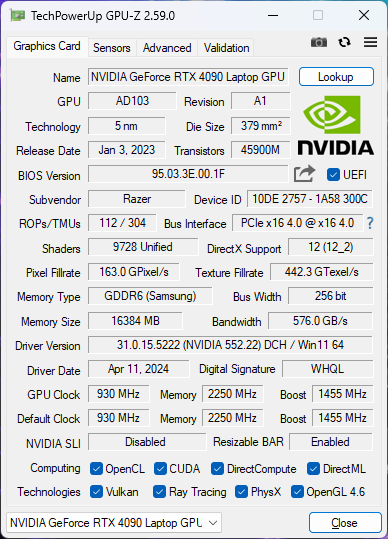
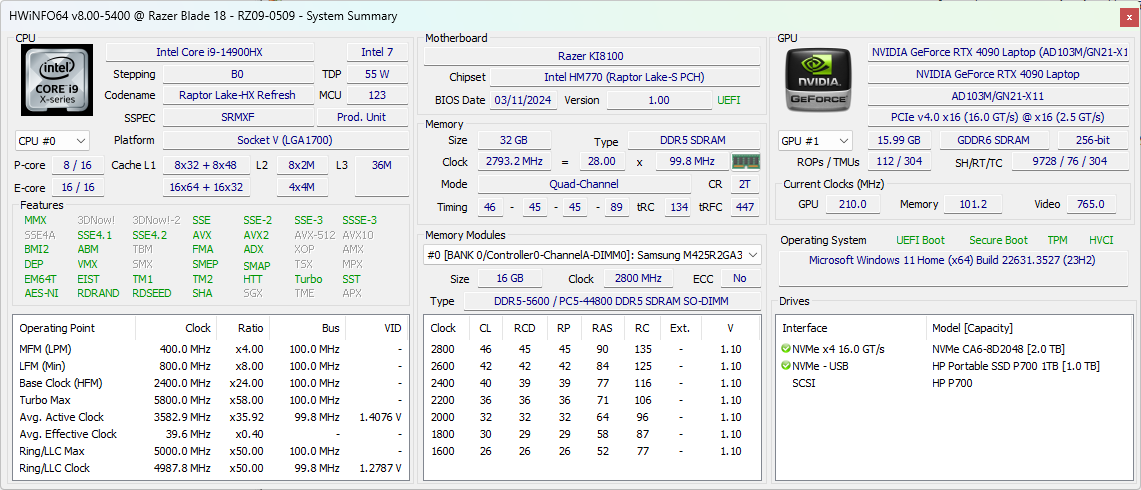
İnceleme konfigürasyonumuz 175 W GeForce RTX 4090 GPU, 2 TB SSD ve 2560 x 1600 300 Hz Mini-LED ekran ile yaklaşık 4500 USD'ye geliyor. Diğer SKU'lar GeForce RTX 4070/4080 veya yukarıda bahsedilen 4K 200 Hz IPS ekranla birlikte gönderilir, ancak şu anda tüm yapılandırmalar aynı Core i9-14900HX CPU ile birlikte gelir. Alternatif Mercury White rengi yalnızca belirli konfigürasyonlarda mevcuttur.
Blade 18'in küçük bir avuç dolusu rakibi var ve bunların arasında MSI Titan 18, Asus ROG Strix Scar 18, Acer Predator Helios 18ya da devasa Alienware m18 R2.
Daha fazla Razer incelemesi:
Karşılaştırmalı olarak olası rakipler
Derecelendirme | Tarih | Modeli | Ağırlık | Yükseklik | Boyut | Çözünürlük | Fiyat |
|---|---|---|---|---|---|---|---|
| 90.5 % v7 (old) | 05/2024 | Razer Blade 18 2024 RZ09-0509 i9-14900HX, GeForce RTX 4090 Laptop GPU | 3.1 kg | 21.9 mm | 18.00" | 2560x1600 | |
| 89.5 % v7 (old) | 03/2024 | Alienware m18 R2 i9-14900HX, GeForce RTX 4090 Laptop GPU | 4 kg | 26.7 mm | 18.00" | 2560x1600 | |
| 87.2 % v7 (old) | Asus ROG Strix Scar 17 G733PYV-LL053X R9 7945HX3D, GeForce RTX 4090 Laptop GPU | 2.9 kg | 28.3 mm | 17.30" | 2560x1440 | ||
| 88.8 % v7 (old) | 01/2024 | MSI Titan 18 HX A14VIG i9-14900HX, GeForce RTX 4090 Laptop GPU | 3.6 kg | 32.1 mm | 18.00" | 3840x2400 | |
| 88.3 % v7 (old) | 02/2024 | Asus ROG Strix Scar 18 G834JYR (2024) i9-14900HX, GeForce RTX 4090 Laptop GPU | 3.1 kg | 30.8 mm | 18.00" | 2560x1600 | |
| 91.1 % v7 (old) | 02/2024 | Razer Blade 16 2024, RTX 4090 i9-14900HX, GeForce RTX 4090 Laptop GPU | 2.5 kg | 22 mm | 16.00" | 2560x1600 |
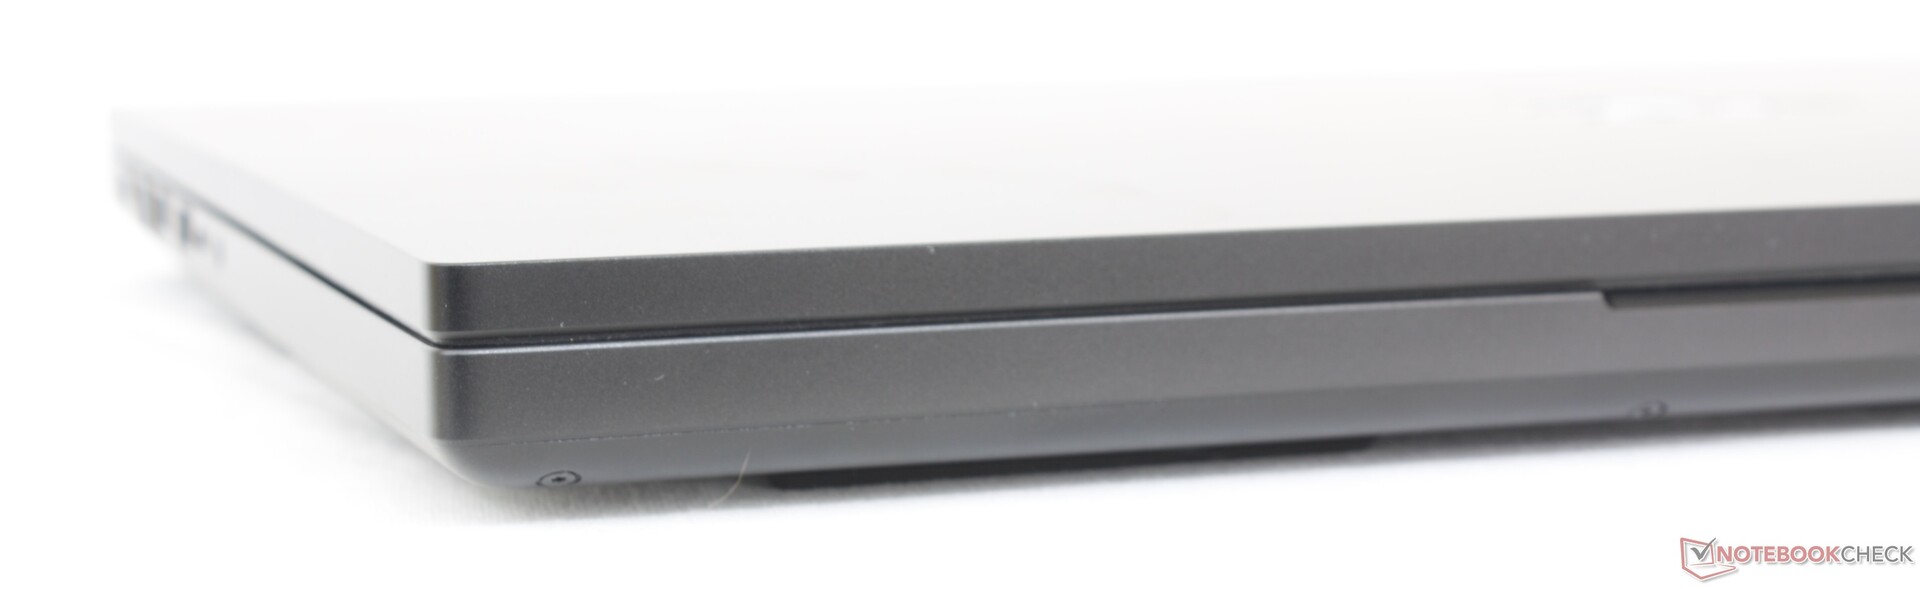
Case - Her Zamanki Gibi Keskin
Kontrol etmenizi öneririz 2023 Blade 18 hakkındaki incelememiz modelin fiziksel özellikleri hakkında daha fazla bilgi edinmek için tüm yorumlarımız 2024 versiyonu için hala geçerlidir. İki yılı birbirinden ayırmak için klavye veya kasada herhangi bir değişiklik olmasa da, aslında görsel olarak ayırt edilmelerine yardımcı olacak küçük bir ekleme var; 2024 modelinde artık manuel bir web kamerası kaydırıcısı bulunurken, 2023 modelinde yoktu.
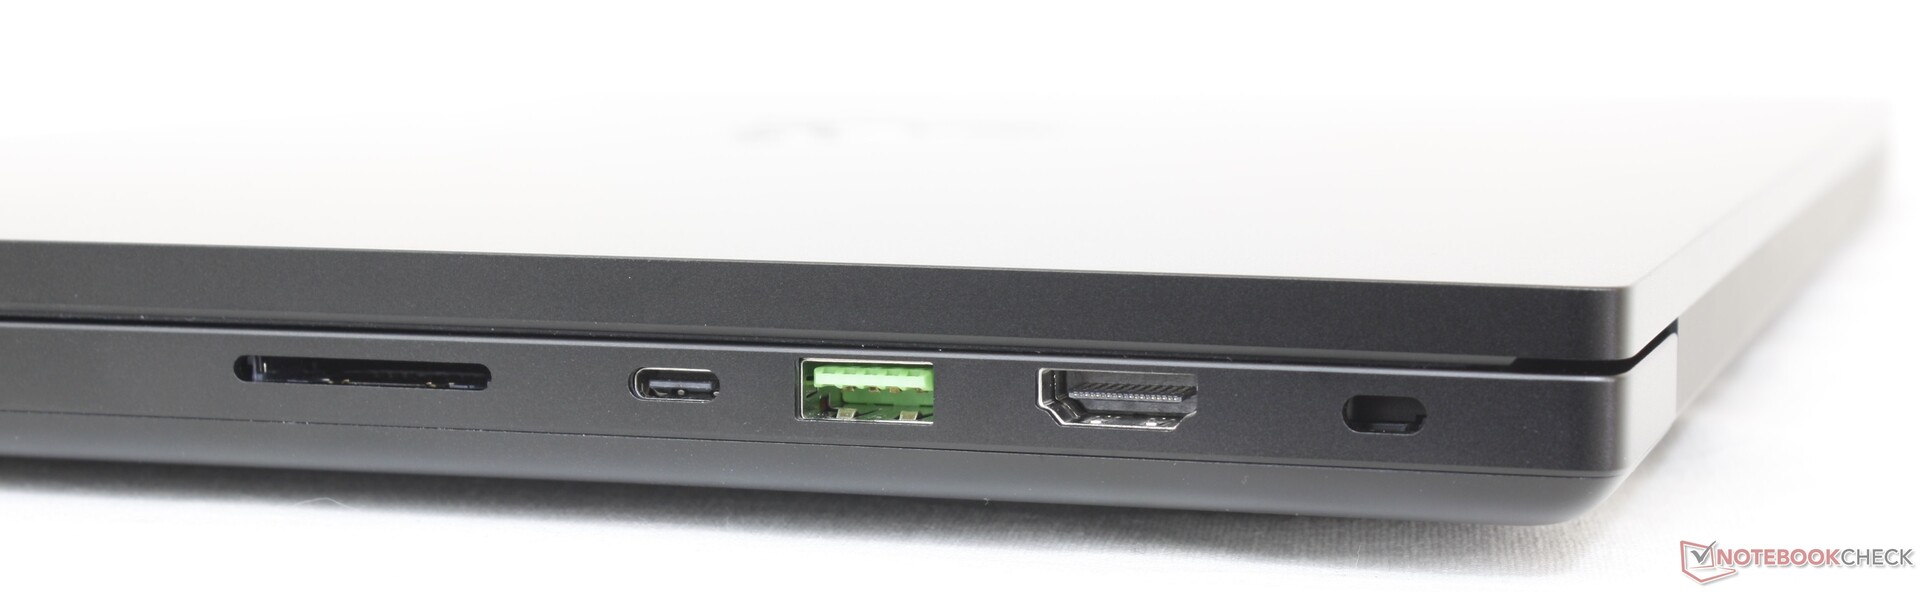
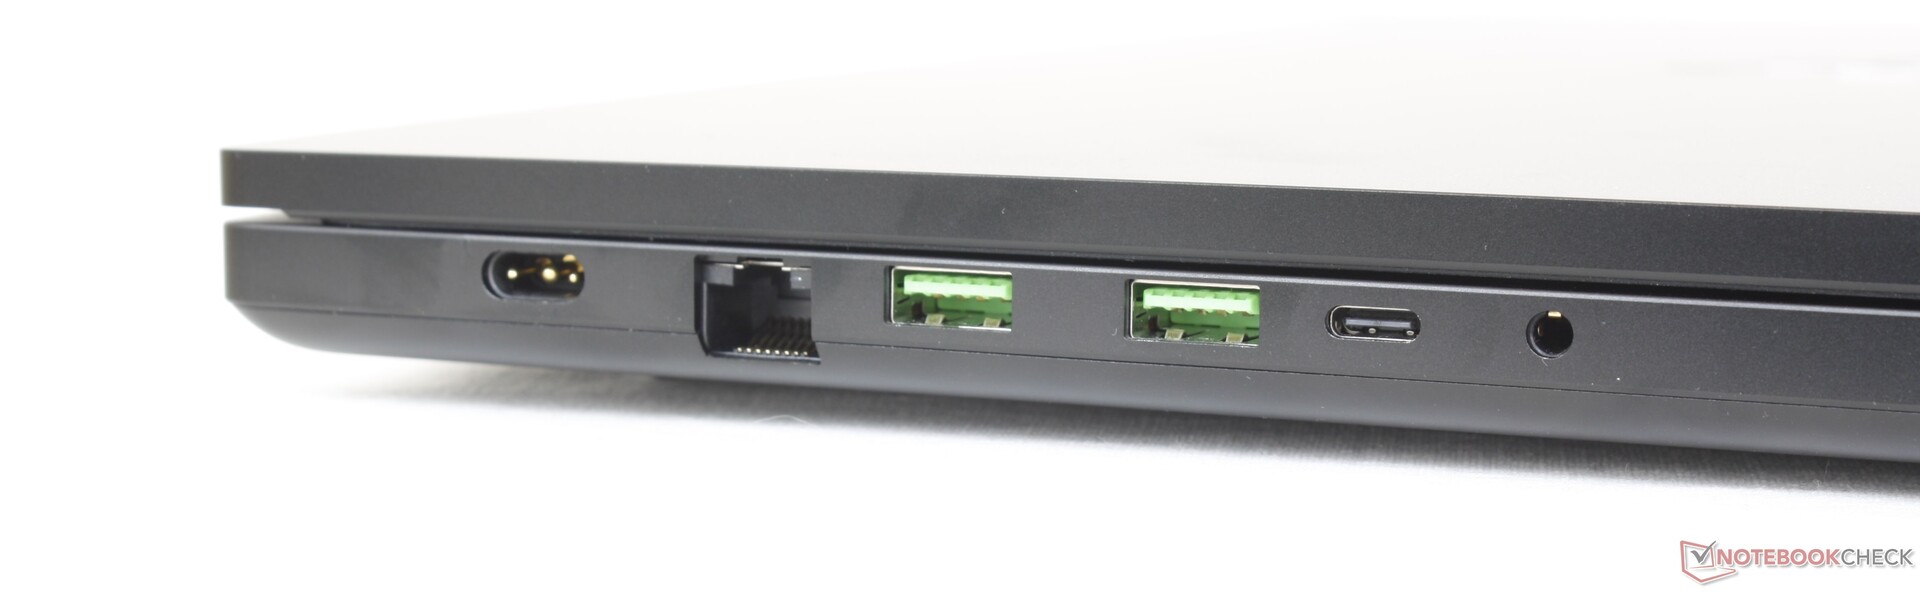
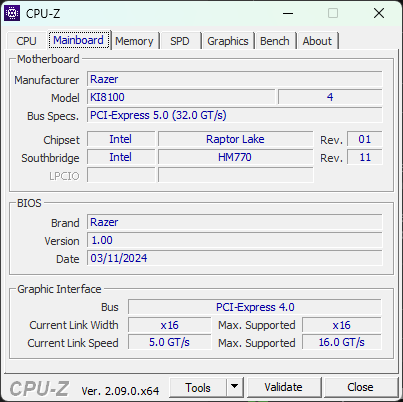
Bağlanabilirlik - Thunderbolt 5 ile Geleceğe Hazırlanma

Thunderbolt 4 bağlantı noktası 2024 modeli için Thunderbolt 5'e yükseltilmiştir. Bunun yalnızca sağ kenardaki Type-C bağlantı noktası için geçerli olduğunu ve bu nedenle sol kenardaki Type-C bağlantı noktasının hala USB 3.2 Gen. 2 bağlantısıyla sınırlı olduğunu unutmayın. Thunderbolt 4 ile karşılaştırıldığında Thunderbolt 5, eGPU'lar gibi daha zorlu harici cihazlar için ayrılmış ek şeritlerle iki kat bant genişliğini (80 Gbps'ye karşı 40 Gbps) desteklemektedir.
Thunderbolt 5 spesifikasyonu ayrıca 240 W'a kadar aşağı yönlü şarjı da desteklemektedir. Ancak Blade 18'de USB-C şarjı hala 100 W veya ana varil 330 W AC adaptörünün üçte birinden daha azıyla sınırlıdır. Adil olmak gerekirse, yeni özellikten tam olarak yararlanmak için ek donanım ayarlamaları gerektiğinden, bu yazı itibariyle hiçbir dizüstü bilgisayar 240 W USB-C şarjını tam olarak desteklemiyor.

SD Kart Okuyucu
| SD Card Reader | |
| average JPG Copy Test (av. of 3 runs) | |
| Alienware m18 R2 (Toshiba Exceria Pro SDXC 64 GB UHS-II) | |
| Razer Blade 18 2024 RZ09-0509 (Toshiba Exceria Pro SDXC 64 GB UHS-II) | |
| Razer Blade 16 2024, RTX 4090 | |
| MSI Titan 18 HX A14VIG (Toshiba Exceria Pro SDXC 64 GB UHS-II) | |
| maximum AS SSD Seq Read Test (1GB) | |
| Razer Blade 18 2024 RZ09-0509 (Toshiba Exceria Pro SDXC 64 GB UHS-II) | |
| Alienware m18 R2 (Toshiba Exceria Pro SDXC 64 GB UHS-II) | |
| Razer Blade 16 2024, RTX 4090 | |
| MSI Titan 18 HX A14VIG (Toshiba Exceria Pro SDXC 64 GB UHS-II) | |
İletişim
WLAN, hem Bluetooth 5.4 hem de Wi-Fi 7 desteği için Intel BE200'e yükseltildi. Ancak kullanıcıların büyük çoğunluğu hala Wi-Fi 7 yönlendiricilere sahip değil ve bu nedenle şimdilik yalnızca birkaçı herhangi bir performans iyileştirmesi fark edecek.
| Networking | |
| iperf3 transmit AXE11000 | |
| Razer Blade 16 2024, RTX 4090 | |
| Razer Blade 18 2024 RZ09-0509 | |
| MSI Titan 18 HX A14VIG | |
| Asus ROG Strix Scar 18 G834JYR (2024) | |
| Alienware m18 R2 | |
| iperf3 receive AXE11000 | |
| Asus ROG Strix Scar 18 G834JYR (2024) | |
| Razer Blade 16 2024, RTX 4090 | |
| Razer Blade 18 2024 RZ09-0509 | |
| Alienware m18 R2 | |
| MSI Titan 18 HX A14VIG | |
| iperf3 transmit AXE11000 6GHz | |
| Razer Blade 16 2024, RTX 4090 | |
| Razer Blade 18 2024 RZ09-0509 | |
| MSI Titan 18 HX A14VIG | |
| Alienware m18 R2 | |
| iperf3 receive AXE11000 6GHz | |
| Razer Blade 16 2024, RTX 4090 | |
| MSI Titan 18 HX A14VIG | |
| Razer Blade 18 2024 RZ09-0509 | |
| Alienware m18 R2 | |
Web kamerası
5 MP + IR web kamerası, gizlilik için yeni deklanşör kaydırıcısı dışında değişmedi. İlginç bir şekilde bu, rakip Titan HX gibi 5 MP web kamerasına sahip tek 18 inçlik oyun dizüstü bilgisayarı, Alienware m18 R2ve ROG Strix Scar 18, karşılaştırıldığında sadece 1 MP ila 2 MP kameralarla geliyor.


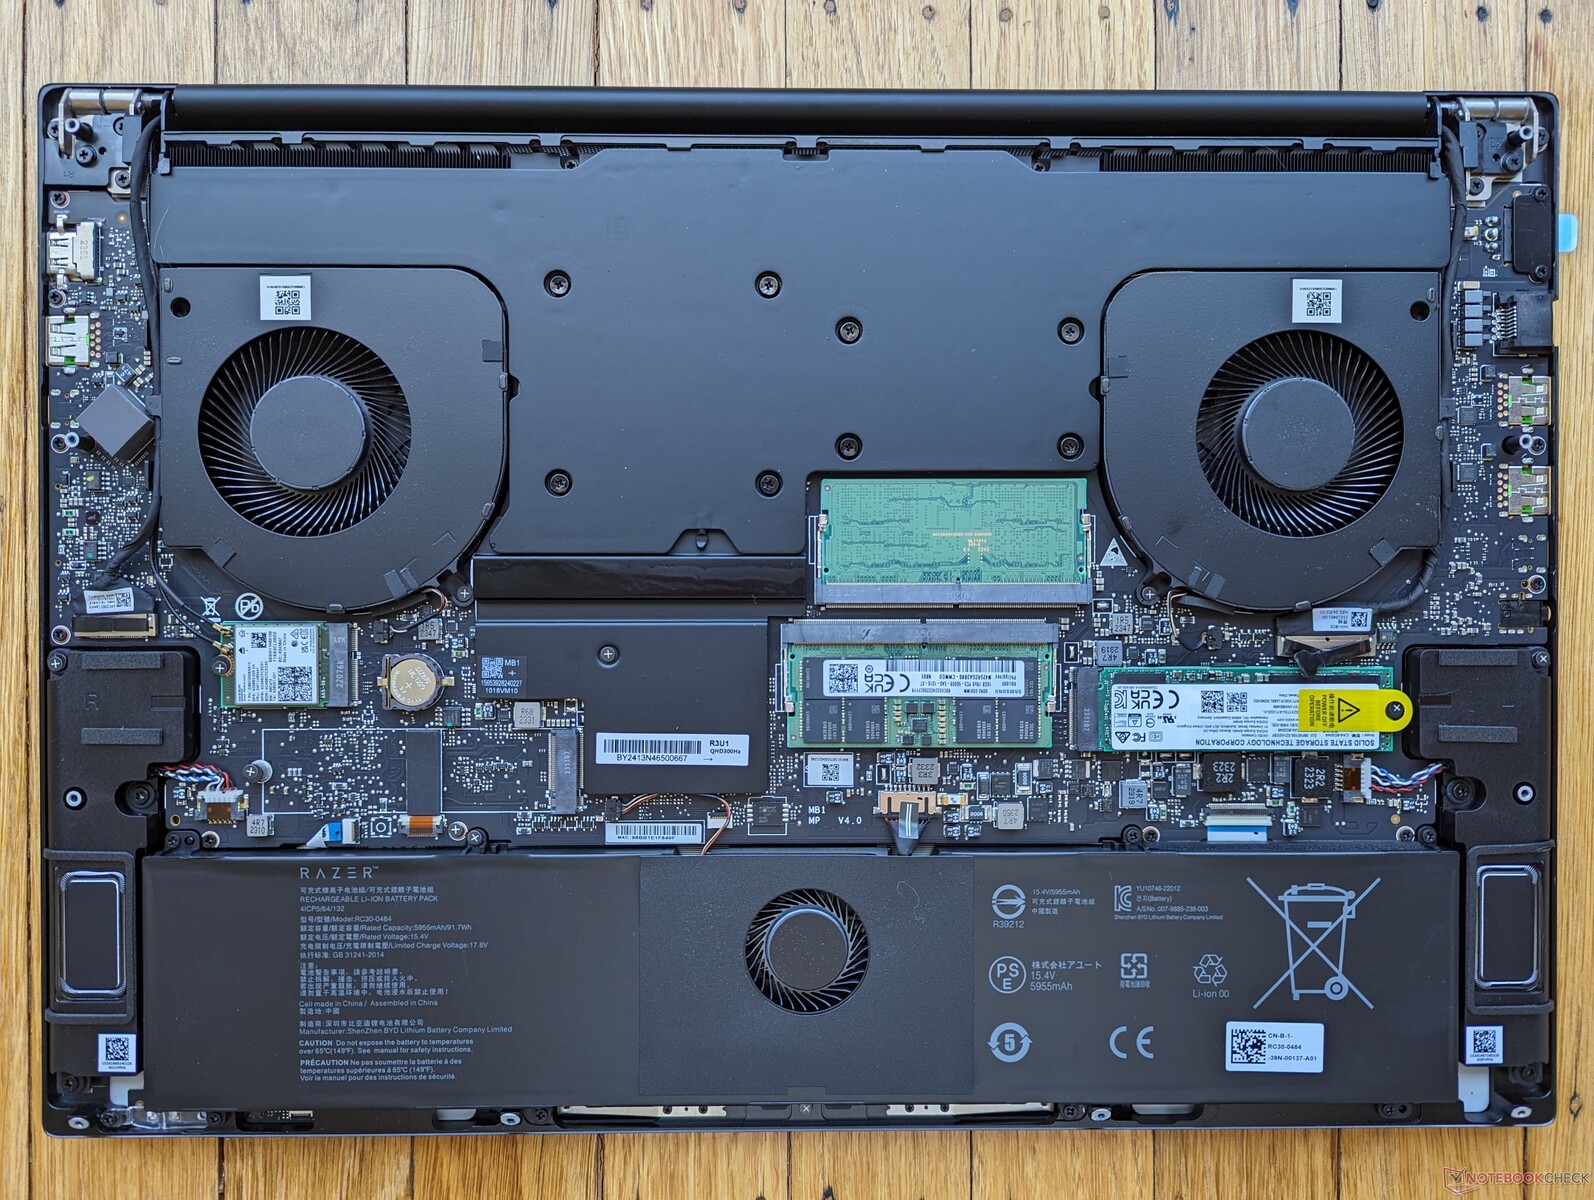
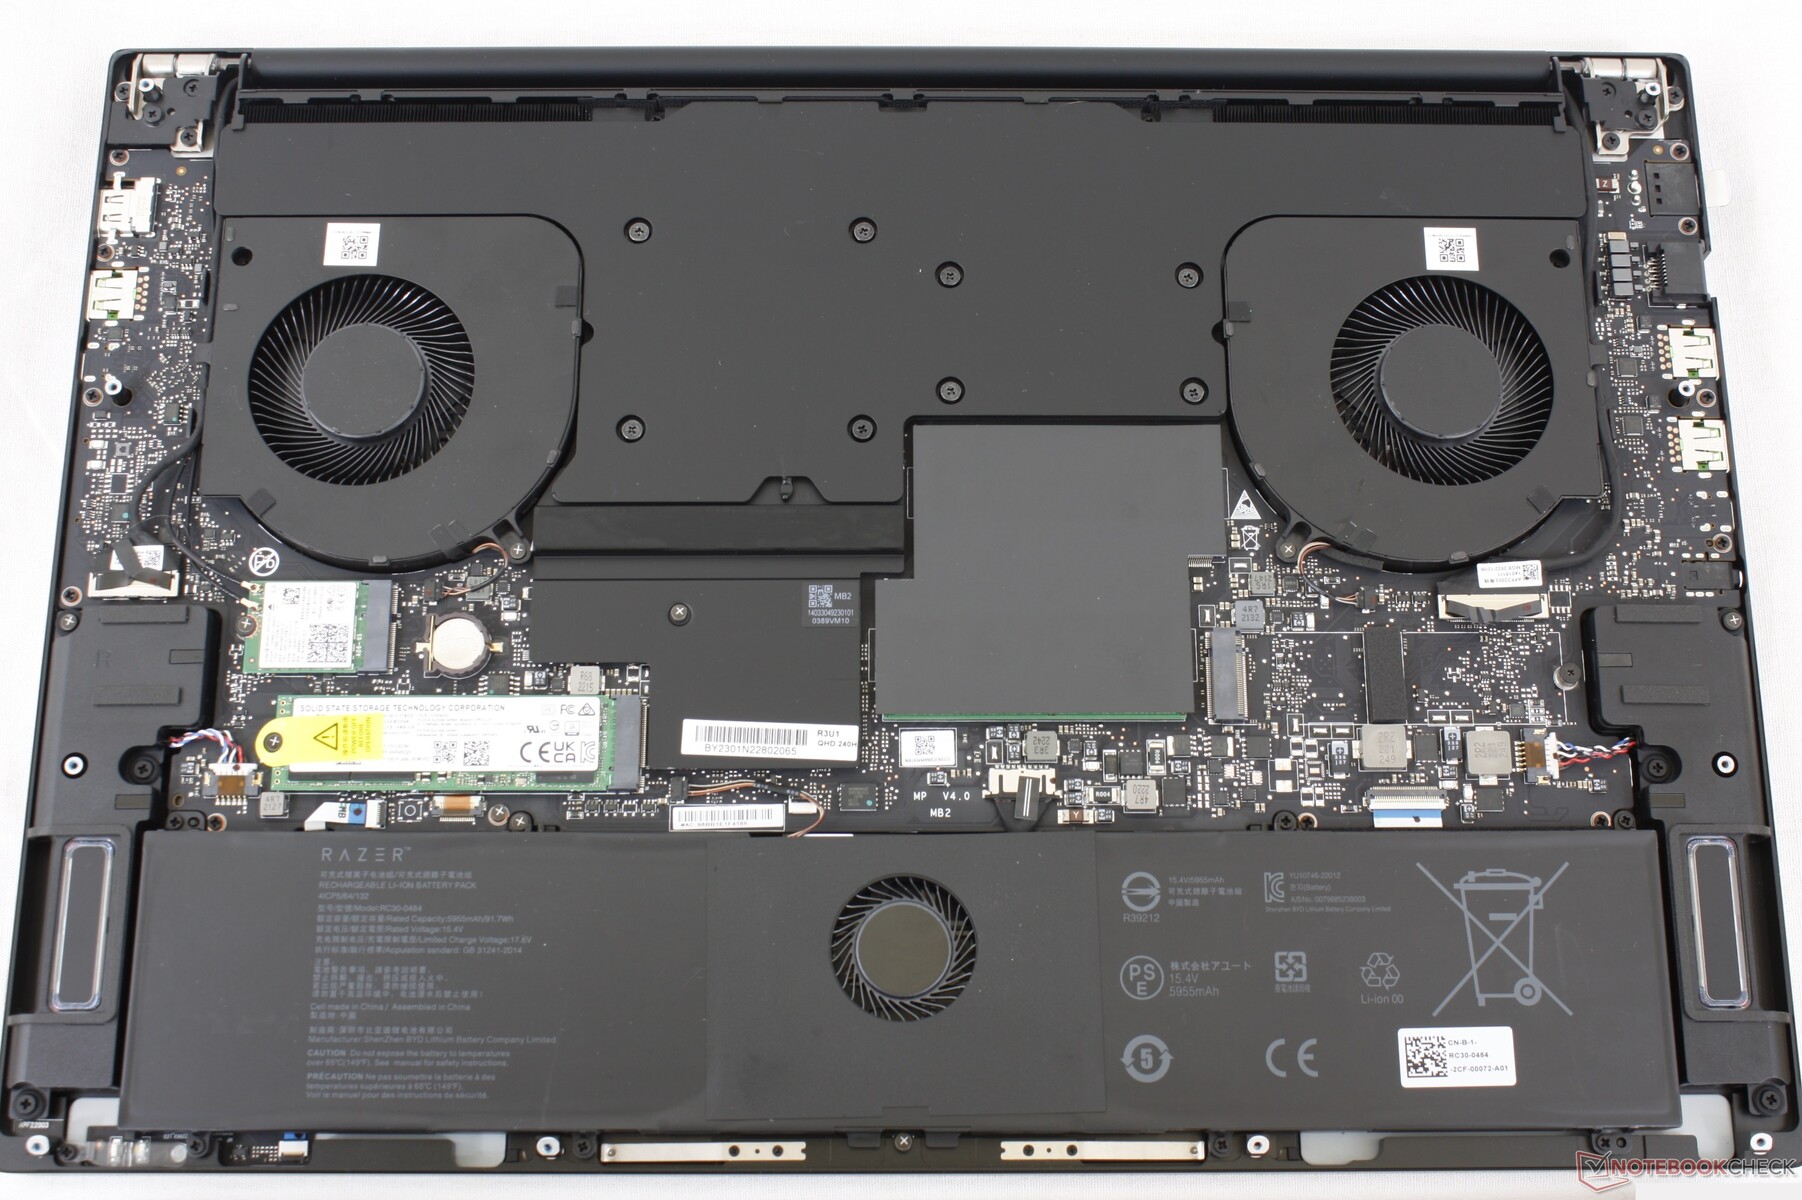
Bakım
2024 modeli, ön köşelere yakın biraz daha büyük hoparlörlere sahiptir. Bunun dışında, 2023 versiyonuyla karşılaştırıldığında kayda değer bir fark yoktur.
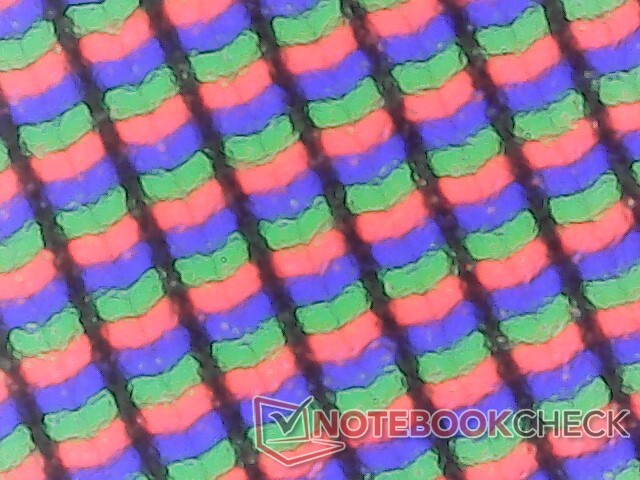
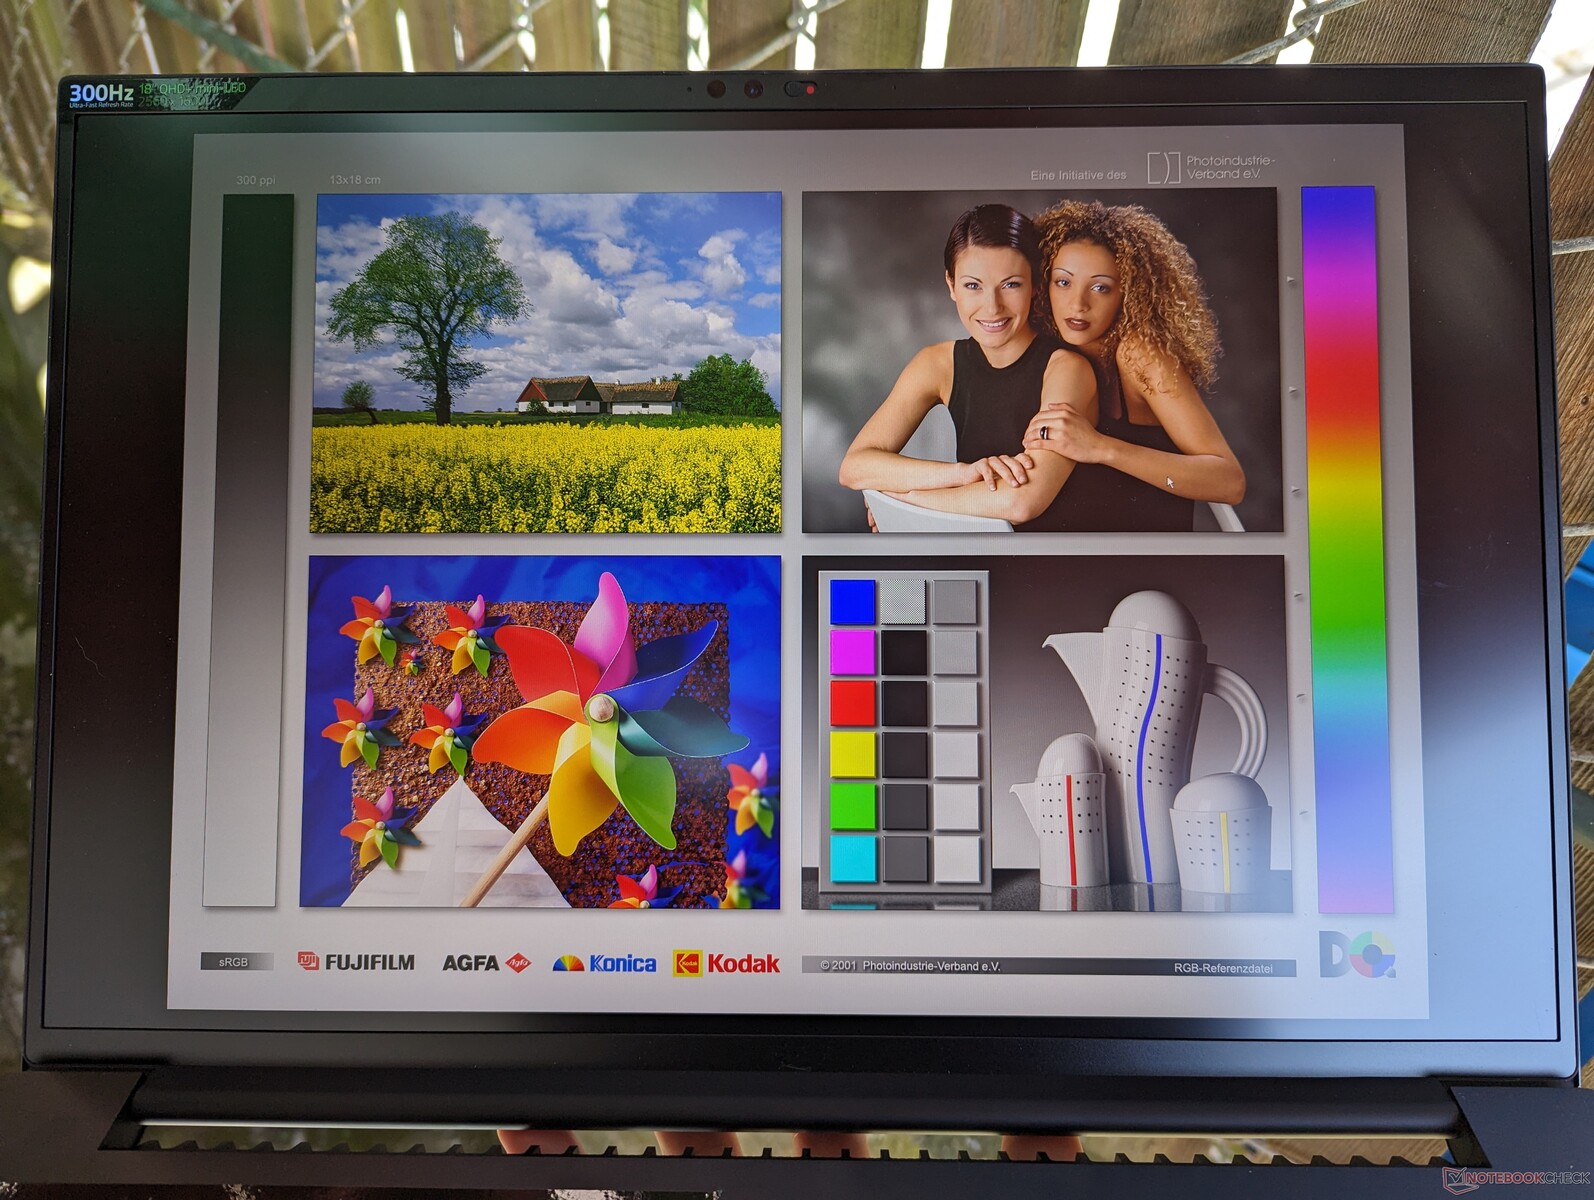
Ekran - QHD+ 300 Hz Mini-LED
2023 Blade 18'deki QHD+ 240 Hz panel bu yıl iki yeni seçenekle değiştirildi:
- QHD+ (2560 x 1600), 300 Hz, Mini-LED, HDR1000
- 4K UHD+ (3840 x 2400), 200 Hz, IPS, HDR400
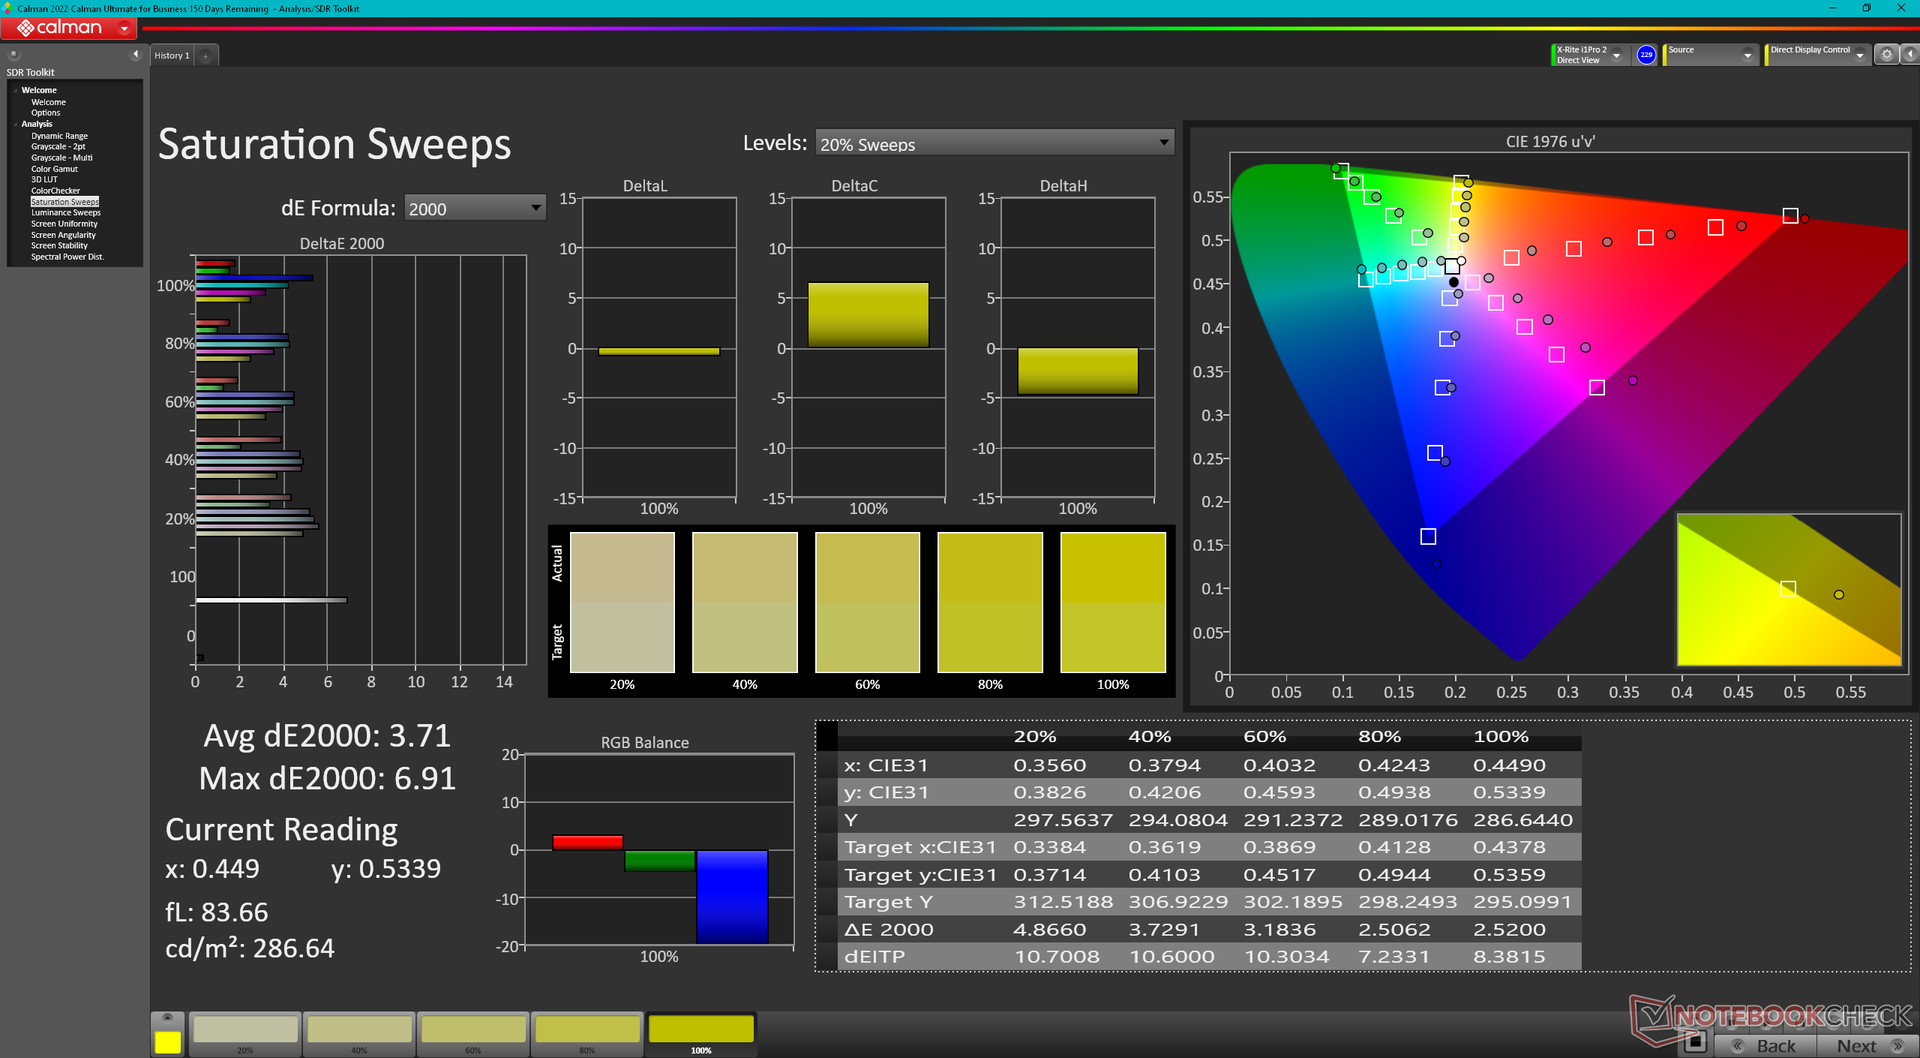
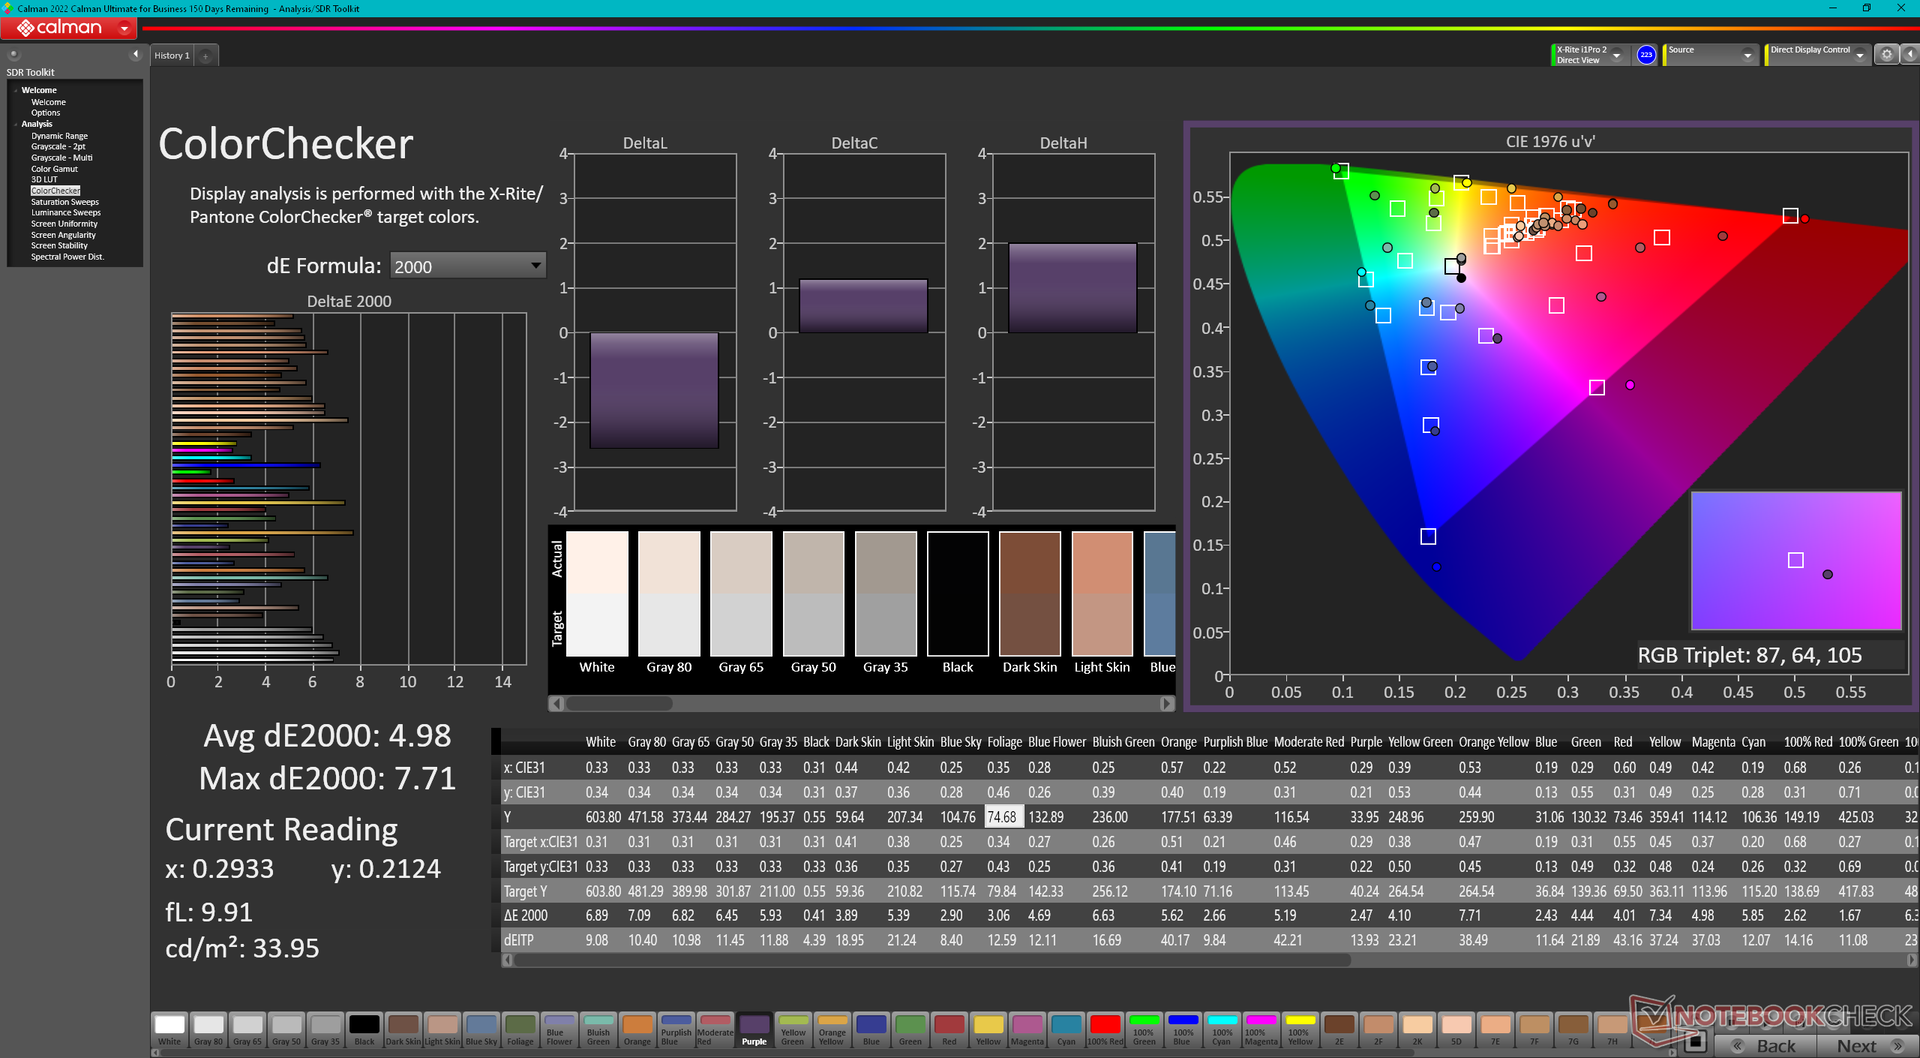
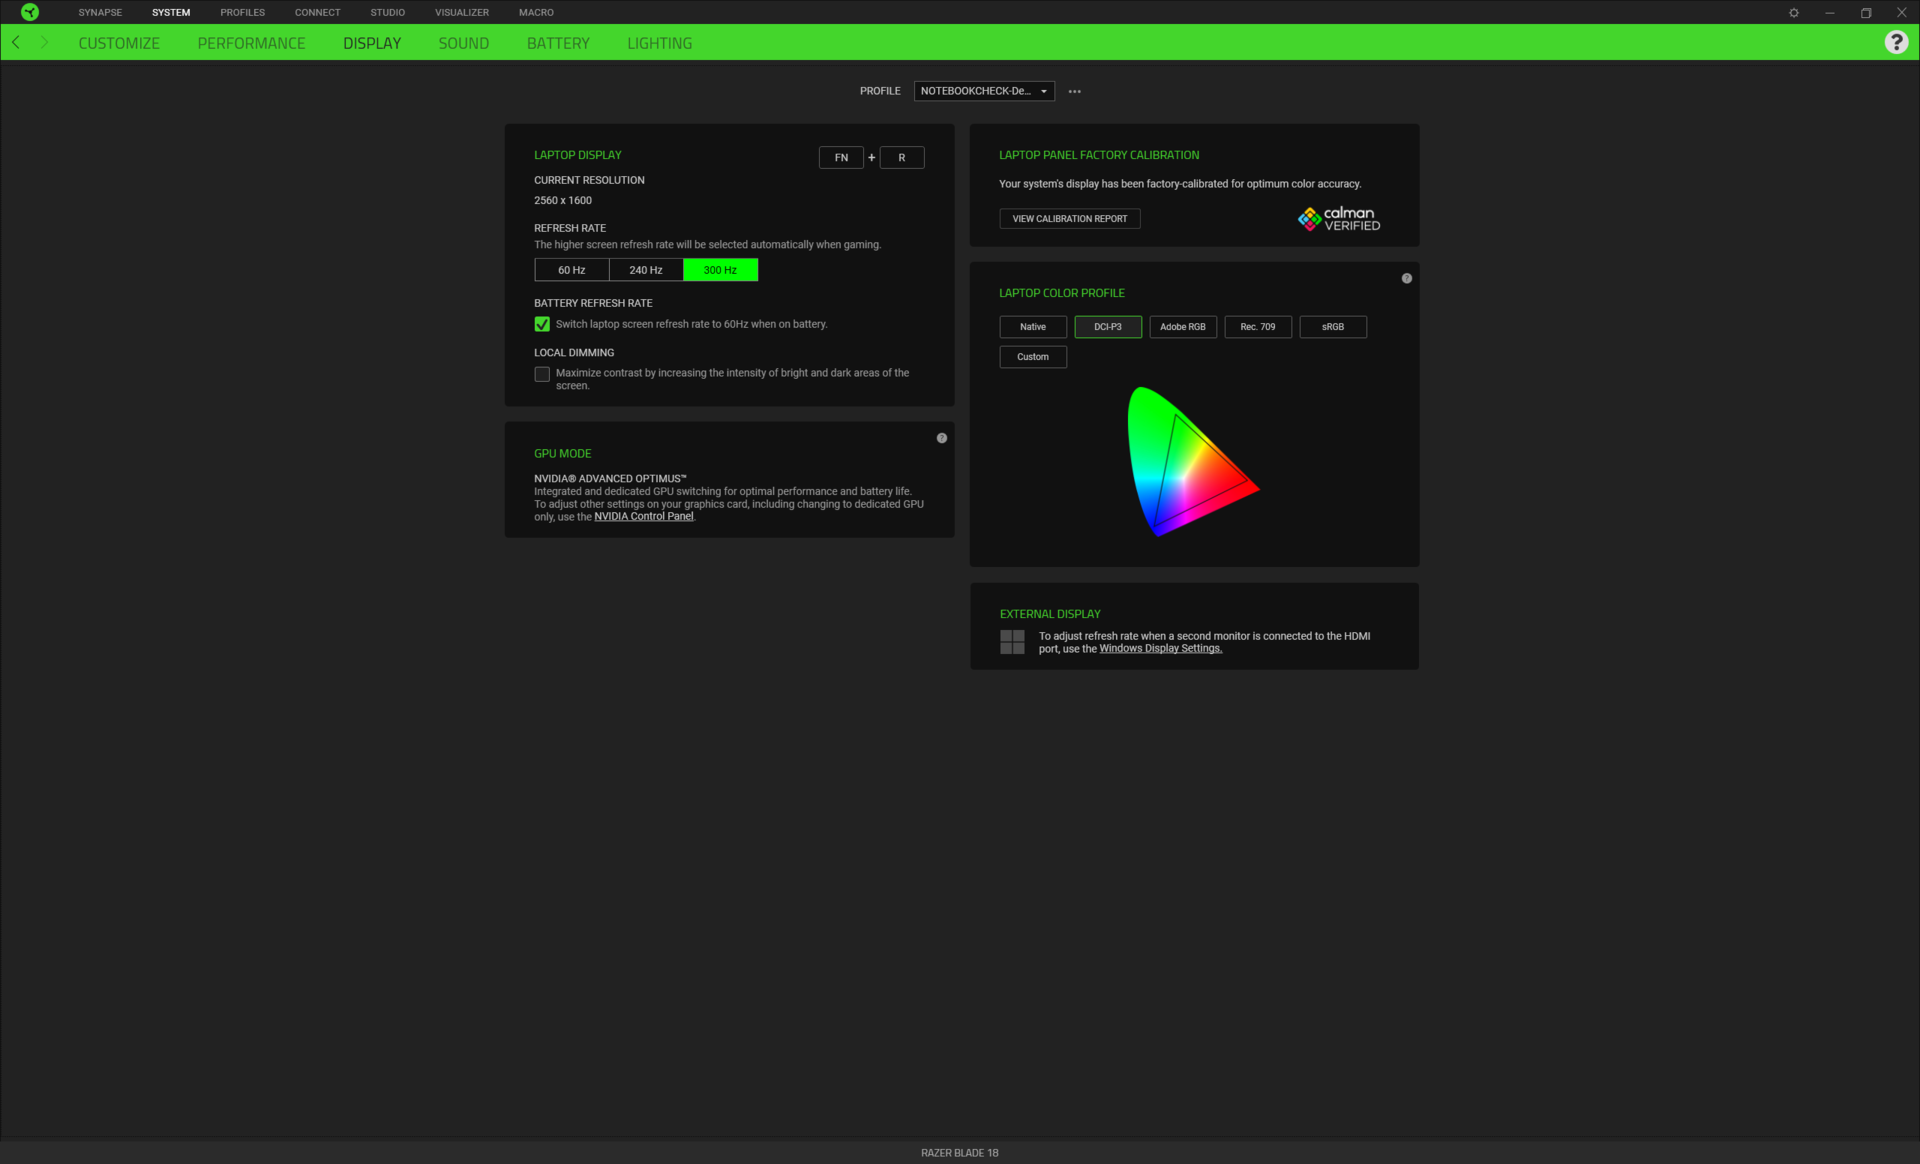
Her iki panel de G-Sync, fabrika kalibrasyonu, tam DCI-P3 renkleri ve hem zorlu oyunlara hem de çoğu düzenleme görevine uygun hızlı <3 ms tepki süreleri sunar. Özel test ünitemiz kalınlaştırılmış seçenekle yapılandırılmıştır. Bu BOE NE180QDM-NM1 panelinin ROG Strix Scar 18 adresinde de bulunduğunu unutmayın, yani Razer ve Asus dizüstü bilgisayarlar karşılaştırılabilir görüntüleme deneyimleri sunabilir.
IPS ve OLED ile karşılaştırıldığında mini-LED, HDR gereksinimlerine daha iyi uyum sağlamak için IPS'den daha derin siyah seviyeleri ve OLED'den daha parlak beyazlar sağlar. Örneğin, üst düzey IPS veya OLED panelli dizüstü bilgisayarlar genellikle HDR400 veya HDR500'ü kapsarken, mini-LED genellikle daha canlı multimedya oynatma için HDR1000'i karşılar. Blade 18 ünitemizdeki maksimum parlaklık, hem HDR hem de yerel karartma etkinleştirildiğinde 1227 nit'e ulaşabilirken, HDR etkinleştirildiğinde ancak yerel karartma kapalıyken yalnızca 712 nit'e ulaşabiliyor. SDR modunda parlaklık ~600 nit ile sınırlıdır, bu da diğer birçok oyun dizüstü bilgisayarından çok daha parlaktır.
| Ekran Ayarı | SDR Modu w/ Yerel Karartma Kapalı | SDR Modu w/ Yerel Karartma Açık | Yerel Karartma Kapalı HDR Modu | Yerel Karartma Açıkken HDR Modu |
| Maksimum Parlaklık (nit) | 605 | 602 | 712 | 1227 |
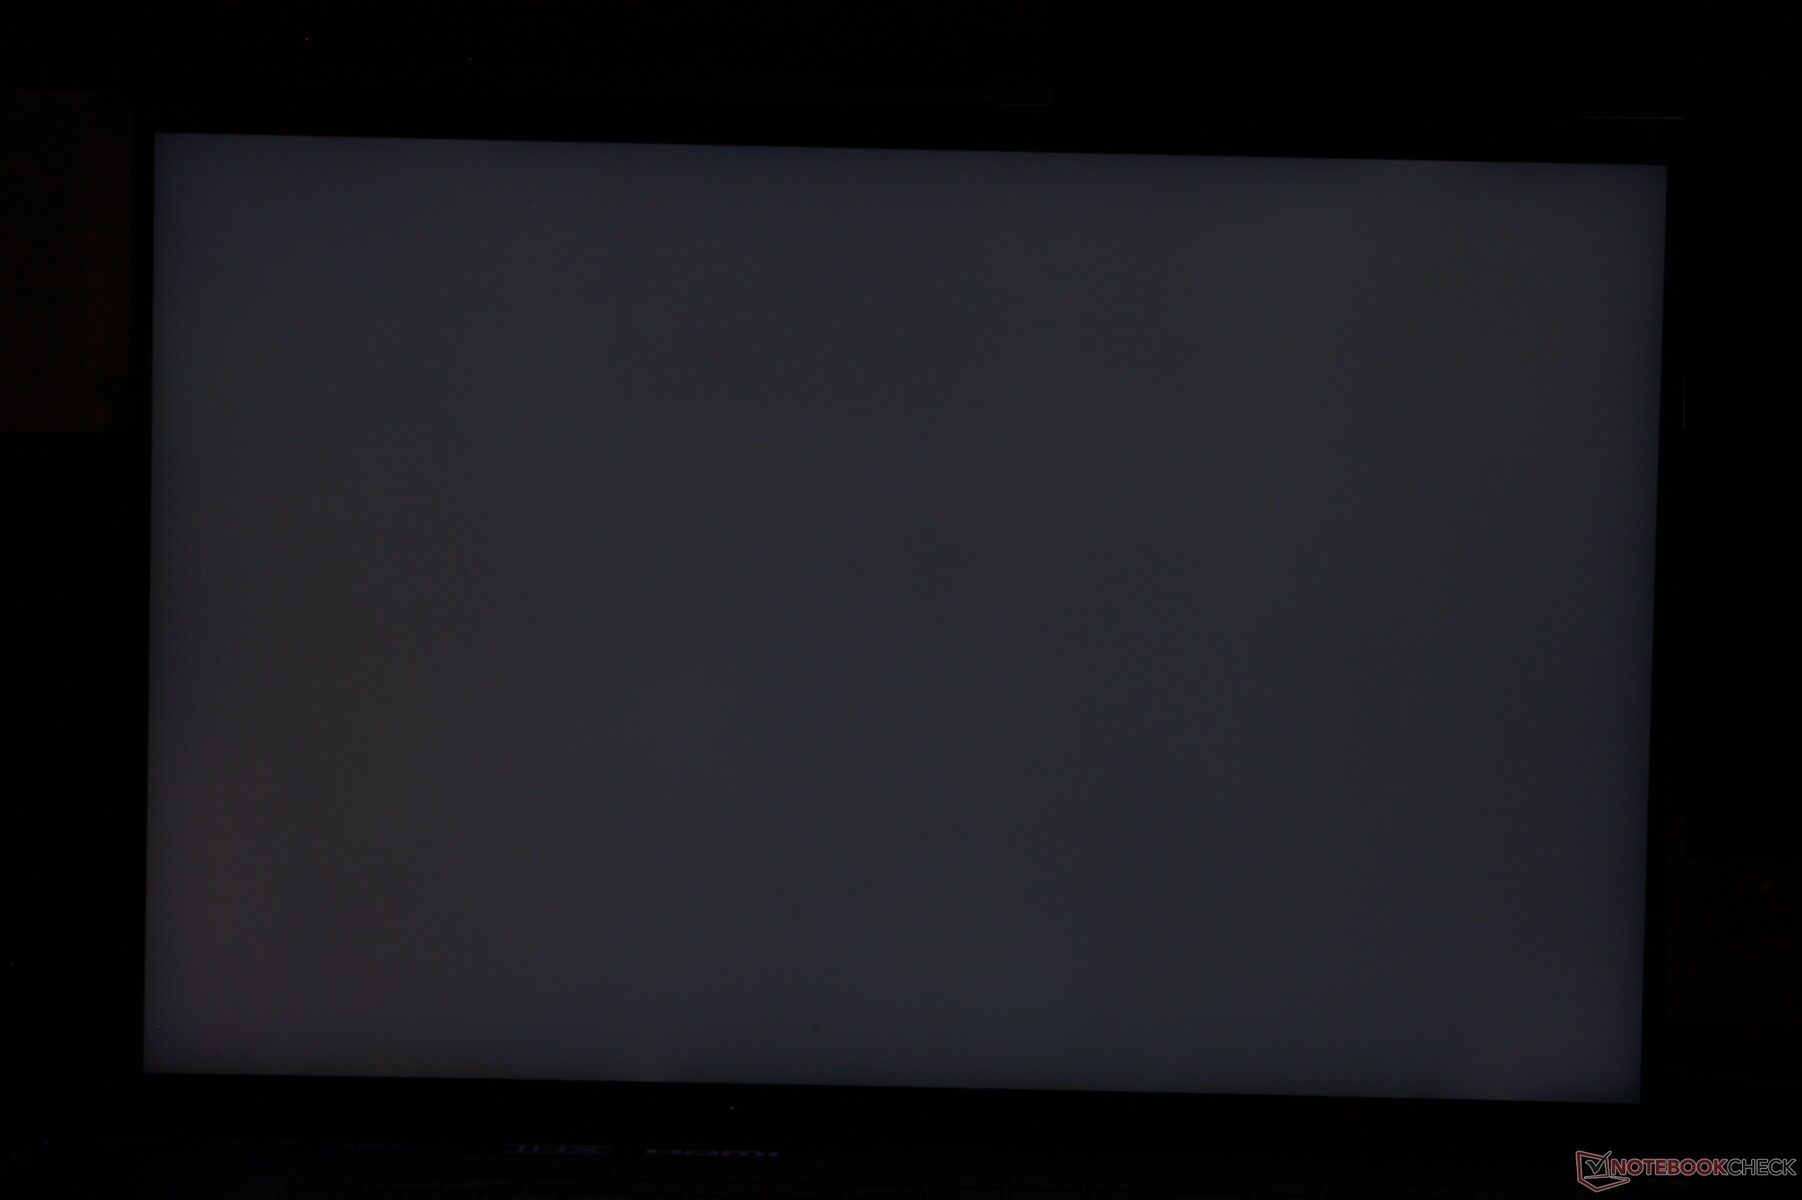
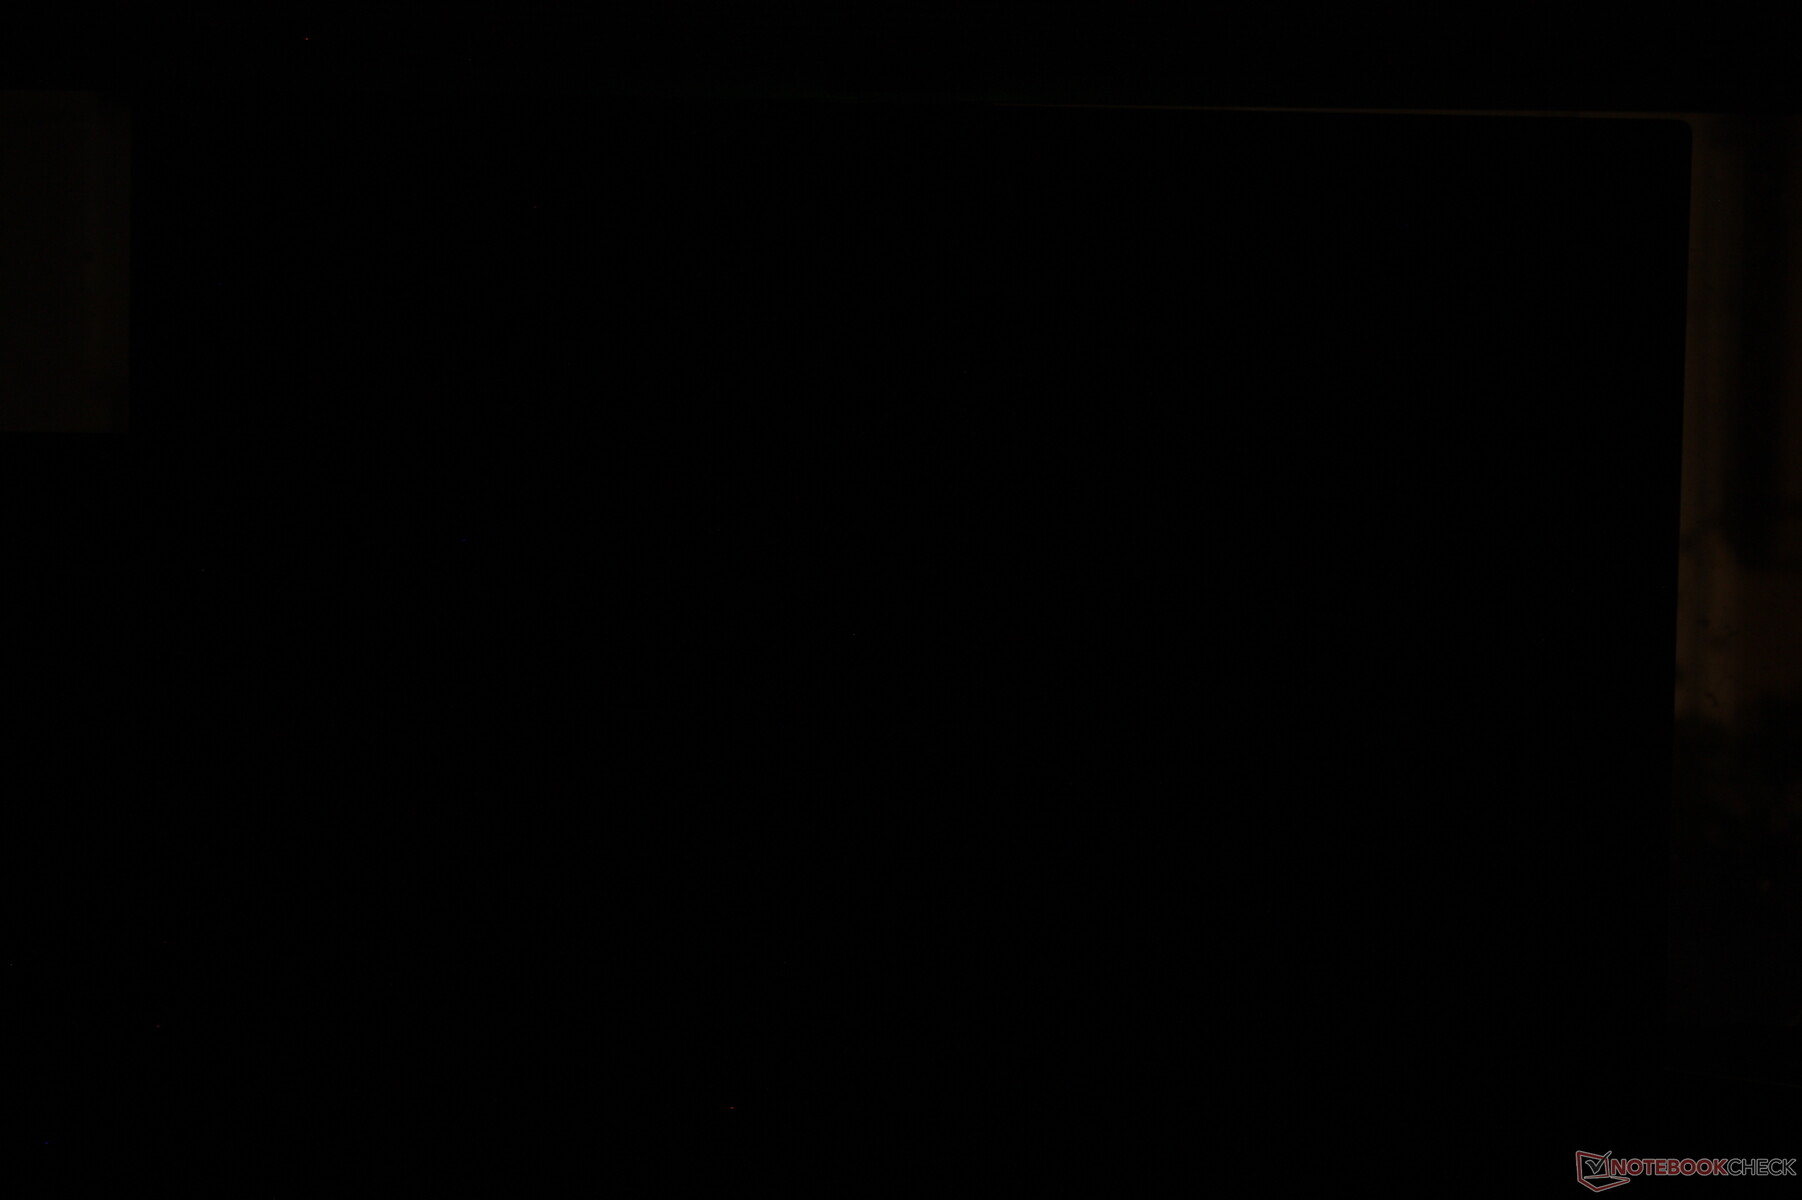
Siyah seviyeleri ve dolayısıyla kontrast da yerel karartmadan etkileniyor. Özellikle HDR etkinleştirildiğinde çok daha yüksek kontrast seviyeleri için yerel karartma kapalıyken 0,62 nit, yerel karartma açıkken 0,22 nit siyah seviyesi ölçebiliyoruz. Yerel karartma, doğal "halo" etkisi nedeniyle tarama veya düzenleme amaçları için gerekli olmayabilir veya hatta önerilmeyebilir, ancak dezavantajın daha az fark edildiği HDR videolar ve oyunlar için etkinleştirmeye değer.
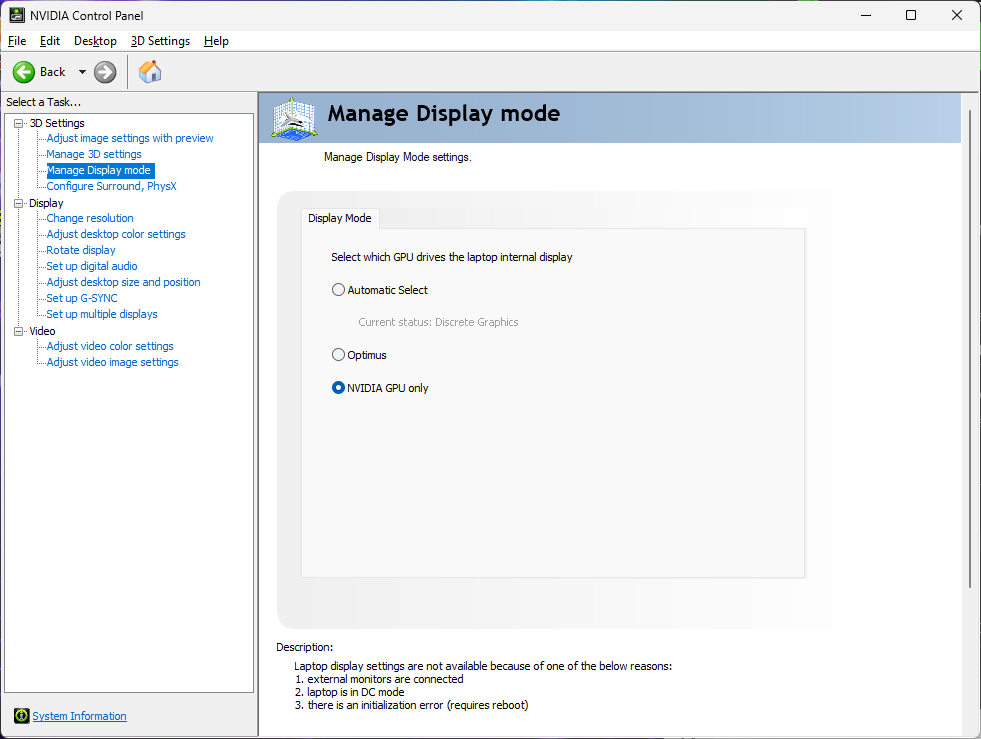
Panel yenileme hızının yalnızca dGPU modunda 300 Hz'e kadar desteklediğini, aksi takdirde Optimus modunda 240 Hz ile sınırlı olduğunu unutmayın. Yalnızca Optimus modunda 60 Hz'e kadar dinamik yenileme hızı desteklenir.
| |||||||||||||||||||||||||
Aydınlatma: 97 %
Batarya modunda parlaklık: 605.4 cd/m²
Kontrast: 976:1 (Siyah: 0.62 cd/m²)
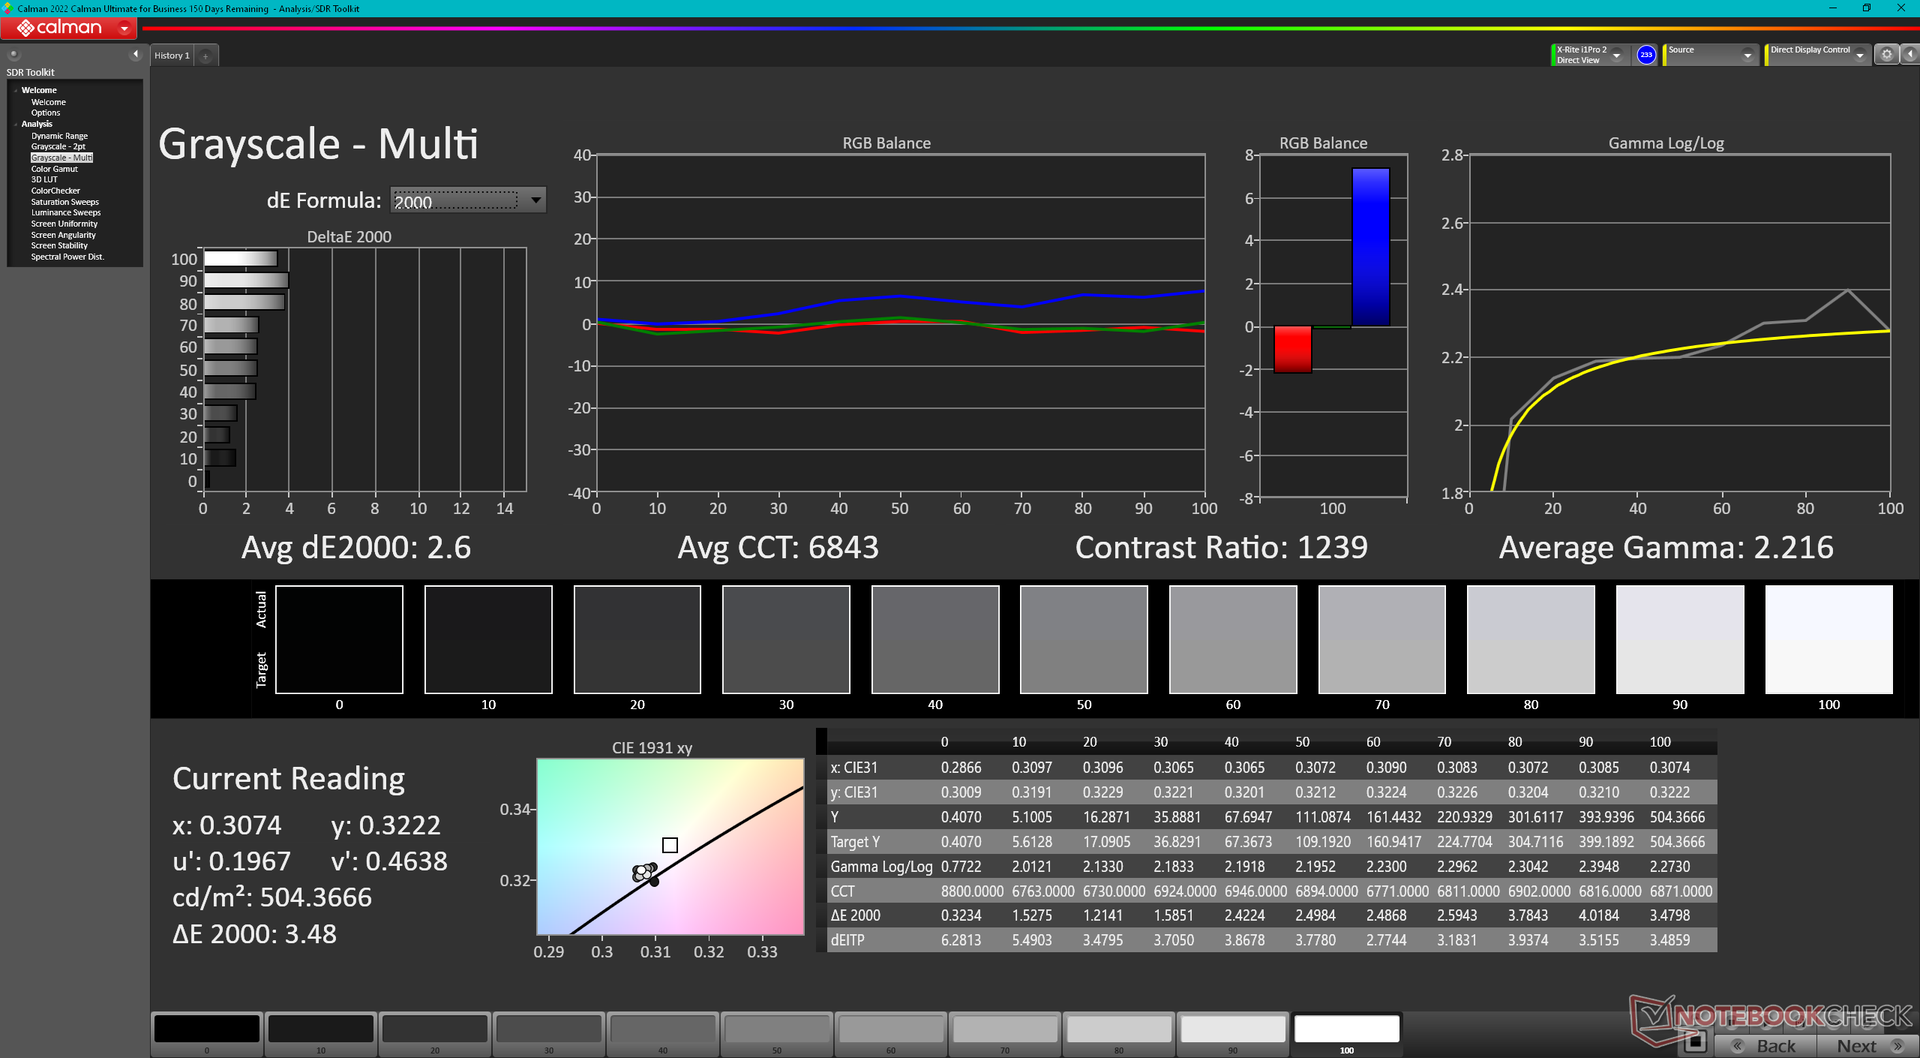
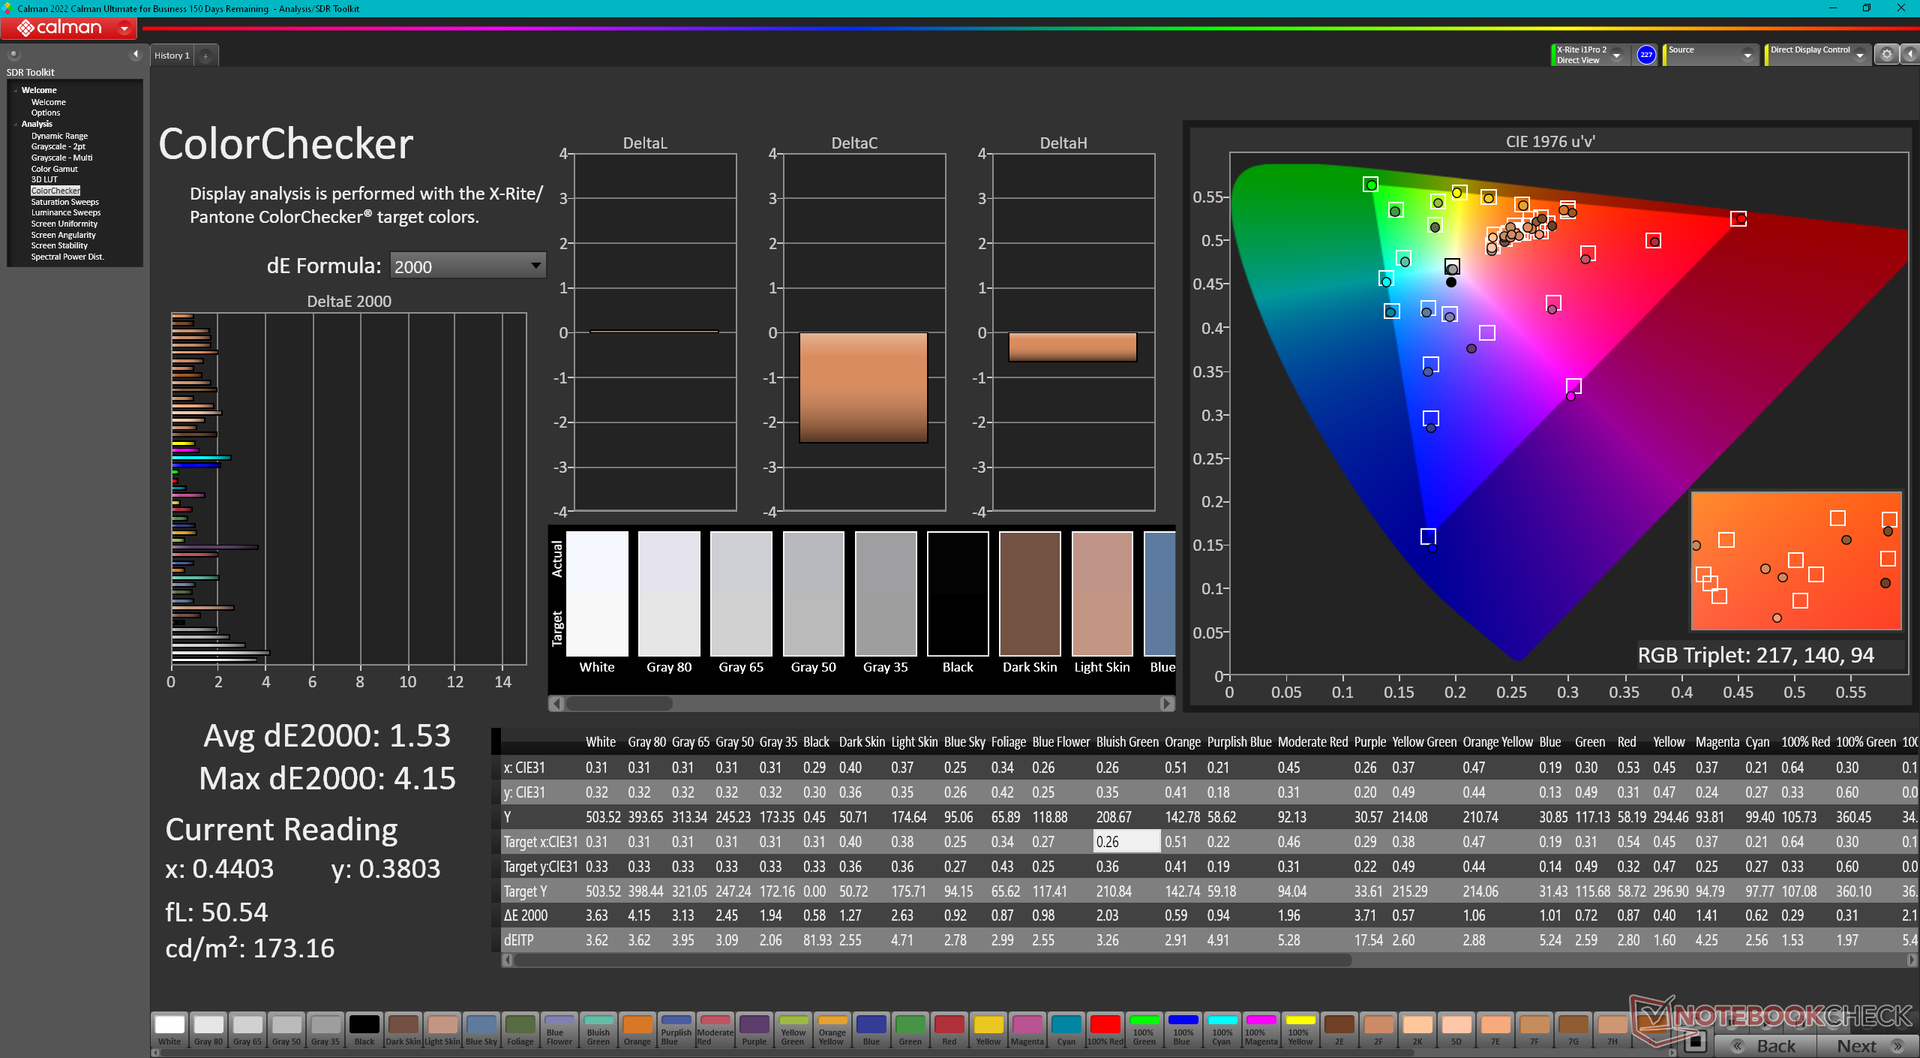
ΔE ColorChecker Calman: 1.53 | ∀{0.5-29.43 Ø4.72}
ΔE Greyscale Calman: 2.6 | ∀{0.09-98 Ø4.97}
86.9% AdobeRGB 1998 (Argyll 3D)
100% sRGB (Argyll 3D)
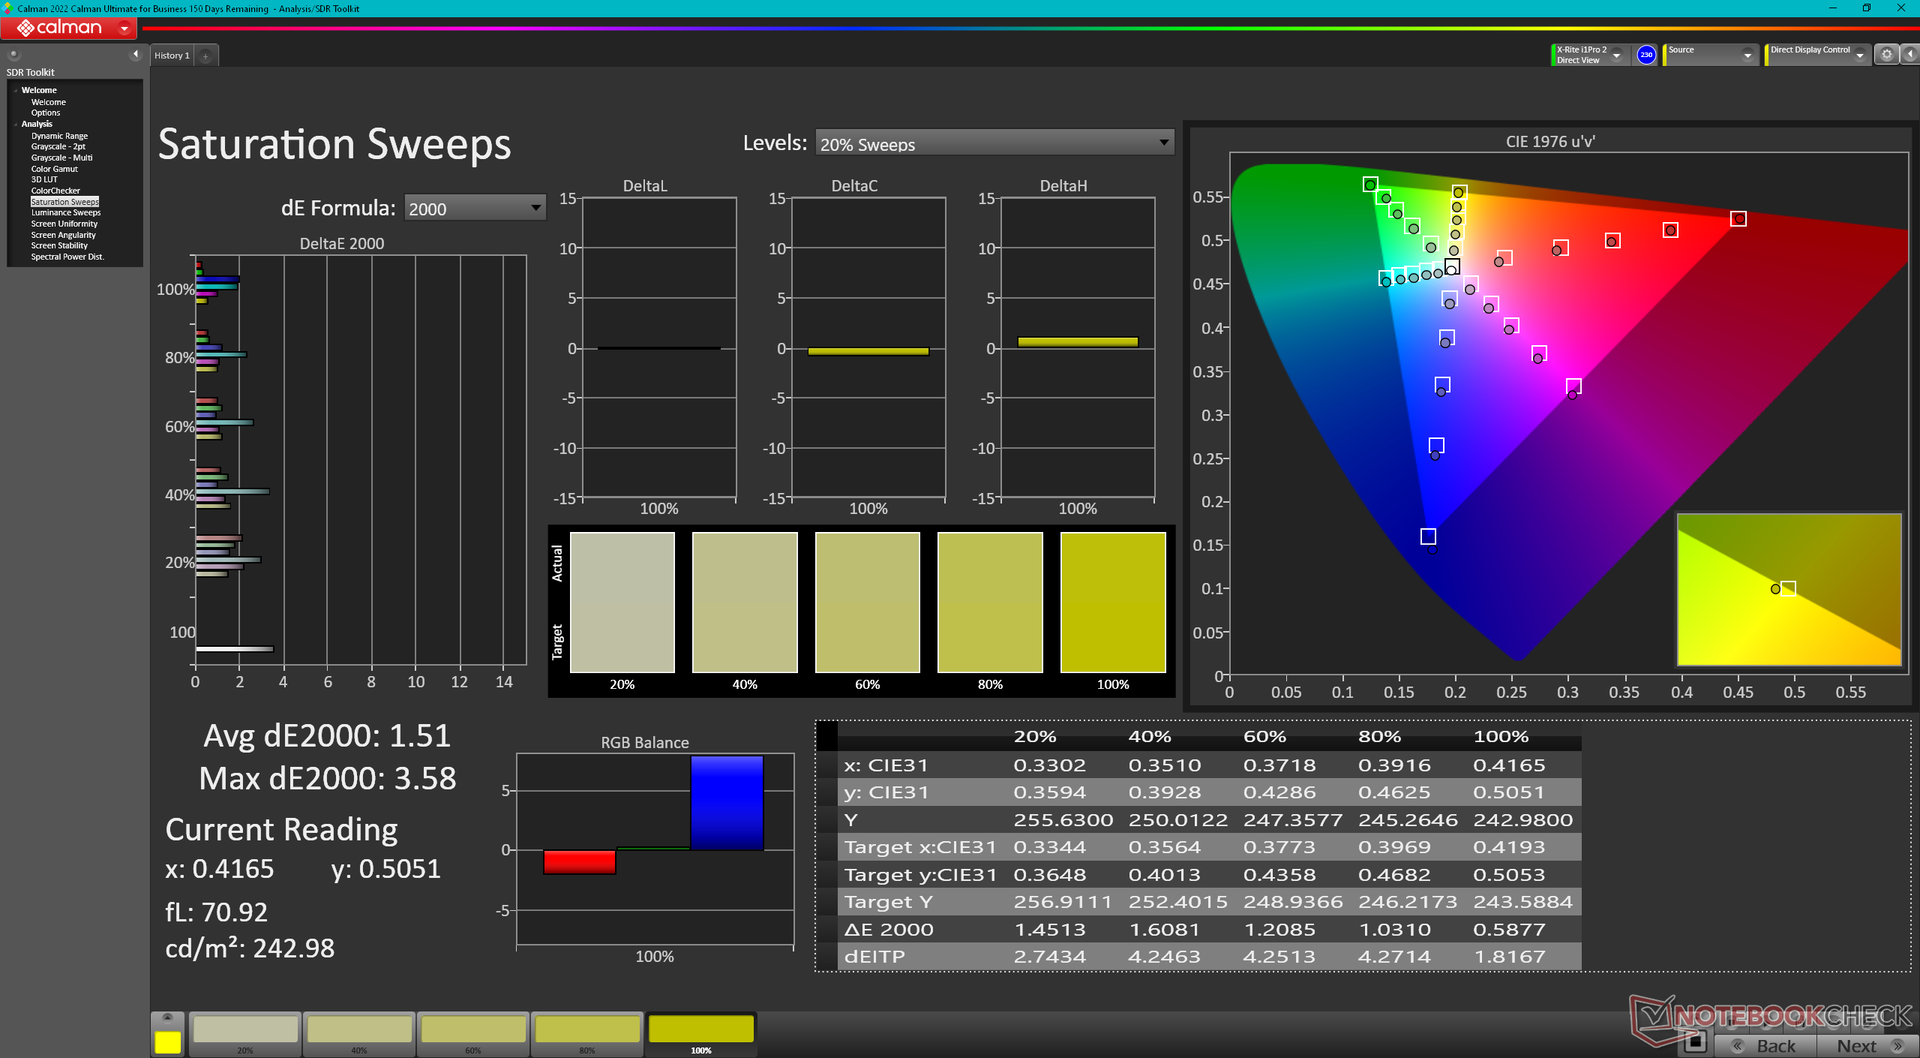
99% Display P3 (Argyll 3D)
Gamma: 2.22
CCT: 6843 K
| Razer Blade 18 2024 RZ09-0509 BOE NE180QDM-NM1, Mini-LED, 2560x1600, 18" | Razer Blade 18 RTX 4070 AU Optronics B180QAN01.0, IPS, 2560x1600, 18" | Alienware m18 R2 BOE NE18NZ1, IPS, 2560x1600, 18" | MSI Titan 18 HX A14VIG AU Optronics B180ZAN01.0, Mini-LED, 3840x2400, 18" | Asus ROG Strix Scar 18 G834JYR (2024) BOE NE180QDM-NM1, Mini LED, 2560x1600, 18" | |
|---|---|---|---|---|---|
| Display | -1% | 0% | -1% | 2% | |
| Display P3 Coverage (%) | 99 | 96.9 -2% | 97.8 -1% | 98.1 -1% | 99.9 1% |
| sRGB Coverage (%) | 100 | 99.8 0% | 99.5 0% | 99.8 0% | 100 0% |
| AdobeRGB 1998 Coverage (%) | 86.9 | 85.3 -2% | 88.9 2% | 86.2 -1% | 90 4% |
| Response Times | 44% | 28% | -249% | -17% | |
| Response Time Grey 50% / Grey 80% * (ms) | 7.6 ? | 4.2 ? 45% | 5.3 ? 30% | 8.6 ? -13% | 12 ? -58% |
| Response Time Black / White * (ms) | 14 ? | 8 ? 43% | 10.4 ? 26% | 81.8 ? -484% | 10.7 ? 24% |
| PWM Frequency (Hz) | 26444 ? | 2592 ? | 5733 ? | ||
| Screen | -20% | -26% | -45% | 202% | |
| Brightness middle (cd/m²) | 605.4 | 549.6 -9% | 271.8 -55% | 467.5 -23% | 937 55% |
| Brightness (cd/m²) | 600 | 524 -13% | 275 -54% | 459 -23% | 934 56% |
| Brightness Distribution (%) | 97 | 89 -8% | 78 -20% | 90 -7% | 89 -8% |
| Black Level * (cd/m²) | 0.62 | 0.53 15% | 0.27 56% | 0.066 89% | |
| Contrast (:1) | 976 | 1037 6% | 1007 3% | 14197 1355% | |
| Colorchecker dE 2000 * | 1.53 | 3.32 -117% | 2.48 -62% | 3.77 -146% | 1.52 1% |
| Colorchecker dE 2000 max. * | 4.15 | 6.63 -60% | 5.59 -35% | 6.12 -47% | 2.82 32% |
| Greyscale dE 2000 * | 2.6 | 2 23% | 3.7 -42% | 3.2 -23% | 1.7 35% |
| Gamma | 2.22 99% | 2.29 96% | 2.2 100% | 2.43 91% | 2.042 108% |
| CCT | 6843 95% | 6319 103% | 6355 102% | 6478 100% | 6578 99% |
| Colorchecker dE 2000 calibrated * | 2.7 | 0.56 | 2.94 | 1.21 | |
| Toplam Ortalama (Program / Ayarlar) | 8% /
-6% | 1% /
-12% | -98% /
-70% | 62% /
122% |
* ... daha küçük daha iyidir
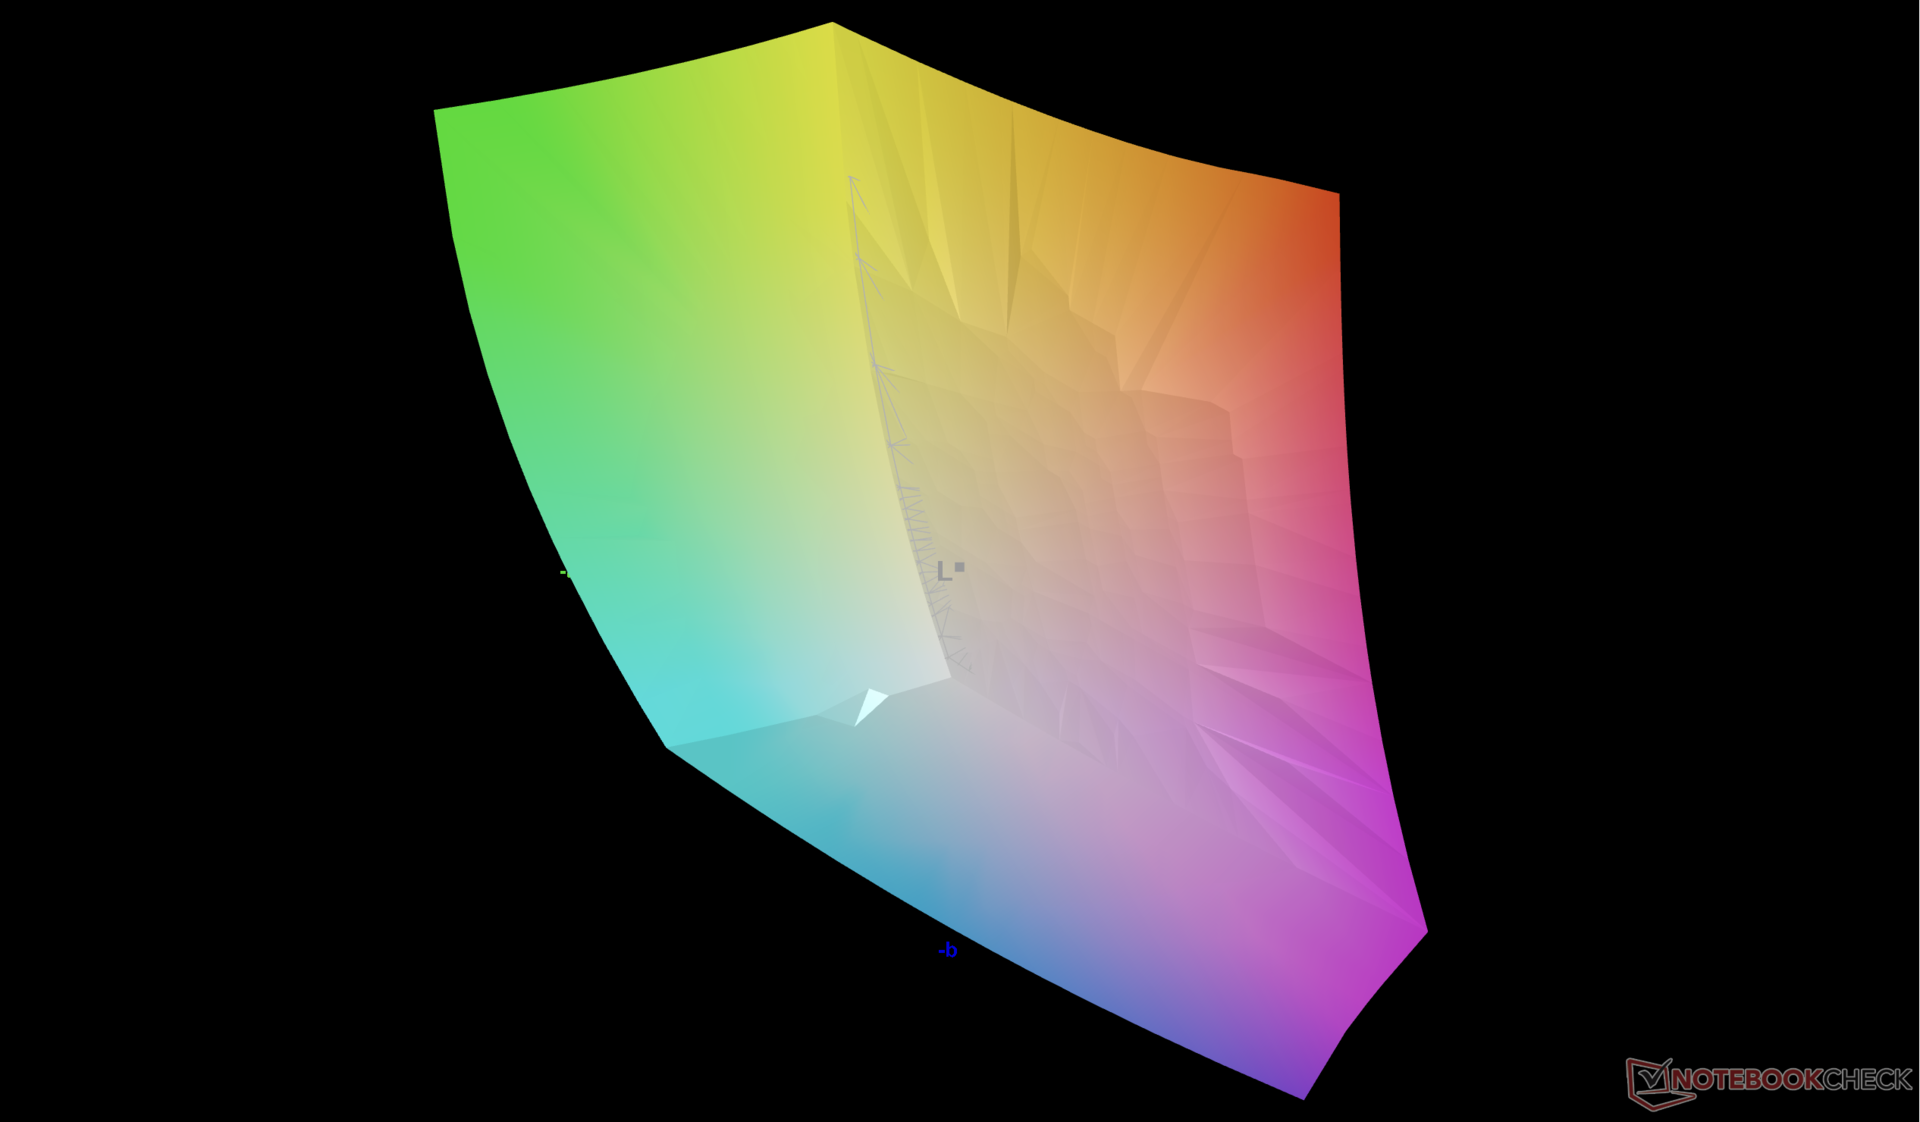
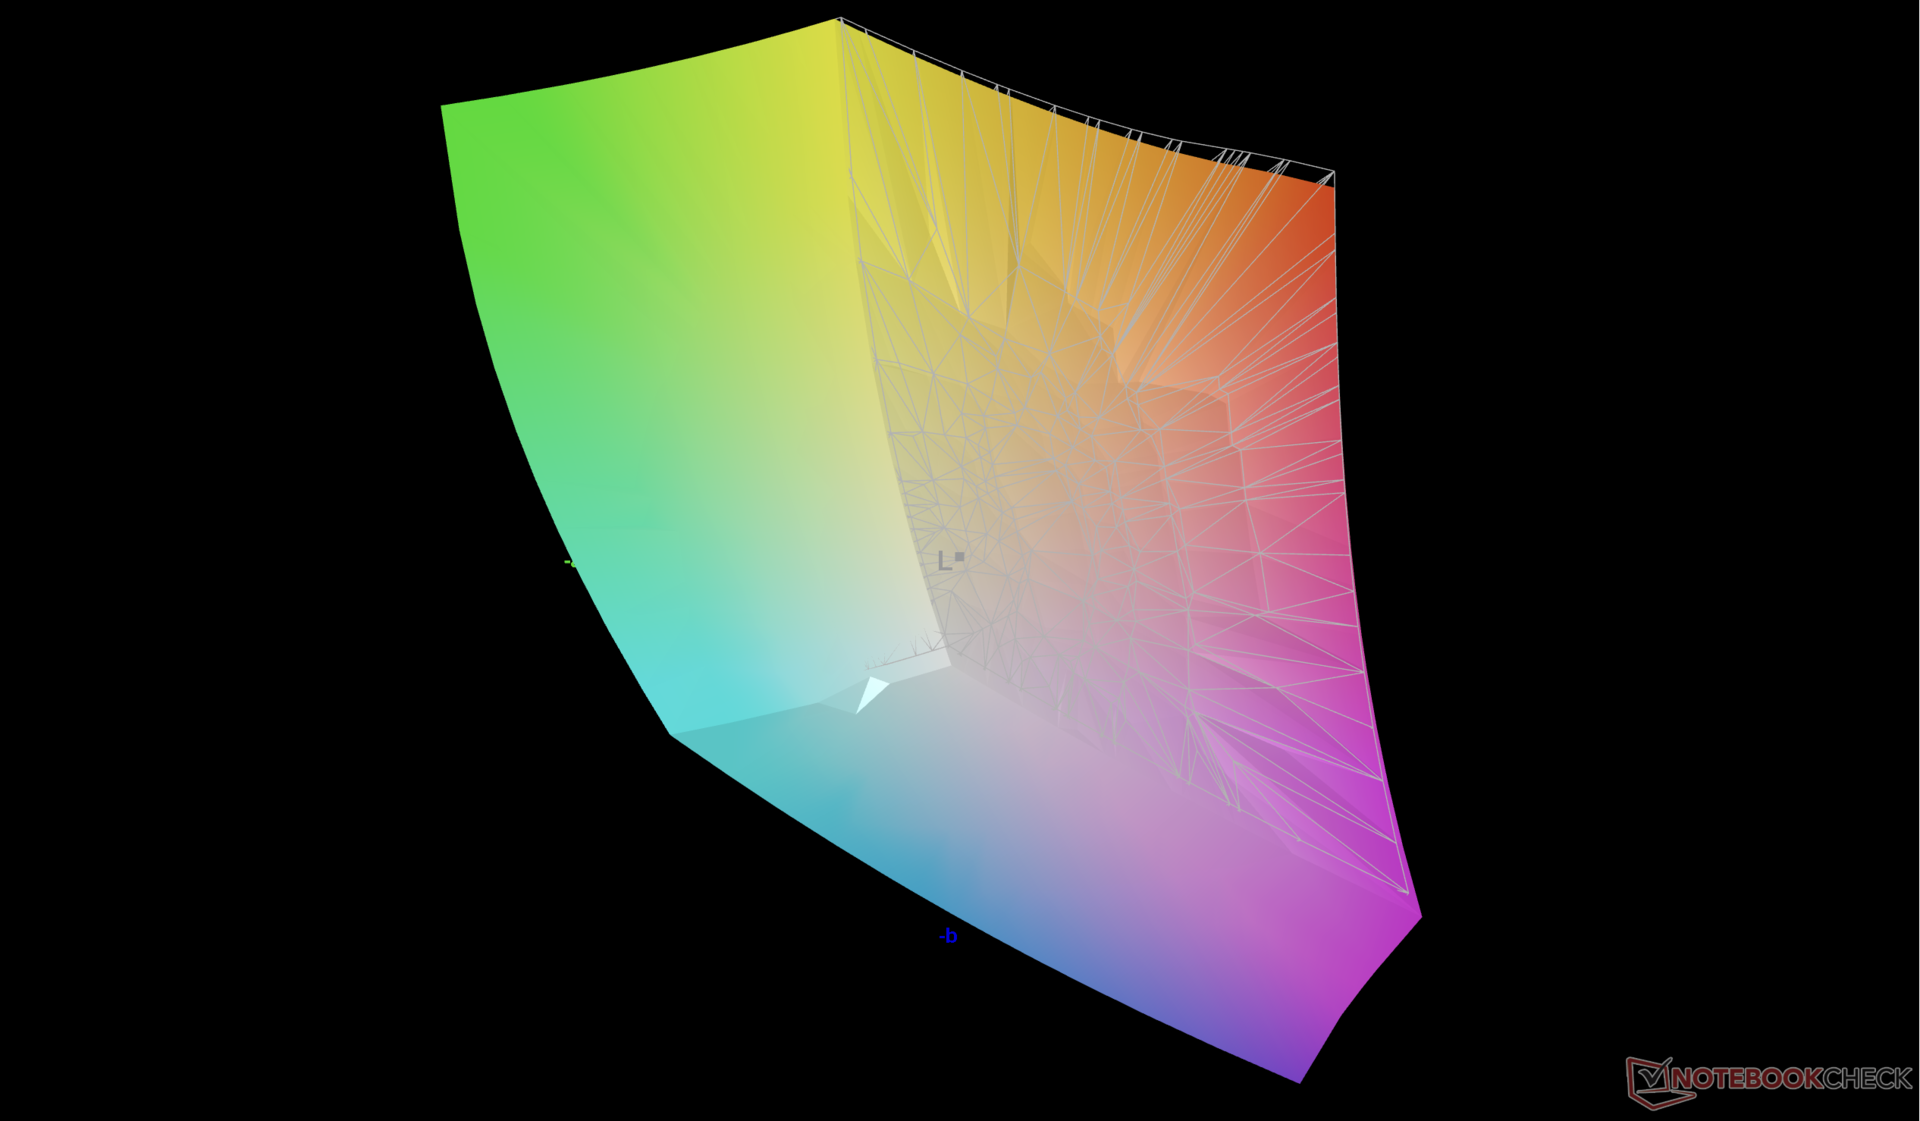
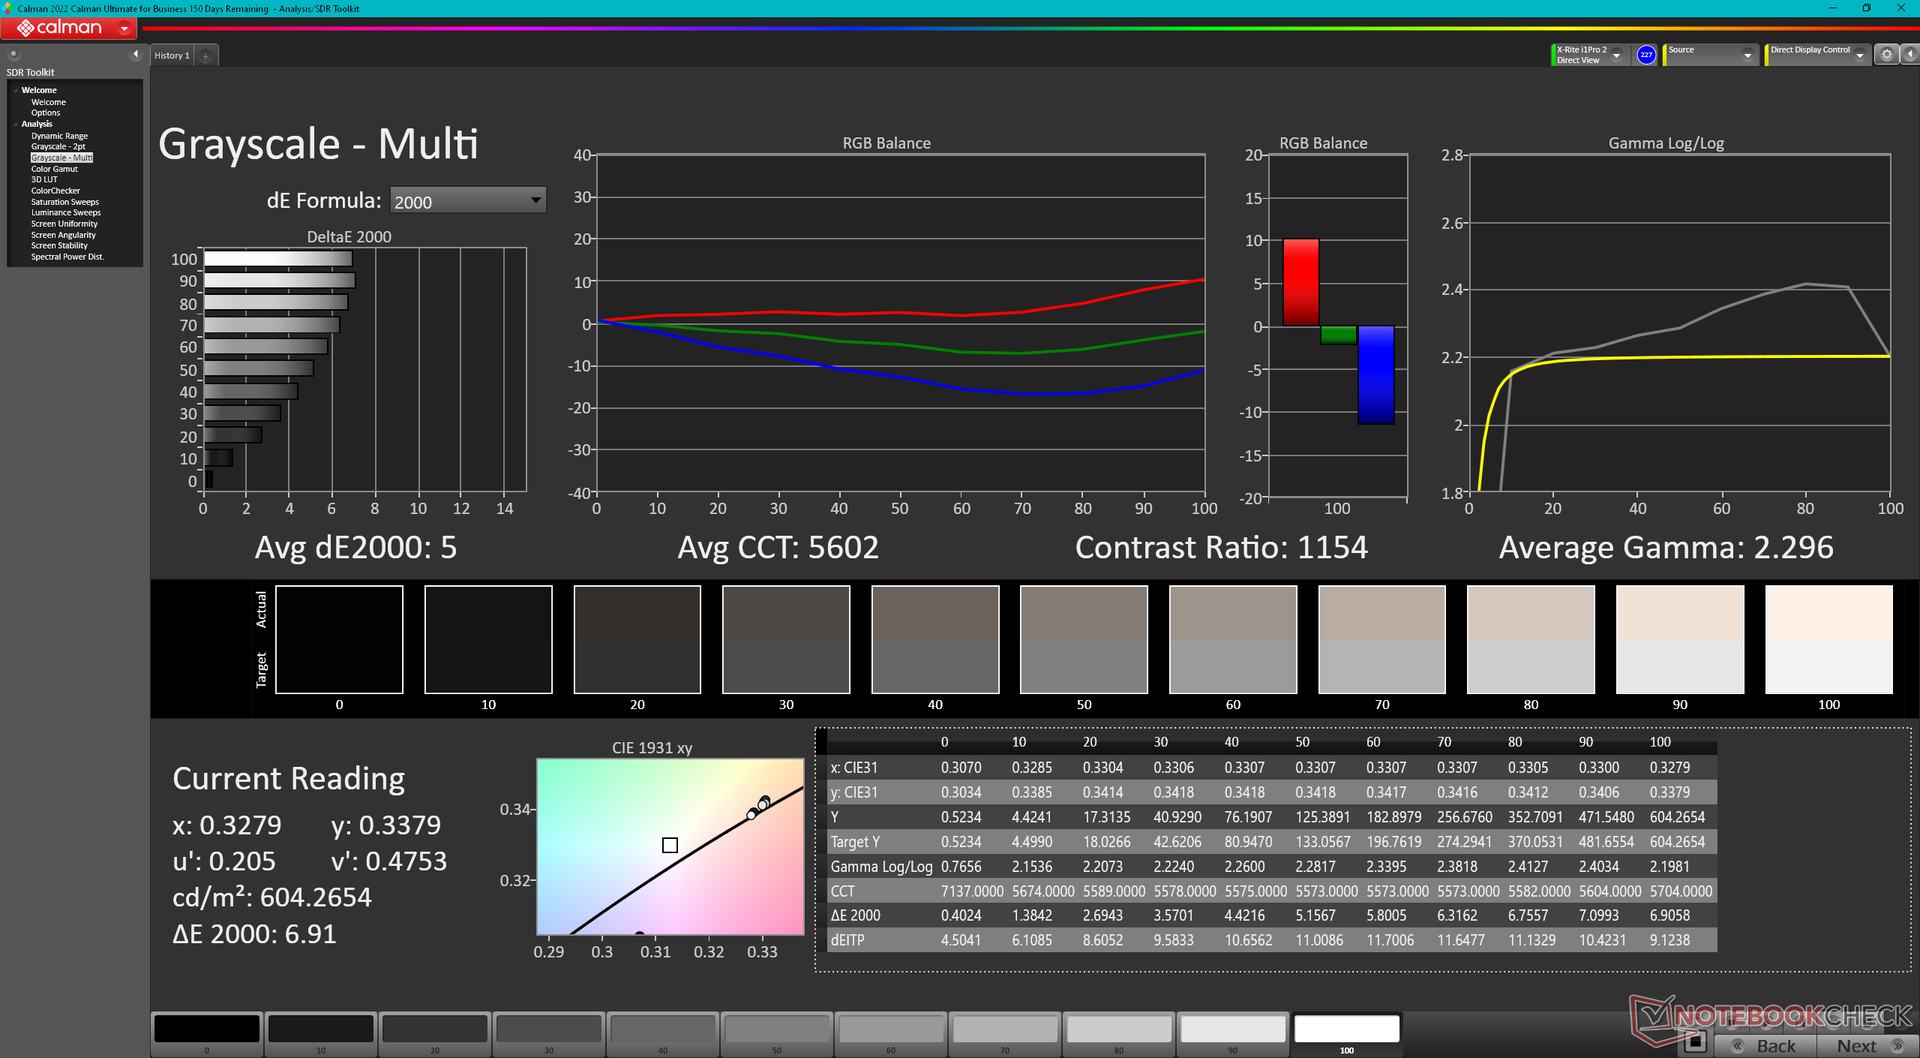
P3 standardı reklamı yapıldığı gibi tam olarak temsil ediliyor. Ancak Optimus ve dGPU modları arasında geçiş yaparken renkler can sıkıcı bir şekilde değişiyor. sRGB renkleri sırasıyla sadece 2,6 ve 1,53 ortalama DeltaE gri tonlama ve ColorChecker değerleriyle doğrudur, ancak P3 renkleri P3 moduna ayarlandığında bile daha yanlıştır. Örneğin renk sıcaklığı, P3'e ayarlandığında otomatik olarak 5600K'da daha sıcak hale gelir. Farklı GPU modları arasında geçiş yaparken P3 renklerinin nasıl gösterildiği ile ilgili bir hata olabilir.
Yanıt Sürelerini Görüntüle
| ↔ Tepki Süresi Siyahtan Beyaza | ||
|---|---|---|
| 14 ms ... yükseliş ↗ ve sonbahar↘ birleşimi | ↗ 6.6 ms yükseliş | 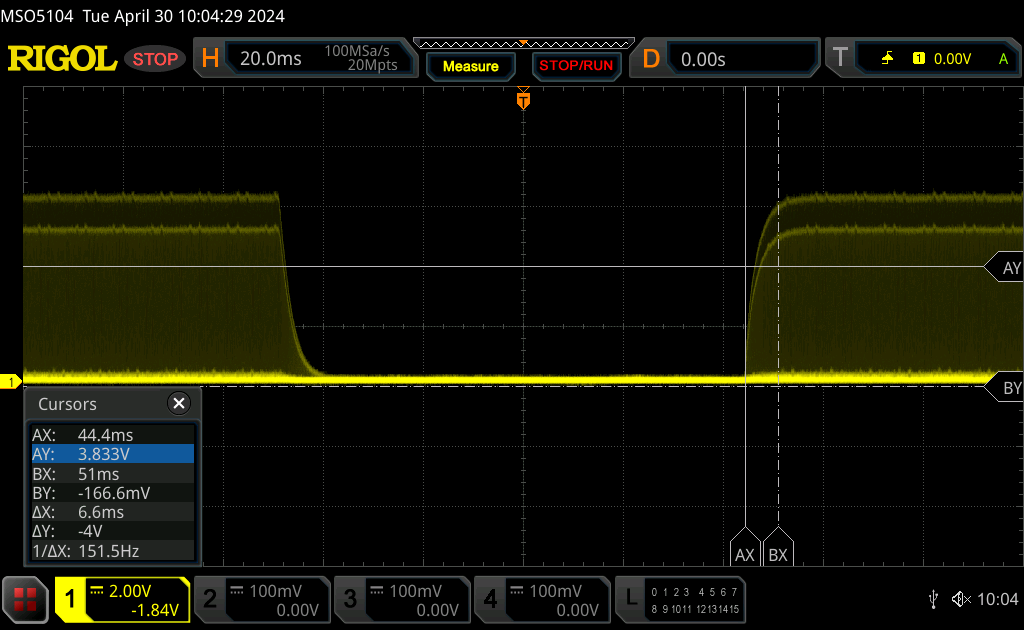 |
| ↘ 7.4 ms sonbahar | ||
| Ekran, testlerimizde iyi yanıt oranları gösteriyor ancak rekabetçi oyuncular için çok yavaş olabilir. Karşılaştırıldığında, test edilen tüm cihazlar 0.1 (minimum) ile 240 (maksimum) ms arasında değişir. » Tüm cihazların 34 %'si daha iyi. Bu, ölçülen yanıt süresinin test edilen tüm cihazların ortalamasından (19.8 ms) daha iyi olduğu anlamına gelir. | ||
| ↔ Tepki Süresi %50 Griden %80 Griye | ||
| 7.6 ms ... yükseliş ↗ ve sonbahar↘ birleşimi | ↗ 3.6 ms yükseliş | 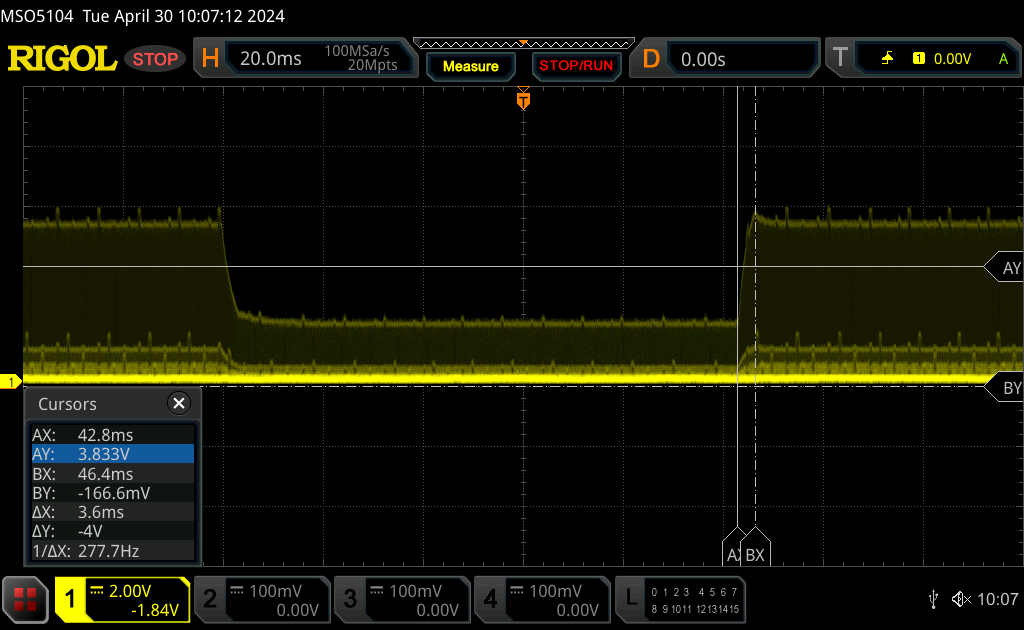 |
| ↘ 4 ms sonbahar | ||
| Ekran, testlerimizde çok hızlı yanıt oranları gösteriyor ve hızlı oyun oynamaya çok uygun olmalı. Karşılaştırıldığında, test edilen tüm cihazlar 0.165 (minimum) ile 636 (maksimum) ms arasında değişir. » Tüm cihazların 20 %'si daha iyi. Bu, ölçülen yanıt süresinin test edilen tüm cihazların ortalamasından (31 ms) daha iyi olduğu anlamına gelir. | ||
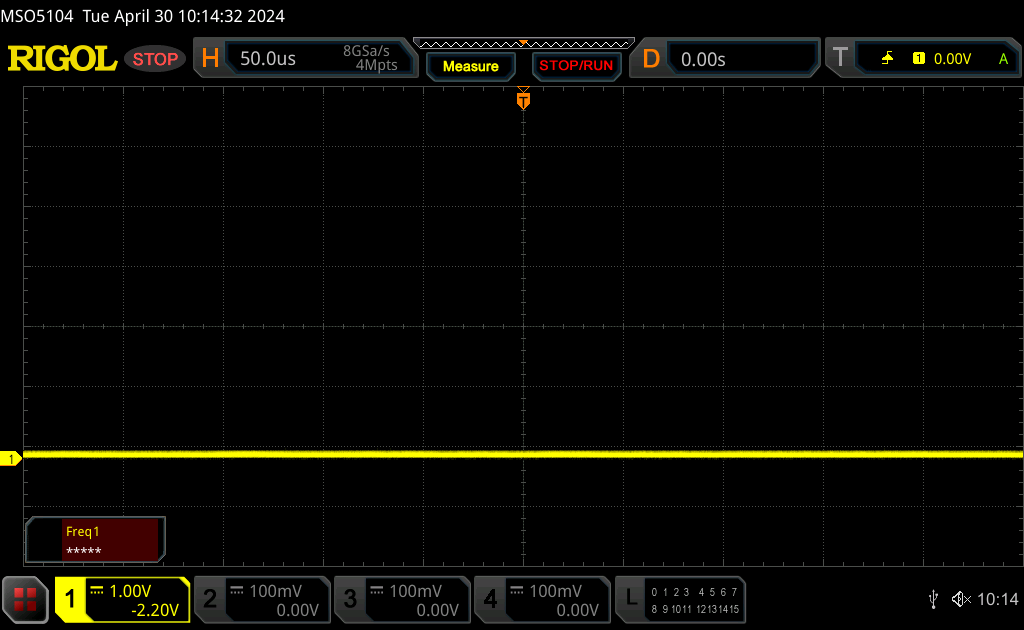
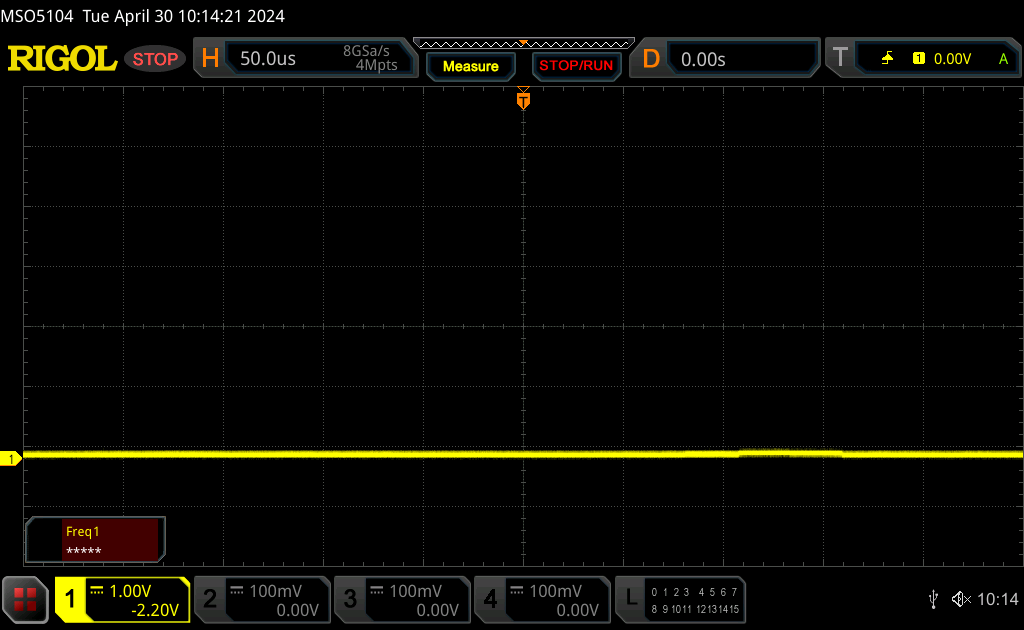
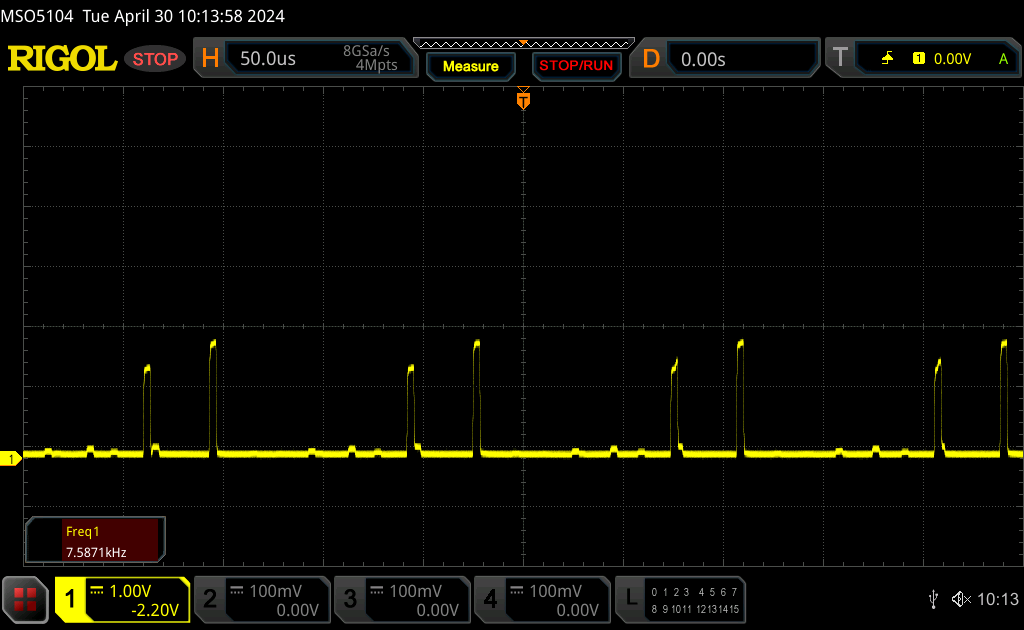
Ekran Titremesi / PWM (Darbe Genişliği Modülasyonu)
| Ekran titriyor / PWM algılandı | 26444 Hz | ≤ 100 % parlaklık ayarı | 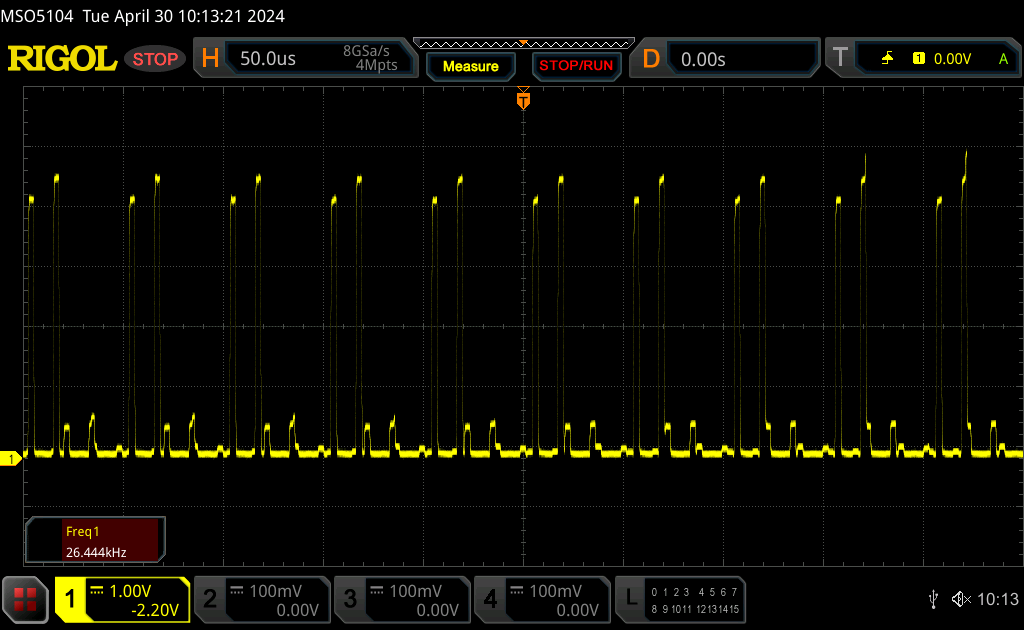 |
Ekran arka ışığı 26444 Hz'de titriyor (en kötü durum, örneğin PWM kullanılması) 100 % ve altındaki parlaklık ayarında titreme algılandı. Bu parlaklık ayarının üzerinde titreme veya PWM olmamalıdır. 26444 Hz frekansı oldukça yüksektir, bu nedenle PWM'ye duyarlı çoğu kullanıcı herhangi bir titremeyi fark etmemelidir. Karşılaştırıldığında: Test edilen tüm cihazların %52 %'si ekranı karartmak için PWM kullanmıyor. PWM tespit edilirse, ortalama 7750 (minimum: 5 - maksimum: 343500) Hz ölçüldü. | |||
Mini LED seçenekli diğer dizüstü bilgisayarlarda olduğu gibi titreme mevcuttur. Ancak sıklığı son derece yüksektir ve bu nedenle hassas kullanıcılar için göz yorgunluğuna neden olma olasılığı daha düşüktür. Parlaklık seviyeleri yüzde 50'nin altına düşürüldüğünde titreme yoğunluğunun da önemli ölçüde düştüğü görülüyor ve bu nedenle daha düşük parlaklık seviyeleri kötü bir fikir olmayabilir.

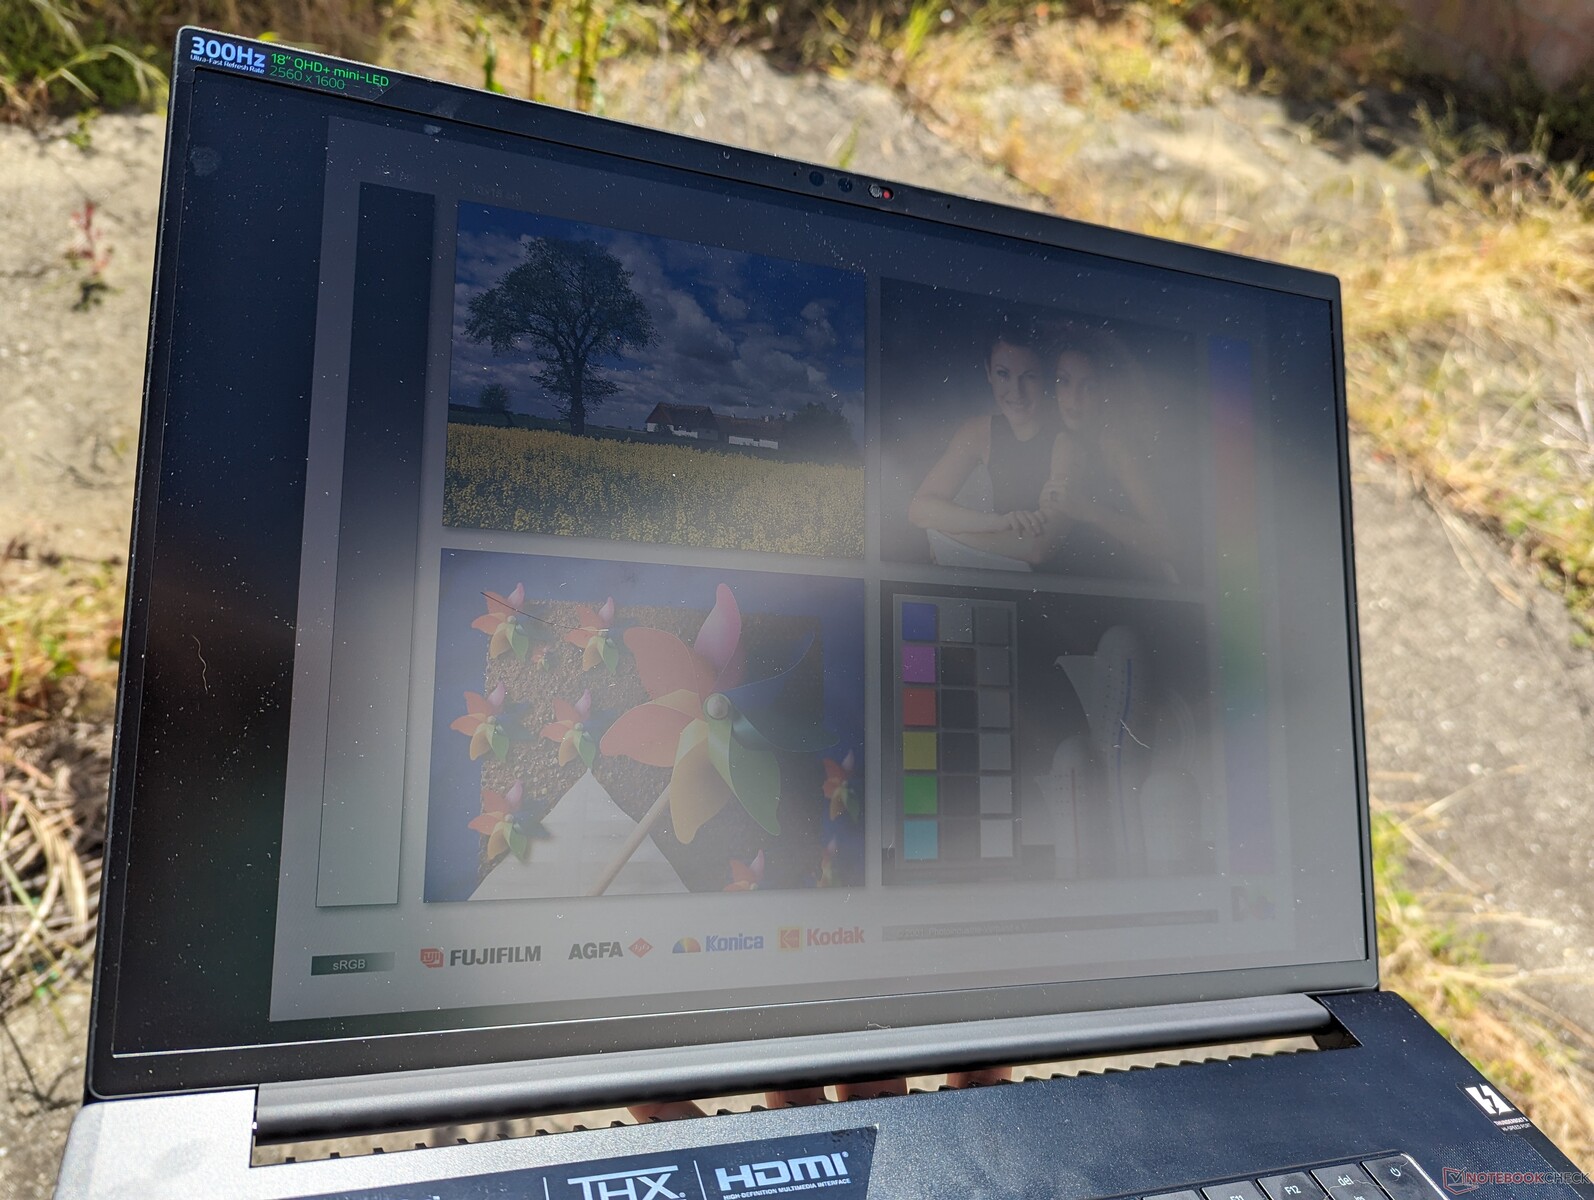
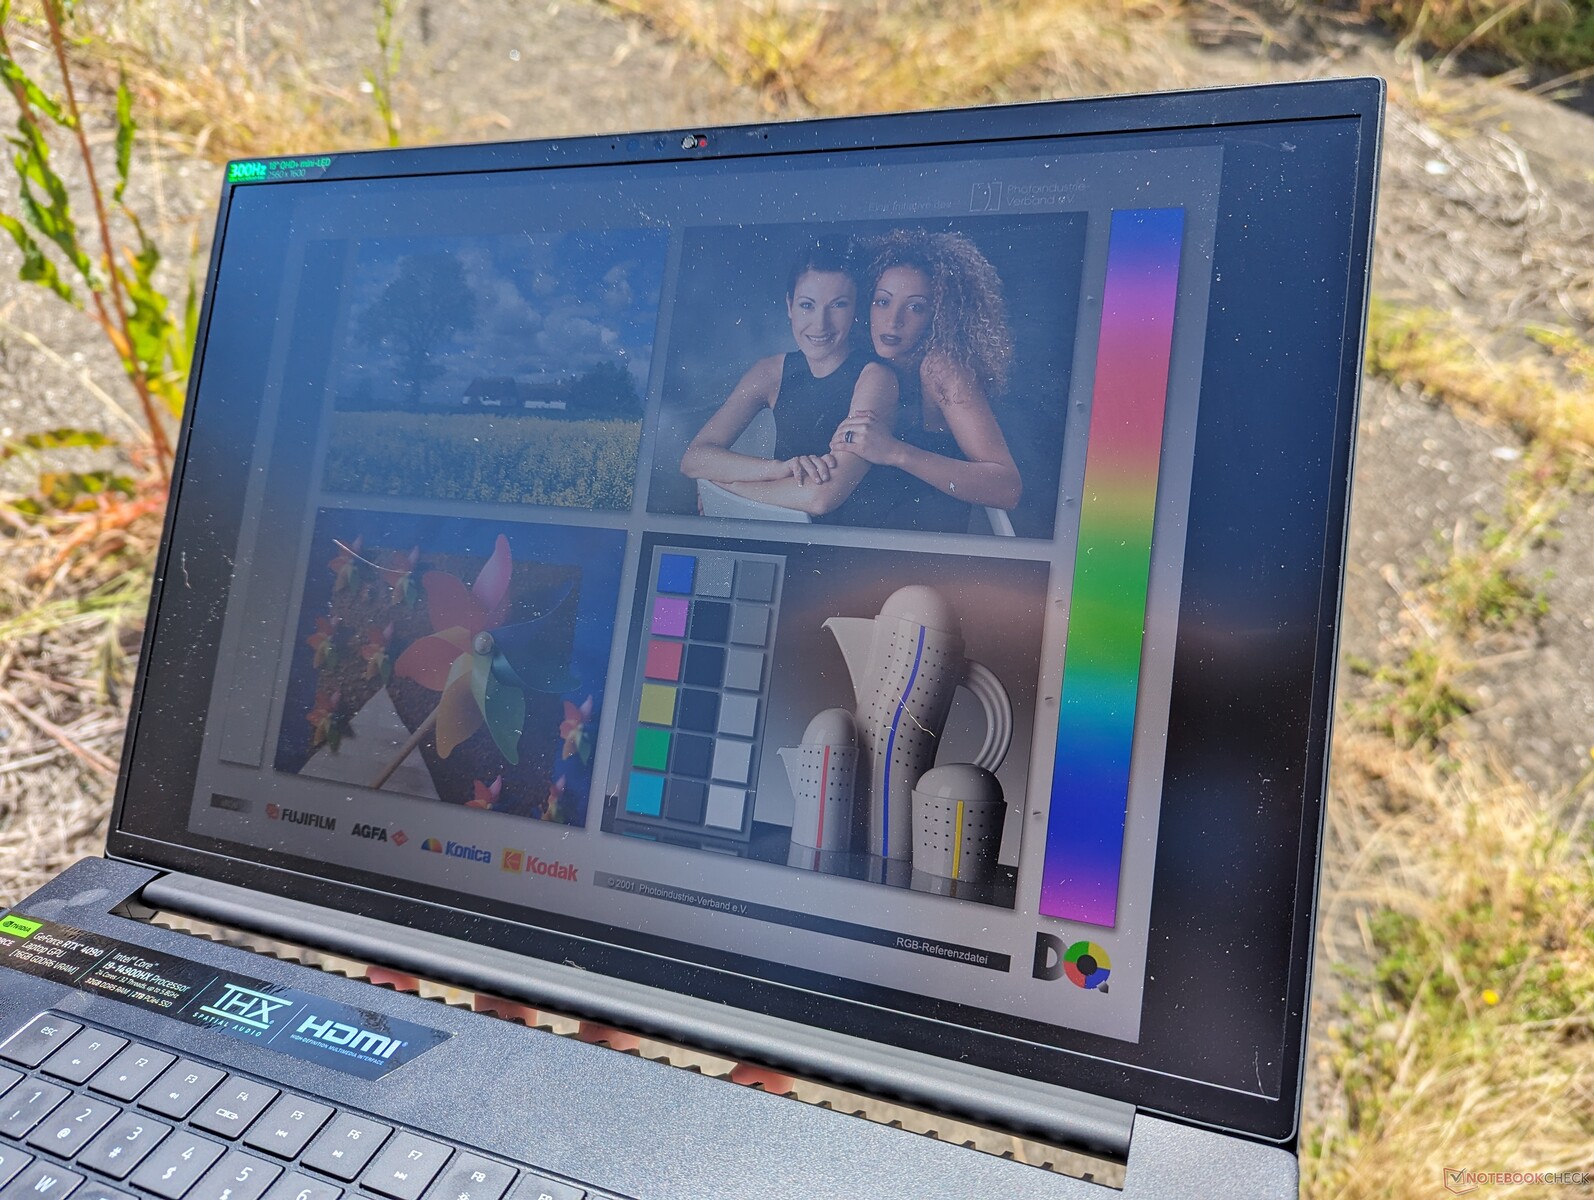
Özellikle mat kaplama parlamayı en aza indirdiği için dış mekan görünürlüğü gölgede iyidir. Bununla birlikte, optimum görüntüleme deneyimi için doğrudan güneş ışığından kaçınılmalıdır.
Performans - Geçen Yılla Aynı
Test Koşulları
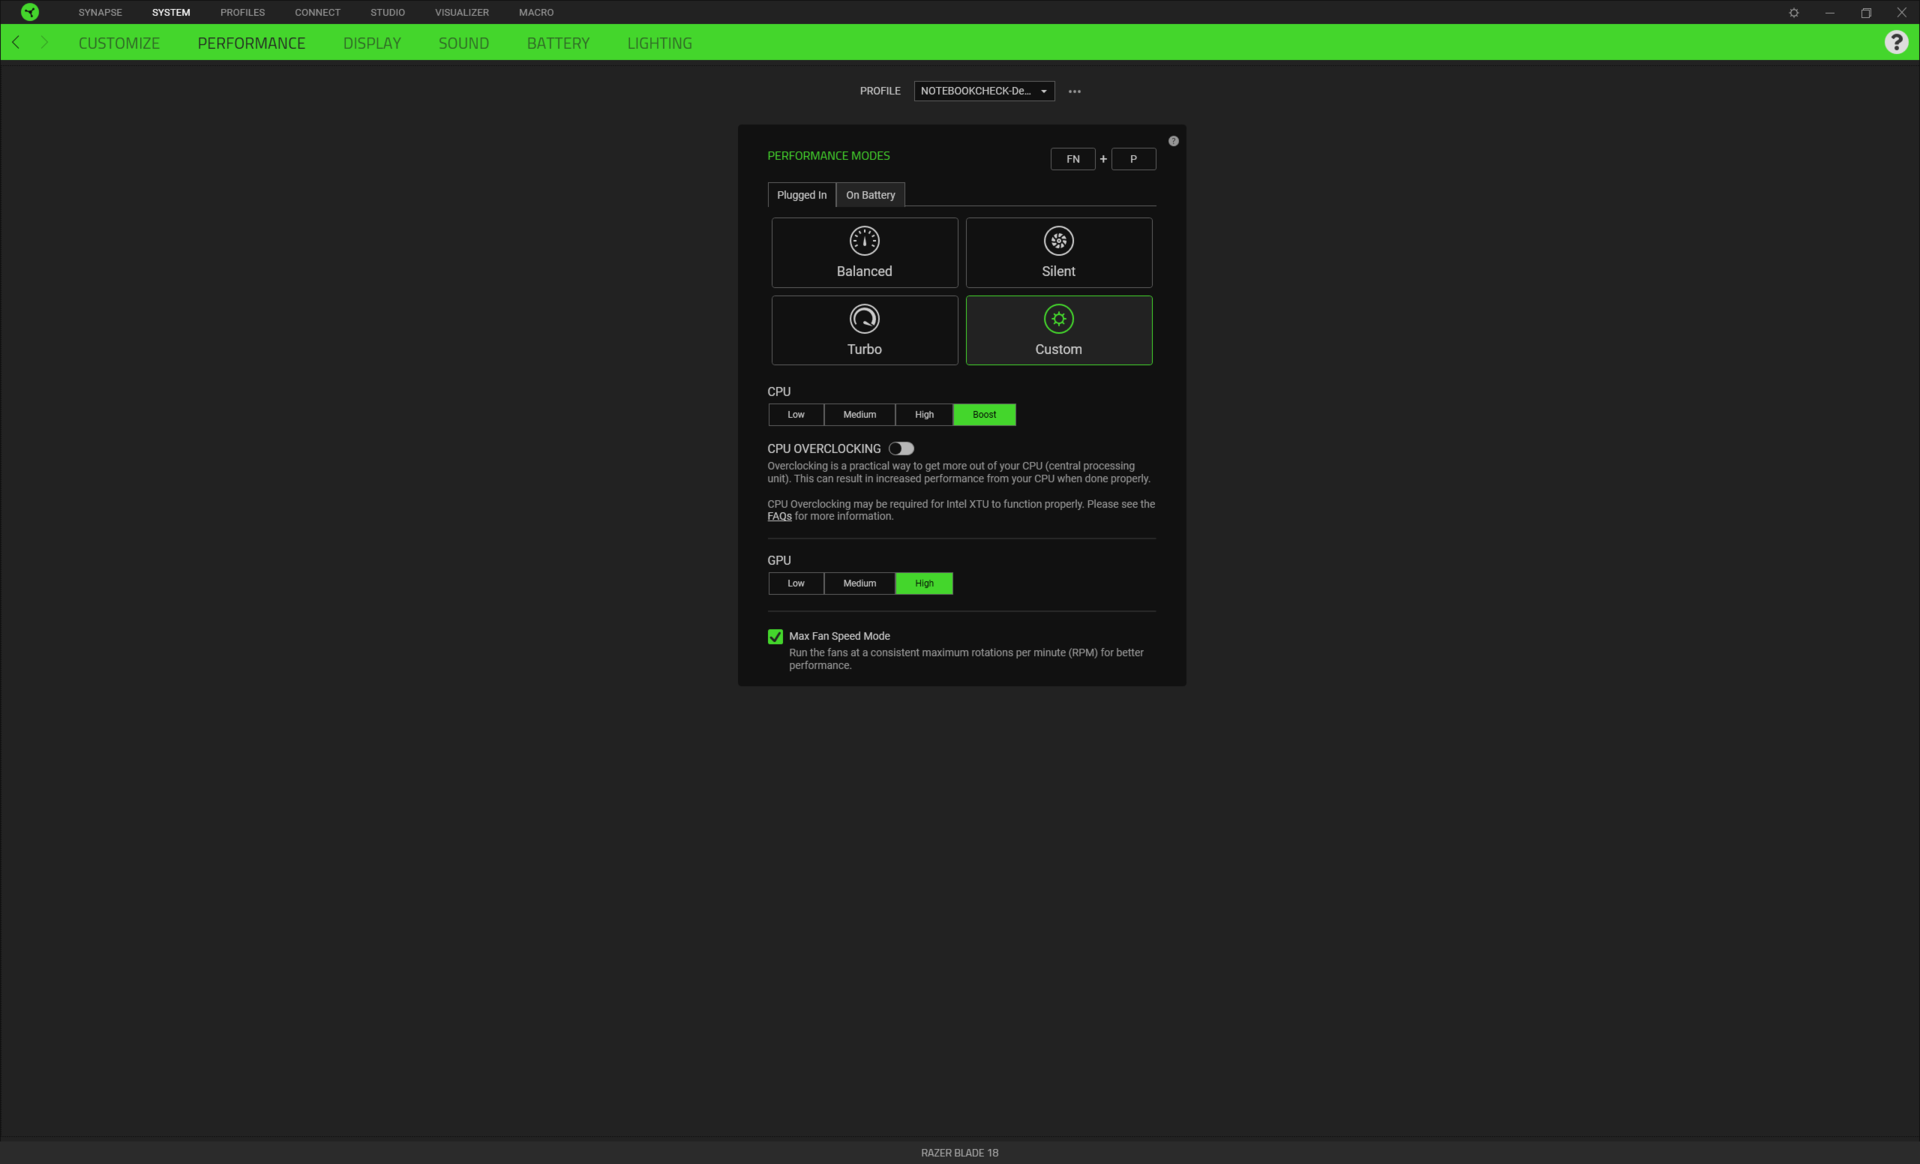
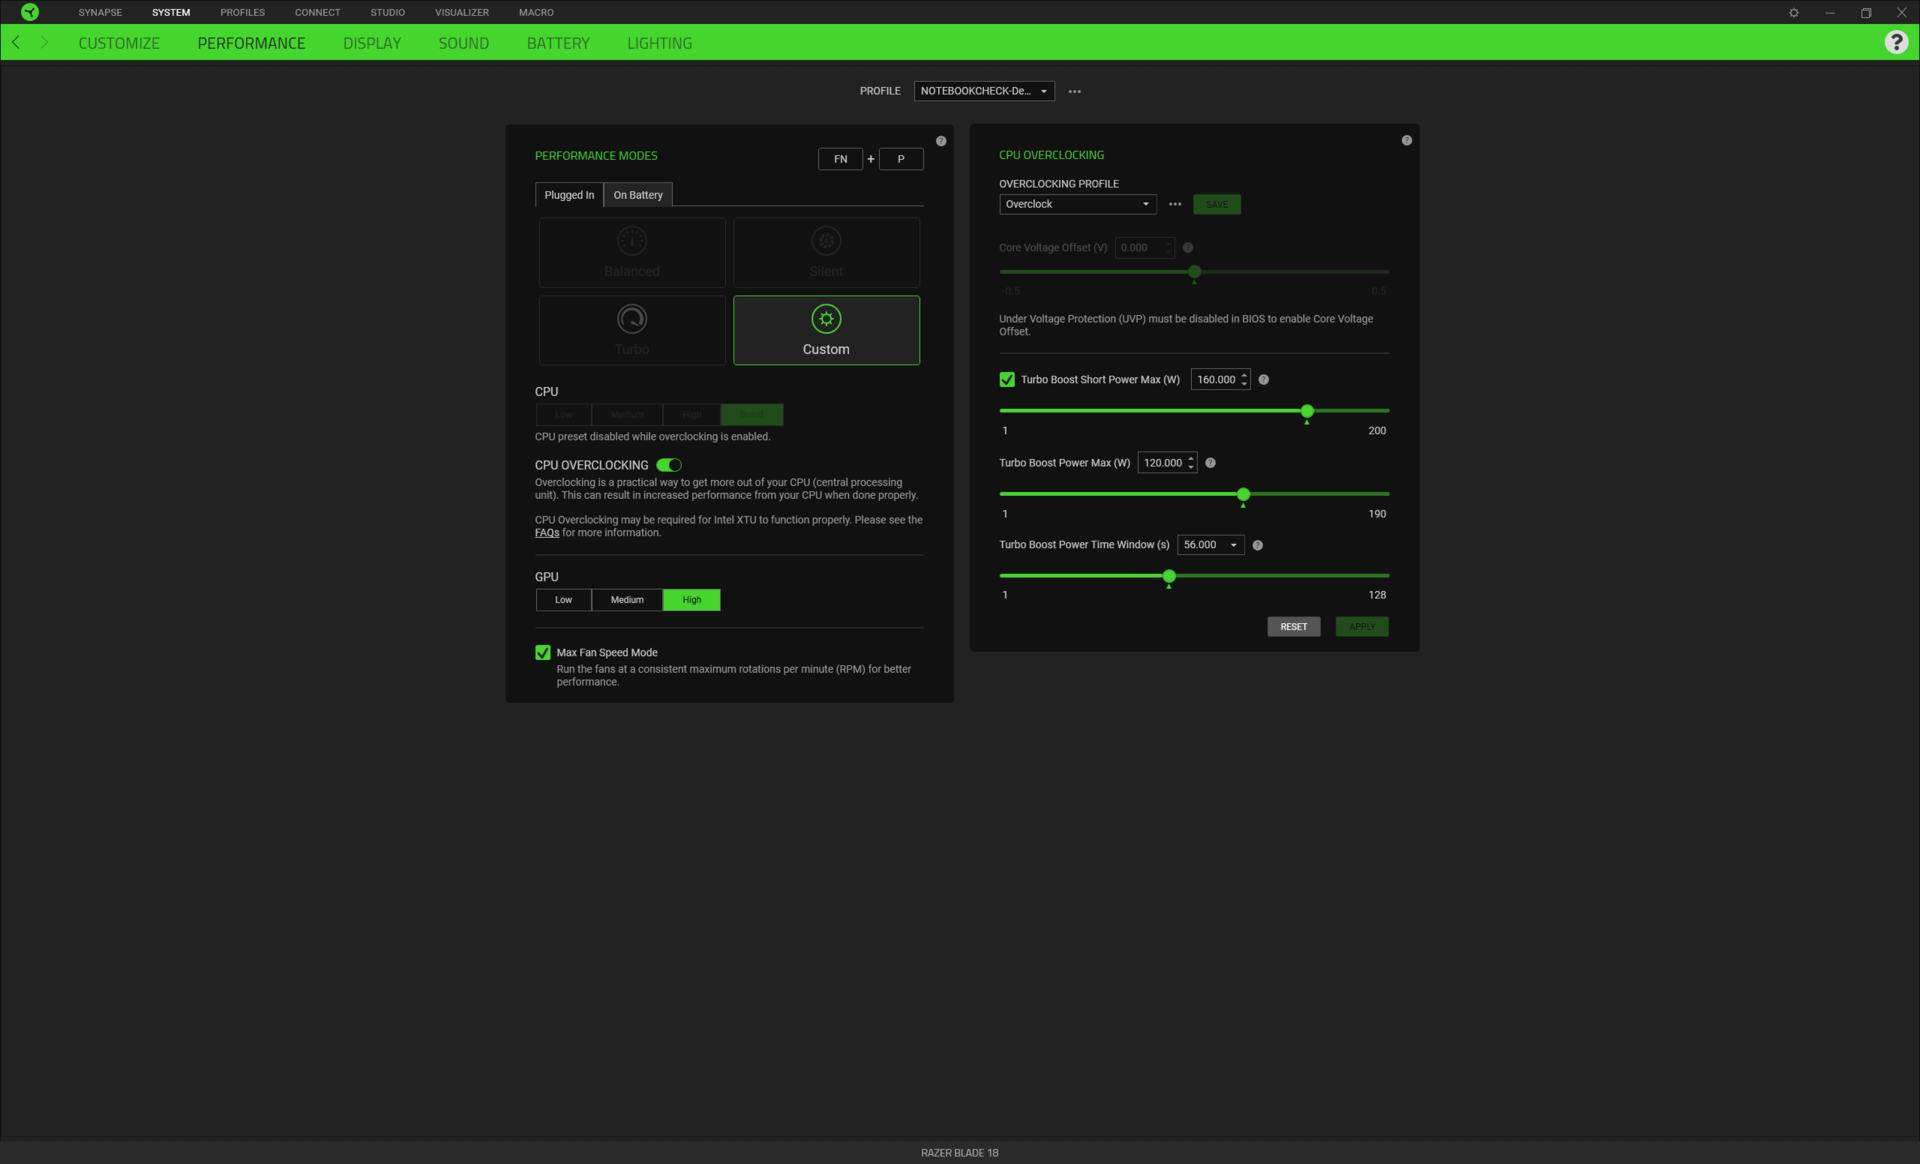
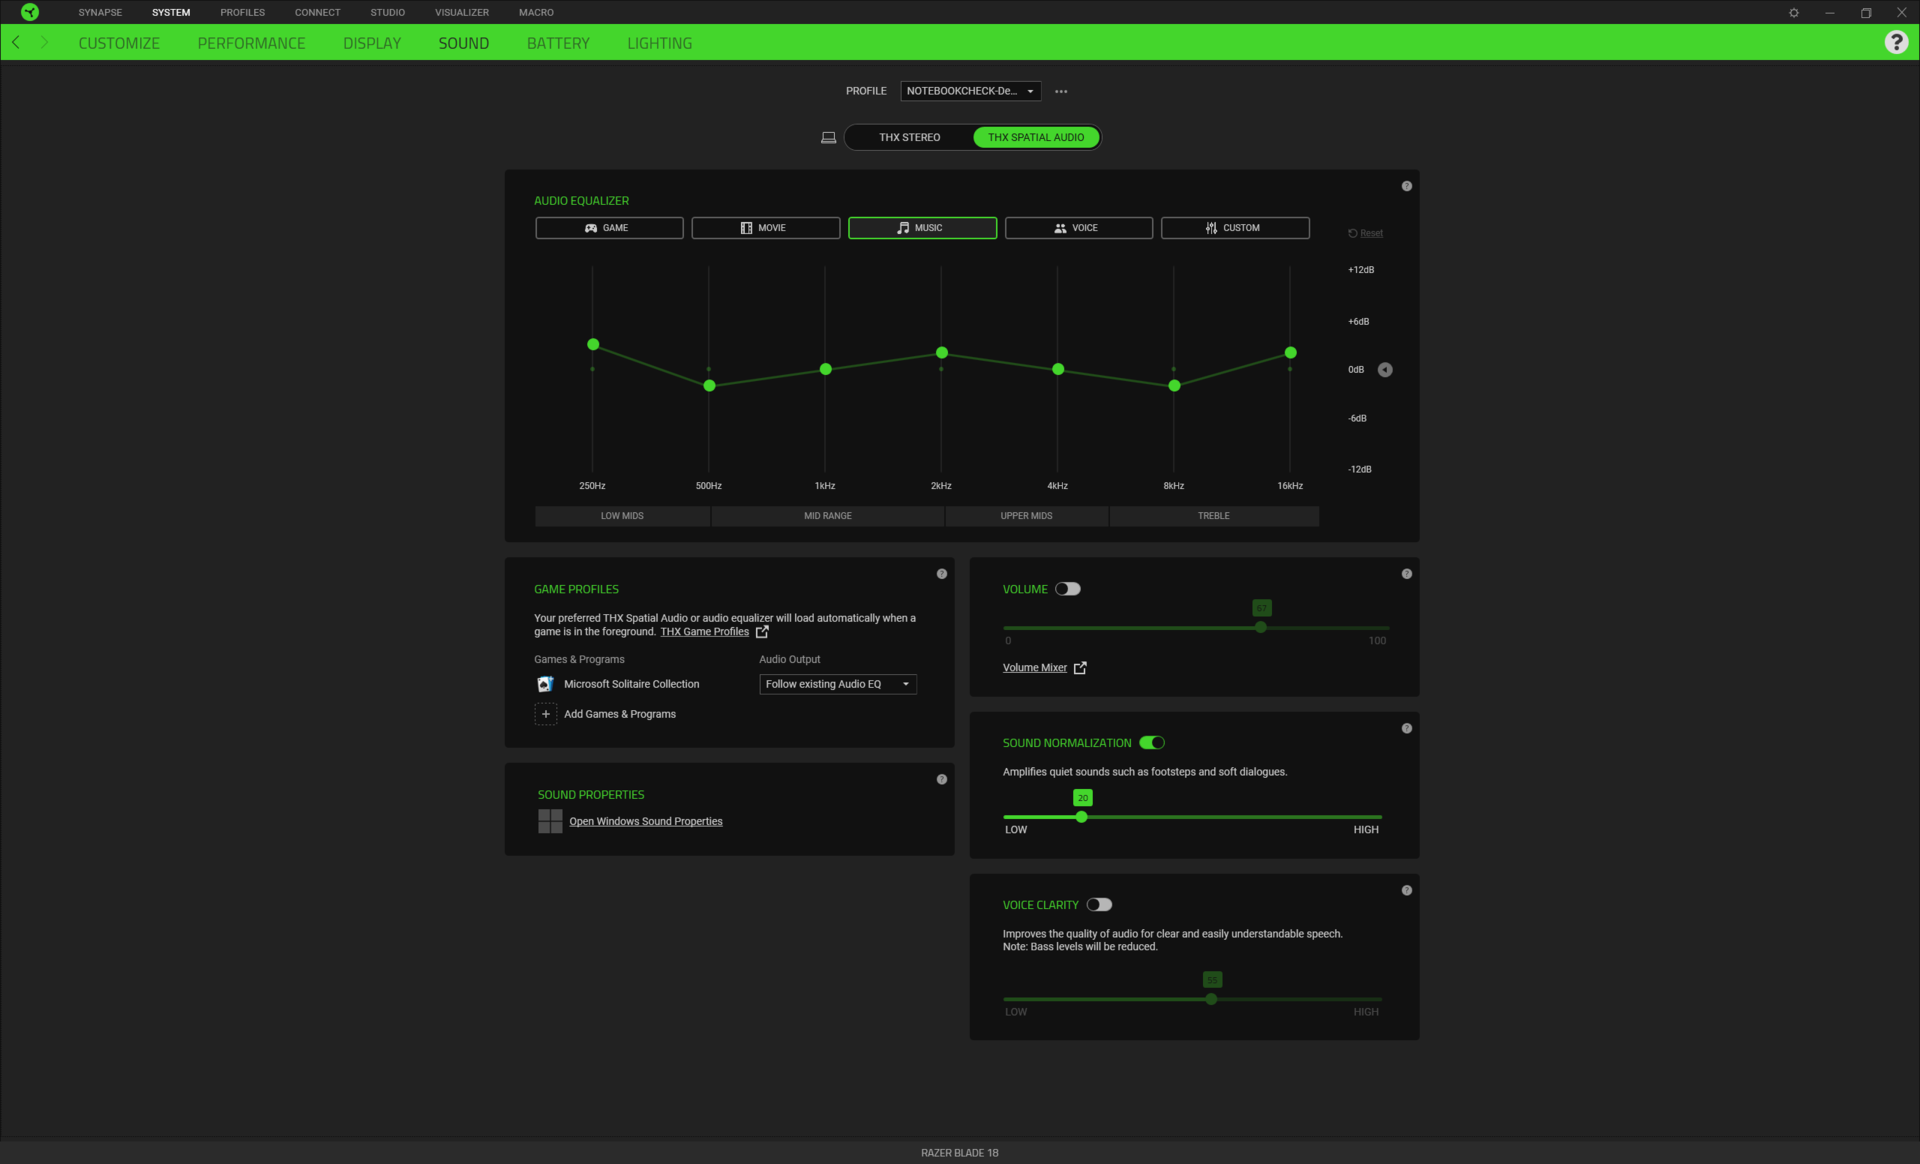
Razer, Synapse'i ek özellikler ve gelişmiş özelleştirme için onay kutuları ile güncellemeye devam ediyor. Bu yılki yenilikler arasında Turbo modu, Maksimum Fan modu ve yenileme hızını ayarlamak için renk profilleri ve kısayol tuşları gibi entegre ekran işlevleri yer alıyor. Aşağıdaki testlerimizin de göstereceği gibi yeni Turbo modunun aslında Özel moda eşdeğer olduğunu unutmayın. Razer, kullanıcıların oyun için "en iyi" modu seçmelerini kolaylaştırmak için Turbo modunu eklediklerini söylüyor, ancak artık aralarından seçim yapabileceğiniz çok fazla kafa karıştırıcı mod olduğu için bunun tam tersi bir etkiye sahip olabileceğini düşünüyoruz. Aşağıdaki tüm testlerimiz, aksi belirtilmediği sürece CPU ve GPU sırasıyla Boost ve High olarak ayarlanarak Custom modunda gerçekleştirilmiştir.
Belki de akılda tutulması gereken en önemli özellik, Ekran sekmesi altındaki yerel karartma geçişidir. İlginç bir şekilde, yerel karartma mini-LED'in en önemli satış noktalarından biri olmasına rağmen Razer bunu varsayılan olarak kapatmıştır. Bu özelliğin açılması, yukarıda belirtildiği gibi HDR modunda parlaklık seviyelerini büyük ölçüde etkileyebilir.
İşlemci
Oysa 12. nesilden Core i9-12900HX 13. kuşağa Core i9-13900HX 13. nesil Core i9-13900HX'ten 14. nesil Core i9-13900HX'e geçiş yüzde 25 ila 30 performans artışı sağlayacaktır Core i9-14900HX esasen düz bir çizgidir. Hem tek hem de çok iş parçacıklı iş yüklerinde 2023 ve 2024 Blade 18 modellerimiz arasındaki kıyaslama sonuçları birbirlerine yüzde 5 puan yakın olacaktır. I9-14900HX, gayri resmi olarak i9-13900HX'in yeniden markalanması olarak tanımlanır ve rakamlarımız bunu yansıtır.
| Güç Profili | CineBench R23 xT Puanı (Puan) | Sürekli CPU Güç Seviyesi (W) | Cyberpunk 2077 QHD Ultra (FPS) |
| Dengeli | 14269 | 55 -> 45 | 65.13 |
| Turbo | 27029 | 135 -> 125 | 84.69 |
| Özel w/ Maksimum Fan Açık | 27167 | 135 -> 125 | 85.46 |
İlginç bir şekilde, Razer sistemimizden elde edilen CPU sonuçları, aynı CPU'ya sahip diğer oyun dizüstü bilgisayarlarından biraz ama sürekli olarak daha yavaş olacaktır Alienware m18 R2 veya MSI Titan 18 HX. Bunun Synapse yazılımı aracılığıyla daha fazla hız aşırtma boşluğu sağlamak için kasıtlı olarak yapıldığından şüpheleniyoruz. CPU Turbo Boost performansı ve TDP seviyeleri, yukarıdaki tabloda gösterildiği gibi farklı güç profillerine bağlıdır.
Cinebench R15 Multi Loop
Cinebench R23: Multi Core | Single Core
Cinebench R20: CPU (Multi Core) | CPU (Single Core)
Cinebench R15: CPU Multi 64Bit | CPU Single 64Bit
Blender: v2.79 BMW27 CPU
7-Zip 18.03: 7z b 4 | 7z b 4 -mmt1
Geekbench 6.7: Multi-Core | Single-Core
Geekbench 5.5: Multi-Core | Single-Core
HWBOT x265 Benchmark v2.2: 4k Preset
LibreOffice : 20 Documents To PDF
R Benchmark 2.5: Overall mean
| CPU Performance rating | |
| Alienware m18 R1 AMD | |
| Asus ROG Strix Scar 17 G733PYV-LL053X | |
| Alienware m18 R2 | |
| Alienware m18 R1 -2! | |
| MSI Titan 18 HX A14VIG | |
| Razer Blade 16 2024, RTX 4090 | |
| Asus ROG Strix Scar 18 G834JYR (2024) | |
| Ortalama Intel Core i9-14900HX | |
| Razer Blade 18 RTX 4070 -2! | |
| Razer Blade 18 2024 RZ09-0509 | |
| MSI Titan GT77 12UHS -2! | |
| Asus TUF Gaming A17 FA707XI-NS94 | |
| MSI Pulse 17 B13VGK | |
| Acer Nitro 17 AN17-41-R9LN | |
| Cinebench R23 / Multi Core | |
| Alienware m18 R1 AMD | |
| Asus ROG Strix Scar 17 G733PYV-LL053X | |
| Alienware m18 R1 | |
| MSI Titan 18 HX A14VIG | |
| Alienware m18 R2 | |
| Razer Blade 16 2024, RTX 4090 | |
| Ortalama Intel Core i9-14900HX (17078 - 36249, n=37) | |
| Razer Blade 18 RTX 4070 | |
| Asus ROG Strix Scar 18 G834JYR (2024) | |
| Razer Blade 18 2024 RZ09-0509 | |
| MSI Titan GT77 12UHS | |
| MSI Pulse 17 B13VGK | |
| Asus TUF Gaming A17 FA707XI-NS94 | |
| Acer Nitro 17 AN17-41-R9LN | |
| Cinebench R23 / Single Core | |
| Alienware m18 R2 | |
| Asus ROG Strix Scar 18 G834JYR (2024) | |
| Ortalama Intel Core i9-14900HX (1720 - 2245, n=37) | |
| MSI Titan 18 HX A14VIG | |
| Razer Blade 16 2024, RTX 4090 | |
| Alienware m18 R1 | |
| Razer Blade 18 2024 RZ09-0509 | |
| Razer Blade 18 RTX 4070 | |
| Alienware m18 R1 AMD | |
| Asus ROG Strix Scar 17 G733PYV-LL053X | |
| MSI Titan GT77 12UHS | |
| Asus TUF Gaming A17 FA707XI-NS94 | |
| MSI Pulse 17 B13VGK | |
| Acer Nitro 17 AN17-41-R9LN | |
| Cinebench R20 / CPU (Multi Core) | |
| Alienware m18 R1 AMD | |
| Asus ROG Strix Scar 17 G733PYV-LL053X | |
| Alienware m18 R1 | |
| MSI Titan 18 HX A14VIG | |
| Alienware m18 R2 | |
| Ortalama Intel Core i9-14900HX (6579 - 13832, n=37) | |
| Razer Blade 16 2024, RTX 4090 | |
| Razer Blade 18 RTX 4070 | |
| Razer Blade 18 2024 RZ09-0509 | |
| Asus ROG Strix Scar 18 G834JYR (2024) | |
| MSI Titan GT77 12UHS | |
| MSI Pulse 17 B13VGK | |
| Asus TUF Gaming A17 FA707XI-NS94 | |
| Acer Nitro 17 AN17-41-R9LN | |
| Cinebench R20 / CPU (Single Core) | |
| Alienware m18 R2 | |
| Asus ROG Strix Scar 18 G834JYR (2024) | |
| Ortalama Intel Core i9-14900HX (657 - 859, n=37) | |
| MSI Titan 18 HX A14VIG | |
| Razer Blade 18 2024 RZ09-0509 | |
| Razer Blade 16 2024, RTX 4090 | |
| Alienware m18 R1 | |
| Razer Blade 18 RTX 4070 | |
| Asus ROG Strix Scar 17 G733PYV-LL053X | |
| Alienware m18 R1 AMD | |
| MSI Titan GT77 12UHS | |
| Asus TUF Gaming A17 FA707XI-NS94 | |
| MSI Pulse 17 B13VGK | |
| Acer Nitro 17 AN17-41-R9LN | |
| Cinebench R15 / CPU Multi 64Bit | |
| Asus ROG Strix Scar 17 G733PYV-LL053X | |
| Alienware m18 R1 AMD | |
| Alienware m18 R1 | |
| Alienware m18 R2 | |
| MSI Titan 18 HX A14VIG | |
| Razer Blade 18 RTX 4070 | |
| Razer Blade 16 2024, RTX 4090 | |
| Ortalama Intel Core i9-14900HX (3263 - 5589, n=38) | |
| Razer Blade 18 2024 RZ09-0509 | |
| Asus ROG Strix Scar 18 G834JYR (2024) | |
| MSI Titan GT77 12UHS | |
| MSI Pulse 17 B13VGK | |
| Asus TUF Gaming A17 FA707XI-NS94 | |
| Acer Nitro 17 AN17-41-R9LN | |
| Cinebench R15 / CPU Single 64Bit | |
| Alienware m18 R2 | |
| Asus ROG Strix Scar 17 G733PYV-LL053X | |
| Razer Blade 16 2024, RTX 4090 | |
| Alienware m18 R1 AMD | |
| Ortalama Intel Core i9-14900HX (247 - 323, n=37) | |
| Razer Blade 18 2024 RZ09-0509 | |
| Alienware m18 R1 | |
| Asus ROG Strix Scar 18 G834JYR (2024) | |
| MSI Titan 18 HX A14VIG | |
| Razer Blade 18 RTX 4070 | |
| Asus TUF Gaming A17 FA707XI-NS94 | |
| MSI Titan GT77 12UHS | |
| Acer Nitro 17 AN17-41-R9LN | |
| MSI Pulse 17 B13VGK | |
| Blender / v2.79 BMW27 CPU | |
| Acer Nitro 17 AN17-41-R9LN | |
| Asus TUF Gaming A17 FA707XI-NS94 | |
| MSI Pulse 17 B13VGK | |
| MSI Titan GT77 12UHS | |
| Ortalama Intel Core i9-14900HX (91 - 206, n=37) | |
| Asus ROG Strix Scar 18 G834JYR (2024) | |
| Razer Blade 18 2024 RZ09-0509 | |
| Razer Blade 16 2024, RTX 4090 | |
| Razer Blade 18 RTX 4070 | |
| MSI Titan 18 HX A14VIG | |
| Alienware m18 R2 | |
| Alienware m18 R1 | |
| Asus ROG Strix Scar 17 G733PYV-LL053X | |
| Alienware m18 R1 AMD | |
| 7-Zip 18.03 / 7z b 4 | |
| Alienware m18 R1 AMD | |
| Asus ROG Strix Scar 17 G733PYV-LL053X | |
| Alienware m18 R1 | |
| Alienware m18 R2 | |
| MSI Titan 18 HX A14VIG | |
| Razer Blade 18 RTX 4070 | |
| Razer Blade 16 2024, RTX 4090 | |
| Asus ROG Strix Scar 18 G834JYR (2024) | |
| Ortalama Intel Core i9-14900HX (66769 - 136645, n=37) | |
| Razer Blade 18 2024 RZ09-0509 | |
| MSI Titan GT77 12UHS | |
| MSI Pulse 17 B13VGK | |
| Asus TUF Gaming A17 FA707XI-NS94 | |
| Acer Nitro 17 AN17-41-R9LN | |
| 7-Zip 18.03 / 7z b 4 -mmt1 | |
| Asus ROG Strix Scar 17 G733PYV-LL053X | |
| Alienware m18 R1 AMD | |
| Asus ROG Strix Scar 18 G834JYR (2024) | |
| Alienware m18 R2 | |
| Ortalama Intel Core i9-14900HX (5452 - 7545, n=37) | |
| Razer Blade 16 2024, RTX 4090 | |
| Alienware m18 R1 | |
| Razer Blade 18 RTX 4070 | |
| Asus TUF Gaming A17 FA707XI-NS94 | |
| MSI Titan 18 HX A14VIG | |
| Razer Blade 18 2024 RZ09-0509 | |
| MSI Titan GT77 12UHS | |
| Acer Nitro 17 AN17-41-R9LN | |
| MSI Pulse 17 B13VGK | |
| Geekbench 6.7 / Multi-Core | |
| Alienware m18 R2 | |
| Asus ROG Strix Scar 18 G834JYR (2024) | |
| Razer Blade 16 2024, RTX 4090 | |
| Ortalama Intel Core i9-14900HX (13158 - 19665, n=37) | |
| Razer Blade 18 2024 RZ09-0509 | |
| Asus ROG Strix Scar 17 G733PYV-LL053X | |
| MSI Titan 18 HX A14VIG | |
| Alienware m18 R1 AMD | |
| MSI Pulse 17 B13VGK | |
| Asus TUF Gaming A17 FA707XI-NS94 | |
| Acer Nitro 17 AN17-41-R9LN | |
| Geekbench 6.7 / Single-Core | |
| Alienware m18 R2 | |
| Asus ROG Strix Scar 18 G834JYR (2024) | |
| Ortalama Intel Core i9-14900HX (2419 - 3129, n=37) | |
| Razer Blade 16 2024, RTX 4090 | |
| Asus ROG Strix Scar 17 G733PYV-LL053X | |
| Alienware m18 R1 AMD | |
| MSI Titan 18 HX A14VIG | |
| Razer Blade 18 2024 RZ09-0509 | |
| Asus TUF Gaming A17 FA707XI-NS94 | |
| MSI Pulse 17 B13VGK | |
| Acer Nitro 17 AN17-41-R9LN | |
| Geekbench 5.5 / Multi-Core | |
| Alienware m18 R1 | |
| Alienware m18 R2 | |
| Razer Blade 18 RTX 4070 | |
| Asus ROG Strix Scar 18 G834JYR (2024) | |
| Asus ROG Strix Scar 17 G733PYV-LL053X | |
| Alienware m18 R1 AMD | |
| Ortalama Intel Core i9-14900HX (8618 - 23194, n=37) | |
| Razer Blade 16 2024, RTX 4090 | |
| Razer Blade 18 2024 RZ09-0509 | |
| MSI Titan 18 HX A14VIG | |
| MSI Titan GT77 12UHS | |
| MSI Pulse 17 B13VGK | |
| Asus TUF Gaming A17 FA707XI-NS94 | |
| Acer Nitro 17 AN17-41-R9LN | |
| Geekbench 5.5 / Single-Core | |
| Alienware m18 R2 | |
| Asus ROG Strix Scar 17 G733PYV-LL053X | |
| Razer Blade 16 2024, RTX 4090 | |
| Alienware m18 R1 AMD | |
| Asus ROG Strix Scar 18 G834JYR (2024) | |
| MSI Titan 18 HX A14VIG | |
| Ortalama Intel Core i9-14900HX (1669 - 2210, n=37) | |
| Alienware m18 R1 | |
| Razer Blade 18 RTX 4070 | |
| Razer Blade 18 2024 RZ09-0509 | |
| Asus TUF Gaming A17 FA707XI-NS94 | |
| MSI Titan GT77 12UHS | |
| MSI Pulse 17 B13VGK | |
| Acer Nitro 17 AN17-41-R9LN | |
| HWBOT x265 Benchmark v2.2 / 4k Preset | |
| Alienware m18 R1 AMD | |
| Asus ROG Strix Scar 17 G733PYV-LL053X | |
| Alienware m18 R1 | |
| Alienware m18 R2 | |
| Razer Blade 18 RTX 4070 | |
| MSI Titan 18 HX A14VIG | |
| Razer Blade 16 2024, RTX 4090 | |
| Ortalama Intel Core i9-14900HX (16.8 - 38.9, n=37) | |
| Asus ROG Strix Scar 18 G834JYR (2024) | |
| Razer Blade 18 2024 RZ09-0509 | |
| MSI Titan GT77 12UHS | |
| Asus TUF Gaming A17 FA707XI-NS94 | |
| MSI Pulse 17 B13VGK | |
| Acer Nitro 17 AN17-41-R9LN | |
| LibreOffice / 20 Documents To PDF | |
| Acer Nitro 17 AN17-41-R9LN | |
| MSI Pulse 17 B13VGK | |
| Asus TUF Gaming A17 FA707XI-NS94 | |
| Razer Blade 18 2024 RZ09-0509 | |
| Razer Blade 16 2024, RTX 4090 | |
| Alienware m18 R1 | |
| MSI Titan 18 HX A14VIG | |
| Alienware m18 R2 | |
| Asus ROG Strix Scar 18 G834JYR (2024) | |
| Razer Blade 18 RTX 4070 | |
| Ortalama Intel Core i9-14900HX (19 - 85.1, n=37) | |
| Alienware m18 R1 AMD | |
| MSI Titan GT77 12UHS | |
| Asus ROG Strix Scar 17 G733PYV-LL053X | |
| R Benchmark 2.5 / Overall mean | |
| Acer Nitro 17 AN17-41-R9LN | |
| MSI Pulse 17 B13VGK | |
| Asus TUF Gaming A17 FA707XI-NS94 | |
| MSI Titan GT77 12UHS | |
| Alienware m18 R1 AMD | |
| Asus ROG Strix Scar 17 G733PYV-LL053X | |
| Razer Blade 18 RTX 4070 | |
| Asus ROG Strix Scar 18 G834JYR (2024) | |
| Razer Blade 18 2024 RZ09-0509 | |
| Alienware m18 R1 | |
| MSI Titan 18 HX A14VIG | |
| Ortalama Intel Core i9-14900HX (0.3604 - 0.4859, n=37) | |
| Razer Blade 16 2024, RTX 4090 | |
| Alienware m18 R2 | |
Cinebench R23: Multi Core | Single Core
Cinebench R20: CPU (Multi Core) | CPU (Single Core)
Cinebench R15: CPU Multi 64Bit | CPU Single 64Bit
Blender: v2.79 BMW27 CPU
7-Zip 18.03: 7z b 4 | 7z b 4 -mmt1
Geekbench 6.7: Multi-Core | Single-Core
Geekbench 5.5: Multi-Core | Single-Core
HWBOT x265 Benchmark v2.2: 4k Preset
LibreOffice : 20 Documents To PDF
R Benchmark 2.5: Overall mean
* ... daha küçük daha iyidir
AIDA64: FP32 Ray-Trace | FPU Julia | CPU SHA3 | CPU Queen | FPU SinJulia | FPU Mandel | CPU AES | CPU ZLib | FP64 Ray-Trace | CPU PhotoWorxx
| Performance rating | |
| Asus ROG Strix Scar 17 G733PYV-LL053X | |
| Alienware m18 R2 | |
| MSI Titan 18 HX A14VIG | |
| Razer Blade 16 2024, RTX 4090 | |
| Asus ROG Strix Scar 18 G834JYR (2024) | |
| Sınıf ortalaması Gaming | |
| Razer Blade 18 2024 RZ09-0509 | |
| Ortalama Intel Core i9-14900HX | |
| AIDA64 / FP32 Ray-Trace | |
| Asus ROG Strix Scar 17 G733PYV-LL053X | |
| Sınıf ortalaması Gaming (10227 - 85542, n=103, son 2 yıl) | |
| MSI Titan 18 HX A14VIG | |
| Alienware m18 R2 | |
| Razer Blade 16 2024, RTX 4090 | |
| Asus ROG Strix Scar 18 G834JYR (2024) | |
| Razer Blade 18 2024 RZ09-0509 | |
| Ortalama Intel Core i9-14900HX (13098 - 33474, n=36) | |
| AIDA64 / FPU Julia | |
| Asus ROG Strix Scar 17 G733PYV-LL053X | |
| MSI Titan 18 HX A14VIG | |
| Alienware m18 R2 | |
| Sınıf ortalaması Gaming (51376 - 238426, n=103, son 2 yıl) | |
| Asus ROG Strix Scar 18 G834JYR (2024) | |
| Razer Blade 18 2024 RZ09-0509 | |
| Razer Blade 16 2024, RTX 4090 | |
| Ortalama Intel Core i9-14900HX (67573 - 166040, n=36) | |
| AIDA64 / CPU SHA3 | |
| Asus ROG Strix Scar 17 G733PYV-LL053X | |
| MSI Titan 18 HX A14VIG | |
| Alienware m18 R2 | |
| Sınıf ortalaması Gaming (2180 - 9817, n=103, son 2 yıl) | |
| Asus ROG Strix Scar 18 G834JYR (2024) | |
| Razer Blade 16 2024, RTX 4090 | |
| Razer Blade 18 2024 RZ09-0509 | |
| Ortalama Intel Core i9-14900HX (3589 - 7979, n=36) | |
| AIDA64 / CPU Queen | |
| Asus ROG Strix Scar 17 G733PYV-LL053X | |
| MSI Titan 18 HX A14VIG | |
| Asus ROG Strix Scar 18 G834JYR (2024) | |
| Alienware m18 R2 | |
| Razer Blade 16 2024, RTX 4090 | |
| Ortalama Intel Core i9-14900HX (118405 - 148966, n=36) | |
| Razer Blade 18 2024 RZ09-0509 | |
| Sınıf ortalaması Gaming (49785 - 173351, n=89, son 2 yıl) | |
| AIDA64 / FPU SinJulia | |
| Asus ROG Strix Scar 17 G733PYV-LL053X | |
| MSI Titan 18 HX A14VIG | |
| Alienware m18 R2 | |
| Asus ROG Strix Scar 18 G834JYR (2024) | |
| Razer Blade 16 2024, RTX 4090 | |
| Razer Blade 18 2024 RZ09-0509 | |
| Ortalama Intel Core i9-14900HX (10475 - 18517, n=36) | |
| Sınıf ortalaması Gaming (4424 - 33636, n=103, son 2 yıl) | |
| AIDA64 / FPU Mandel | |
| Asus ROG Strix Scar 17 G733PYV-LL053X | |
| Sınıf ortalaması Gaming (25115 - 128721, n=103, son 2 yıl) | |
| Alienware m18 R2 | |
| MSI Titan 18 HX A14VIG | |
| Razer Blade 16 2024, RTX 4090 | |
| Asus ROG Strix Scar 18 G834JYR (2024) | |
| Razer Blade 18 2024 RZ09-0509 | |
| Ortalama Intel Core i9-14900HX (32543 - 83662, n=36) | |
| AIDA64 / CPU AES | |
| Asus ROG Strix Scar 17 G733PYV-LL053X | |
| Ortalama Intel Core i9-14900HX (86964 - 241777, n=36) | |
| MSI Titan 18 HX A14VIG | |
| Alienware m18 R2 | |
| Razer Blade 16 2024, RTX 4090 | |
| Asus ROG Strix Scar 18 G834JYR (2024) | |
| Razer Blade 18 2024 RZ09-0509 | |
| Sınıf ortalaması Gaming (39258 - 247074, n=103, son 2 yıl) | |
| AIDA64 / CPU ZLib | |
| MSI Titan 18 HX A14VIG | |
| Alienware m18 R2 | |
| Asus ROG Strix Scar 17 G733PYV-LL053X | |
| Razer Blade 16 2024, RTX 4090 | |
| Razer Blade 18 2024 RZ09-0509 | |
| Ortalama Intel Core i9-14900HX (1054 - 2292, n=36) | |
| Asus ROG Strix Scar 18 G834JYR (2024) | |
| Sınıf ortalaması Gaming (574 - 2531, n=103, son 2 yıl) | |
| AIDA64 / FP64 Ray-Trace | |
| Asus ROG Strix Scar 17 G733PYV-LL053X | |
| Sınıf ortalaması Gaming (5509 - 45446, n=103, son 2 yıl) | |
| Alienware m18 R2 | |
| MSI Titan 18 HX A14VIG | |
| Razer Blade 16 2024, RTX 4090 | |
| Razer Blade 18 2024 RZ09-0509 | |
| Asus ROG Strix Scar 18 G834JYR (2024) | |
| Ortalama Intel Core i9-14900HX (6809 - 18349, n=36) | |
| AIDA64 / CPU PhotoWorxx | |
| Alienware m18 R2 | |
| Asus ROG Strix Scar 18 G834JYR (2024) | |
| Razer Blade 16 2024, RTX 4090 | |
| Razer Blade 18 2024 RZ09-0509 | |
| Ortalama Intel Core i9-14900HX (23903 - 54702, n=36) | |
| Sınıf ortalaması Gaming (12271 - 89891, n=103, son 2 yıl) | |
| Asus ROG Strix Scar 17 G733PYV-LL053X | |
| MSI Titan 18 HX A14VIG | |
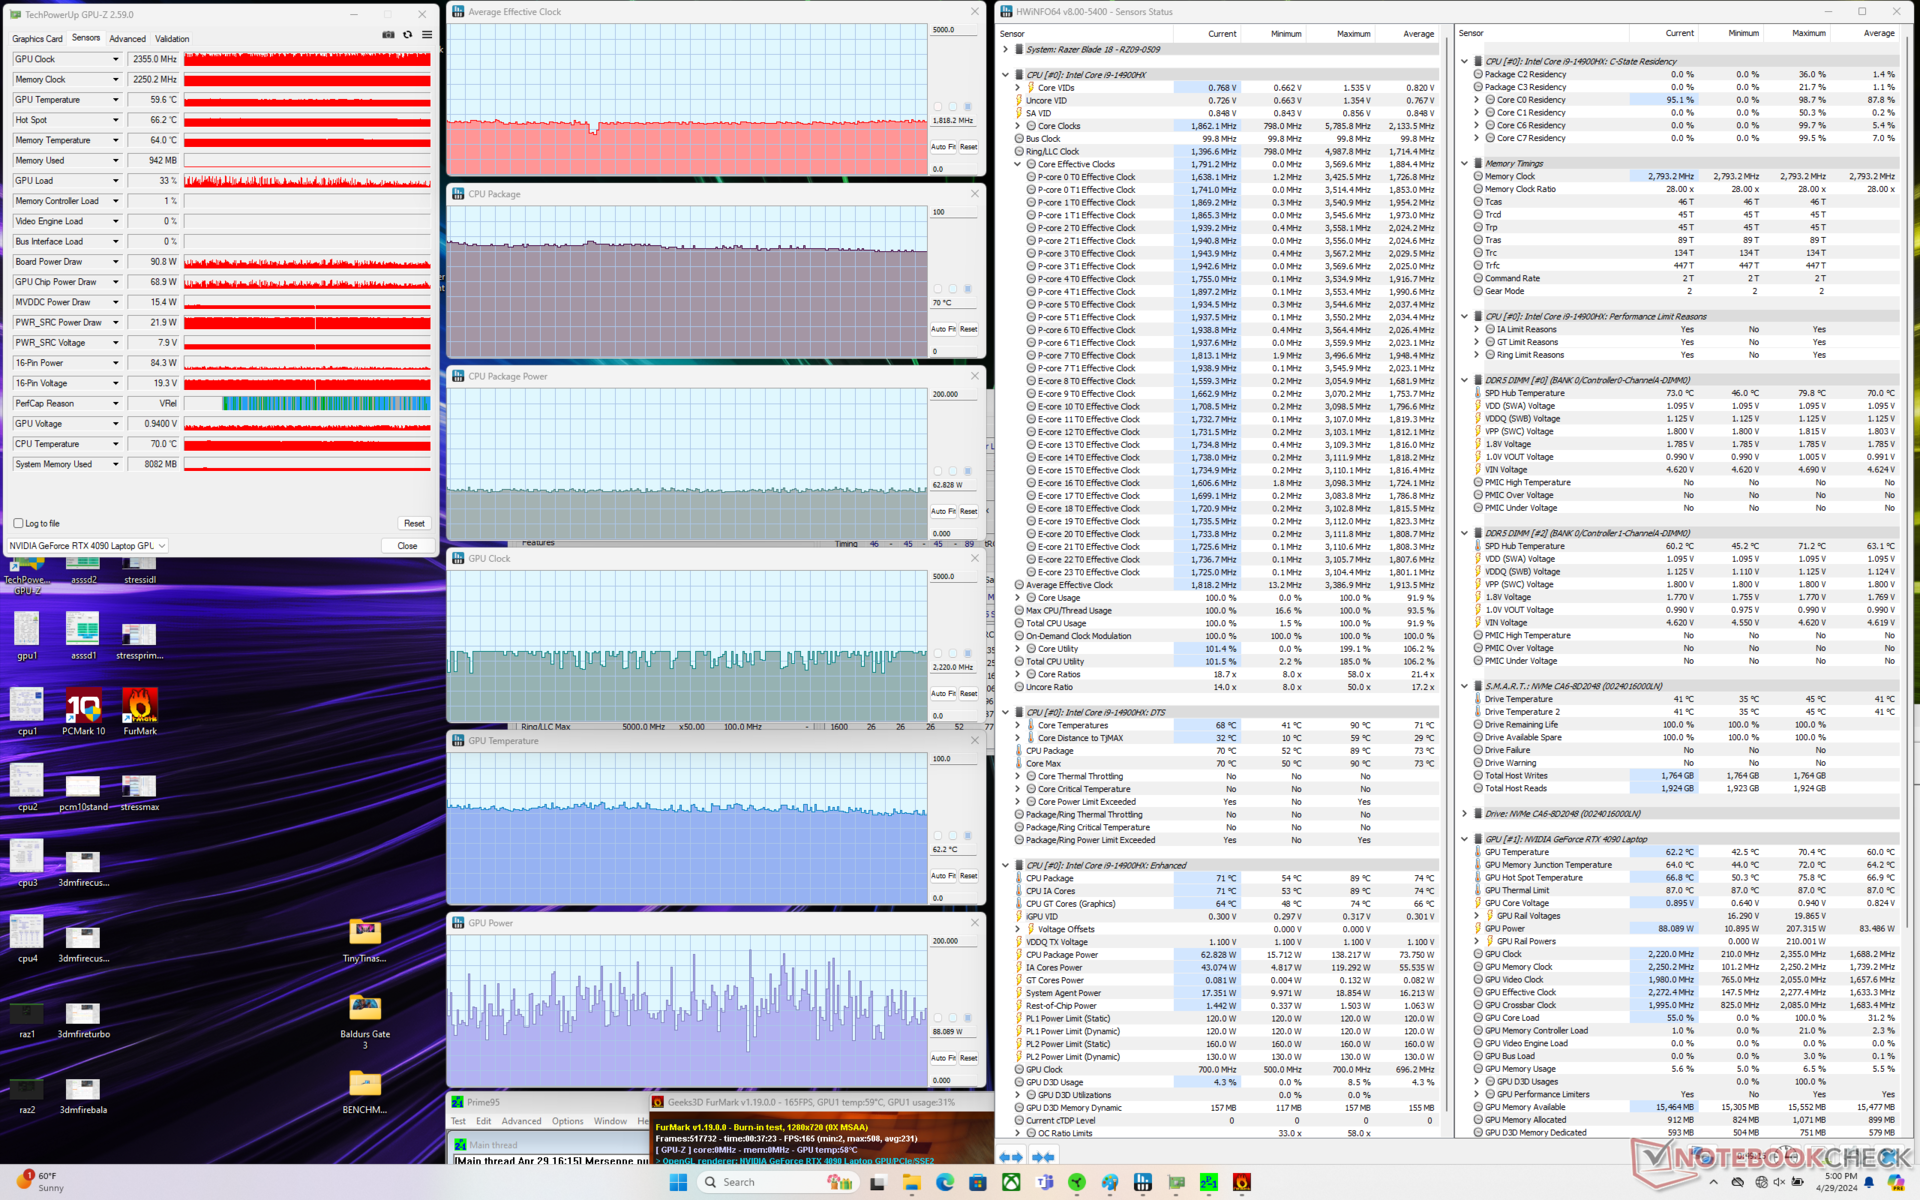
Stres Testi
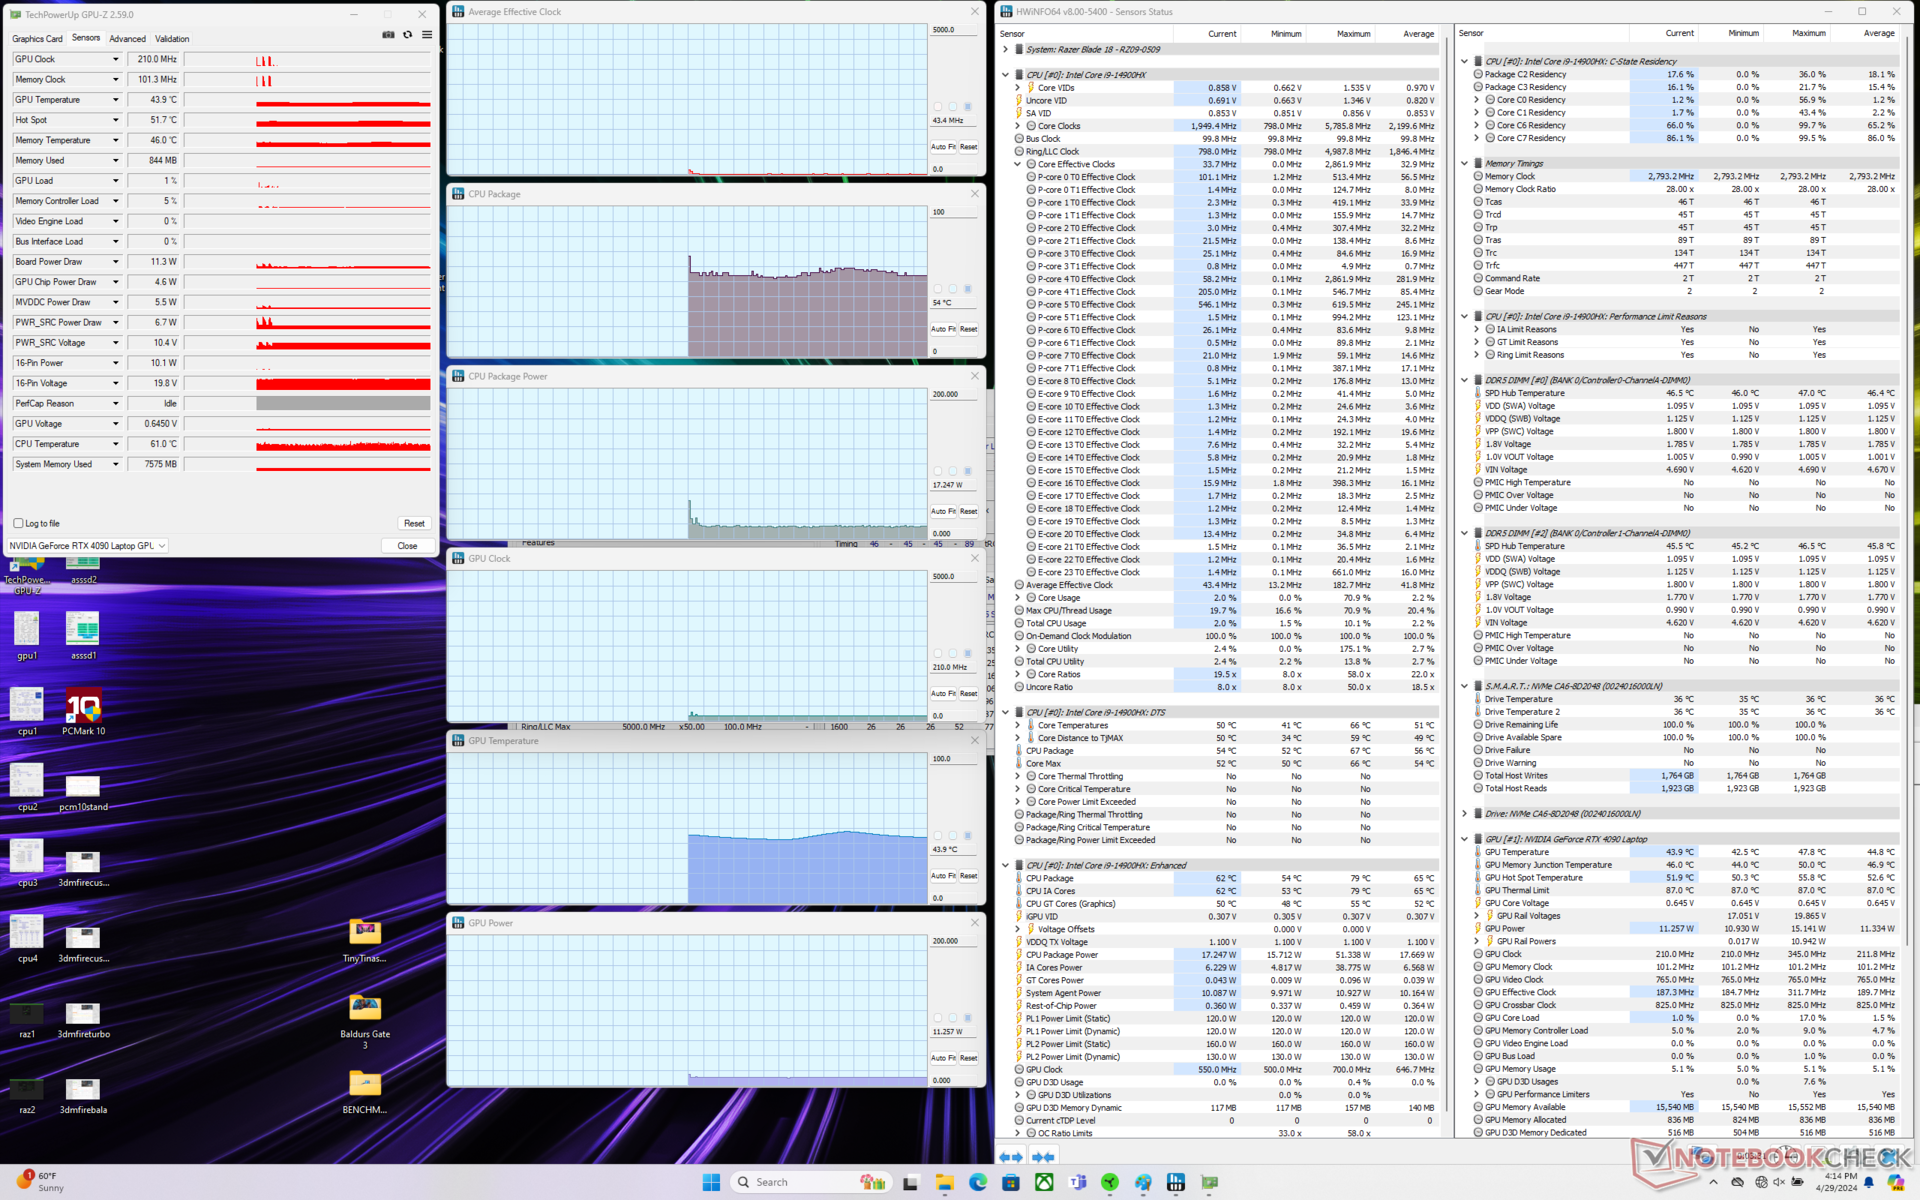
Prime95 çalıştırıldığında CPU güç çekişi 117 W civarında sabitlenerek geçen yılki Blade 18'de kaydettiğimiz 114 W'a çok yakın bir değerde gerçekleşmektedir. Yukarıdaki bölümde belirtildiği gibi neredeyse aynı performans rakamlarıyla eşleştirildiğinde, bu durum yeni Raptor Lake-HX yenileme serisinin eski seriye göre çok az fayda sağladığı veya hiç fayda sağlamadığı gerçeğini daha da pekiştirmektedir Core i9-13950HX.
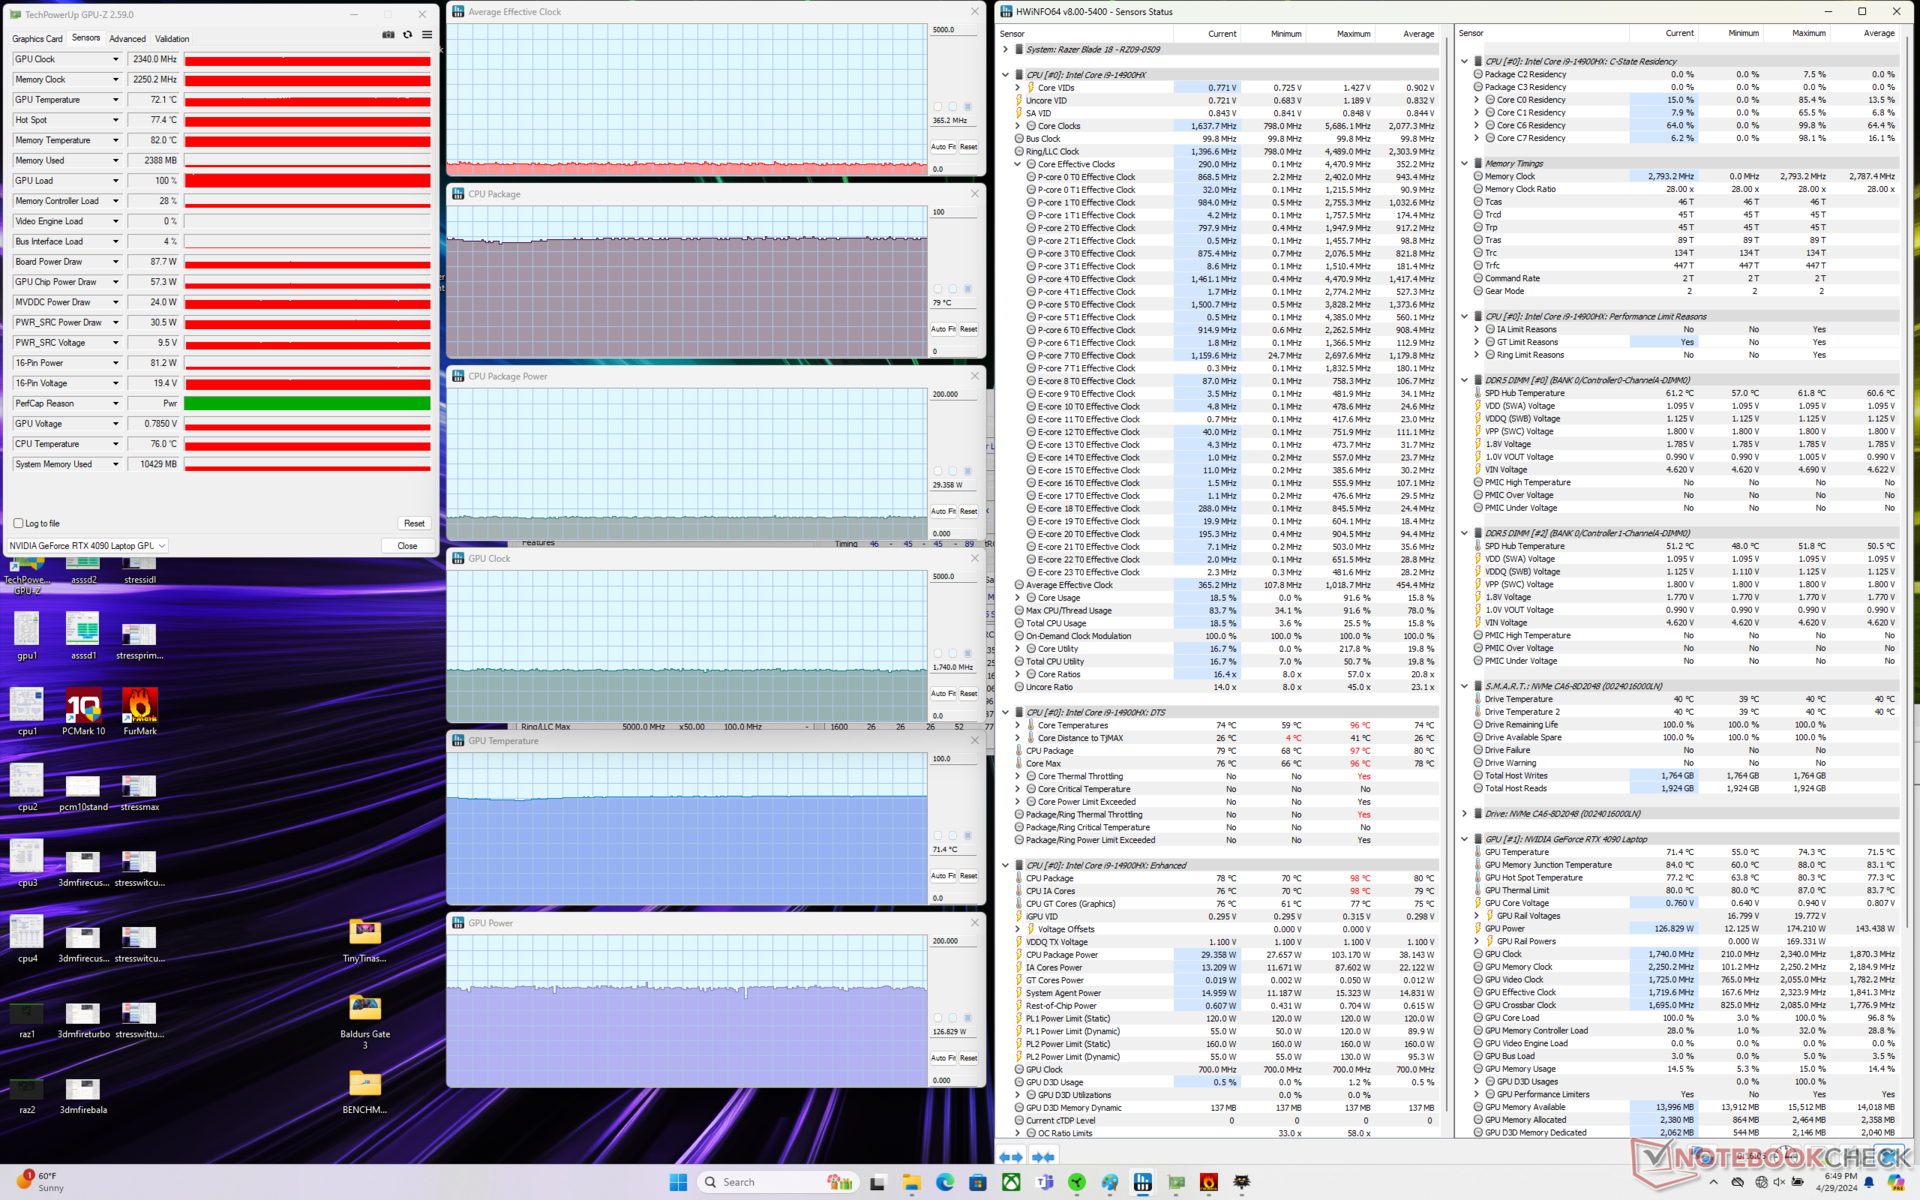
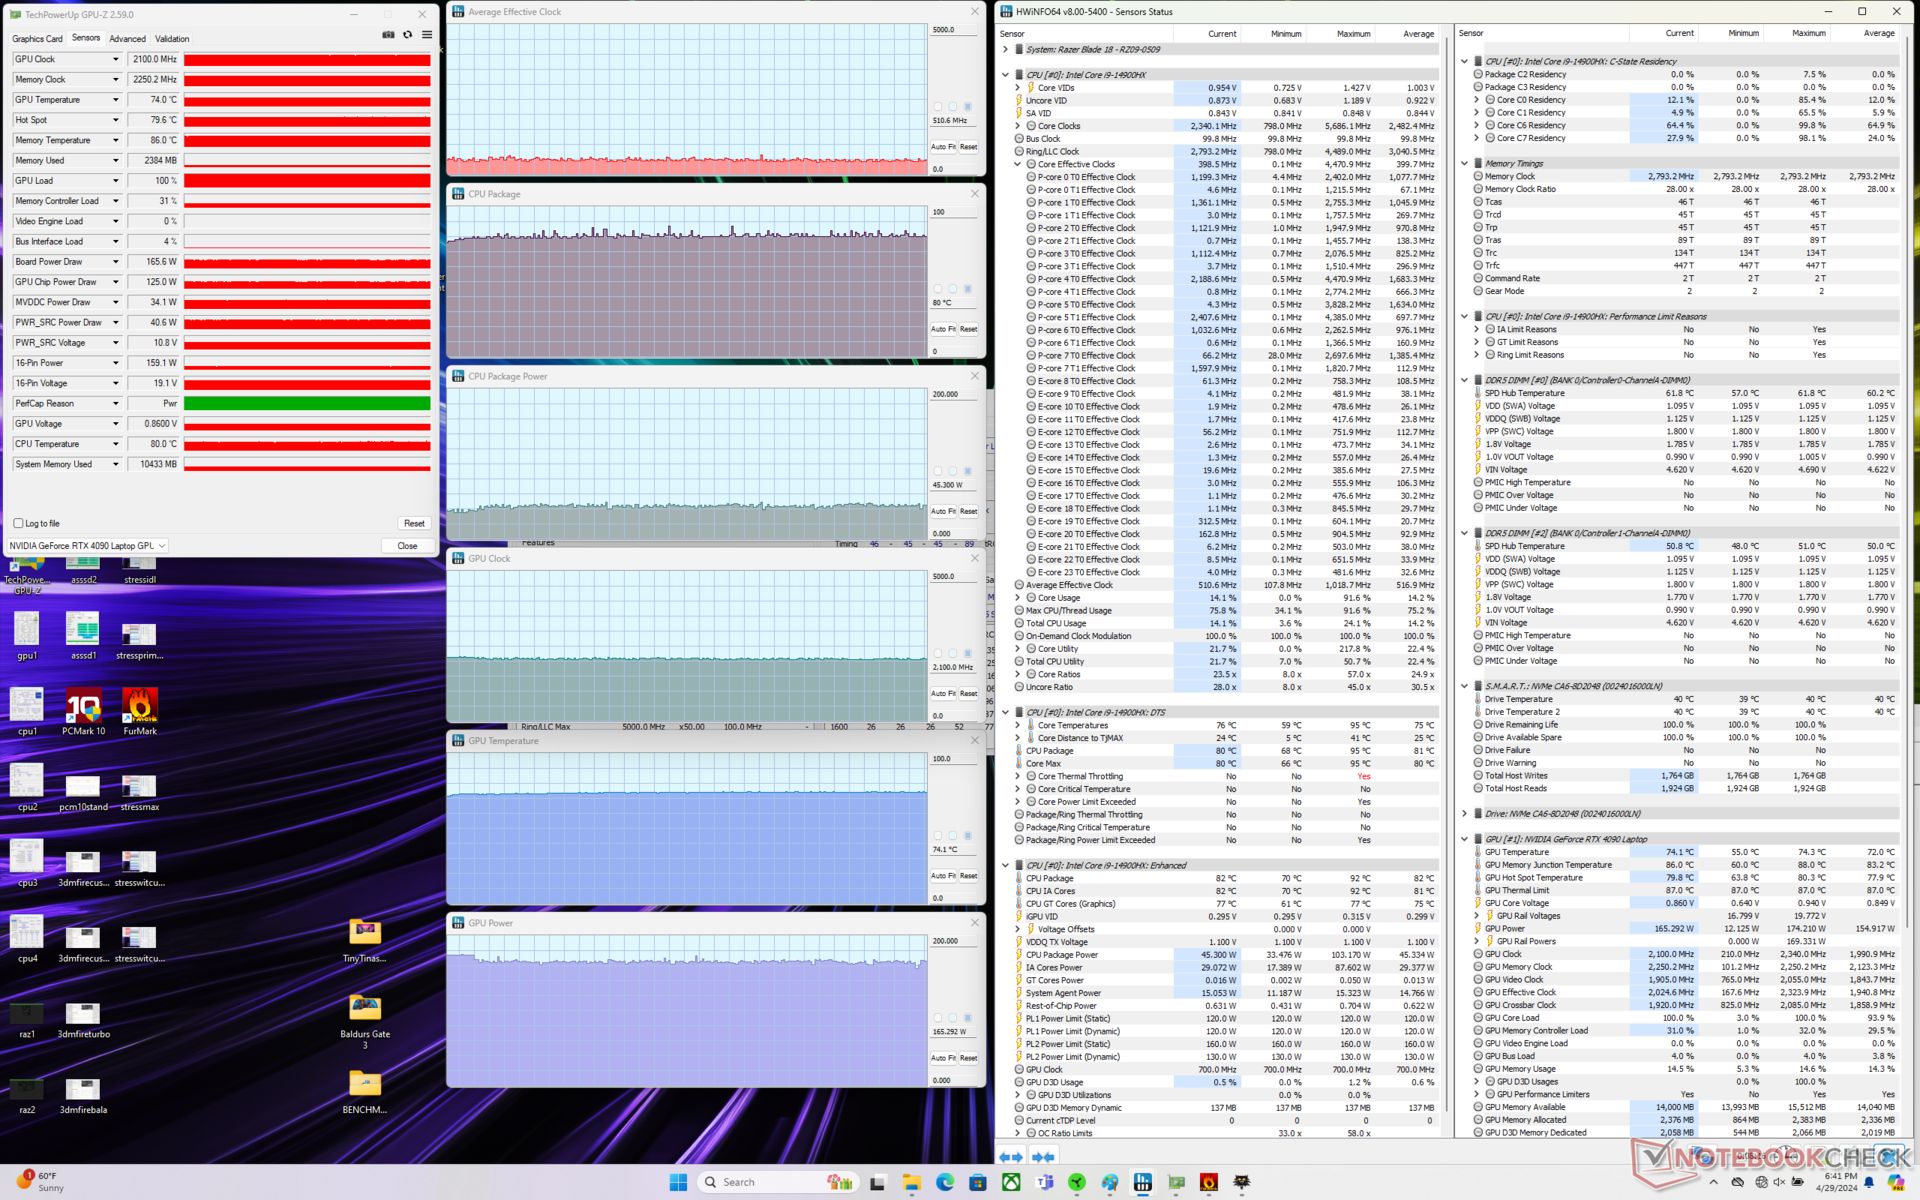
Çalışıyor Witcher 3 gPU kartının güç çekişi sabit 172 W'ta neredeyse aynı kalacağından, tipik oyun yüklerini temsil etmek için Maksimum Fan açık veya Maksimum Fan kapalı arasında önemli bir performans farkı yoktur. Turbo moda düşürmek, GPU güç çekimini pratikte fark edilmeyecek kadar birkaç watt azaltır. CPU ve GPU sıcaklıkları, çok daha ağır ve biraz daha hızlı Alienware m18 R2'deki 87 C ve 64 C'ye kıyasla sırasıyla 80 C ve 74 C'de sabitlenecektir.
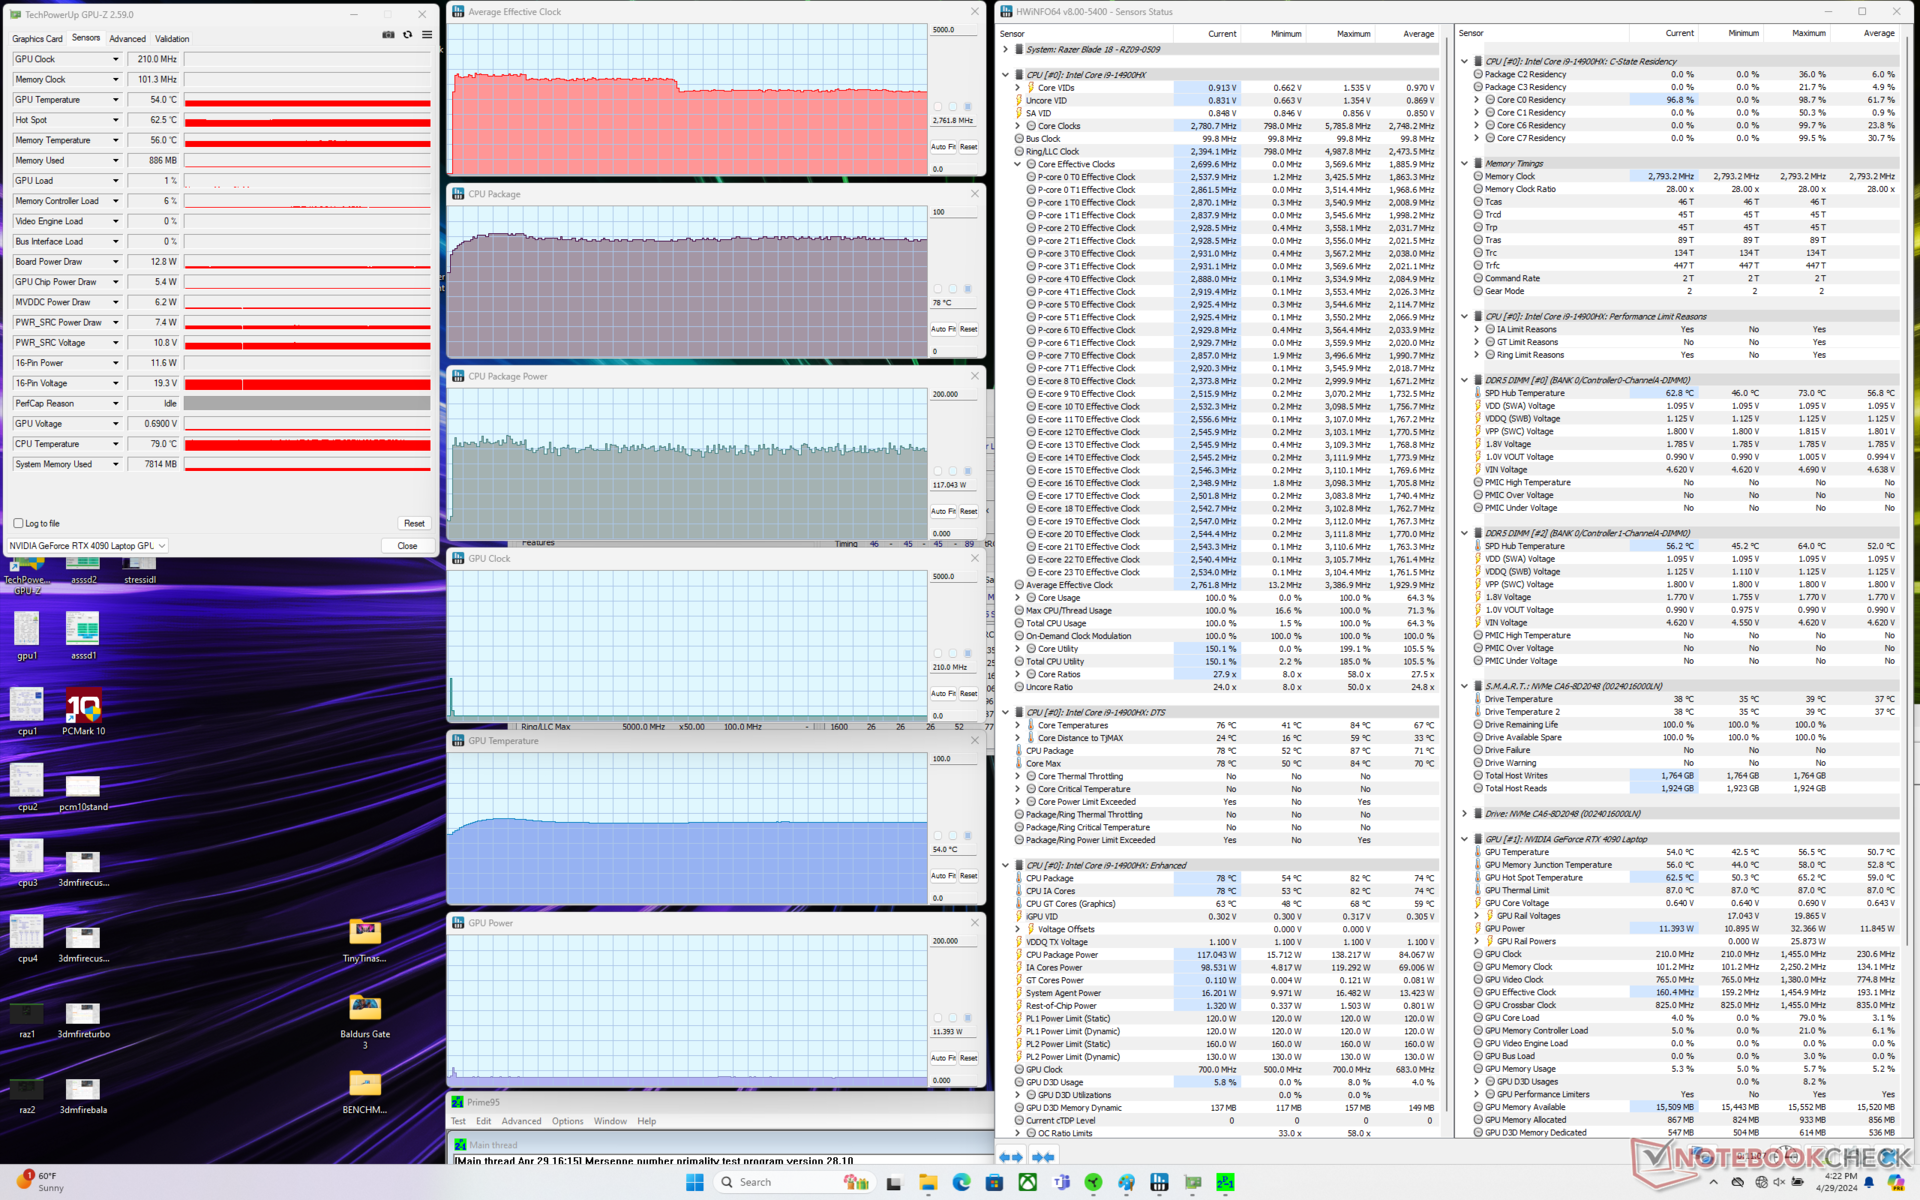
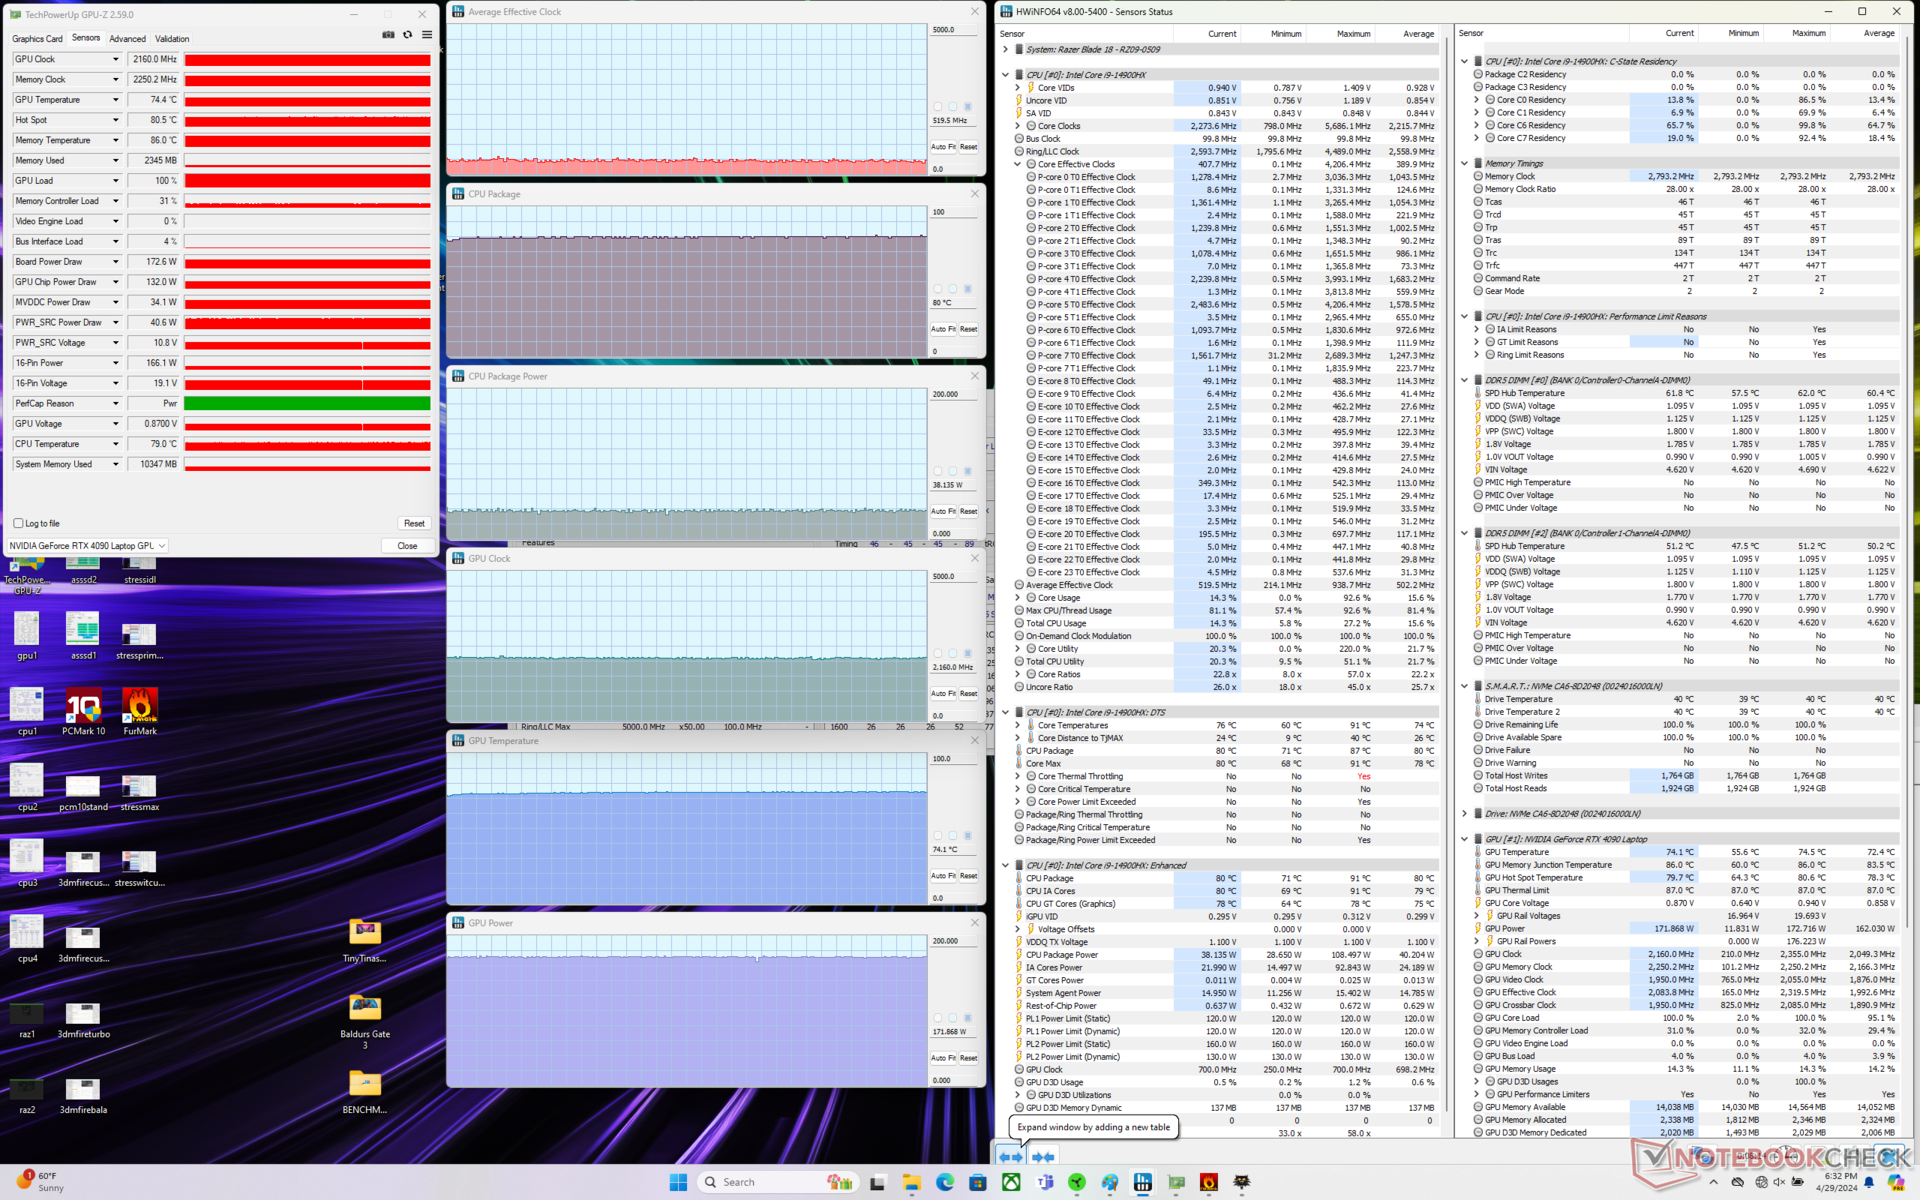
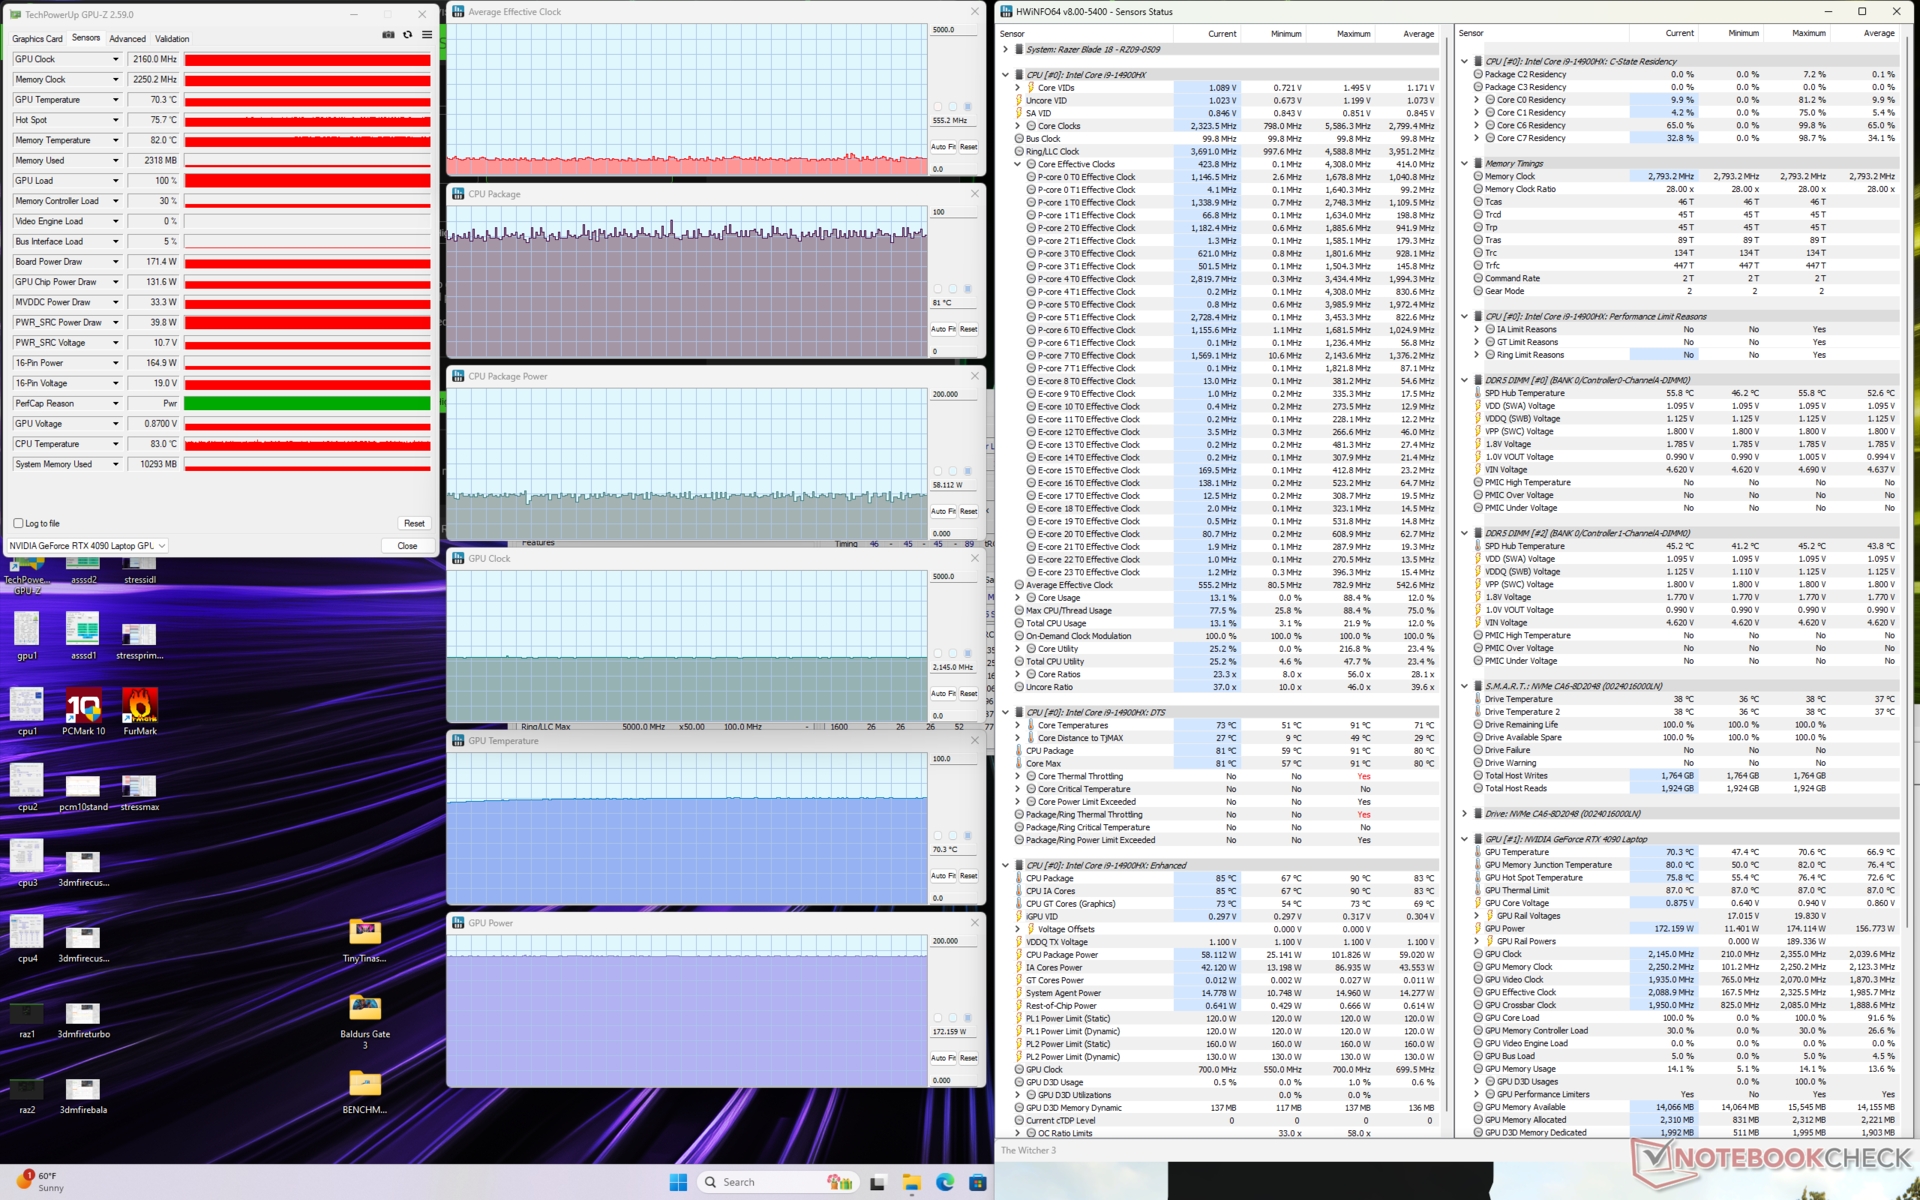
| Ortalama Etkin CPU Saati (GHz) | GPU Saati (MHz) | Ortalama CPU Sıcaklığı (°C) | Ortalama GPU Sıcaklığı (°C) | GPU Kartı Güç Çekimi | |
| Sistem Boşta | -- | -- | 54 | 44 | -- |
| Prime95 Stres | 2.8 | -- | 78 | 54 | -- |
| Prime95 + FurMark Stres | 1.8 | 1515 - 2340 | 70 | 62 | 42 - 181 |
| Witcher 3 Stres (Maksimum Fan Açıkken Özel Mod) | ~0,6 | 2145 | 81 | 70 | 172 |
| Witcher 3 Stres (Özel Mod w/ Maksimum Fan Kapalı) | ~0,5 | 2160 | 80 | 74 | 172 |
| Witcher 3 Stres (Turbo Mod) | ~0,5 | 2100 | 80 | 74 | 165 |
| Witcher 3 Stres (Dengeli Mod) | ~0,4 | 1740 | 79 | 71 | 127 |
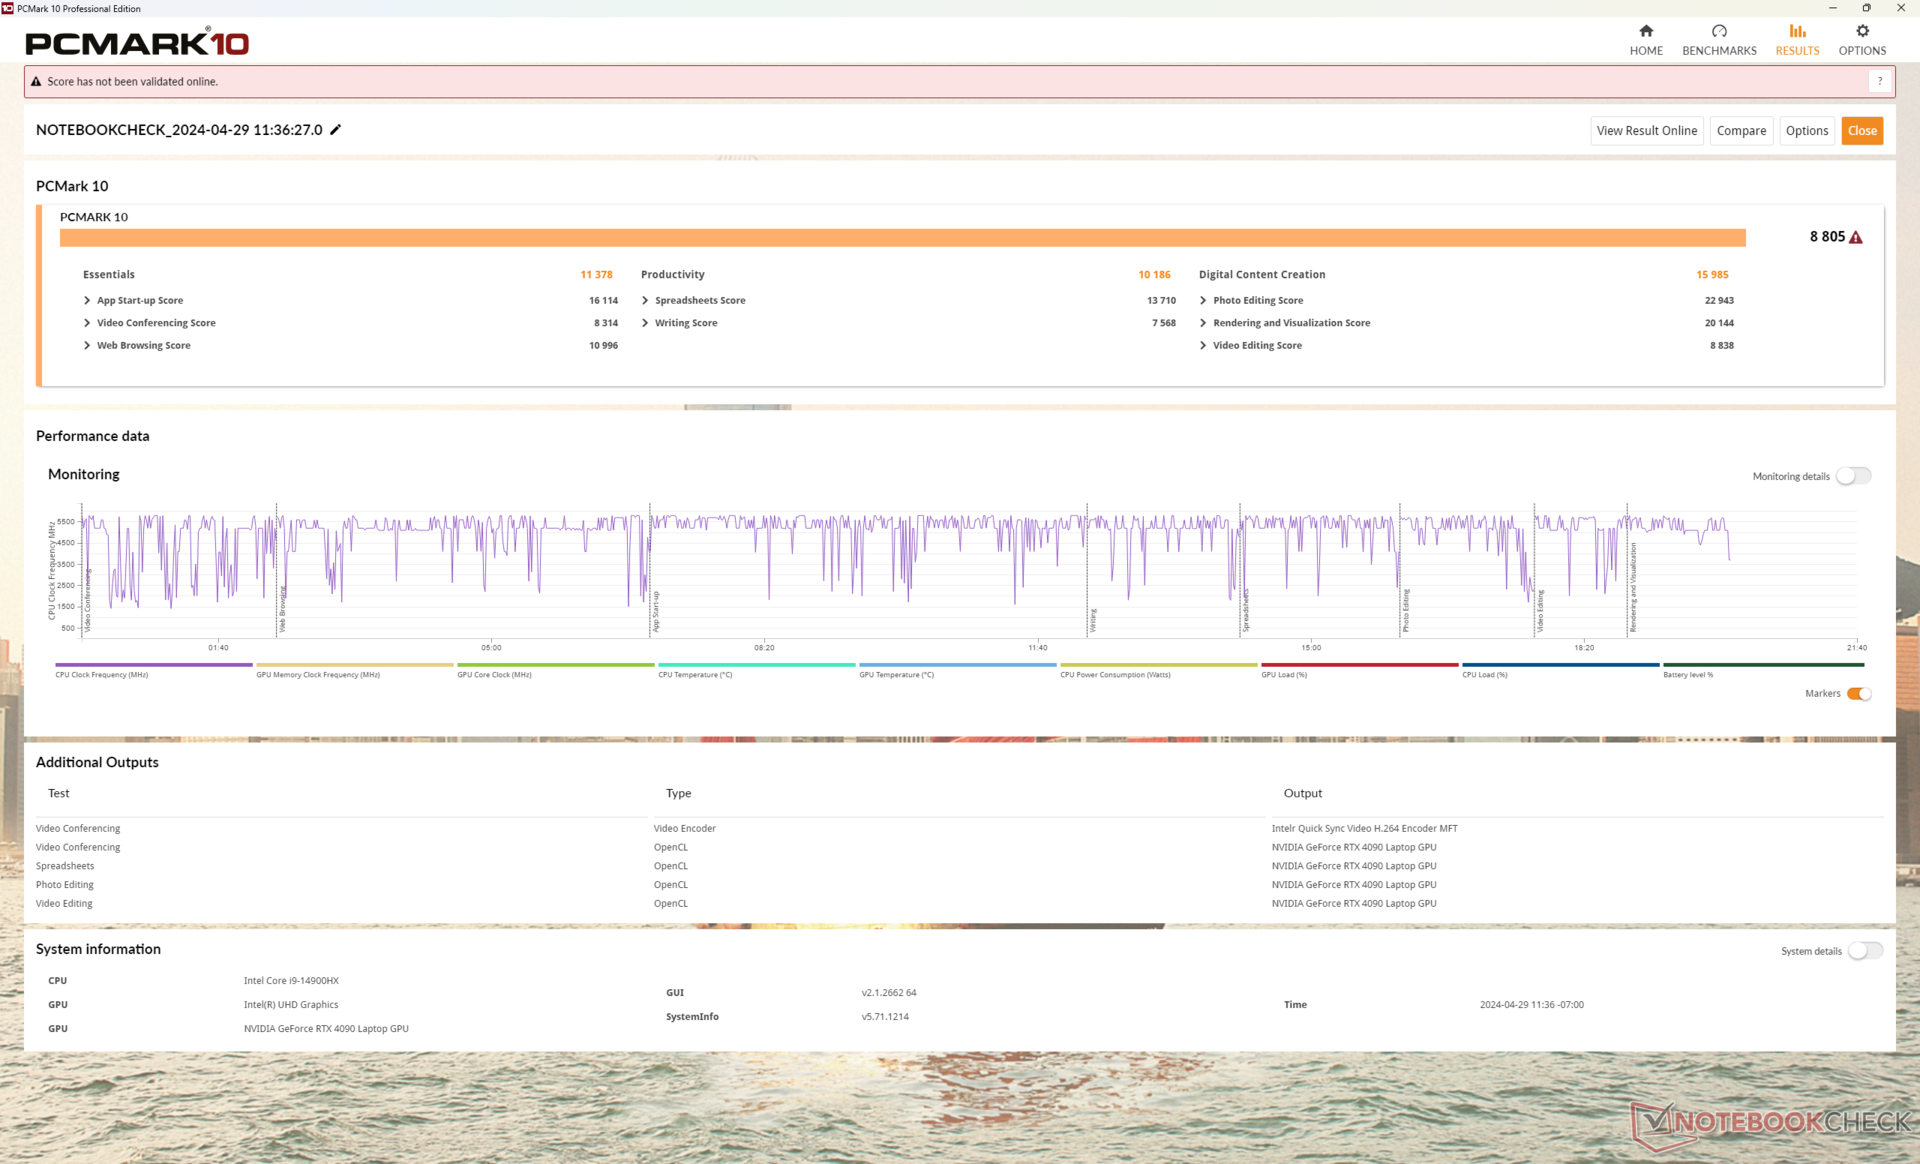
Sistem Performansı
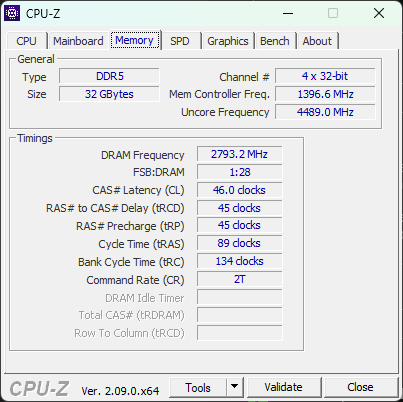
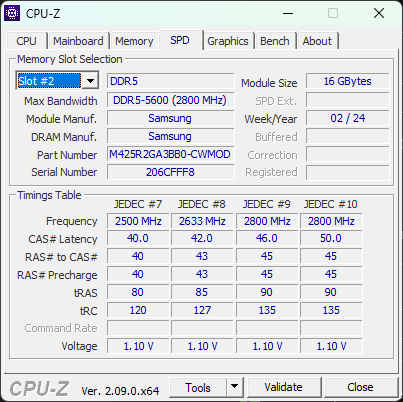
PCMark skorları, benzer Raptor Lake-HX CPU'lara ve GeForce RTX 4090 GPU'lara sahip diğer oyun dizüstü bilgisayarları ile aynı seviyededir eski Core i9-13900HX. RAM hızı 2023 modeline göre değişmedi.
Sistemi Uyku moduna alırken birkaç hatayla karşılaştık. Sistem, dGPU moduna ayarlandığında Uyku modunda çok sıcak çalışmaya devam ediyordu. Optimus moduna ayarlanırsa, sistem Uyku moduna normal bir şekilde giriyor gibi görünüyordu. Uyku modundan uyanırken de ekran bazen birkaç saniye donuyordu.
Bu arada, 2023 modelinde yaşadığımız G-Sync sorunları 2024 ünitemizde mevcut değil.
CrossMark: Overall | Productivity | Creativity | Responsiveness
WebXPRT 3: Overall
WebXPRT 4: Overall
Mozilla Kraken 1.1: Total
| PCMark 10 / Score | |
| Alienware m18 R2 | |
| Asus ROG Strix Scar 17 G733PYV-LL053X | |
| MSI Titan 18 HX A14VIG | |
| Razer Blade 18 2024 RZ09-0509 | |
| Asus ROG Strix Scar 18 G834JYR (2024) | |
| Ortalama Intel Core i9-14900HX, NVIDIA GeForce RTX 4090 Laptop GPU (8230 - 9234, n=13) | |
| Razer Blade 16 2024, RTX 4090 | |
| PCMark 10 / Essentials | |
| MSI Titan 18 HX A14VIG | |
| Asus ROG Strix Scar 17 G733PYV-LL053X | |
| Alienware m18 R2 | |
| Asus ROG Strix Scar 18 G834JYR (2024) | |
| Razer Blade 18 2024 RZ09-0509 | |
| Ortalama Intel Core i9-14900HX, NVIDIA GeForce RTX 4090 Laptop GPU (10778 - 11628, n=13) | |
| Razer Blade 16 2024, RTX 4090 | |
| PCMark 10 / Productivity | |
| Alienware m18 R2 | |
| Razer Blade 16 2024, RTX 4090 | |
| Asus ROG Strix Scar 17 G733PYV-LL053X | |
| Ortalama Intel Core i9-14900HX, NVIDIA GeForce RTX 4090 Laptop GPU (9458 - 11759, n=13) | |
| Asus ROG Strix Scar 18 G834JYR (2024) | |
| MSI Titan 18 HX A14VIG | |
| Razer Blade 18 2024 RZ09-0509 | |
| PCMark 10 / Digital Content Creation | |
| MSI Titan 18 HX A14VIG | |
| Alienware m18 R2 | |
| Asus ROG Strix Scar 17 G733PYV-LL053X | |
| Razer Blade 18 2024 RZ09-0509 | |
| Asus ROG Strix Scar 18 G834JYR (2024) | |
| Ortalama Intel Core i9-14900HX, NVIDIA GeForce RTX 4090 Laptop GPU (13219 - 16462, n=13) | |
| Razer Blade 16 2024, RTX 4090 | |
| CrossMark / Overall | |
| Asus ROG Strix Scar 18 G834JYR (2024) | |
| Razer Blade 16 2024, RTX 4090 | |
| Ortalama Intel Core i9-14900HX, NVIDIA GeForce RTX 4090 Laptop GPU (1877 - 2344, n=10) | |
| Asus ROG Strix Scar 17 G733PYV-LL053X | |
| Alienware m18 R2 | |
| Razer Blade 18 2024 RZ09-0509 | |
| MSI Titan 18 HX A14VIG | |
| CrossMark / Productivity | |
| Asus ROG Strix Scar 18 G834JYR (2024) | |
| Razer Blade 16 2024, RTX 4090 | |
| Ortalama Intel Core i9-14900HX, NVIDIA GeForce RTX 4090 Laptop GPU (1738 - 2162, n=10) | |
| Asus ROG Strix Scar 17 G733PYV-LL053X | |
| Razer Blade 18 2024 RZ09-0509 | |
| Alienware m18 R2 | |
| MSI Titan 18 HX A14VIG | |
| CrossMark / Creativity | |
| Asus ROG Strix Scar 18 G834JYR (2024) | |
| Razer Blade 16 2024, RTX 4090 | |
| Asus ROG Strix Scar 17 G733PYV-LL053X | |
| Alienware m18 R2 | |
| Ortalama Intel Core i9-14900HX, NVIDIA GeForce RTX 4090 Laptop GPU (2195 - 2660, n=10) | |
| Razer Blade 18 2024 RZ09-0509 | |
| MSI Titan 18 HX A14VIG | |
| CrossMark / Responsiveness | |
| Asus ROG Strix Scar 18 G834JYR (2024) | |
| Ortalama Intel Core i9-14900HX, NVIDIA GeForce RTX 4090 Laptop GPU (1478 - 2327, n=10) | |
| Razer Blade 16 2024, RTX 4090 | |
| Alienware m18 R2 | |
| Razer Blade 18 2024 RZ09-0509 | |
| Asus ROG Strix Scar 17 G733PYV-LL053X | |
| MSI Titan 18 HX A14VIG | |
| WebXPRT 3 / Overall | |
| Asus ROG Strix Scar 17 G733PYV-LL053X | |
| Razer Blade 18 2024 RZ09-0509 | |
| Razer Blade 16 2024, RTX 4090 | |
| MSI Titan 18 HX A14VIG | |
| Alienware m18 R2 | |
| Ortalama Intel Core i9-14900HX, NVIDIA GeForce RTX 4090 Laptop GPU (279 - 339, n=10) | |
| Asus ROG Strix Scar 18 G834JYR (2024) | |
| WebXPRT 4 / Overall | |
| Asus ROG Strix Scar 17 G733PYV-LL053X | |
| Alienware m18 R2 | |
| Asus ROG Strix Scar 18 G834JYR (2024) | |
| Ortalama Intel Core i9-14900HX, NVIDIA GeForce RTX 4090 Laptop GPU (246 - 309, n=8) | |
| MSI Titan 18 HX A14VIG | |
| Mozilla Kraken 1.1 / Total | |
| Ortalama Intel Core i9-14900HX, NVIDIA GeForce RTX 4090 Laptop GPU (428 - 535, n=11) | |
| MSI Titan 18 HX A14VIG | |
| Razer Blade 16 2024, RTX 4090 | |
| Asus ROG Strix Scar 18 G834JYR (2024) | |
| Razer Blade 18 2024 RZ09-0509 | |
| Alienware m18 R2 | |
| Asus ROG Strix Scar 17 G733PYV-LL053X | |
* ... daha küçük daha iyidir
| PCMark 10 Score | 8805 puan | |
Yardım | ||
| AIDA64 / Memory Copy | |
| Asus ROG Strix Scar 18 G834JYR (2024) | |
| Alienware m18 R2 | |
| Razer Blade 16 2024, RTX 4090 | |
| Razer Blade 18 RTX 4070 | |
| Razer Blade 18 2024 RZ09-0509 | |
| Ortalama Intel Core i9-14900HX (38028 - 83392, n=36) | |
| MSI Titan 18 HX A14VIG | |
| Asus ROG Strix Scar 17 G733PYV-LL053X | |
| AIDA64 / Memory Read | |
| Asus ROG Strix Scar 18 G834JYR (2024) | |
| Razer Blade 16 2024, RTX 4090 | |
| Razer Blade 18 RTX 4070 | |
| Alienware m18 R2 | |
| Razer Blade 18 2024 RZ09-0509 | |
| Ortalama Intel Core i9-14900HX (43306 - 87568, n=36) | |
| Asus ROG Strix Scar 17 G733PYV-LL053X | |
| MSI Titan 18 HX A14VIG | |
| AIDA64 / Memory Write | |
| Asus ROG Strix Scar 18 G834JYR (2024) | |
| Alienware m18 R2 | |
| Razer Blade 18 RTX 4070 | |
| Razer Blade 16 2024, RTX 4090 | |
| Ortalama Intel Core i9-14900HX (37146 - 80589, n=36) | |
| Razer Blade 18 2024 RZ09-0509 | |
| Asus ROG Strix Scar 17 G733PYV-LL053X | |
| MSI Titan 18 HX A14VIG | |
| AIDA64 / Memory Latency | |
| MSI Titan 18 HX A14VIG | |
| Asus ROG Strix Scar 17 G733PYV-LL053X | |
| Razer Blade 18 2024 RZ09-0509 | |
| Alienware m18 R2 | |
| Ortalama Intel Core i9-14900HX (76.1 - 105, n=36) | |
| Razer Blade 18 RTX 4070 | |
| Razer Blade 16 2024, RTX 4090 | |
| Asus ROG Strix Scar 18 G834JYR (2024) | |
* ... daha küçük daha iyidir
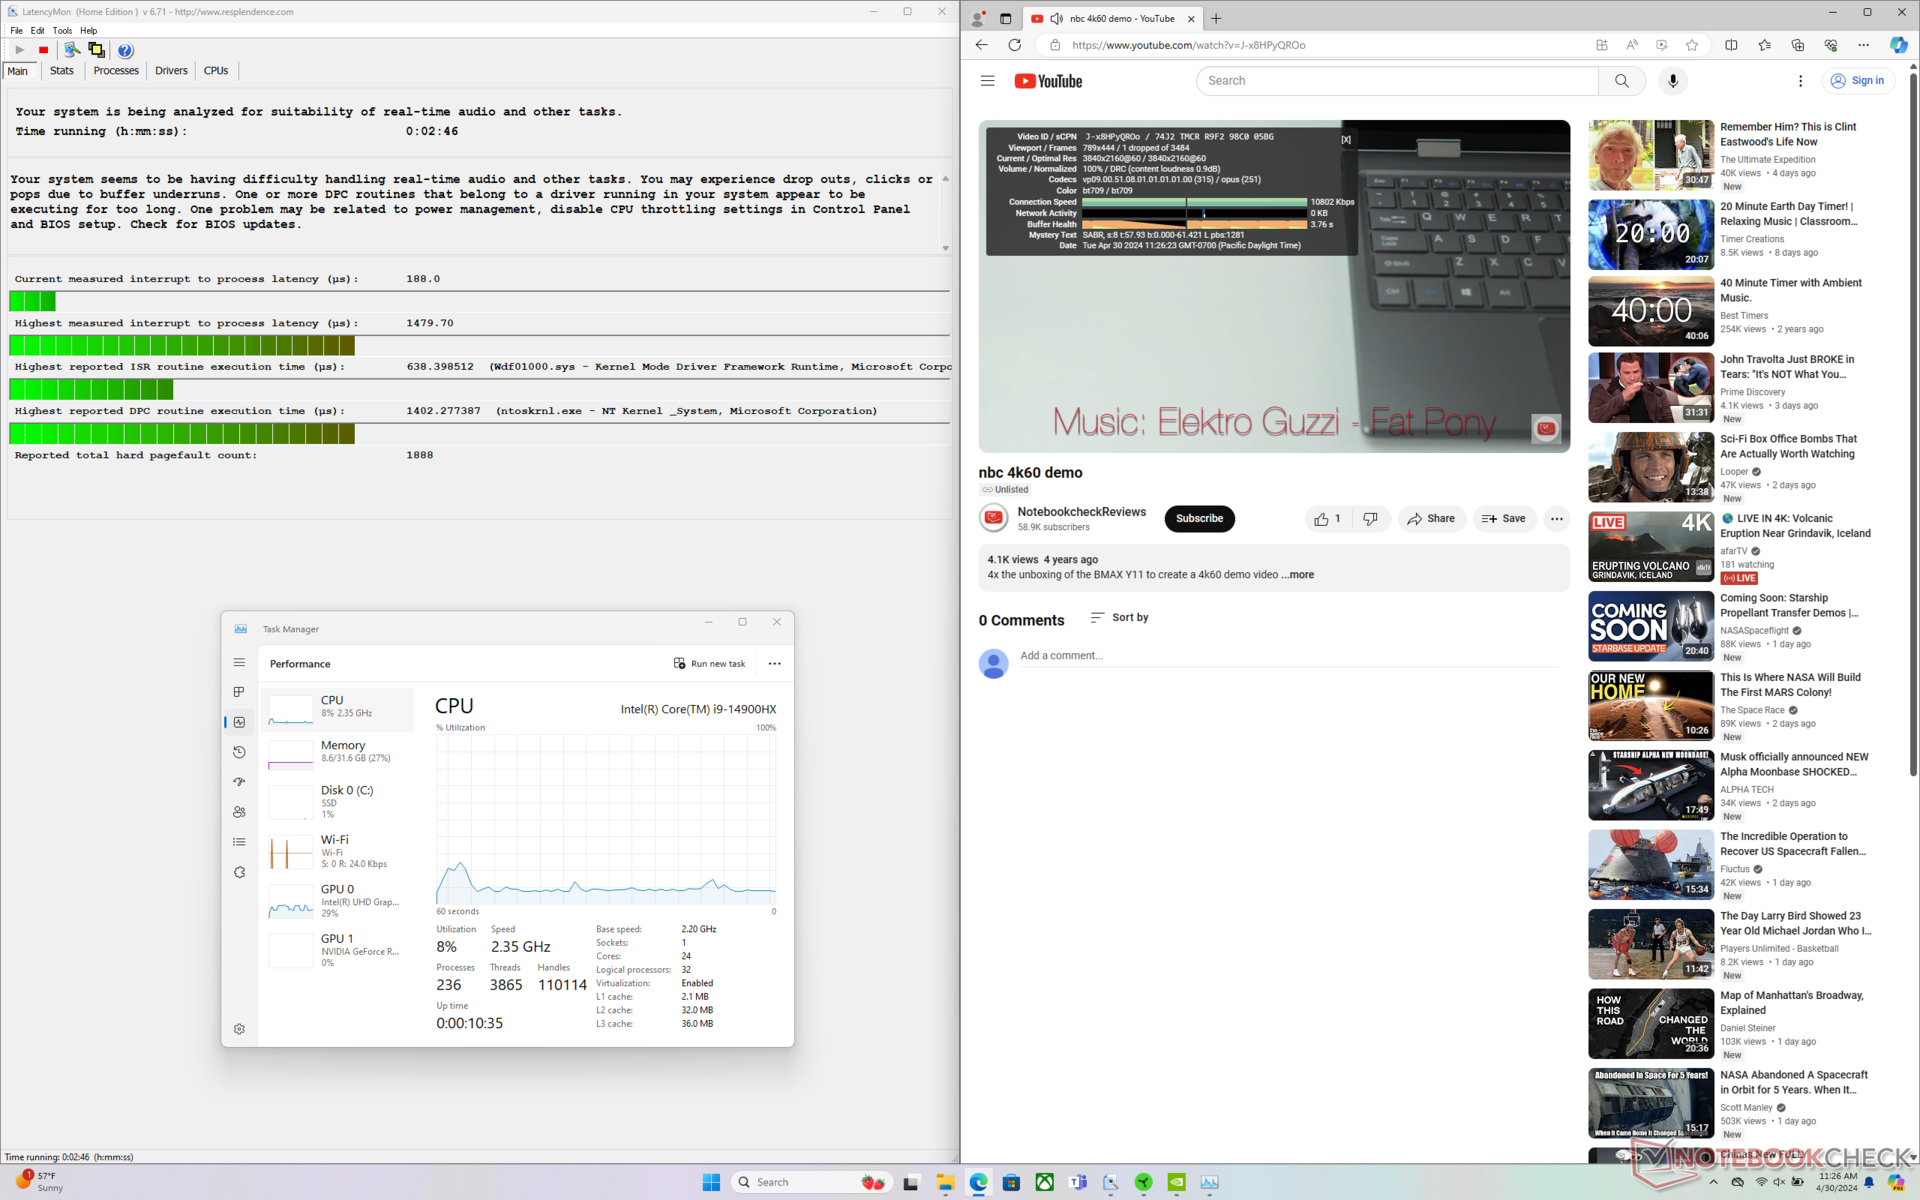
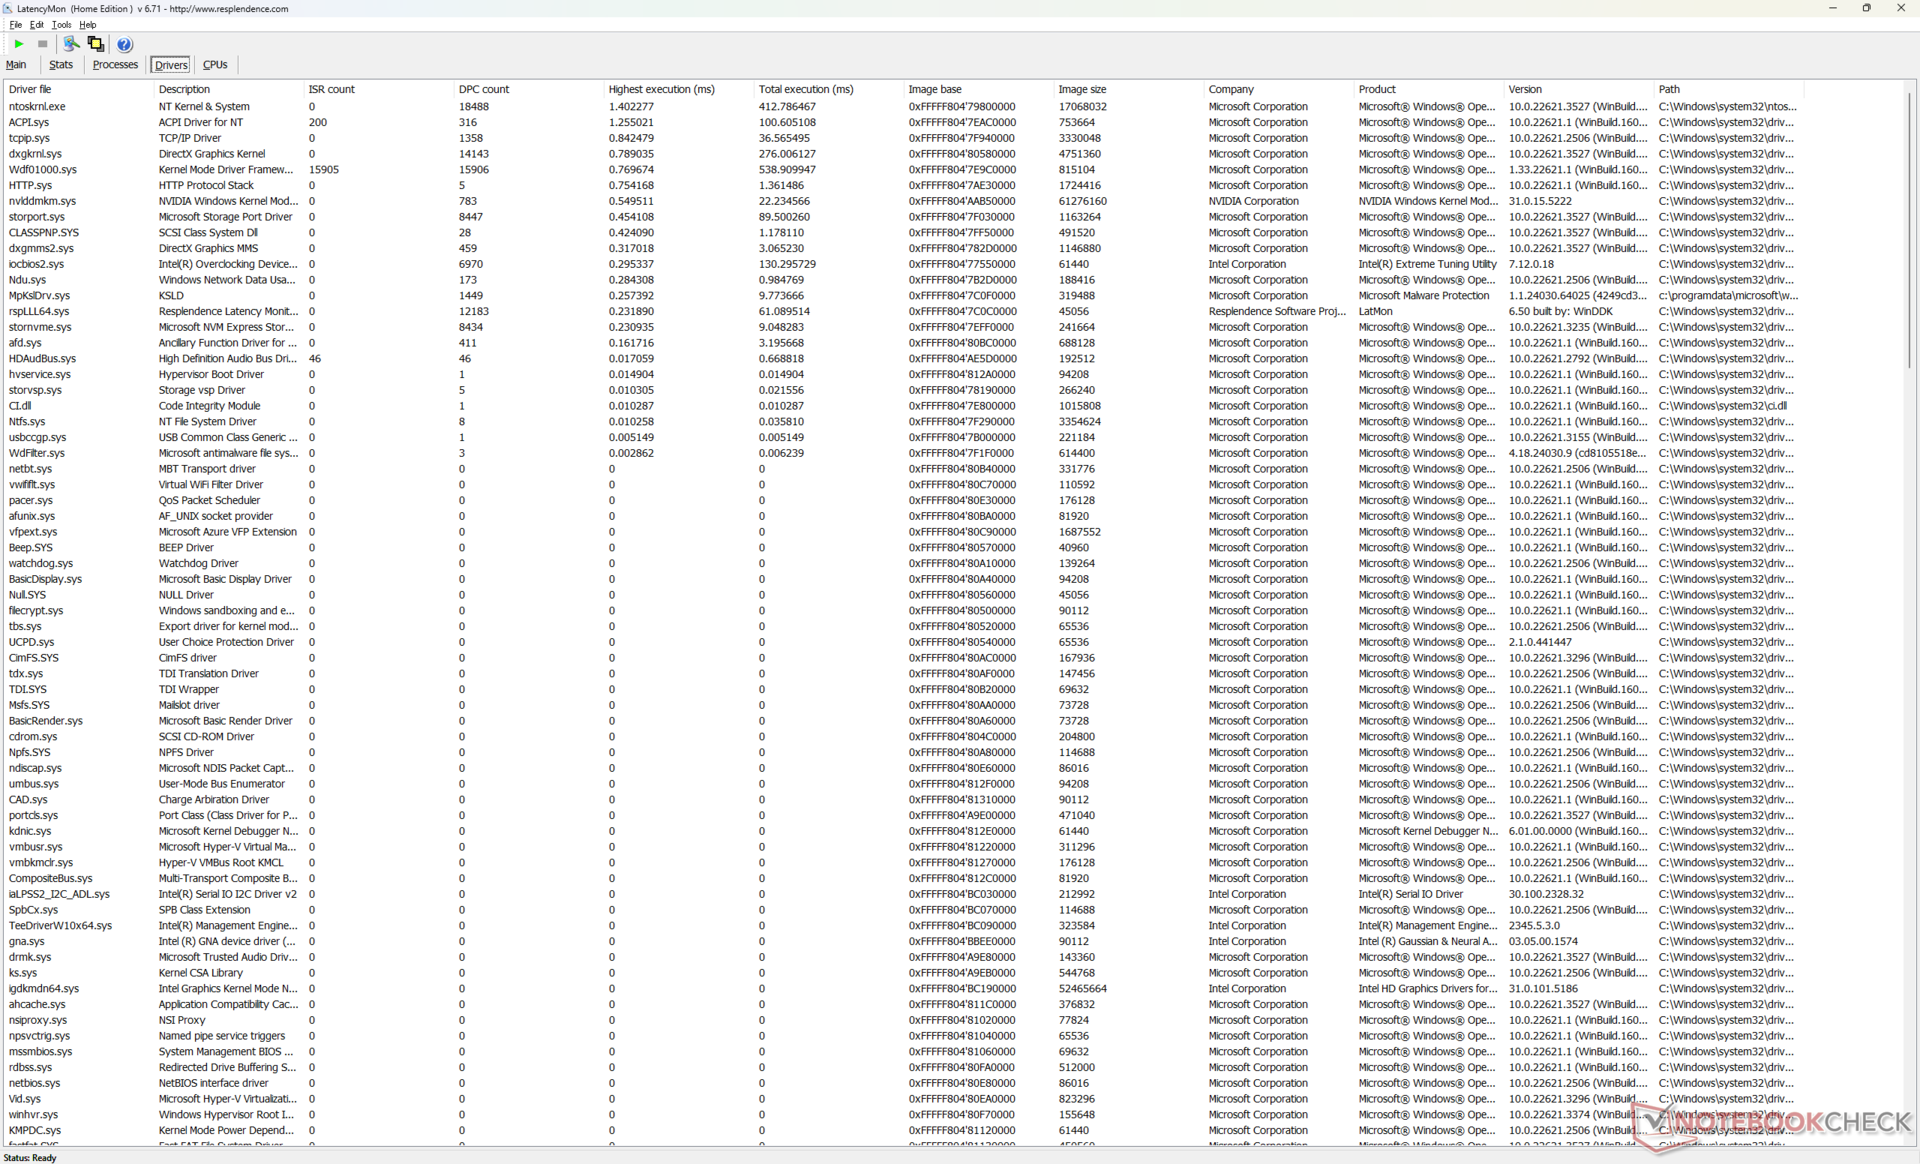
DPC Gecikme Süresi
LatencyMon, ana sayfamızın birden fazla tarayıcı sekmesini açarken yalnızca küçük DPC sorunlarını ortaya çıkarır. 4K60 video oynatma da mükemmel ve ekran görüntüsü alınırken tek kare dışında hiçbir kare düşmedi.
| DPC Latencies / LatencyMon - interrupt to process latency (max), Web, Youtube, Prime95 | |
| Alienware m18 R2 | |
| MSI Titan 18 HX A14VIG | |
| Razer Blade 18 2024 RZ09-0509 | |
| Razer Blade 16 2024, RTX 4090 | |
| Asus ROG Strix Scar 18 G834JYR (2024) | |
| Asus ROG Strix Scar 17 G733PYV-LL053X | |
* ... daha küçük daha iyidir
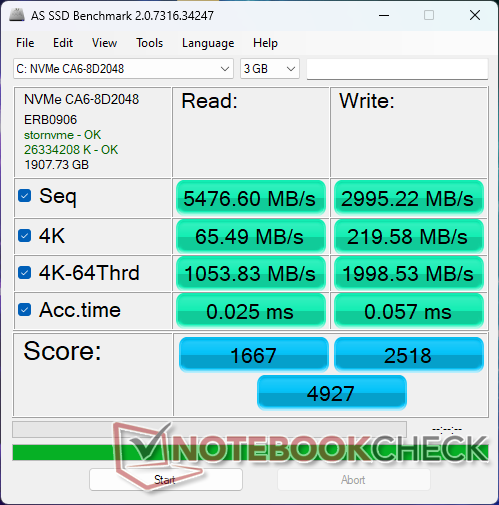
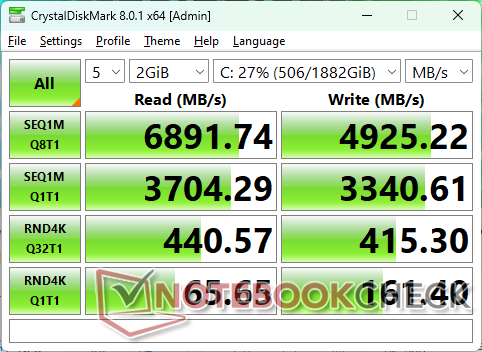
Depolama Cihazları
Hem 2023 hem de 2024 Blade 18 ünitelerimiz aşağıdakilerle birlikte gelir Micron CA6 NVMe SSD'lere sahipken diğer Blade modellerinin çoğunda Samsung sürücüler kullanılmaktadır. Daha küçük 4K blokların okuma ve yazma hızları yavaş olabilir, ancak bunun dışında performans düşürme sorunu yoktur.
PCIe5 SSD seçenekleri, muhtemelen maliyetler ve sınırlı tedarik nedeniyle mevcut değildir.

| Drive Performance rating - Percent | |
| Alienware m18 R2 | |
| Asus ROG Strix Scar 18 G834JYR (2024) | |
| Razer Blade 18 RTX 4070 | |
| Razer Blade 16 2024, RTX 4090 | |
| MSI Titan 18 HX A14VIG | |
| Asus ROG Strix Scar 17 G733PYV-LL053X | |
| Razer Blade 18 2024 RZ09-0509 | |
* ... daha küçük daha iyidir
Disk Throttling: DiskSpd Read Loop, Queue Depth 8
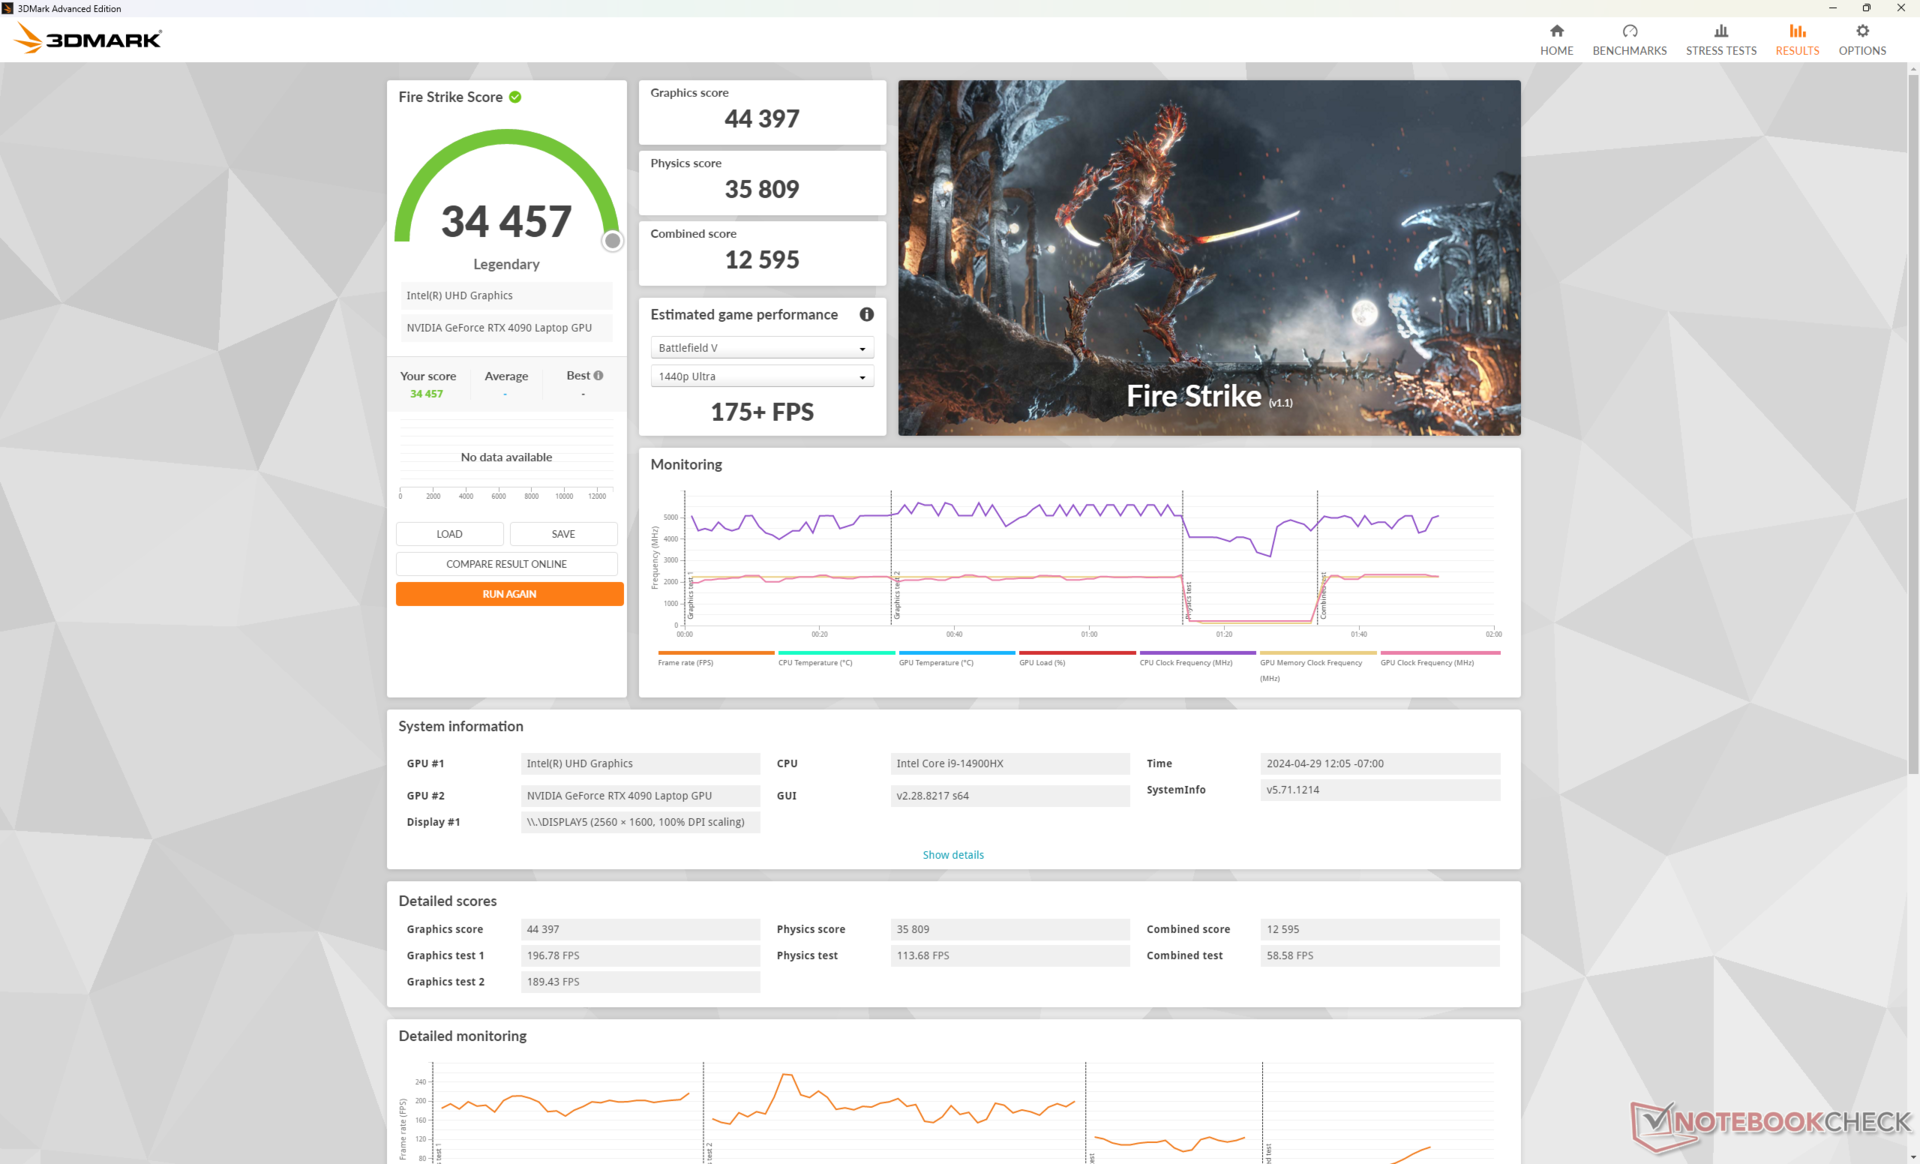
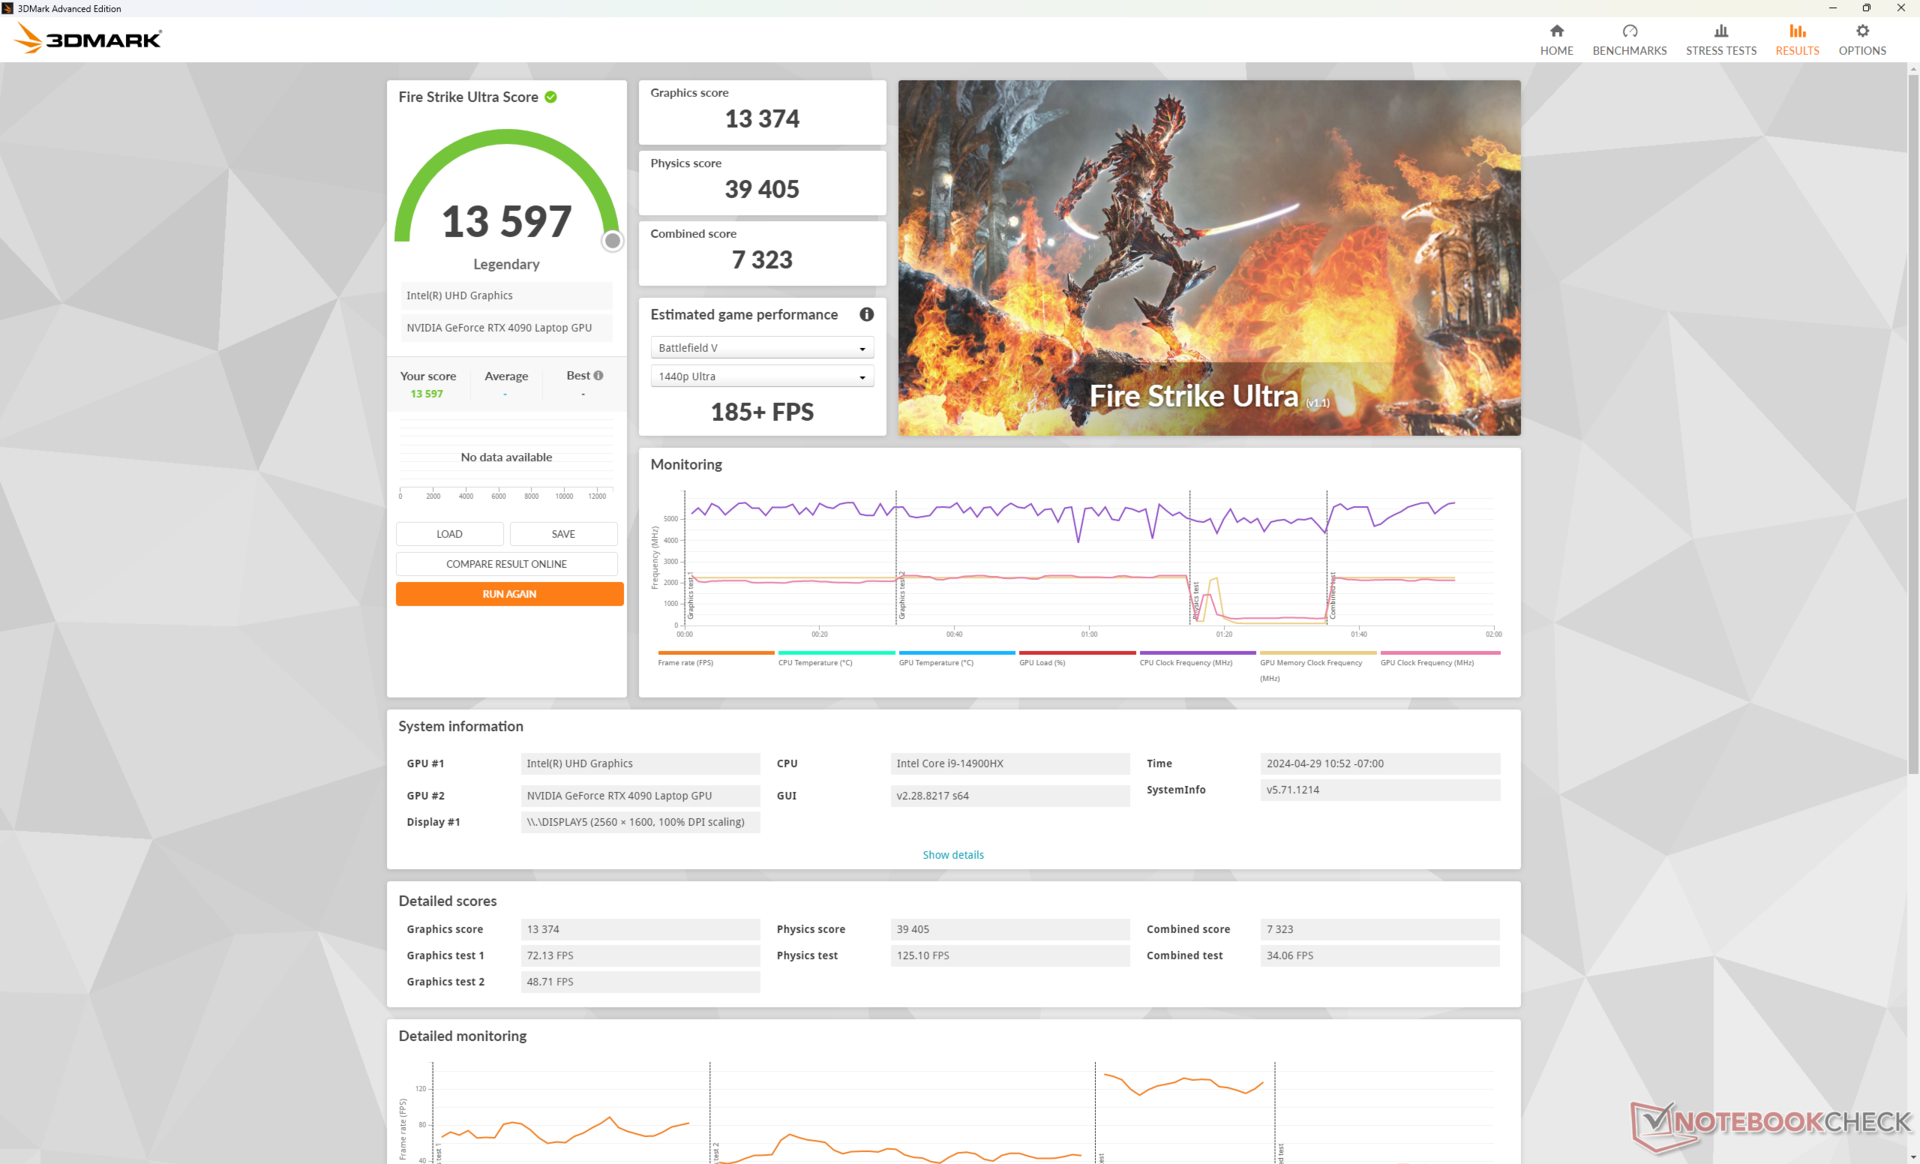
Oyun Performansı - Üst Üste İkinci Yıl RTX 4090
Ham grafik performansı mobil GeForce RTX 4090 esasen aşağıdakilerle aynıdır Bıçak 16 ayrıca 175 W TGP grafiklere sahiptir. Bu nedenle Blade 18, oyunları küçük muadilinden belirgin şekilde daha hızlı çalıştırmayacaktır. Bir alt sınıfa geçmek RTX 4080 veya 4070 yapılandırmasının performansı sırasıyla yaklaşık yüzde 10 ve yüzde 35 ila 40 oranında etkilemesi beklenmektedir. Bu MSI Titan 18 HX aynı GPU'yu Razer'dan biraz daha hızlı çalıştırabilir, ancak aynı zamanda önemli ölçüde daha büyük ve daha ağırdır.
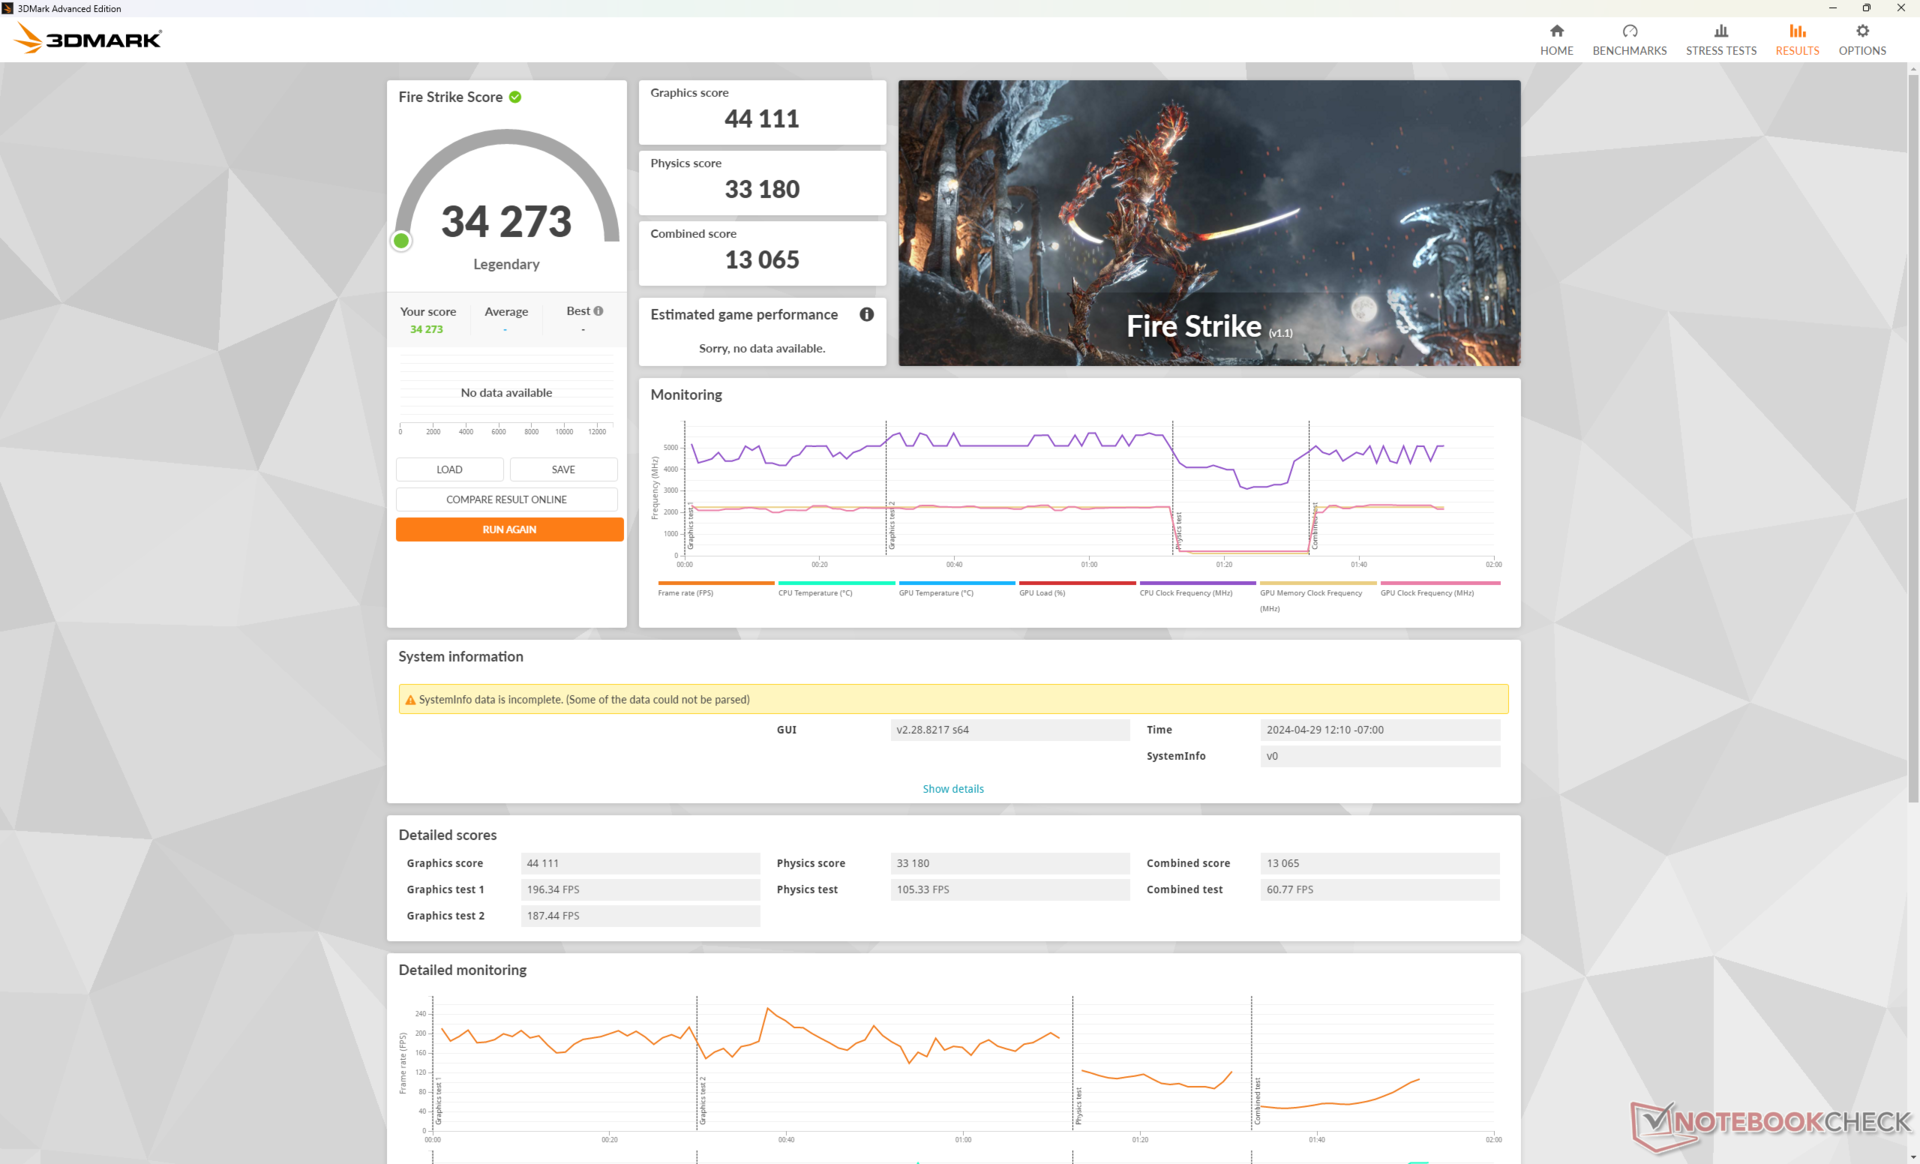
Aşağıdaki Fire Strike sonuç tablomuzda gösterildiği gibi, Max Fan modunun sistem performansı üzerinde çok az etkisi olduğunu veya hiç etkisi olmadığını unutmayın. Bu nedenle GPU'dan en iyi şekilde yararlanmak için Max Fan modunu etkinleştirmek gerekli değildir. Turbo modunun bile oyun oynarken performans üzerinde önemli bir etkisi olmadığı görülüyor.
| Güç Profili | Grafik Puanı | Fizik Puanı | Birleşik Puan |
| Maksimum Fan Açıkken Özel Profil | 44702 | 38887 | 12094 |
| Maksimum Fan Kapalı Özel Profil | 44397 (-1%) | 35809 (-8%) | 12595 (-0%) |
| Turbo Modu | 44111 (-1%) | 33180 (-15%) | 13065 (-0%) |
| Dengeli Mod | 36832 (-18%) | 25159 (-35%) | 6109 (-49%) |
| Akü Gücü | 18581 (-58%) | 23066 (-41%) | 5093 (-58%) |
Gelişmiş Optimus, dGPU ve Optimus modları arasında geçiş yapmak için desteklenir. Bununla birlikte, son sürümlerin aksine ek güç tasarrufu için yalnızca iGPU modu yoktur Alienware dizüstü bilgisayarlar.
| 3DMark Performance rating - Percent | |
| AMD Ryzen 7 7800X3D | |
| Alienware m18 R1 | |
| MSI Titan 18 HX A14VIG | |
| Alienware m18 R2 | |
| Asus ROG Strix Scar 17 G733PYV-LL053X | |
| Razer Blade 18 2024 RZ09-0509 | |
| Ortalama NVIDIA GeForce RTX 4090 Laptop GPU | |
| Razer Blade 16 2024, RTX 4090 -1! | |
| Asus ROG Strix Scar 18 G834JYR (2024) | |
| Alienware m18 R1 AMD -1! | |
| Razer Blade 16 Early 2023 | |
| Razer Blade 18 RTX 4070 | |
| 3DMark 11 - 1280x720 Performance GPU | |
| AMD Ryzen 7 7800X3D | |
| Alienware m18 R1 | |
| Alienware m18 R2 | |
| Razer Blade 16 2024, RTX 4090 | |
| Ortalama NVIDIA GeForce RTX 4090 Laptop GPU (54073 - 73027, n=42) | |
| Razer Blade 18 2024 RZ09-0509 | |
| Asus ROG Strix Scar 17 G733PYV-LL053X | |
| MSI Titan 18 HX A14VIG | |
| Asus ROG Strix Scar 18 G834JYR (2024) | |
| Alienware m18 R1 AMD | |
| Razer Blade 16 Early 2023 | |
| Razer Blade 18 RTX 4070 | |
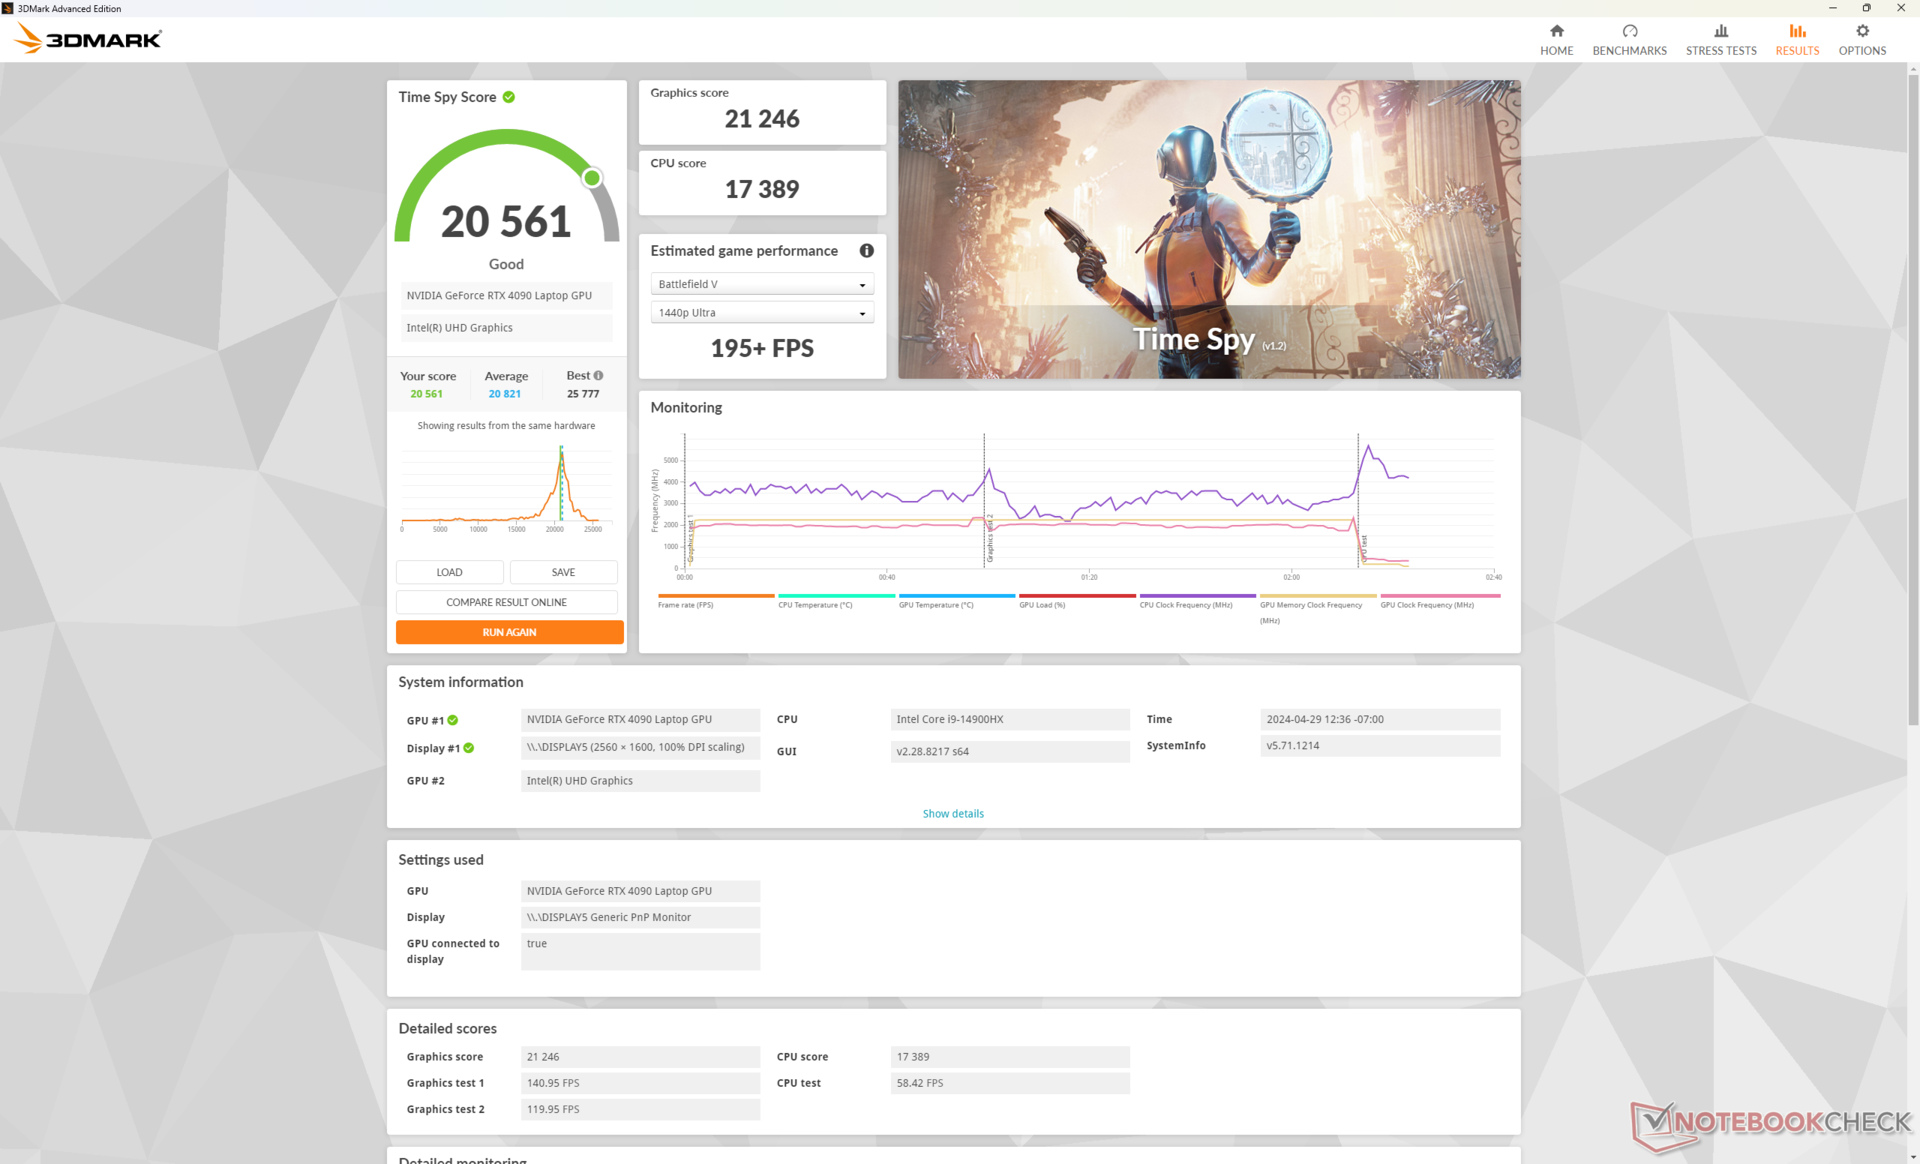
| 3DMark 11 Performance | 45938 puan | |
| 3DMark Fire Strike Score | 34597 puan | |
| 3DMark Time Spy Score | 20561 puan | |
Yardım | ||
| Blender | |
| v3.3 Classroom OPTIX/RTX | |
| Razer Blade 18 2024 RZ09-0509 | |
| Ortalama NVIDIA GeForce RTX 4090 Laptop GPU (9 - 19, n=39) | |
| Asus ROG Strix Scar 18 G834JYR (2024) | |
| Razer Blade 16 2024, RTX 4090 | |
| Alienware m18 R2 | |
| Asus ROG Strix Scar 17 G733PYV-LL053X | |
| MSI Titan 18 HX A14VIG | |
| v3.3 Classroom CUDA | |
| Razer Blade 18 2024 RZ09-0509 | |
| Ortalama NVIDIA GeForce RTX 4090 Laptop GPU (16 - 24, n=39) | |
| Asus ROG Strix Scar 17 G733PYV-LL053X | |
| MSI Titan 18 HX A14VIG | |
| Razer Blade 16 2024, RTX 4090 | |
| Alienware m18 R2 | |
| Asus ROG Strix Scar 18 G834JYR (2024) | |
| v3.3 Classroom CPU | |
| Asus ROG Strix Scar 18 G834JYR (2024) | |
| Razer Blade 18 2024 RZ09-0509 | |
| Razer Blade 16 2024, RTX 4090 | |
| Ortalama NVIDIA GeForce RTX 4090 Laptop GPU (144 - 305, n=39) | |
| Alienware m18 R2 | |
| MSI Titan 18 HX A14VIG | |
| Asus ROG Strix Scar 17 G733PYV-LL053X | |
* ... daha küçük daha iyidir
| Performance rating - Percent | |
| Asus ROG Strix Scar 17 G733PYV-LL053X | |
| Alienware m18 R2 | |
| MSI Titan 18 HX A14VIG | |
| Razer Blade 16 2024, RTX 4090 | |
| Asus ROG Strix Scar 18 G834JYR (2024) | |
| Razer Blade 18 2024 RZ09-0509 | |
| Sınıf ortalaması Gaming | |
| The Witcher 3 - 1920x1080 Ultra Graphics & Postprocessing (HBAO+) | |
| MSI Titan 18 HX A14VIG | |
| Asus ROG Strix Scar 17 G733PYV-LL053X | |
| Alienware m18 R2 | |
| Razer Blade 16 2024, RTX 4090 | |
| Razer Blade 18 2024 RZ09-0509 | |
| Sınıf ortalaması Gaming (104.7 - 240, n=6, son 2 yıl) | |
| Asus ROG Strix Scar 18 G834JYR (2024) | |
| GTA V - 1920x1080 Highest AA:4xMSAA + FX AF:16x | |
| Asus ROG Strix Scar 17 G733PYV-LL053X | |
| MSI Titan 18 HX A14VIG | |
| Razer Blade 16 2024, RTX 4090 | |
| Alienware m18 R2 | |
| Asus ROG Strix Scar 18 G834JYR (2024) | |
| Sınıf ortalaması Gaming (48.3 - 186.9, n=93, son 2 yıl) | |
| Razer Blade 18 2024 RZ09-0509 | |
| Final Fantasy XV Benchmark - 1920x1080 High Quality | |
| Alienware m18 R2 | |
| MSI Titan 18 HX A14VIG | |
| Asus ROG Strix Scar 17 G733PYV-LL053X | |
| Asus ROG Strix Scar 18 G834JYR (2024) | |
| Razer Blade 18 2024 RZ09-0509 | |
| Sınıf ortalaması Gaming (41 - 215, n=94, son 2 yıl) | |
| Razer Blade 16 2024, RTX 4090 | |
| Strange Brigade - 1920x1080 ultra AA:ultra AF:16 | |
| Asus ROG Strix Scar 17 G733PYV-LL053X | |
| MSI Titan 18 HX A14VIG | |
| Alienware m18 R2 | |
| Razer Blade 16 2024, RTX 4090 | |
| Asus ROG Strix Scar 18 G834JYR (2024) | |
| Razer Blade 18 2024 RZ09-0509 | |
| Sınıf ortalaması Gaming (76.3 - 456, n=86, son 2 yıl) | |
| Dota 2 Reborn - 1920x1080 ultra (3/3) best looking | |
| Asus ROG Strix Scar 17 G733PYV-LL053X | |
| Razer Blade 16 2024, RTX 4090 | |
| MSI Titan 18 HX A14VIG | |
| Alienware m18 R2 | |
| Razer Blade 18 2024 RZ09-0509 | |
| Asus ROG Strix Scar 18 G834JYR (2024) | |
| Sınıf ortalaması Gaming (84.8 - 248, n=106, son 2 yıl) | |
| X-Plane 11.11 - 1920x1080 high (fps_test=3) | |
| Asus ROG Strix Scar 17 G733PYV-LL053X | |
| Razer Blade 16 2024, RTX 4090 | |
| Alienware m18 R2 | |
| Asus ROG Strix Scar 18 G834JYR (2024) | |
| Razer Blade 18 2024 RZ09-0509 | |
| MSI Titan 18 HX A14VIG | |
| Sınıf ortalaması Gaming (55.5 - 143.5, n=108, son 2 yıl) | |
| Cyberpunk 2077 | |
| 3840x2160 Ultra Preset (FSR off) | |
| Sınıf ortalaması Gaming (25.1 - 128.8, n=35, son 2 yıl) | |
| Asus ROG Strix Scar 17 G733PYV-LL053X | |
| MSI Titan 18 HX A14VIG | |
| Alienware m18 R2 | |
| Ortalama NVIDIA GeForce RTX 4090 Laptop GPU (31.6 - 50.6, n=11) | |
| Razer Blade 16 2024, RTX 4090 | |
| Razer Blade 18 2024 RZ09-0509 | |
| 2560x1440 Ultra Preset (FSR off) | |
| Asus ROG Strix Scar 17 G733PYV-LL053X | |
| MSI Titan 18 HX A14VIG | |
| Alienware m18 R2 | |
| Ortalama NVIDIA GeForce RTX 4090 Laptop GPU (68.1 - 103.9, n=21) | |
| Asus ROG Strix Scar 18 G834JYR (2024) | |
| Razer Blade 16 2024, RTX 4090 | |
| Razer Blade 18 2024 RZ09-0509 | |
| Sınıf ortalaması Gaming (24.8 - 122.8, n=90, son 2 yıl) | |
| 1920x1080 Ultra Preset (FSR off) | |
| Asus ROG Strix Scar 17 G733PYV-LL053X | |
| Alienware m18 R2 | |
| MSI Titan 18 HX A14VIG | |
| Ortalama NVIDIA GeForce RTX 4090 Laptop GPU (93.1 - 158, n=21) | |
| Asus ROG Strix Scar 18 G834JYR (2024) | |
| Sınıf ortalaması Gaming (17.7 - 169.9, n=114, son 2 yıl) | |
| Razer Blade 18 2024 RZ09-0509 | |
| Razer Blade 16 2024, RTX 4090 | |
| Baldur's Gate 3 | |
| 3840x2160 Ultra Preset AA:T | |
| Alienware m18 R2 | |
| MSI Titan 18 HX A14VIG | |
| Asus ROG Strix Scar 17 G733PYV-LL053X | |
| Razer Blade 16 2024, RTX 4090 | |
| Ortalama NVIDIA GeForce RTX 4090 Laptop GPU (57 - 81.7, n=10) | |
| Sınıf ortalaması Gaming (38.8 - 94, n=31, son 2 yıl) | |
| Razer Blade 18 2024 RZ09-0509 | |
| 2560x1440 Ultra Preset AA:T | |
| MSI Titan 18 HX A14VIG | |
| Alienware m18 R2 | |
| Razer Blade 16 2024, RTX 4090 | |
| Asus ROG Strix Scar 17 G733PYV-LL053X | |
| Ortalama NVIDIA GeForce RTX 4090 Laptop GPU (99 - 155.2, n=10) | |
| Razer Blade 18 2024 RZ09-0509 | |
| Sınıf ortalaması Gaming (60 - 175.5, n=82, son 2 yıl) | |
| 1920x1080 Ultra Preset AA:T | |
| MSI Titan 18 HX A14VIG | |
| Alienware m18 R2 | |
| Asus ROG Strix Scar 17 G733PYV-LL053X | |
| Ortalama NVIDIA GeForce RTX 4090 Laptop GPU (118 - 208, n=10) | |
| Razer Blade 16 2024, RTX 4090 | |
| Razer Blade 18 2024 RZ09-0509 | |
| Sınıf ortalaması Gaming (59.4 - 246, n=101, son 2 yıl) | |
| Alan Wake 2 | |
| 3840x2160 High Preset | |
| Alienware m18 R2 | |
| Ortalama NVIDIA GeForce RTX 4090 Laptop GPU (41.6 - 46.9, n=5) | |
| Asus ROG Strix Scar 17 G733PYV-LL053X | |
| Razer Blade 18 2024 RZ09-0509 | |
| Razer Blade 16 2024, RTX 4090 | |
| Sınıf ortalaması Gaming (18.6 - 49.9, n=20, son 2 yıl) | |
| 2560x1440 High Preset | |
| Alienware m18 R2 | |
| Ortalama NVIDIA GeForce RTX 4090 Laptop GPU (78.4 - 87.1, n=7) | |
| Asus ROG Strix Scar 17 G733PYV-LL053X | |
| Razer Blade 18 2024 RZ09-0509 | |
| Razer Blade 16 2024, RTX 4090 | |
| Sınıf ortalaması Gaming (36.7 - 93.1, n=32, son 2 yıl) | |
| 1920x1080 High Preset | |
| Ortalama NVIDIA GeForce RTX 4090 Laptop GPU (108.6 - 124.7, n=7) | |
| Alienware m18 R2 | |
| Asus ROG Strix Scar 17 G733PYV-LL053X | |
| Razer Blade 18 2024 RZ09-0509 | |
| Razer Blade 16 2024, RTX 4090 | |
| Sınıf ortalaması Gaming (61.7 - 133.2, n=30, son 2 yıl) | |
Witcher 3 FPS Chart
| düşük | orta | yüksek | ultra | QHD | 4K DLSS | 4K | |
|---|---|---|---|---|---|---|---|
| GTA V (2015) | 129.8 | 126.6 | 165.4 | ||||
| The Witcher 3 (2015) | 193 | 154.6 | 149.8 | ||||
| Dota 2 Reborn (2015) | 213 | 191.8 | 180.5 | 164 | 147 | ||
| Final Fantasy XV Benchmark (2018) | 156.9 | 139.1 | 87.3 | ||||
| X-Plane 11.11 (2018) | 183.8 | 158.2 | 127.2 | 107.2 | |||
| Strange Brigade (2018) | 325 | 268 | 149.2 | ||||
| F1 23 (2023) | 110.9 | 73.1 | 37.1 | ||||
| Baldur's Gate 3 (2023) | 160.5 | 119.2 | 94.4 | 70.5 | |||
| Cyberpunk 2077 (2023) | 101.25 | 83.38 | 37.38 | ||||
| Assassin's Creed Mirage (2023) | 124 | 114 | 98 | 73 | |||
| Alan Wake 2 (2023) | 114.1 | 79.4 | 60.8 | 42.3 | |||
| Call of Duty Modern Warfare 3 2023 (2023) | 174 | 132 | 92 | 87 |
Emisyonlar - Sadece Gerektiğinde Yüksek Sesle
Sistem Gürültüsü
Fan gürültüsü, büyük ölçüde GPU yapılandırma farklılıklarımız nedeniyle 2023 Blade 18'imizde kaydettiğimizden daha yüksek. Fanlar, Dengeli ve Optimus moduna ayarlandığında bile 24 ila 29 dB(A) arasında daha sık atıyordu. Bu fark edilebilecek kadar yüksek ancak asla rahatsız edici değil.
Oyuncular için belki de en önemlisi, fan gürültüsü güç profili ayarına bağlı olarak çok farklı olabilir. Çalışırken Witcher 3 örneğin, Max Fan modu etkinken fan gürültüsü 61 dB(A)'ya kadar çıkarken, Max Fan modu kapalıyken sadece 54 dB(A)'dır. Stok ayarlarında Max Fan açık ve kapalı arasında performans farkı olmadığından, gürültü seviyelerini düşük tutmak için Max Fan kapalı olarak oyun oynamanızı öneririz. Turbo modundaki fan gürültüsü, yukarıdaki performans sonuçlarımızla uyumlu olan Max Fan kapalı ile aynı olacaktır.
Rakiplerle kıyaslandığında Blade 18, Alienware m18 R2'den biraz daha yüksek olmasa da karşılaştırılabilir veya ROG Strix Scar 18 aynı GeForce RTX 4090 GPU üzerinde çalışıyor. Fan seviyeleri >50 dB(A)'ya ulaştığında, özellikle ayak seslerinin ve diğer küçük ses ipuçlarının oyun için hayati önem taşıdığı oyunlarda kulaklık kullanılması önerilir.
Ses yüksekliği
| Boşta |
| 23.9 / 28.2 / 29 dB |
| Çalışırken |
| 36.8 / 61.1 dB |
 | ||
30 dB sessiz 40 dB(A) duyulabilirlik 50 dB(A) gürültülü |
||
min: | ||
| Razer Blade 18 2024 RZ09-0509 GeForce RTX 4090 Laptop GPU, i9-14900HX | Razer Blade 18 RTX 4070 GeForce RTX 4070 Laptop GPU, i9-13950HX, SSSTC CA6-8D1024 | Alienware m18 R2 GeForce RTX 4090 Laptop GPU, i9-14900HX, SK Hynix PC811 HFS002TEM9X152N | MSI Titan 18 HX A14VIG GeForce RTX 4090 Laptop GPU, i9-14900HX, 2x Samsung PM9A1a MZVL22T0HDLB (RAID 0) | Asus ROG Strix Scar 18 G834JYR (2024) GeForce RTX 4090 Laptop GPU, i9-14900HX, Samsung PM9A1a MZVL22T0HDLB | Razer Blade 16 2024, RTX 4090 GeForce RTX 4090 Laptop GPU, i9-14900HX, Samsung PM9A1 MZVL22T0HBLB | |
|---|---|---|---|---|---|---|
| Noise | 7% | 3% | 1% | -5% | 6% | |
| kapalı / ortam * (dB) | 23.4 | 23.5 -0% | 23.6 -1% | 22.8 3% | 24 -3% | 23 2% |
| Idle Minimum * (dB) | 23.9 | 23.8 -0% | 23.8 -0% | 23.8 -0% | 27 -13% | 23 4% |
| Idle Average * (dB) | 28.2 | 23.8 16% | 26.1 7% | 23.8 16% | 28 1% | 23 18% |
| Idle Maximum * (dB) | 29 | 26.8 8% | 31.5 -9% | 28 3% | 32 -10% | 27.66 5% |
| Load Average * (dB) | 36.8 | 37.3 -1% | 31.5 14% | 38 -3% | 50 -36% | 43.76 -19% |
| Witcher 3 ultra * (dB) | 54.1 | 48 11% | 52.1 4% | 57.3 -6% | 50 8% | 46.81 13% |
| Load Maximum * (dB) | 61.1 | 53.5 12% | 56.6 7% | 62.8 -3% | 52 15% | 50.37 18% |
* ... daha küçük daha iyidir
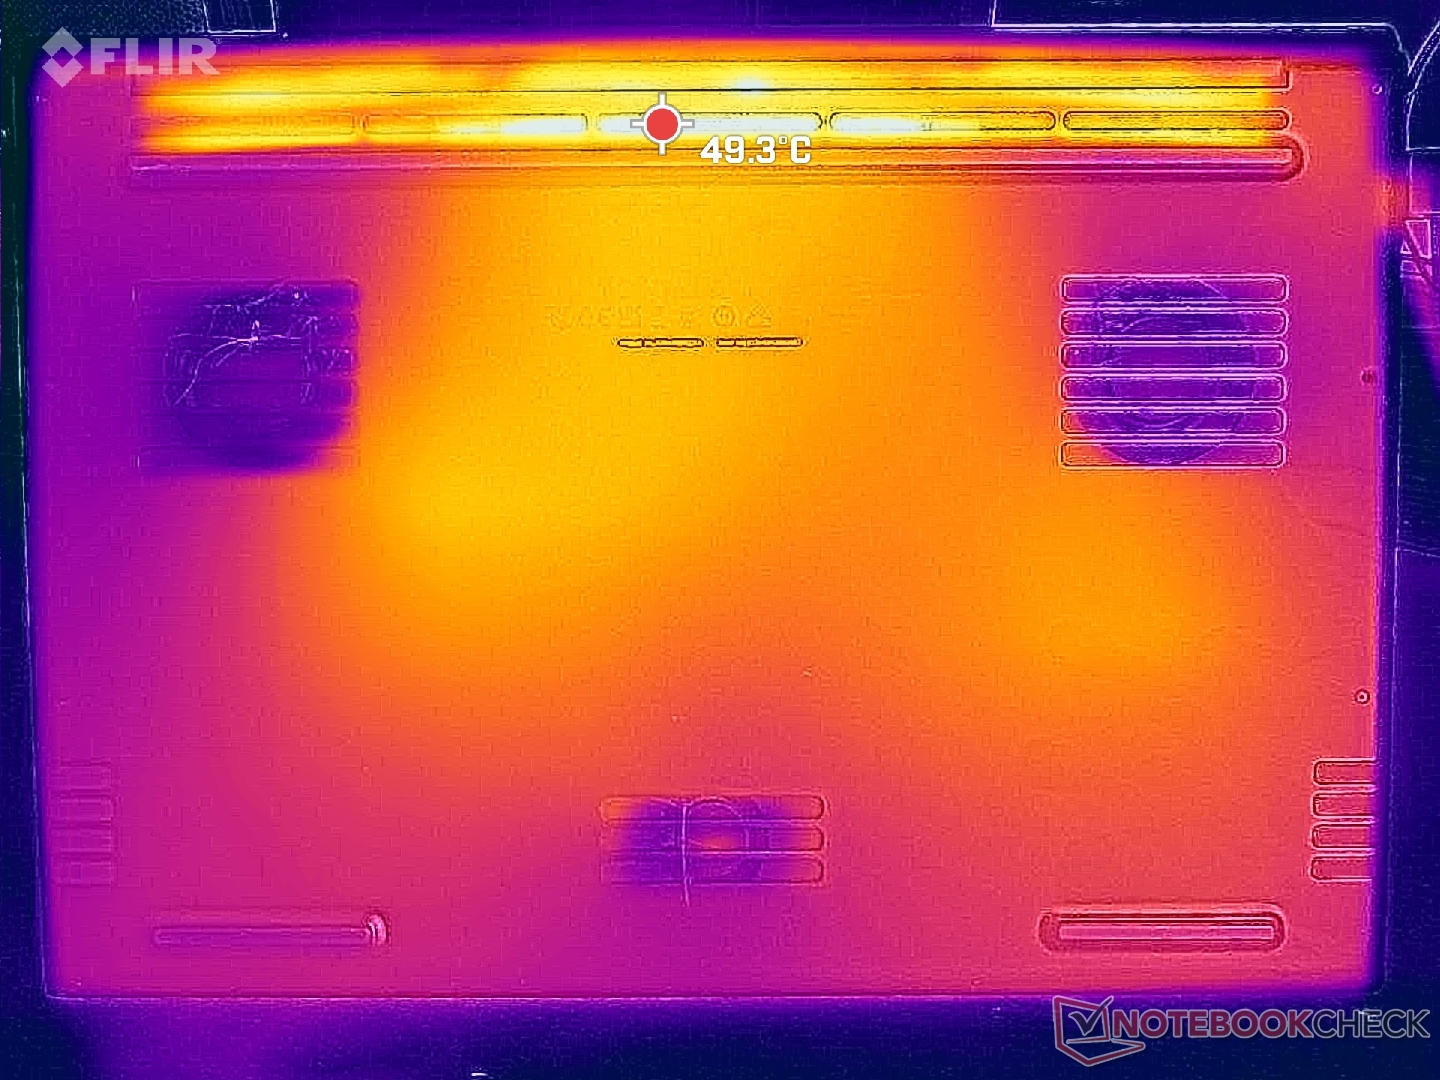
Sıcaklık
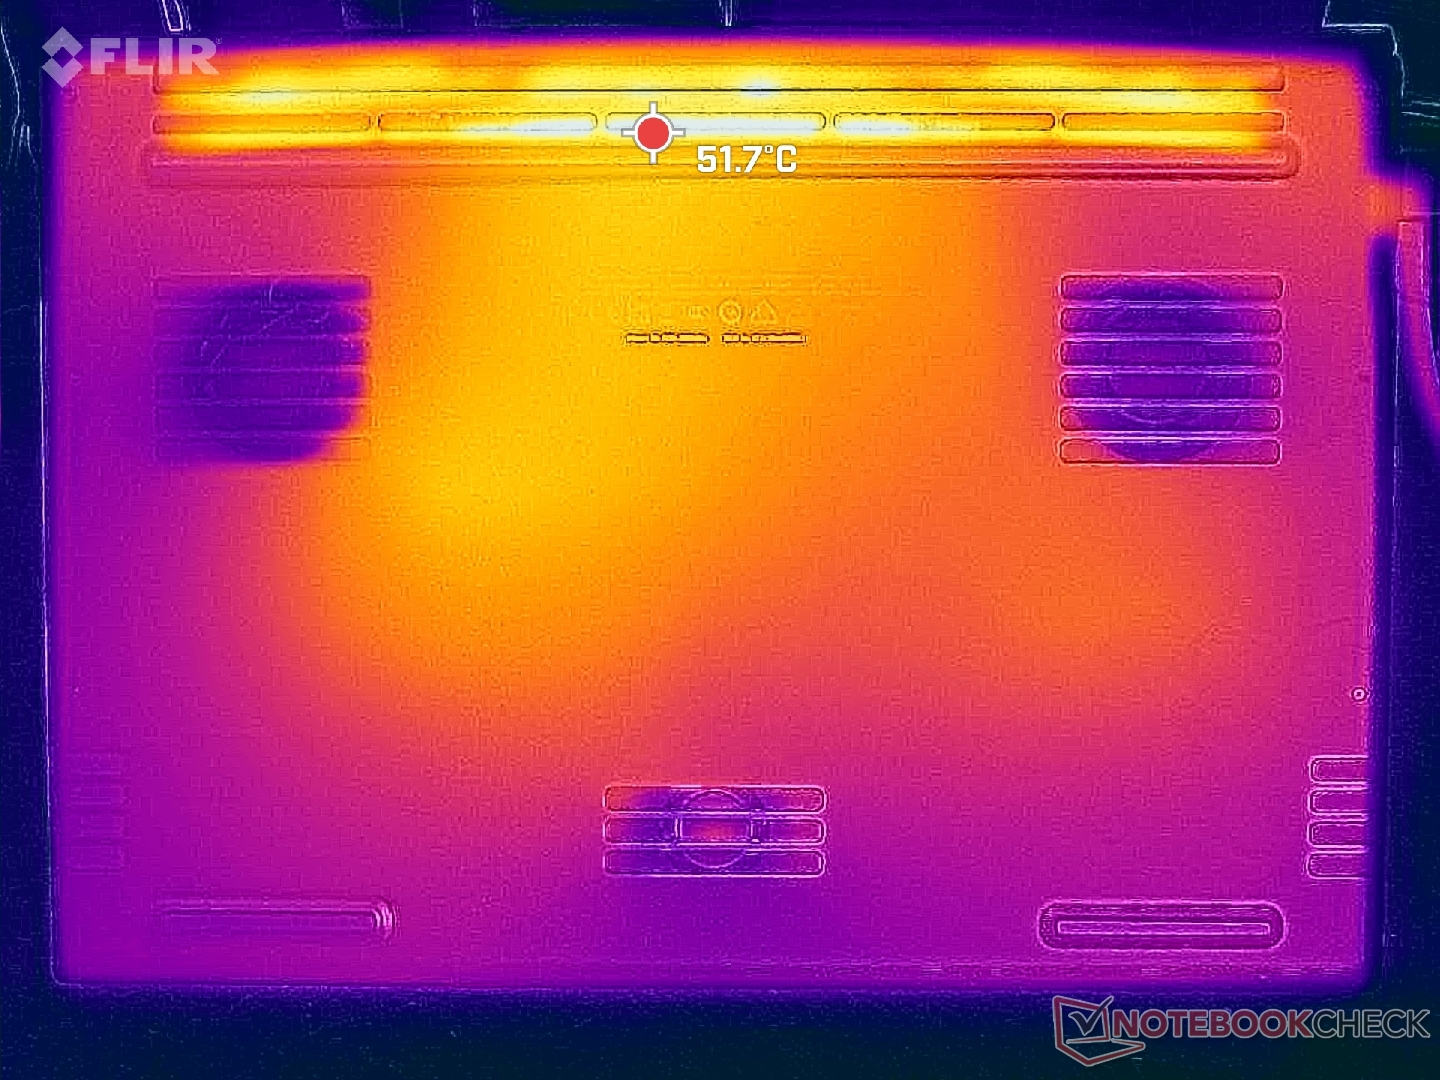
Oyun oynarken yüzey sıcaklıkları 2023 ünitemizde kaydettiğimizden belirgin şekilde daha sıcak, ancak bu yine çoğunlukla konfigürasyonlarımızdaki GPU farklılıklarından kaynaklanıyor. Razer, altta yatan soğutma çözümünde hiçbir değişiklik yapmadı.
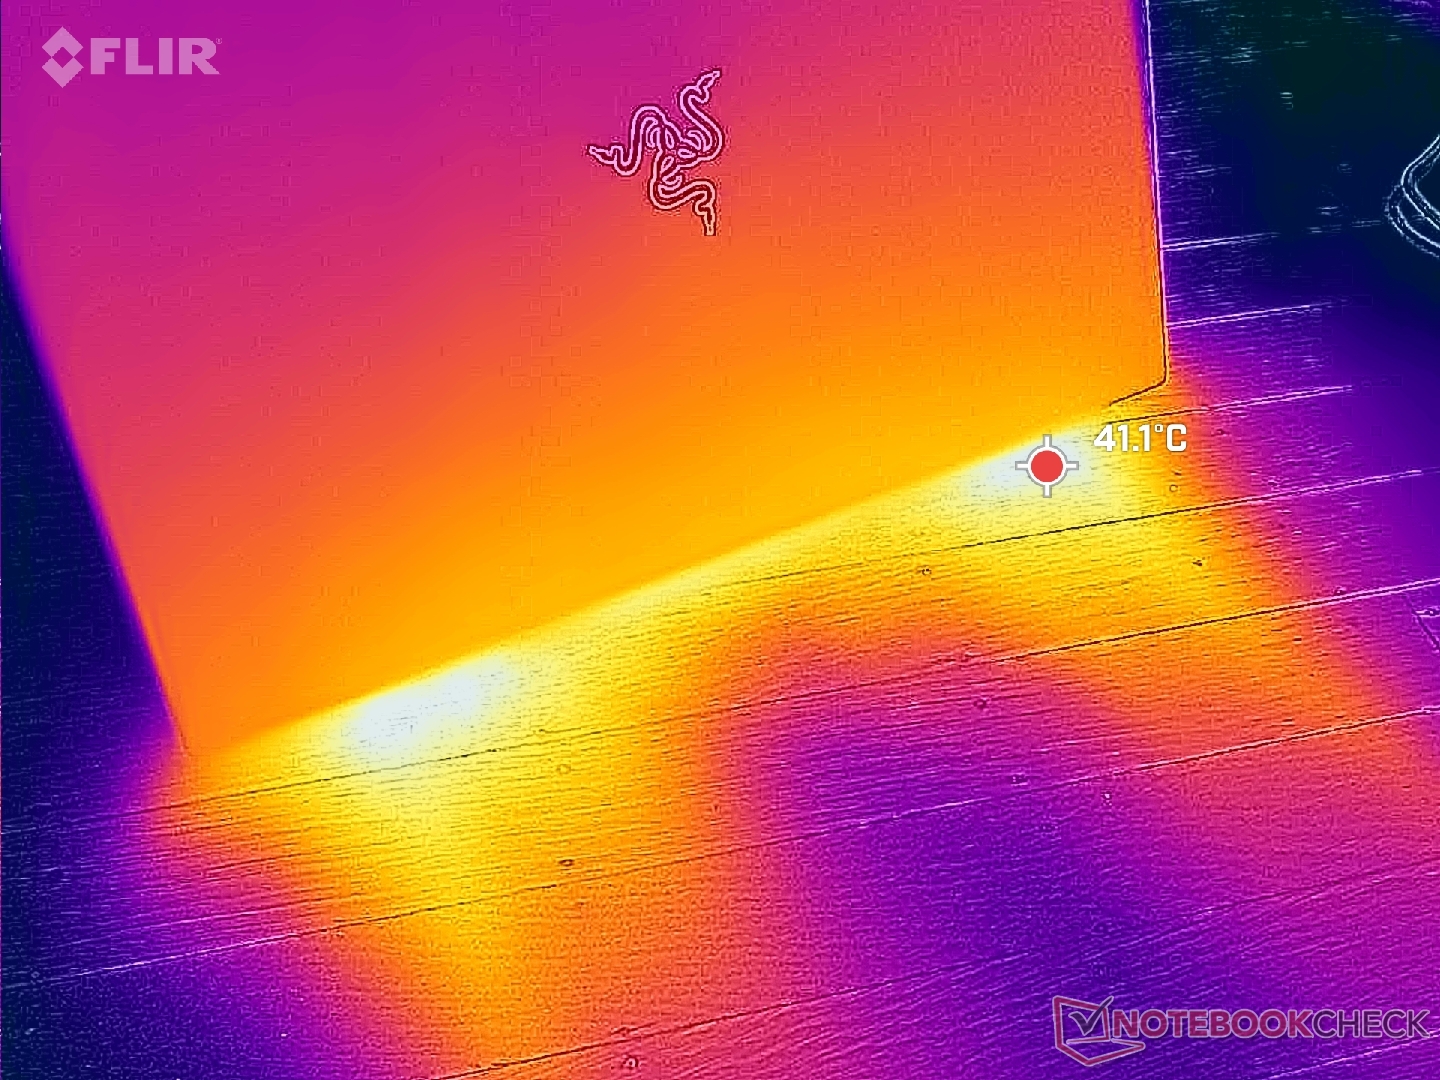
Razer güç tuğlaları piyasadaki en küçük ama en sıcak güç tuğlaları olmaya devam ediyor. Örneğin, Alienware m18 R2 adaptöründe sadece 54 C'ye kıyasla adaptörümüz oyun oynarken 63 C'nin üzerine ulaşıyordu. GaN şarj cihazları söz konusu olduğunda daha yüksek sıcaklıklar tasarım gereğidir.
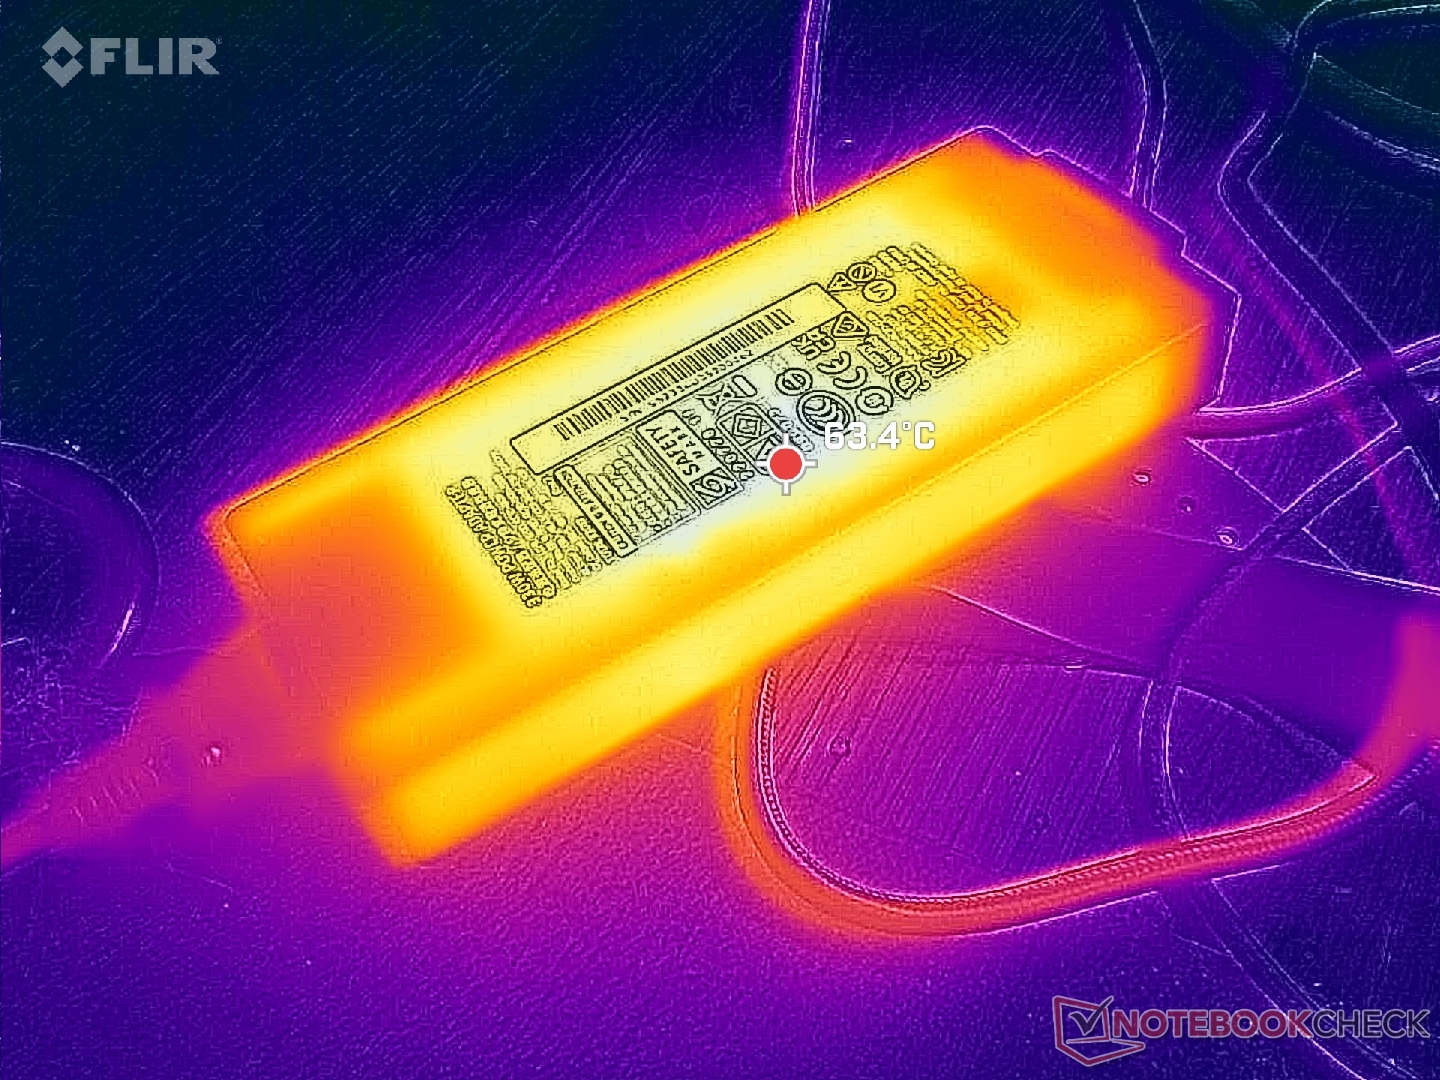
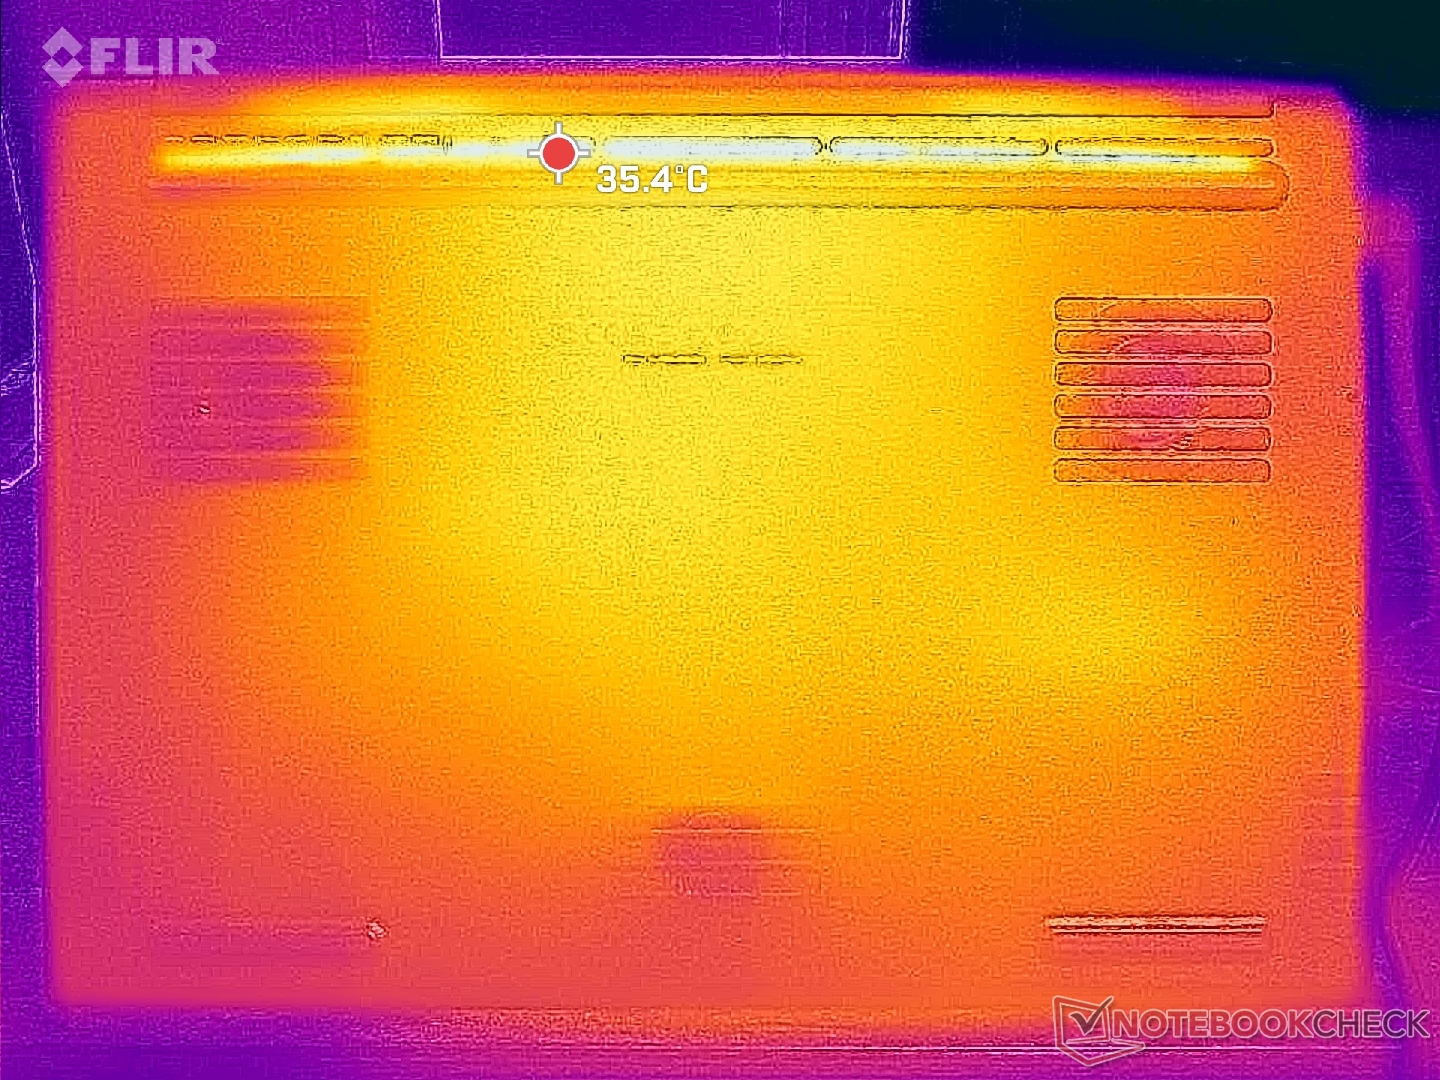
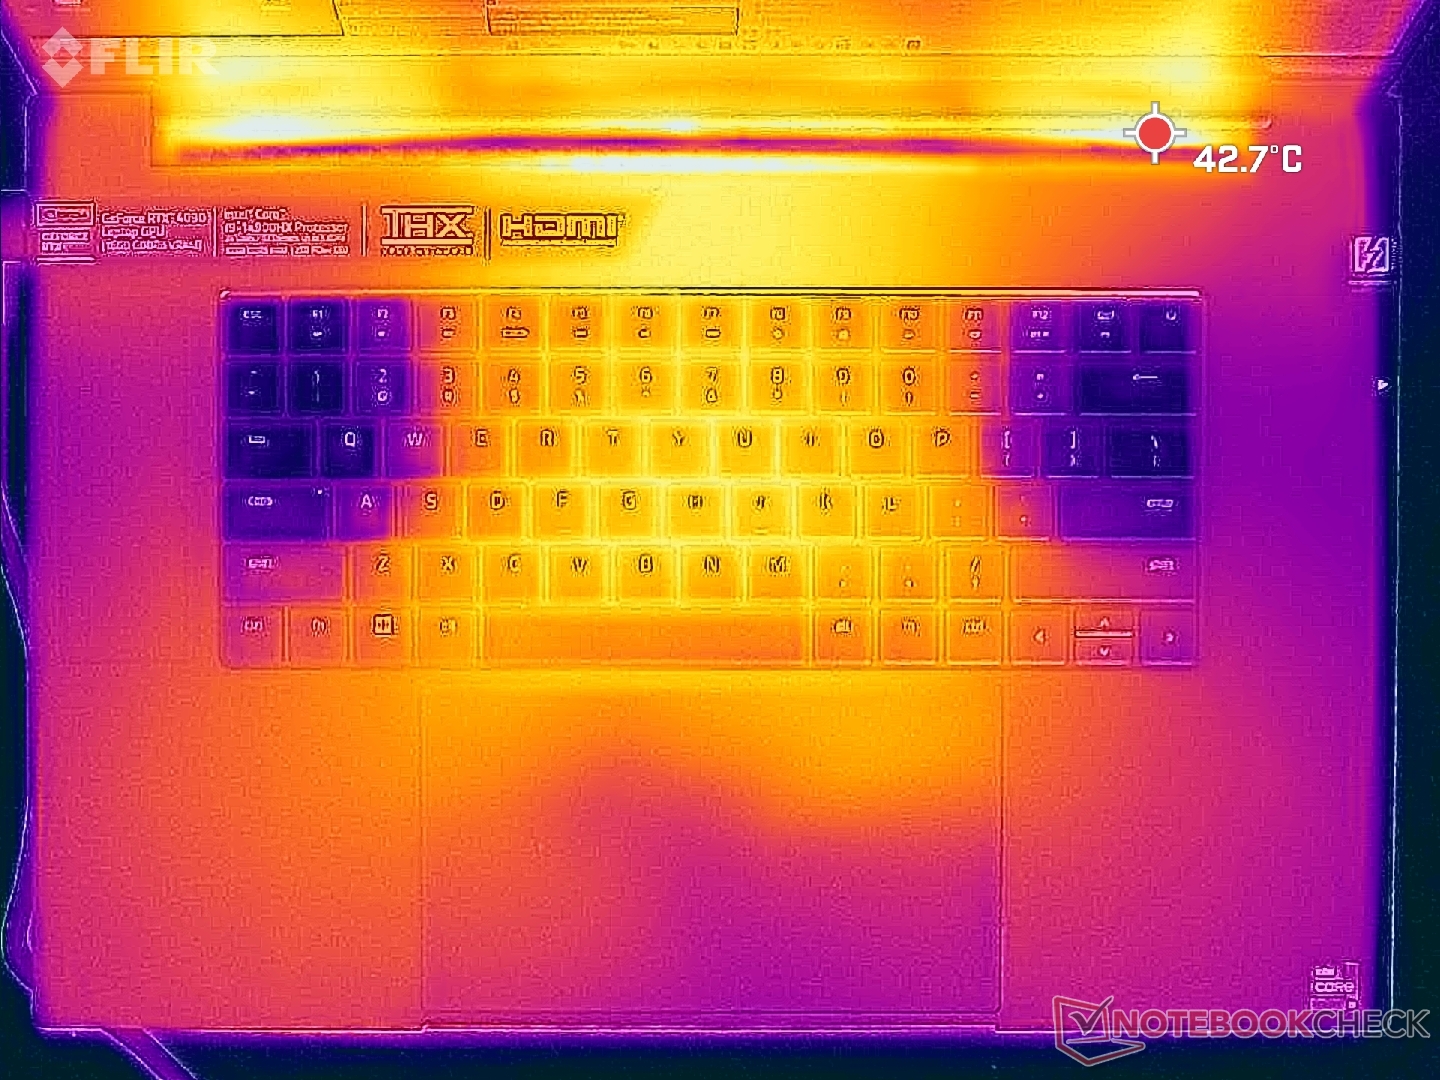
(±) Üst taraftaki maksimum sıcaklık, 40.4 °C / 105 F ortalamasına kıyasla 43.2 °C / 110 F'dir. , Gaming sınıfı için 21.2 ile 68.8 °C arasında değişir.
(±) Alt kısım, 43.2 °C / 110 F ortalamasına kıyasla maksimum 42.6 °C / 109 F'ye kadar ısınır
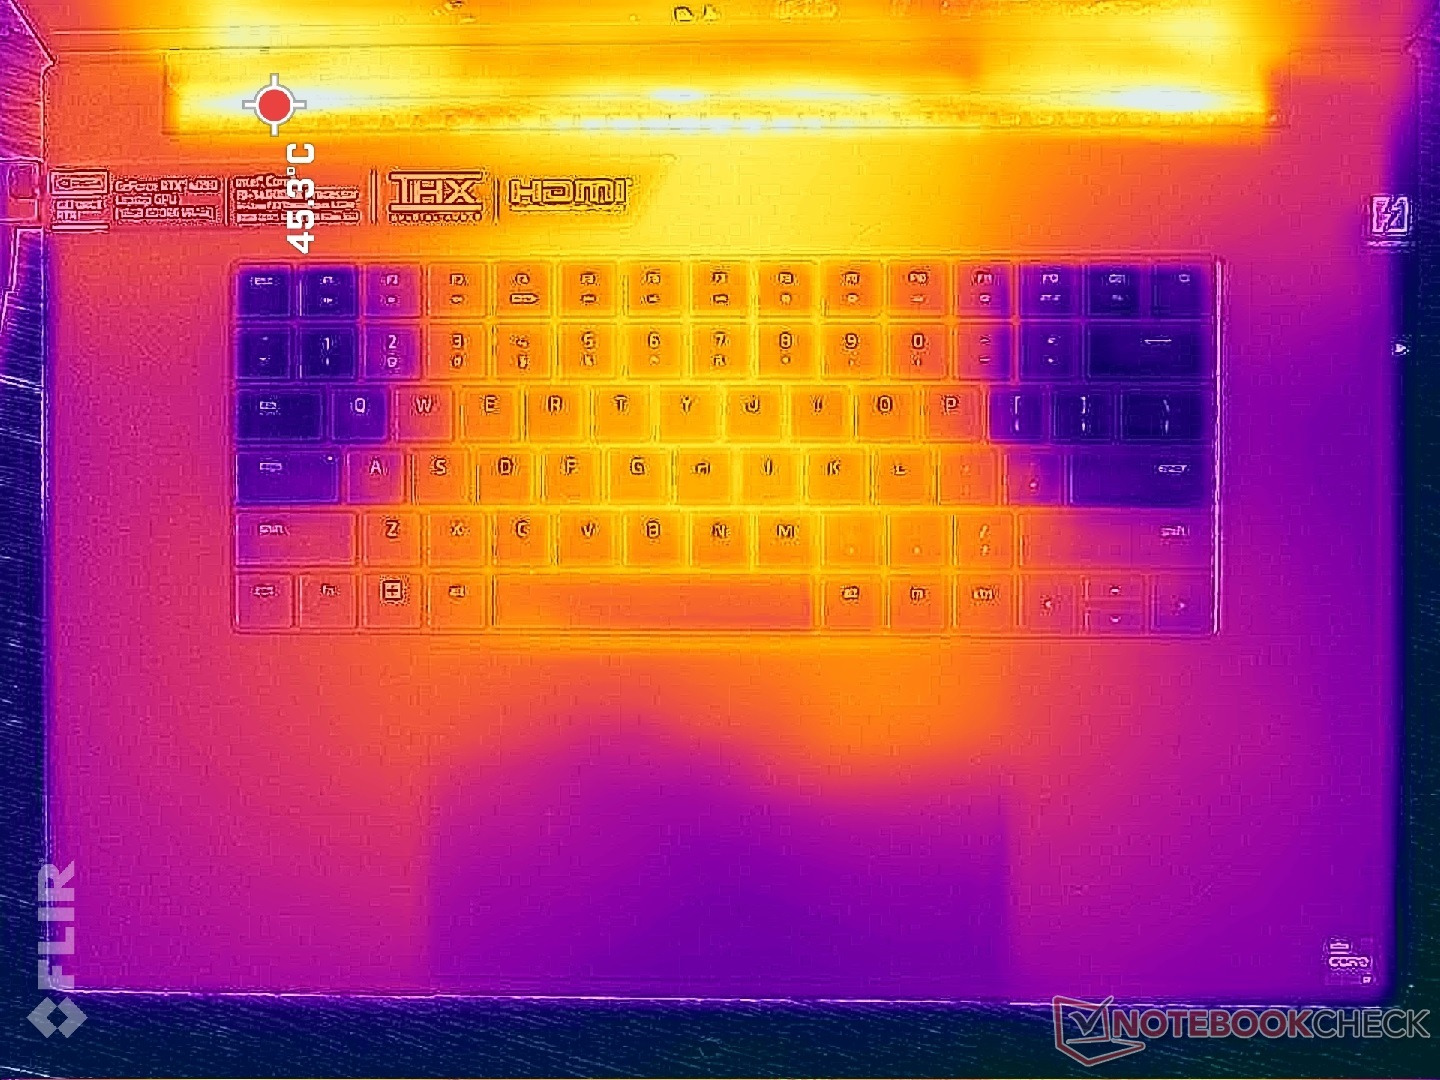
(+) Boşta kullanımda, üst tarafın ortalama sıcaklığı 31.3 °C / 88 F olup, cihazın 33.9 °C / 93 F.
(±) The Witcher 3 oynarken, üst tarafın ortalama sıcaklığı 34.9 °C / 95 F olup, cihazın 33.9 °C / 93 F.
(±) Avuç içi dayanakları ve dokunmatik yüzey maksimum 36.2 °C / 97.2 F ile dokunulamayacak kadar ısınabilir.
(-) Benzer cihazların avuç içi dayanağı alanının ortalama sıcaklığı 28.8 °C / 83.8 F (-7.4 °C / -13.4 F) idi.
| Razer Blade 18 2024 RZ09-0509 Intel Core i9-14900HX, NVIDIA GeForce RTX 4090 Laptop GPU | Razer Blade 18 RTX 4070 Intel Core i9-13950HX, NVIDIA GeForce RTX 4070 Laptop GPU | Alienware m18 R2 Intel Core i9-14900HX, NVIDIA GeForce RTX 4090 Laptop GPU | MSI Titan 18 HX A14VIG Intel Core i9-14900HX, NVIDIA GeForce RTX 4090 Laptop GPU | Asus ROG Strix Scar 18 G834JYR (2024) Intel Core i9-14900HX, NVIDIA GeForce RTX 4090 Laptop GPU | Razer Blade 16 2024, RTX 4090 Intel Core i9-14900HX, NVIDIA GeForce RTX 4090 Laptop GPU | |
|---|---|---|---|---|---|---|
| Heat | 12% | -4% | 7% | 3% | 7% | |
| Maximum Upper Side * (°C) | 43.2 | 39.2 9% | 41.2 5% | 37.8 13% | 49 -13% | 45 -4% |
| Maximum Bottom * (°C) | 42.6 | 35.6 16% | 34.6 19% | 37.6 12% | 47 -10% | 45 -6% |
| Idle Upper Side * (°C) | 36 | 31.8 12% | 42.8 -19% | 34.8 3% | 29 19% | 29 19% |
| Idle Bottom * (°C) | 36.4 | 33.2 9% | 43.6 -20% | 36 1% | 31 15% | 30 18% |
* ... daha küçük daha iyidir
Konuşmacılar
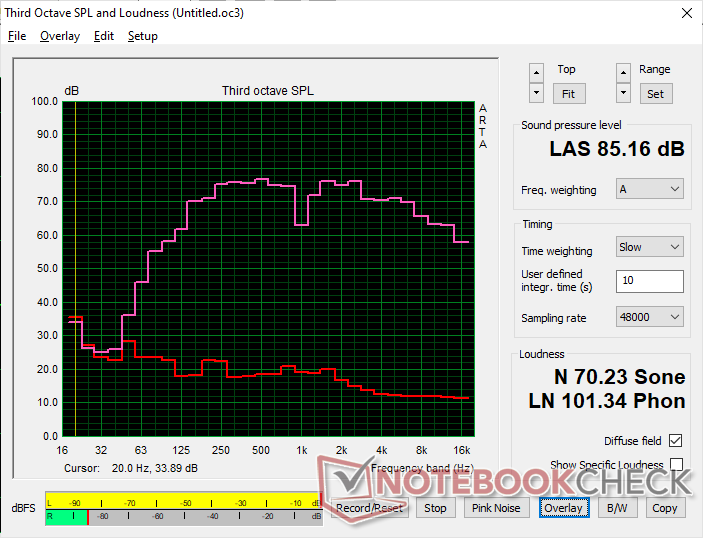
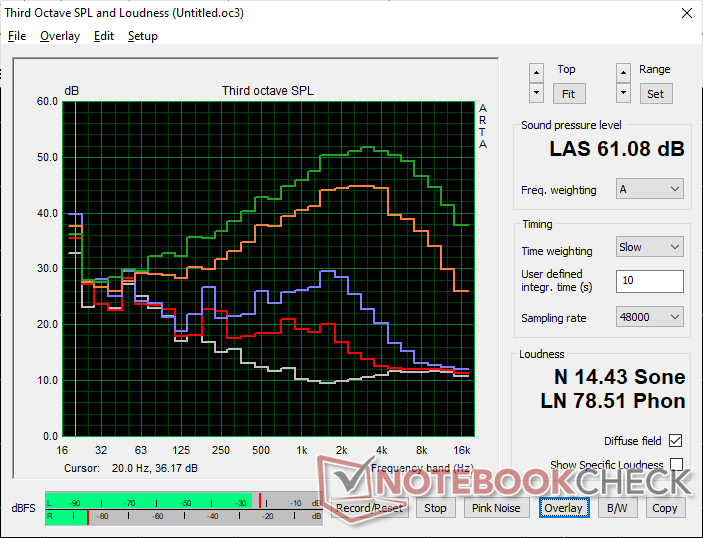
Razer Blade 18 2024 RZ09-0509 ses analizi
(+) | hoparlörler nispeten yüksek sesle çalabilir (85.2 dB)
Bas 100 - 315Hz
(±) | azaltılmış bas - ortalama olarak medyandan 5.3% daha düşük
(+) | bas doğrusaldır (6.5% delta ile önceki frekans)
Ortalar 400 - 2000 Hz
(+) | dengeli ortalar - medyandan yalnızca 4.5% uzakta
(±) | Ortaların doğrusallığı ortalamadır (7.1% delta - önceki frekans)
Yüksekler 2 - 16 kHz
(+) | dengeli yüksekler - medyandan yalnızca 2.9% uzakta
(+) | yüksekler doğrusaldır (4% deltadan önceki frekansa)
Toplam 100 - 16.000 Hz
(+) | genel ses doğrusaldır (9.3% ortancaya göre fark)
Aynı sınıfla karşılaştırıldığında
» Bu sınıftaki tüm test edilen cihazların %3%'si daha iyi, 2% benzer, 95% daha kötüydü
» En iyisinin deltası 6% idi, ortalama 18% idi, en kötüsü 132% idi
Test edilen tüm cihazlarla karşılaştırıldığında
» Test edilen tüm cihazların %3'si daha iyi, 1 benzer, % 96 daha kötüydü
» En iyisinin deltası 4% idi, ortalama 23% idi, en kötüsü 134% idi
Apple MacBook Pro 16 2021 M1 Pro ses analizi
(+) | hoparlörler nispeten yüksek sesle çalabilir (84.7 dB)
Bas 100 - 315Hz
(+) | iyi bas - medyandan yalnızca 3.8% uzakta
(+) | bas doğrusaldır (5.2% delta ile önceki frekans)
Ortalar 400 - 2000 Hz
(+) | dengeli ortalar - medyandan yalnızca 1.3% uzakta
(+) | orta frekanslar doğrusaldır (2.1% deltadan önceki frekansa)
Yüksekler 2 - 16 kHz
(+) | dengeli yüksekler - medyandan yalnızca 1.9% uzakta
(+) | yüksekler doğrusaldır (2.7% deltadan önceki frekansa)
Toplam 100 - 16.000 Hz
(+) | genel ses doğrusaldır (4.6% ortancaya göre fark)
Aynı sınıfla karşılaştırıldığında
» Bu sınıftaki tüm test edilen cihazların %0%'si daha iyi, 0% benzer, 100% daha kötüydü
» En iyisinin deltası 5% idi, ortalama 17% idi, en kötüsü 45% idi
Test edilen tüm cihazlarla karşılaştırıldığında
» Test edilen tüm cihazların %0'si daha iyi, 0 benzer, % 100 daha kötüydü
» En iyisinin deltası 4% idi, ortalama 23% idi, en kötüsü 134% idi
Enerji Yönetimi
Güç Tüketimi
Tüketim, 2023 ve 2024 test ünitelerimiz arasındaki ekran ve GPU farklılıkları nedeniyle beklendiği gibi genel olarak daha yüksektir. Masaüstünde Optimus modunda, minimum parlaklık seviyesinde ve 60 Hz yenileme hızında rölantide çalışmak yaklaşık 25 W gerektirirken, dGPU modunda, maksimum parlaklık seviyesinde ve 300 Hz yenileme hızında rölantide çalışmak 2 kat daha fazla çekecektir.
Witcher 3 adresini çalıştırmak, RTX 4090 destekli 2024 test ünitemizden, benzer koşullar altında RTX 4070 destekli 2023 ünitemize göre yaklaşık 70 W daha fazla talep ediyor. Sonuç olarak, alt uç RTX 4070 yapılandırmaları daha küçük 280 W GaN adaptörle gönderilirken RTX 4080/4090 yapılandırmaları biraz daha büyük 330 W GaN adaptörle gönderilir (~18 x 7,5 x 2,5 cm vs. ~16,3 x 7 x 2,5 cm)
| Kapalı / Bekleme modu | |
| Boşta | |
| Çalışırken |
|
Key:
min: | |
| Razer Blade 18 2024 RZ09-0509 i9-14900HX, GeForce RTX 4090 Laptop GPU, , Mini-LED, 2560x1600, 18" | Razer Blade 18 RTX 4070 i9-13950HX, GeForce RTX 4070 Laptop GPU, SSSTC CA6-8D1024, IPS, 2560x1600, 18" | Alienware m18 R2 i9-14900HX, GeForce RTX 4090 Laptop GPU, SK Hynix PC811 HFS002TEM9X152N, IPS, 2560x1600, 18" | MSI Titan 18 HX A14VIG i9-14900HX, GeForce RTX 4090 Laptop GPU, 2x Samsung PM9A1a MZVL22T0HDLB (RAID 0), Mini-LED, 3840x2400, 18" | Asus ROG Strix Scar 18 G834JYR (2024) i9-14900HX, GeForce RTX 4090 Laptop GPU, Samsung PM9A1a MZVL22T0HDLB, Mini LED, 2560x1600, 18" | |
|---|---|---|---|---|---|
| Power Consumption | 10% | 3% | 3% | 26% | |
| Idle Minimum * (Watt) | 25.4 | 24.5 4% | 10.6 58% | 13.2 48% | 14 45% |
| Idle Average * (Watt) | 37.7 | 34.1 10% | 20.9 45% | 25.4 33% | 17 55% |
| Idle Maximum * (Watt) | 57.9 | 47.7 18% | 40 31% | 53.5 8% | 24 59% |
| Load Average * (Watt) | 128.4 | 140 -9% | 201.1 -57% | 151.4 -18% | 143 -11% |
| Witcher 3 ultra * (Watt) | 273.1 | 202 26% | 358 -31% | 336 -23% | 251 8% |
| Load Maximum * (Watt) | 297.9 | 261 12% | 378.9 -27% | 395.2 -33% | 302 -1% |
* ... daha küçük daha iyidir
Pil Ömrü
Çalışma süreleri, sadece 20 dakika kadar biraz daha uzun olmasa da öncekiyle hemen hemen aynı. WLAN testimizin Optimus modunu ve daha yavaş 60 Hz yenileme hızını hesaba kattığını, yani hem yerel karartma hem de yüksek yenileme hızları etkinken dGPU modunda pil ömrünün daha da kısa olacağını unutmayın.
Bir 18 inçlik oyun güç merkezinden uzun çalışma süreleri beklemek gerçekçi değil, ancak ROG Strix Scar 18 veya Alienware m18 R2 bu konuda hala Razer'ı geride bırakıyor.
| Razer Blade 18 2024 RZ09-0509 i9-14900HX, GeForce RTX 4090 Laptop GPU, 91.7 Wh | Razer Blade 18 RTX 4070 i9-13950HX, GeForce RTX 4070 Laptop GPU, 91.7 Wh | Alienware m18 R2 i9-14900HX, GeForce RTX 4090 Laptop GPU, 97 Wh | MSI Titan 18 HX A14VIG i9-14900HX, GeForce RTX 4090 Laptop GPU, 99.9 Wh | Asus ROG Strix Scar 18 G834JYR (2024) i9-14900HX, GeForce RTX 4090 Laptop GPU, 90 Wh | Razer Blade 16 2024, RTX 4090 i9-14900HX, GeForce RTX 4090 Laptop GPU, 95.2 Wh | |
|---|---|---|---|---|---|---|
| Pil Çalışma Süresi | 9% | 9% | 1% | 53% | 28% | |
| Reader / Idle (h) | 6.6 | 7 6% | 5.9 -11% | 10.2 55% | ||
| WiFi v1.3 (h) | 4.4 | 4 -9% | 4.8 9% | 4.2 -5% | 7.7 75% | 5.5 25% |
| Load (h) | 1 | 1.3 30% | 1.2 20% | 1.3 30% | 1.3 30% | |
| H.264 (h) | 7.5 | 7.6 |
Artılar
Eksiler
Karar - Her Şey Bu Yeni Ekran Seçenekleri Hakkında
Bu yıl dahil edilecek yeni Nvidia GPU'ları olmadığı ve yeni Raptor Lake-HX yenileme serisinden gerçek bir kazanım elde edilmediği için Razer, 2024 Blade 18'i görsel olarak aynı olan 2023 selefinden daha çekici hale getirmek için başka bir yere bakmak zorunda kaldı. Bu durumda en yeni model, hem mini-LED hem de yeni nesil Thunderbolt ile piyasadaki ilk oyun dizüstü bilgisayarlarından biri olmak için Thunderbolt 5 desteğinin yanı sıra yeni ekran seçenekleri içeriyor. Wi-Fi 7 ve web kamerası deklanşörü gibi diğer küçük güncellemeler memnuniyetle karşılanıyor ancak yine de sadece küçük yükseltmeler. Bu spesifik özelliklerden etkilenmeyen oyuncular bunun yerine 2023 Bıçak 18 aynı oyun performansını ve kullanıcı deneyimini yüzlerce dolar daha ucuza sunabiliyor.
Thunderbolt 5, mini-LED ve Wi-Fi 7, 2024 Blade 18'i geçmişten ayırmaya yardımcı oluyor. Ancak performans avcıları, 2023 ve 2024 modelleri arasında önemli bir fark bulamayacaklar.
Dizüstü bilgisayarlardaki mini-LED'e gelince, panel, desteklenen oyunlar ve videolar için hem HDR hem de yerel karartma etkinken en iyisidir. Aksi takdirde, halo etkisinden kaçınmak için iş yükünüze bağlı olarak yerel karartmayı sürekli olarak açıp kapatmanız gerekecektir. Blade 18'i öncelikle oyun ve multimedya için kullanmayı planlıyorsanız, 2K mini LED ekran en uygun seçenek olabilir. Buna karşılık, HDR'yi nadiren etkinleştiren ve Blade 18'i öncelikle içerik oluşturma, düzenleme veya CAD çalışması gibi profesyonel amaçlar için isteyen kullanıcılar, 18 inçlik büyük ekran boyutuyla iyi bir şekilde eşleşen daha yüksek çözünürlüklü 4K IPS yapılandırmasını düşünmelidir. Razer bu konuda madalyonun her iki yüzüne de sahip.
Son olarak, 4K mini LED'in Blade 18'de mevcut olduğunu belirtmek gerekir MSI Titan 18 razer'da ise bu özellik yok. MSI sisteminin G-Sync'i desteklememesi ve bu nedenle şimdilik "nihai" bir 18 inç mini LED panelin bulunmaması bir değiş tokuş.
Fiyat ve Bulunabilirlik
Amazon şu anda mini LED konfigürasyonumuzu 4500 USD karşılığında gönderiyor. Alternatif olarak, kullanıcılar adresini doğrudan Razer'dan satın alabilirler 2023 ve 2024 modelleri arasında daha fazla yapılandırma seçeneği ile.
Razer Blade 18 2024 RZ09-0509
- 05/05/2024 v7 (old)
Allen Ngo
Şeffaflık
İncelenecek cihazların seçimi editör ekibimiz tarafından yapılır. Test örneği, bu incelemenin amacı doğrultusunda üretici veya perakendeci tarafından yazara ödünç olarak sağlanmıştır. Borç verenin bu inceleme üzerinde herhangi bir etkisi olmadığı gibi, üretici de yayınlanmadan önce bu incelemenin bir kopyasını almamıştır. Bu incelemeyi yayınlama zorunluluğu yoktu. Bağımsız bir medya şirketi olarak Notebookcheck, üreticilerin, perakendecilerin veya yayıncıların otoritesine tabi değildir.
Notebookcheck bu şekilde test yapıyor
Notebookcheck, tüm sonuçların karşılaştırılabilir olmasını sağlamak için her yıl yüzlerce dizüstü bilgisayarı ve akıllı telefonu standart prosedürler kullanarak bağımsız olarak inceliyor. Yaklaşık 20 yıldır test yöntemlerimizi sürekli olarak geliştirdik ve bu süreçte endüstri standartlarını belirledik. Test laboratuvarlarımızda deneyimli teknisyenler ve editörler tarafından yüksek kaliteli ölçüm ekipmanları kullanılmaktadır. Bu testler çok aşamalı bir doğrulama sürecini içerir. Karmaşık derecelendirme sistemimiz, nesnelliği koruyan yüzlerce sağlam temellere dayanan ölçüm ve kıyaslamaya dayanmaktadır.Price comparison

