Dell XPS 17 9700 Core i7 Dizüstü Bilgisayar İnceleme: Neredeyse MacBook Pro 17
XPS 17 9700, saygıdeğer XPS serilerinde Dell'in en yeni (ve en büyük) aile üyesidir. Daha küçük XPS 13 9300 ve XPS 15 9500'ün 16:10 en boy oranı, süper boyutlu tıklama yüzeyi, kasa tasarımı ve malzemeleri ve ekranın dört tarafındaki dar çerçeveler dahil olmak üzere fiziksel özelliklerinin çoğunu devralır. daha büyük form faktörü Dell'in XPS 15 ile aynı CPU seçeneklerini korurken hem buhar odası soğutmasını hem de daha hızlı GeForce RTX 2060 Max-Q GPU'yu kullanmasına izin verdi. SKU'lar dört çekirdekli Core i5-10300H CPU, 8 GB ile başlıyor 1400 USD karşılığında DDR4-2933 RAM, 256 GB SSD ve 1200p 500-nit dokunmatik olmayan ekran, üst düzey SKU'lar yerel çözünürlüğü ikiye katlıyor ve dokunmatik ekran desteği, sekiz çekirdekli Core i7-10875H seçenekleri ve GeForce GTX 1650 Ti ekliyor veya 3000 USD'ye kadar RTX 2060 Max-Q grafik kartı. Yakın gelecek için bir Core i9-10980HK seçeneği planlandı. Test birimimiz, ağzına kadar donatılmış üst düzey yapılandırmadır, ancak yakın gelecekte daha düşük bir Core i5 SKU üzerinde başka bir inceleme bekleyebilirsiniz. XPS 17 serisi. XPS 17'nin rakipleri arasında HP Envy 17, Gigabyte Aero 17, MSI Creator 17 ve 16 inç MacBook Pro 16 gibi diğer yüksek performanslı 17 inç multimedya veya profesyonel dizüstü bilgisayarlar yer alıyor. Daha fazla Dell incelemesi: Latitude 7410XPS 15 9500Alienware m17 R2G5 15 EYLEM 5540
Derecelendirme | Tarih | Modeli | Ağırlık | Yükseklik | Boyut | Çözünürlük | Fiyat |
|---|---|---|---|---|---|---|---|
| 87.9 % v7 (old) | 07/2020 | Dell XPS 17 9700 Core i7 RTX 2060 Max-Q i7-10875H, GeForce RTX 2060 Max-Q | 2.5 kg | 19.5 mm | 17.00" | 3840x2400 | |
| 82.5 % v7 (old) | 07/2020 | MSI Creator 17 A10SGS i7-10875H, GeForce RTX 2080 Super Max-Q | 2.4 kg | 20 mm | 17.30" | 3840x2160 | |
| 80.9 % v7 (old) | 06/2020 | HP Envy 17t-cg000 i7-1065G7, GeForce MX330 | 2.7 kg | 19.3 mm | 17.30" | 3840x2160 | |
| 87 % v7 (old) | 05/2020 | Gigabyte Aero 17 HDR XB i7-10875H, GeForce RTX 2070 Super Max-Q | 2.7 kg | 21 mm | 17.30" | 3840x2160 | |
| 87.4 % v7 (old) | 06/2020 | Razer Blade Pro 17 RTX 2070 Max-Q 300 Hz i7-10875H, GeForce RTX 2070 Max-Q | 2.7 kg | 19.9 mm | 17.30" | 1920x1080 |
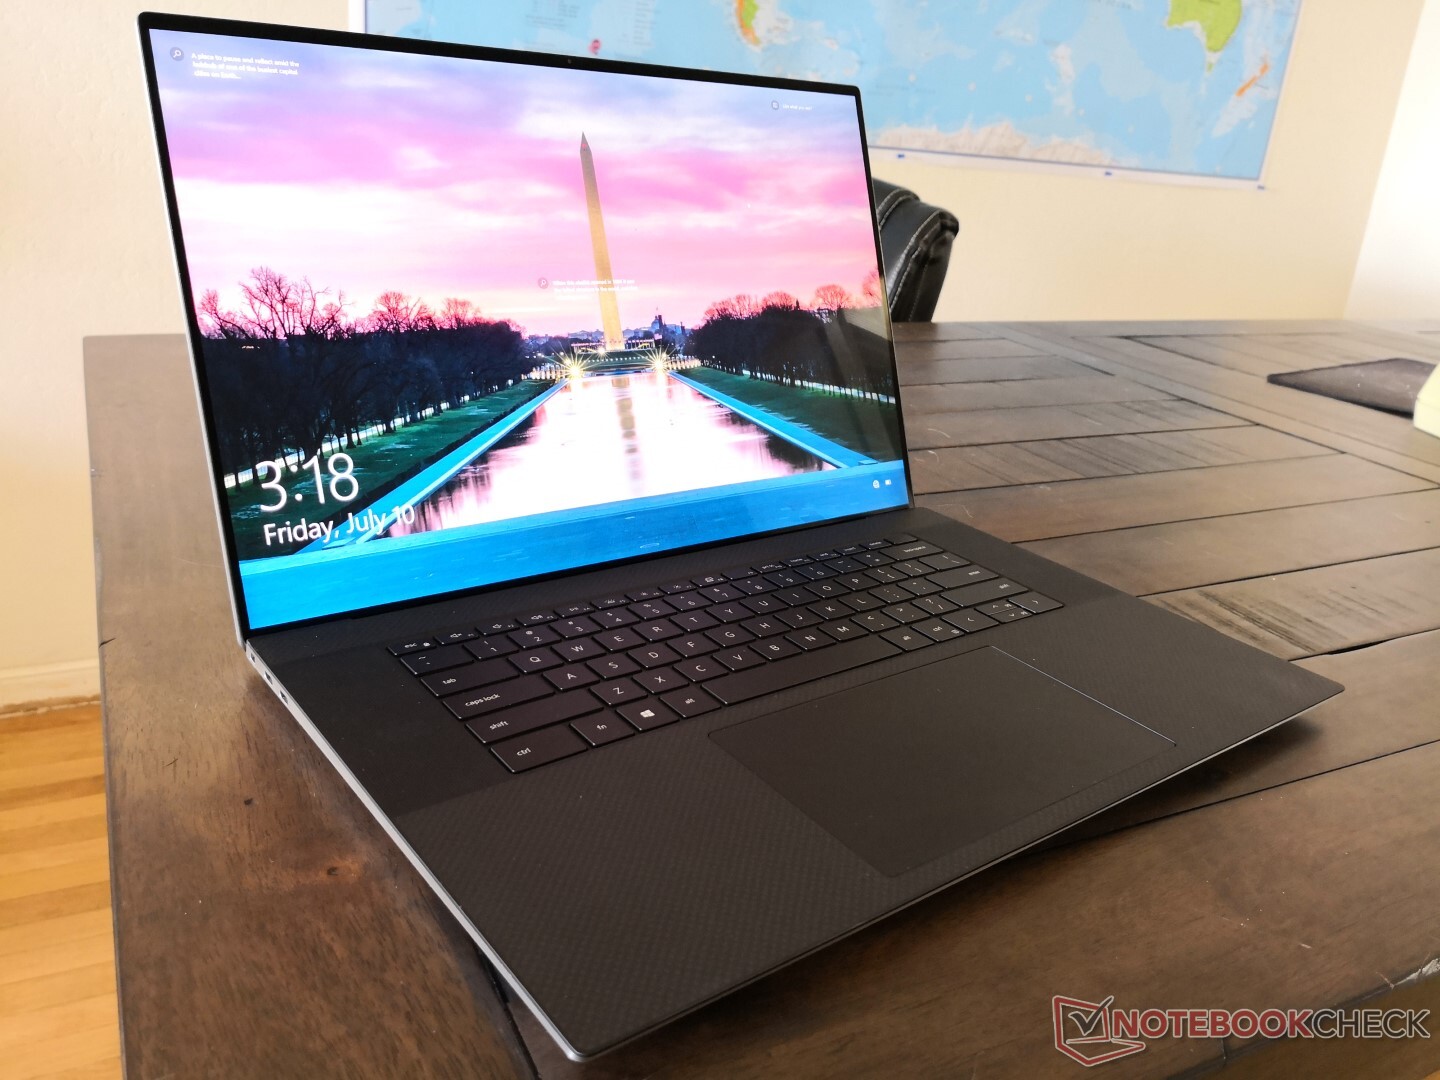
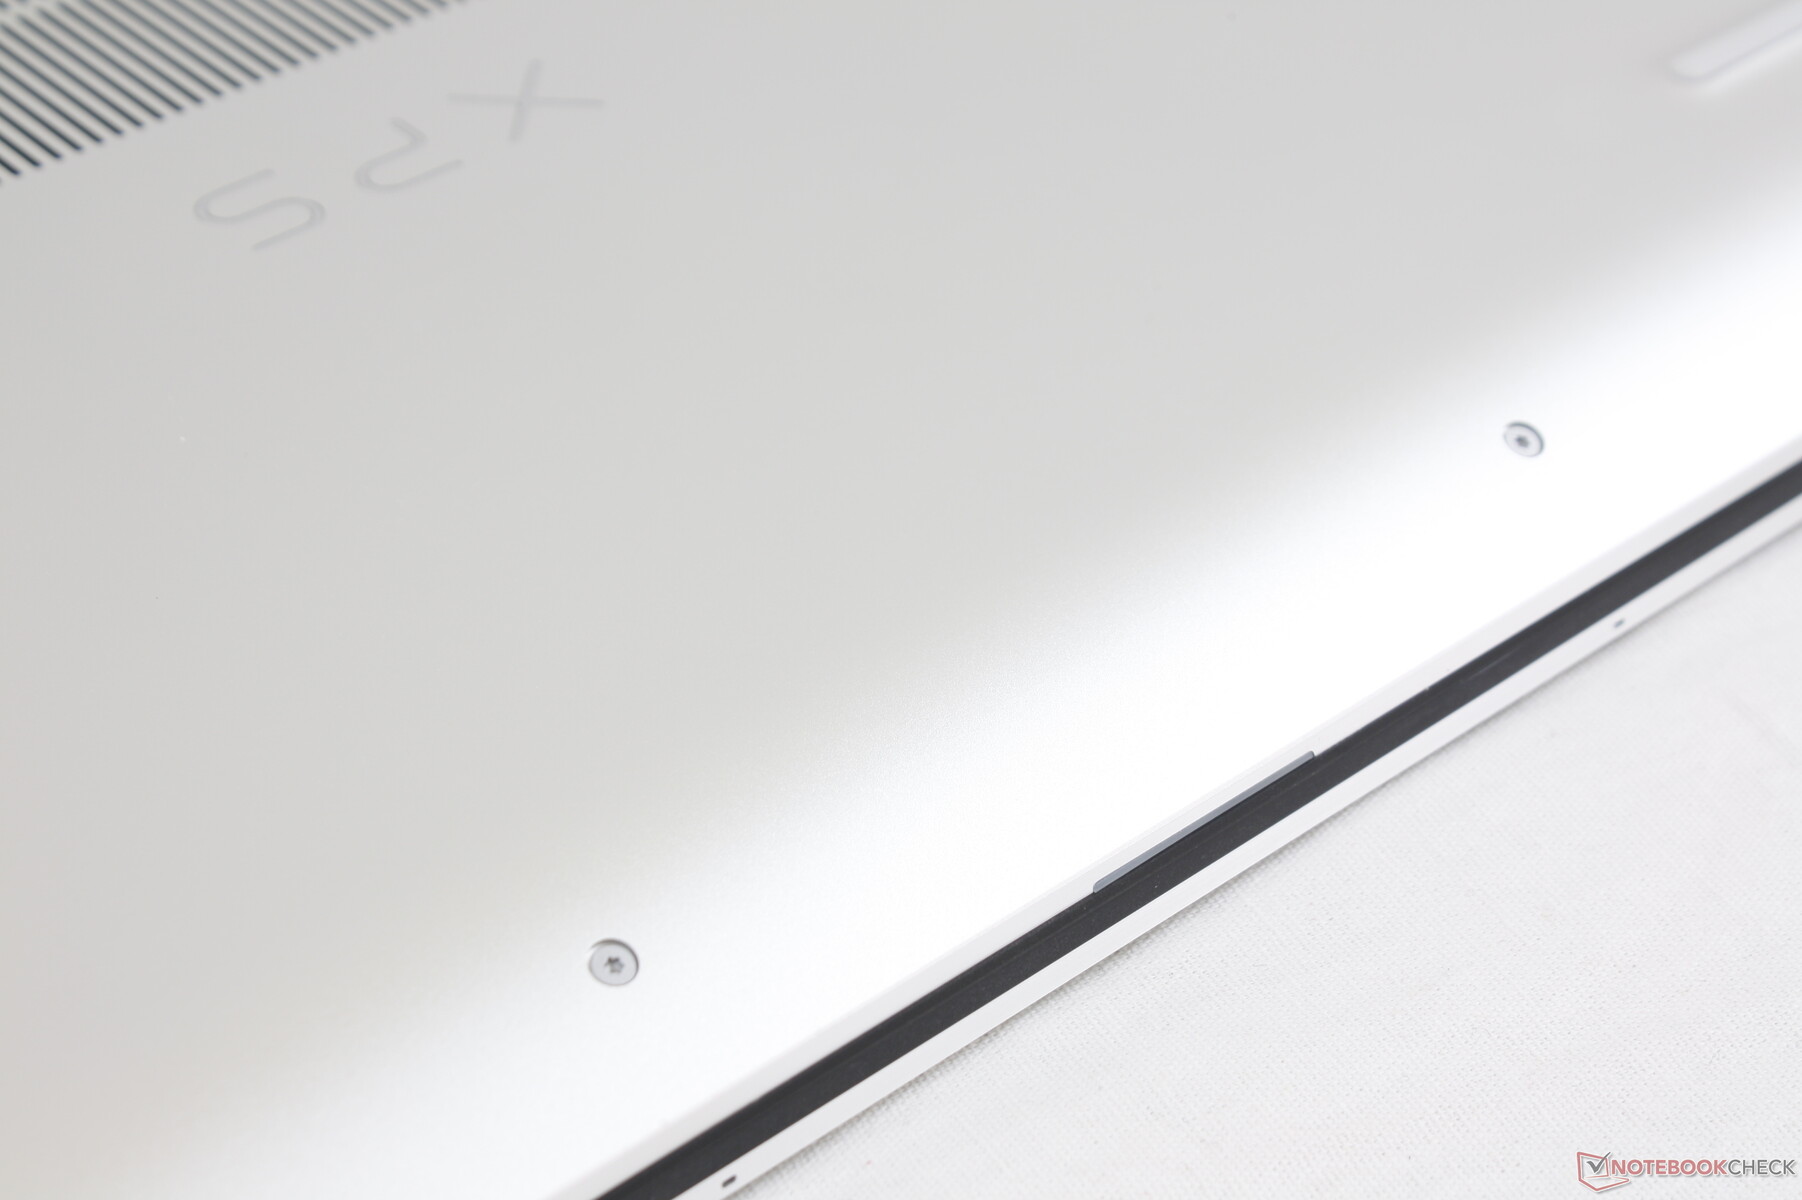
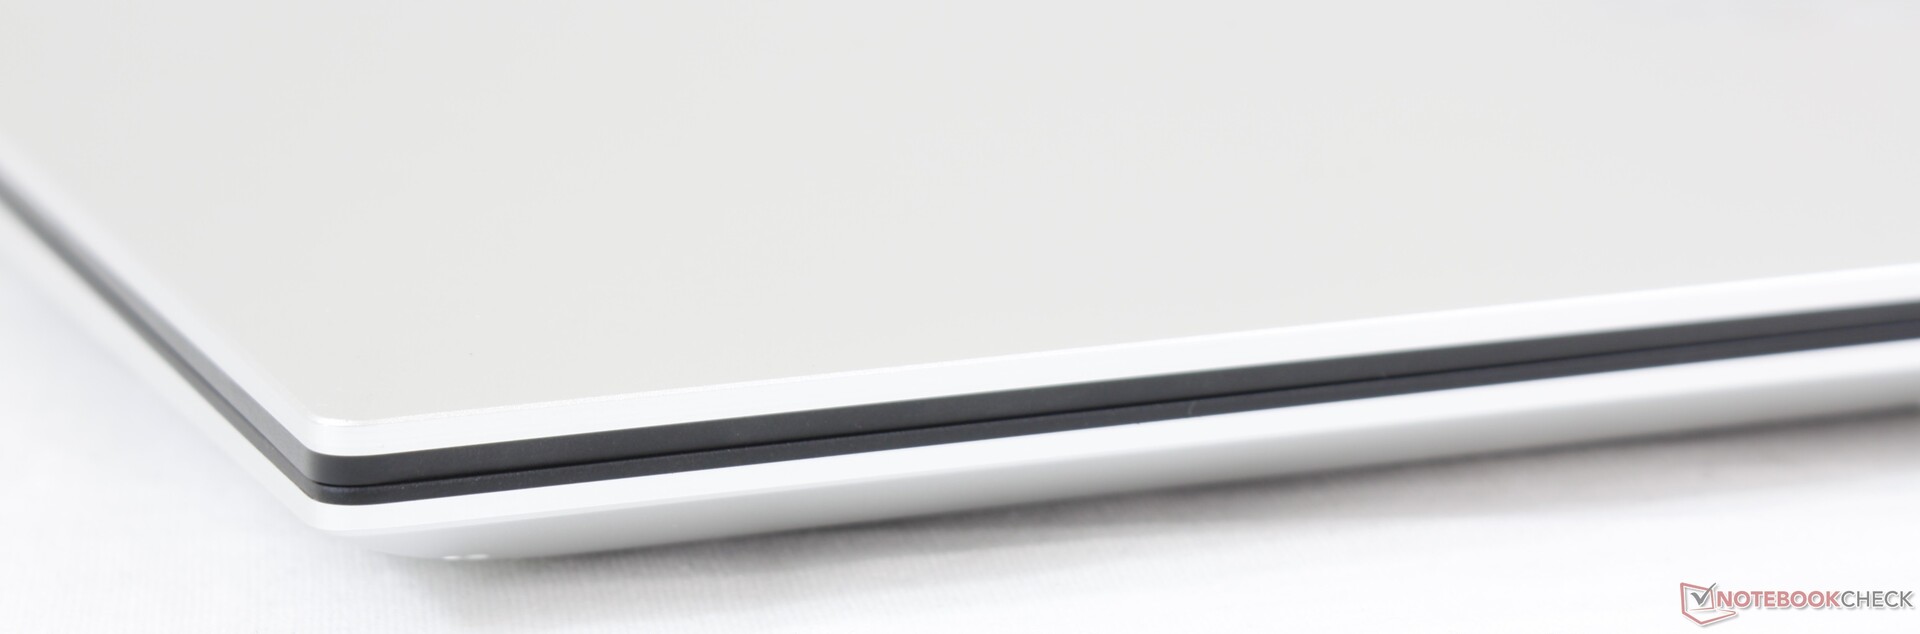
Olgu - Büyütülmüş XPS 15
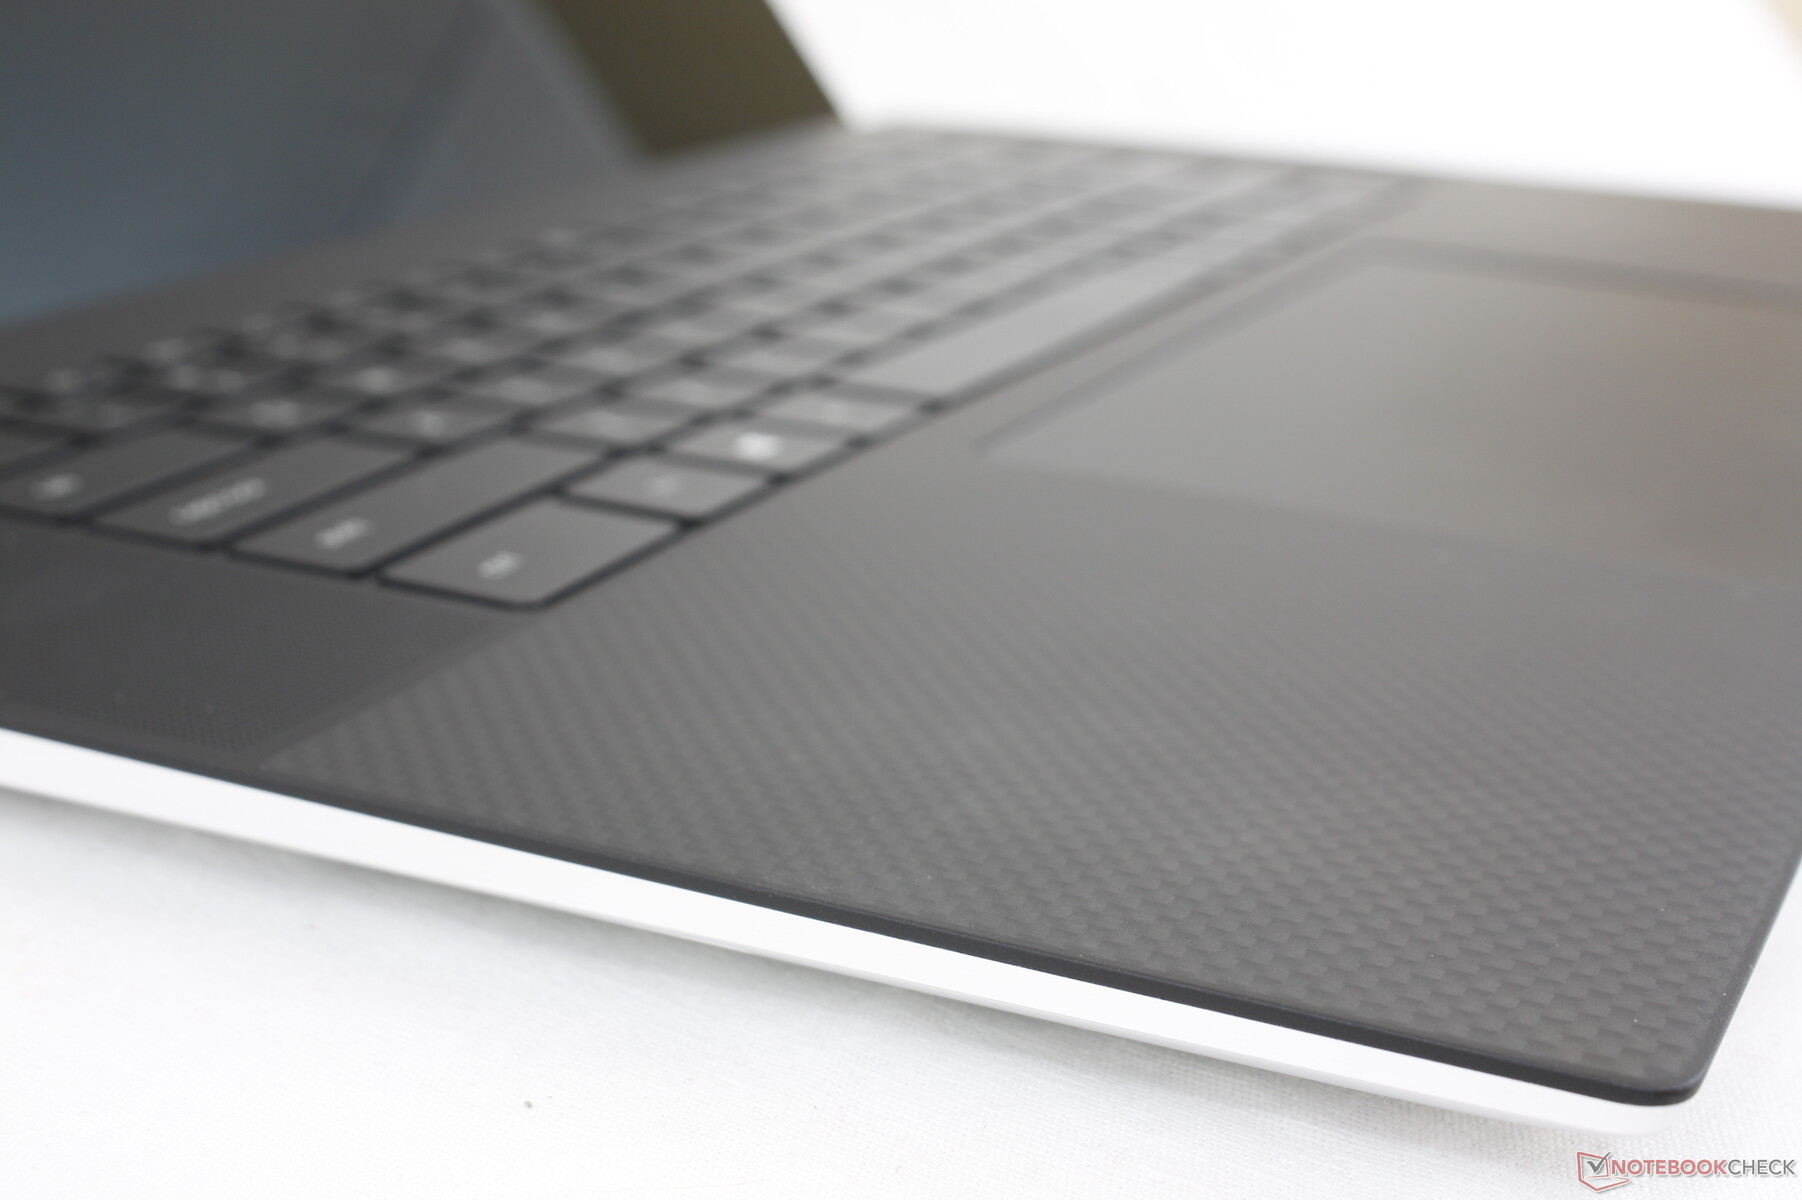
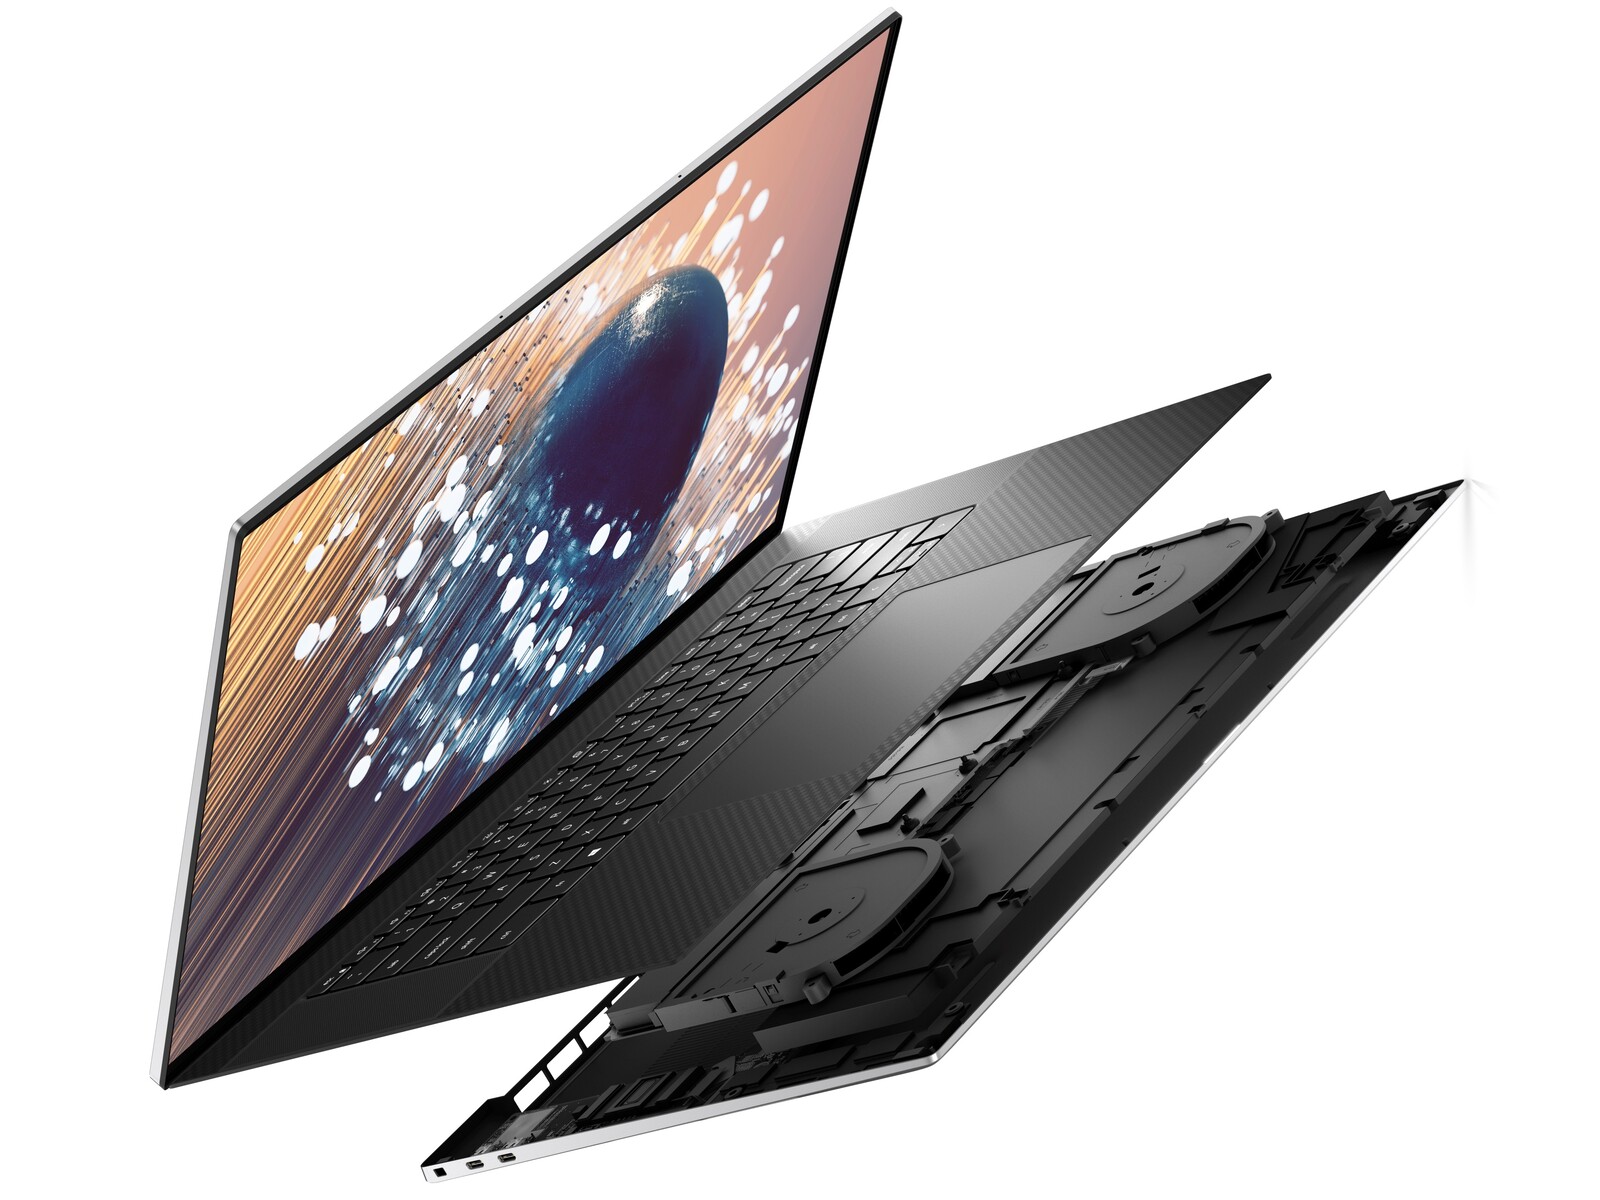
XPS 17'nin tasarım ve görsel stilinden etkilenmek kolaydır. Dell, zaten mükemmel XPS 15'in görünümünü ve hissini neredeyse 17 inç boyutuna çevirdiğinden, mevcut en iyi görünümlü 17 inç dizüstü bilgisayarlardan biridir. "Neredeyse mükemmel" demeliyiz, çünkü şasinin bazı yönleri XPS 15'te olduğundan daha zayıf hissediyor. Örneğin, menteşeler daha sert olabilirken ekran ve taban köşelerini bükerken biraz daha esniyor ve gıcırdıyor. daha iyi bir ömür duygusu vermek için. Razer Blade Pro 17 gibi daha kalın ve daha büyük 17 inç dizüstü bilgisayarlar bu açıdan avantajlı.
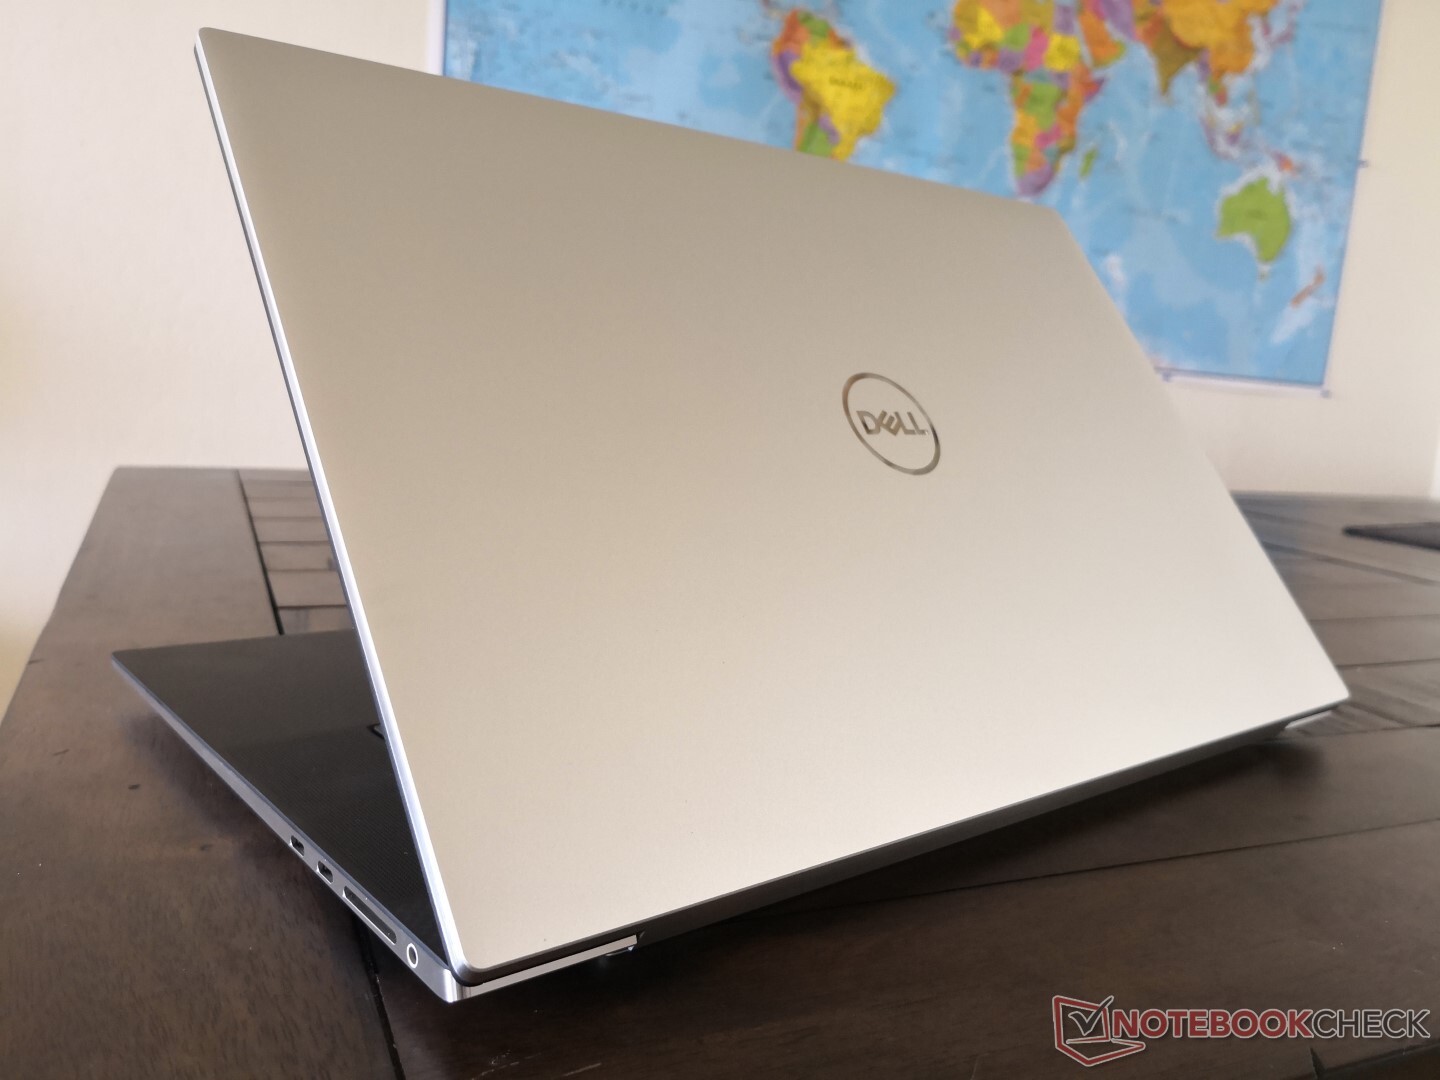
XPS 15'in herhangi bir 15.6 inçlik dizüstü bilgisayarın en küçük ayak izlerine sahip olması gibi, XPS 17 muhtemelen gördüğümüz en taşınabilir 17 inçlik dizüstü bilgisayardır. Bu kısmen, daha yaygın 17.3 inç ile karşılaştırıldığında biraz daha küçük 17 inç ekran boyutundan kaynaklanıyor, ancak daha uzun 16:10 en boy oranı bu farkı oluşturuyor.Küçük boyutlara rağmen sistem hala 2.5 kg ağırlığında. buhar odaları geleneksel bakır ısı borularına göre daha ağırdır. 17 inçlik bir dizüstü bilgisayarla sık sık seyahat etmeyi planlıyorsanız, bu veya LG Gram 17 en iyi iki seçeneğiniz olacaktır.
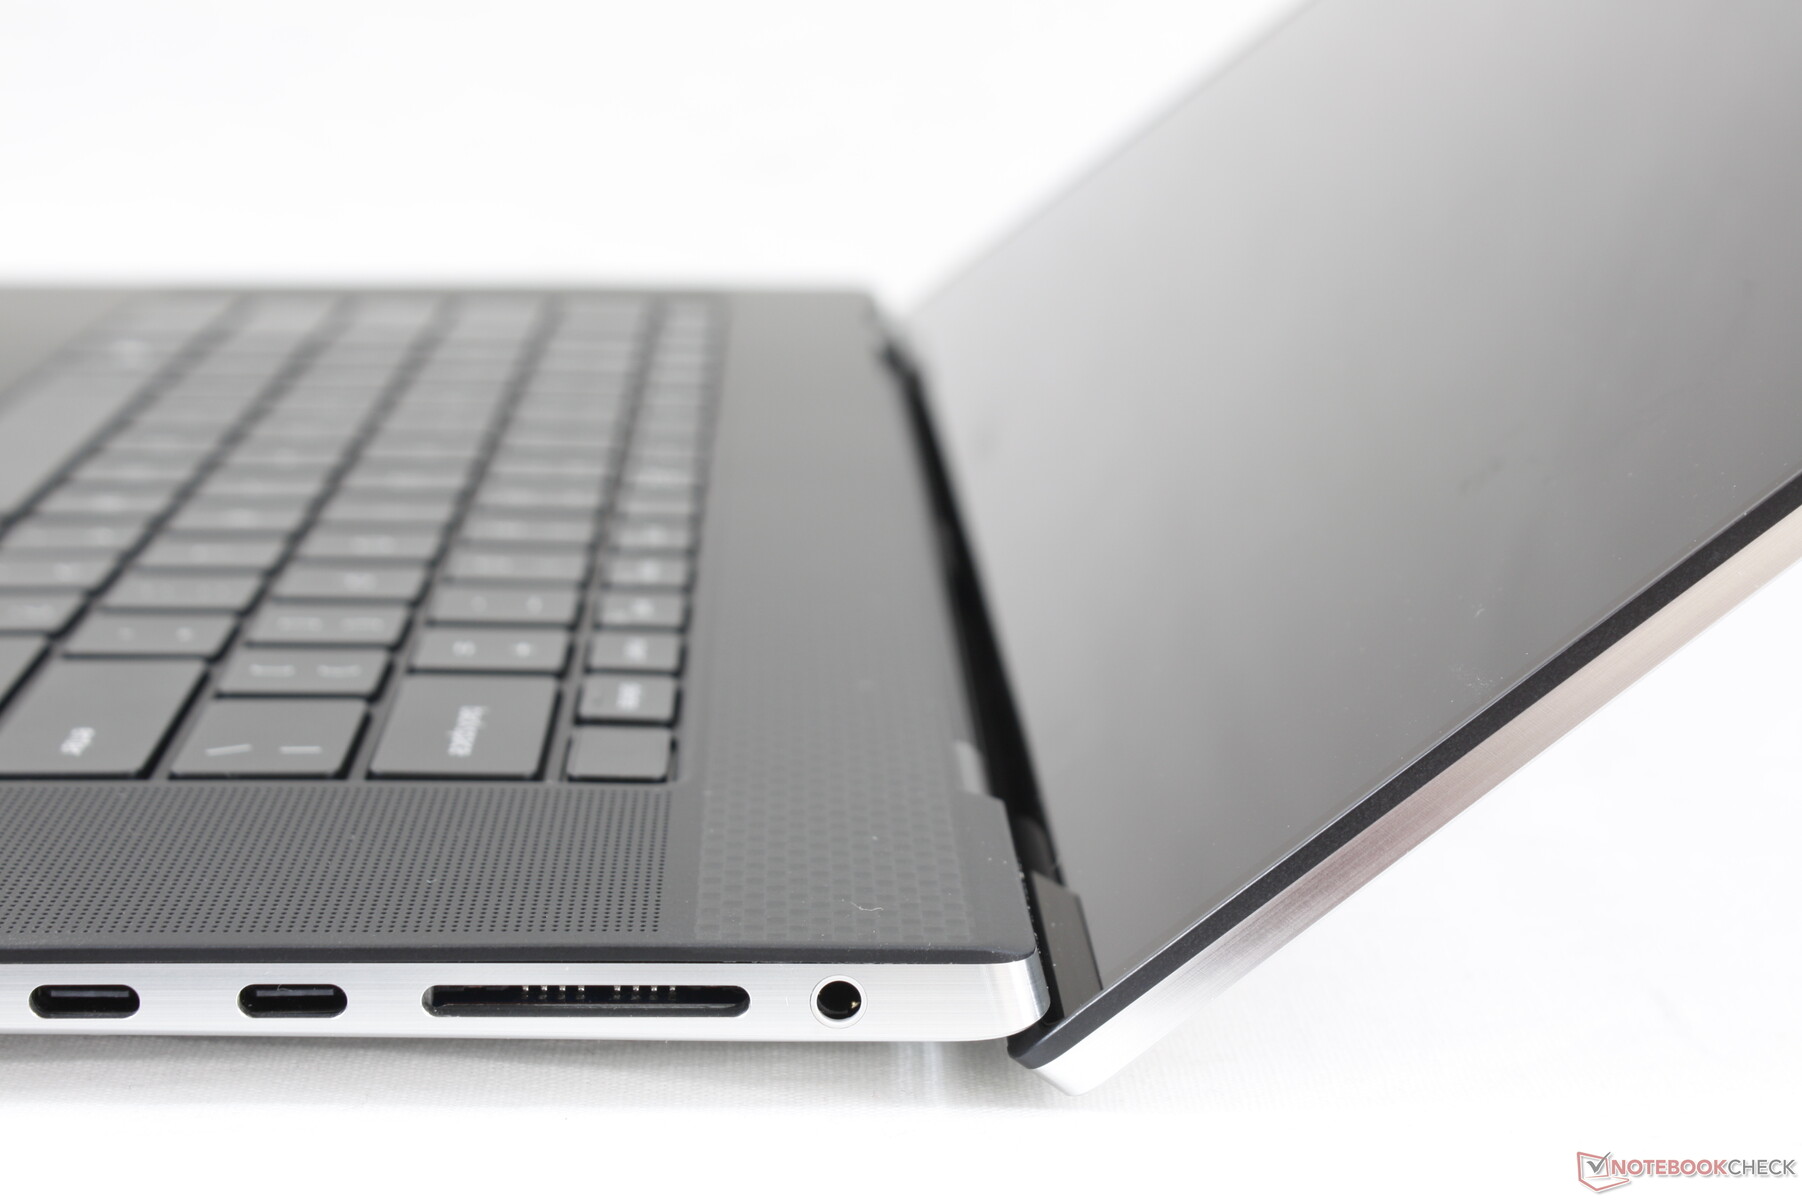

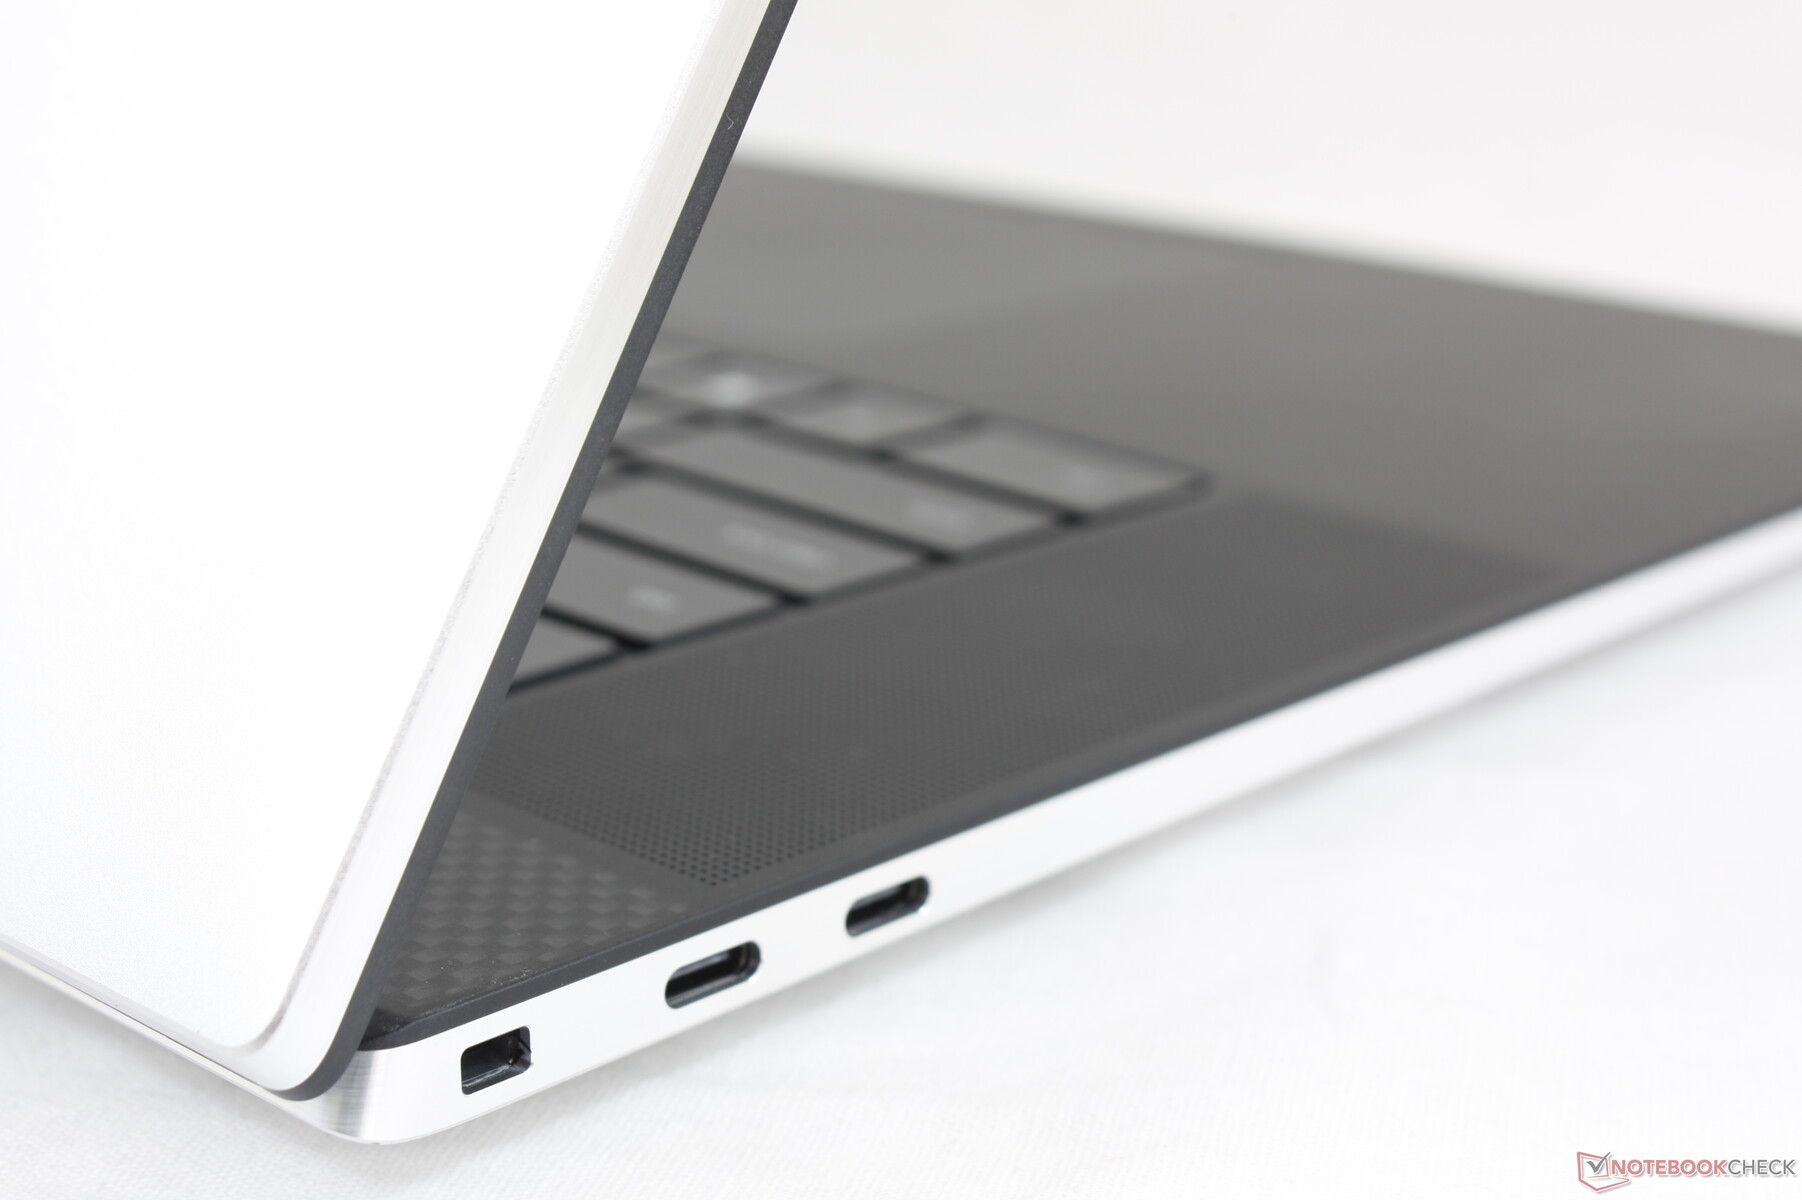

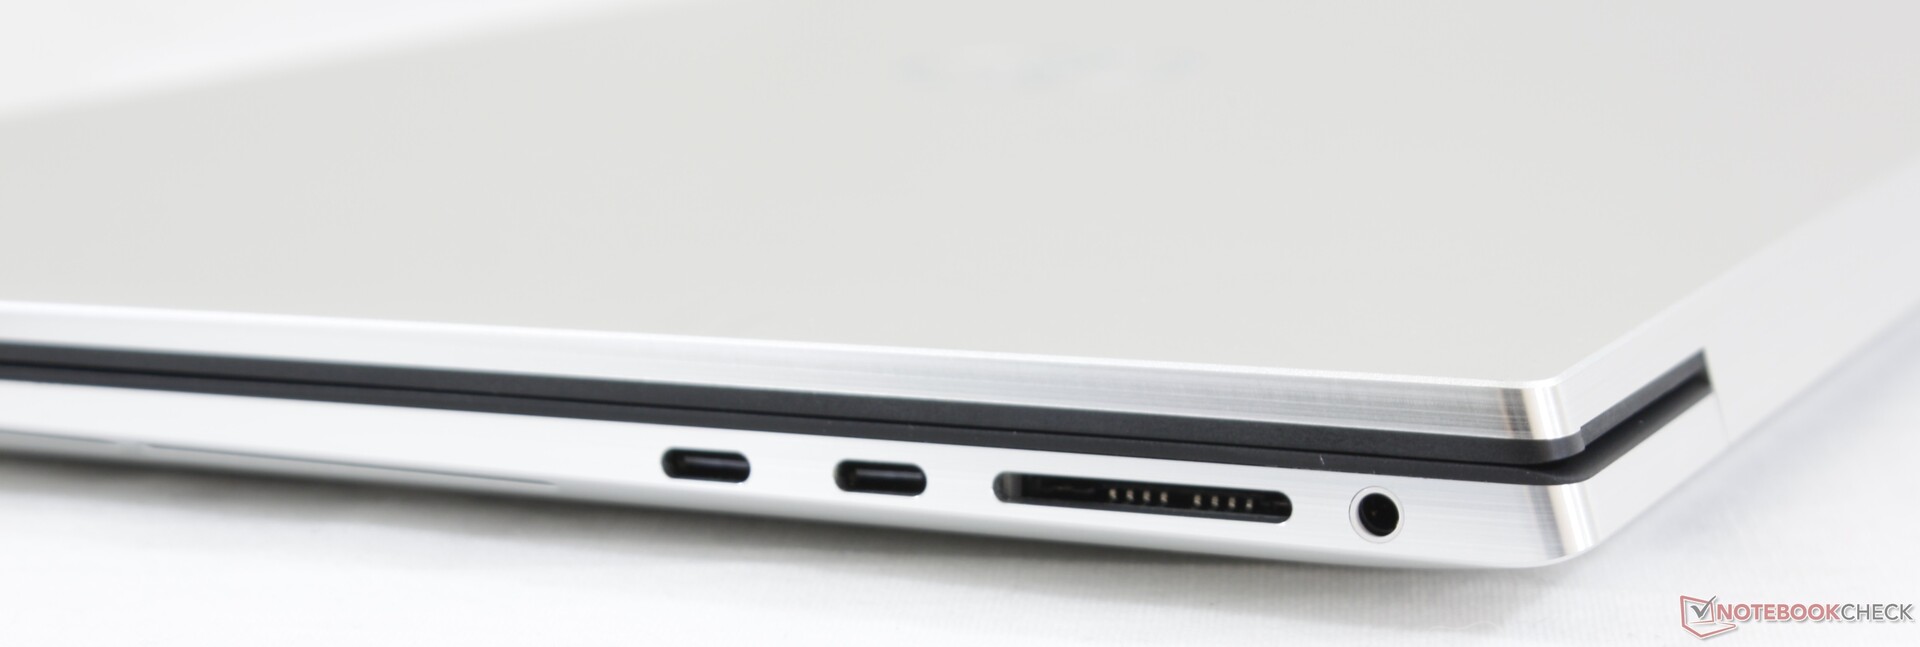
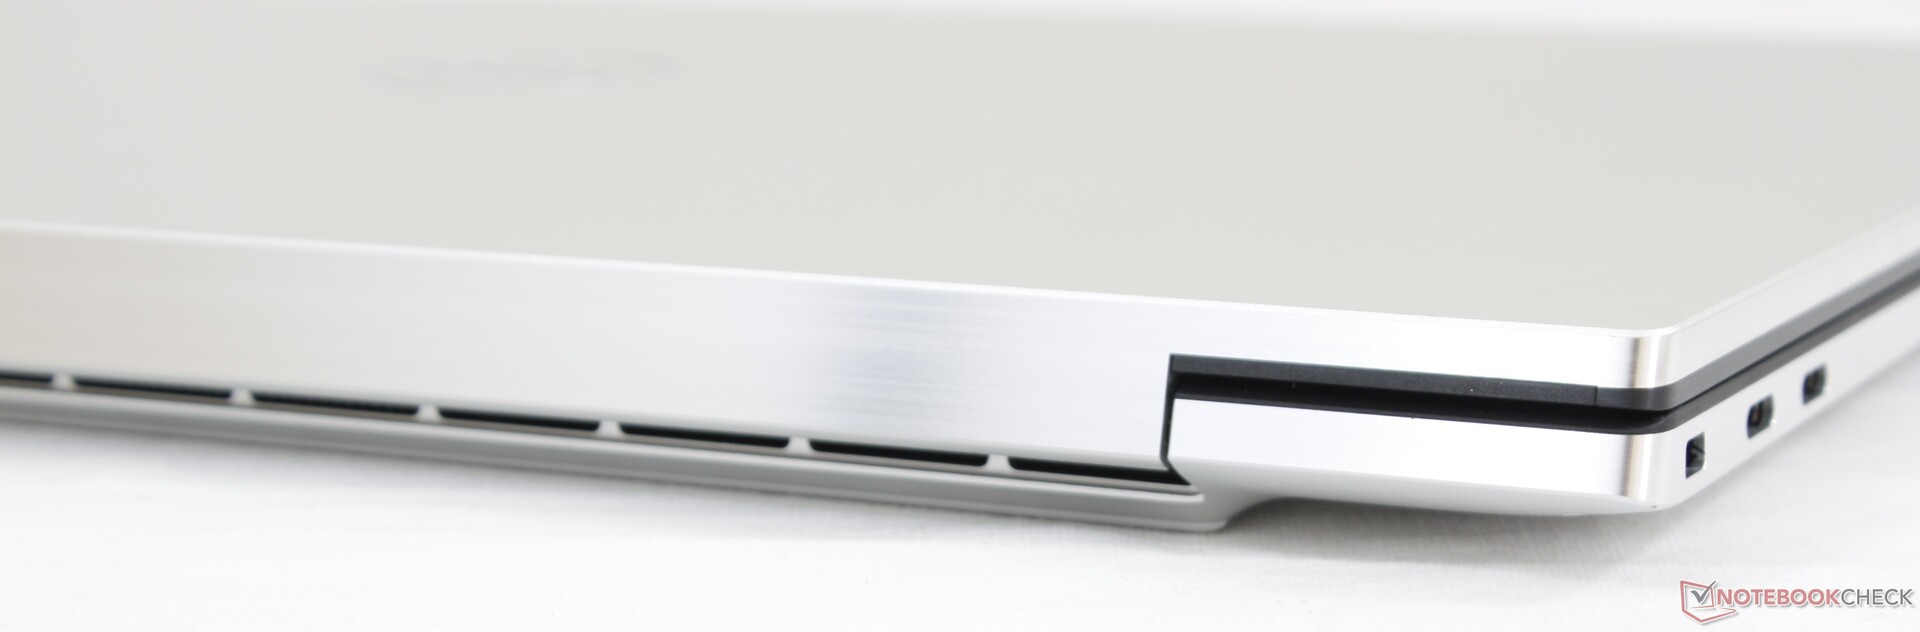
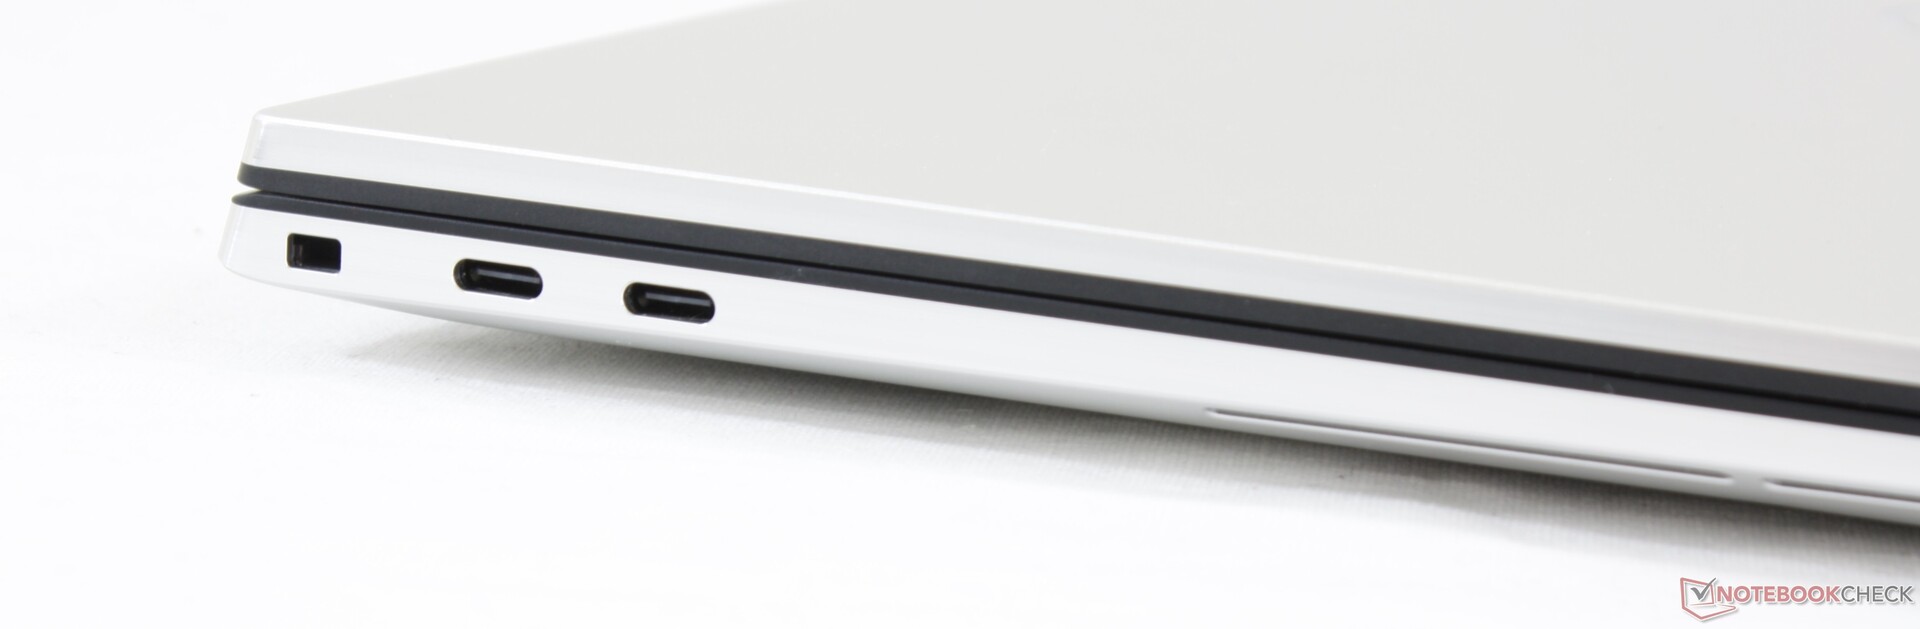
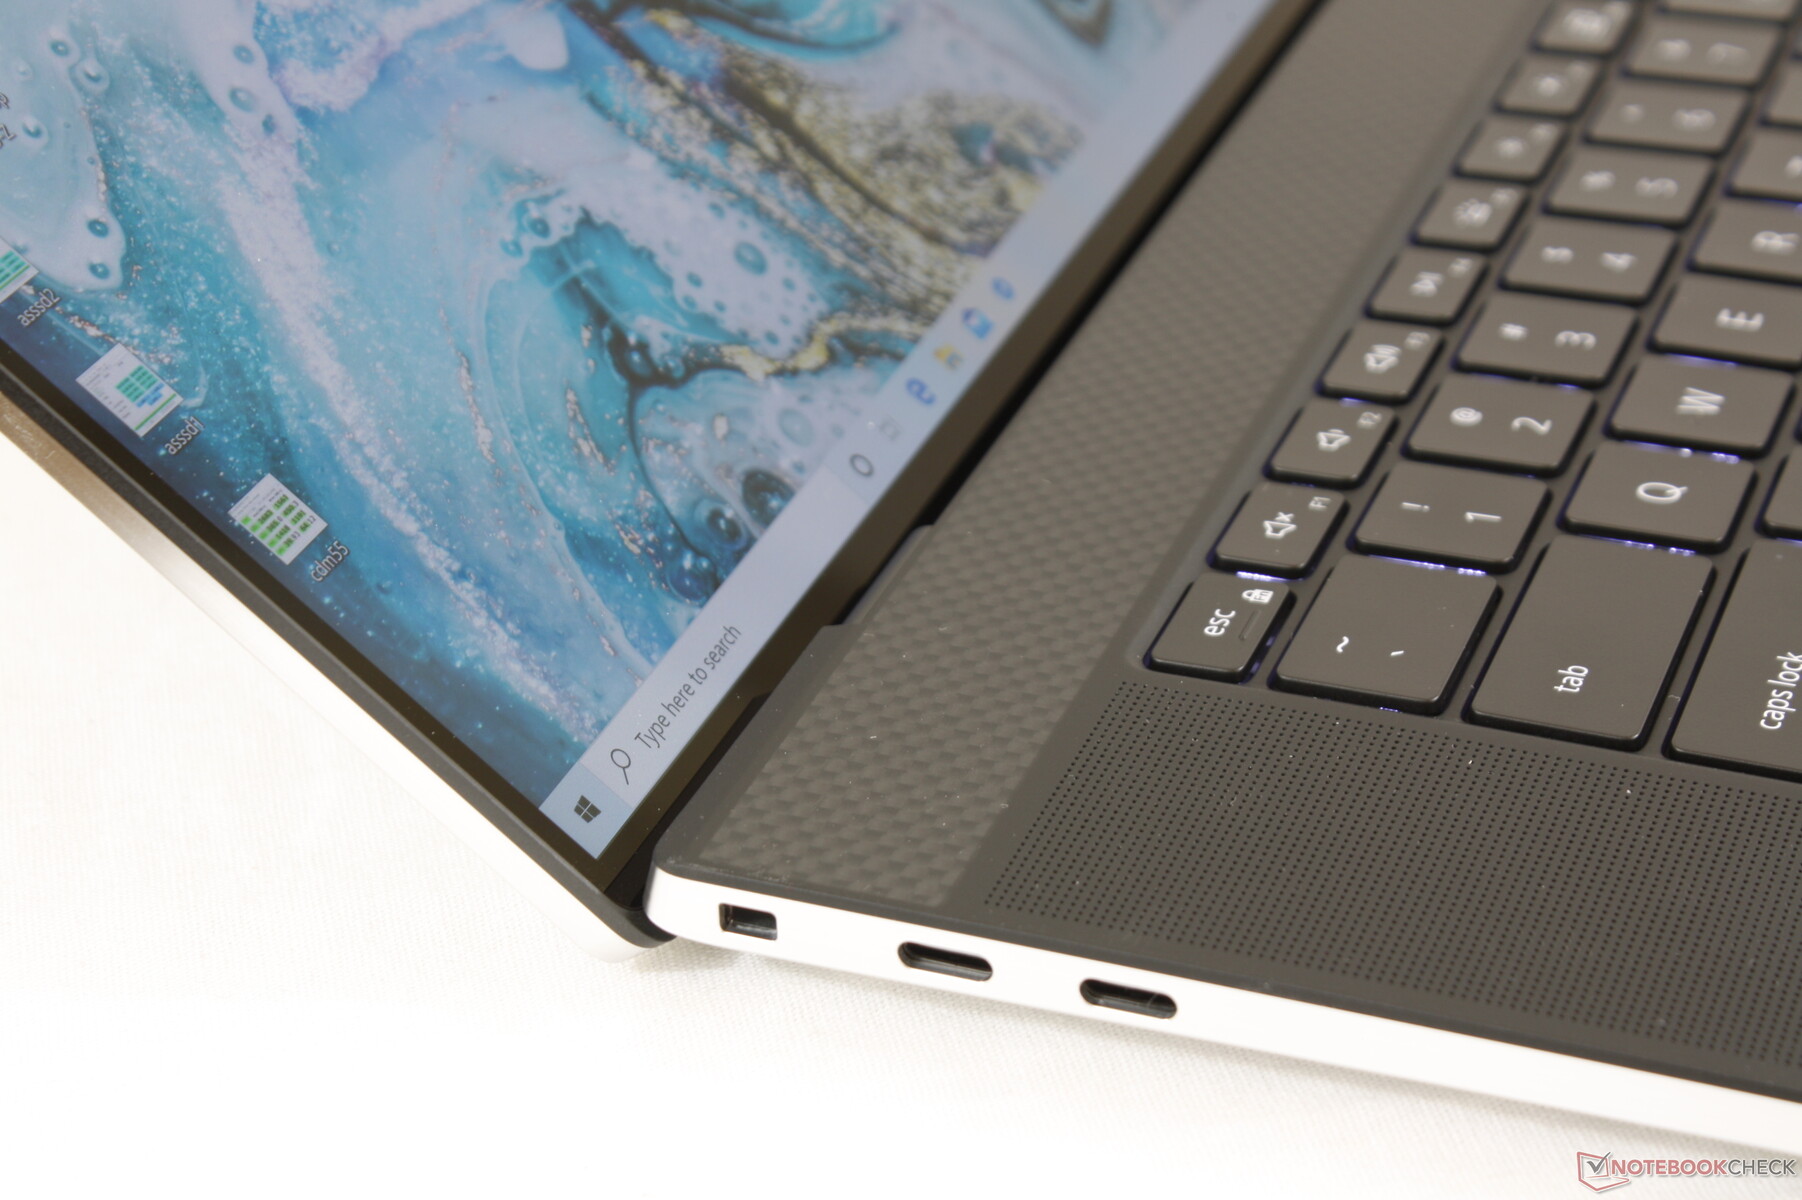
Bağlantı - MacBook Pro'yu Tee'ye Kopyalama
Birkaç ay önce HP ile bir konferans görüşmesi sırasında, bir şirket temsilcisi MacBook Pro 15 hakkında şunları söyledi: "Dört Thunderbolt 3 bağlantı noktasıyla ne yapacaksınız?" Gerçekten de emin değiliz, ama bir şey var kesin: yanınızda bir sürü adaptör taşımaya hazır olun. 17 inçlik daha büyük form faktörüne rağmen Dell'in başka herhangi bir bağlantı noktasında sıkıştıramaması biraz talihsiz bir durum. Örneğin HP Envy 17t, USB C Tipi'ne ek olarak hem HDMI hem de USB Tip A'yı entegre eder. Can sıkıcı şekilde, bağlantı noktaları kenarlar boyunca sıkıca paketlenir, böylece daha kalın adaptörler ve yerleştirme istasyonları bitişik bağlantı noktalarına erişimi engelleyebilir.
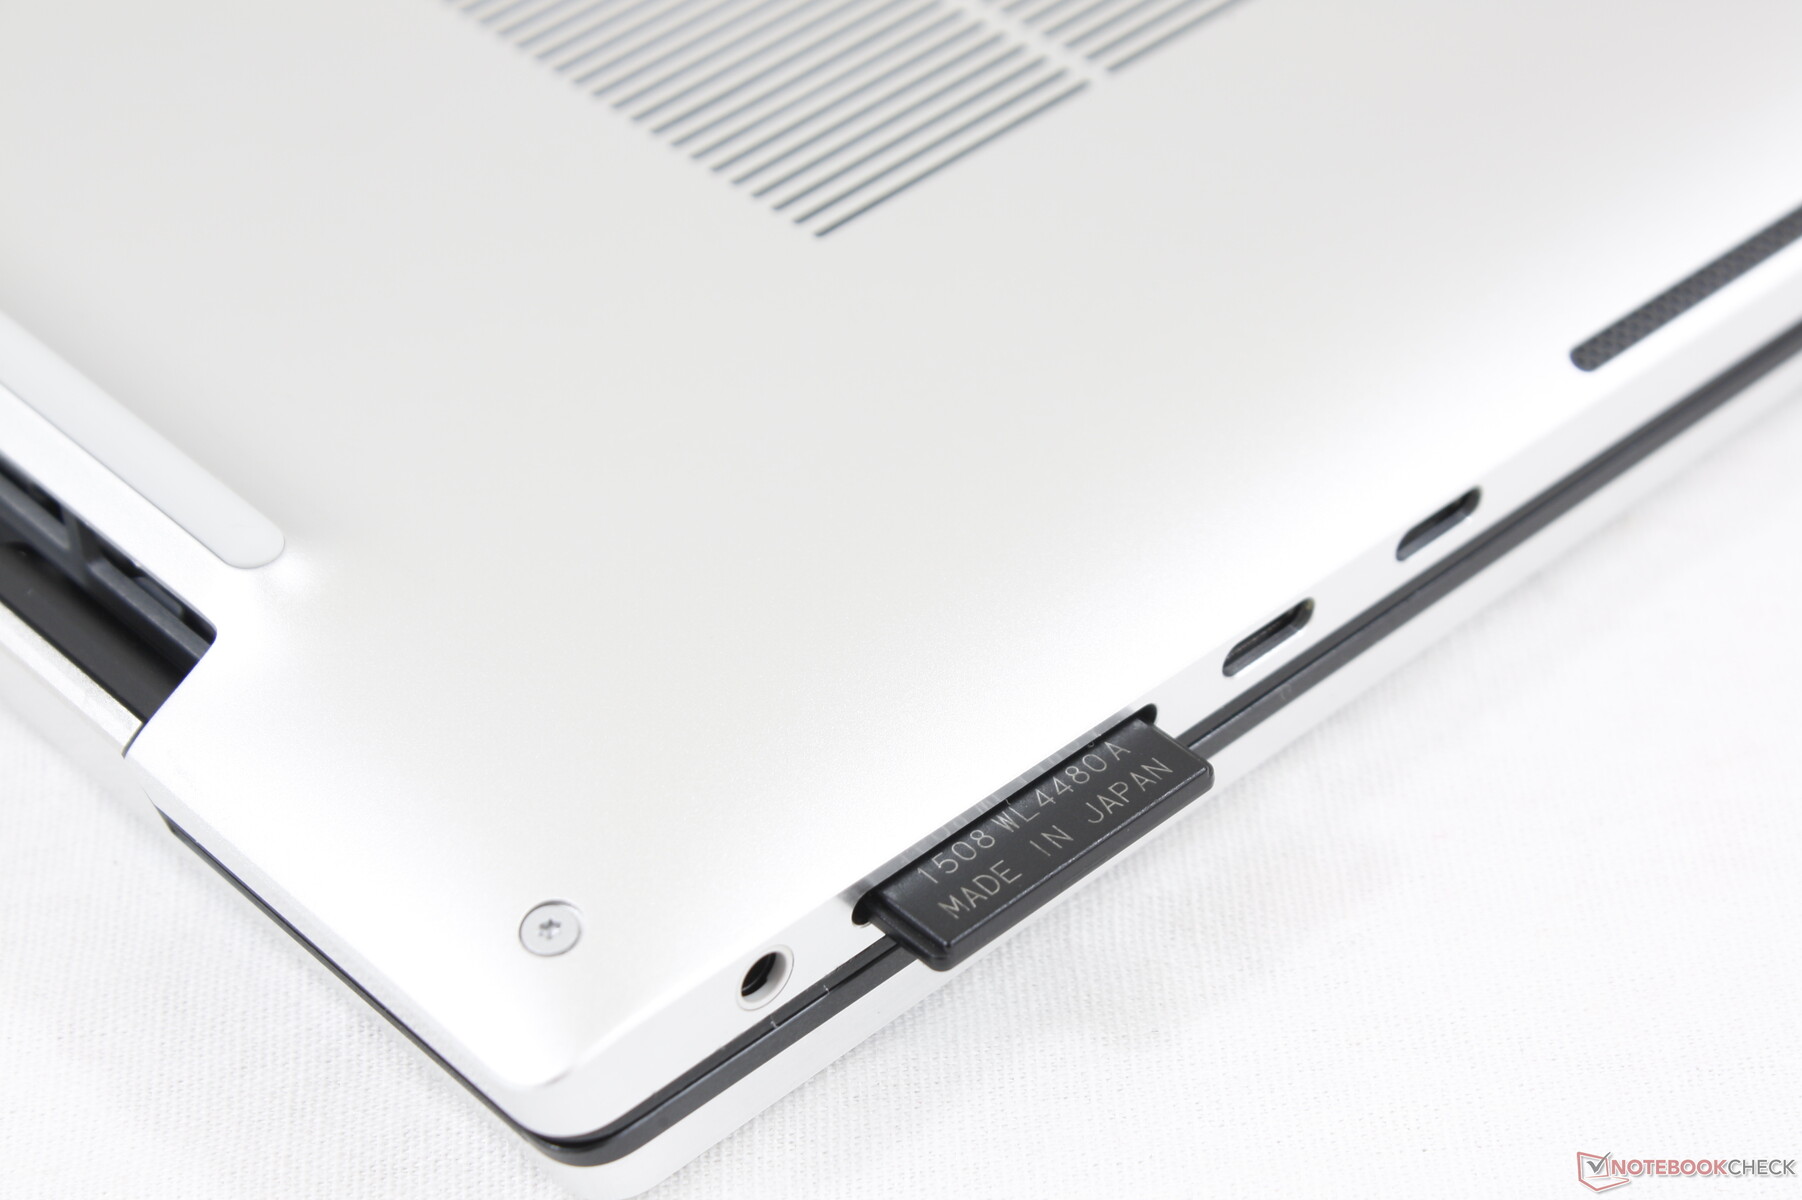
SD Kart Okuyucu
Entegre SD kart okuyucu, XPS 15'teki gibi çok hızlı aktarım hızları döndürür. 1 GB'lık resimleri UHS-II test kartımızdan masaüstüne taşımak sadece 5 ila 6 saniye sürer. Kart okuyucunun yaylı olmadığını unutmayın.
| SD Card Reader | |
| average JPG Copy Test (av. of 3 runs) | |
| Razer Blade Pro 17 RTX 2070 Max-Q 300 Hz (Toshiba Exceria Pro SDXC 64 GB UHS-II) | |
| Gigabyte Aero 17 HDR XB (Toshiba Exceria Pro SDXC 64 GB UHS-II) | |
| Dell XPS 17 9700 Core i7 RTX 2060 Max-Q (Toshiba Exceria Pro SDXC 64 GB UHS-II) | |
| HP Envy 17t-cg000 (Toshiba Exceria Pro SDXC 64 GB UHS-II) | |
| maximum AS SSD Seq Read Test (1GB) | |
| Gigabyte Aero 17 HDR XB (Toshiba Exceria Pro SDXC 64 GB UHS-II) | |
| Razer Blade Pro 17 RTX 2070 Max-Q 300 Hz (Toshiba Exceria Pro SDXC 64 GB UHS-II) | |
| Dell XPS 17 9700 Core i7 RTX 2060 Max-Q (Toshiba Exceria Pro SDXC 64 GB UHS-II) | |
| HP Envy 17t-cg000 (Toshiba Exceria Pro SDXC 64 GB UHS-II) | |
İletişim
Wi-Fi 6 özellikli Killer 1650, tüm SKU'larda standart olarak gelir. Bunun yerine Intel AX200 / 201'i tercih ederdik çünkü Killer Wi-Fi tipik olarak oyuncuları hedefliyor ve XPS 17 bir oyun makinesi olarak pazarlanmıyor. Bununla birlikte, Netgear RAX200 test yönlendiricimize bağlandığında herhangi bir sorunla karşılaşmadık.
Web kamerası


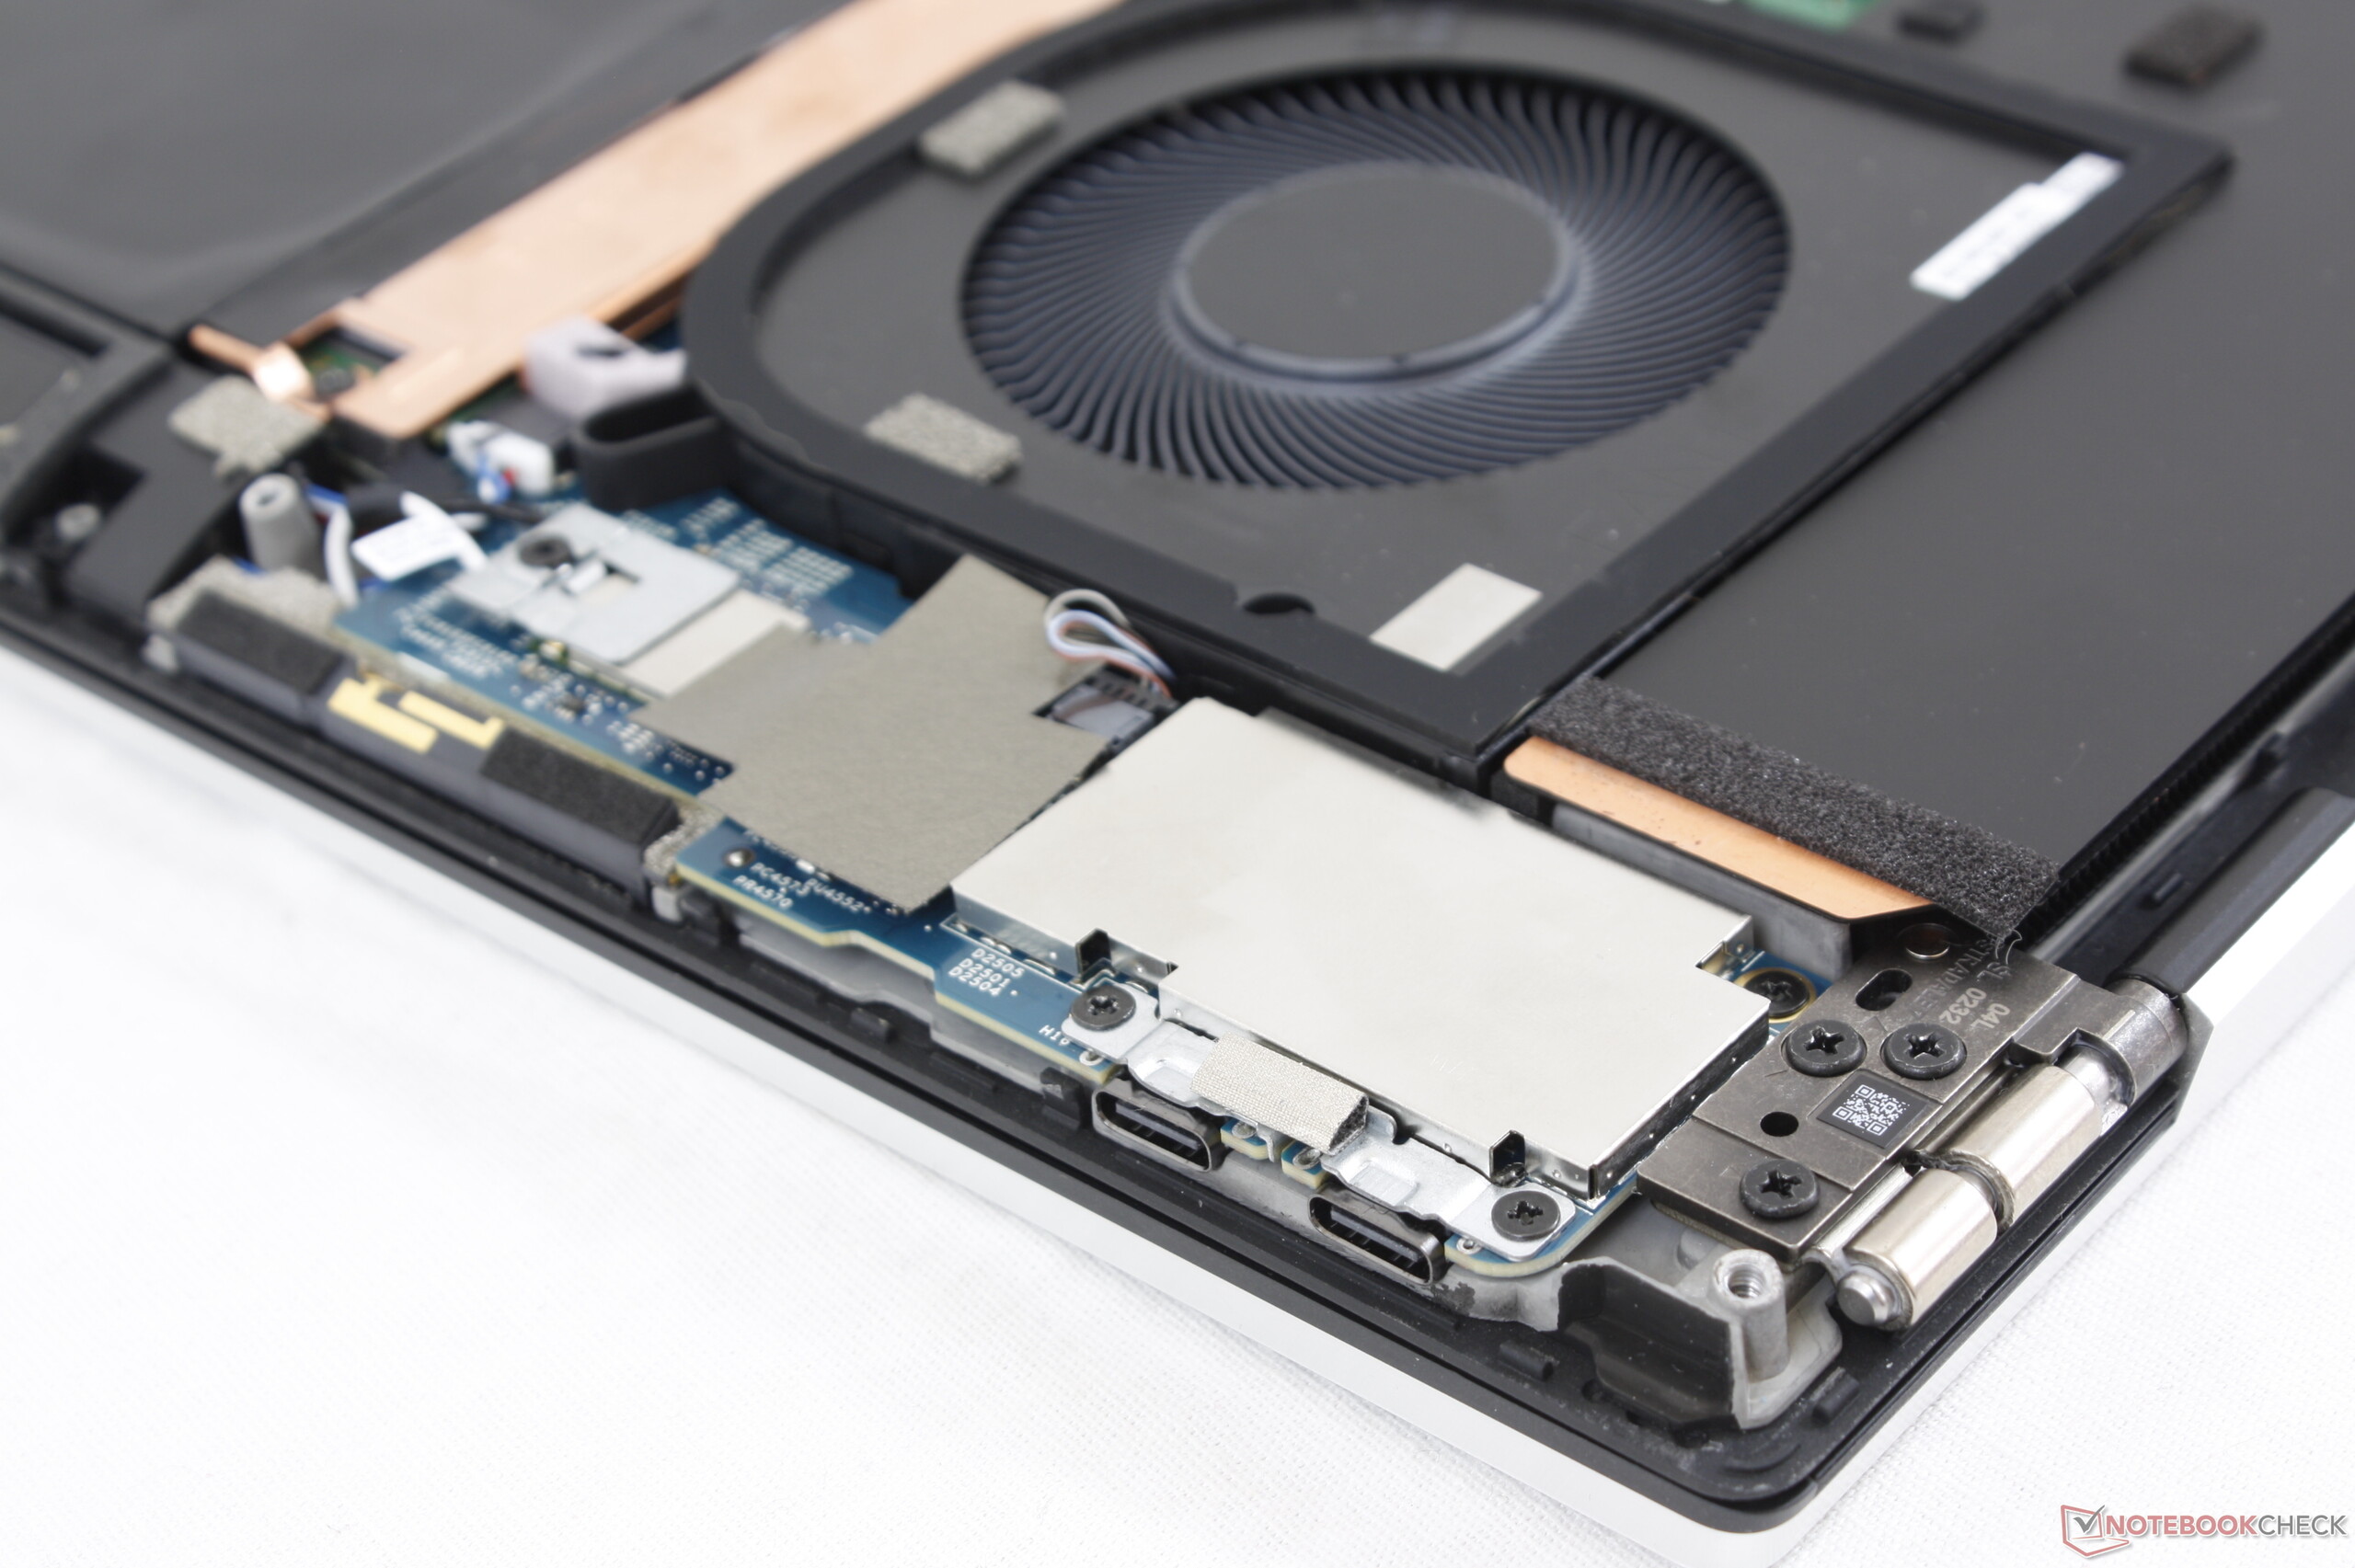
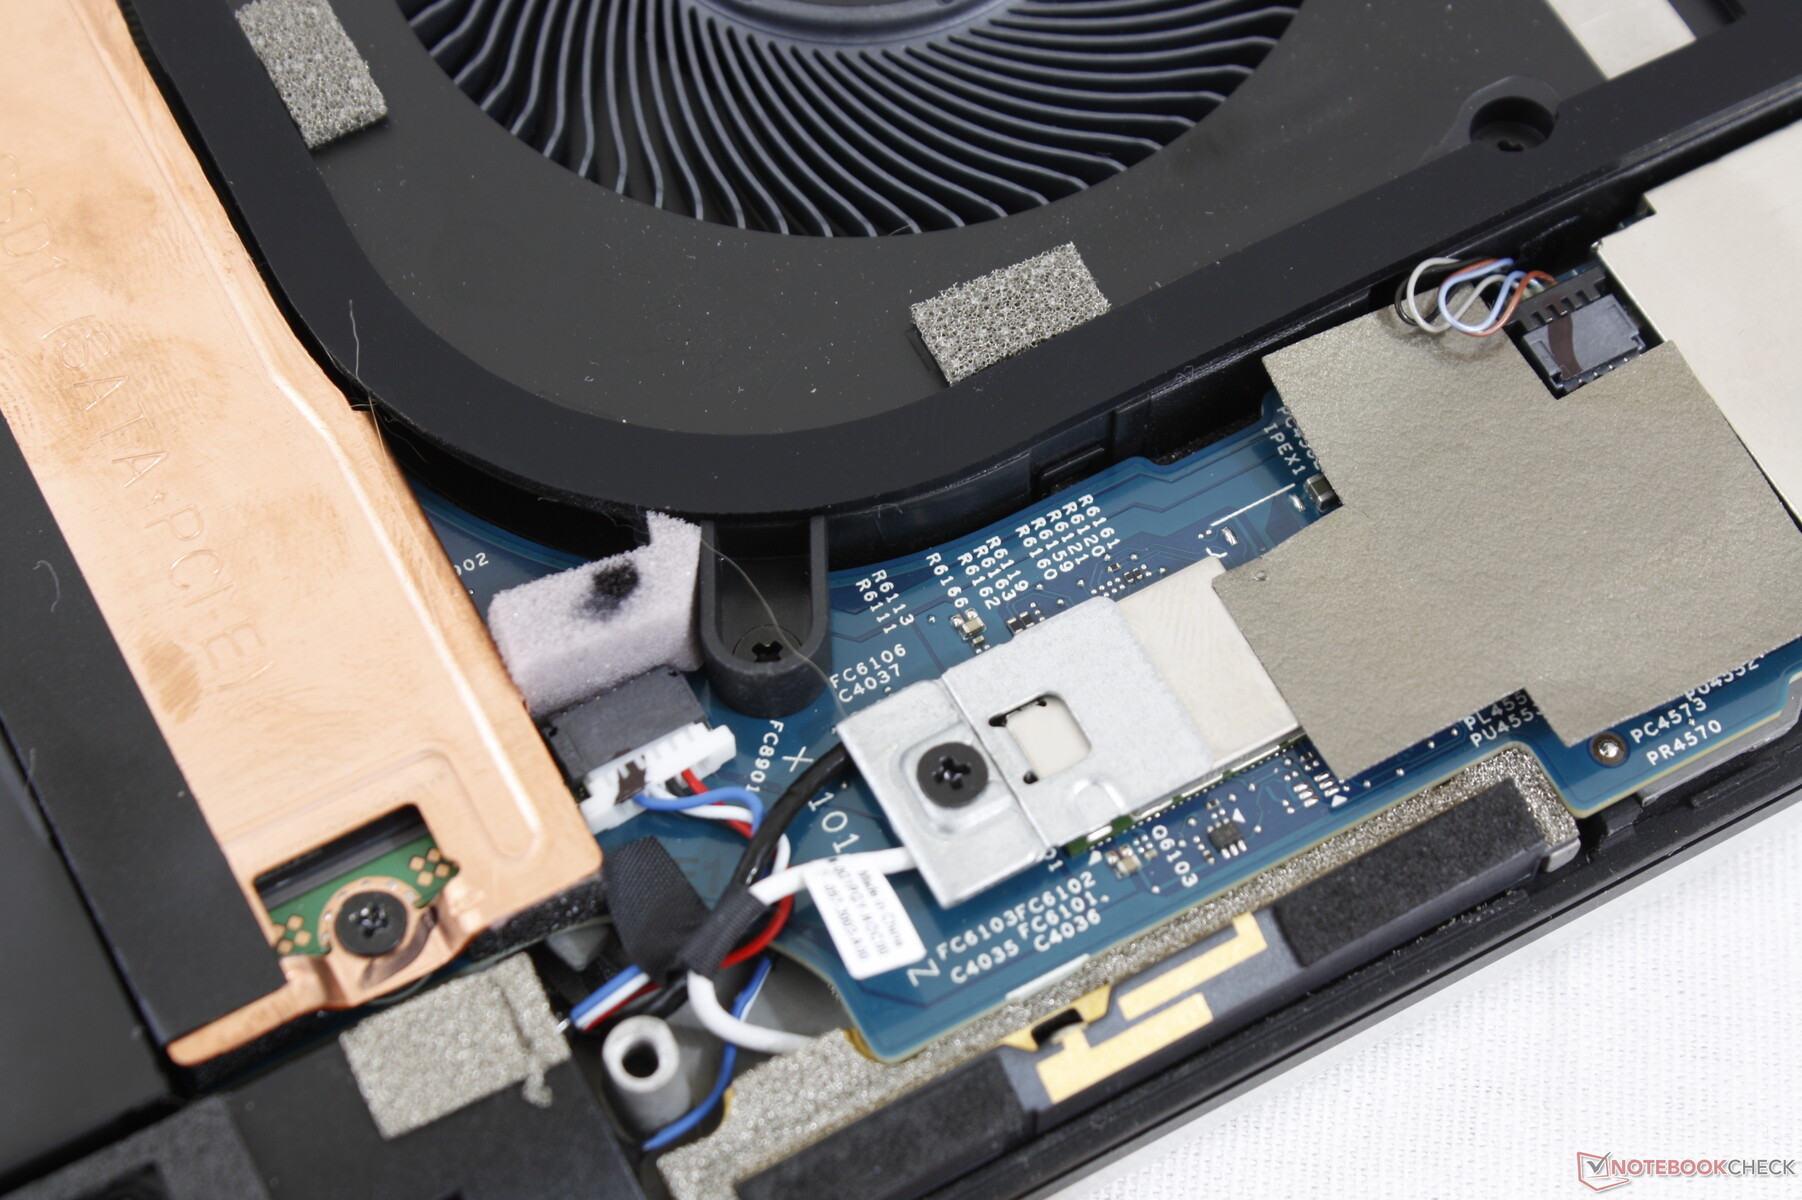
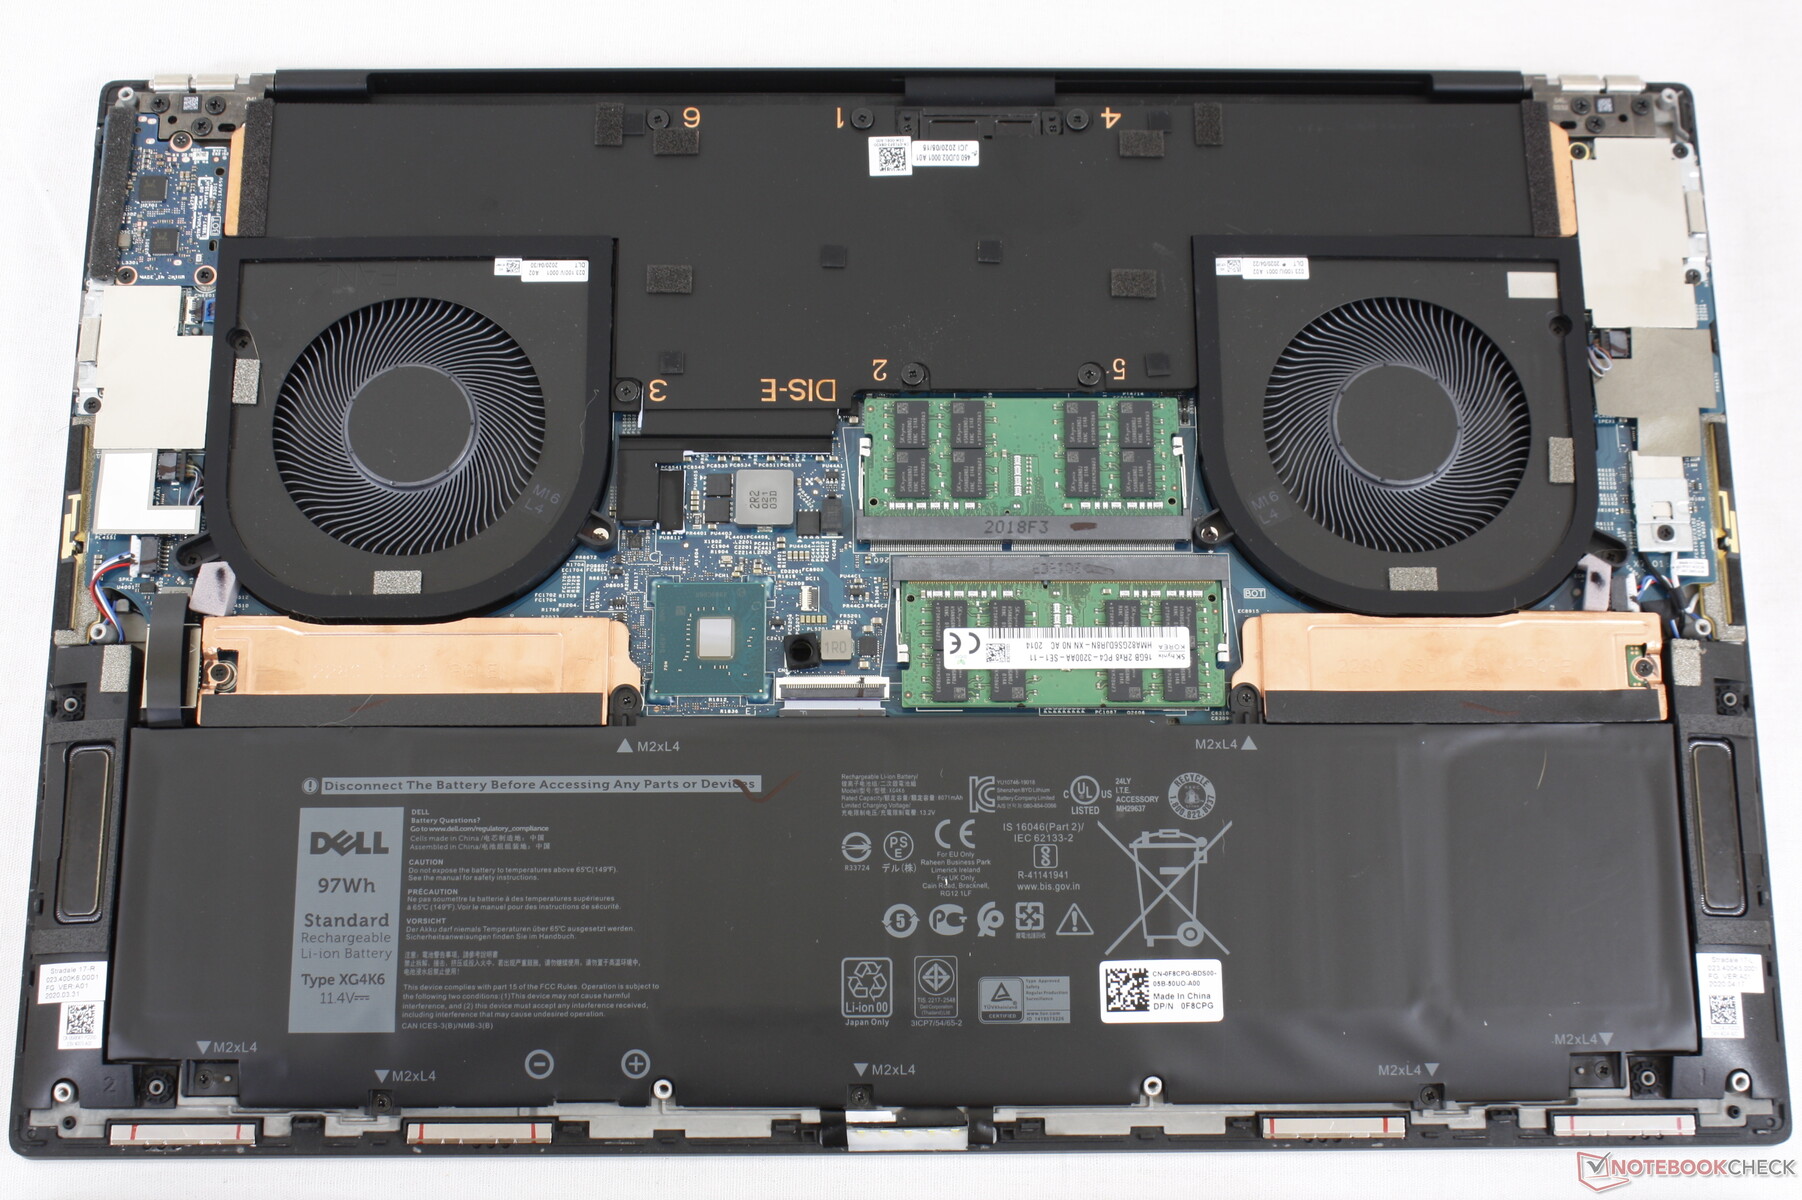
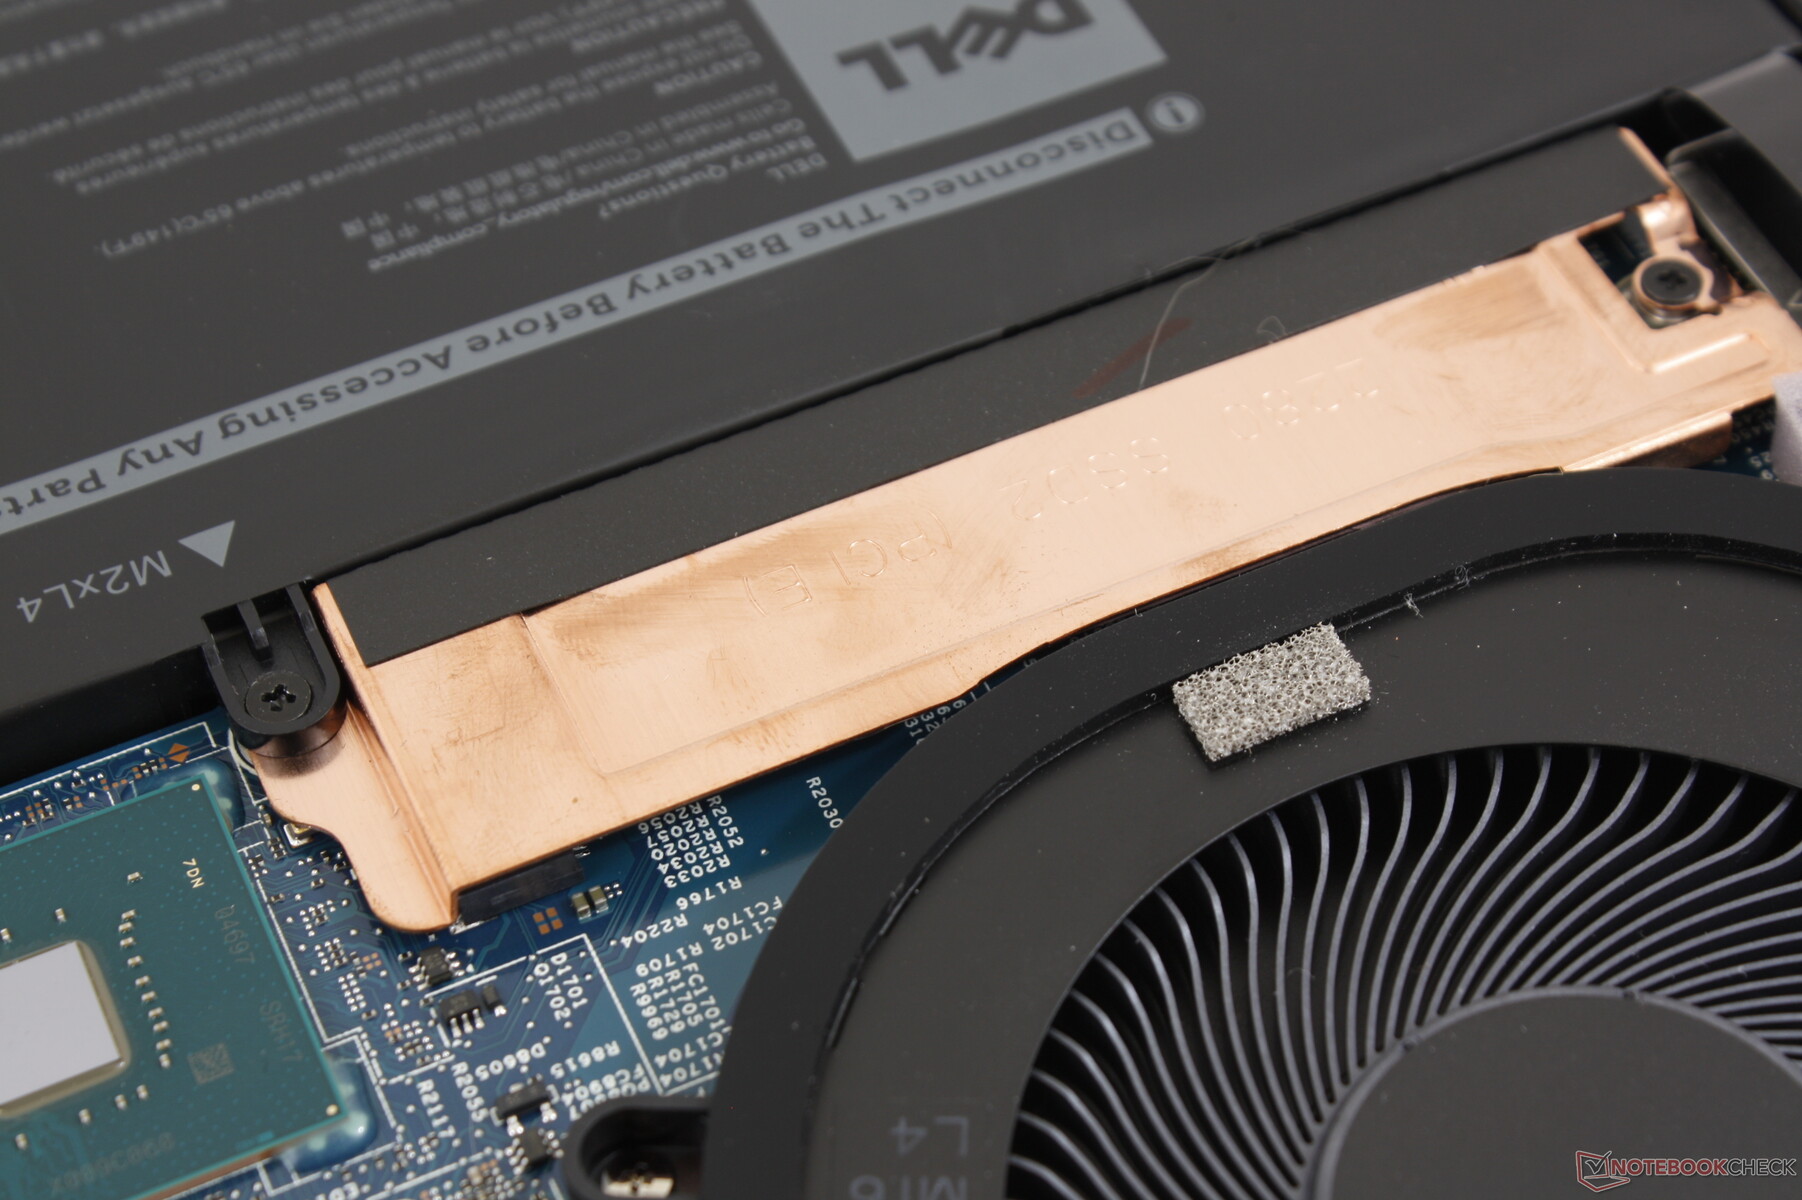
Bakım
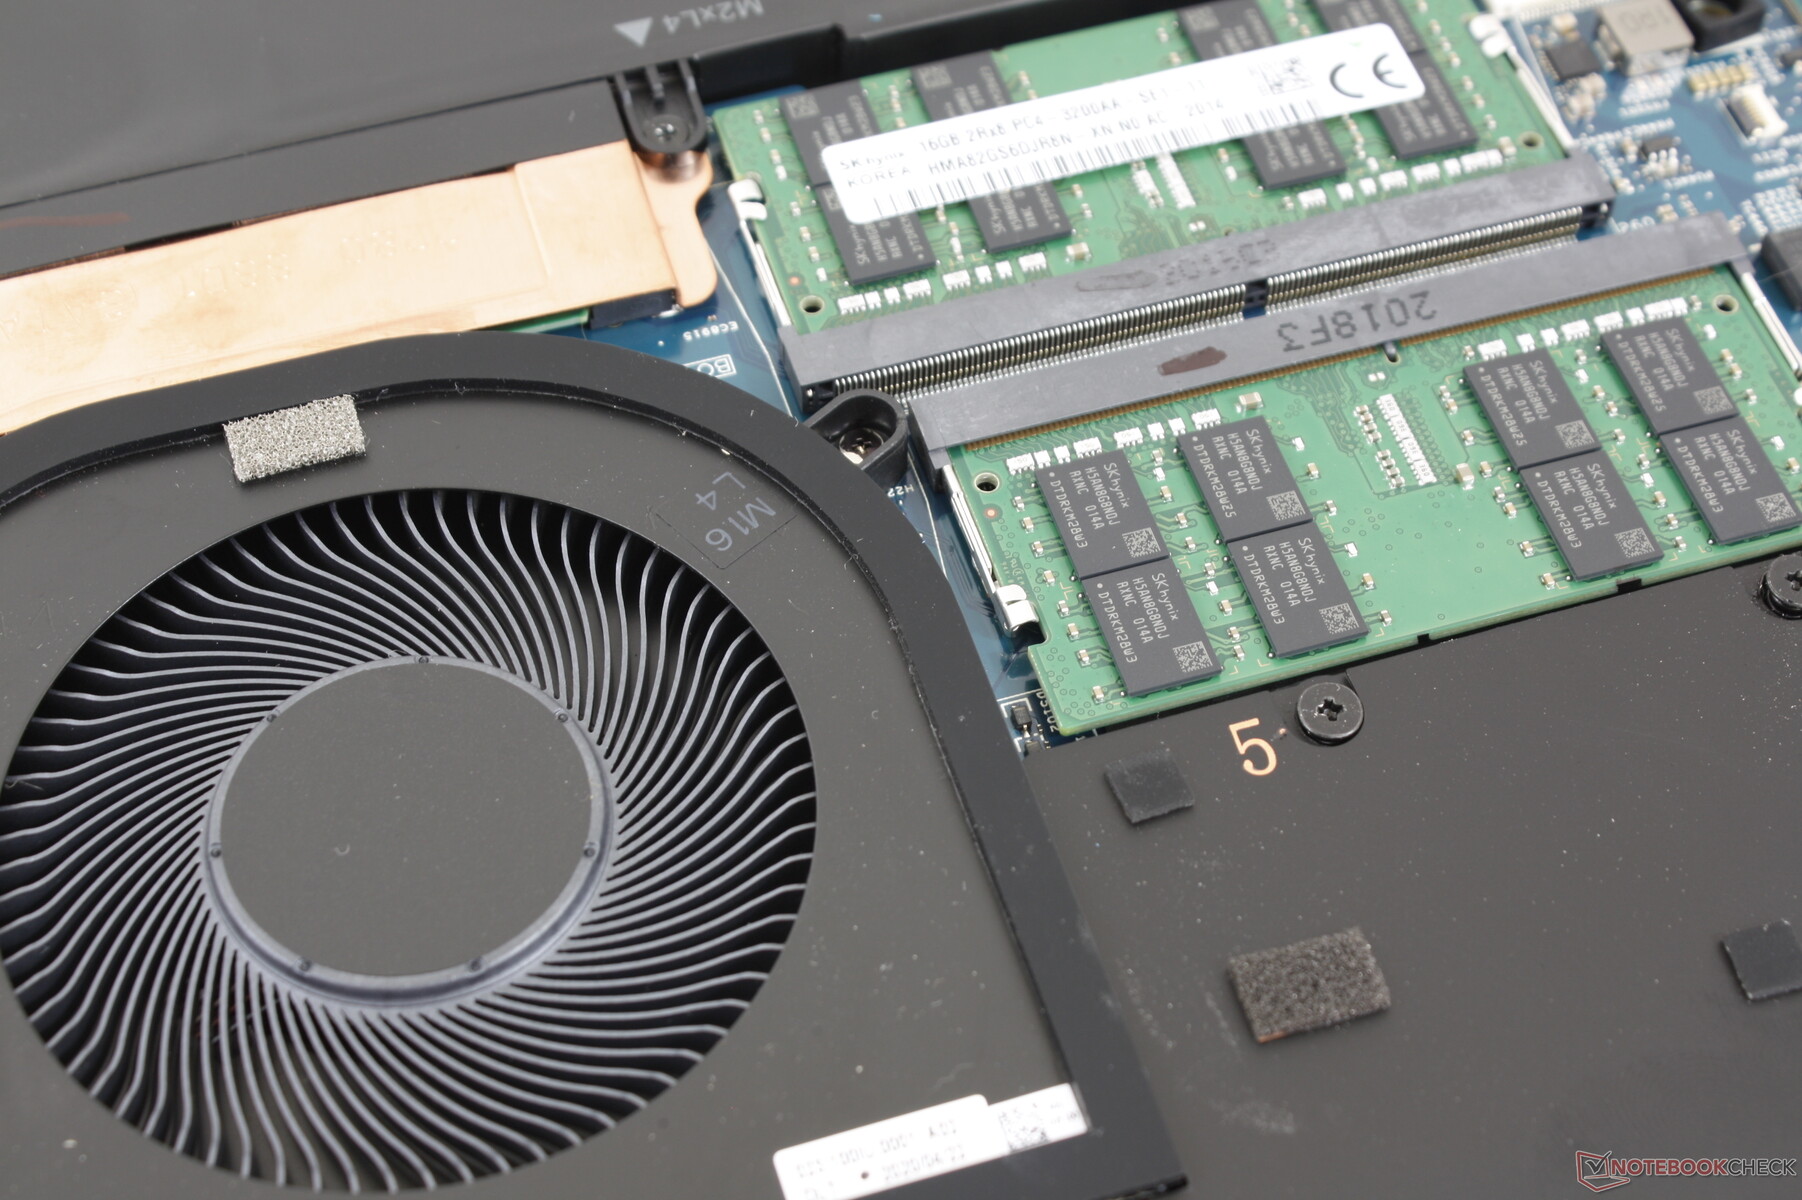
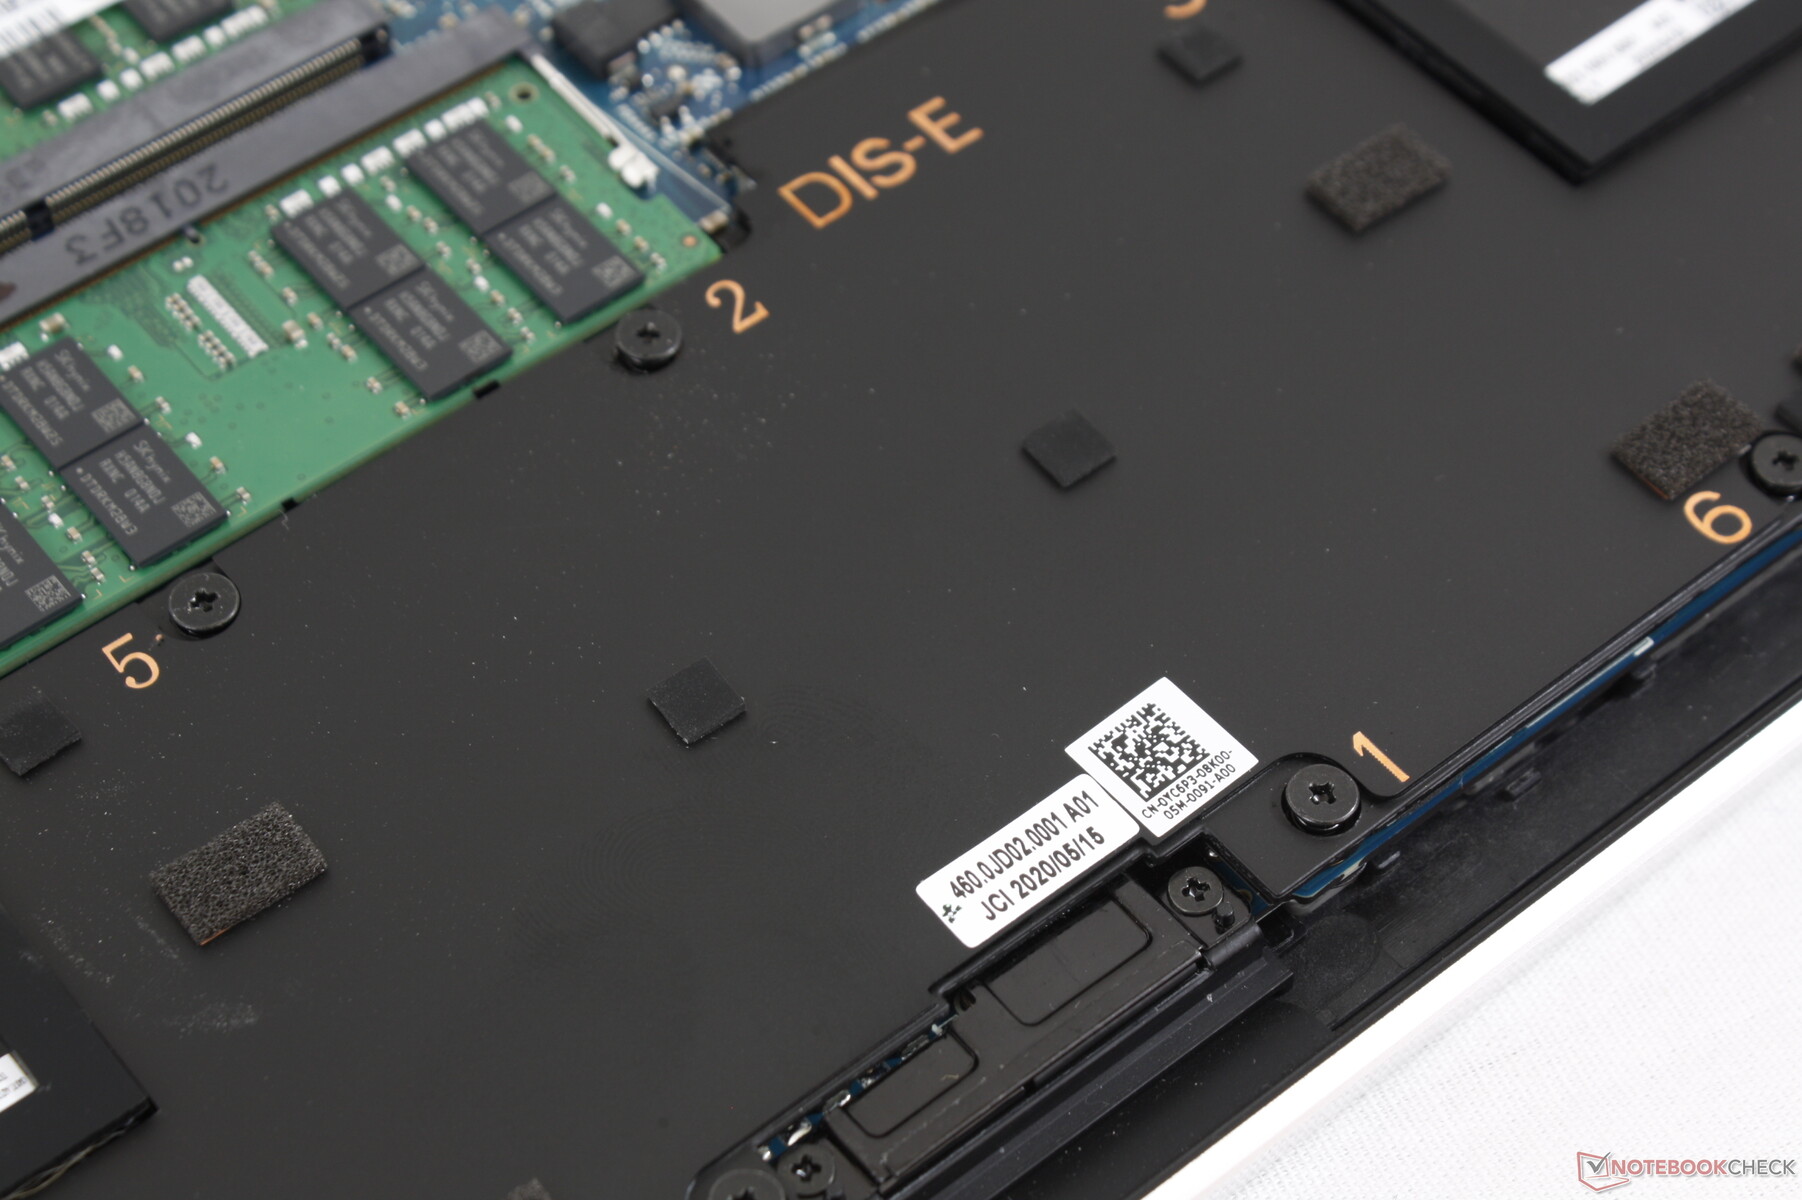
Alt panel sekiz T5 Torx vida ile sabitlenmiştir ve kenarları ve köşeleri daha sıkı ve keskin olduğu için açılması genellikle XPS 15 7590'dan daha zordur. Parmak kesmelerini önlemek için eski bir kredi kartı gibi plastik bir kenar önerilir. Depolama için iki M.2 2280 yuvasının yanında iki DDR4 SODIMM RAM yuvası bulunur.
Aksesuarlar ve Garanti
Perakende kutu, MacBook Pro 15 için söyleyebileceğimizden daha fazla olan USB-A ve HDMI 2.0 bağlantısı için kullanışlı bir adaptör içerir. Diğer USB-C veya Thunderbolt 3 bağlantı istasyonları ve monitörleri sistem için doğal bir uyum sağlayacaktır. Doğrudan Dell'den sipariş edilirse, standart bir yıllık sınırlı garanti birçok eklenti seçeneği için geçerlidir.
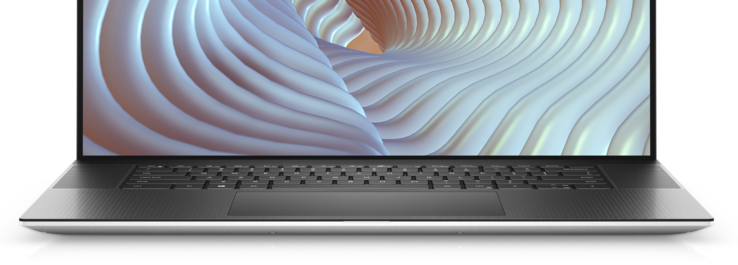
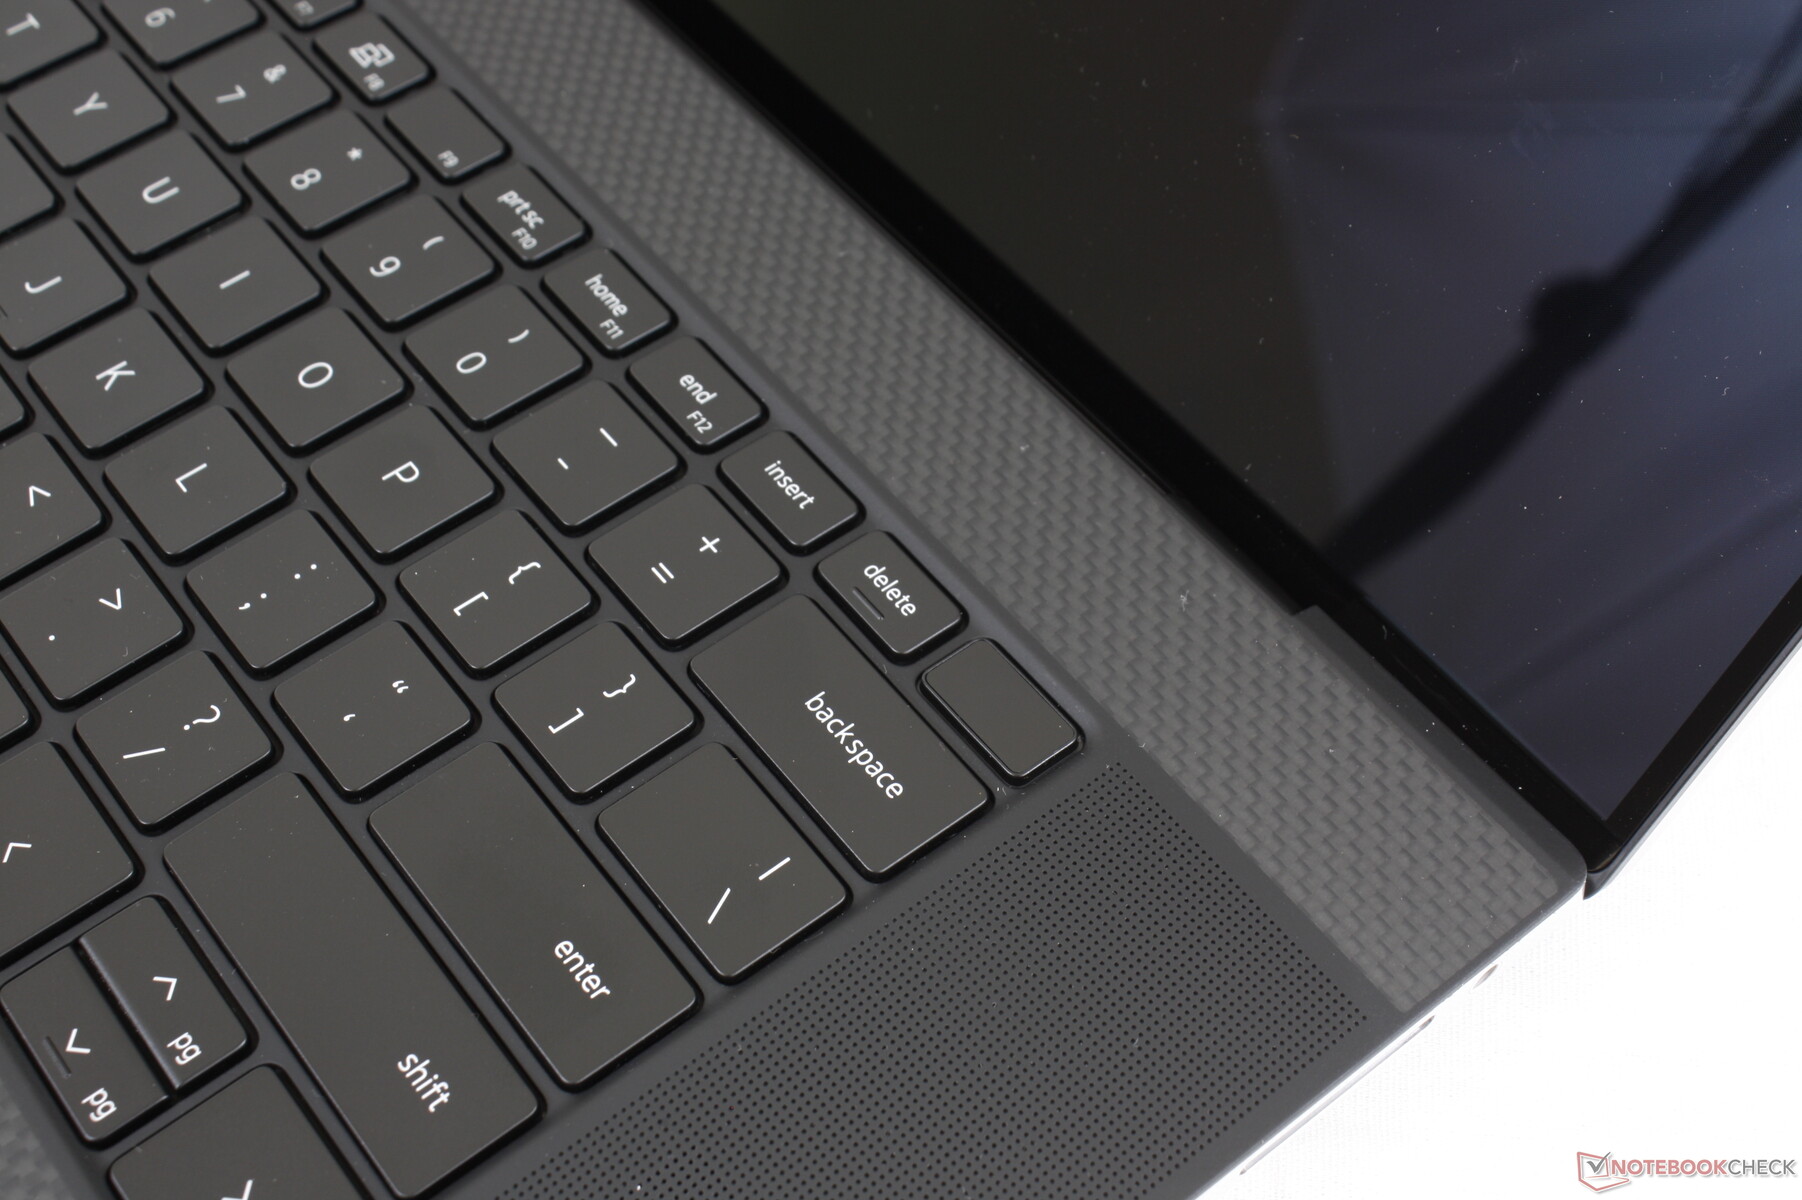
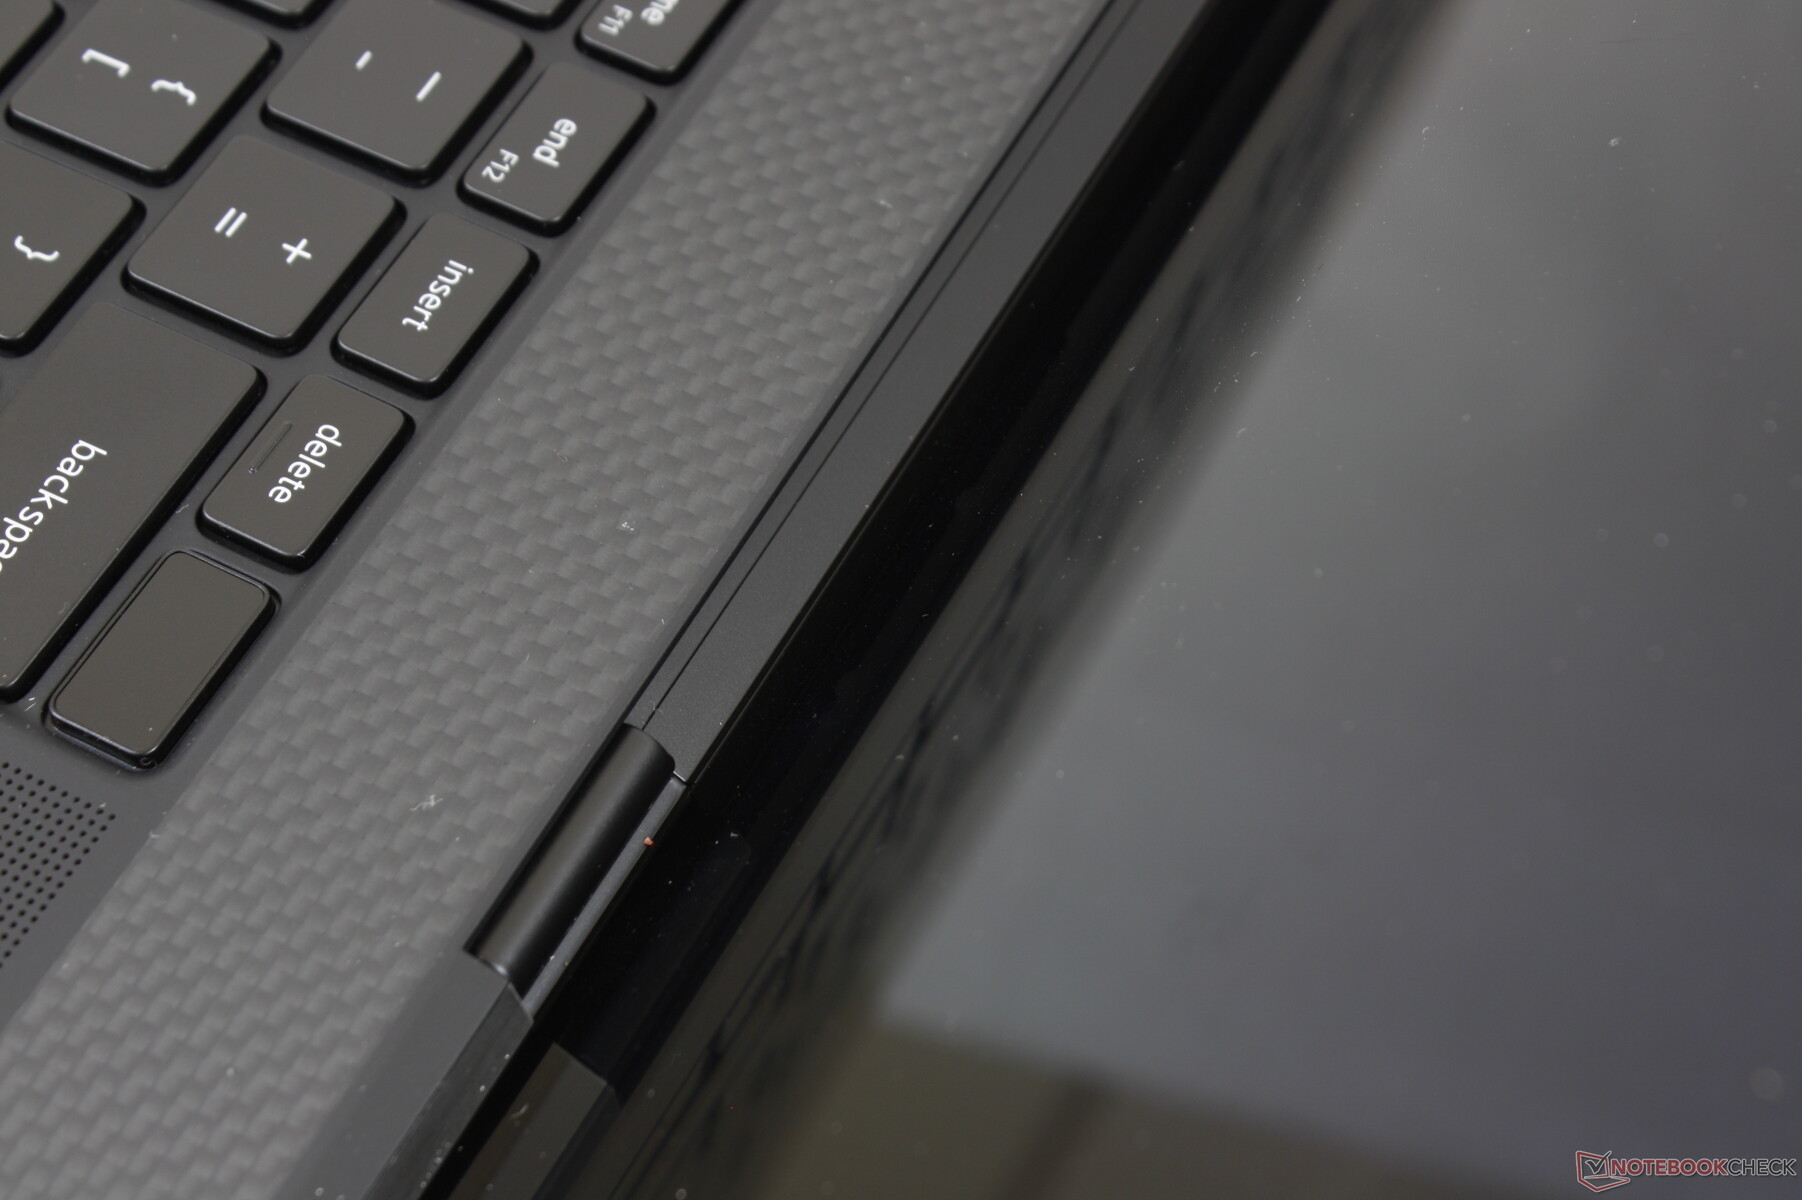
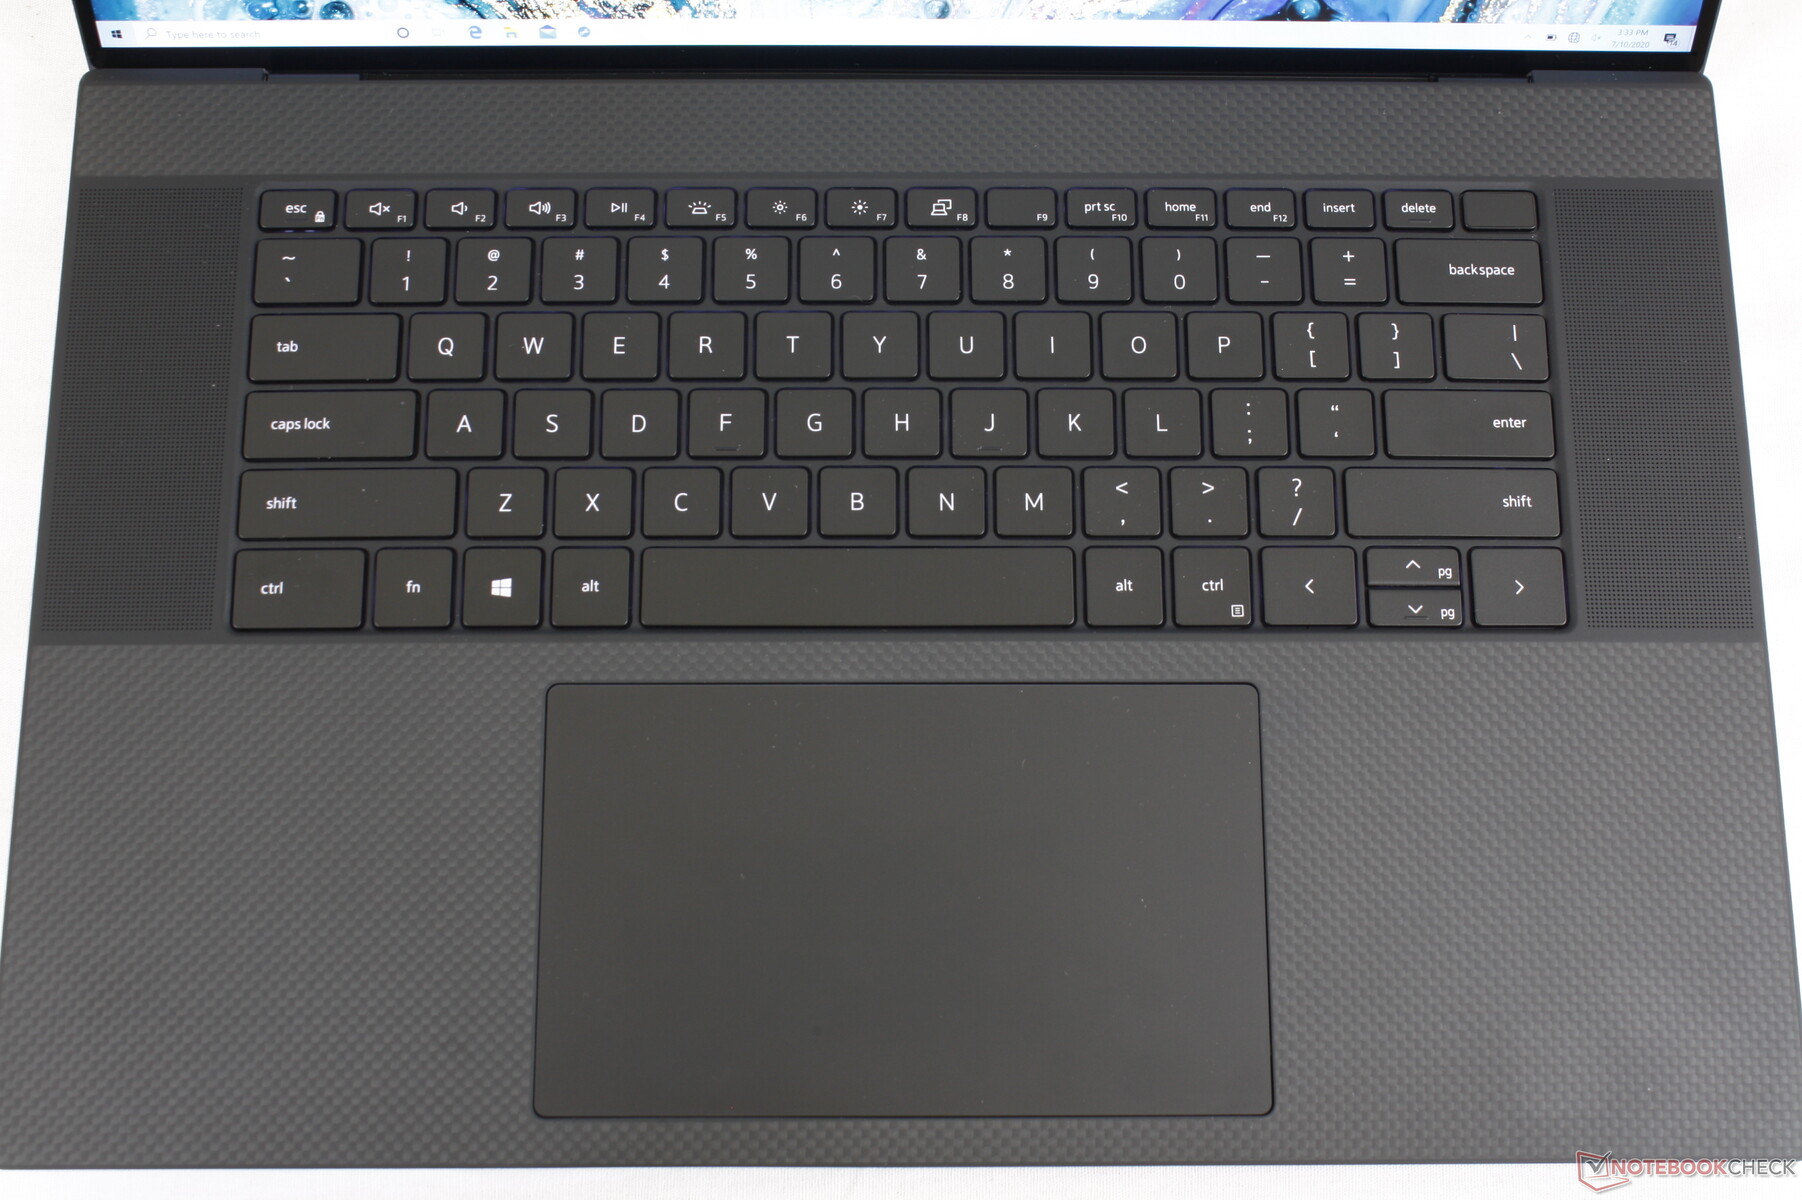
Giriş Aygıtları - XPS Üzerine Yazma Gibi 15
KeyboardDell, aralarında benzer bir yazma deneyimi için XPS 15 9500 ve XPS 17 9700 arasında aynı klavye tuşlarını ve düzenini kullanır. Böylece, XPS 15'i yazmakta rahat olursanız, anahtar boyutları aynı olduğundan XPS 17'de kendinizi evinizde hissedeceksiniz. Önemli seyahat, bir HP Spectre veya Dell Latitude'dan daha sığdır, ancak orta düzeyde bir sesle geri bildirim net kalır.
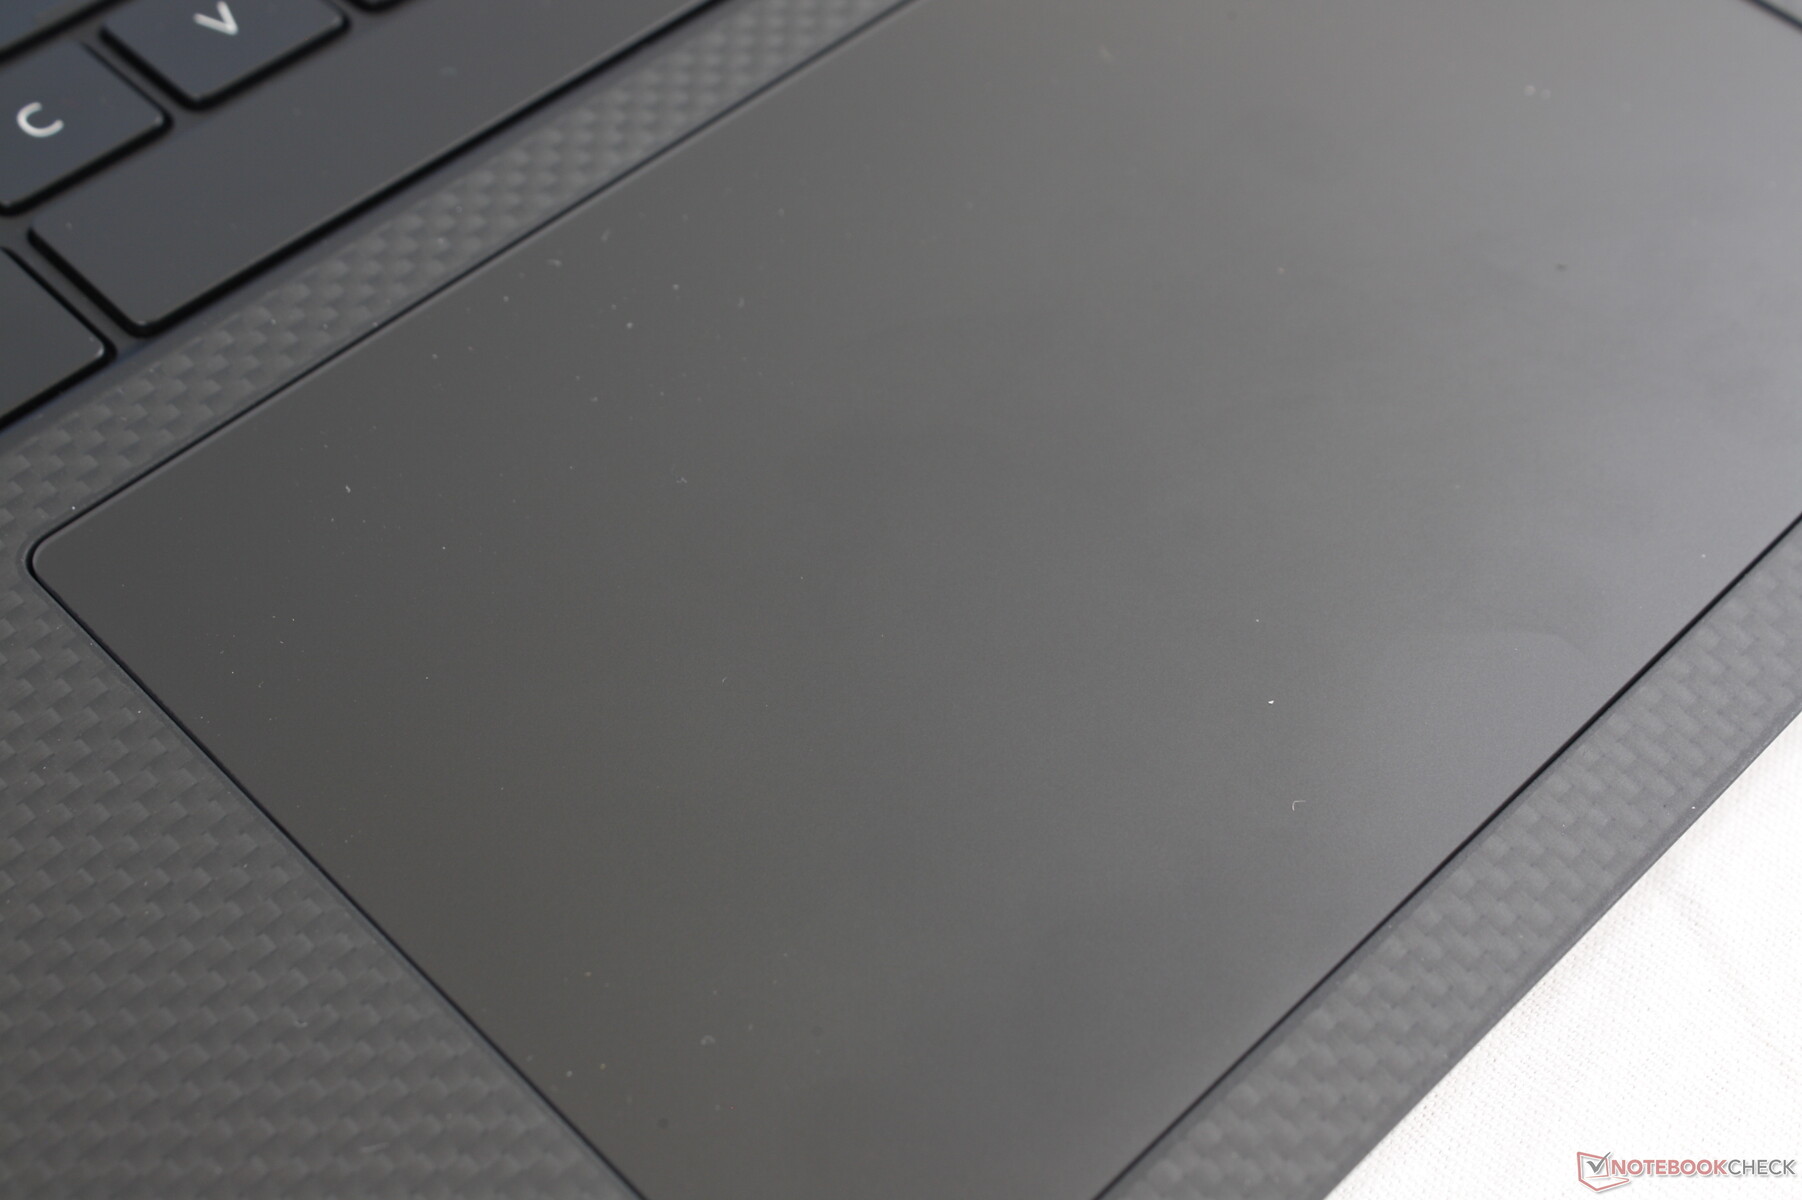
Dokunmatik
Clickpad, kolay kaydırma ve imleç kontrolü için benzer çekişe sahip en son XPS 15'teki (~ 15.1 x 9 cm) ile aynı boyuttadır.Ancak tıklama yüzeyinin ne kadar büyük ve ferah olabileceğine bakılmaksızın, özel fare düğmelerinin daha dokunsal ve doğru hissi. Buradaki entegre düğmeler, basıldığında tatmin edici olmayan bir tıklama için geri bildirimde yumuşaktır. Sürükleme ve bırakma gibi çoklu dokunma işlemlerinin, tıklama yüzeyinin büyüklüğü nedeniyle iki elle gerçekleştirilmesi çok daha kolaydır.

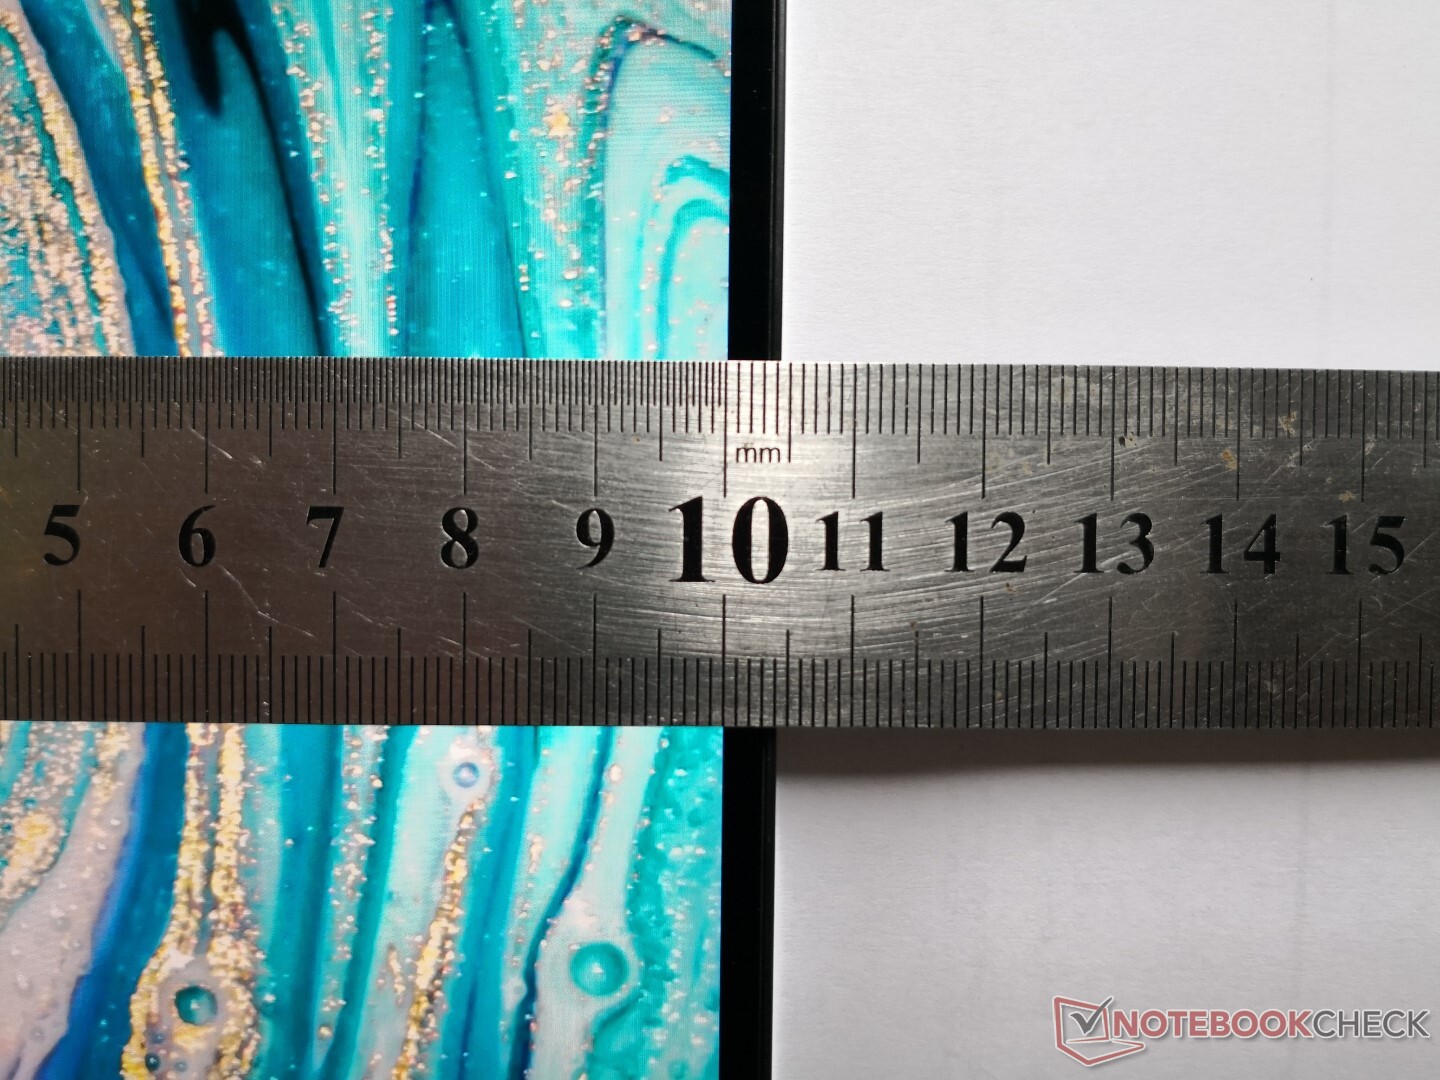
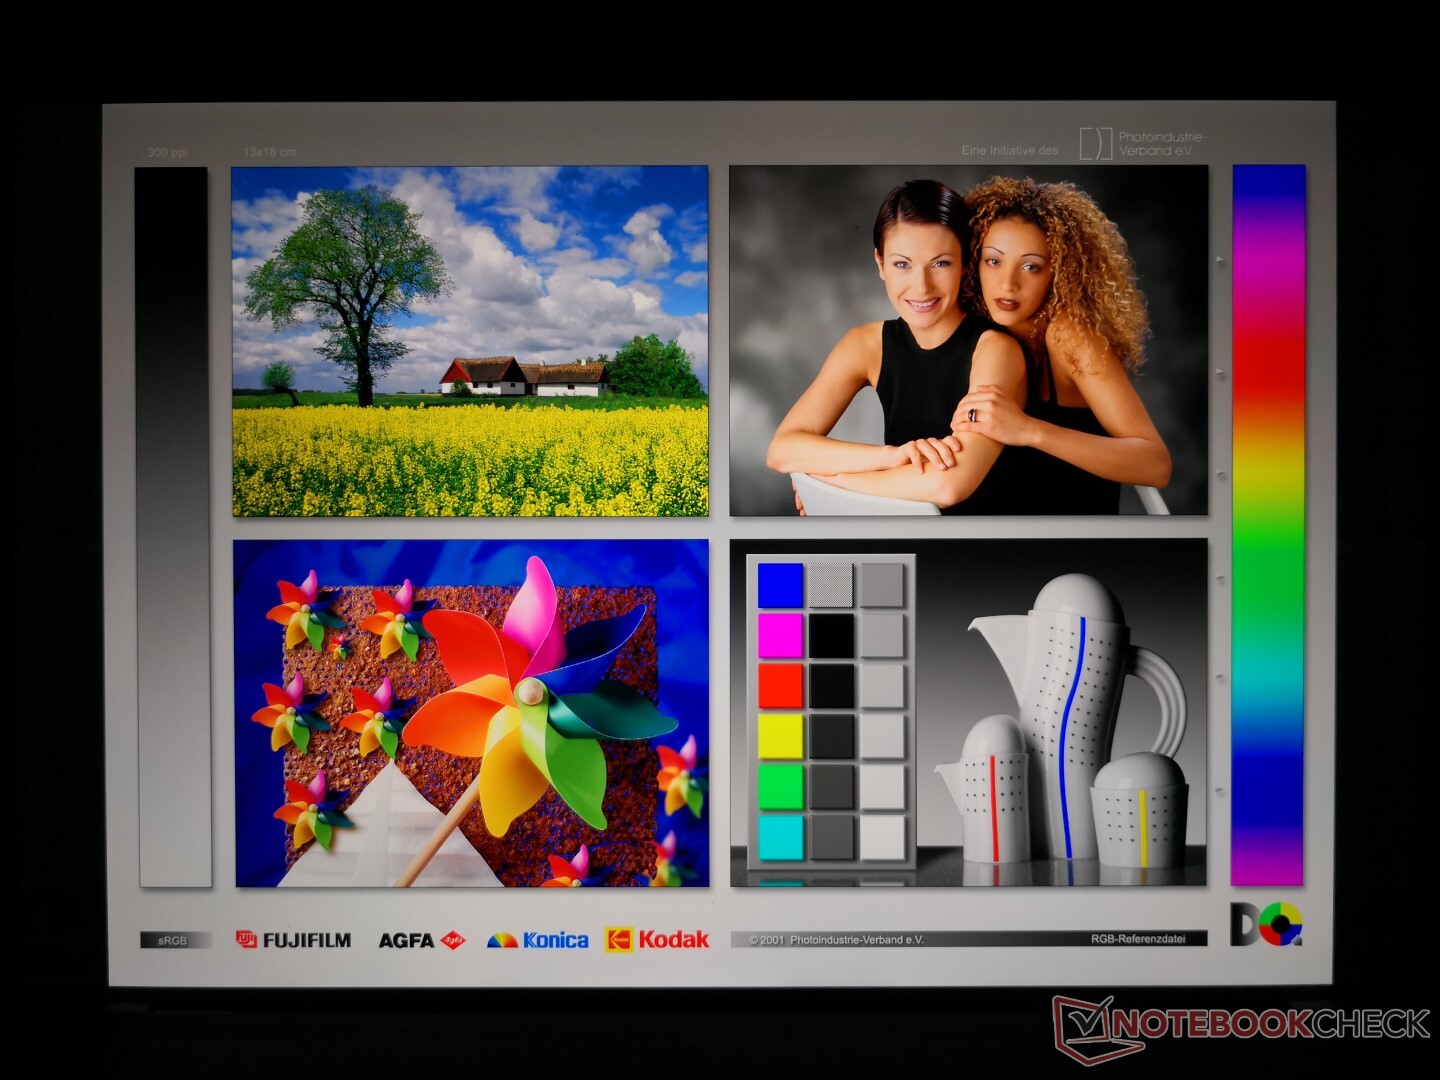
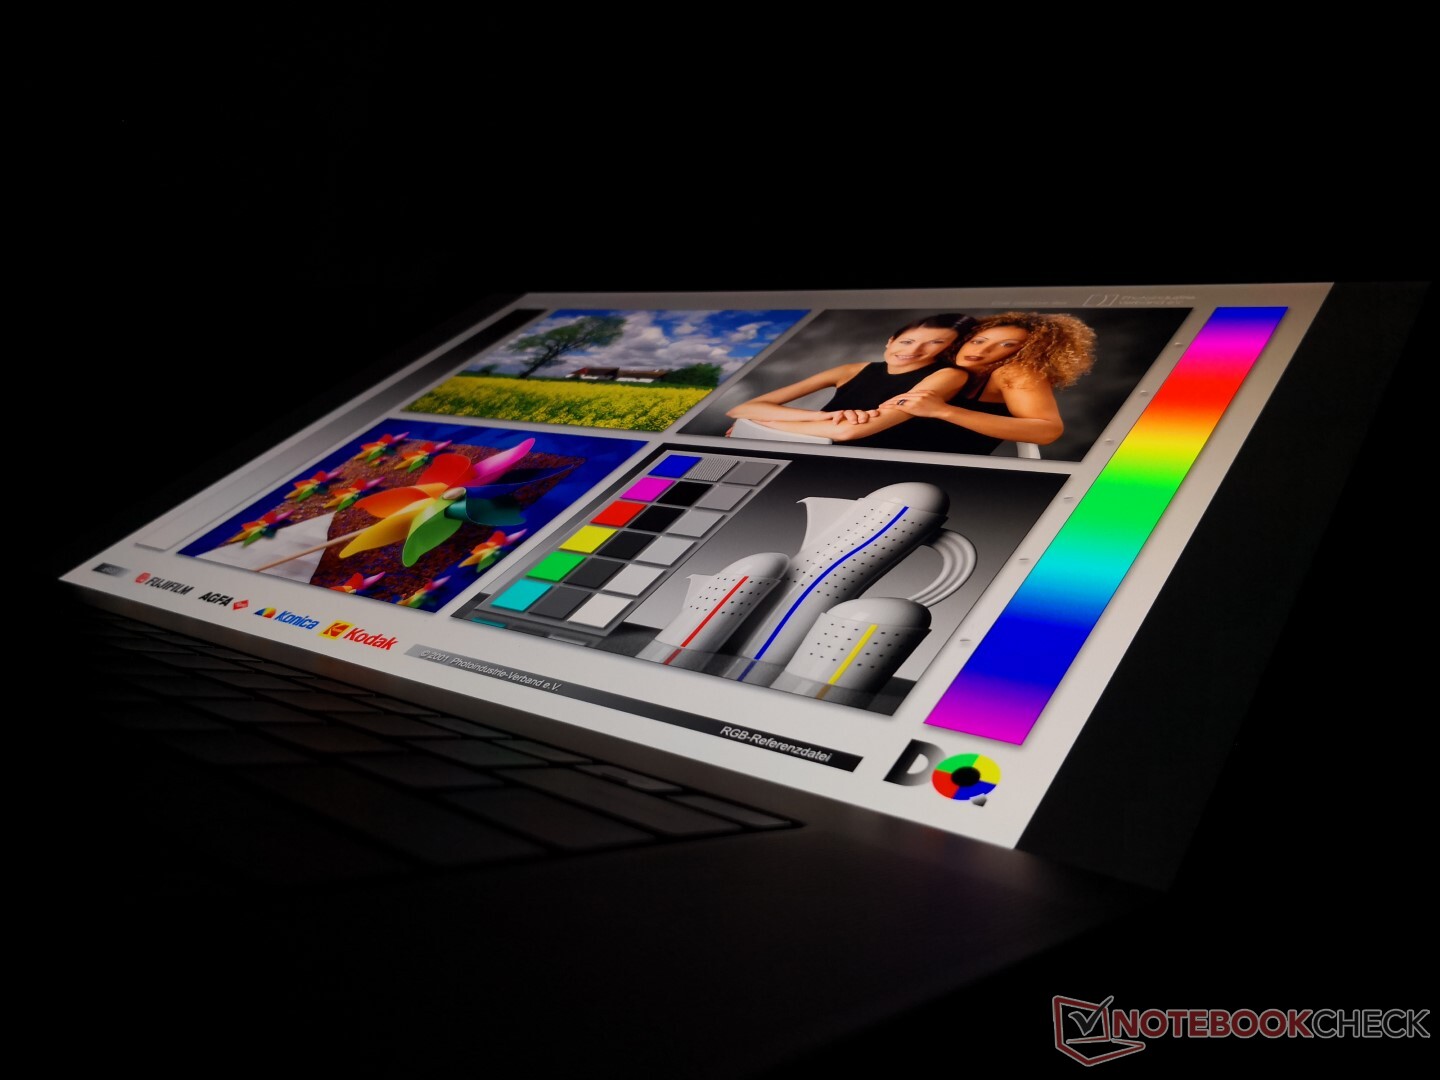
Ekran - 17 inçlik Dizüstü Bilgisayarlarda En Yüksek Ekran-Gövde Oranı
Sharp bir kez daha XPS ekrandan sorumlu ve XPS 17'nin en iyi yönlerinden biri. Ekranı ilk kez açtığınızda, ekranın geri kalanına göre ekranın ne kadar büyük olduğu herkesin şaşırmasına neden olacak. şasi. Belki de tesadüf değil, ölçülen parlaklık, tepki süreleri ve kontrast oranı, yüksek kaliteli bir panel kullanan MacBook Pro 16'da gözlemlediğimize çok yakın. Bununla birlikte, Dell daha yüksek PPI ve daha derin renkler için daha geniş gamı nedeniyle MacBook Pro ekranını hala sınırlıyor.
| |||||||||||||||||||||||||
Aydınlatma: 84 %
Batarya modunda parlaklık: 539.4 cd/m²
Kontrast: 1686:1 (Siyah: 0.32 cd/m²)
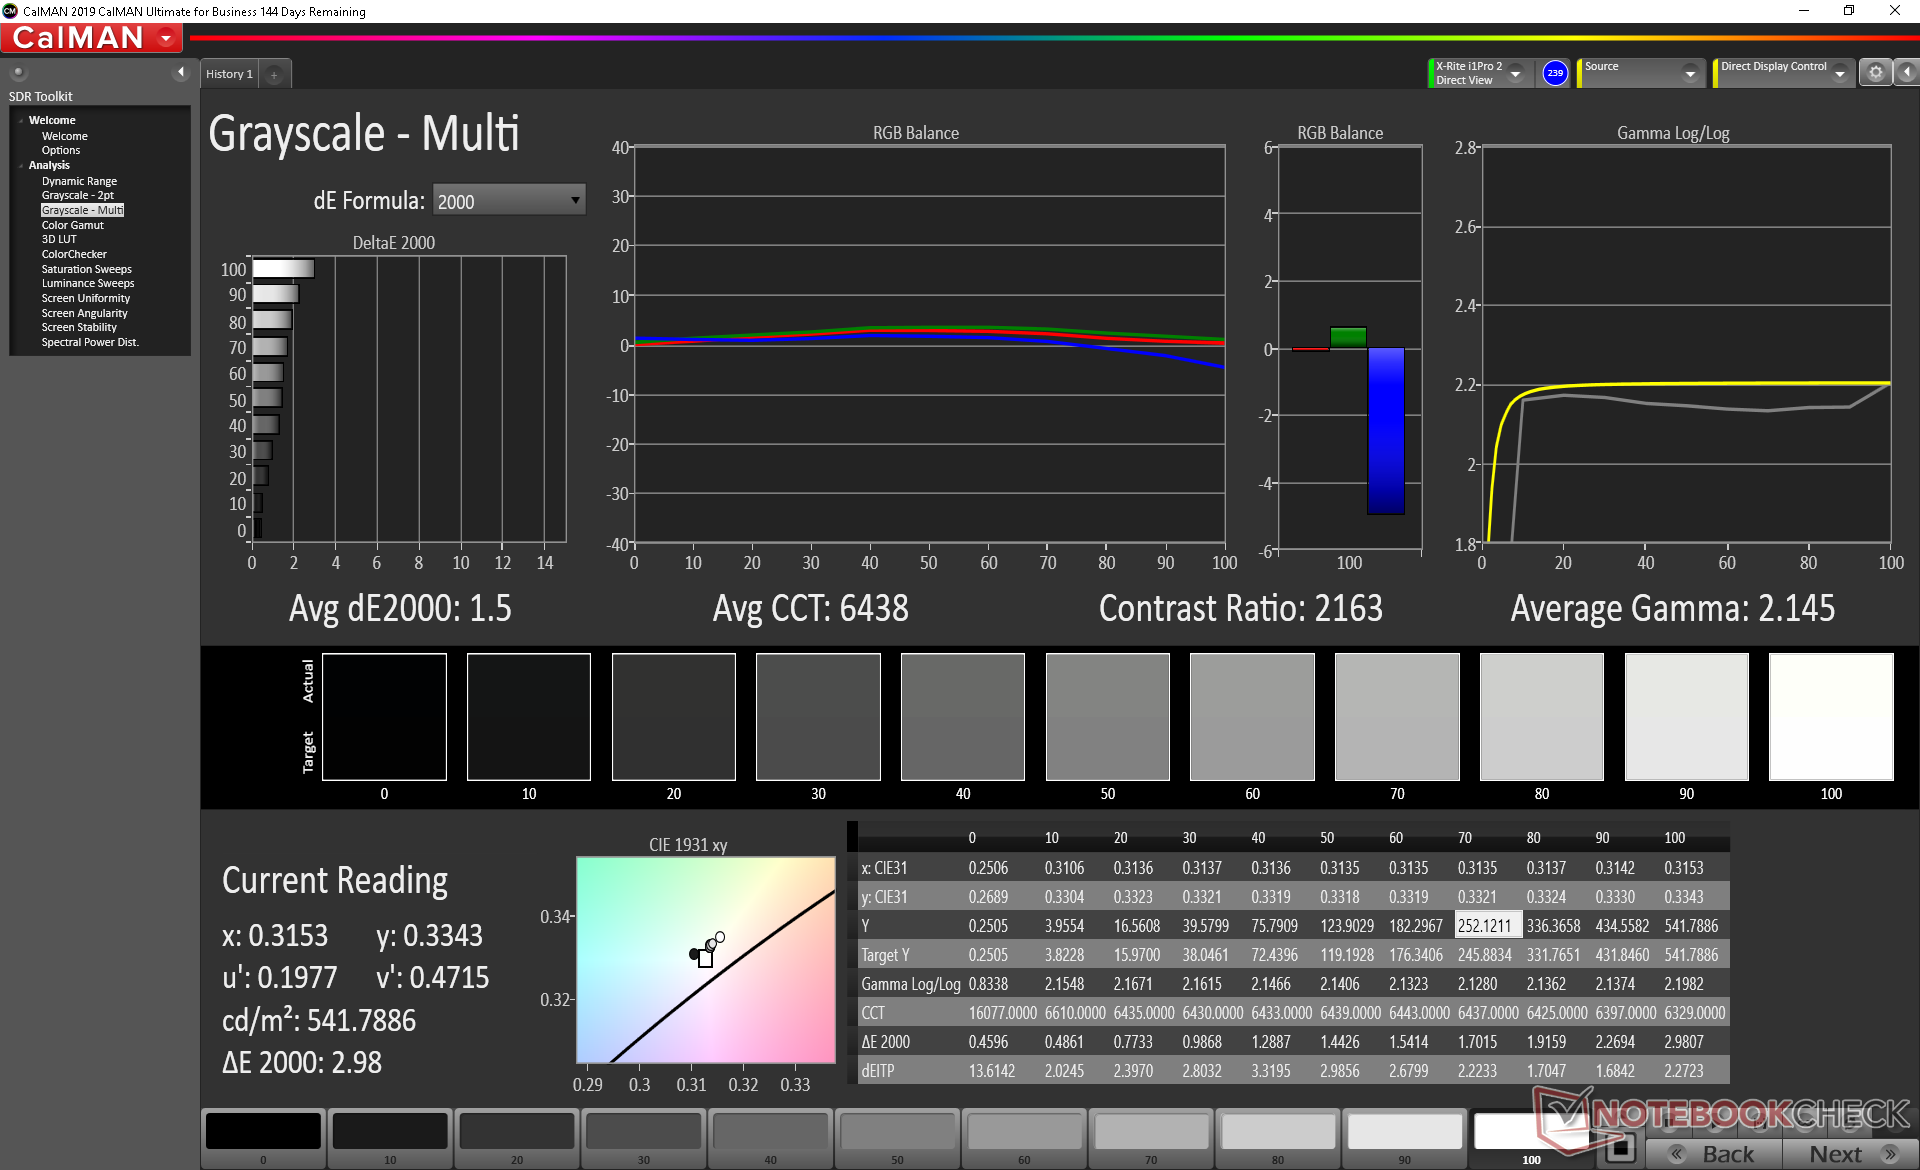
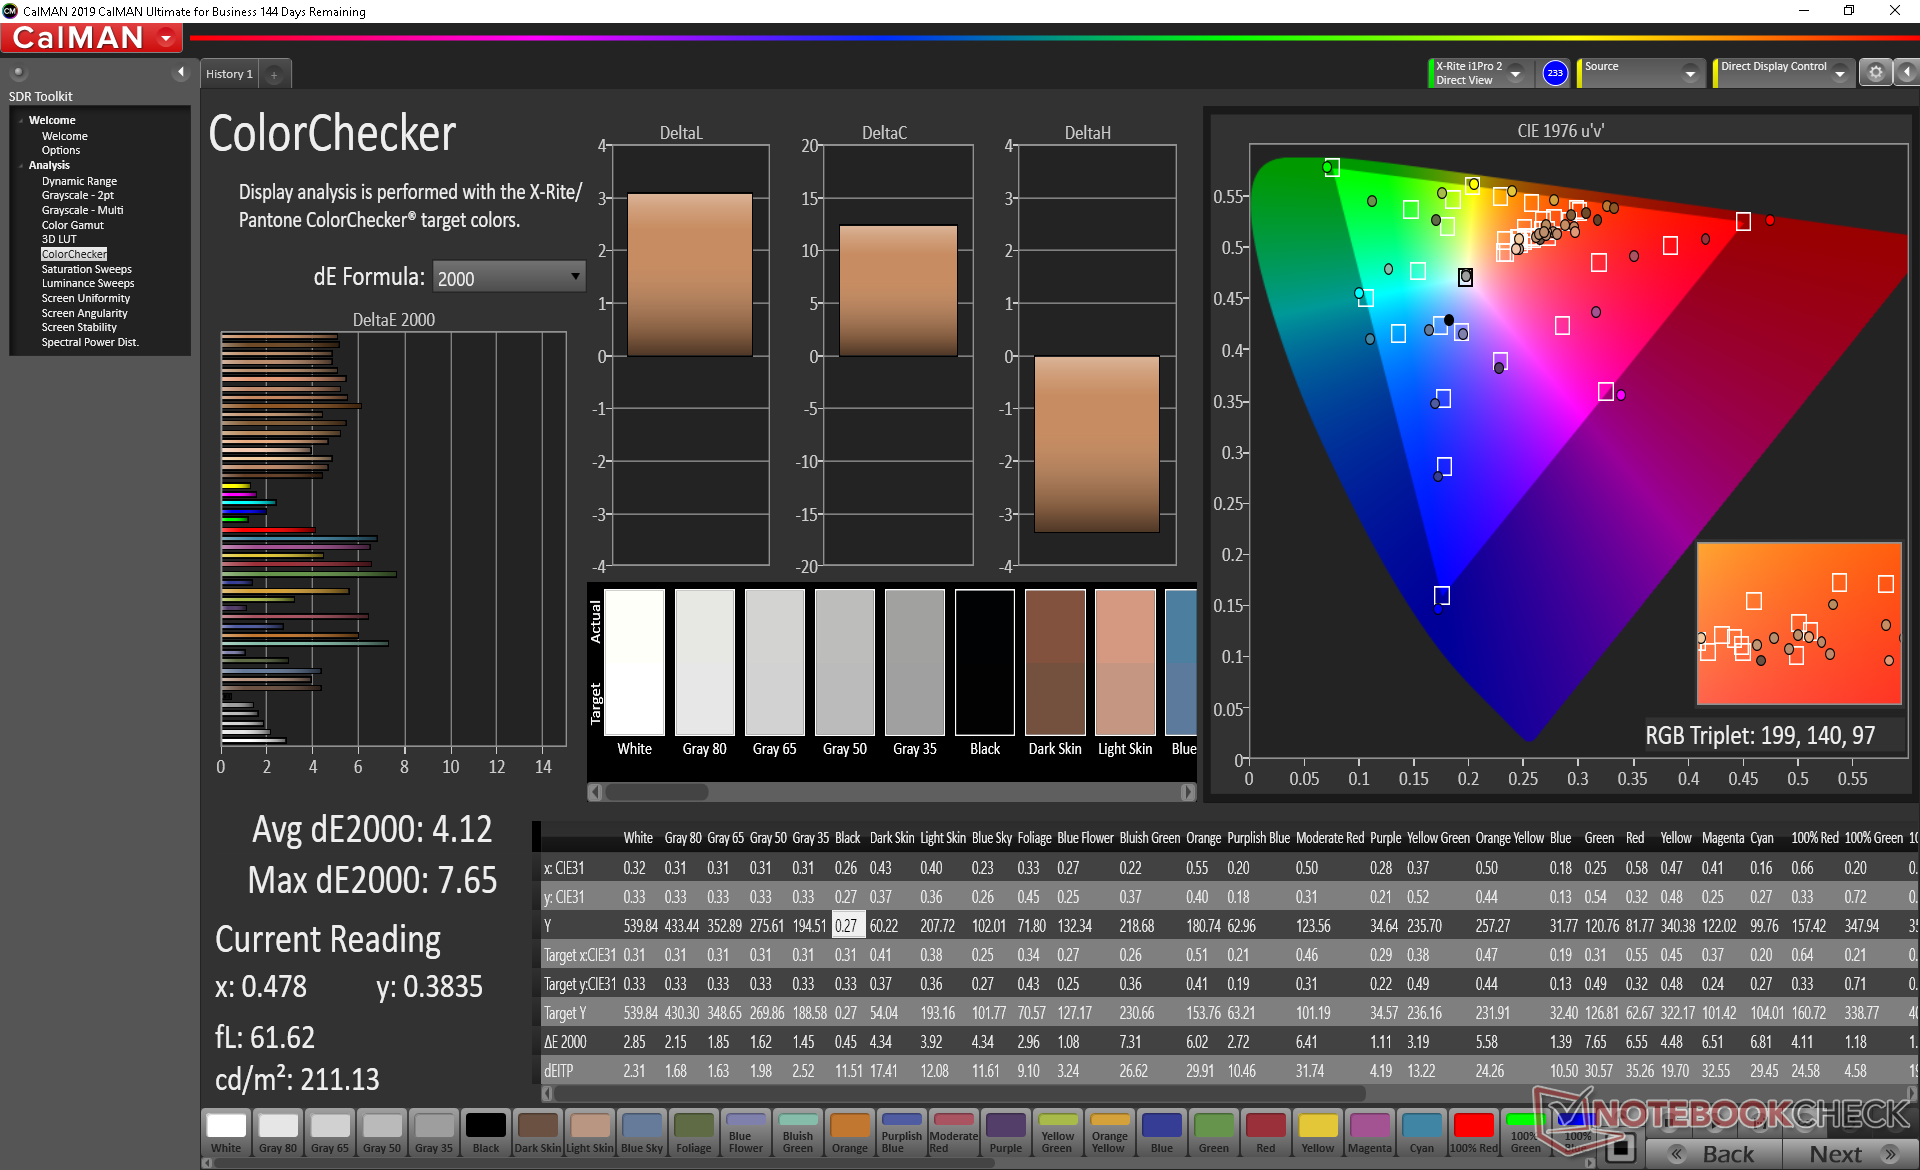
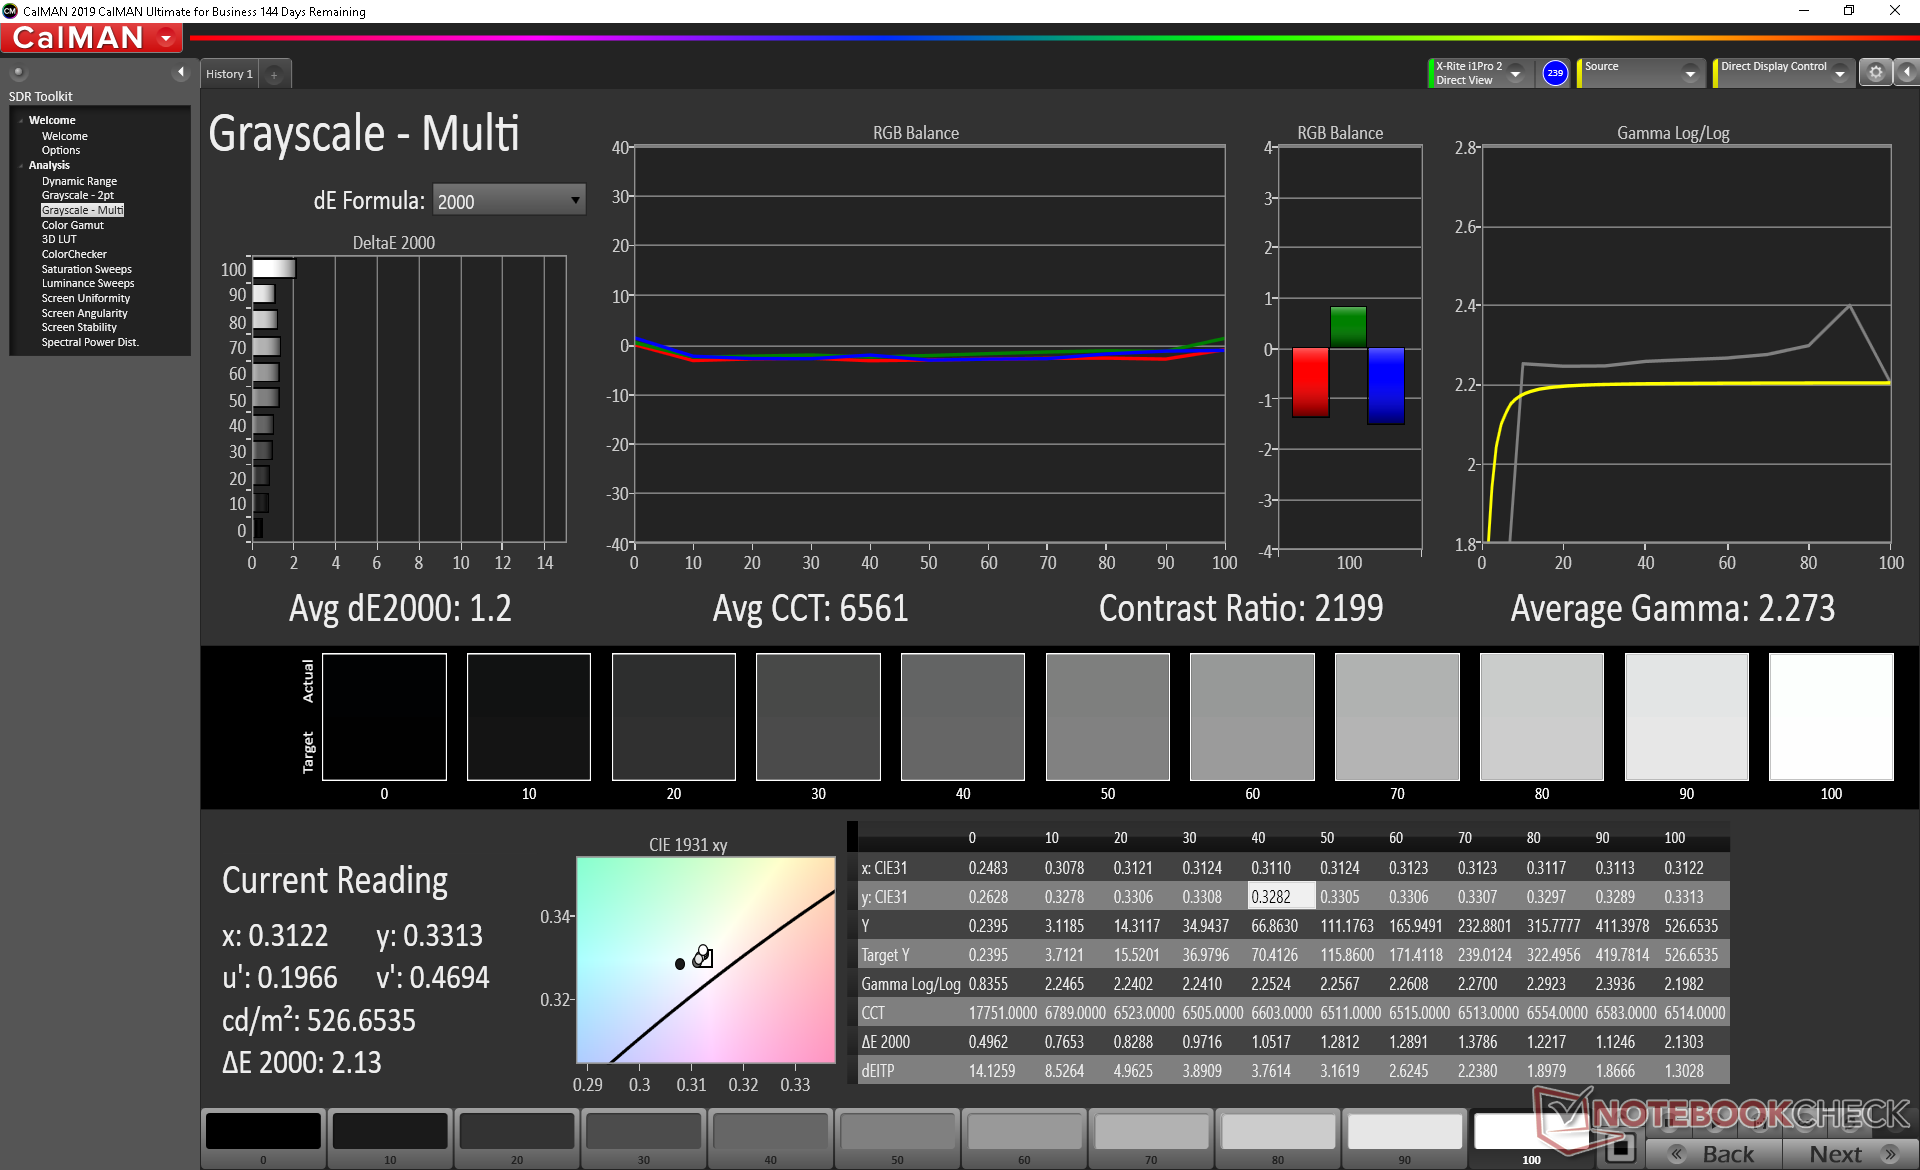
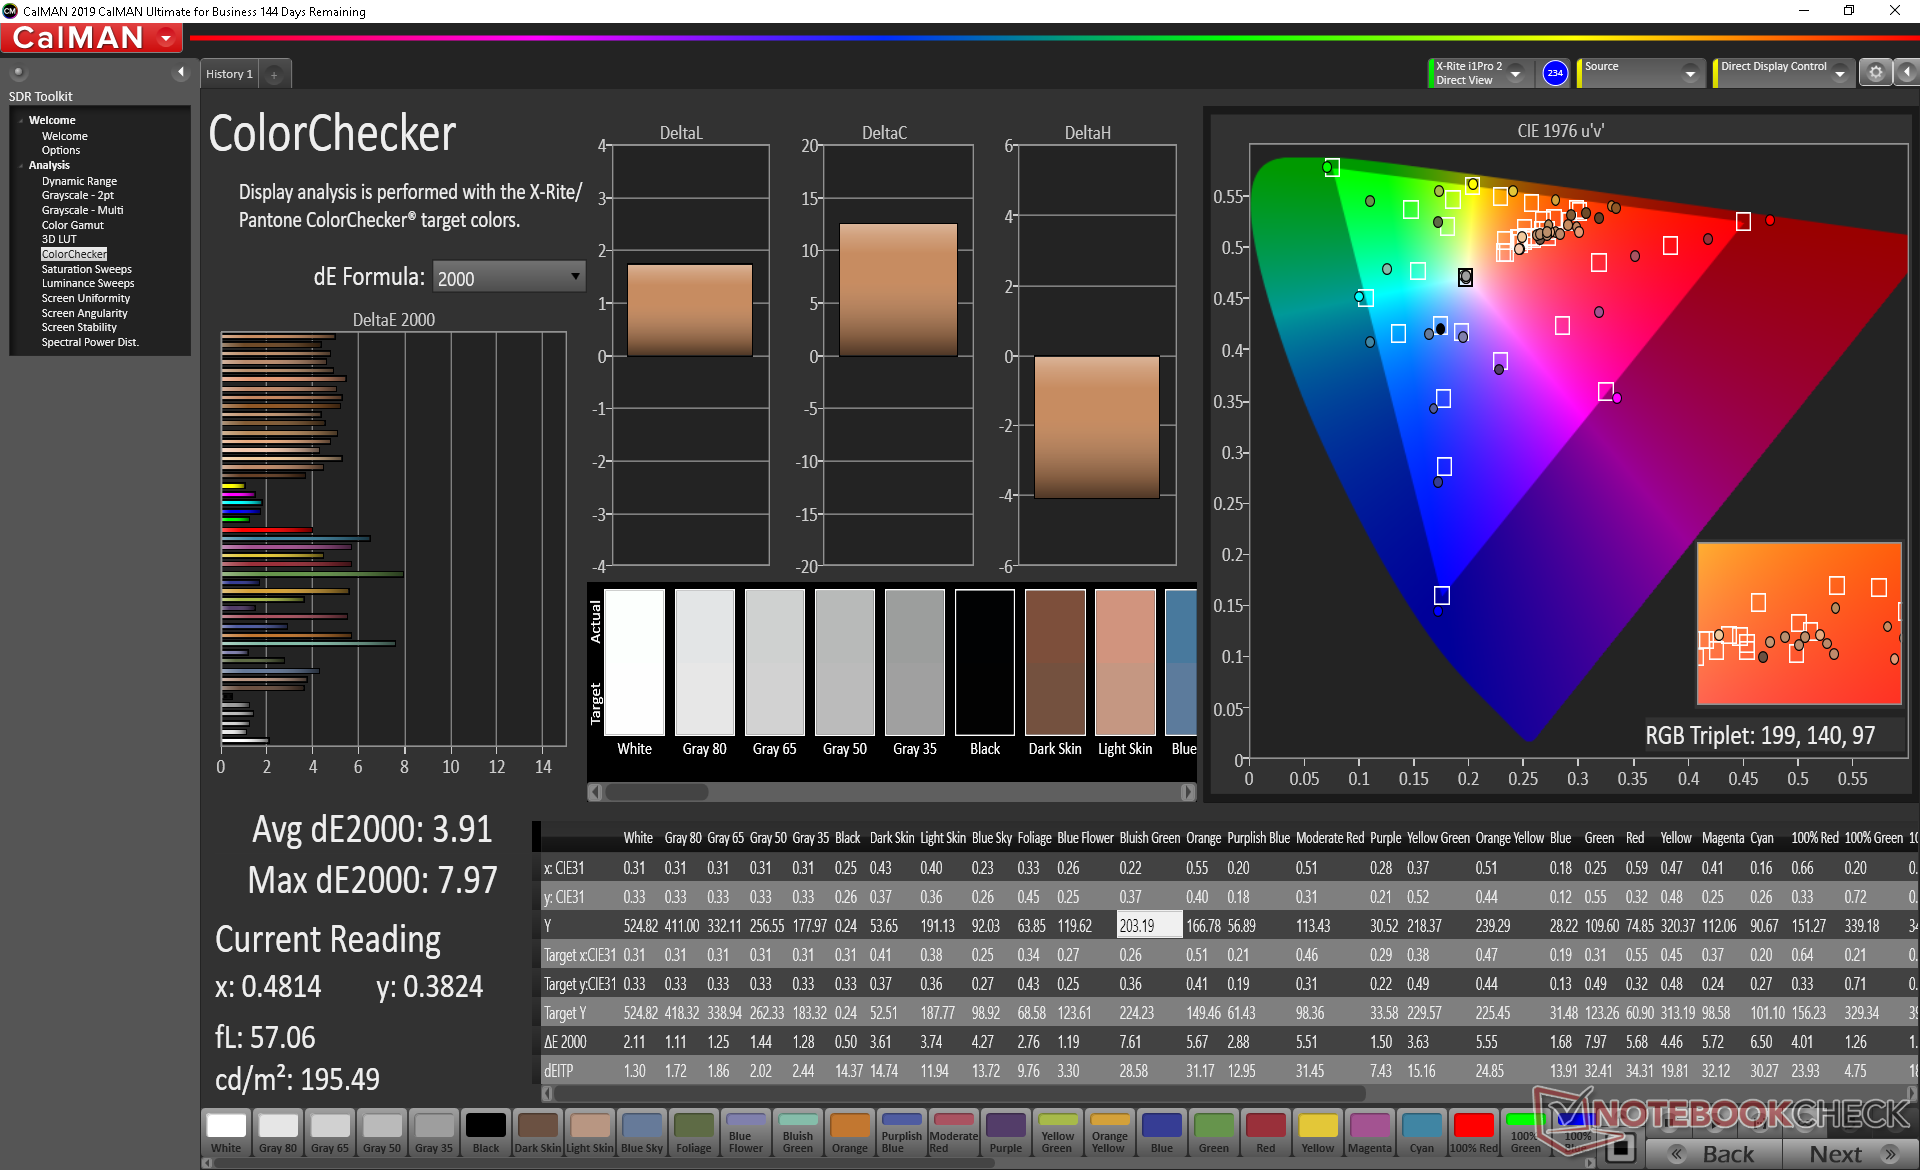
ΔE ColorChecker Calman: 4.12 | ∀{0.5-29.43 Ø4.73}
calibrated: 3.91
ΔE Greyscale Calman: 1.5 | ∀{0.09-98 Ø4.97}
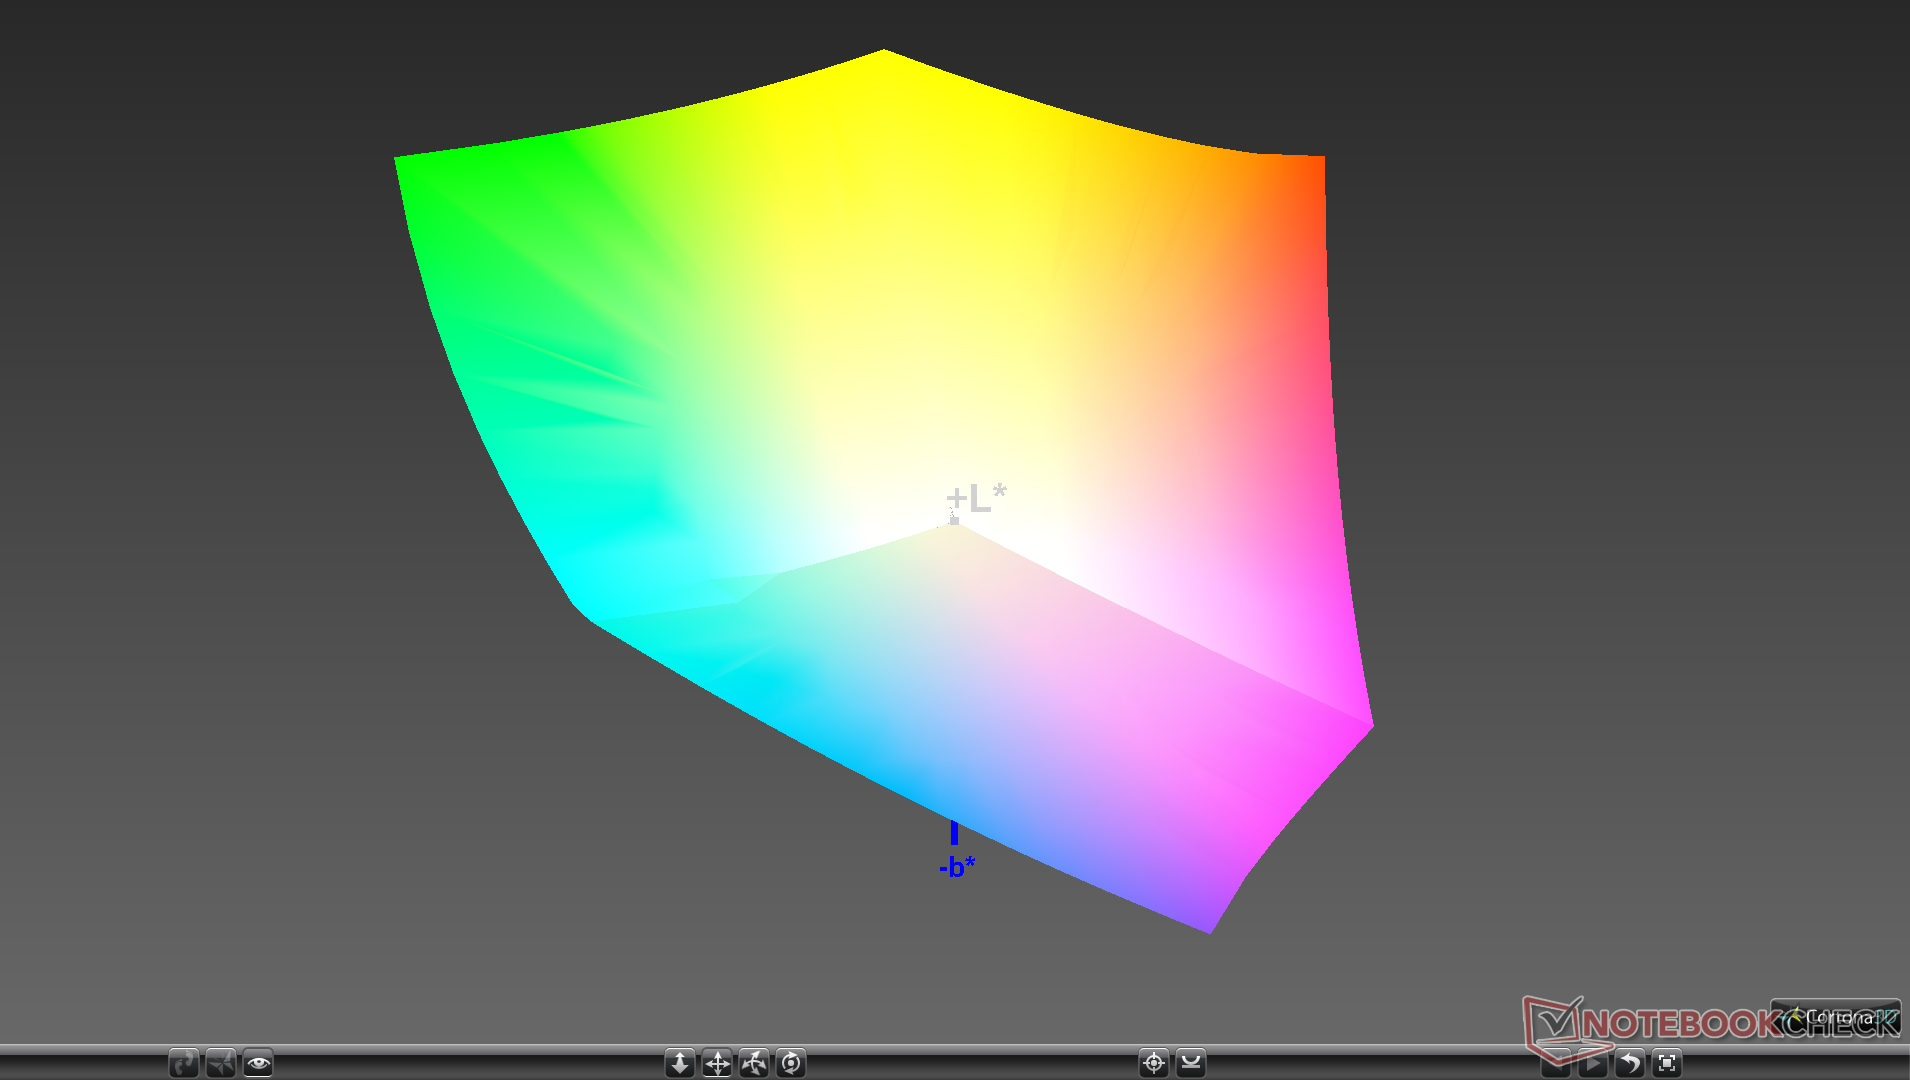
100% sRGB (Argyll 1.6.3 3D)
90.4% AdobeRGB 1998 (Argyll 1.6.3 3D)
99.8% AdobeRGB 1998 (Argyll 3D)
100% sRGB (Argyll 3D)
90.5% Display P3 (Argyll 3D)
Gamma: 2.15
CCT: 6438 K
| Dell XPS 17 9700 Core i7 RTX 2060 Max-Q Sharp LQ170R1, IPS, 17", 3840x2400 | Razer Blade Pro 17 RTX 2070 Max-Q 300 Hz Sharp LQ173M1JW02, IPS, 17.3", 1920x1080 | MSI Creator 17 A10SGS B173ZAN05.0 (AUO278E), Mini-LED IPS-Level, 17.3", 3840x2160 | HP Envy 17t-cg000 AU Optronics AUO168E, IPS, 17.3", 3840x2160 | Gigabyte Aero 17 HDR XB AUO B173ZAN03.2 (AUO329B), IPS, 17.3", 3840x2160 | Apple MacBook Pro 16 2019 i9 5500M APPA044, IPS, 16", 3072x1920 | |
|---|---|---|---|---|---|---|
| Display | -16% | -9% | -2% | -1% | ||
| Display P3 Coverage (%) | 90.5 | 72.2 -20% | 82 -9% | 86.2 -5% | 86.5 -4% | |
| sRGB Coverage (%) | 100 | 98.5 -1% | 97.5 -2% | 100 0% | 100 0% | |
| AdobeRGB 1998 Coverage (%) | 99.8 | 73 -27% | 84 -16% | 99.8 0% | 100 0% | |
| Response Times | 80% | 72% | 10% | 6% | -6% | |
| Response Time Grey 50% / Grey 80% * (ms) | 51.2 ? | 5.6 ? 89% | 45.2 ? 12% | 55.2 ? -8% | 52.4 ? -2% | |
| Response Time Black / White * (ms) | 32 ? | 9.6 ? 70% | 8.8 ? 72% | 29.6 ? 7% | 26 ? 19% | 34.9 ? -9% |
| PWM Frequency (Hz) | 26600 ? | 131700 | ||||
| Screen | -46% | -6% | -46% | 17% | 12% | |
| Brightness middle (cd/m²) | 539.4 | 328 -39% | 996 85% | 383.4 -29% | 487 -10% | 519 -4% |
| Brightness (cd/m²) | 494 | 329 -33% | 952 93% | 382 -23% | 475 -4% | 477 -3% |
| Brightness Distribution (%) | 84 | 78 -7% | 93 11% | 86 2% | 95 13% | 86 2% |
| Black Level * (cd/m²) | 0.32 | 0.35 -9% | 0.68 -113% | 0.34 -6% | 0.38 -19% | 0.39 -22% |
| Contrast (:1) | 1686 | 937 -44% | 1465 -13% | 1128 -33% | 1282 -24% | 1331 -21% |
| Colorchecker dE 2000 * | 4.12 | 4.74 -15% | 4.21 -2% | 6.24 -51% | 1.19 71% | 2.28 45% |
| Colorchecker dE 2000 max. * | 7.65 | 8.99 -18% | 6.79 11% | 10.18 -33% | 2.43 68% | 6.54 15% |
| Colorchecker dE 2000 calibrated * | 3.91 | 2.12 46% | 2.03 48% | 3.7 5% | 0.5 87% | 0.86 78% |
| Greyscale dE 2000 * | 1.5 | 6.8 -353% | 4.1 -173% | 6.6 -340% | 1.45 3% | 0.9 40% |
| Gamma | 2.15 102% | 2.2 100% | 2.207 100% | 2.272 97% | 2.21 100% | 2145 0% |
| CCT | 6438 101% | 6446 101% | 7491 87% | 5973 109% | 6557 99% | 6572 99% |
| Color Space (Percent of AdobeRGB 1998) (%) | 90.4 | 64.8 -28% | 84 -7% | 88 -3% | 88 -3% | 78 -14% |
| Color Space (Percent of sRGB) (%) | 100 | 98.6 -1% | 97 -3% | 100 0% | 100 0% | |
| Toplam Ortalama (Program / Ayarlar) | 6% /
-24% | 19% /
-1% | -13% /
-31% | 7% /
12% | 3% /
9% |
* ... daha küçük daha iyidir
Renk alanı, MSI Creator 17 veya Gigabyte Aero 17 gibi çoğu profesyonel dizüstü bilgisayara benzer olacak şekilde tüm sRGB'leri ve AdobeRGB'nin yüzde 90'ını kapsıyor. Tipik tüketici Ultrabook, AdobeRGB'nin yaklaşık yüzde 60'ını karşılaştırıyor.

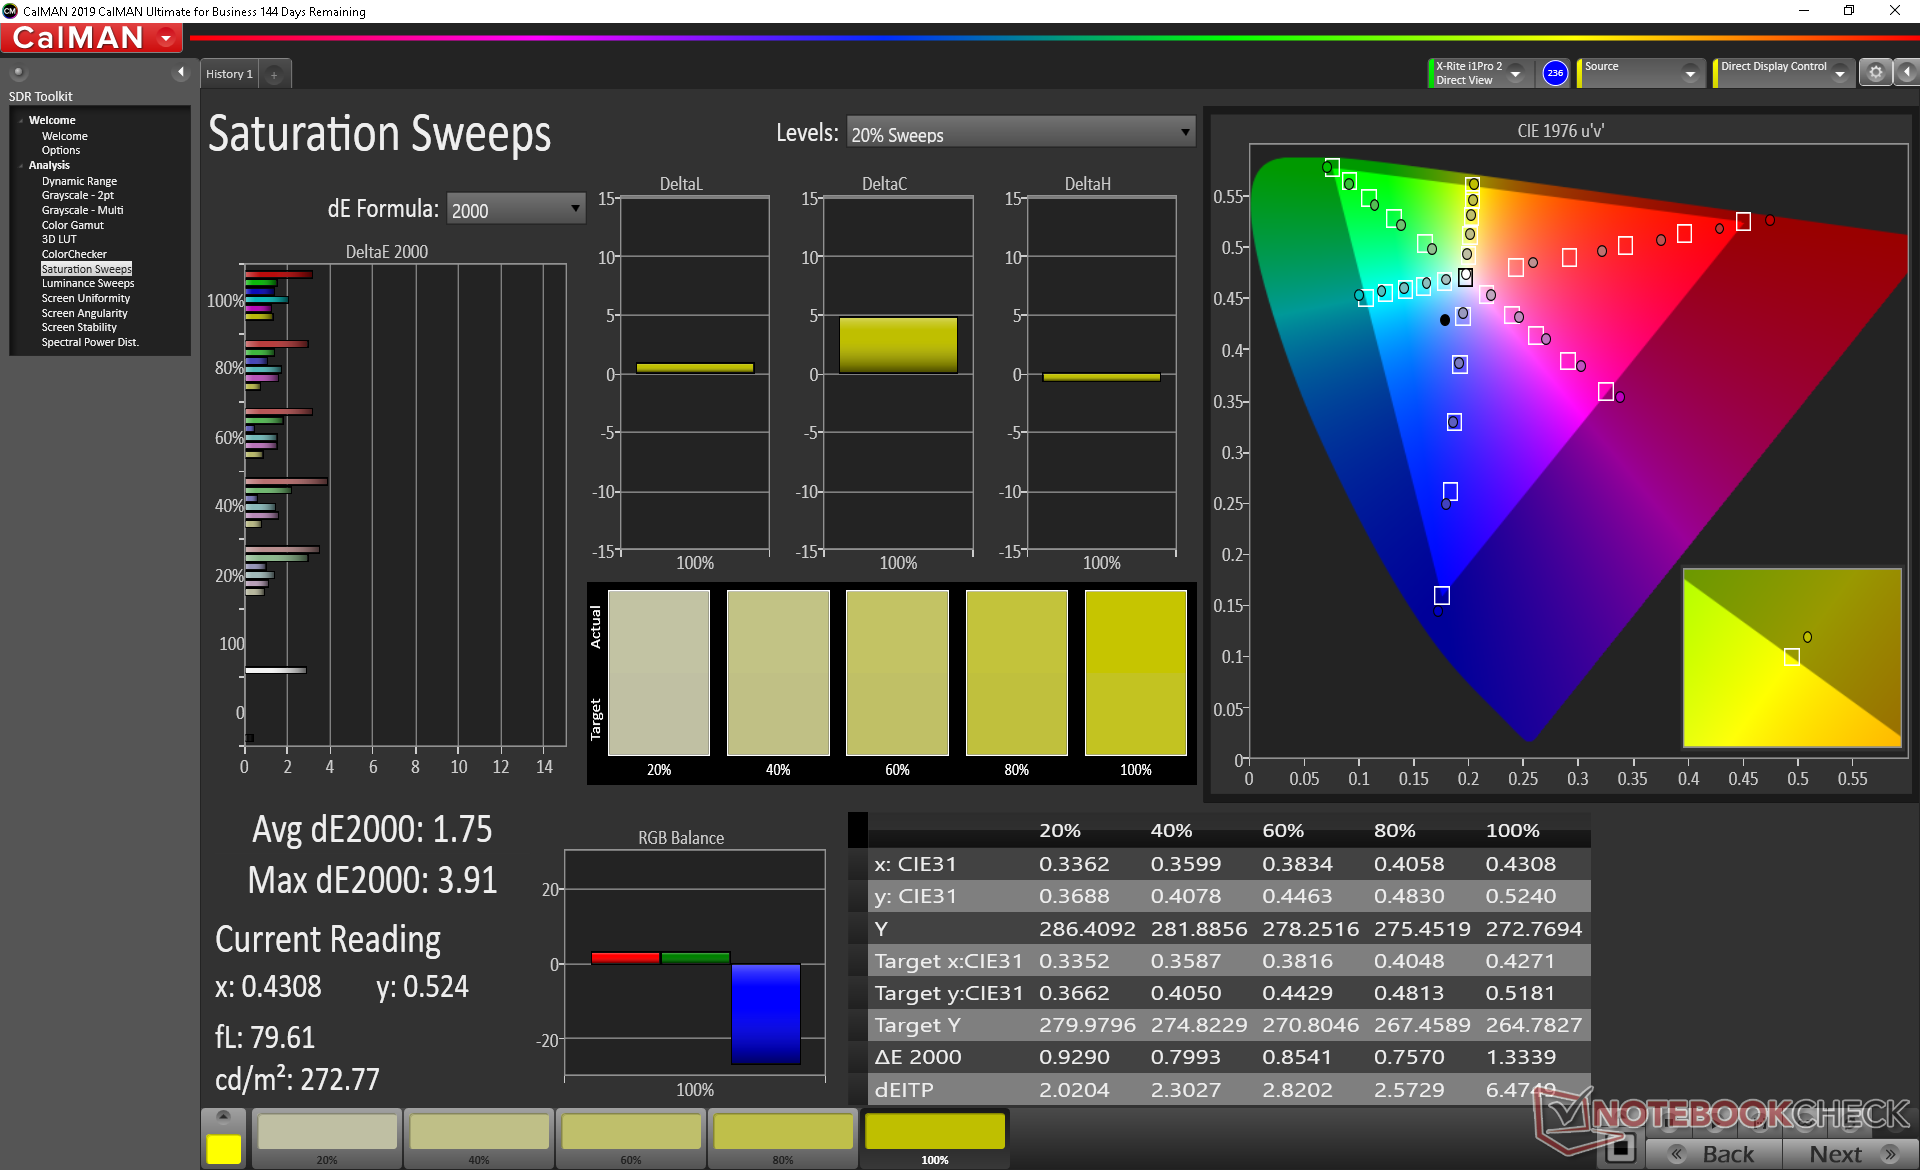
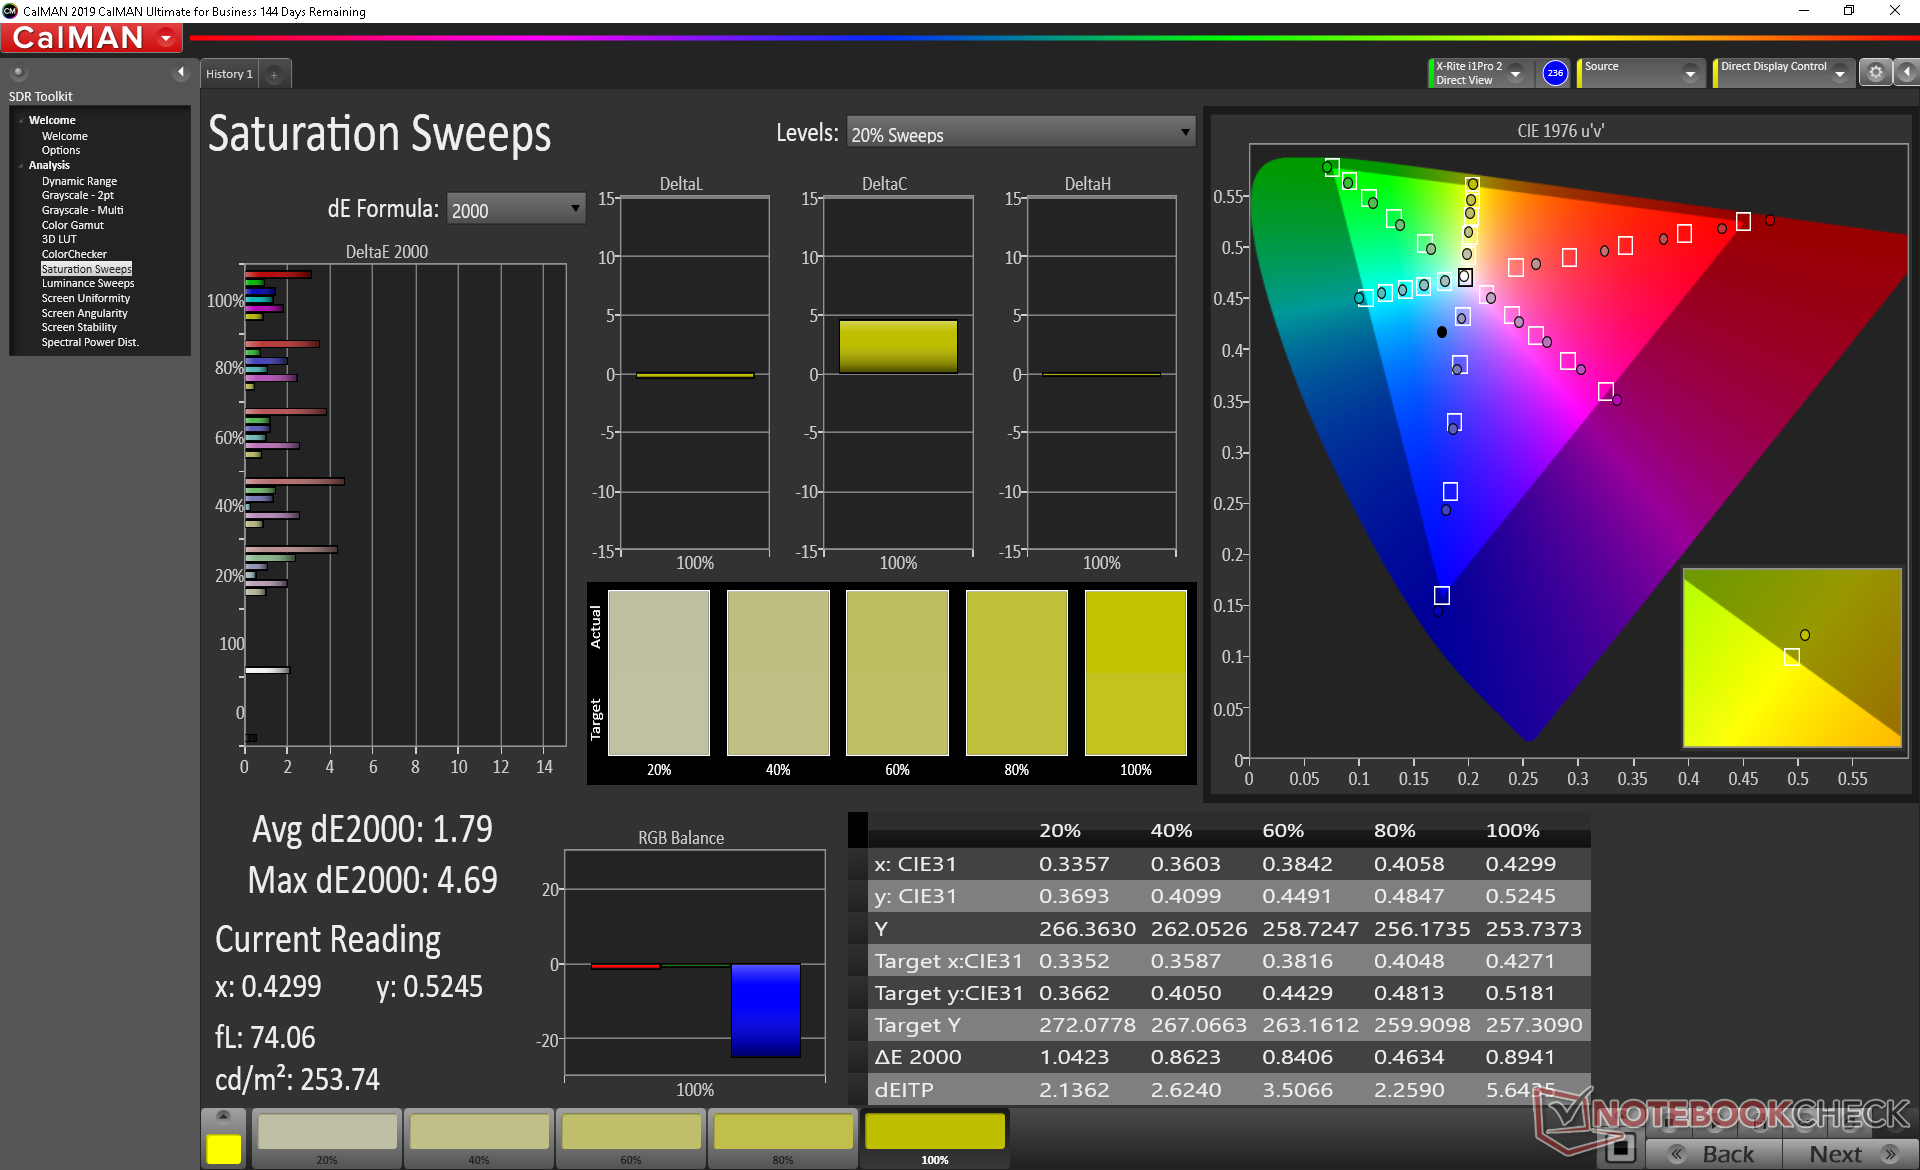
Ekran, ortalama DeltaE ve renk doygunluğu değerleri sırasıyla sadece 1,5 ve 1,75 ile kutudan iyi kalibre edilmiştir. Paneli kendimiz daha da kalibre etmeye çalışmak önemsiz değişikliklere neden olur ve bu nedenle son kullanıcı kalibrasyonu gerekli değildir.
Yanıt Sürelerini Görüntüle
| ↔ Tepki Süresi Siyahtan Beyaza | ||
|---|---|---|
| 32 ms ... yükseliş ↗ ve sonbahar↘ birleşimi | ↗ 18 ms yükseliş | 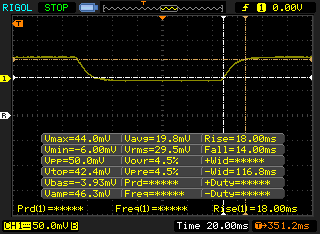 |
| ↘ 14 ms sonbahar | ||
| Ekran, testlerimizde yavaş yanıt oranları gösteriyor ve oyuncular için yetersiz olacaktır. Karşılaştırıldığında, test edilen tüm cihazlar 0.1 (minimum) ile 240 (maksimum) ms arasında değişir. » Tüm cihazların 86 %'si daha iyi. Bu, ölçülen yanıt süresinin test edilen tüm cihazların ortalamasından (19.9 ms) daha kötü olduğu anlamına gelir. | ||
| ↔ Tepki Süresi %50 Griden %80 Griye | ||
| 51.2 ms ... yükseliş ↗ ve sonbahar↘ birleşimi | ↗ 27.2 ms yükseliş | 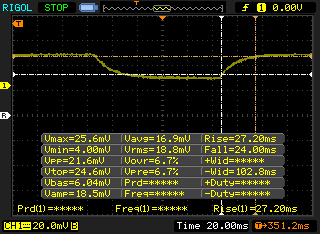 |
| ↘ 24 ms sonbahar | ||
| Ekran, testlerimizde yavaş yanıt oranları gösteriyor ve oyuncular için yetersiz olacaktır. Karşılaştırıldığında, test edilen tüm cihazlar 0.165 (minimum) ile 636 (maksimum) ms arasında değişir. » Tüm cihazların 88 %'si daha iyi. Bu, ölçülen yanıt süresinin test edilen tüm cihazların ortalamasından (31.1 ms) daha kötü olduğu anlamına gelir. | ||
Ekran Titremesi / PWM (Darbe Genişliği Modülasyonu)
| Ekran titriyor / PWM algılanmadı | 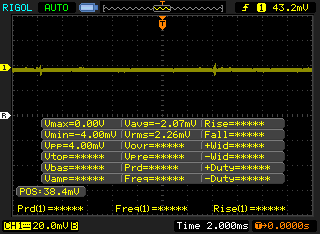 | ||
Karşılaştırıldığında: Test edilen tüm cihazların %52 %'si ekranı karartmak için PWM kullanmıyor. PWM tespit edilirse, ortalama 7798 (minimum: 5 - maksimum: 343500) Hz ölçüldü. | |||
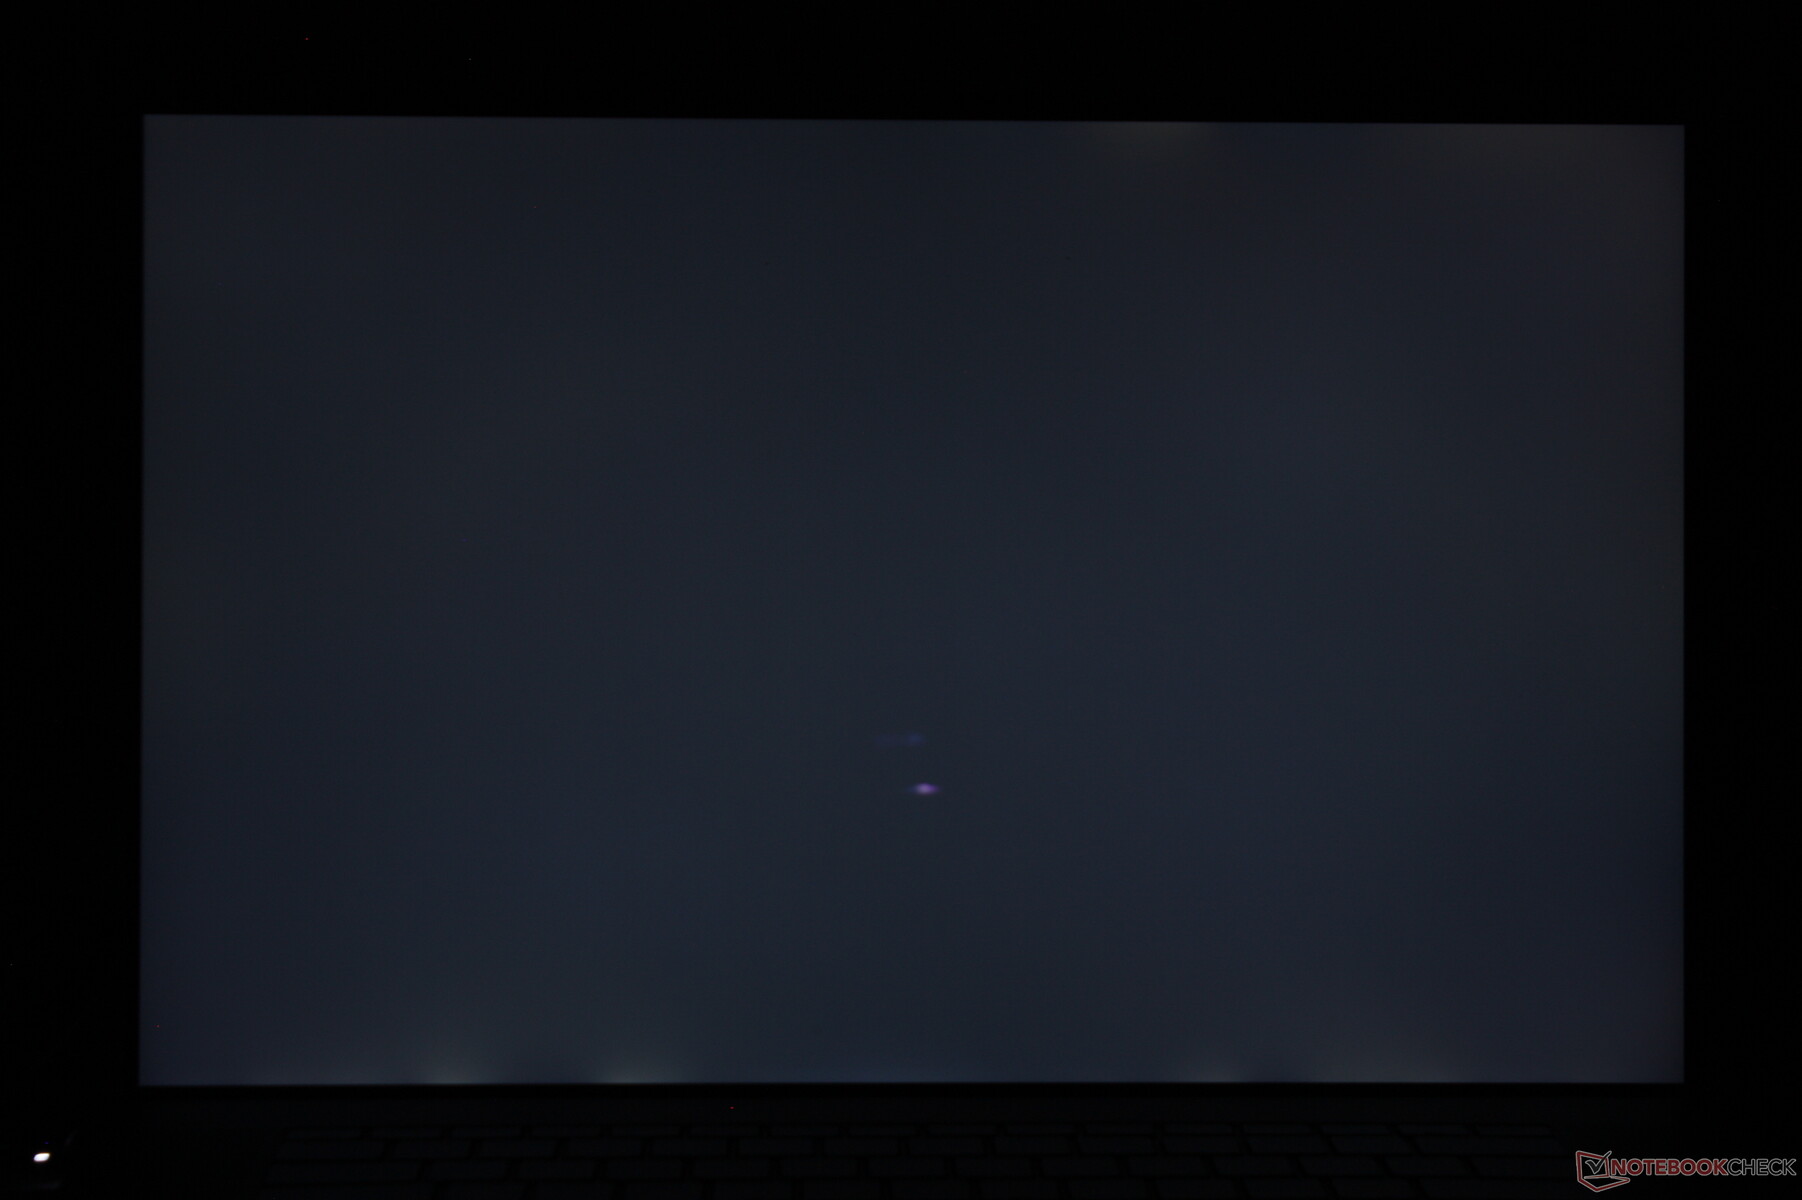
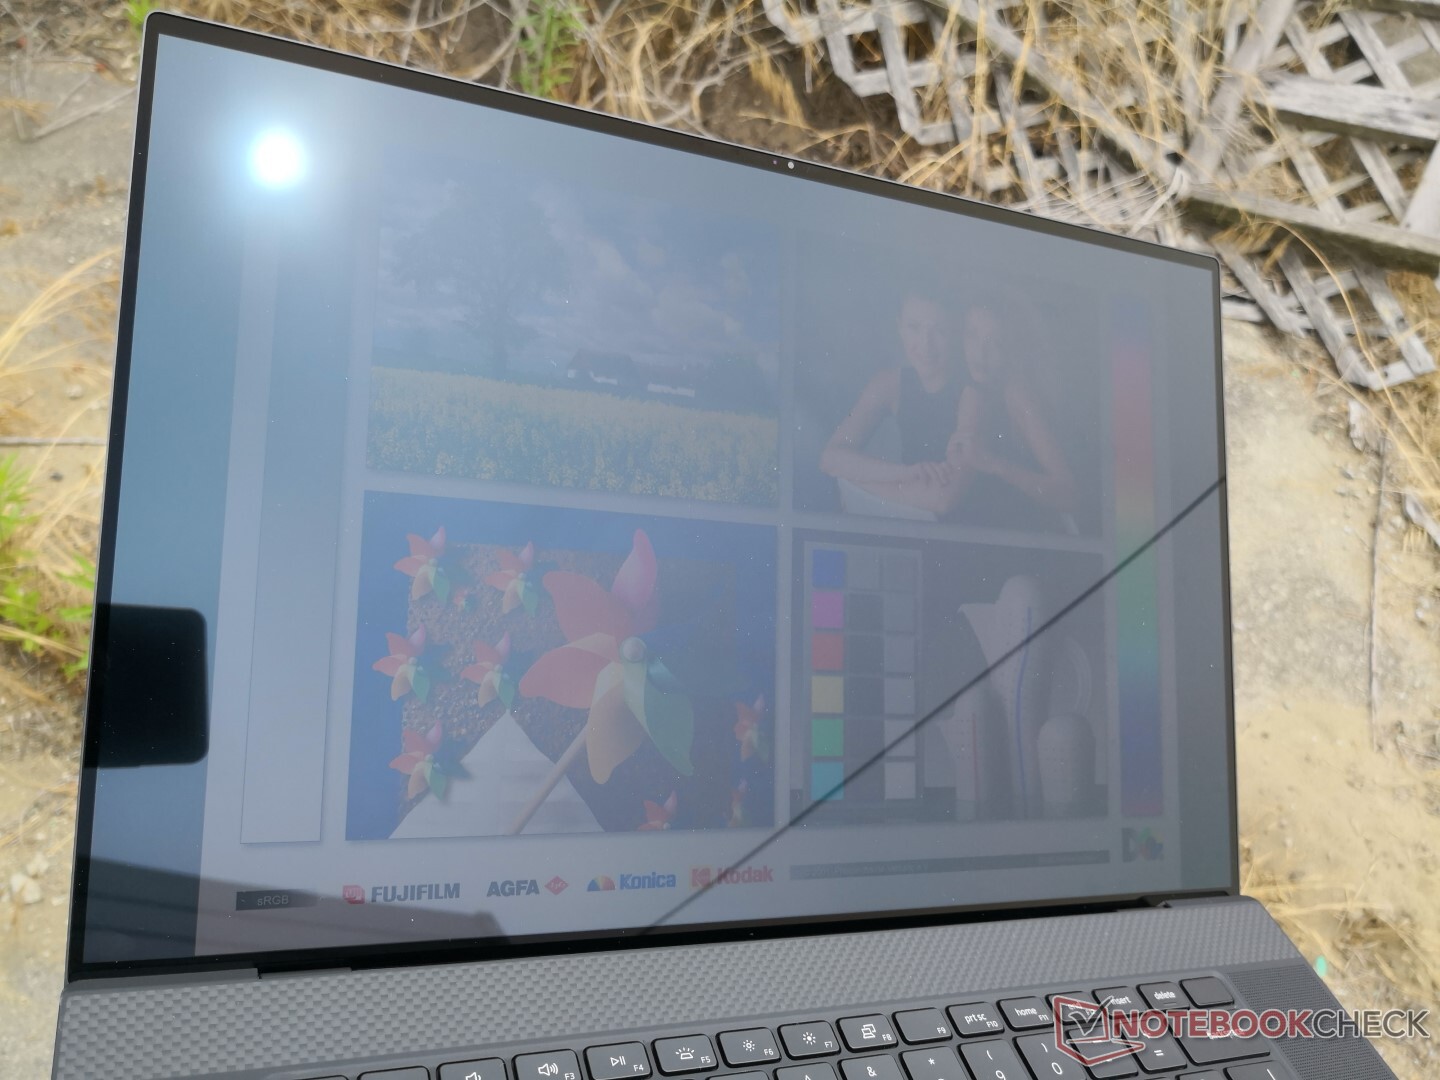
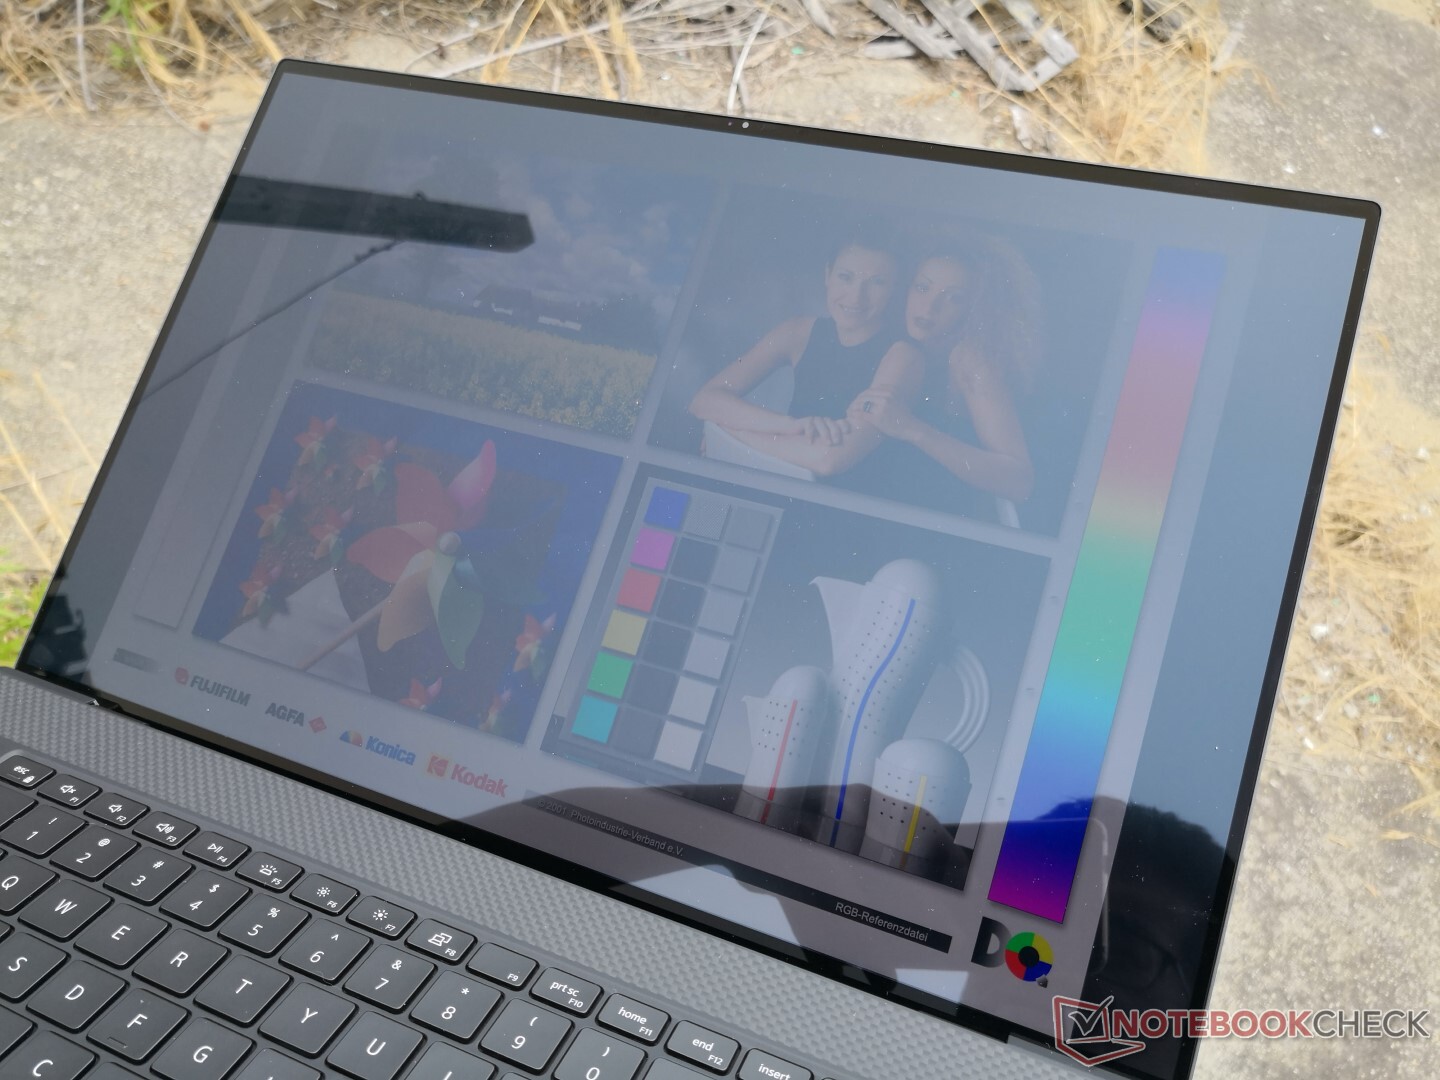
Parlak ekrandan biraz parlama olsa bile, dış mekan görünürlüğü gölgede iken tolere edilebilir. Şaşılıktan kaçınmak için parlaklığı maksimuma ayarlamanızı ve yazı tipi ölçeğini artırmanızı öneririz. Doğrudan güneş ışığı renkleri yıkayacaktır ve bundan kaçınılmalıdır.


Performans - Şimdi GeForce RTX 2060 Max-Q Seçenekleriyle
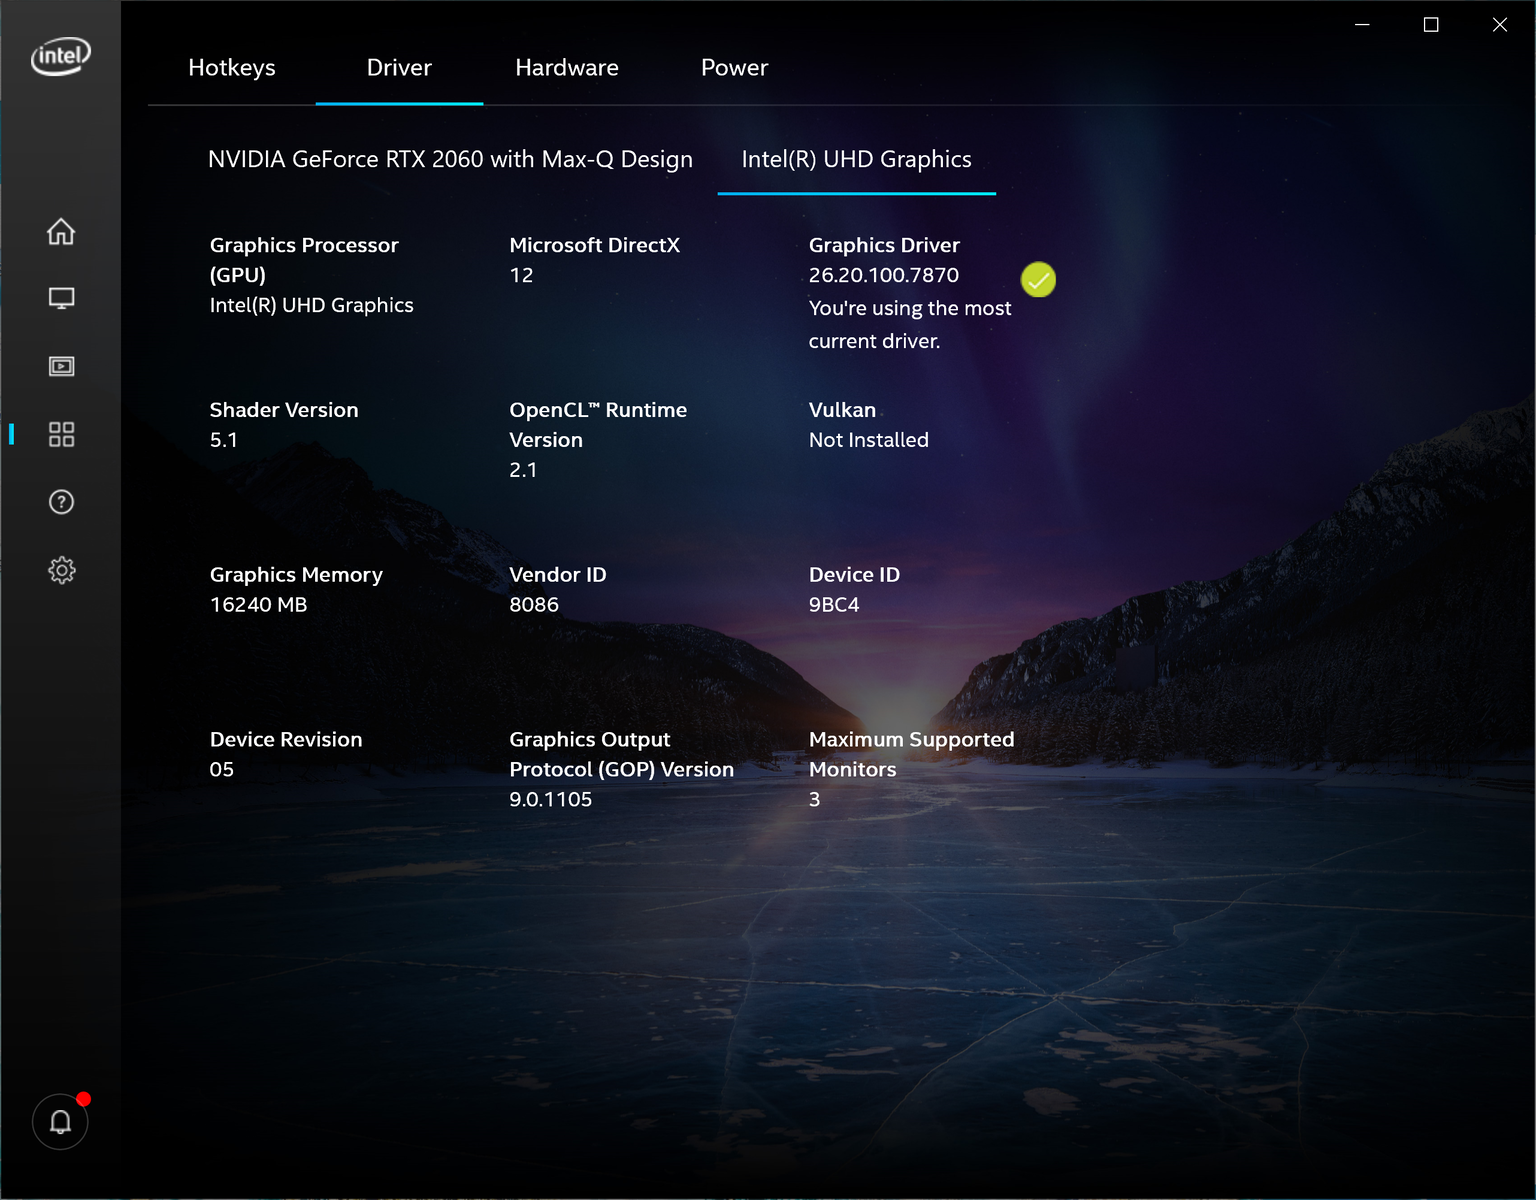
XPS 15'e çok benzeyen Dell, XPS 17 ile hem multimedya kullanıcılarını hem de yüksek performanslı kullanıcıları hedefliyor. Sistemi sadece okul çalışması, göz atma veya video için kullanmak isteyen kullanıcılar, daha talepkar kullanıcılar olarak Core i5 UHD grafik SKU'su ile gidebilir Core i7 ve ayrık GeForce GTX 1650 Ti veya RTX 2060 Max-Q ile yapılandırabilir. Dell, Core i9 seçeneklerinin yakın gelecekte geleceğini söylüyor, ancak planlanan Ryzen seçeneğinin olmadığı bir serseri. RAM 64 GB-2933'e kadar genişletilebilirken, NVIDIA Optimus GeForce yapılandırmamızla standart olarak geliyor. Aşağıdaki tüm karşılaştırmalar, mümkün olan en yüksek puanlar için Dell'in Ultra Performans modunda gerçekleştirildi.
İşlemci
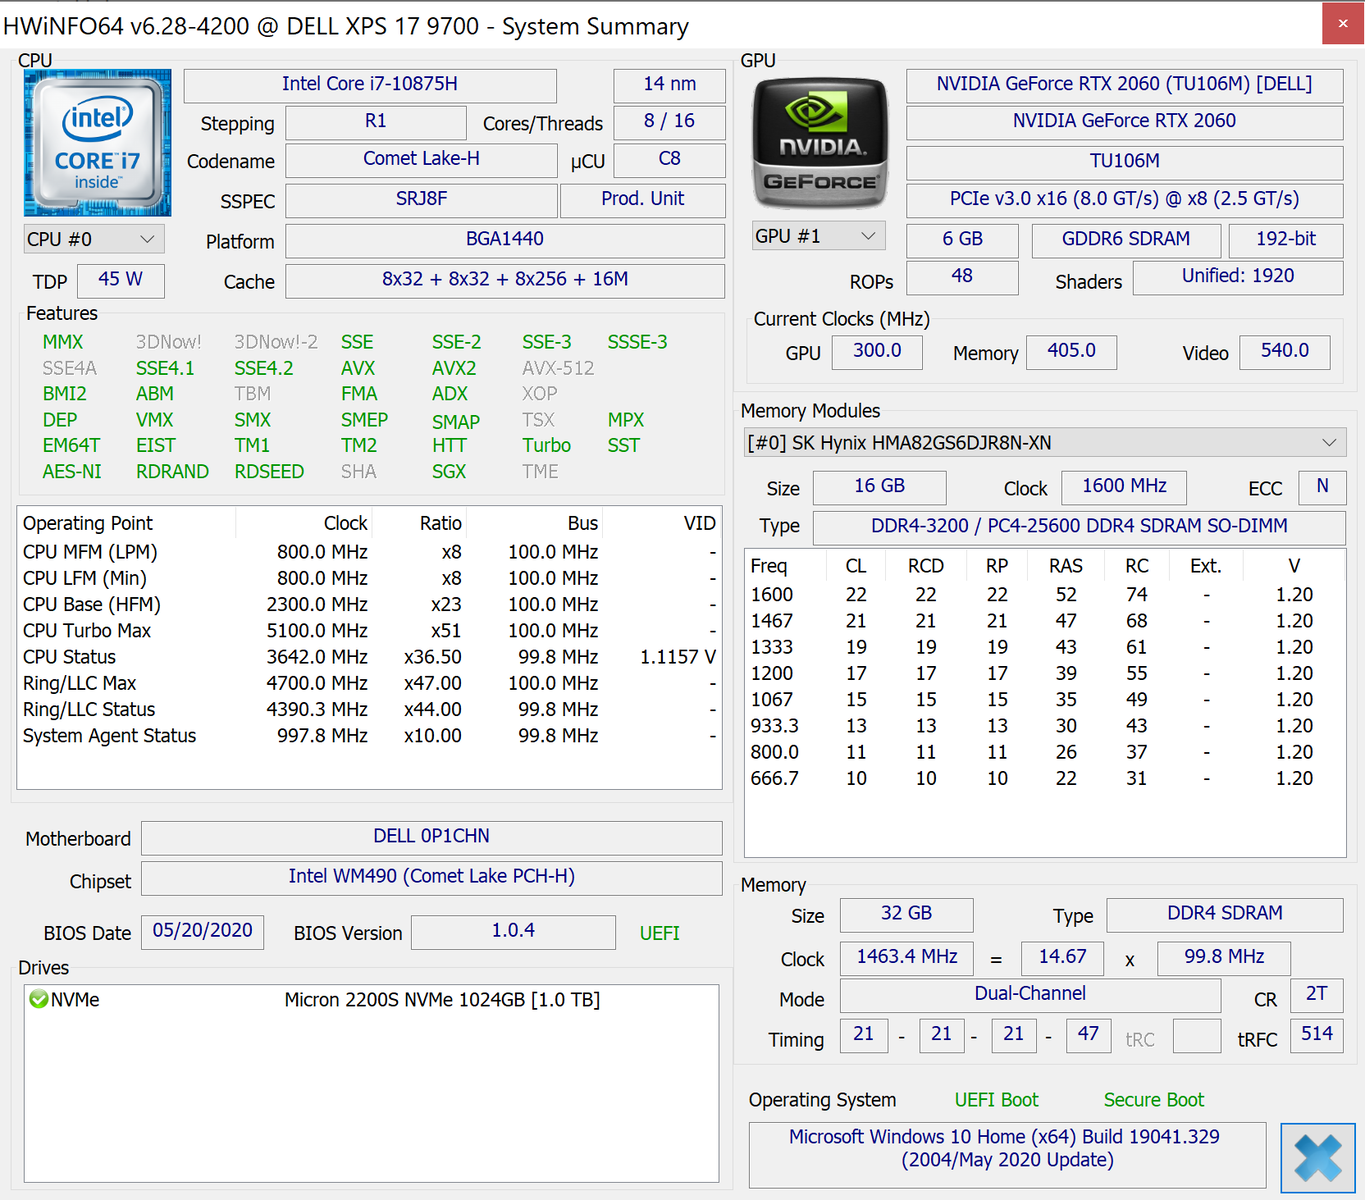
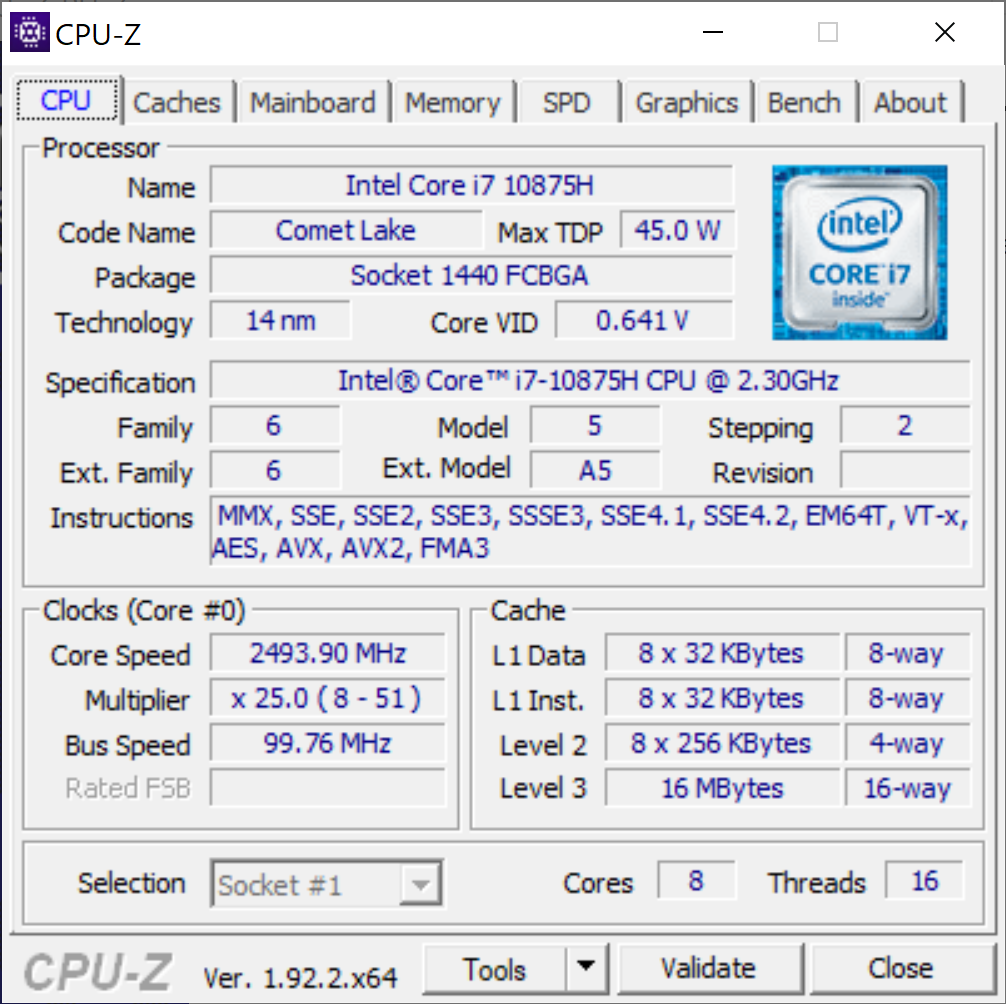
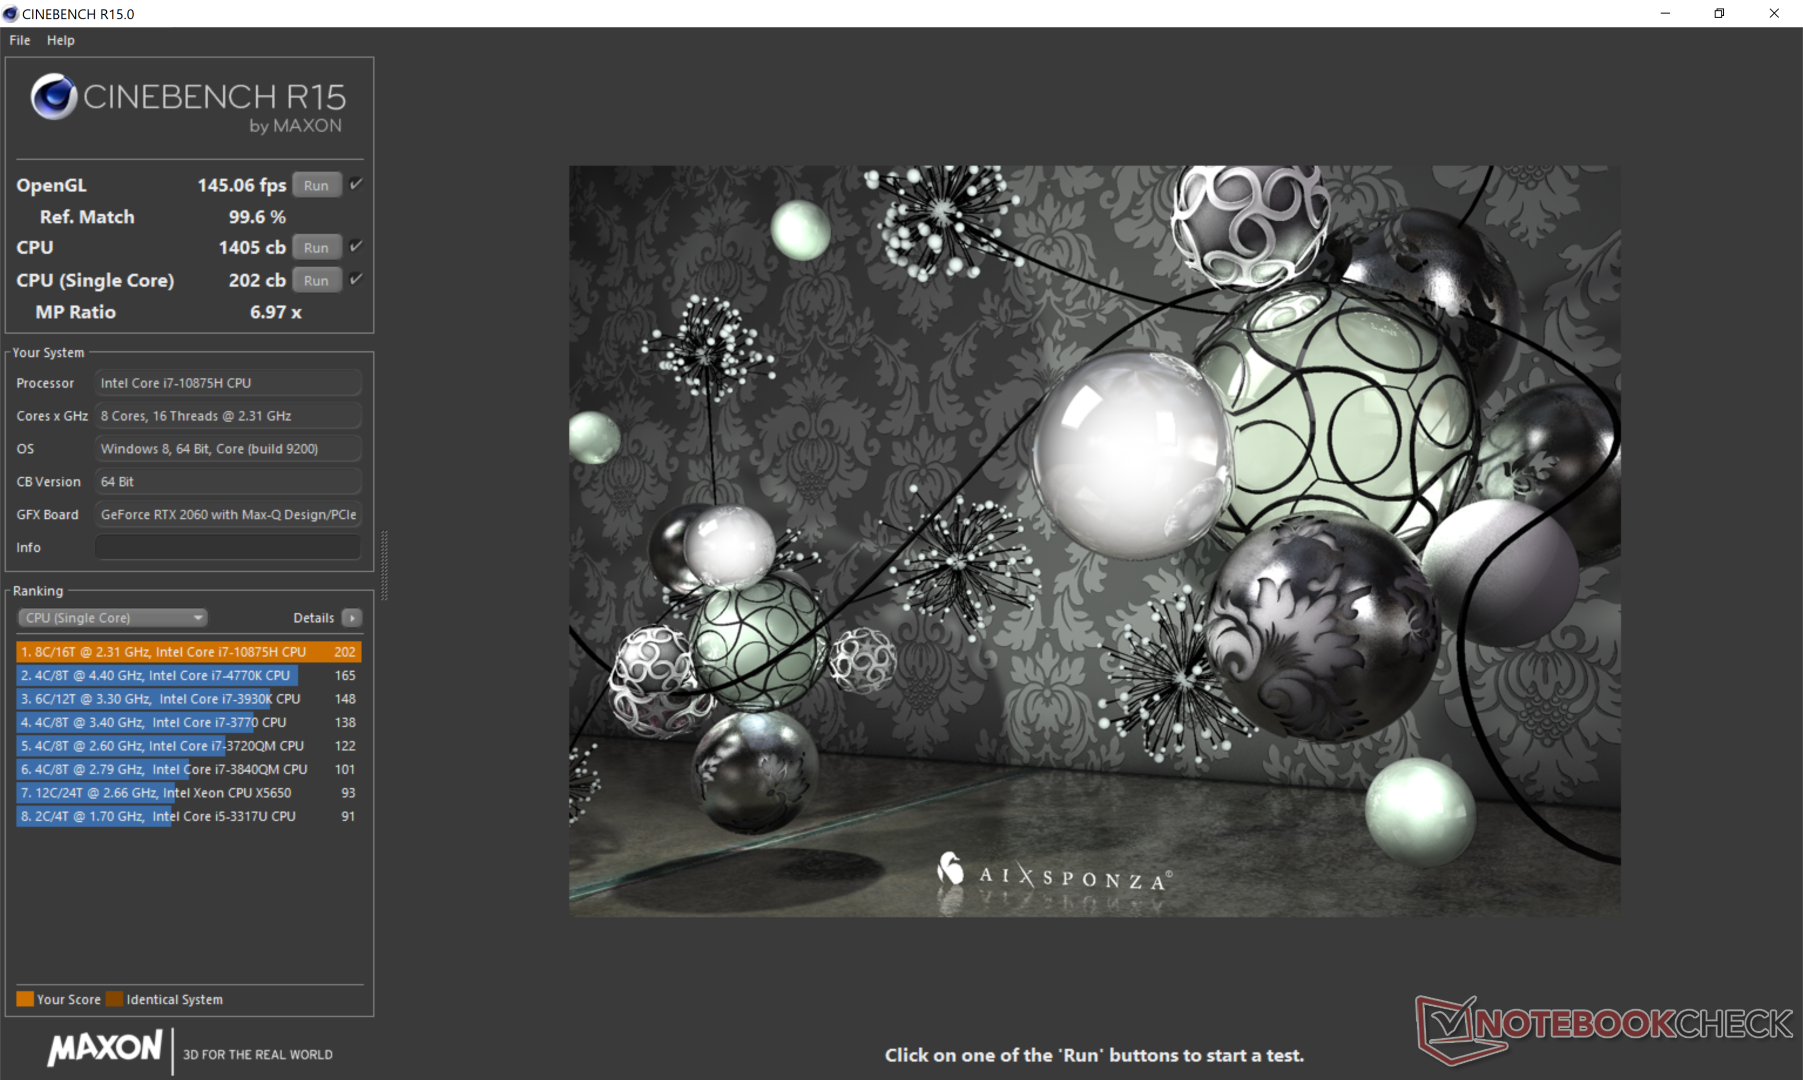
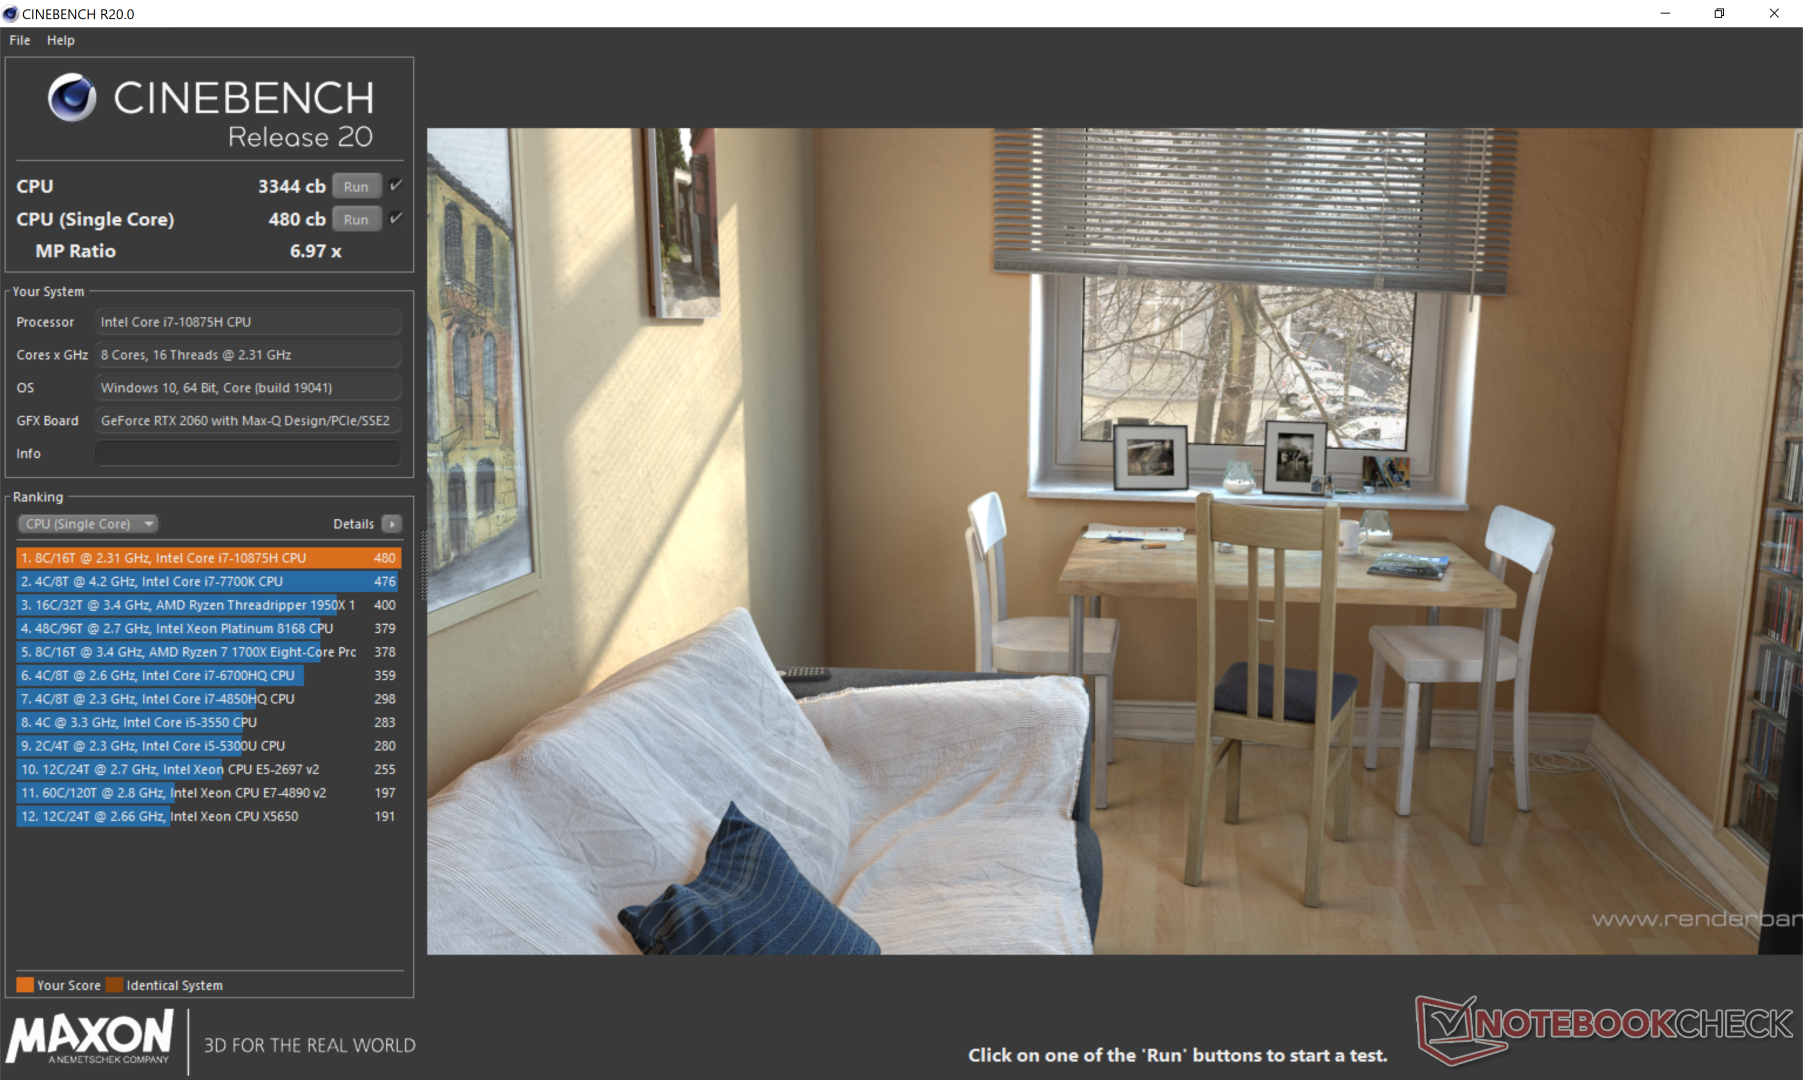
CPU performansı esasen Razer Blade Pro 17 ile aynıdır, ancak hepsi aynı Core i7-10875H CPU ile donatılmış XPS 15 9500'den biraz daha hızlıdır. Alt uç Core i5-10300H seçeneğinden veya geçen yılki Core i7-9750H'den yükseltme, sırasıyla yaklaşık yüzde 60 ve yüzde 40 daha hızlı çok iş parçacığı performansını netleştirecektir. Eski Core i9-9880H'ye sahip Alienware m17 R2 veya MSI GE75 gibi daha kalın sistemler, daha yüksek sürdürülebilir saat hızları için daha büyük soğutma çözümlerine sahip olmaları nedeniyle Dell sistemimizden daha iyi performans gösterecektir. İ7-10875H'den i9-10980HK'ya atlamak muhtemelen XPS 15'te gözlemlediğimiz gibi çok az fayda sağlıyor. Daha fazla teknik bilgi ve karşılaştırma karşılaştırmaları için Core i7-10875H'deki özel sayfamıza bakın.
Cinebench R15: CPU Multi 64Bit | CPU Single 64Bit
Blender: v2.79 BMW27 CPU
7-Zip 18.03: 7z b 4 -mmt1 | 7z b 4
Geekbench 5.5: Single-Core | Multi-Core
HWBOT x265 Benchmark v2.2: 4k Preset
LibreOffice : 20 Documents To PDF
R Benchmark 2.5: Overall mean
| Cinebench R20 / CPU (Multi Core) | |
| MSI Bravo 17 A4DDR | |
| Asus Zephyrus G14 GA401IV | |
| Alienware m17 R2 P41E | |
| Asus Strix Scar 17 G732LXS | |
| MSI GE75 9SG | |
| Ortalama Intel Core i7-10875H (1986 - 4176, n=32) | |
| Dell XPS 17 9700 Core i7 RTX 2060 Max-Q | |
| Acer Nitro 5 AN515-44-R5FT | |
| MSI GE75 Raider 10SE-008US | |
| Dell G5 15 5590 | |
| Asus ROG Zephyrus S GX701GXR | |
| Dell XPS 15 9500 Core i5 | |
| Cinebench R20 / CPU (Single Core) | |
| Asus Zephyrus G14 GA401IV | |
| Asus Strix Scar 17 G732LXS | |
| Ortalama Intel Core i7-10875H (430 - 524, n=32) | |
| Dell XPS 17 9700 Core i7 RTX 2060 Max-Q | |
| MSI Bravo 17 A4DDR | |
| Alienware m17 R2 P41E | |
| MSI GE75 Raider 10SE-008US | |
| Dell XPS 15 9500 Core i5 | |
| MSI GE75 9SG | |
| Acer Nitro 5 AN515-44-R5FT | |
| Asus ROG Zephyrus S GX701GXR | |
| Dell G5 15 5590 | |
| Cinebench R15 / CPU Multi 64Bit | |
| MSI Bravo 17 A4DDR | |
| Asus Zephyrus G14 GA401IV | |
| Alienware m17 R2 P41E | |
| Asus Strix Scar 17 G732LXS | |
| MSI GE75 9SG | |
| Ortalama Intel Core i7-10875H (1003 - 1833, n=38) | |
| Dell XPS 17 9700 Core i7 RTX 2060 Max-Q | |
| Acer Nitro 5 AN515-44-R5FT | |
| MSI GE75 Raider 10SE-008US | |
| Dell G5 15 5590 | |
| Asus ROG Zephyrus S GX701GXR | |
| Dell XPS 15 9500 Core i5 | |
| Cinebench R15 / CPU Single 64Bit | |
| Ortalama Intel Core i7-10875H (190 - 220, n=37) | |
| Asus Strix Scar 17 G732LXS | |
| Dell XPS 17 9700 Core i7 RTX 2060 Max-Q | |
| Alienware m17 R2 P41E | |
| Asus Zephyrus G14 GA401IV | |
| MSI GE75 9SG | |
| MSI Bravo 17 A4DDR | |
| MSI GE75 Raider 10SE-008US | |
| Dell XPS 15 9500 Core i5 | |
| Acer Nitro 5 AN515-44-R5FT | |
| Asus ROG Zephyrus S GX701GXR | |
| Dell G5 15 5590 | |
| Blender / v2.79 BMW27 CPU | |
| Dell XPS 15 9500 Core i5 | |
| MSI GE75 Raider 10SE-008US | |
| Acer Nitro 5 AN515-44-R5FT | |
| Dell XPS 17 9700 Core i7 RTX 2060 Max-Q | |
| Ortalama Intel Core i7-10875H (259 - 535, n=30) | |
| Asus Zephyrus G14 GA401IV | |
| MSI GE75 9SG | |
| Asus Strix Scar 17 G732LXS | |
| MSI Bravo 17 A4DDR | |
| 7-Zip 18.03 / 7z b 4 -mmt1 | |
| Ortalama Intel Core i7-10875H (5071 - 5780, n=31) | |
| Asus Strix Scar 17 G732LXS | |
| Dell XPS 17 9700 Core i7 RTX 2060 Max-Q | |
| MSI GE75 Raider 10SE-008US | |
| MSI GE75 9SG | |
| Dell XPS 15 9500 Core i5 | |
| MSI Bravo 17 A4DDR | |
| Asus Zephyrus G14 GA401IV | |
| Acer Nitro 5 AN515-44-R5FT | |
| 7-Zip 18.03 / 7z b 4 | |
| MSI Bravo 17 A4DDR | |
| Asus Zephyrus G14 GA401IV | |
| MSI GE75 9SG | |
| Asus Strix Scar 17 G732LXS | |
| Ortalama Intel Core i7-10875H (29844 - 49562, n=31) | |
| Dell XPS 17 9700 Core i7 RTX 2060 Max-Q | |
| Acer Nitro 5 AN515-44-R5FT | |
| MSI GE75 Raider 10SE-008US | |
| Dell XPS 15 9500 Core i5 | |
| Geekbench 5.5 / Single-Core | |
| Dell XPS 17 9700 Core i7 RTX 2060 Max-Q | |
| Ortalama Intel Core i7-10875H (1233 - 1371, n=29) | |
| Asus Strix Scar 17 G732LXS | |
| MSI GE75 Raider 10SE-008US | |
| Asus Zephyrus G14 GA401IV | |
| MSI Bravo 17 A4DDR | |
| Dell XPS 15 9500 Core i5 | |
| Acer Nitro 5 AN515-44-R5FT | |
| Geekbench 5.5 / Multi-Core | |
| Asus Strix Scar 17 G732LXS | |
| MSI Bravo 17 A4DDR | |
| Dell XPS 17 9700 Core i7 RTX 2060 Max-Q | |
| Ortalama Intel Core i7-10875H (5715 - 8620, n=29) | |
| Asus Zephyrus G14 GA401IV | |
| MSI GE75 Raider 10SE-008US | |
| Acer Nitro 5 AN515-44-R5FT | |
| Dell XPS 15 9500 Core i5 | |
| HWBOT x265 Benchmark v2.2 / 4k Preset | |
| MSI Bravo 17 A4DDR | |
| Asus Strix Scar 17 G732LXS | |
| Asus Zephyrus G14 GA401IV | |
| MSI GE75 9SG | |
| Ortalama Intel Core i7-10875H (7.27 - 14.1, n=27) | |
| Dell XPS 17 9700 Core i7 RTX 2060 Max-Q | |
| MSI GE75 Raider 10SE-008US | |
| Acer Nitro 5 AN515-44-R5FT | |
| Dell XPS 15 9500 Core i5 | |
| LibreOffice / 20 Documents To PDF | |
| MSI Bravo 17 A4DDR | |
| Acer Nitro 5 AN515-44-R5FT | |
| Dell XPS 15 9500 Core i5 | |
| MSI GE75 Raider 10SE-008US | |
| Asus Strix Scar 17 G732LXS | |
| Ortalama Intel Core i7-10875H (30.2 - 84.3, n=30) | |
| Dell XPS 17 9700 Core i7 RTX 2060 Max-Q | |
| R Benchmark 2.5 / Overall mean | |
| Dell XPS 15 9500 Core i5 | |
| Acer Nitro 5 AN515-44-R5FT | |
| MSI GE75 Raider 10SE-008US | |
| Dell XPS 17 9700 Core i7 RTX 2060 Max-Q | |
| Ortalama Intel Core i7-10875H (0.546 - 0.662, n=29) | |
| Asus Strix Scar 17 G732LXS | |
| MSI Bravo 17 A4DDR | |
* ... daha küçük daha iyidir
Sistem performansı
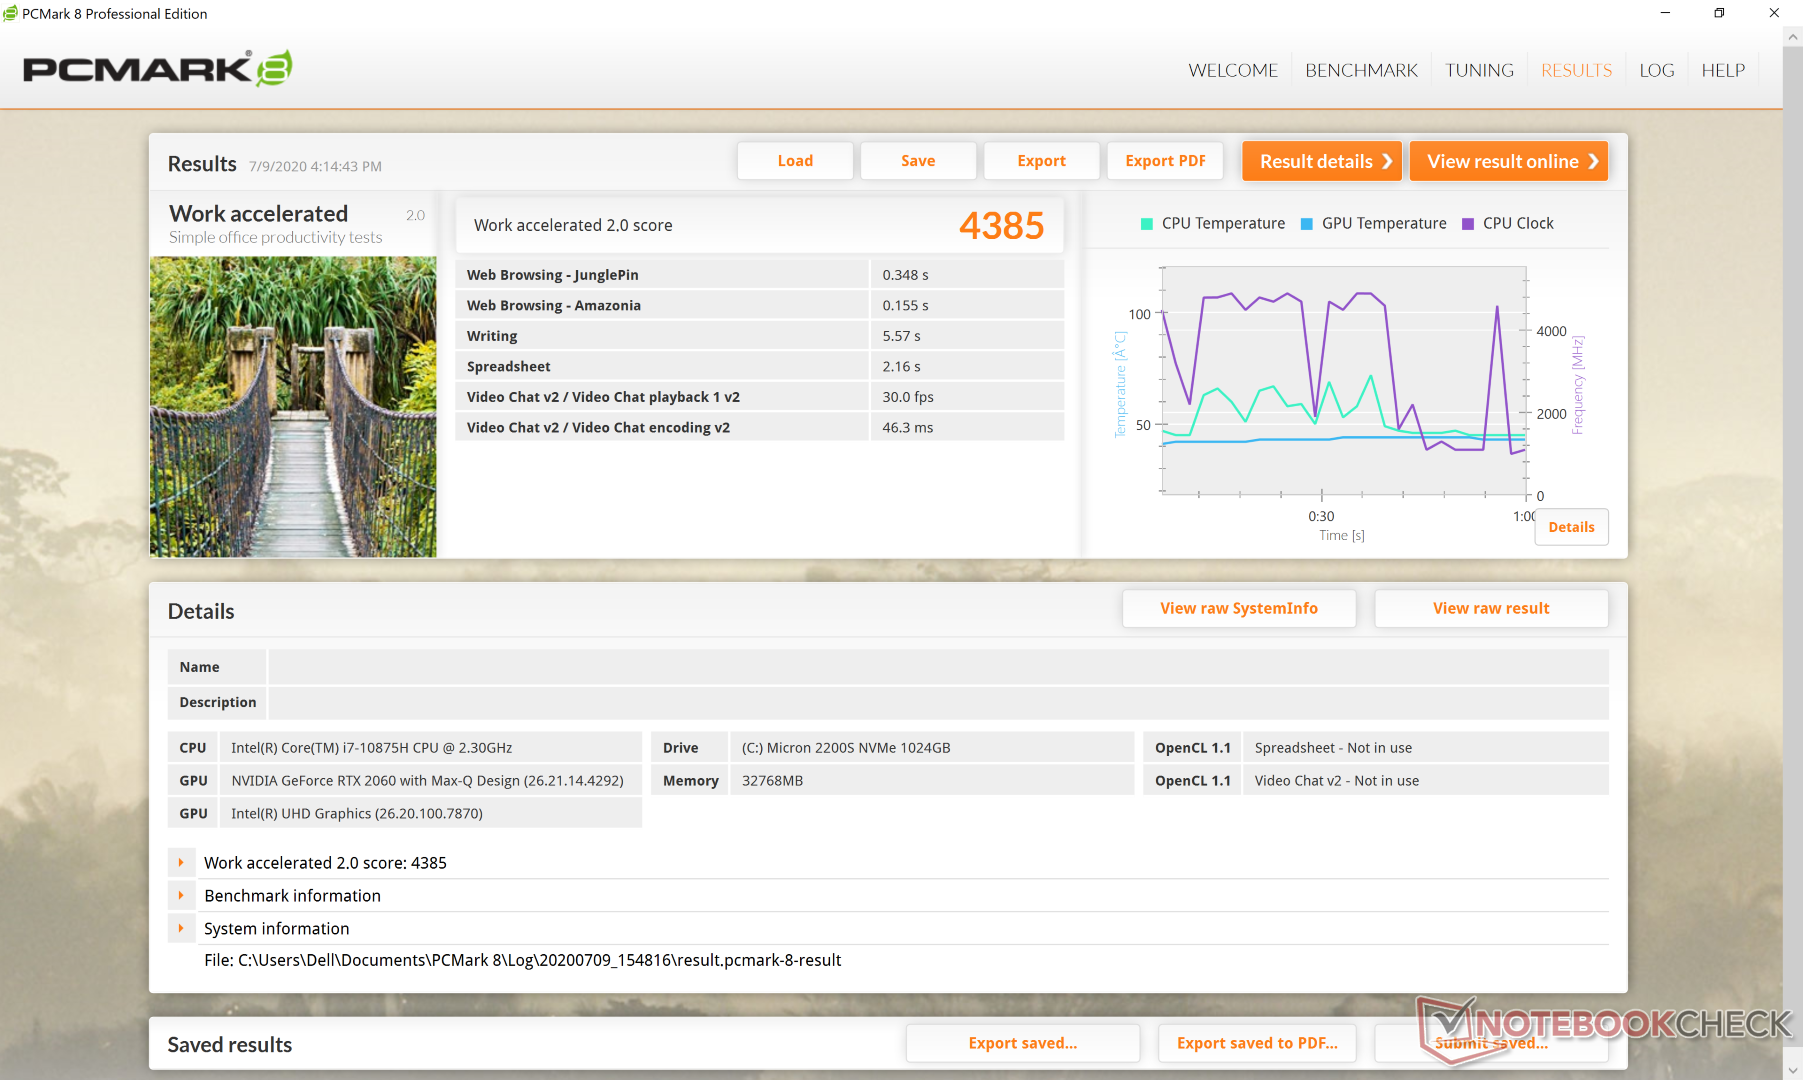
PCMark karşılaştırmaları, daha hızlı GPU nedeniyle çok daha yüksek Dijital Oluşturma skorumuz haricinde XPS 15 9500'ün tek haneli yüzde puanları içindedir. Ayarları, sistem performansını, pil ömrünü ve fan davranışını standart Windows güç profillerine göre daha yakından etkilediğinden, kullanıcıların önceden yüklenmiş Dell Power Manager uygulamasını tanımasını öneririz.


| PCMark 8 | |
| Home Score Accelerated v2 | |
| Razer Blade Pro 17 RTX 2070 Max-Q 300 Hz | |
| HP Envy 17t-cg000 | |
| Dell XPS 17 9700 Core i7 RTX 2060 Max-Q | |
| Work Score Accelerated v2 | |
| Razer Blade Pro 17 RTX 2070 Max-Q 300 Hz | |
| HP Envy 17t-cg000 | |
| Dell XPS 17 9700 Core i7 RTX 2060 Max-Q | |
| PCMark 8 Home Score Accelerated v2 | 3649 puan | |
| PCMark 8 Work Score Accelerated v2 | 4385 puan | |
| PCMark 10 Score | 5672 puan | |
Yardım | ||
DPC Gecikmesi
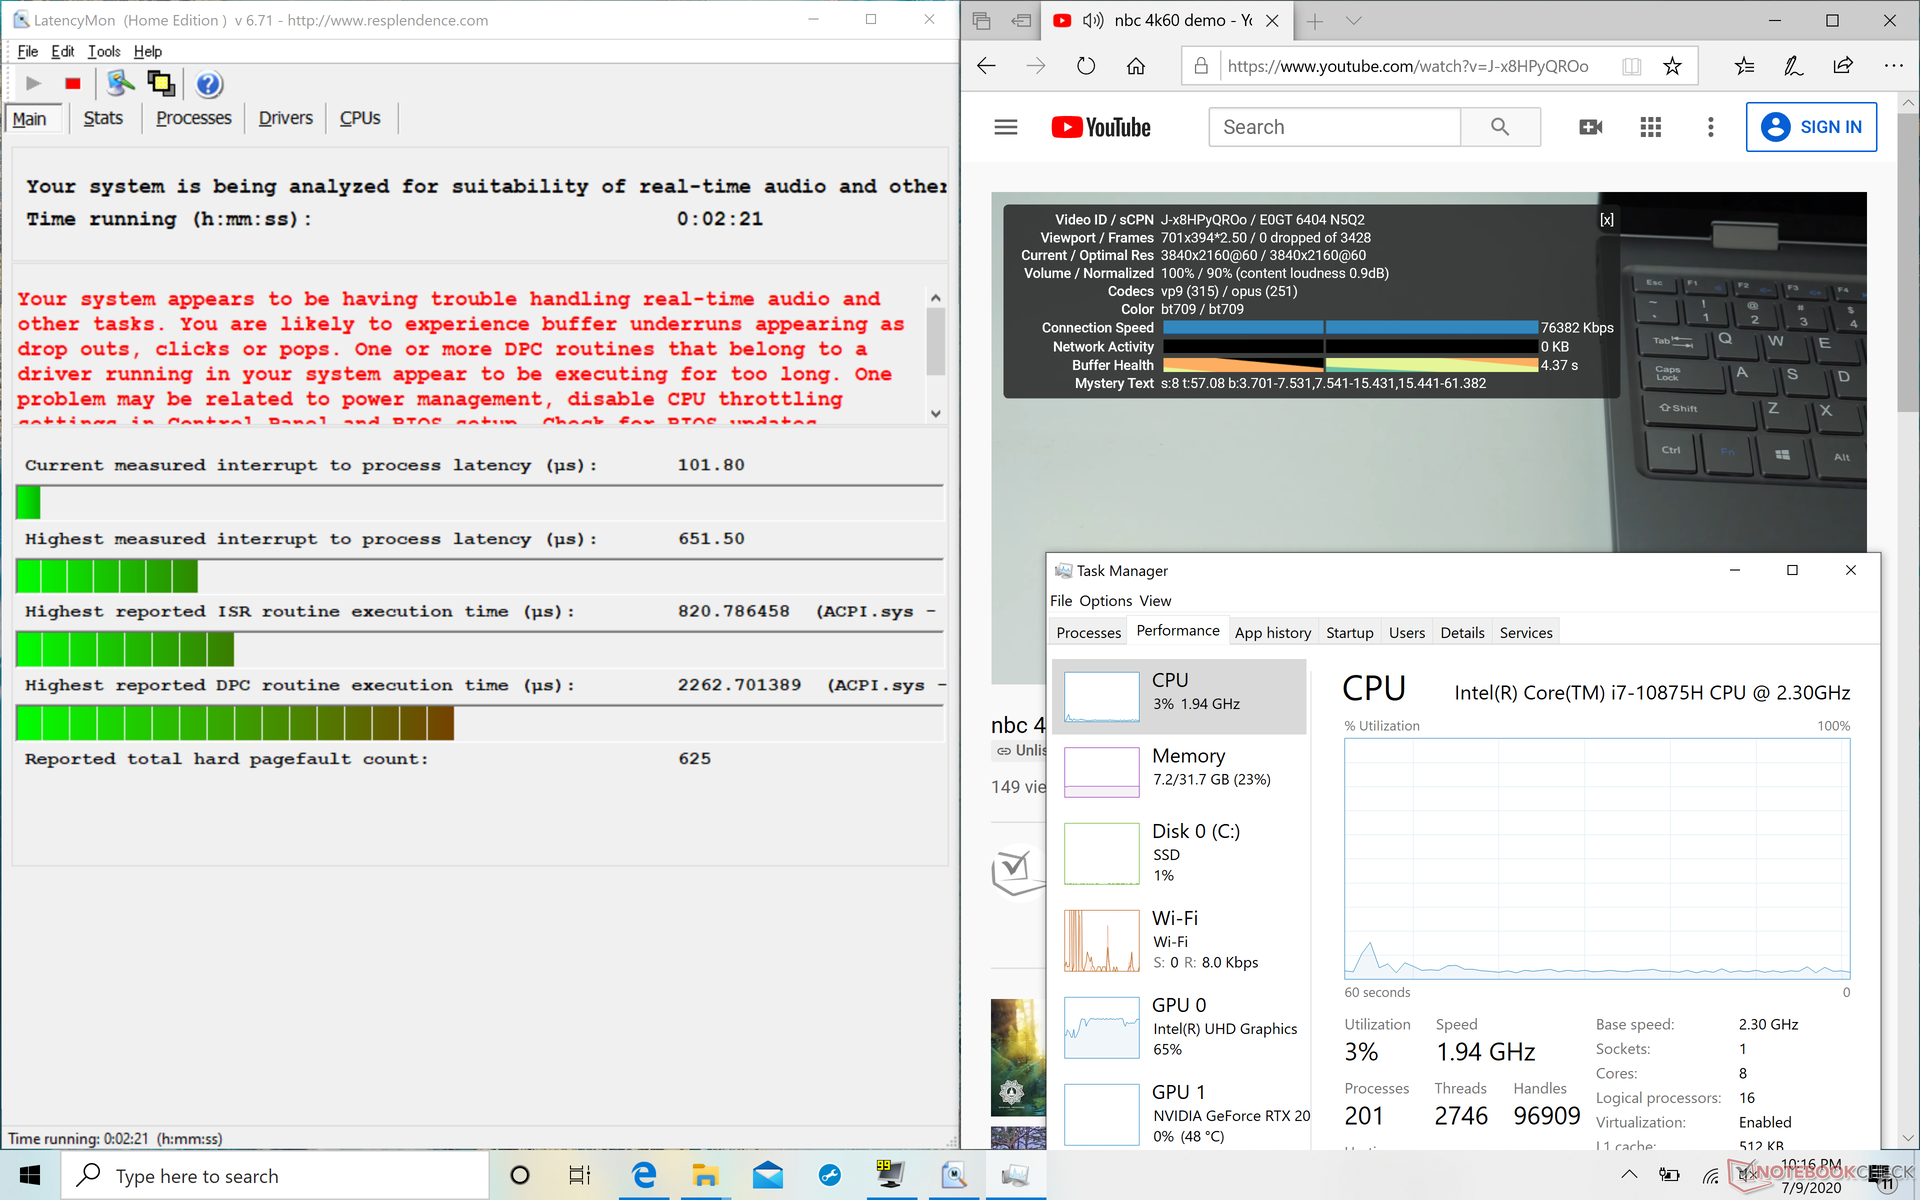
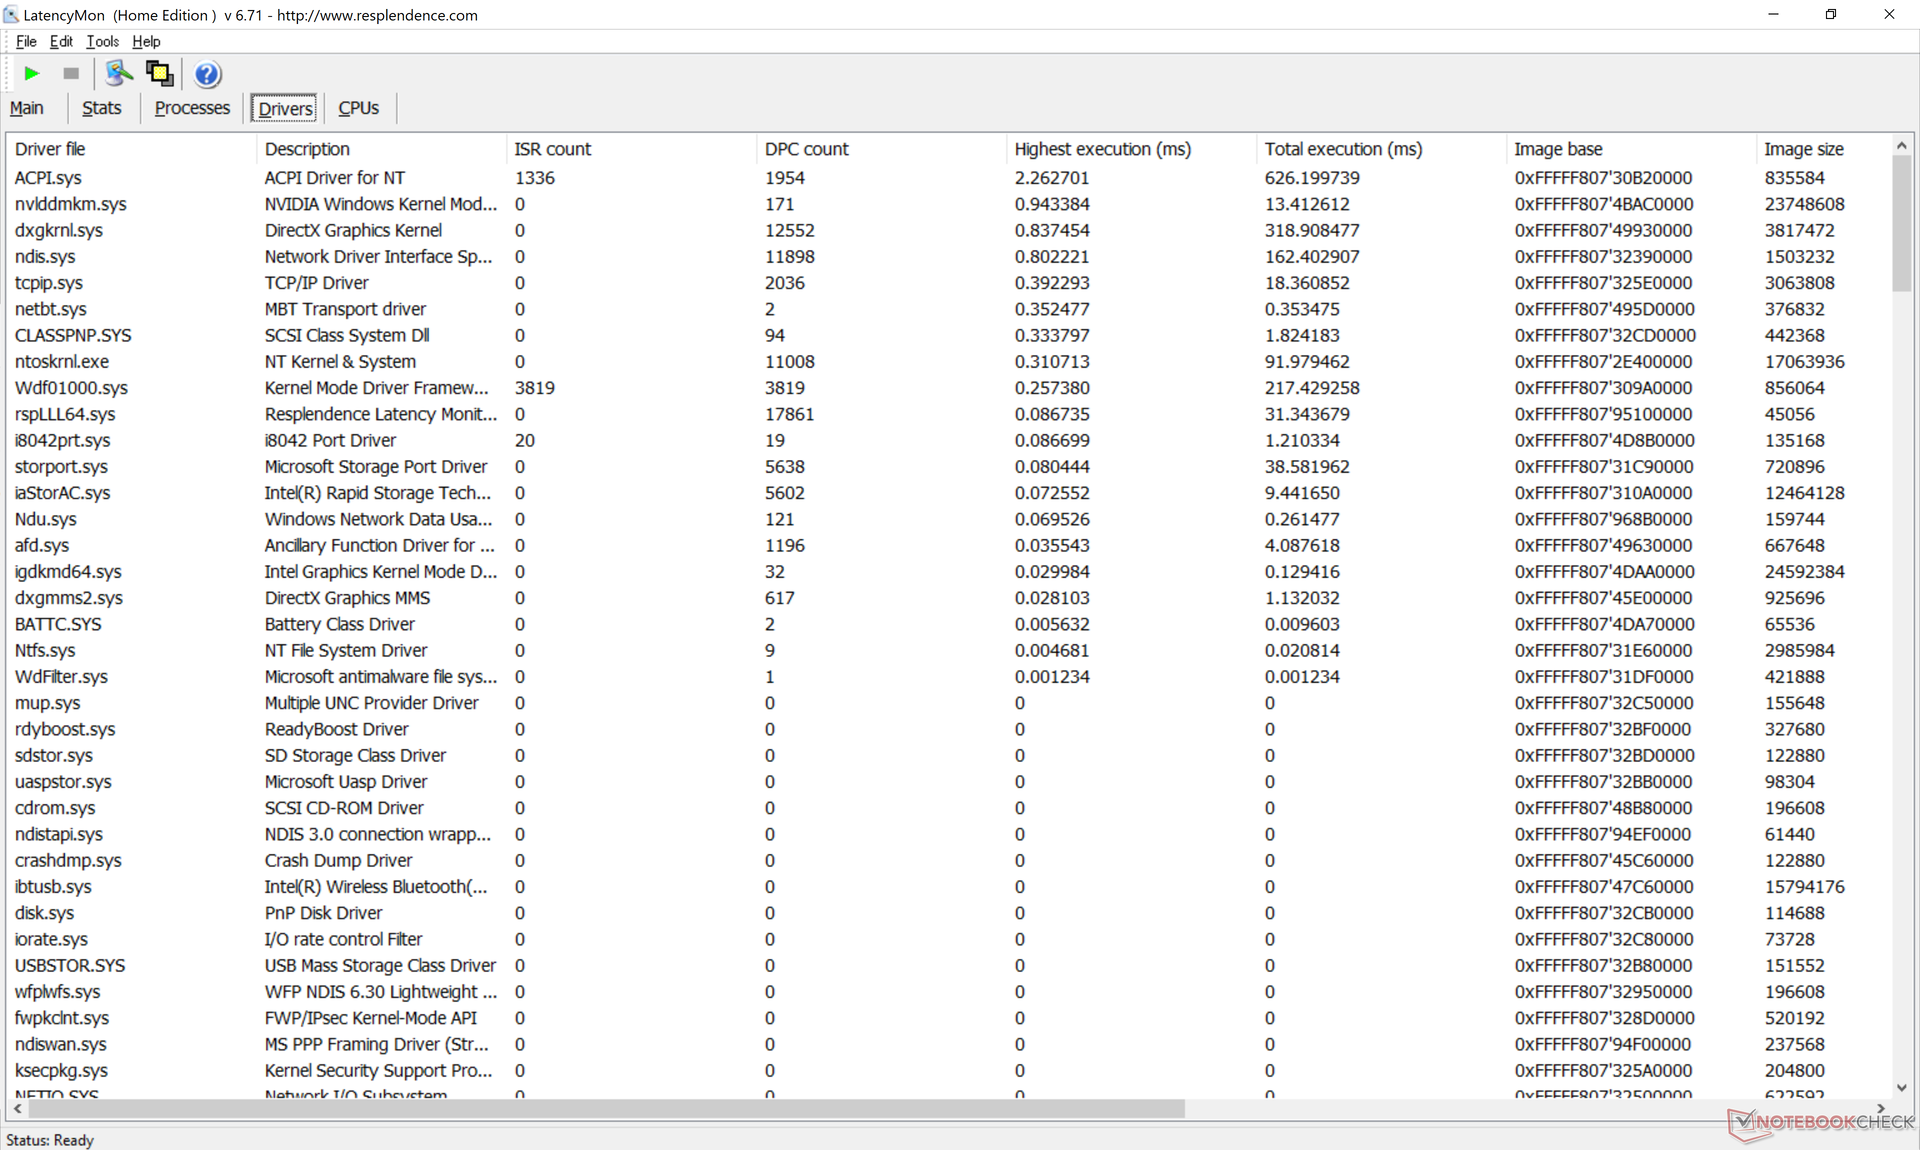
LatencyMon, kesme süreleri kısa olsa da ACPI.sys dosyasının neden olduğu yüksek yürütme sürelerini gösterir. 4K video oynatımı, aksi takdirde pürüzsüzdür ve kaydedilmiş kare kaydedilmez.
| DPC Latencies / LatencyMon - interrupt to process latency (max), Web, Youtube, Prime95 | |
| HP Envy 17t-cg000 | |
| Gigabyte Aero 17 HDR XB | |
| Razer Blade Pro 17 RTX 2070 Max-Q 300 Hz | |
| MSI Creator 17 A10SGS | |
| Dell XPS 17 9700 Core i7 RTX 2060 Max-Q | |
| Asus Zephyrus S17 GX701LXS | |
* ... daha küçük daha iyidir
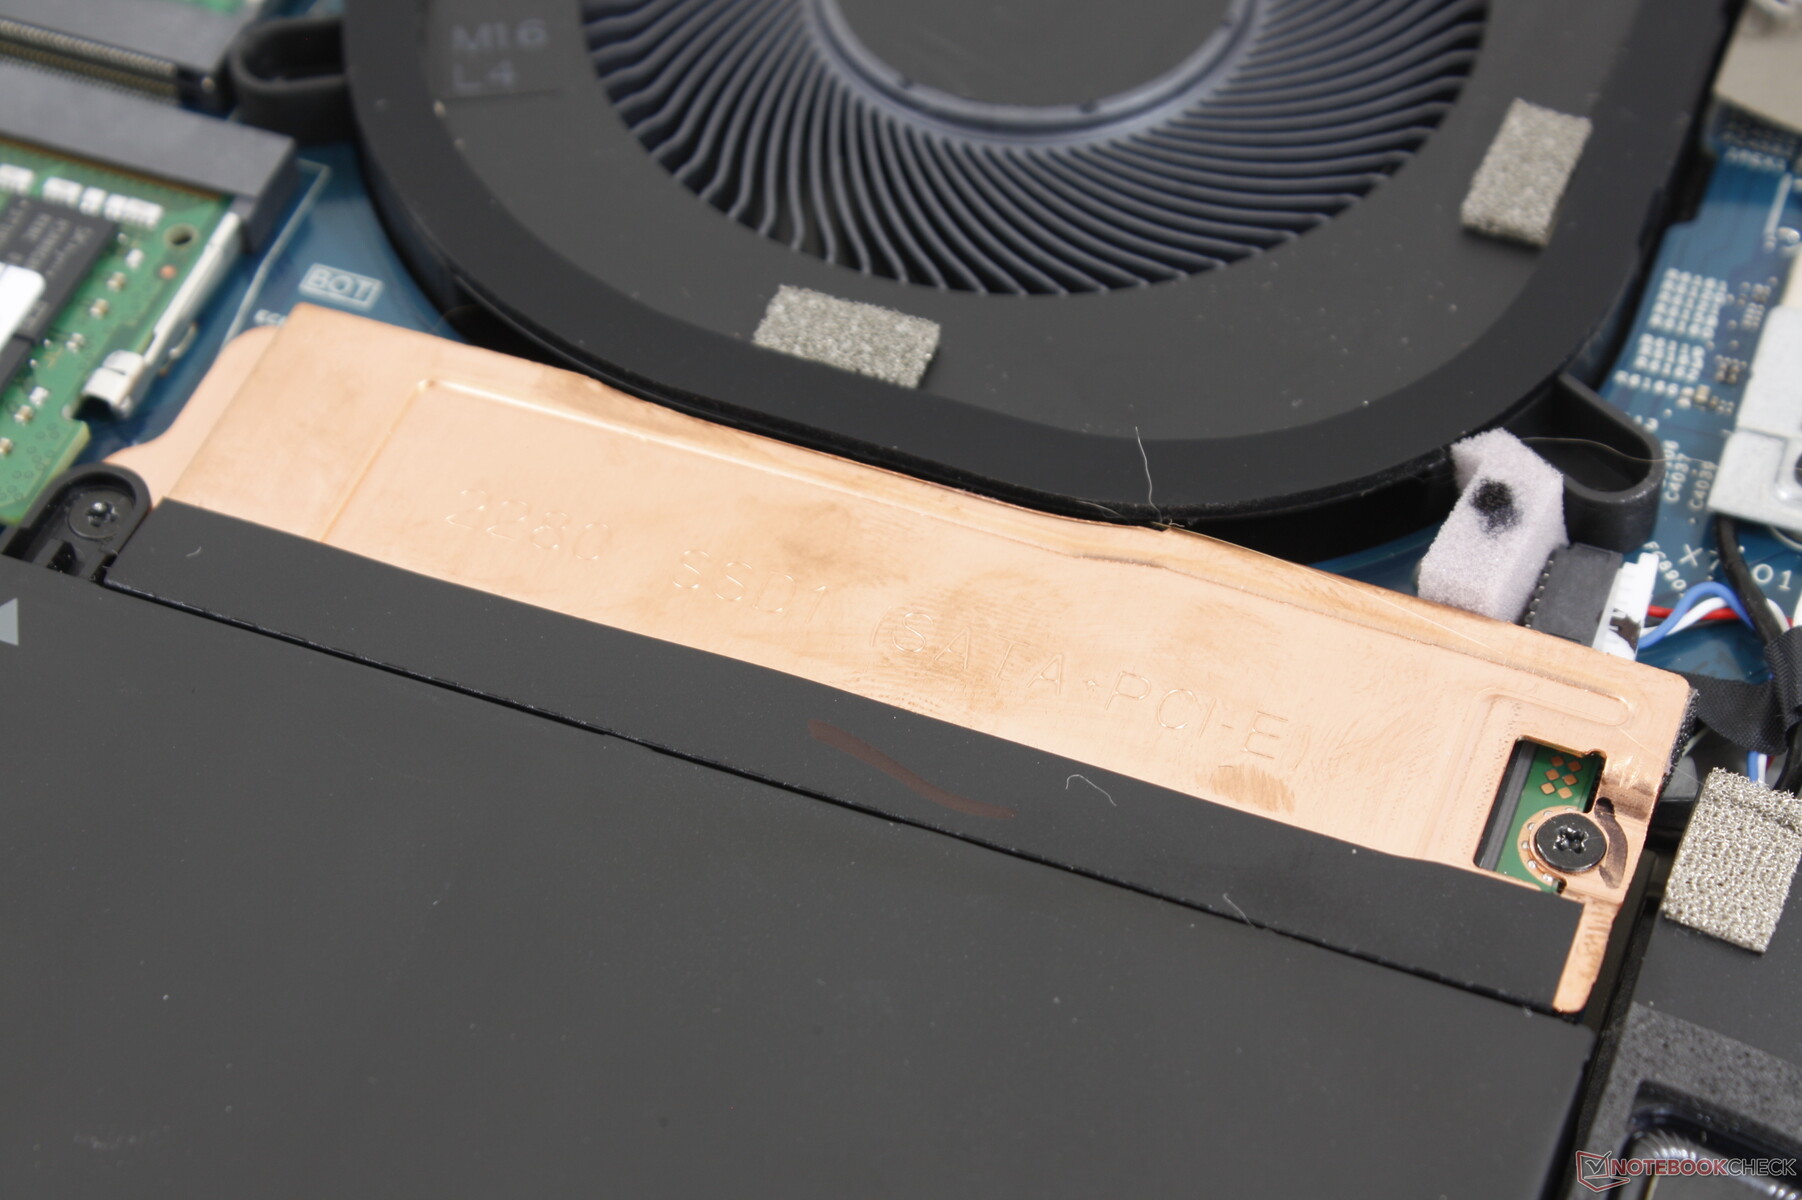
Depolama aygıtları
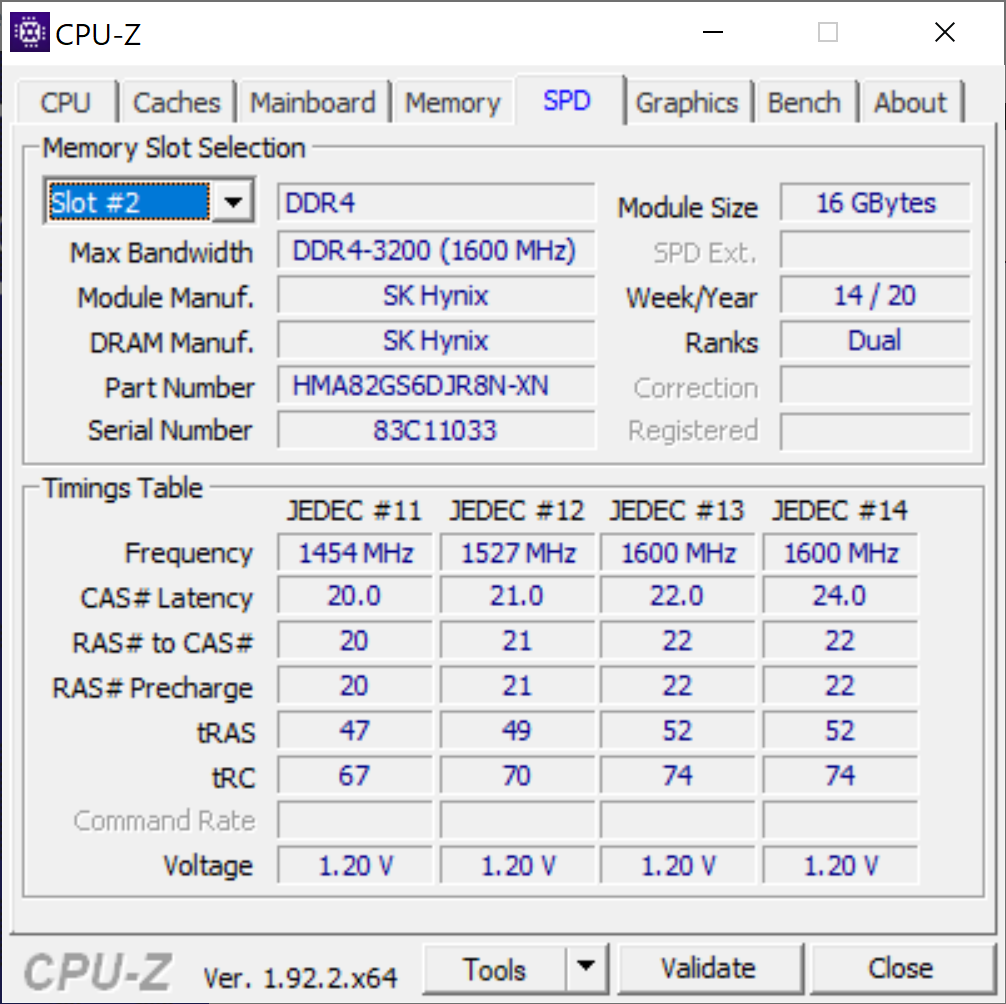
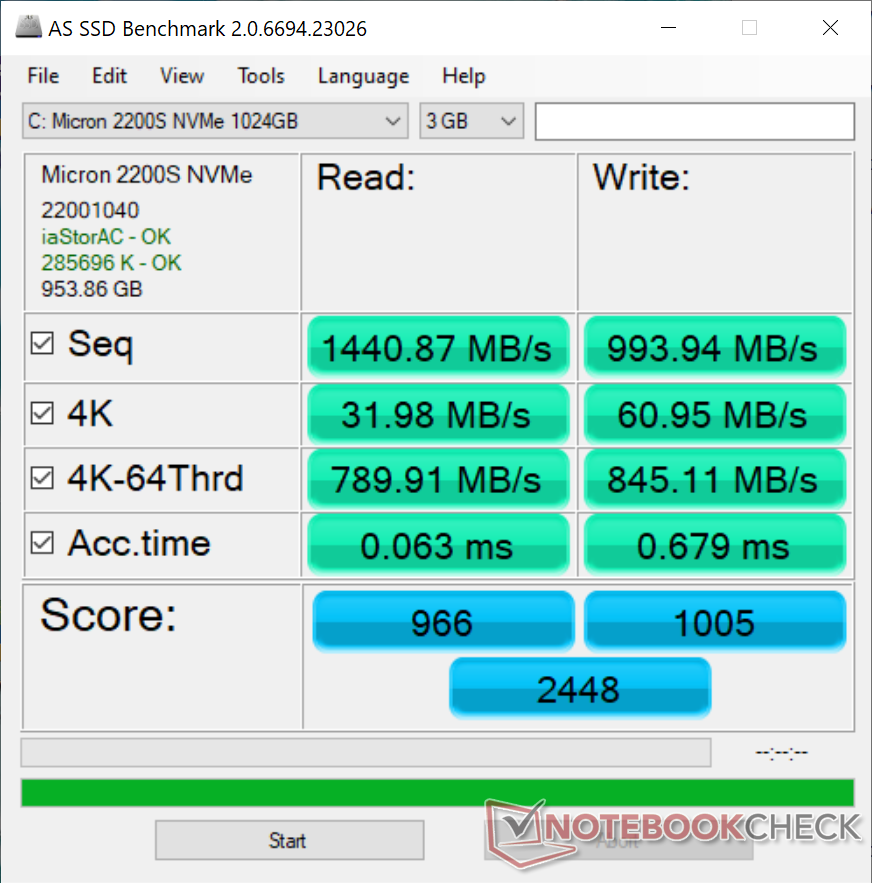
İki dahili M.2 2280 depolama yuvası, biri SATA'yı destekleyen PCIe SSD'leri de destekler. Dell, SSD'leri bir avuç OEM'den alıyor, bu nedenle önceki XPS sistemlerindeki deneyimimize dayanarak Micron, SK Hynix, Toshiba ve Intel arasında bir kumar. Ünitemizdeki 1 TB Micron 2200S, 1 TB Samsung PM981'in hızlarına ulaşmış gibi görünmese bile hala hızlıdır.

| Dell XPS 17 9700 Core i7 RTX 2060 Max-Q Micron 2200S 1TB MTFDHBA1T0TCK | Razer Blade Pro 17 RTX 2070 Max-Q 300 Hz Lite-On CA5-8D512 | HP Envy 17t-cg000 WDC PC SN520 SDAPNUW-512G | Gigabyte Aero 17 HDR XB Samsung SSD PM981a MZVLB512HBJQ | Apple MacBook Pro 16 2019 i9 5500M Apple SSD AP1024 7171 | Asus ProArt StudioBook Pro 17 W700G3T Samsung SSD PM981 MZVLB1T0HALR | |
|---|---|---|---|---|---|---|
| AS SSD | 19% | 20% | 79% | 39% | 104% | |
| Seq Read (MB/s) | 1141 | 2019 77% | 1161 2% | 1762 54% | 2531 122% | 2958 159% |
| Seq Write (MB/s) | 994 | 1314 32% | 809 -19% | 2309 132% | 2289 130% | 2350 136% |
| 4K Read (MB/s) | 31.98 | 46.61 46% | 40.63 27% | 49.45 55% | 15.85 -50% | 56.6 77% |
| 4K Write (MB/s) | 61 | 90.2 48% | 138.6 127% | 117.1 92% | 39.88 -35% | 106.1 74% |
| 4K-64 Read (MB/s) | 790 | 665 -16% | 857 8% | 1237 57% | 1267 60% | 1836 132% |
| 4K-64 Write (MB/s) | 845 | 813 -4% | 1041 23% | 1986 135% | 1749 107% | 1789 112% |
| Access Time Read * (ms) | 0.063 | 0.058 8% | 0.067 -6% | 0.076 -21% | 0.122 -94% | 0.061 3% |
| Access Time Write * (ms) | 0.679 | 0.167 75% | 0.026 96% | 0.032 95% | 0.095 86% | 0.036 95% |
| Score Read (Points) | 966 | 913 -5% | 1013 5% | 1463 51% | 1536 59% | 2189 127% |
| Score Write (Points) | 1005 | 1034 3% | 1260 25% | 2334 132% | 2018 101% | 2130 112% |
| Score Total (Points) | 2448 | 2392 -2% | 2783 14% | 4581 87% | 4317 76% | 5411 121% |
| Copy ISO MB/s (MB/s) | 1732 | 1715 -1% | 1350 -22% | 1995 15% | ||
| Copy Program MB/s (MB/s) | 717 | 622 -13% | 766 7% | 584 -19% | ||
| Copy Game MB/s (MB/s) | 1343 | 1506 12% | 1190 -11% | 1135 -15% | ||
| CrystalDiskMark 5.2 / 6 | 48% | 11% | 53% | 22% | 53% | |
| Write 4K (MB/s) | 64.1 | 119 86% | 124.2 94% | 123.4 93% | 55.5 -13% | 147.6 130% |
| Read 4K (MB/s) | 39.93 | 51.9 30% | 46.11 15% | 45.59 14% | 16.21 -59% | 47.57 19% |
| Write Seq (MB/s) | 1191 | 2258 90% | 2320 95% | 1959 64% | 2222 87% | |
| Read Seq (MB/s) | 1418 | 2283 61% | 2013 42% | 1763 24% | 2543 79% | |
| Write 4K Q32T1 (MB/s) | 450.3 | 491 9% | 447 -1% | 489.3 9% | 398.5 -12% | 459.2 2% |
| Read 4K Q32T1 (MB/s) | 365 | 540 48% | 350.1 -4% | 559 53% | 648 78% | 515 41% |
| Write Seq Q32T1 (MB/s) | 1563 | 2253 44% | 1463 -6% | 2979 91% | 2727 74% | 2167 39% |
| Read Seq Q32T1 (MB/s) | 2683 | 3172 18% | 1751 -35% | 3432 28% | 3242 21% | 3430 28% |
| Write 4K Q8T8 (MB/s) | 445.5 | |||||
| Read 4K Q8T8 (MB/s) | 926 | |||||
| Toplam Ortalama (Program / Ayarlar) | 34% /
29% | 16% /
17% | 66% /
68% | 31% /
33% | 79% /
83% |
* ... daha küçük daha iyidir

Disk Throttling: DiskSpd Read Loop, Queue Depth 8
GPU Performansı - Oyun Özellikli, ancak Oyun Optimum Değil
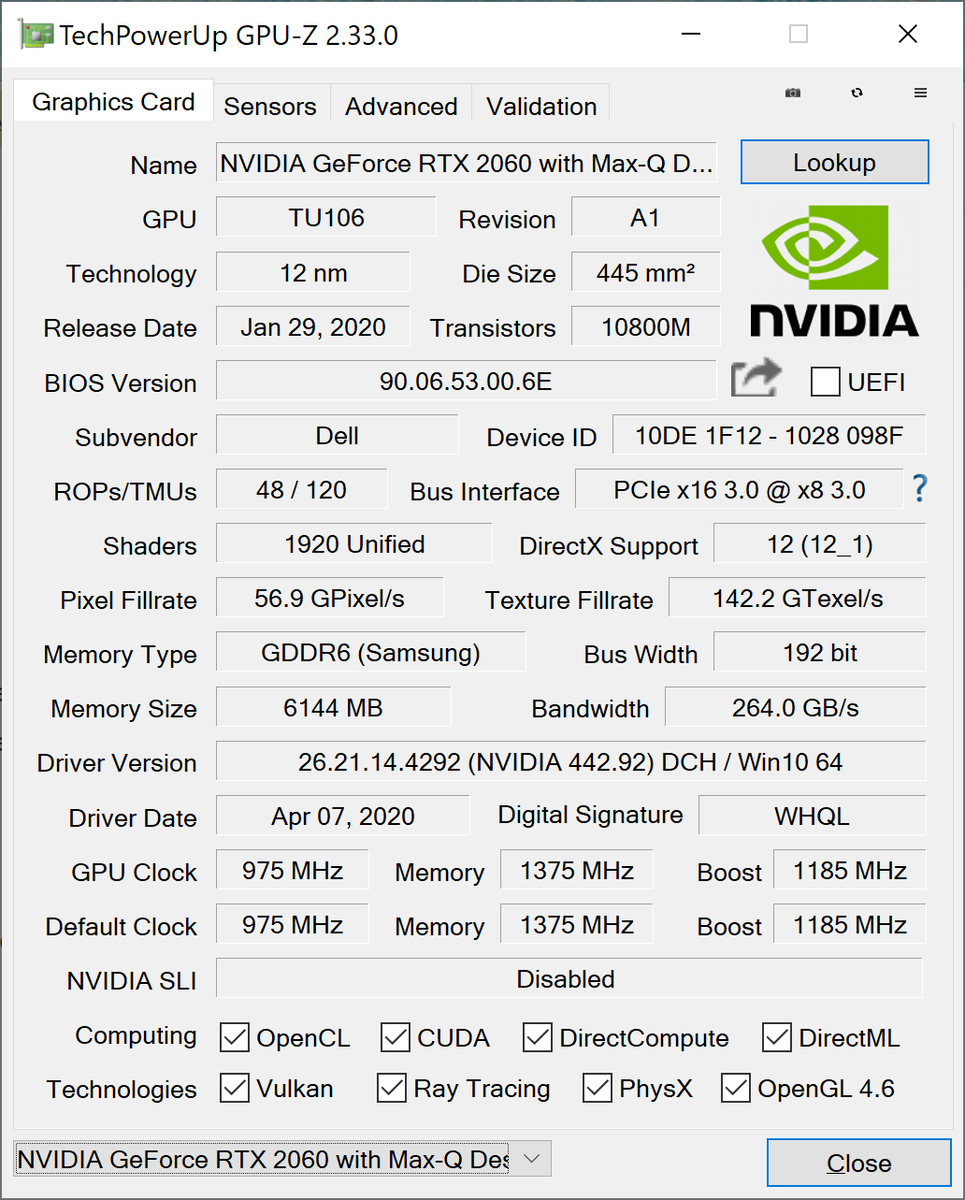
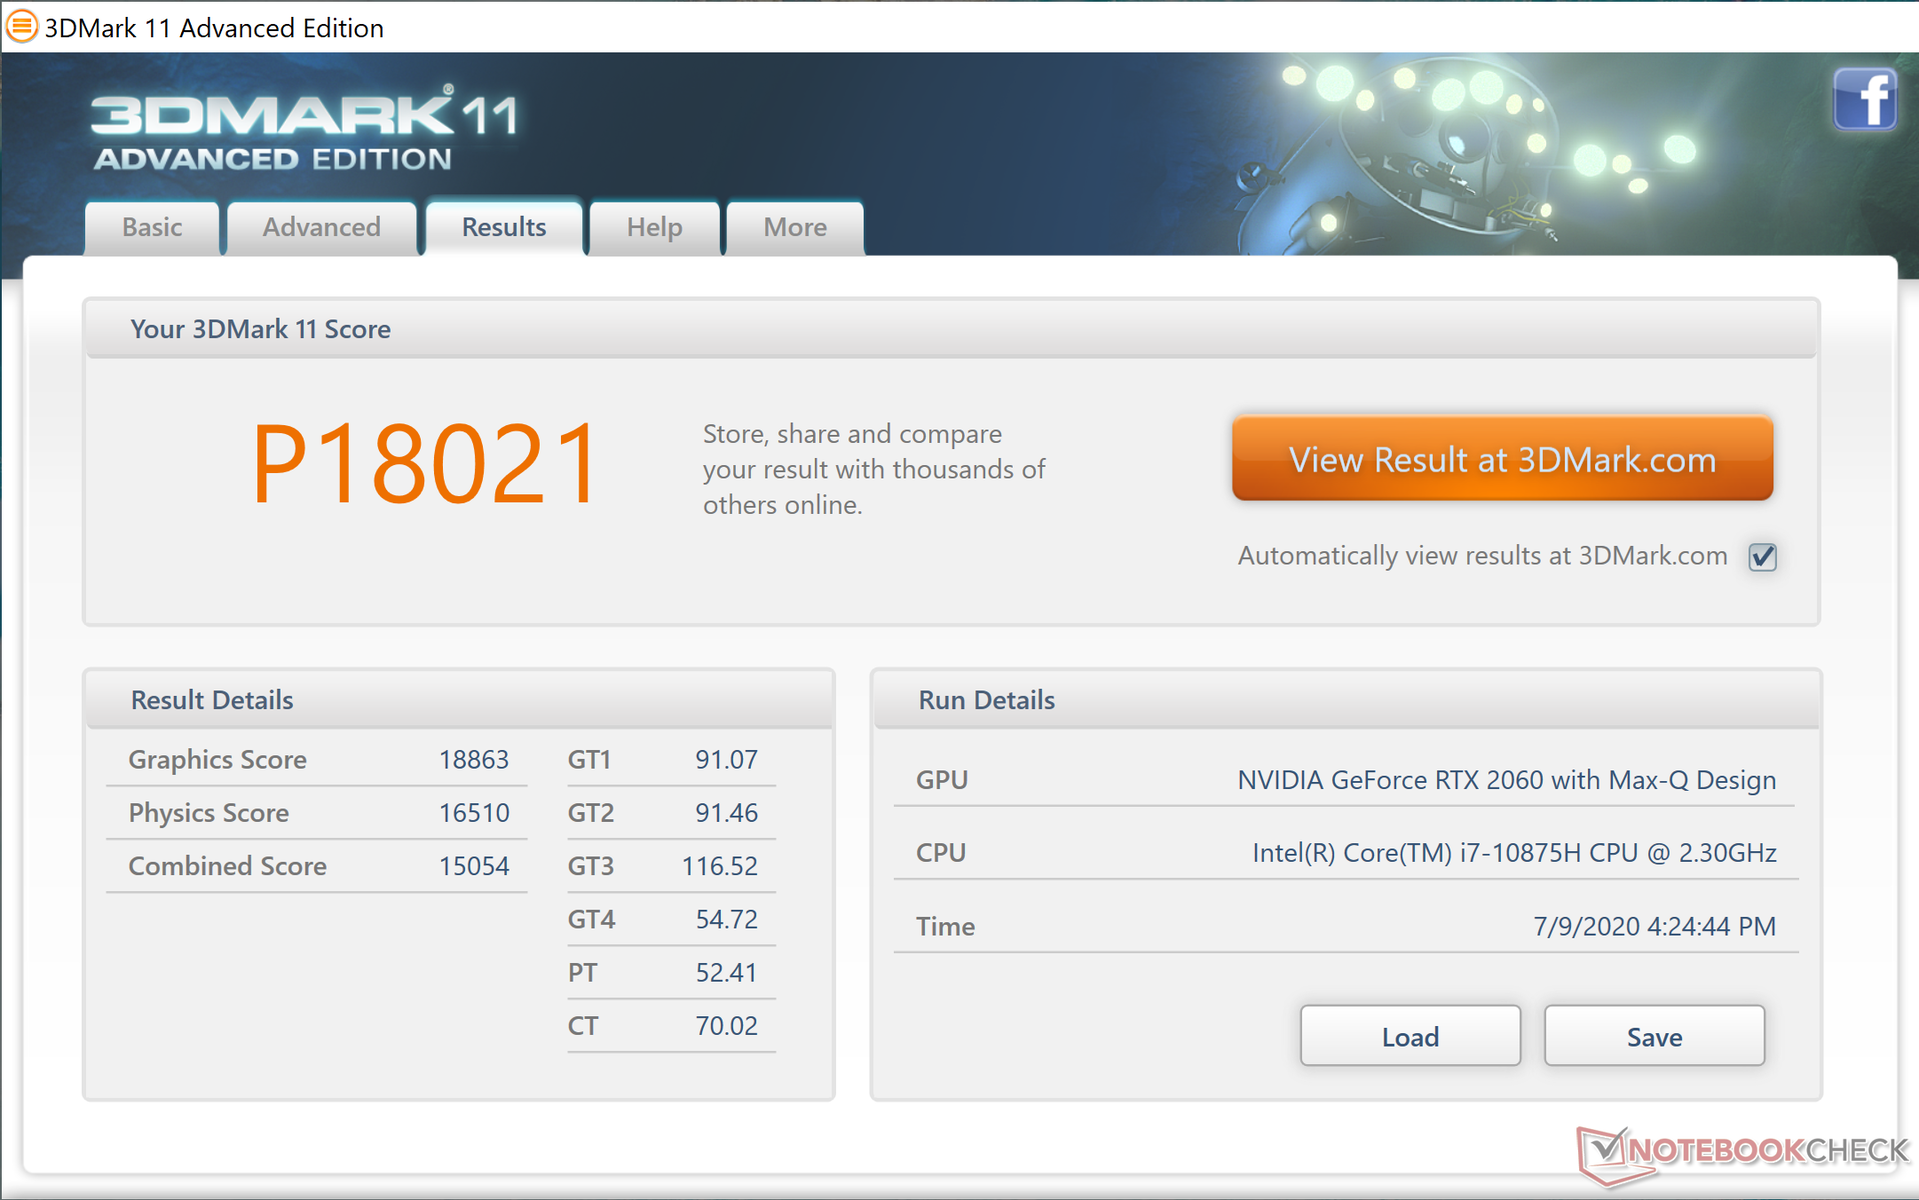
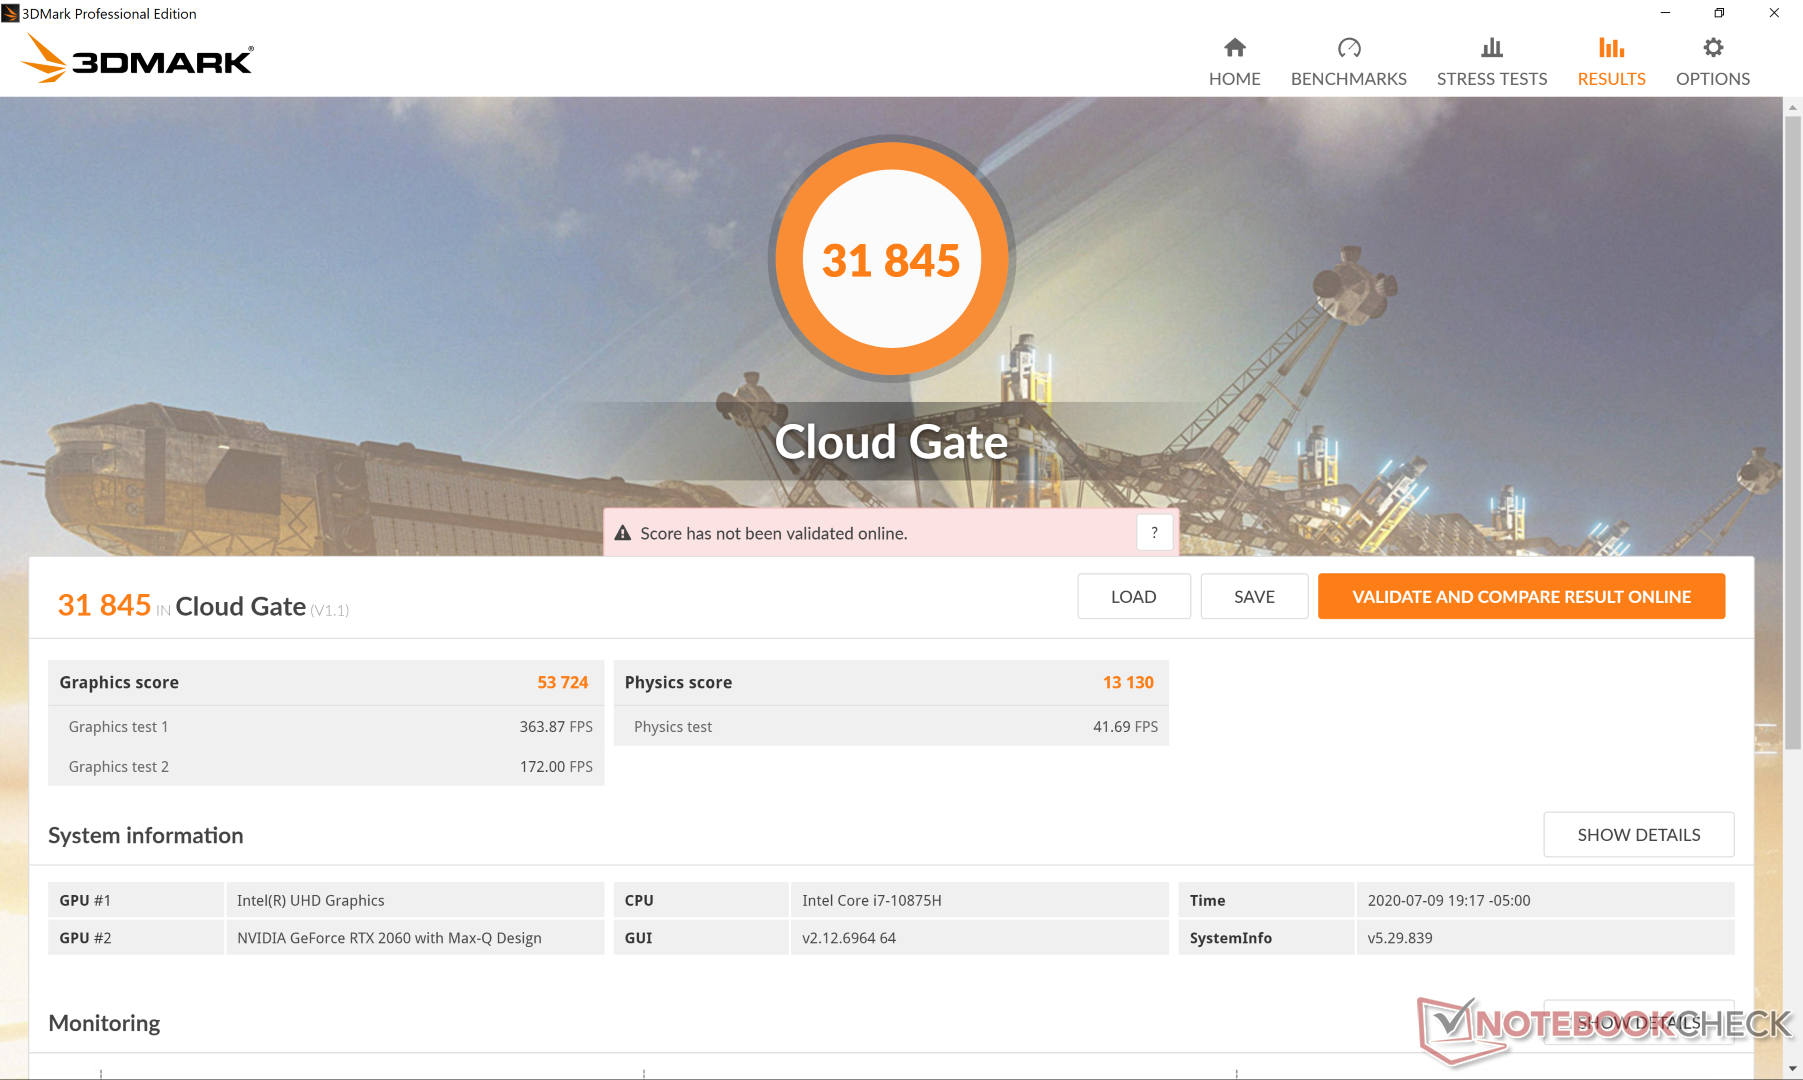
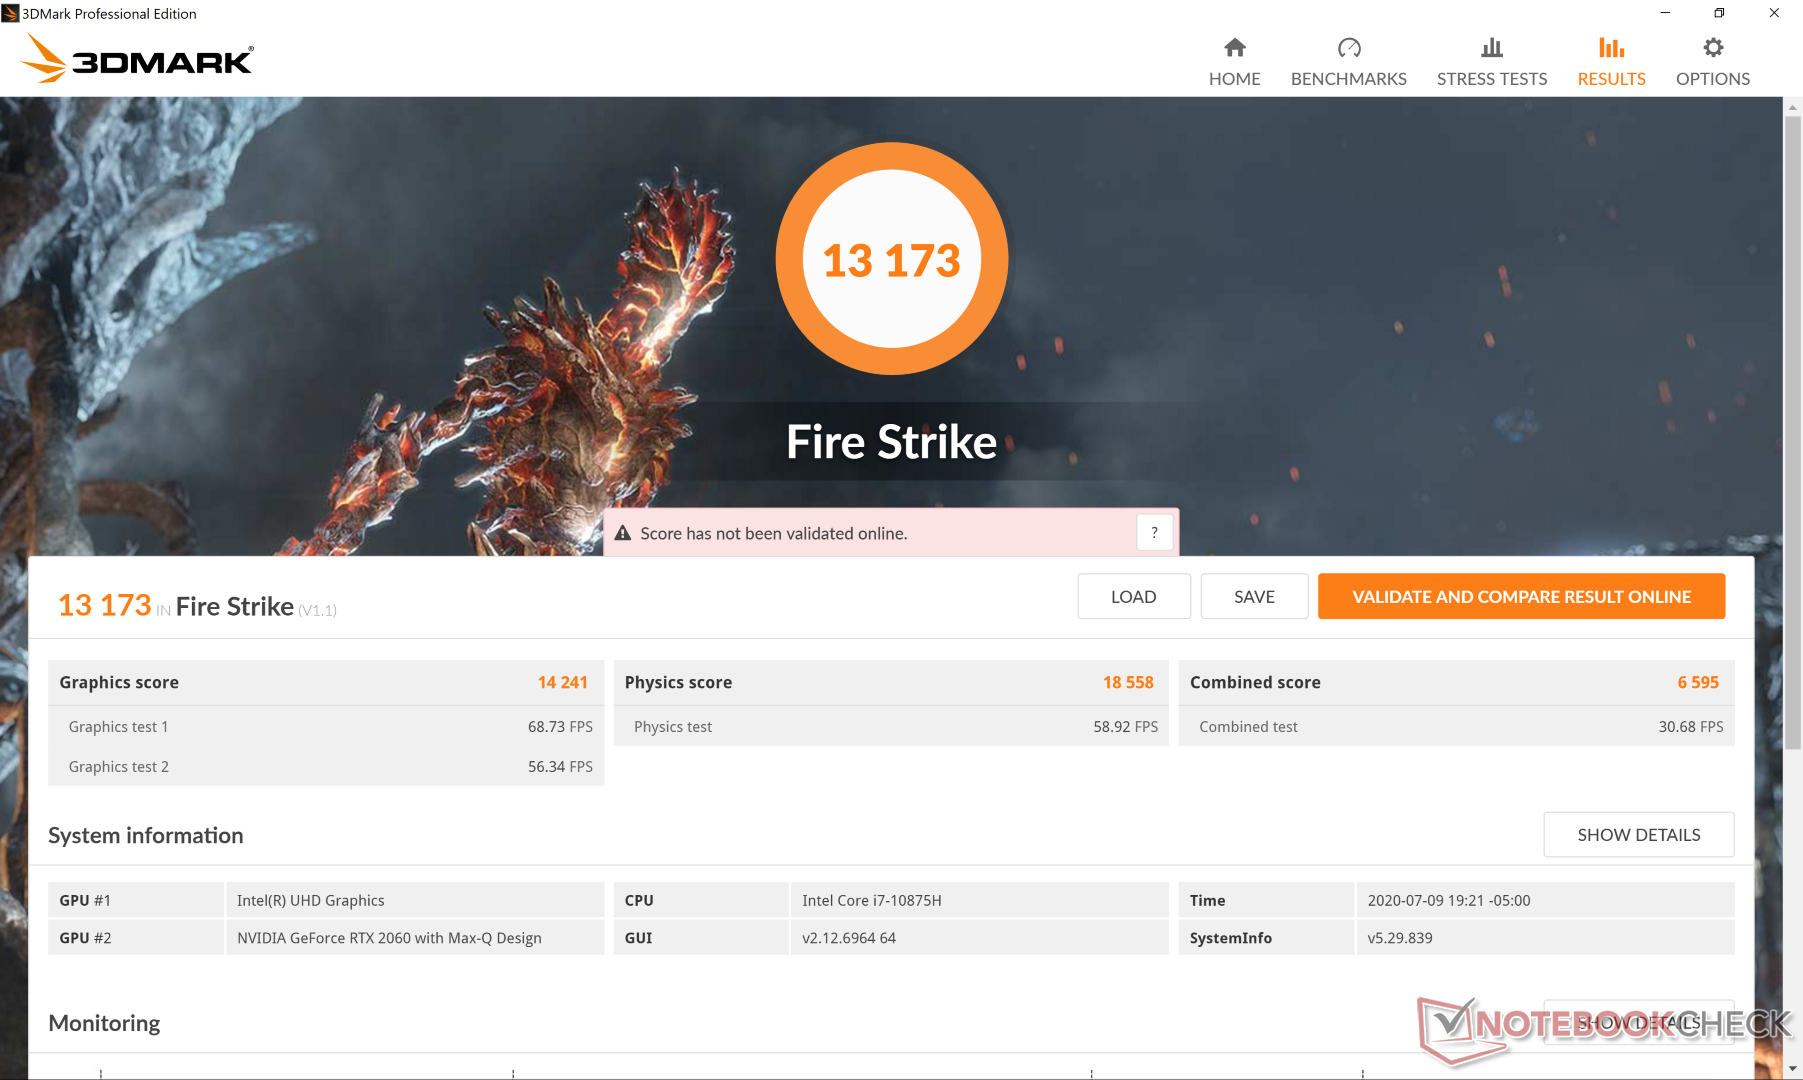
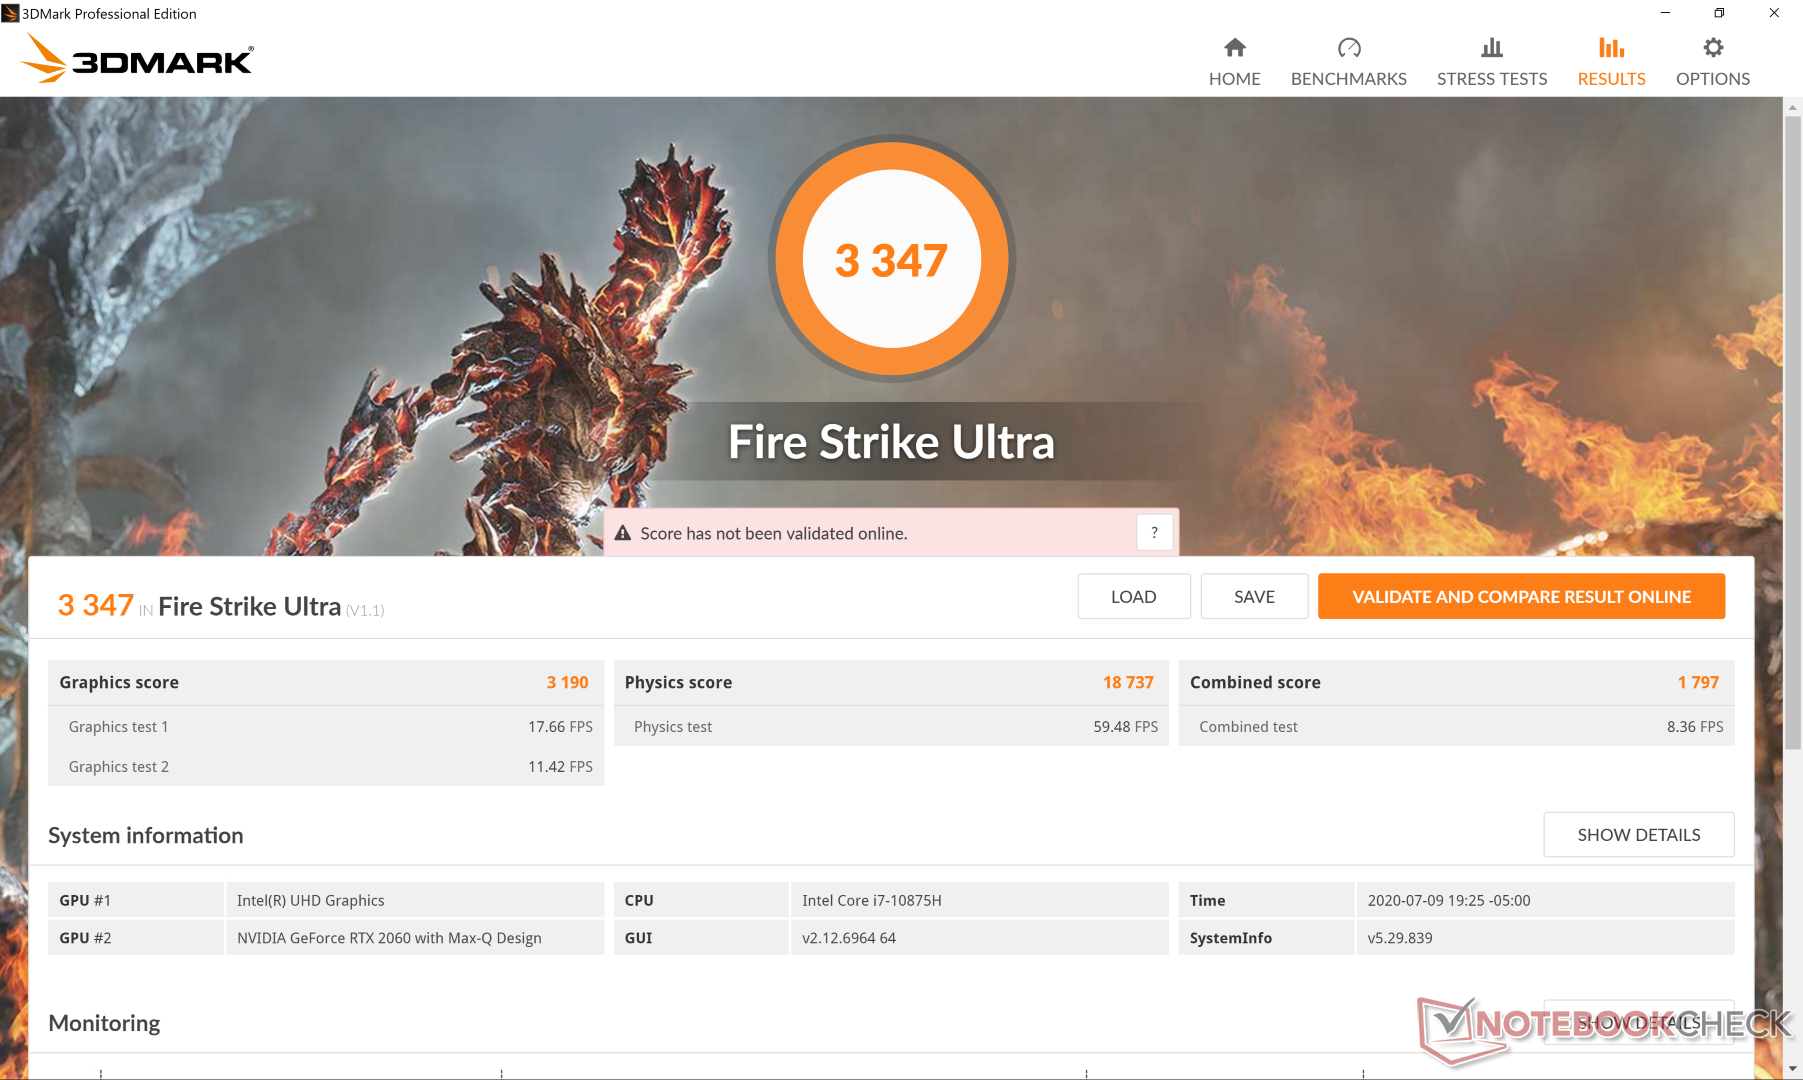
XPS 17, nadir GeForce RTX 2060 Max-Q (ilk olarak Asus Zephyrus G14) ile birlikte gelen ikinci dizüstü bilgisayardır. Burada standart mobil RTX 2060'tan yaklaşık yüzde 10 ila 15 daha yavaş olsa da, XPS 15 serisinde bulunan GTX 1650 seçeneklerinden veya daha ucuz XPS 17 SKU'lardan her biri yaklaşık yüzde 50 oranında önemli ölçüde daha hızlı. Ham oyun performansı olarak GTX 1660 Ti seçeneği sunmamak, daha pahalı RTX 2060 Max-Q sans ışın izleme hızlandırmasıyla neredeyse aynıdır.Daha fazla teknik bilgi ve kıyaslama ayrıntıları için GeForce RTX 2060 Max-Q'daki özel sayfamıza bakın.

| 3DMark | |
| 1920x1080 Fire Strike Graphics | |
| MSI Creator 17 A10SGS | |
| MSI RTX 2060 Gaming Z 6G | |
| Alienware 17 R5 | |
| Eluktronics RP-15 | |
| Asus TUF A17 FA706IU-AS76 | |
| Ortalama NVIDIA GeForce RTX 2060 Max-Q (14129 - 15650, n=4) | |
| Dell XPS 17 9700 Core i7 RTX 2060 Max-Q | |
| Dell XPS 15 9500 Core i7 4K UHD | |
| Dell XPS 15 7590 9980HK GTX 1650 | |
| 2560x1440 Time Spy Graphics | |
| MSI RTX 2060 Gaming Z 6G | |
| MSI Creator 17 A10SGS | |
| Eluktronics RP-15 | |
| Asus TUF A17 FA706IU-AS76 | |
| Alienware 17 R5 | |
| Ortalama NVIDIA GeForce RTX 2060 Max-Q (5357 - 5914, n=4) | |
| Dell XPS 17 9700 Core i7 RTX 2060 Max-Q | |
| Dell XPS 15 9500 Core i7 4K UHD | |
| Dell XPS 15 7590 9980HK GTX 1650 | |
| 2560x1440 Time Spy Score | |
| MSI RTX 2060 Gaming Z 6G | |
| MSI Creator 17 A10SGS | |
| Eluktronics RP-15 | |
| Asus TUF A17 FA706IU-AS76 | |
| Ortalama NVIDIA GeForce RTX 2060 Max-Q (5390 - 6171, n=4) | |
| Alienware 17 R5 | |
| Dell XPS 17 9700 Core i7 RTX 2060 Max-Q | |
| Dell XPS 15 9500 Core i7 4K UHD | |
| Dell XPS 15 7590 9980HK GTX 1650 | |
| 3DMark 11 | |
| 1280x720 Performance GPU | |
| MSI RTX 2060 Gaming Z 6G | |
| MSI Creator 17 A10SGS | |
| Alienware 17 R5 | |
| Eluktronics RP-15 | |
| Asus TUF A17 FA706IU-AS76 | |
| Ortalama NVIDIA GeForce RTX 2060 Max-Q (18863 - 21105, n=4) | |
| Dell XPS 17 9700 Core i7 RTX 2060 Max-Q | |
| Dell XPS 15 9500 Core i7 4K UHD | |
| Dell XPS 15 7590 9980HK GTX 1650 | |
| 1280x720 Performance Combined | |
| MSI Creator 17 A10SGS | |
| Dell XPS 17 9700 Core i7 RTX 2060 Max-Q | |
| Eluktronics RP-15 | |
| MSI RTX 2060 Gaming Z 6G | |
| Ortalama NVIDIA GeForce RTX 2060 Max-Q (12071 - 15054, n=4) | |
| Asus TUF A17 FA706IU-AS76 | |
| Dell XPS 15 9500 Core i7 4K UHD | |
| Alienware 17 R5 | |
| Dell XPS 15 7590 9980HK GTX 1650 | |
| 3DMark 11 Performance | 18021 puan | |
| 3DMark Cloud Gate Standard Score | 31845 puan | |
| 3DMark Fire Strike Score | 13173 puan | |
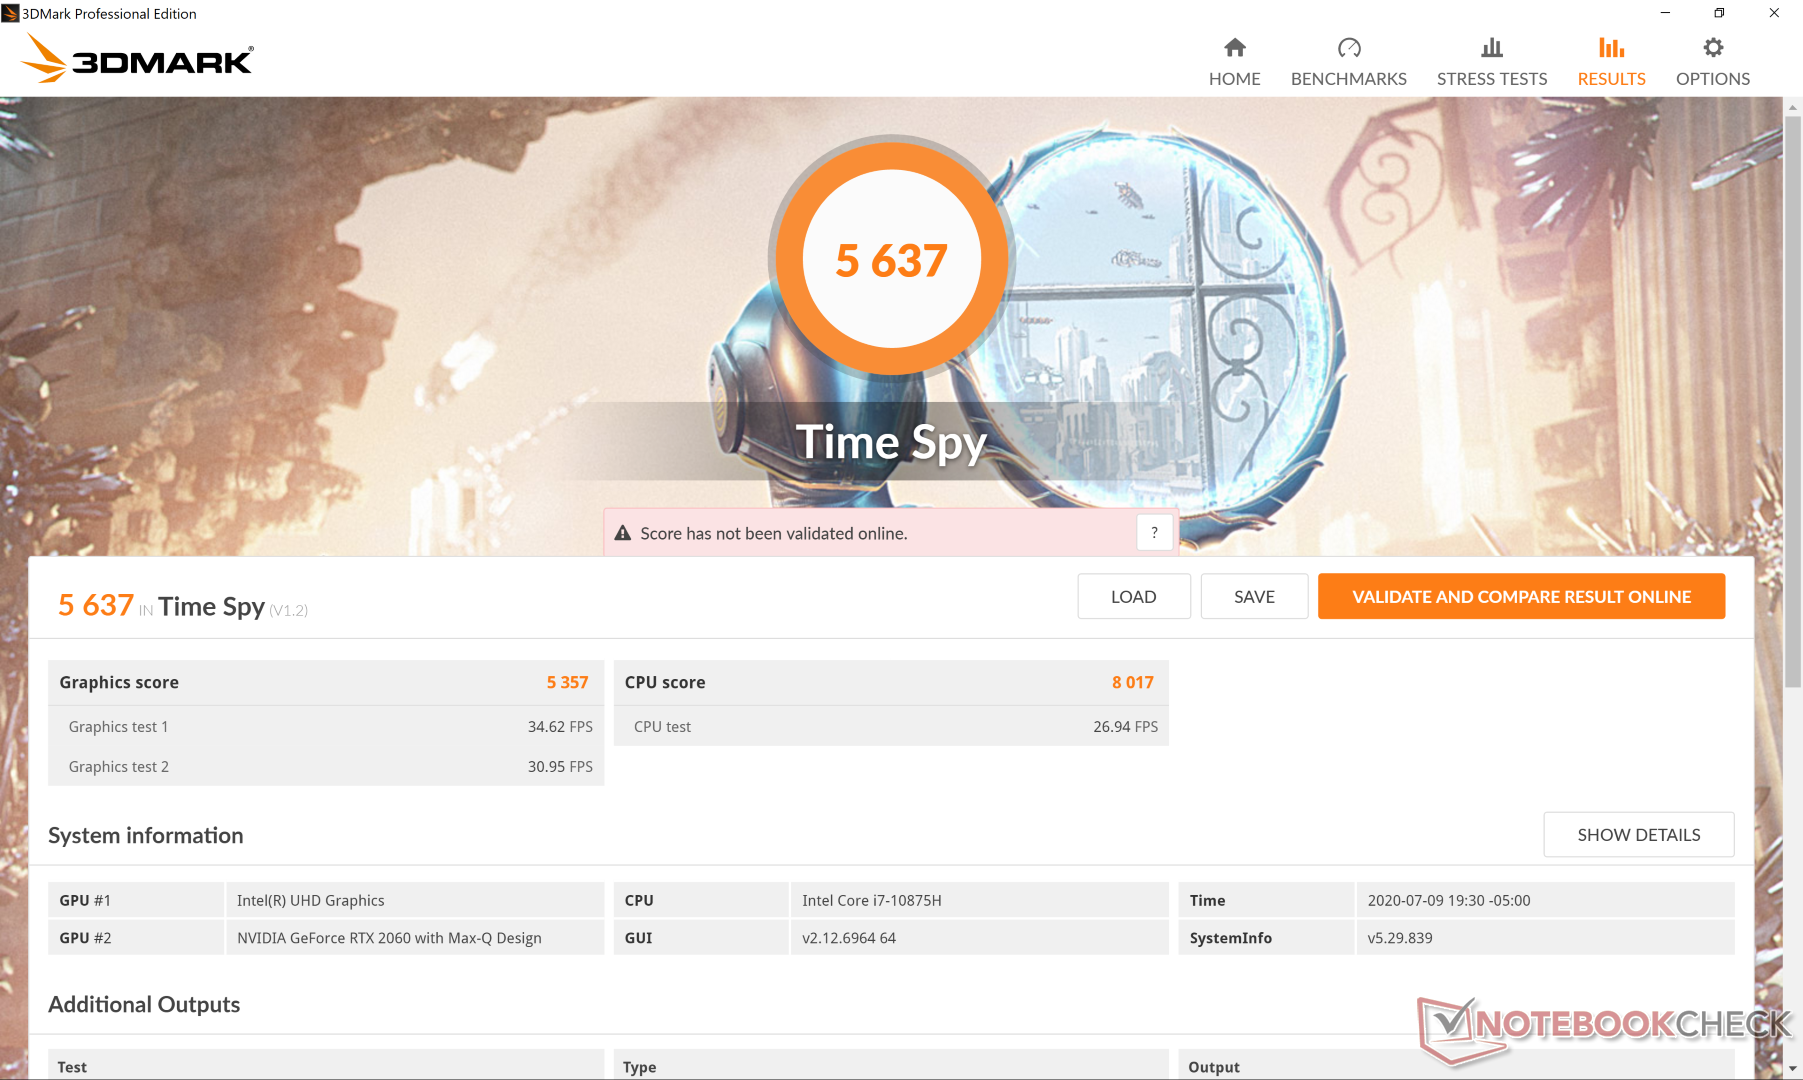
| 3DMark Time Spy Score | 5637 puan | |
Yardım | ||
Oyun Performansı
Dell, XPS serisini oyunculara pazarlamıyor, ancak XPS 17 yine de en yeni oyunları oynayabiliyor. Bununla birlikte, birkaç barikat, "uygun" bir oyun makinesi olmasını engelliyor. 4K paneldeki tepki süreleri biraz yavaştır, böylece oyuncular hızlı tempolu oyunlar oynarken çok fazla gölgelenme bekleyebilirler. Oyun için bir dizüstü bilgisayarda bu kadar harcayacaksanız kesinlikle daha iyi alternatifler var.
| The Witcher 3 - 1920x1080 Ultra Graphics & Postprocessing (HBAO+) | |
| Gigabyte Aero 17 HDR XB | |
| MSI RTX 2060 Gaming Z 6G | |
| Dell G5 15 SE 5505 P89F | |
| Ortalama NVIDIA GeForce RTX 2060 Max-Q (51.2 - 62.9, n=4) | |
| Dell XPS 17 9700 Core i7 RTX 2060 Max-Q | |
| Asus TUF A17 FA706IU-AS76 | |
| MSI Bravo 15 A4DCR | |
| MSI GF75 Thin 10SCXR | |
| Asus TUF FX705GM | |
| Shadow of the Tomb Raider - 1920x1080 Highest Preset AA:T | |
| Gigabyte Aero 17 HDR XB | |
| MSI RTX 2060 Gaming Z 6G | |
| Asus TUF A17 FA706IU-AS76 | |
| Ortalama NVIDIA GeForce RTX 2060 Max-Q (65 - 74, n=2) | |
| Dell G5 15 SE 5505 P89F | |
| Dell XPS 17 9700 Core i7 RTX 2060 Max-Q | |
| Asus TUF FX705GM | |
| MSI GF75 Thin 10SCXR | |
| MSI Bravo 15 A4DCR | |
Idling on Witcher 3 should result in stable frame rates throughout, but that is not the case on the XPS 17 as frame rates would begin to periodically dip to to the 10 to 20 FPS range after the first 30 minutes into the stress test. We re-tested this twice on Dell's Ultra Performance profile and results would remain the same. We're not sure what is responsible as we can notice no dip in GPU clock rates while running the game, but this is extremely unusual and not something we've recorded before on any other laptop.
| düşük | orta | yüksek | ultra | 4K | |
|---|---|---|---|---|---|
| The Witcher 3 (2015) | 284.8 | 182.1 | 109 | 56.1 | 24.9 |
| Dota 2 Reborn (2015) | 152 | 140 | 131 | 123 | 75.5 |
| X-Plane 11.11 (2018) | 111 | 97.8 | 79.8 | 63.7 | |
| Shadow of the Tomb Raider (2018) | 118 | 84 | 75 | 65 | 20 |
| Far Cry New Dawn (2019) | 105 | 75 | 70 | 63 | |
| Dirt Rally 2.0 (2019) | 276.7 | 125.3 | 105.3 | 60.5 | 24.4 |
| Control (2019) | 183.7 | 67.1 | 50.4 | ||
| GRID 2019 (2019) | 157.4 | 109.4 | 103.4 | 73.5 | 33.1 |
| Star Wars Jedi Fallen Order (2019) | 92.9 | 88 | 77.8 | ||
| Gears Tactics (2020) | 257.9 | 120.4 | 76.4 | 56.9 | 18.9 |
Emissions
System Noise — Very Quiet when Low, Very Loud when High
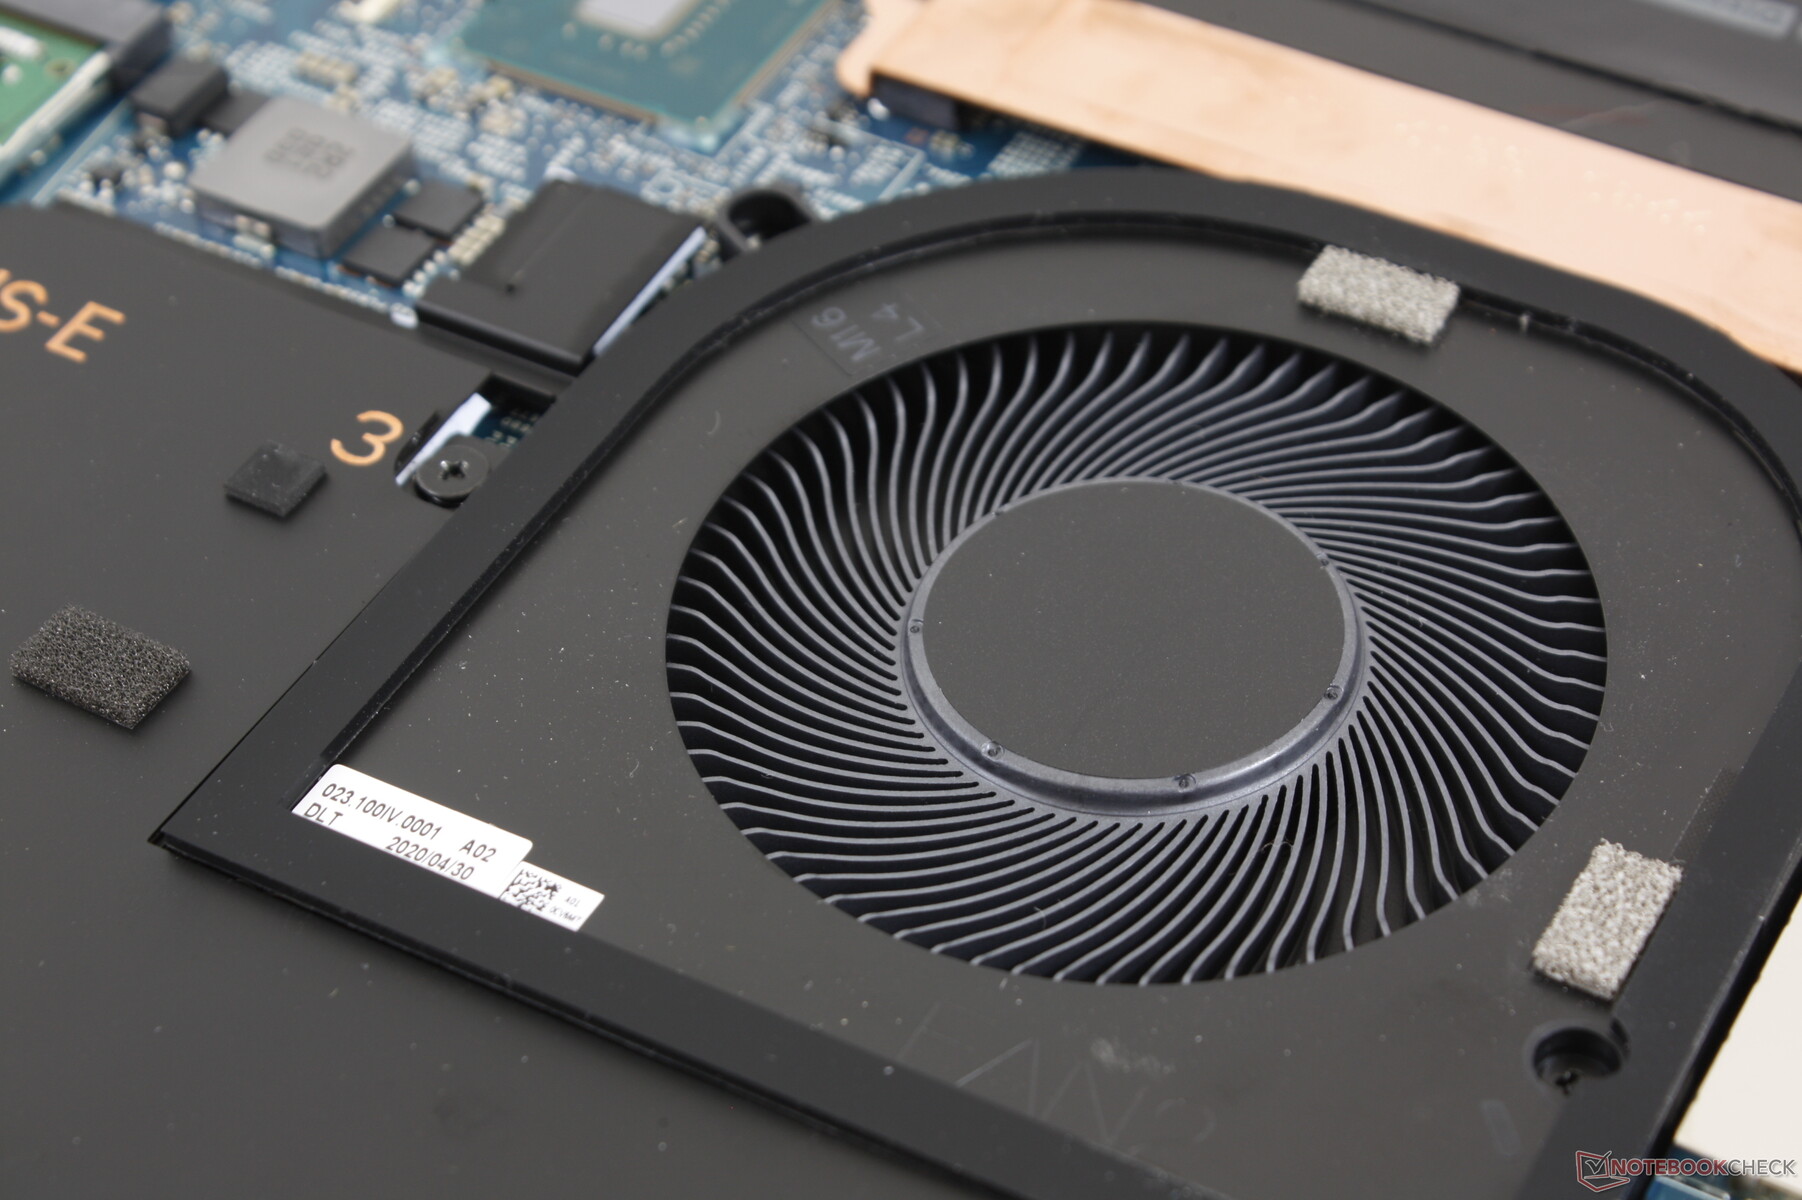
Dell has taken a page out of the Razer playbook by equipping its XPS 17 with a vapor chamber cooler in contrast to the traditional copper heat pipe solution as found on the XPS 15. The twin fans are also larger this time around at 65 to 70 mm in diameter compared to the 45 mm fans of its smaller sibling.
Even with these significant cooling changes, we can't say that fan noise isn't any quieter when under high loads. Running the first 90-second benchmark scene of 3DMark 06 results in a fan noise of 43 dB(A) while gaming on Ultra Performance mode will induce 49 dB(A). Such numbers are more comparable to ultra-thin gaming laptops rather than other multimedia laptops which is probably unsurprising given that the XPS 17 comes equipped with a GeForce RTX GPU.
However, the Dell system is able to remain silent for very long periods with little to no fan pulsing behavior when simply browsing the web or streaming video. At worst, we're able to record 30.5 dB(A) during these low loads against a silent background of 28 dB(A). We like that the fans are mostly idle during undemanding loads whereas the fans on many other high-performance laptops tend to kick into gear sooner and more abruptly.
| Dell XPS 17 9700 Core i7 RTX 2060 Max-Q GeForce RTX 2060 Max-Q, i7-10875H, Micron 2200S 1TB MTFDHBA1T0TCK | Razer Blade Pro 17 RTX 2070 Max-Q 300 Hz GeForce RTX 2070 Max-Q, i7-10875H, Lite-On CA5-8D512 | MSI Creator 17 A10SGS GeForce RTX 2080 Super Max-Q, i7-10875H, Samsung SSD PM981 MZVLB2T0HMLB | HP Envy 17t-cg000 GeForce MX330, i7-1065G7, WDC PC SN520 SDAPNUW-512G | Gigabyte Aero 17 HDR XB GeForce RTX 2070 Super Max-Q, i7-10875H, Samsung SSD PM981a MZVLB512HBJQ | Asus Zephyrus S17 GX701LXS GeForce RTX 2080 Super Max-Q, i7-10875H, Samsung PM981a MZVLB1T0HBLR | |
|---|---|---|---|---|---|---|
| Noise | -4% | -11% | 2% | -16% | -8% | |
| kapalı / ortam * (dB) | 28 | 28.2 -1% | 30 -7% | 28.2 -1% | 30 -7% | 25 11% |
| Idle Minimum * (dB) | 28 | 28.2 -1% | 32 -14% | 28.2 -1% | 35 -25% | 32 -14% |
| Idle Average * (dB) | 28 | 28.2 -1% | 33 -18% | 28.2 -1% | 36 -29% | 35 -25% |
| Idle Maximum * (dB) | 28 | 30.5 -9% | 40 -43% | 29.5 -5% | 38 -36% | 43 -54% |
| Load Average * (dB) | 43.2 | 42.2 2% | 47 -9% | 43.9 -2% | 47 -9% | 44 -2% |
| Witcher 3 ultra * (dB) | 49 | 53 -8% | 46 6% | 43.9 10% | 49 -0% | 41 16% |
| Load Maximum * (dB) | 50.5 | 55.5 -10% | 48 5% | 43.9 13% | 54 -7% | 45 11% |
* ... daha küçük daha iyidir
Ses yüksekliği
| Boşta |
| 28 / 28 / 28 dB |
| Çalışırken |
| 43.2 / 50.5 dB |
 | ||
30 dB sessiz 40 dB(A) duyulabilirlik 50 dB(A) gürültülü |
||
min: | ||
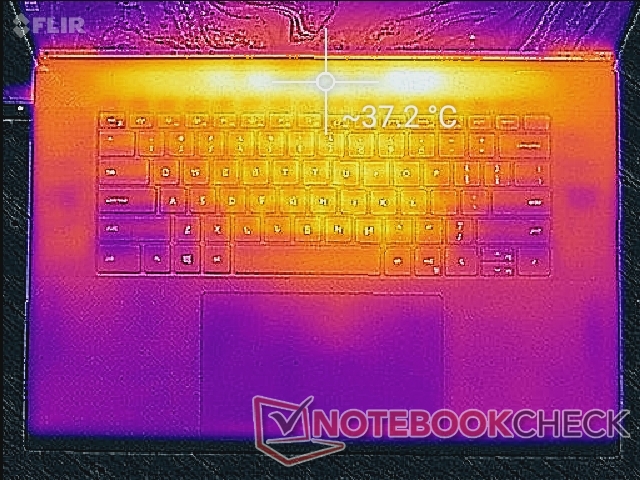
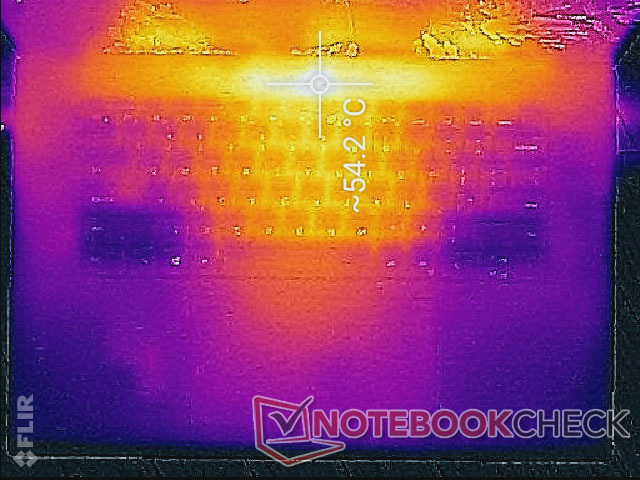
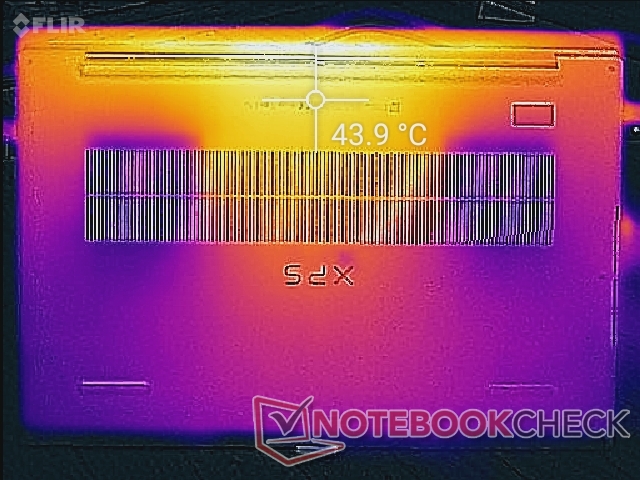
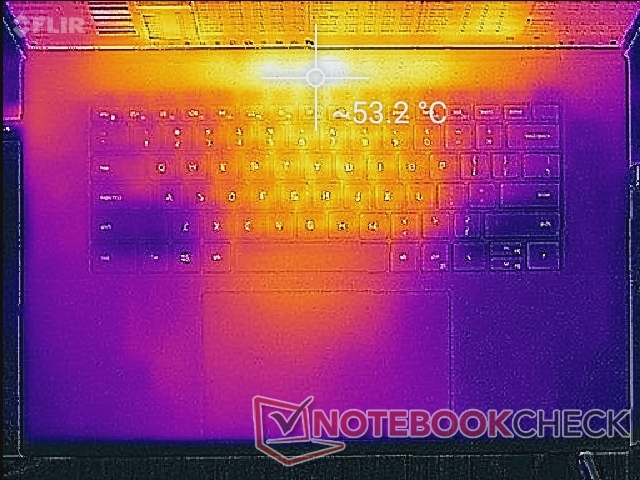
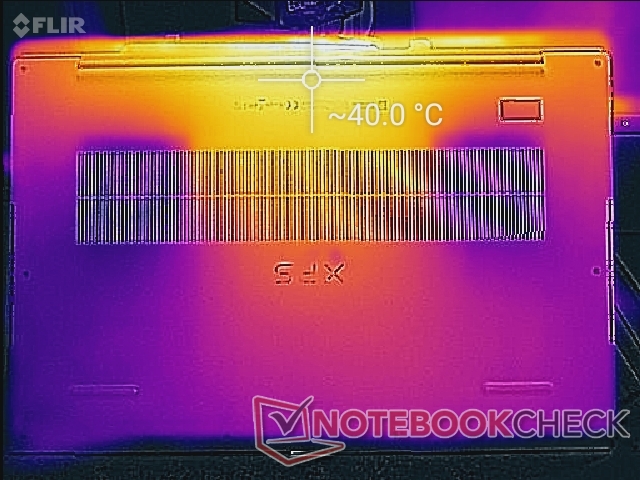
Temperature
Surface temperature gradient is largely symmetrical meaning that any hot spots are nearest the keyboard center. When gaming or running extreme loads, this area can be as warm as 54 C while the bottom can reach 44 C as shown by our temperature maps below. Results are about the same as on the XPS 15 if not slightly warmer despite the larger form factor and vapor chamber cooling.
It's worth noting that surface temperatures will be warmer than usual during low loads since the fans will likely be idling. It's a small trade off for having the fans be as quiet as possible when typing, browsing, or watching videos. Surface temperatures will also be quite warm when on Standby mode and plugged into an outlet.
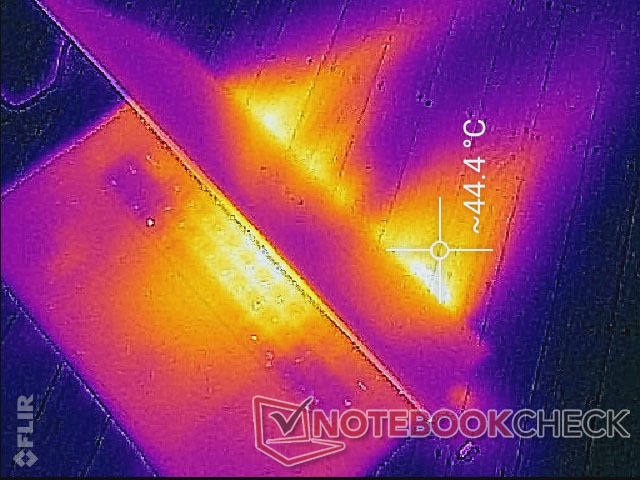

(-) Üst taraftaki maksimum sıcaklık, 36.8 °C / 98 F ortalamasına kıyasla 53 °C / 127 F'dir. , Multimedia sınıfı için 21 ile 71 °C arasında değişir.
(+) Alt kısım, 39.1 °C / 102 F ortalamasına kıyasla maksimum 39.2 °C / 103 F'ye kadar ısınır
(+) Boşta kullanımda, üst tarafın ortalama sıcaklığı 31.4 °C / 89 F olup, cihazın 31.3 °C / 88 F.
(±) The Witcher 3 oynarken, üst tarafın ortalama sıcaklığı 37.3 °C / 99 F olup, cihazın 31.3 °C / 88 F.
(+) Avuç içi dayanakları ve dokunmatik yüzey maksimum (34.2 °C / 93.6 F) cilt sıcaklığına ulaşıyor ve bu nedenle sıcak değil.
(-) Benzer cihazların avuç içi dayanağı alanının ortalama sıcaklığı 28.7 °C / 83.7 F (-5.5 °C / -9.9 F) idi.

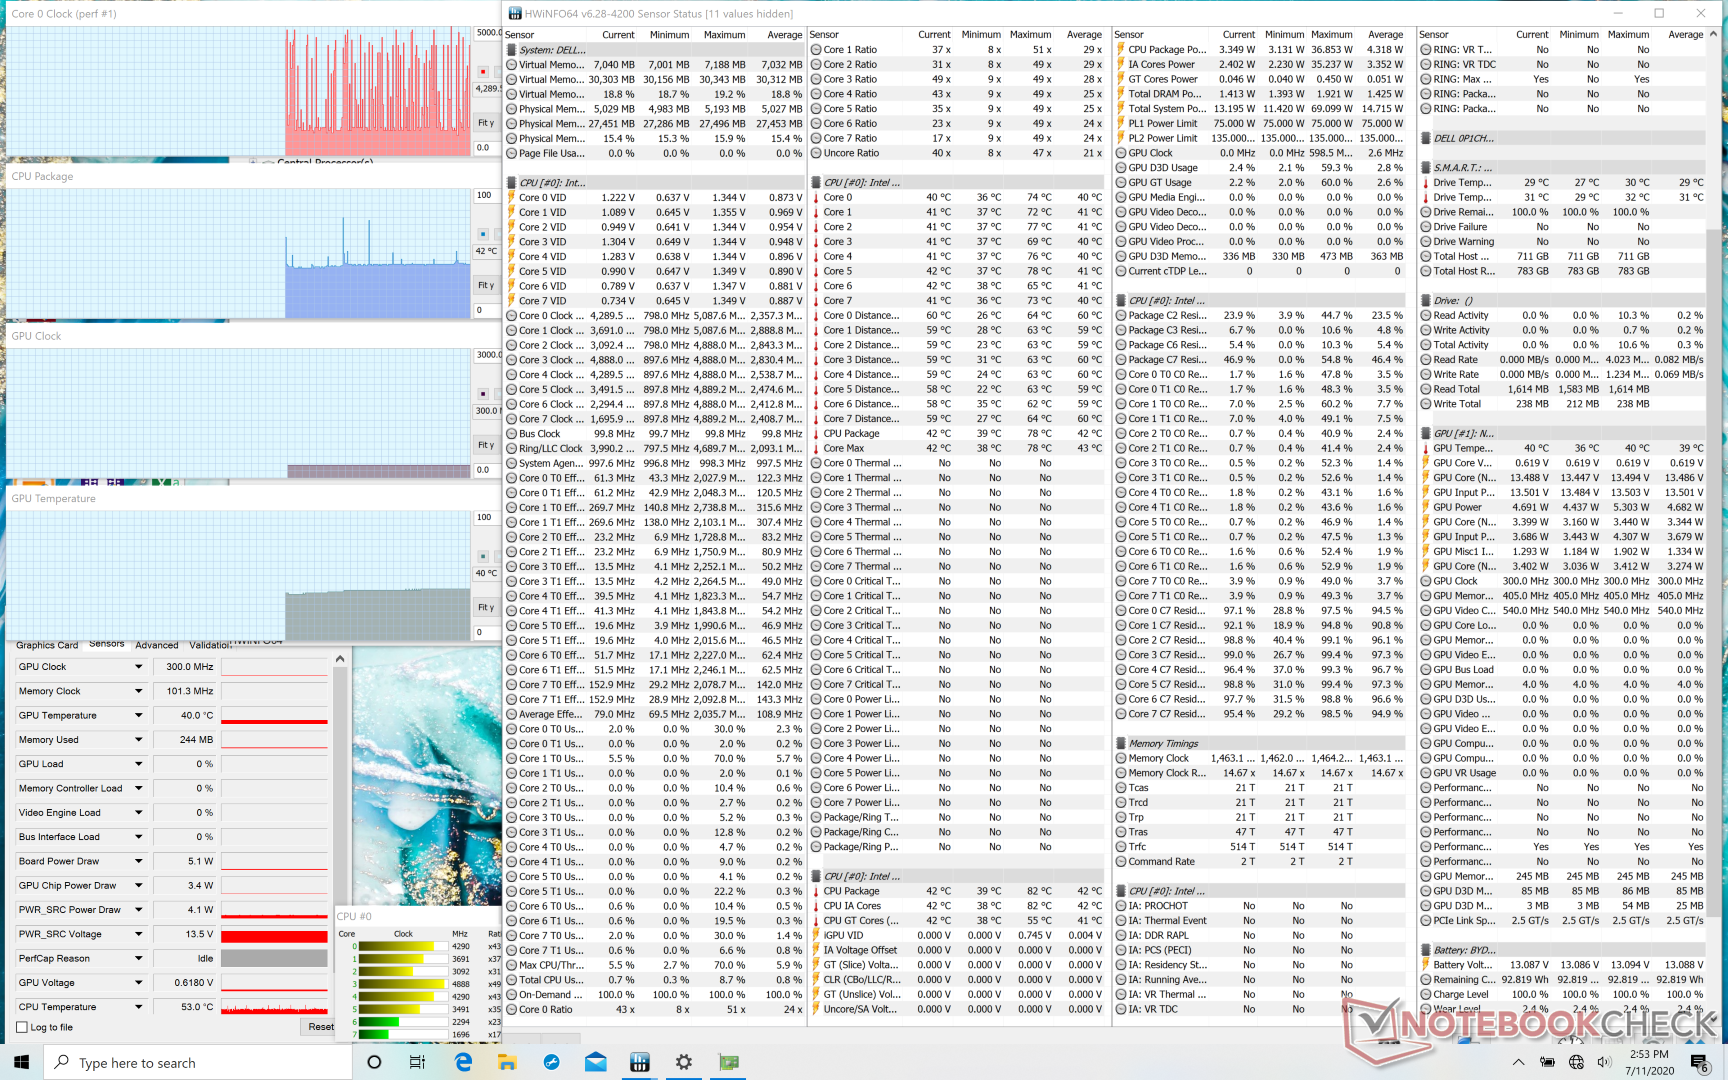
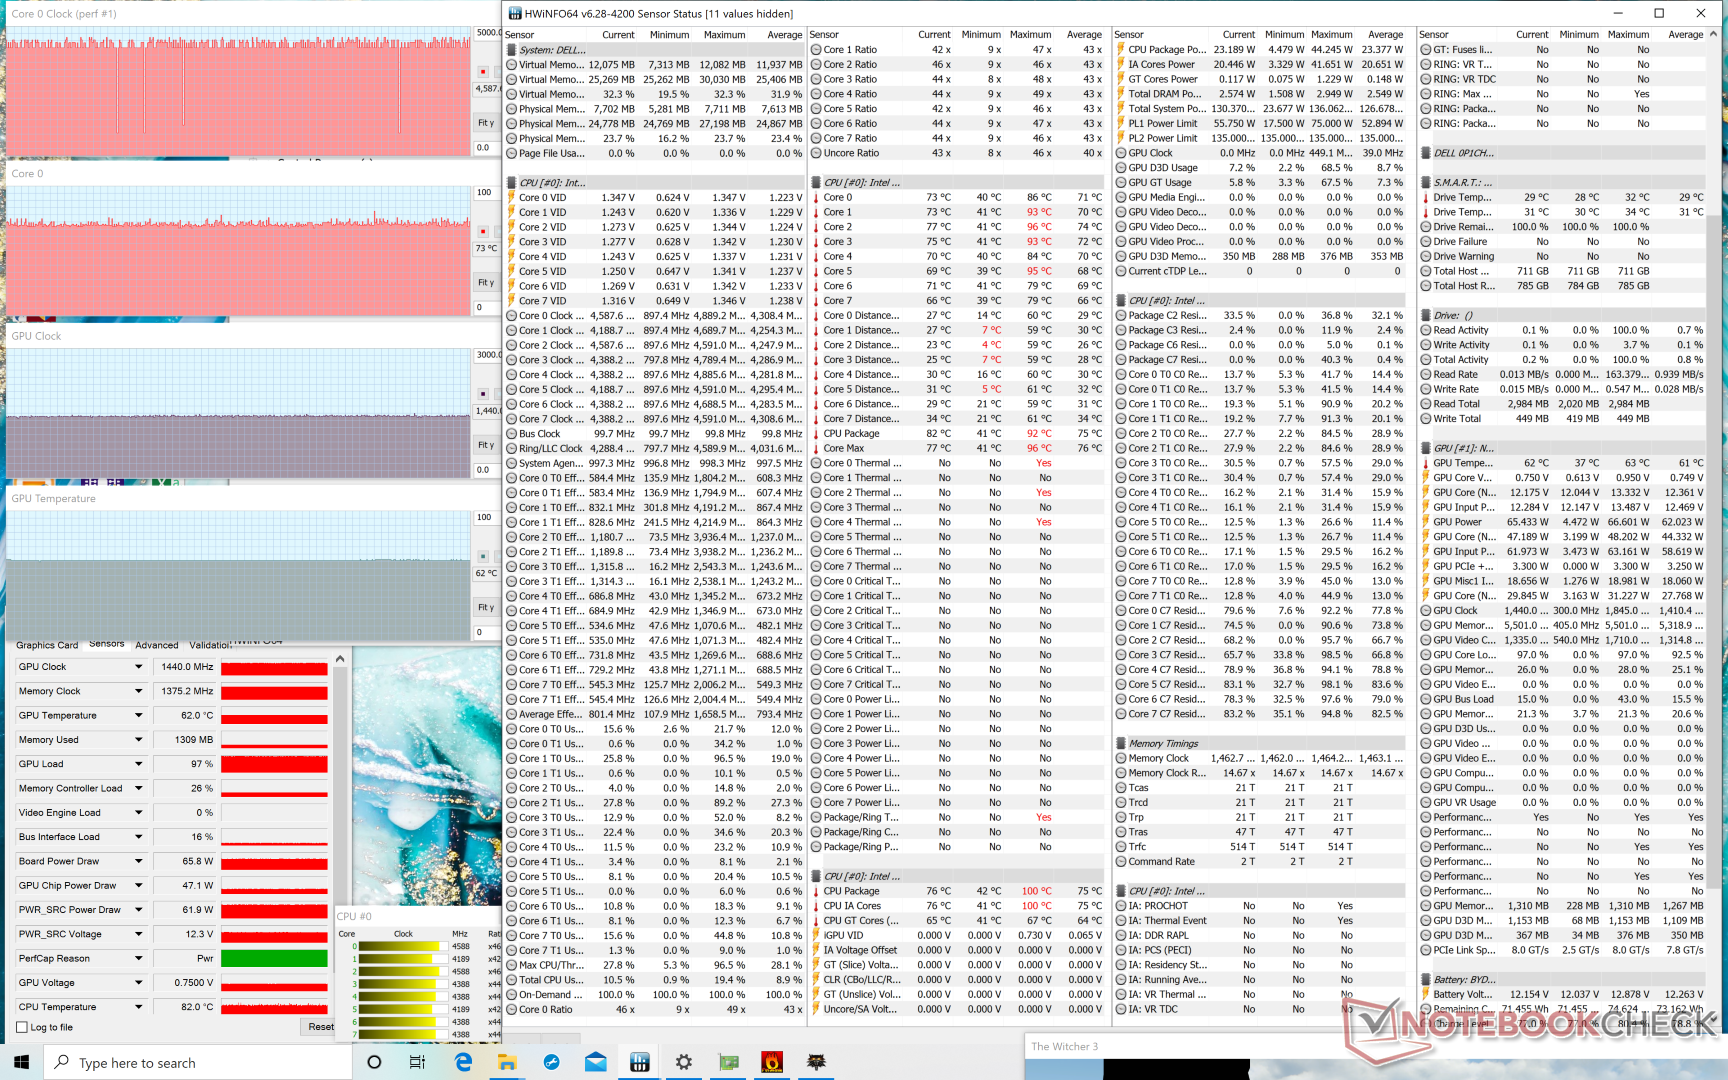
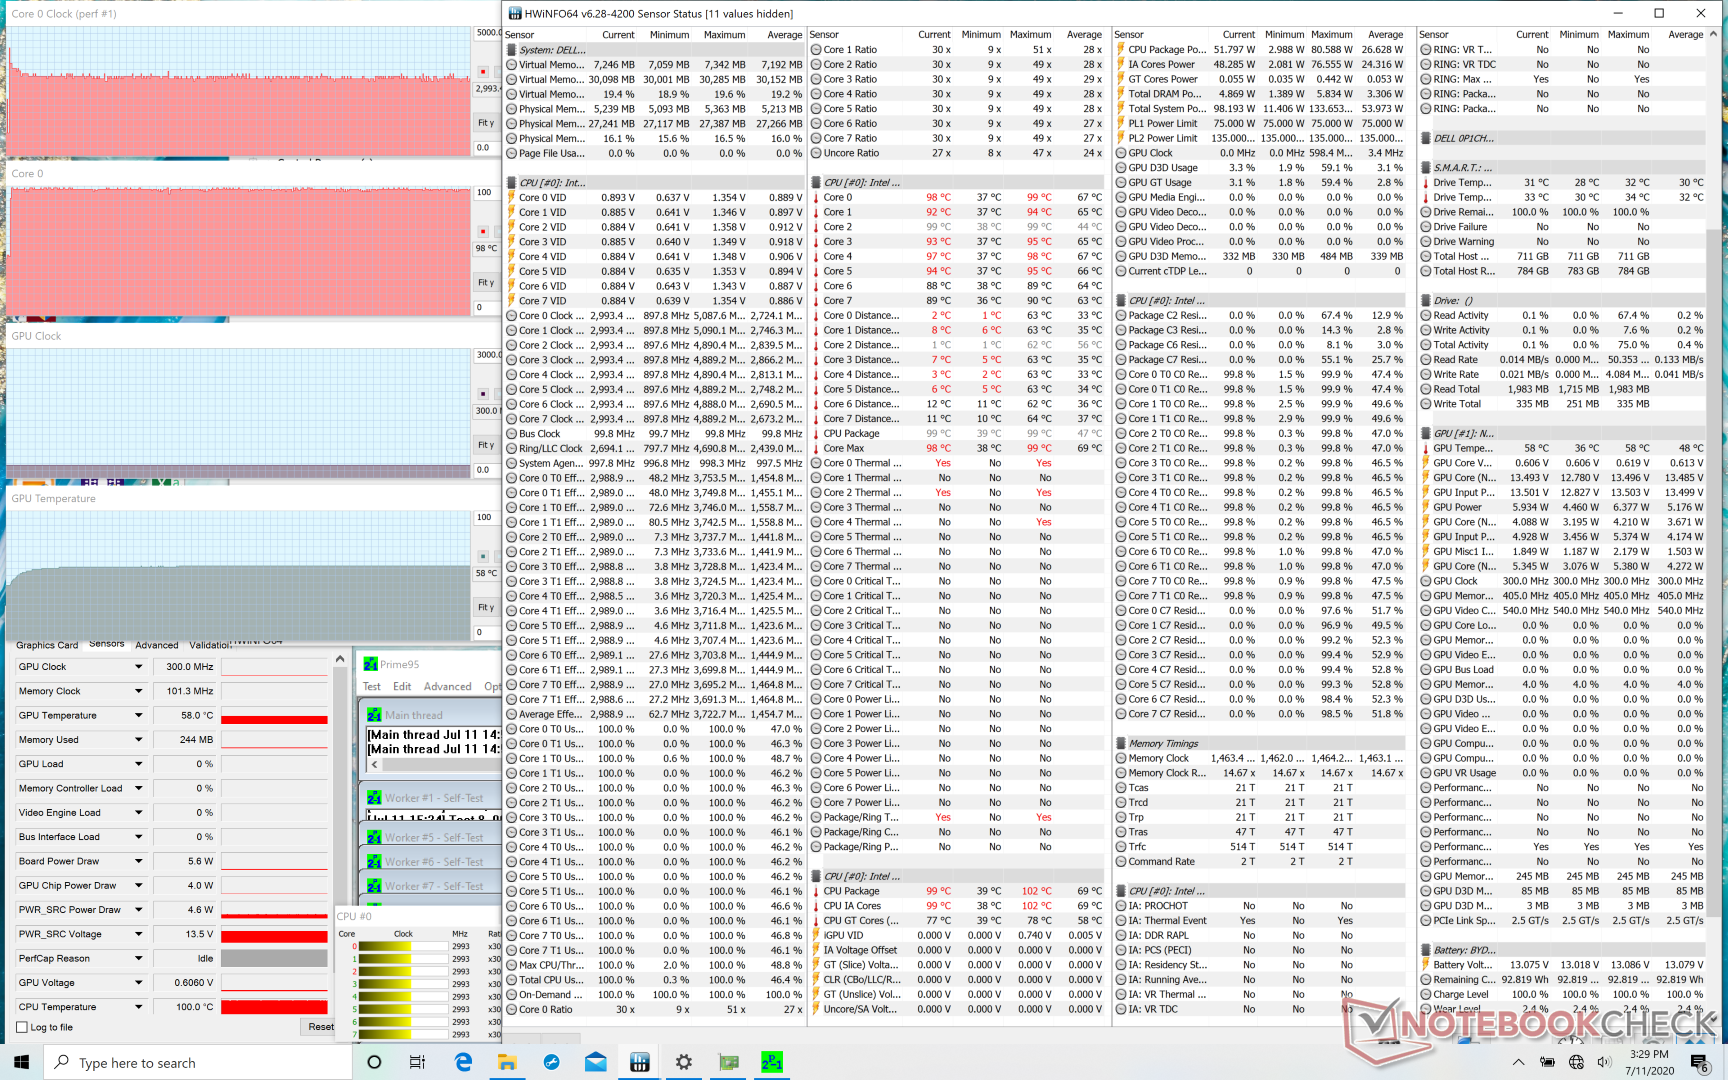
Stress Test — High Core Temperatures Under Full Load
For better or worse, Dell likes to run its processors at extremely warm temperatures as exemplified by the Alienware series, the XPS 13/15, and the recent G5 15 SE. This is good in that users are getting as much CPU performance as the cooling solution can allow, but also unfavorable in terms of processor lifespan. Running Prime95 results in stable CPU clock rates and temperature of 2.9 to 3.1 GHz and 99 C, respectively, compared to 3.2 to 3.3 GHz and just 66 C on the larger Razer Blade Pro 17 equipped with the same processor.
Running Witcher 3 is more representative of real-world loads. The CPU and GPU would stabilize at much cooler and respectable temperatures of 73 C and 62 C, respectively.
Running on battery power will limit performance. A Fire Strike run on batteries would returns Physics and Graphics scores of 15946 and 4425 points, respectively, compared to 18558 and 14241 points when on mains.
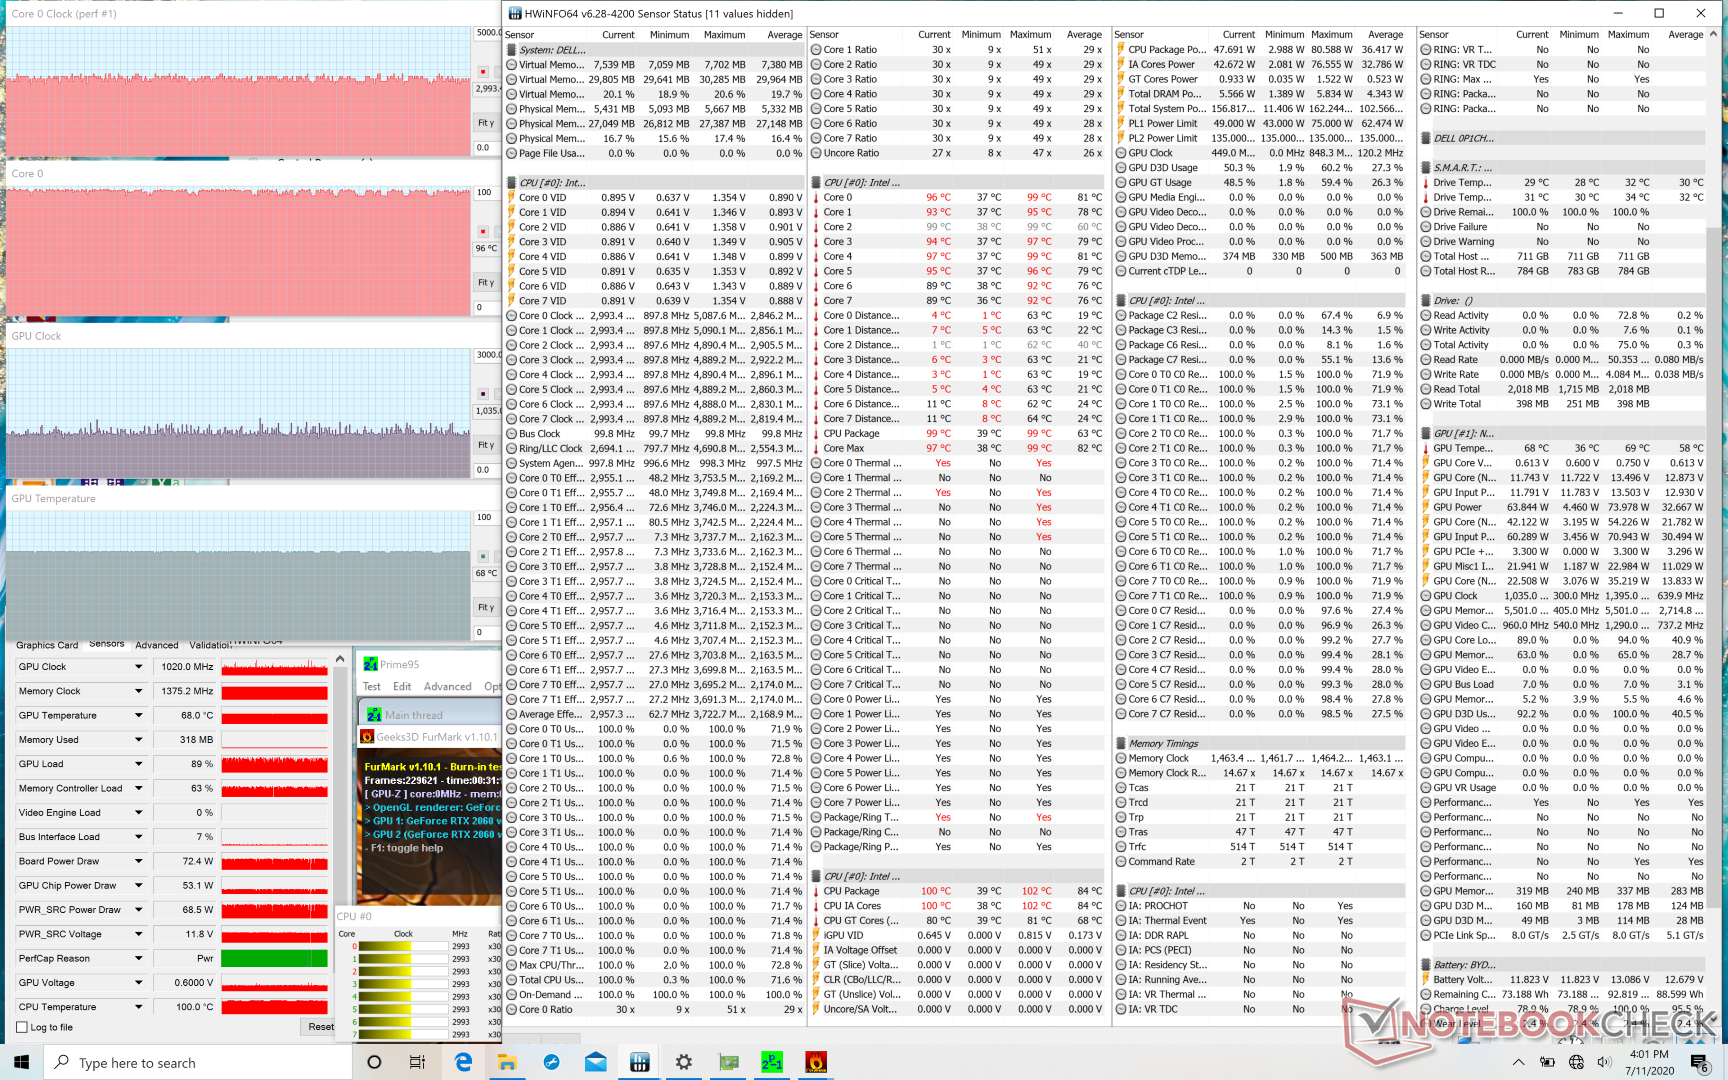
| CPU Clock (GHz) | GPU Clock (MHz) | Average CPU Temperature (°C) | Average GPU Temperature (°C) | |
| System Idle | -- | -- | 42 | 40 |
| Prime95 Stress | 2.9 - 3.1 | -- | 99 | 58 |
| Prime95 + FurMark Stress | 2.0 - 3.1 | ~1020 | 99 | 68 |
| Witcher 3 Stress | ~4.6 | 1440 | 73 | 62 |
Speakers
Even though the XPS 17 is larger than the XPS 15 and has larger speaker grilles along the sides of its keyboard, audio quality remains the same. The system still comes with two 2.5 W speakers and two 1.5 W tweeters for the same 8 W audio output. Bass reproduction is excellent for an ultra-thin laptop and comparable to the HP Spectre x360 15. The palm rests will vibrate to the touch when audio is set to 50 percent or higher.


Dell XPS 17 9700 Core i7 RTX 2060 Max-Q ses analizi
(±) | hoparlör ses yüksekliği ortalama ama iyi (75.8 dB)
Bas 100 - 315Hz
(±) | azaltılmış bas - ortalama olarak medyandan 8.3% daha düşük
(±) | Bas doğrusallığı ortalamadır (8.6% delta - önceki frekans)
Ortalar 400 - 2000 Hz
(+) | dengeli ortalar - medyandan yalnızca 2.2% uzakta
(+) | orta frekanslar doğrusaldır (3.8% deltadan önceki frekansa)
Yüksekler 2 - 16 kHz
(+) | dengeli yüksekler - medyandan yalnızca 2.1% uzakta
(+) | yüksekler doğrusaldır (5.3% deltadan önceki frekansa)
Toplam 100 - 16.000 Hz
(+) | genel ses doğrusaldır (10.9% ortancaya göre fark)
Aynı sınıfla karşılaştırıldığında
» Bu sınıftaki tüm test edilen cihazların %16%'si daha iyi, 3% benzer, 81% daha kötüydü
» En iyisinin deltası 5% idi, ortalama 17% idi, en kötüsü 45% idi
Test edilen tüm cihazlarla karşılaştırıldığında
» Test edilen tüm cihazların %6'si daha iyi, 2 benzer, % 92 daha kötüydü
» En iyisinin deltası 4% idi, ortalama 24% idi, en kötüsü 134% idi
Apple MacBook 12 (Early 2016) 1.1 GHz ses analizi
(+) | hoparlörler nispeten yüksek sesle çalabilir (83.6 dB)
Bas 100 - 315Hz
(±) | azaltılmış bas - ortalama olarak medyandan 11.3% daha düşük
(±) | Bas doğrusallığı ortalamadır (14.2% delta - önceki frekans)
Ortalar 400 - 2000 Hz
(+) | dengeli ortalar - medyandan yalnızca 2.4% uzakta
(+) | orta frekanslar doğrusaldır (5.5% deltadan önceki frekansa)
Yüksekler 2 - 16 kHz
(+) | dengeli yüksekler - medyandan yalnızca 2% uzakta
(+) | yüksekler doğrusaldır (4.5% deltadan önceki frekansa)
Toplam 100 - 16.000 Hz
(+) | genel ses doğrusaldır (10.2% ortancaya göre fark)
Aynı sınıfla karşılaştırıldığında
» Bu sınıftaki tüm test edilen cihazların %7%'si daha iyi, 2% benzer, 91% daha kötüydü
» En iyisinin deltası 5% idi, ortalama 18% idi, en kötüsü 53% idi
Test edilen tüm cihazlarla karşılaştırıldığında
» Test edilen tüm cihazların %5'si daha iyi, 1 benzer, % 94 daha kötüydü
» En iyisinin deltası 4% idi, ortalama 24% idi, en kötüsü 134% idi
Energy Management
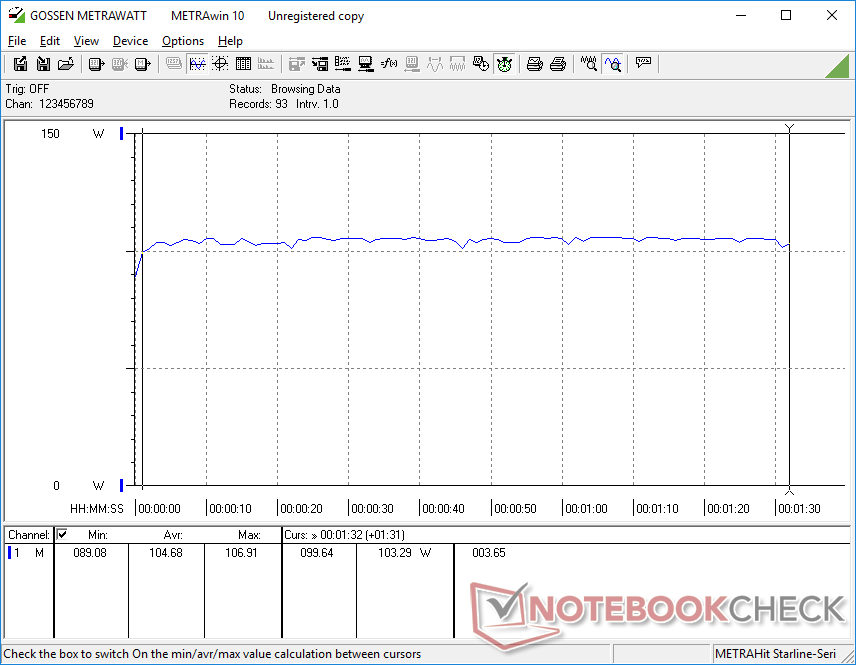
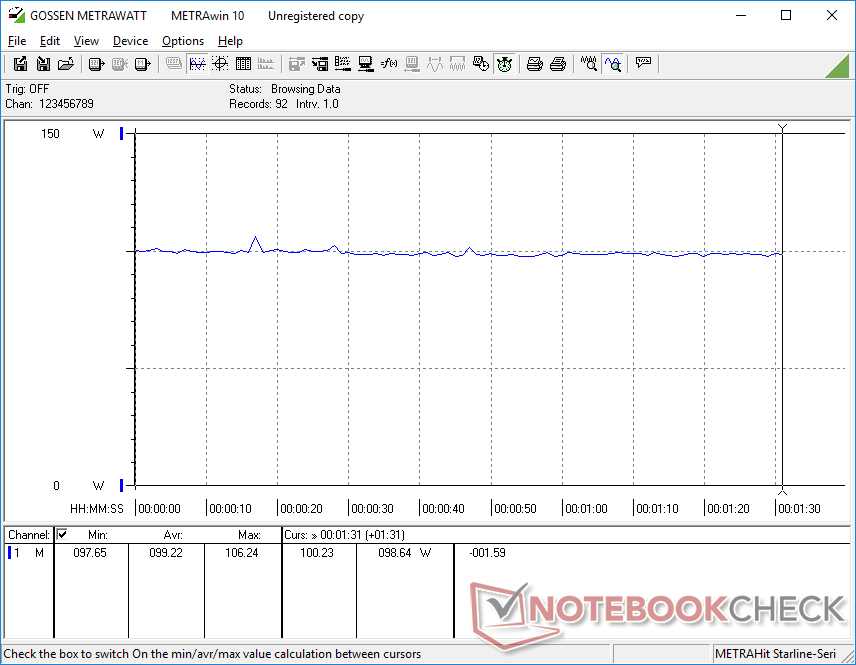
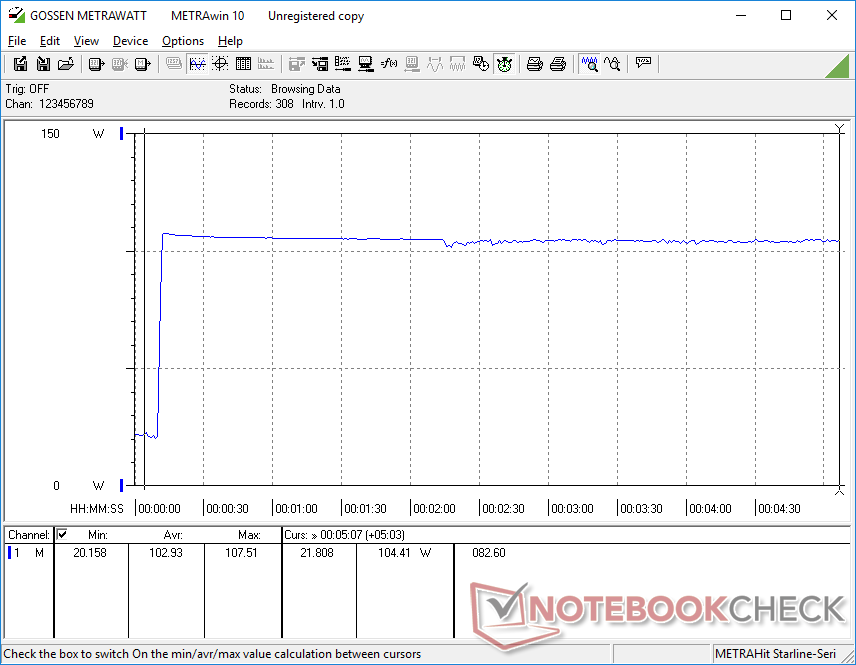
Power Consumption — Can USB-C Really Power a 17-inch GeForce RTX 2060 Max-Q Laptop?
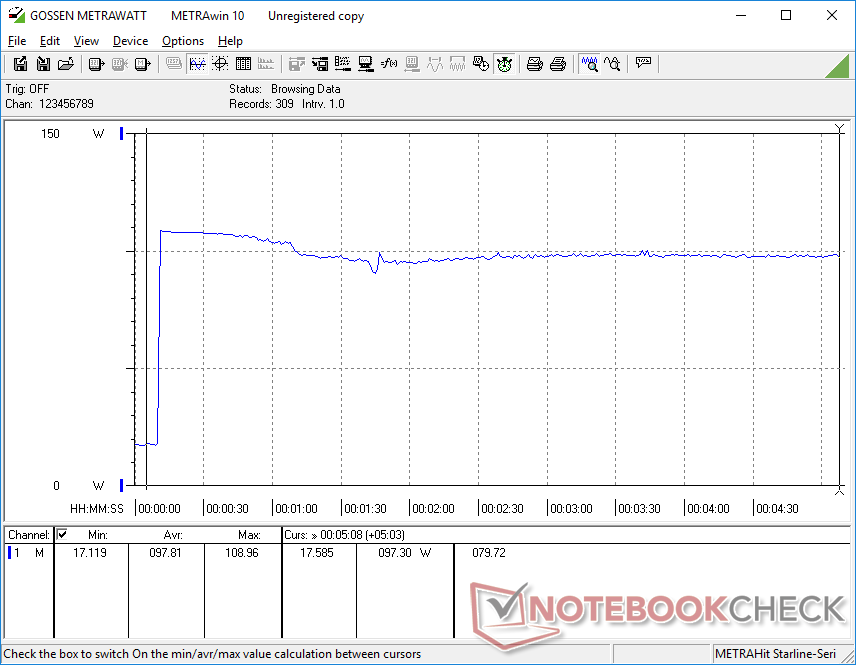
Idling on desktop consumes just 5 W to 6 W when on the lowest brightness setting and power profile which likely explains the long battery life we recorded in the next section below. Simply switching to High Performance mode with the discrete GPU enabled and at maximum screen brightness would consume 21 W meaning it's well worth setting the system to Power Saver mode if battery life is of importance. Even so, the system is very power efficient when compared to other performance 17-inch laptops with the same CPU and GPU class.
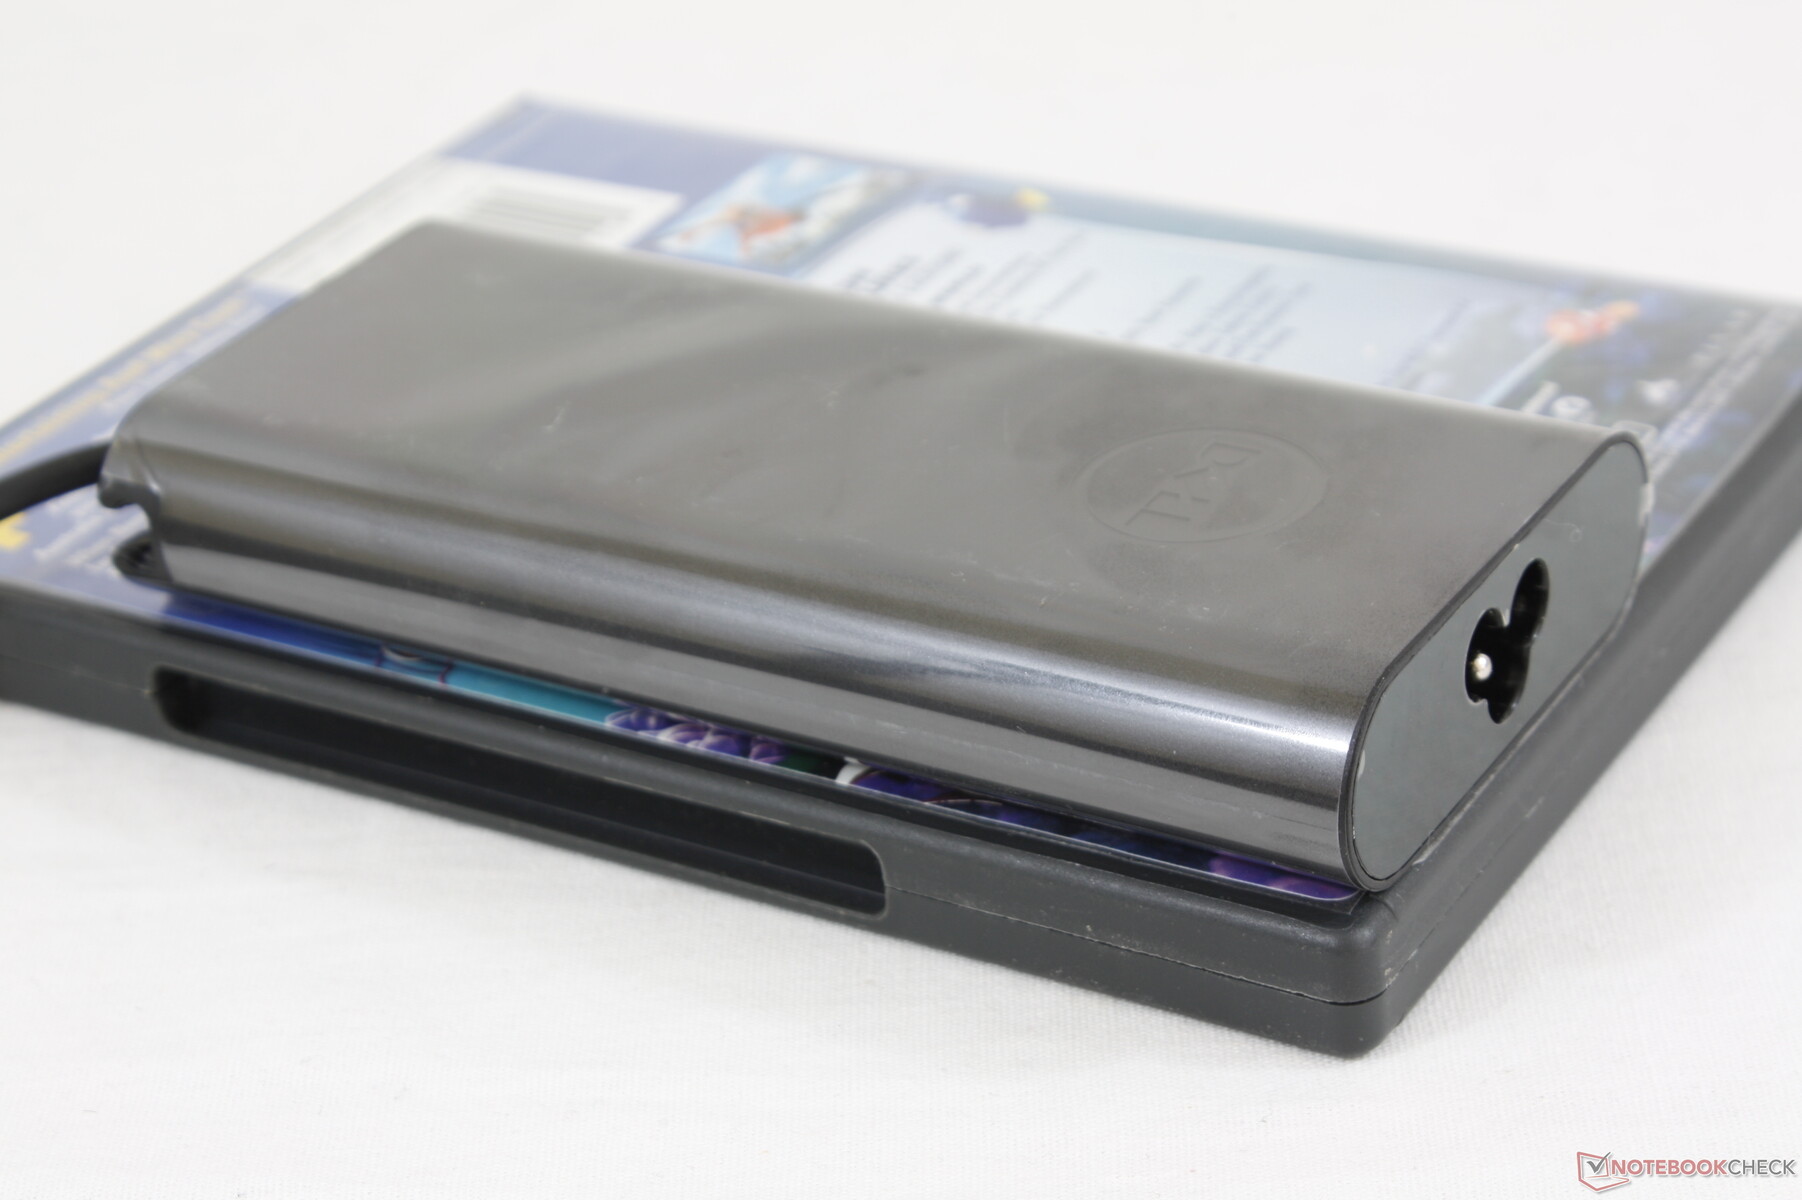
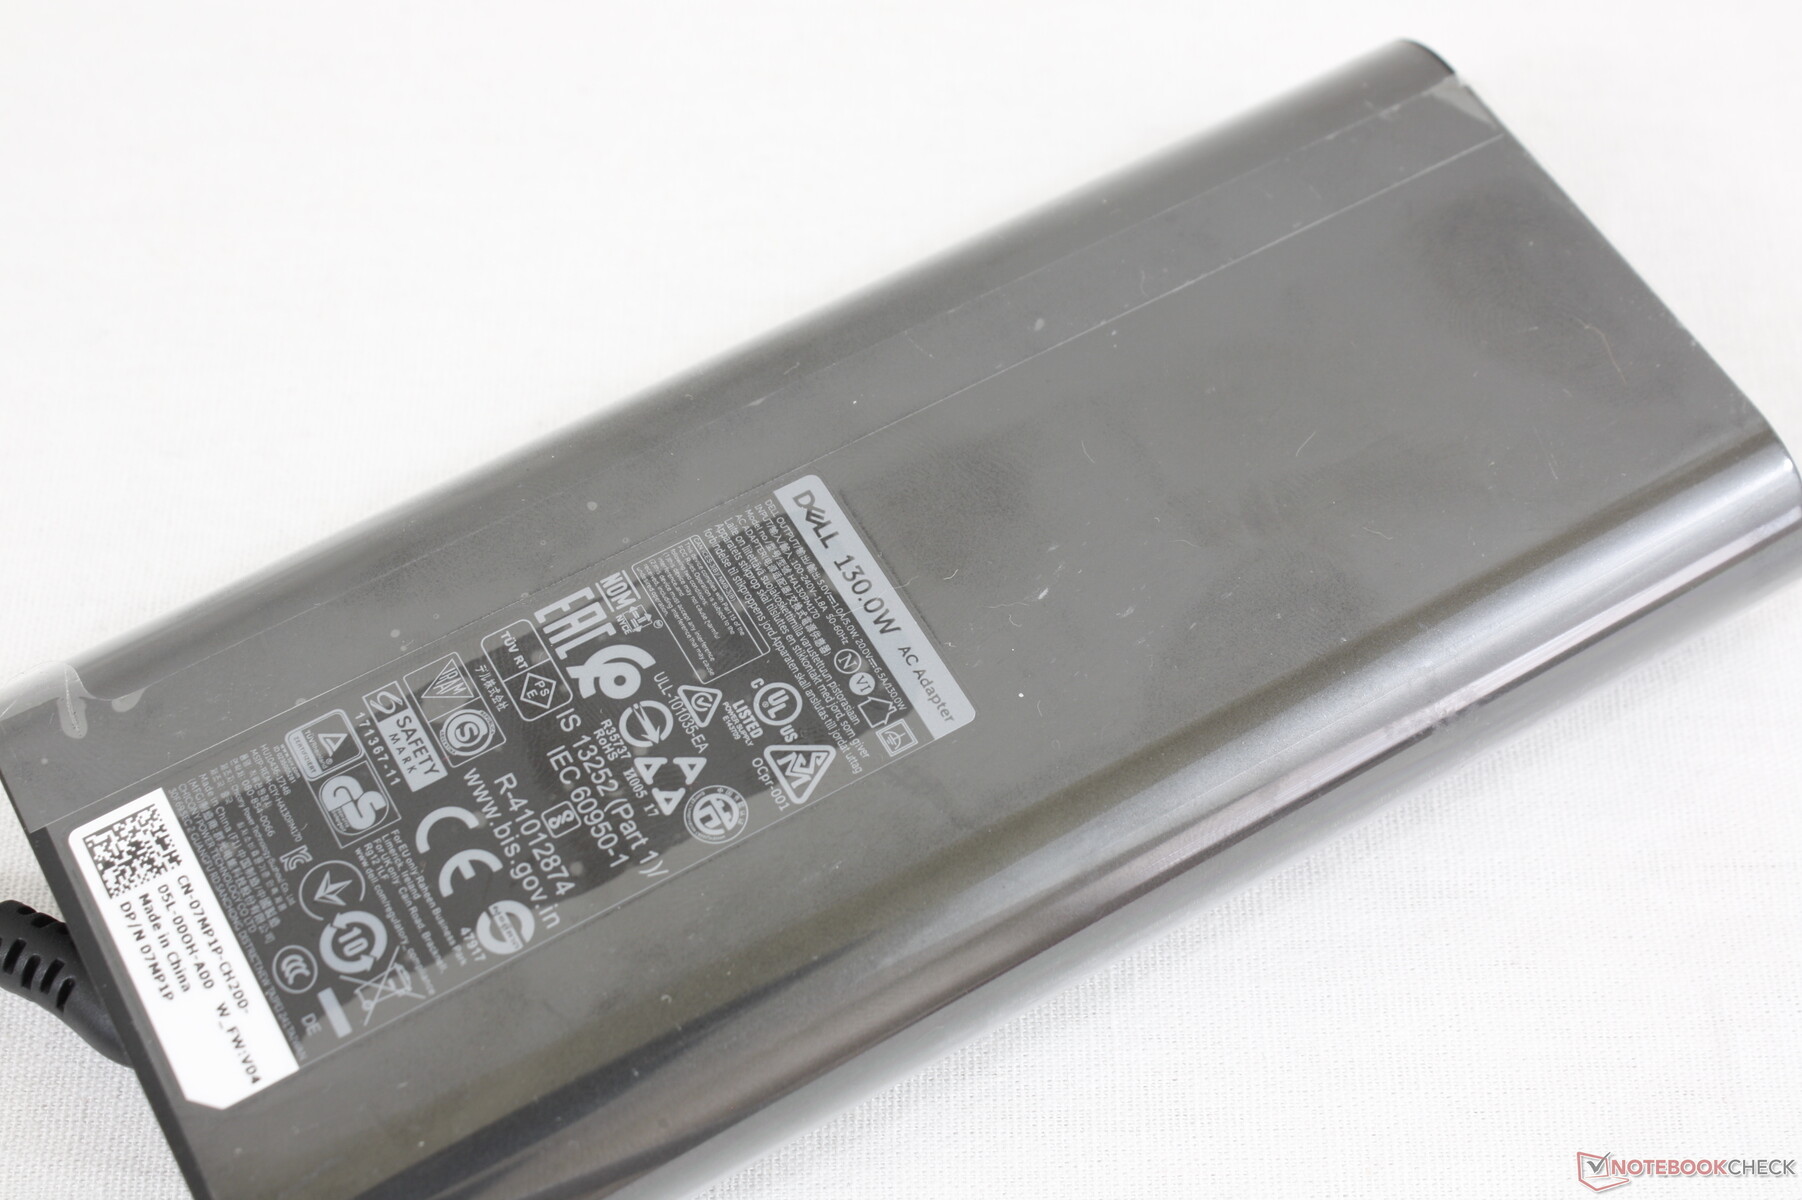
Power consumption becomes strange when running higher loads like gaming. Although the XPS 17 uses the same 130 W AC adapter as the XPS 15, it is unable to pull more than ~100 W no matter the onscreen load. The system must then pull power from the battery to make up for this difference which results in faster-than-expected battery drain over time even when connected to an outlet. When running Witcher 3, for example, battery percentage would drop by about 13 percent per hour.
Dell says it's currently investigating this issue with our full details here. Should anything change, we'll update this section as well. But for now, the system appears "capped" at ~100 W despite shipping with a 130 W AC adapter.
Also of note is that the system will pull 6.8 W from the outlet when in Sleep mode whereas most other laptops typically pull just 1 W to 2 W when under similar conditions.
| Kapalı / Bekleme modu | |
| Boşta | |
| Çalışırken |
|
Key:
min: | |
| Dell XPS 17 9700 Core i7 RTX 2060 Max-Q i7-10875H, GeForce RTX 2060 Max-Q, Micron 2200S 1TB MTFDHBA1T0TCK, IPS, 3840x2400, 17" | Acer Aspire Nitro 5 AN517-51-7887 i7-9750H, GeForce GTX 1660 Ti Mobile, WDC PC SN520 SDAPNUW-512G, IPS, 1920x1080, 17.3" | MSI Creator 17 A10SGS i7-10875H, GeForce RTX 2080 Super Max-Q, Samsung SSD PM981 MZVLB2T0HMLB, Mini-LED IPS-Level, 3840x2160, 17.3" | HP Envy 17t-cg000 i7-1065G7, GeForce MX330, WDC PC SN520 SDAPNUW-512G, IPS, 3840x2160, 17.3" | Gigabyte Aero 17 HDR XB i7-10875H, GeForce RTX 2070 Super Max-Q, Samsung SSD PM981a MZVLB512HBJQ, IPS, 3840x2160, 17.3" | Apple MacBook Pro 16 2019 i9 5500M i9-9880H, Radeon Pro 5500M, Apple SSD AP1024 7171, IPS, 3072x1920, 16" | |
|---|---|---|---|---|---|---|
| Power Consumption | 11% | -78% | 24% | -69% | 18% | |
| Idle Minimum * (Watt) | 5.8 | 3.9 33% | 15 -159% | 6.1 -5% | 16 -176% | 3.7 36% |
| Idle Average * (Watt) | 20.6 | 8.9 57% | 20 3% | 13 37% | 19 8% | 12.1 41% |
| Idle Maximum * (Watt) | 21 | 12.2 42% | 42 -100% | 13.5 36% | 30 -43% | 17 19% |
| Load Average * (Watt) | 104.7 | 83 21% | 150 -43% | 72.7 31% | 109 -4% | 91.5 13% |
| Witcher 3 ultra * (Watt) | 99.2 | 130 -31% | 170 -71% | 62.2 37% | 167 -68% | 103 -4% |
| Load Maximum * (Watt) | 107.6 | 168 -56% | 210 -95% | 97.1 10% | 246 -129% | 102.3 5% |
* ... daha küçük daha iyidir
Battery Life — 97 Wh For Travelers
Runtimes are almost identical to what we recorded on the XPS 15 despite the larger form factor and faster GPU. We got around 9.5 hours of real-world WLAN use which is very long for a 17-inch laptop with a Core H series processor and GeForce RTX GPU. Our WLAN test involves looping web pages every 40 seconds on the Balanced power profile with the integrated GPU enabled and at a display brightness of 150 nits.
Charging from empty to full capacity takes about 2 hours. Remember that charging will slow to a halt or even discharge when running very high processing loads for long periods.
| Dell XPS 17 9700 Core i7 RTX 2060 Max-Q i7-10875H, GeForce RTX 2060 Max-Q, 97 Wh | Razer Blade Pro 17 RTX 2070 Max-Q 300 Hz i7-10875H, GeForce RTX 2070 Max-Q, 70 Wh | MSI Creator 17 A10SGS i7-10875H, GeForce RTX 2080 Super Max-Q, 82 Wh | HP Envy 17t-cg000 i7-1065G7, GeForce MX330, 55 Wh | Gigabyte Aero 17 HDR XB i7-10875H, GeForce RTX 2070 Super Max-Q, 94 Wh | Apple MacBook Pro 16 2019 i9 5500M i9-9880H, Radeon Pro 5500M, 99.8 Wh | |
|---|---|---|---|---|---|---|
| Pil Çalışma Süresi | -49% | -57% | -39% | -26% | -13% | |
| Reader / Idle (h) | 23.8 | 7.2 -70% | 15.4 -35% | 9.9 -58% | ||
| WiFi v1.3 (h) | 9.7 | 4.9 -49% | 4.4 -55% | 4.6 -53% | 6.2 -36% | 12 24% |
| Load (h) | 2 | 1.1 -45% | 1.4 -30% | 2.3 15% | 1 -50% | |
| Witcher 3 ultra (h) | 0.9 |
Artılar
Eksiler
Verdict — One of a Kind
We commend the XPS 17 for pushing limits further than most other manufacturers out there. Nobody else has an ultra-thin 17.0-inch 16:10 laptop with an 8-core Core i7 CPU (soon to be Core i9) running at 99 C on full load alongside a GeForce RTX 2060 Max-Q GPU all powered by a USB-C adapter. It even manages to integrate a vapor chamber cooler — a feature mostly found on select gaming laptops. The risks and hardware involved are pretty insane relative to alternatives that usually play it safer.
From our time with the system, we think it could benefit from taking a step back and focusing on some of the basics again. Strengthen the hinges, make the clickpad keys firmer, integrate a webcam shutter, and improve the charging rate — all aspects that many laptops costing half the price have already nailed down.
Users intending to run the XPS 17 at high loads for extended periods should be aware of a few drawbacks. Firstly, the battery may not recharge since the USB-C adapter is limited to 130 W. There's a reason why most other GeForce RTX-powered laptops don't run on USB-C adapters and that's because proprietary barrel chargers are able to push much more power to the demanding system. Secondly, sustained gaming performance may not be steady as we are able to record recurring frame rate drops. When coupled with the noticeable ghosting, users shouldn't look at this as a gaming machine despite the Killer wireless and GeForce RTX graphics.
The XPS 17 is at its best for "bursty" operations like browsing or video editing where the system isn't at high utilization for hours at a time. The display, design, and performance-per-volume are what make the system more attractive than most other 15.6-inch and 17.3-inch solutions.
A one-of-a-kind 17-inch powerhouse laptop with no direct equal. The impressive hardware and appealing visual design will draw eyes, but some basic aspects need some more attention.
Dell XPS 17 9700 Core i7 RTX 2060 Max-Q
- 07/15/2020 v7 (old)
Allen Ngo
Price comparison

