2020 Razer Blade Pro 17 incelemesi: 300Hz bir laptopa gerçekten ihtiyacınız var mı?
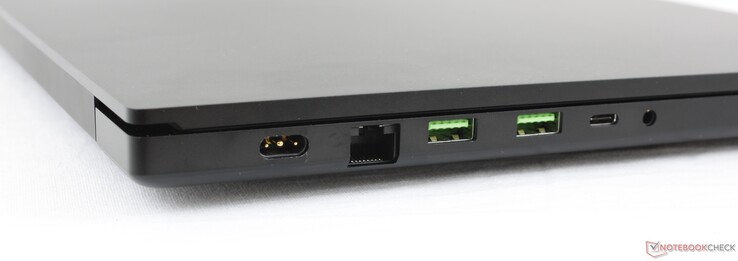
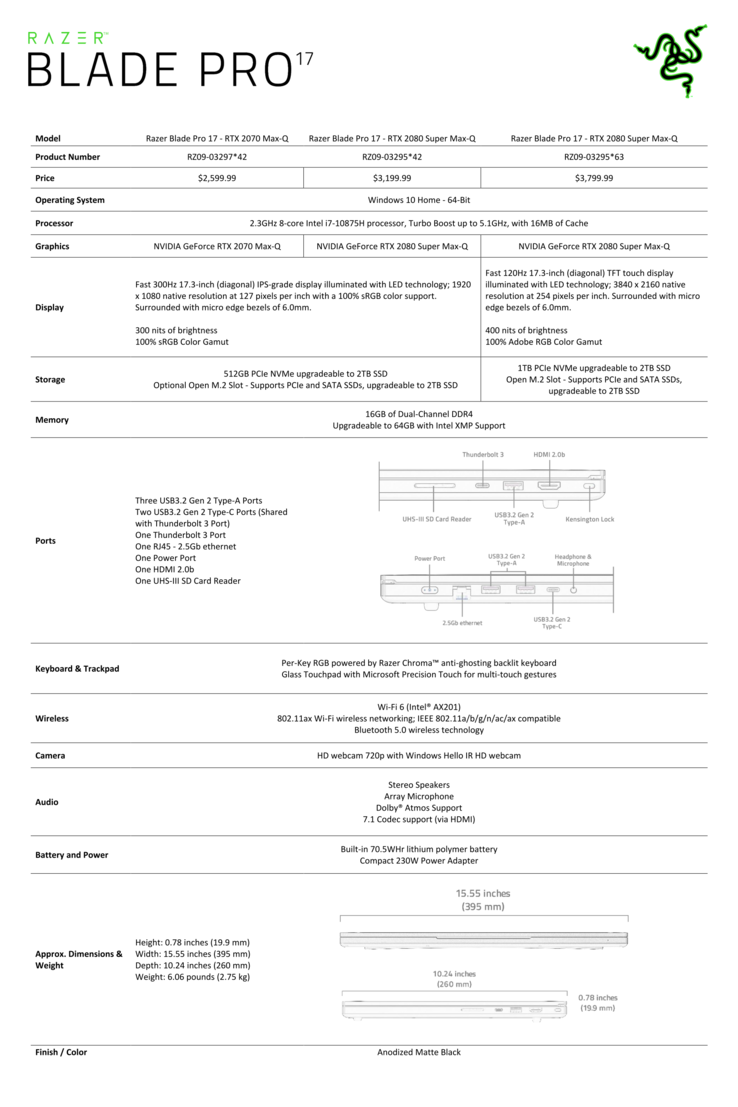
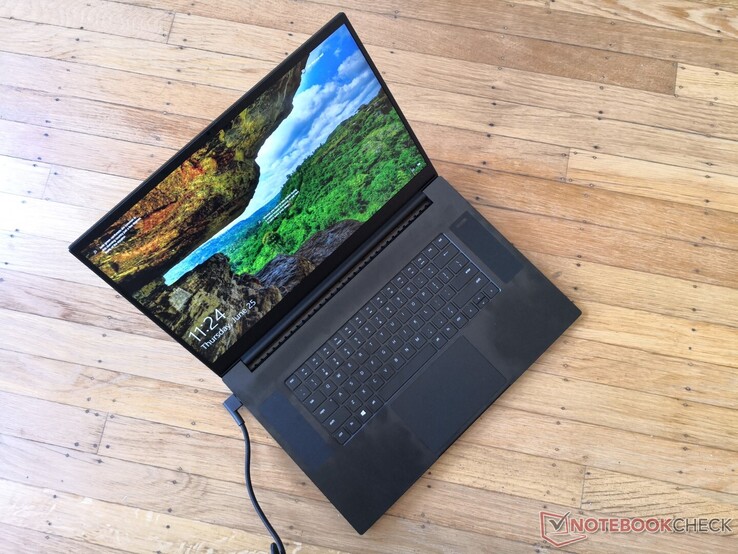
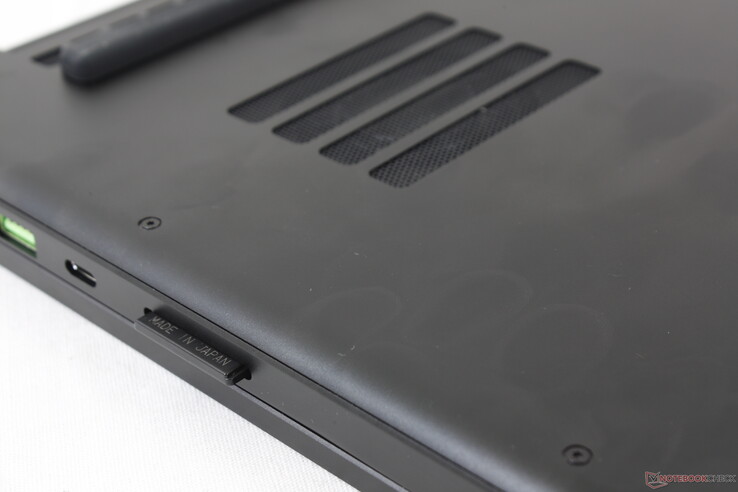
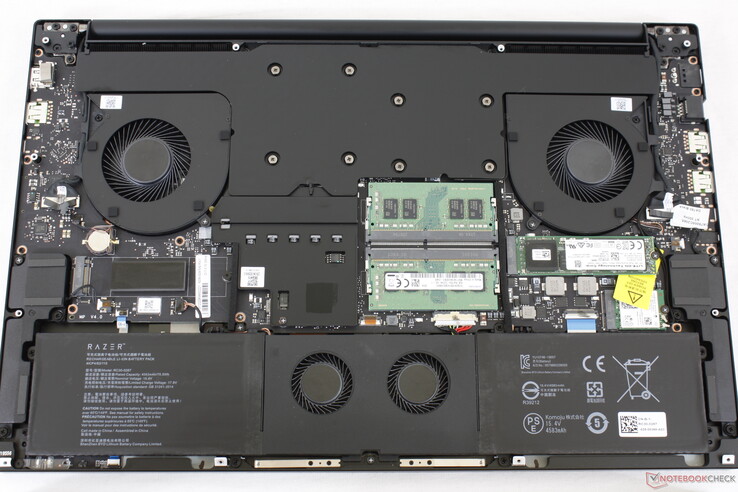
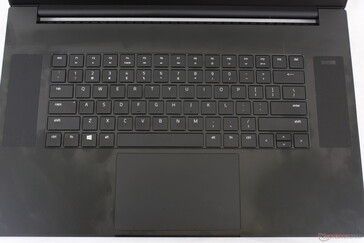
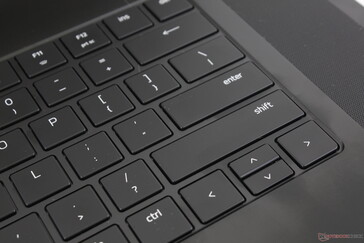
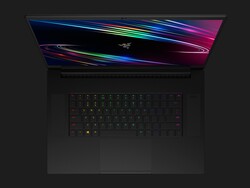
Razer, son zamanlarda 10.3 Core Core i7 işlemciler, isteğe bağlı GeForce Super Max-Q GPU'lar, daha fazla ekran seçeneği ve daha uzun bir Shift tuşu ile 17.3 inç Blade Pro 17 serilerini 2020 için yeniledi. Buradaki birimimiz, geçen yılki modelde "sadece" 240 Hz yerine 300 Hz ekran için dikkat çeken en son modelin en ucuz yapılandırmasıdır. 2020 Blade Pro 17, işlemci, ekran ve hafif klavye farklılıklarından başka aslında 2019 Blade Pro 17 ile aynı özellikler ve tasarım. Bu nedenle, dizüstü bilgisayarın şasi, bağlantı noktaları ve diğer fiziksel özellikleri hakkında daha fazla bilgi edinmek için 2019 modelindeki mevcut incelememize göz atmanızı öneririz. MSI GS75, Asus Zephyrus S GX701, Dell Alienware m17 R2 veya Eluktronics RP-17 gibi diğer yüksek kaliteli ultra ince 17,3 inç oyun dizüstü bilgisayarlarını içerir: Daha fazla Razer yorumu: Blade Pro 17 4K UHDBlade 15 Studio EditionBlade StealthRazer Phone 2
Top 10
» Top 10 Multimedia Notebook listesi
» Top 10 oyun notebooku
» Top 10 bütçeye uygun Ofis/İş Notebook Listesi
» Top 10 Premium Ofis/İş notebookları
» Top 10 Çalışma istasyonu laptopları
» Top 10 Subnotebook listesi
» Top 10 Ultrabooklar
» En iyi 10 dönüştürülebilir modeli
» Seçimi en iyi 10 tablet
» Notebookcheck Top 10 Windows Tabletleri
» Top 10 Subnotebook listesi
» NotebookCheck tarafından incelenen en iyi Notebook ekranları
» Notebookcheck'in 500 Euro altındaki en iyi 10 Notebook listesi
» NotebookCheck tarafından seçilen 300 Euro altındaki en iyi 10 Notebook
» Notebookcheck'in 500 Euro altındaki en iyi 10 Notebook listesi
» Notebookcheck'in Top 10 akıllı telefon listesi
» Notebookcheck'in Top 10 hafif oyun notebookları
Derecelendirme | Tarih | Modeli | Ağırlık | Yükseklik | Boyut | Çözünürlük | Fiyat |
|---|---|---|---|---|---|---|---|
| 87.4 % v7 (old) | 06/2020 | Razer Blade Pro 17 RTX 2070 Max-Q 300 Hz i7-10875H, GeForce RTX 2070 Max-Q | 2.7 kg | 19.9 mm | 17.30" | 1920x1080 | |
| 81.2 % v7 (old) | 12/2019 | Asus ROG Zephyrus S GX701GXR i7-9750H, GeForce RTX 2080 Max-Q | 2.7 kg | 18.7 mm | 17.30" | 1920x1080 | |
| 82.9 % v7 (old) | 07/2019 | MSI GS75 Stealth 9SG i7-9750H, GeForce RTX 2080 Max-Q | 2.3 kg | 18.9 mm | 17.30" | 1920x1080 | |
| 84.2 % v7 (old) | Alienware m17 R2 P41E i9-9980HK, GeForce RTX 2080 Max-Q | 2.6 kg | 20.5 mm | 17.30" | 1920x1080 | ||
| 86.5 % v7 (old) | 06/2020 | Aorus 17G XB i7-10875H, GeForce RTX 2070 Super Max-Q | 2.7 kg | 26 mm | 17.30" | 1920x1080 |
Durum
| SD Card Reader | |
| average JPG Copy Test (av. of 3 runs) | |
| Aorus 17G XB (Toshiba Exceria Pro SDXC 64 GB UHS-II) | |
| Razer Blade Pro 17 RTX 2070 Max-Q 300 Hz (Toshiba Exceria Pro SDXC 64 GB UHS-II) | |
| Dell XPS 15 9500 Core i7 4K UHD (Toshiba Exceria Pro SDXC 64 GB UHS-II) | |
| Razer Blade Pro 17 4K UHD 120 Hz (Toshiba Exceria Pro SDXC 64 GB UHS-II) | |
| MSI GS63VR 7RG-005 (Toshiba Exceria Pro SDXC 64 GB UHS-II) | |
| maximum AS SSD Seq Read Test (1GB) | |
| Aorus 17G XB (Toshiba Exceria Pro SDXC 64 GB UHS-II) | |
| Razer Blade Pro 17 RTX 2070 Max-Q 300 Hz (Toshiba Exceria Pro SDXC 64 GB UHS-II) | |
| MSI GS63VR 7RG-005 (Toshiba Exceria Pro SDXC 64 GB UHS-II) | |
| Razer Blade Pro 17 4K UHD 120 Hz (Toshiba Exceria Pro SDXC 64 GB UHS-II) | |
| Dell XPS 15 9500 Core i7 4K UHD (Toshiba Exceria Pro SDXC 64 GB UHS-II) | |
İletişim
| Networking | |
| iperf3 transmit AX12 | |
| Razer Blade Pro 17 RTX 2070 Max-Q 300 Hz | |
| Aorus 17G XB | |
| MSI Bravo 17 A4DDR | |
| Asus TUF A17 FA706IU-AS76 | |
| Alienware m17 R2 P41E | |
| iperf3 receive AX12 | |
| MSI Bravo 17 A4DDR | |
| Aorus 17G XB | |
| Razer Blade Pro 17 RTX 2070 Max-Q 300 Hz | |
| Alienware m17 R2 P41E | |
| Asus TUF A17 FA706IU-AS76 | |
Web kamerası
Giriş cihazları
Görüntüle
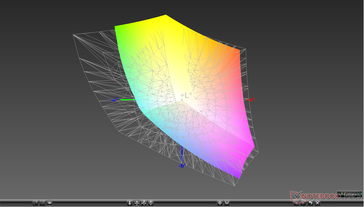
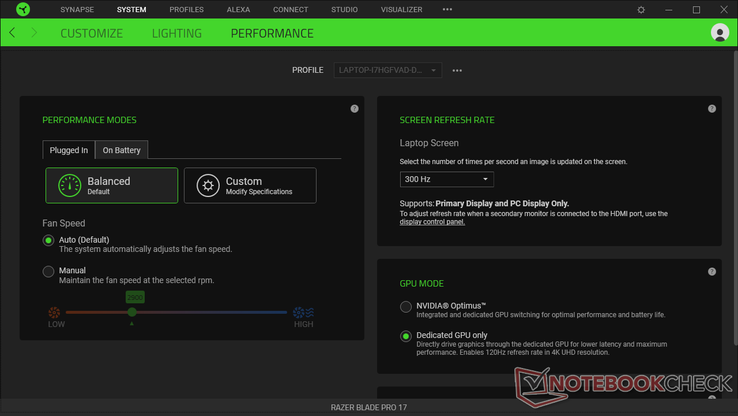
Yeni 1080p 300 Hz ekran, 2020 Blade Pro 17'yi önceki sürümlerden ayıran ayırt edici bir faktördür. Dizüstü bilgisayar, Blade 15 veya Gigabyte Aero 17'de "sadece" 240 Hz ile karşılaştırıldığında Sharp LQ173M1JW02 IPS paneliyle gelen ilk veritabanımızdır. Geçen yılın 4K UHD 120 Hz panelini tercih eden kullanıcılar bunun yerine 2020'de hala bu seçeneğe sahipler 1080p300 panel, belirgin çözünürlük ve yenileme hızı farklılıkları dışında yukarıda belirtilen parlak 4K120 panel ile karşılaştırıldığında bazı avantajlara ve dezavantajlara sahiptir. Parlaklık aralarında neredeyse aynı olmasına rağmen, 4K panel, daha derin ve daha doğru renkler için 300 Hz panelimizden daha geniş bir renk kapsamı ile biraz daha yüksek bir kontrast oranı sunar. Buna karşılık, 300 Hz panel gölgelenmeyi sınırlamak için daha hızlı siyah-beyaz ve gri-gri tepki sürelerine sahiptir. Söylemeye gerek yok, görsel deneyim günlük iş yüklerinde 240 Hz'den daha iyi hissetmese de 300 Hz yenileme hızı ipeksi bir pürüzsüzlük hissi veriyor.
| |||||||||||||||||||||||||
Aydınlatma: 78 %
Batarya modunda parlaklık: 328 cd/m²
Kontrast: 937:1 (Siyah: 0.35 cd/m²)
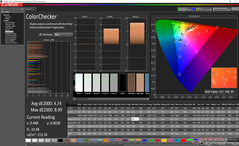
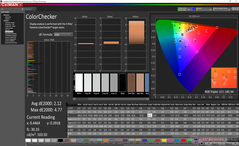
ΔE ColorChecker Calman: 4.74 | ∀{0.5-29.43 Ø4.77}
calibrated: 2.12
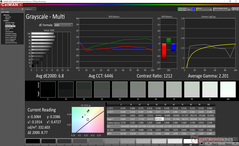
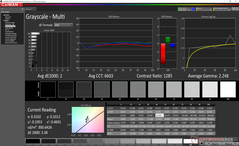
ΔE Greyscale Calman: 6.8 | ∀{0.09-98 Ø5}
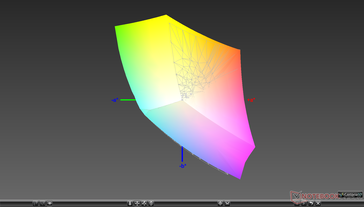
98.6% sRGB (Argyll 1.6.3 3D)
64.8% AdobeRGB 1998 (Argyll 1.6.3 3D)
73% AdobeRGB 1998 (Argyll 3D)
98.5% sRGB (Argyll 3D)
72.2% Display P3 (Argyll 3D)
Gamma: 2.2
CCT: 6446 K
| Razer Blade Pro 17 RTX 2070 Max-Q 300 Hz Sharp LQ173M1JW02, IPS, 17.3", 1920x1080 | Asus ROG Zephyrus S GX701GXR AU Optronics B173HAN05.1, IPS, 17.3", 1920x1080 | MSI GS75 Stealth 9SG Chi Mei N173HCE-G33 (CMN175C), IPS, 17.3", 1920x1080 | Alienware m17 R2 P41E Chi Mei 173HCE, CMN175F, IPS, 17.3", 1920x1080 | Aorus 17G XB AU Optronics B173HAN05.0 (AUO509D), IPS, 17.3", 1920x1080 | Razer Blade Pro 17 4K UHD 120 Hz AU Optronics B173ZAN03.3, IPS, 17.3", 3840x2160 | |
|---|---|---|---|---|---|---|
| Display | -2% | -10% | -1% | -1% | 18% | |
| Display P3 Coverage (%) | 72.2 | 70 -3% | 62.6 -13% | 70.8 -2% | 70.6 -2% | 84.8 17% |
| sRGB Coverage (%) | 98.5 | 96.6 -2% | 93.5 -5% | 98.5 0% | 97.2 -1% | 99.9 1% |
| AdobeRGB 1998 Coverage (%) | 73 | 72.3 -1% | 64.7 -11% | 72.2 -1% | 72.8 0% | 98.6 35% |
| Response Times | 11% | -17% | -110% | -106% | -90% | |
| Response Time Grey 50% / Grey 80% * (ms) | 5.6 ? | 5.6 ? -0% | 7.2 ? -29% | 17.2 ? -207% | 16 ? -186% | 15.2 ? -171% |
| Response Time Black / White * (ms) | 9.6 ? | 7.6 ? 21% | 10 ? -4% | 10.8 ? -13% | 12 ? -25% | 10.4 ? -8% |
| PWM Frequency (Hz) | 25510 ? | 26320 ? | ||||
| Screen | 23% | 31% | 32% | 31% | 3% | |
| Brightness middle (cd/m²) | 328 | 288 -12% | 366 12% | 384.2 17% | 293 -11% | 346.7 6% |
| Brightness (cd/m²) | 329 | 276 -16% | 343 4% | 357 9% | 285 -13% | 332 1% |
| Brightness Distribution (%) | 78 | 93 19% | 91 17% | 90 15% | 95 22% | 91 17% |
| Black Level * (cd/m²) | 0.35 | 0.24 31% | 0.29 17% | 0.29 17% | 0.24 31% | 0.27 23% |
| Contrast (:1) | 937 | 1200 28% | 1262 35% | 1325 41% | 1221 30% | 1284 37% |
| Colorchecker dE 2000 * | 4.74 | 1.92 59% | 1.51 68% | 1.35 72% | 1.27 73% | 5.62 -19% |
| Colorchecker dE 2000 max. * | 8.99 | 4.57 49% | 3.22 64% | 3.45 62% | 2.24 75% | 9.36 -4% |
| Colorchecker dE 2000 calibrated * | 2.12 | 1.14 46% | 0.71 67% | 1.42 33% | 1.06 50% | 3.81 -80% |
| Greyscale dE 2000 * | 6.8 | 3.08 55% | 1.93 72% | 1.2 82% | 1.34 80% | 5.5 19% |
| Gamma | 2.2 100% | 2.42 91% | 2.38 92% | 2.23 99% | 2.38 92% | 2.25 98% |
| CCT | 6446 101% | 7055 92% | 6881 94% | 6580 99% | 6542 99% | 6175 105% |
| Color Space (Percent of AdobeRGB 1998) (%) | 64.8 | 65 0% | 60 -7% | 65.5 1% | 73 13% | 87.2 35% |
| Color Space (Percent of sRGB) (%) | 98.6 | 96 -3% | 94 -5% | 98.5 0% | 94 -5% | 100 1% |
| Toplam Ortalama (Program / Ayarlar) | 11% /
17% | 1% /
18% | -26% /
8% | -25% /
8% | -23% /
-6% |
* ... daha küçük daha iyidir
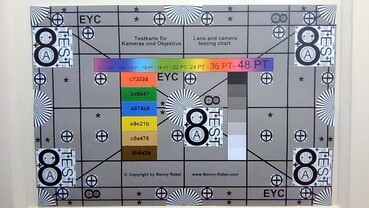
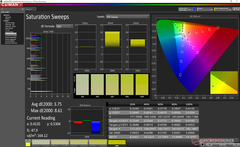
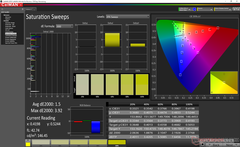
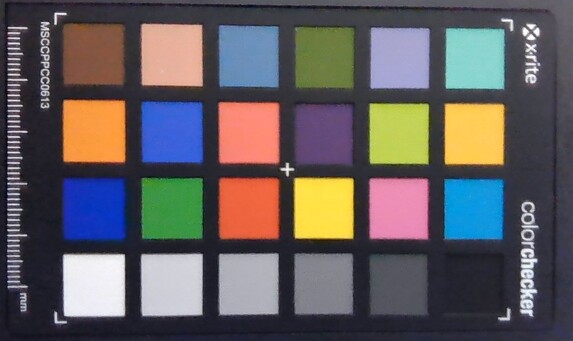
Ekran kutudan daha iyi kalibre edilmiş olabilir. Renk sıcaklığı biraz fazla sıcaktır ve bunun gibi amiral gemisi bir dizüstü bilgisayar için ortalama 6.8 gri tonlamalı DeltaE nispeten yüksektir. Paneli kendimiz kalibre etmek, daha doğru bir ekran için sorunları giderir.
Yanıt Sürelerini Görüntüle
| ↔ Tepki Süresi Siyahtan Beyaza | ||
|---|---|---|
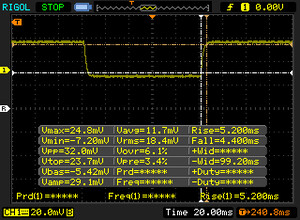
| 9.6 ms ... yükseliş ↗ ve sonbahar↘ birleşimi | ↗ 5.2 ms yükseliş | |
| ↘ 4.4 ms sonbahar | ||
| Ekran, testlerimizde hızlı yanıt oranları gösteriyor ve oyun oynamaya uygun olmalı. Karşılaştırıldığında, test edilen tüm cihazlar 0.1 (minimum) ile 240 (maksimum) ms arasında değişir. » Tüm cihazların 25 %'si daha iyi. Bu, ölçülen yanıt süresinin test edilen tüm cihazların ortalamasından (20.2 ms) daha iyi olduğu anlamına gelir. | ||
| ↔ Tepki Süresi %50 Griden %80 Griye | ||
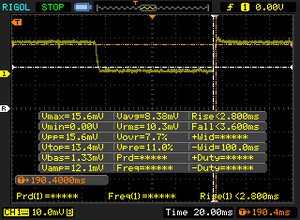
| 5.6 ms ... yükseliş ↗ ve sonbahar↘ birleşimi | ↗ 2.6 ms yükseliş | |
| ↘ 3 ms sonbahar | ||
| Ekran, testlerimizde çok hızlı yanıt oranları gösteriyor ve hızlı oyun oynamaya çok uygun olmalı. Karşılaştırıldığında, test edilen tüm cihazlar 0.165 (minimum) ile 636 (maksimum) ms arasında değişir. » Tüm cihazların 17 %'si daha iyi. Bu, ölçülen yanıt süresinin test edilen tüm cihazların ortalamasından (31.5 ms) daha iyi olduğu anlamına gelir. | ||
Ekran Titremesi / PWM (Darbe Genişliği Modülasyonu)
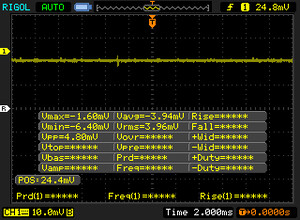
| Ekran titriyor / PWM algılanmadı | |||
Karşılaştırıldığında: Test edilen tüm cihazların %53 %'si ekranı karartmak için PWM kullanmıyor. PWM tespit edilirse, ortalama 8070 (minimum: 5 - maksimum: 343500) Hz ölçüldü. | |||
Dış mekan görünürlüğü, 2019 modelinden veya bu konudaki diğer oyun dizüstü bilgisayarlarından çok daha iyi veya daha kötü değildir. ~ 300 nit ekran, mat katmana bakılmaksızın böyle parlak ortam aydınlatmasının üstesinden gelecek şekilde tasarlanmamıştır.
Verim
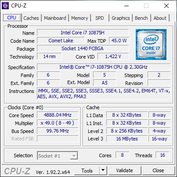
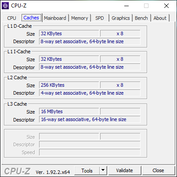
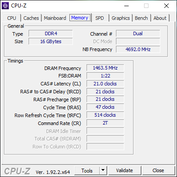
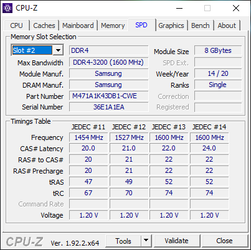
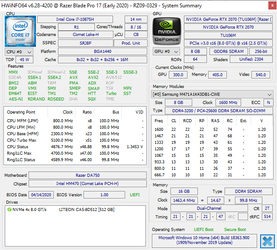
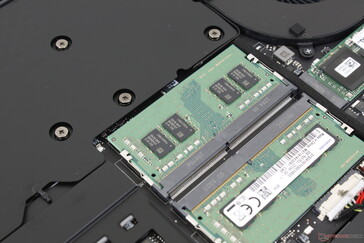
Tüm 2020 seçenekleri, geçen yılki 9. nesil altıgen çekirdekli Core i7-9750H'yi başarmak için 10. nesil sekiz çekirdekli Core i7-10875H ile standart olarak geliyor. Diğer oyun dizüstü bilgisayarlarının aksine Razer, hexa-core Core i7-10750H'yi sunmaz. Core i9 da burada mevcut değil, ancak bu ince ve hafif oyun dizüstü bilgisayarları için MSI GS66'da gördüklerimize dayanarak önerebileceğimiz bir şey değil.RAM DDR4-2667'den DDR4-2933'e yükseltildi . İki erişilebilir SODIMM yuvası 64 GB'a kadar izin verir.Nvidia Optimus dahil değildir, ancak kullanıcılar Razer Synapse yazılımı aracılığıyla entegre ve ayrık GPU'lar arasında manuel olarak geçiş yapabilir. Her seferinde yeniden başlatma gerekecektir. Manuel grafik geçişi genellikle G-Sync desteği anlamına gelir, ancak burada mevcut değildir. Rahatsız edici bir şekilde, sistemi kablosuz devre dışı bırakıldığında Razer Synapse her zaman giriş ekranında sıkışacaktır. Kablosuz ekranını yeniden etkinleştirmeniz ve ardından giriş ekranını geçmek için Synapse'i tamamen yeniden başlatmanız gerekir.
İşlemci
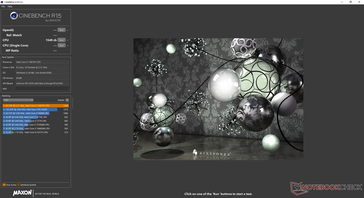
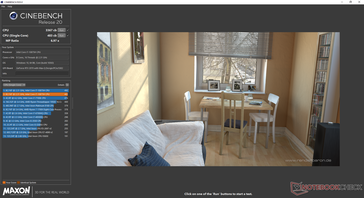
CPU performansı, veritabanımızdaki ortalama Core i7-10875H işlemciden biraz daha yavaştır. Yine de, ham çok iş parçacıklı performans, Core i7-9750H ile geçen yılki Blade Pro 17'ye göre yaklaşık yüzde 45 daha hızlı. Bu elbette yüzde 45 daha hızlı kare hızlarına dönüşmeyecek, ancak içerik oluşturucular neredeyse kesinlikle ek çekirdeklerden daha fazla faydalanacak. AMD'nin bugüne kadar etkileyici Ryzen serisi ile Intel'e çok fazla baskı yaptığı için Razer'ın Ryzen 7 4800H seçenekleri sunmaması çok kötü. CineBench R15 Multi-Thread'ı bir döngüde çalıştırırken, 1494'ün ilk yüksek puanı yaklaşık yüzde 9'luk bir performans düşüşünü temsil etmek için ikinci döngü 1360 puana iner. Daha fazla teknik bilgi ve karşılaştırma karşılaştırmaları için Core i7-10875H'deki özel sayfamıza bakın.
Cinebench R15: CPU Multi 64Bit | CPU Single 64Bit
Blender: v2.79 BMW27 CPU
7-Zip 18.03: 7z b 4 -mmt1 | 7z b 4
Geekbench 5.5: Single-Core | Multi-Core
HWBOT x265 Benchmark v2.2: 4k Preset
LibreOffice : 20 Documents To PDF
R Benchmark 2.5: Overall mean
| Cinebench R20 / CPU (Multi Core) | |
| Asus Zephyrus G14 GA401IV | |
| Alienware m17 R2 P41E | |
| Asus TUF A17 FA706IU-AS76 | |
| MSI GE66 Raider 10SFS | |
| MSI GE75 9SG | |
| Ortalama Intel Core i7-10875H (1986 - 4176, n=32) | |
| Razer Blade Pro 17 RTX 2070 Max-Q 300 Hz | |
| Acer Nitro 5 AN515-44-R5FT | |
| Acer Nitro 5 AN517-52-77DS | |
| Razer Blade Pro 17 4K UHD 120 Hz | |
| MSI GF75 Thin 10SCXR | |
| Cinebench R20 / CPU (Single Core) | |
| Asus Zephyrus G14 GA401IV | |
| Ortalama Intel Core i7-10875H (430 - 524, n=32) | |
| Razer Blade Pro 17 RTX 2070 Max-Q 300 Hz | |
| Alienware m17 R2 P41E | |
| Acer Nitro 5 AN517-52-77DS | |
| Asus TUF A17 FA706IU-AS76 | |
| MSI GE66 Raider 10SFS | |
| MSI GE75 9SG | |
| MSI GF75 Thin 10SCXR | |
| Razer Blade Pro 17 4K UHD 120 Hz | |
| Acer Nitro 5 AN515-44-R5FT | |
| Cinebench R15 / CPU Multi 64Bit | |
| Asus Zephyrus G14 GA401IV | |
| Asus TUF A17 FA706IU-AS76 | |
| Alienware m17 R2 P41E | |
| MSI GE75 9SG | |
| MSI GE66 Raider 10SFS | |
| Ortalama Intel Core i7-10875H (1003 - 1833, n=38) | |
| Razer Blade Pro 17 RTX 2070 Max-Q 300 Hz | |
| Acer Nitro 5 AN515-44-R5FT | |
| Acer Nitro 5 AN517-52-77DS | |
| Razer Blade Pro 17 4K UHD 120 Hz | |
| MSI GF75 Thin 10SCXR | |
| Cinebench R15 / CPU Single 64Bit | |
| MSI GE66 Raider 10SFS | |
| Ortalama Intel Core i7-10875H (190 - 220, n=37) | |
| Razer Blade Pro 17 RTX 2070 Max-Q 300 Hz | |
| Acer Nitro 5 AN517-52-77DS | |
| Alienware m17 R2 P41E | |
| Asus Zephyrus G14 GA401IV | |
| MSI GE75 9SG | |
| Asus TUF A17 FA706IU-AS76 | |
| MSI GF75 Thin 10SCXR | |
| Acer Nitro 5 AN515-44-R5FT | |
| Razer Blade Pro 17 4K UHD 120 Hz | |
| Blender / v2.79 BMW27 CPU | |
| MSI GF75 Thin 10SCXR | |
| Acer Nitro 5 AN517-52-77DS | |
| Acer Nitro 5 AN515-44-R5FT | |
| Ortalama Intel Core i7-10875H (259 - 535, n=30) | |
| Razer Blade Pro 17 RTX 2070 Max-Q 300 Hz | |
| Asus Zephyrus G14 GA401IV | |
| MSI GE75 9SG | |
| MSI GE66 Raider 10SFS | |
| Asus TUF A17 FA706IU-AS76 | |
| 7-Zip 18.03 / 7z b 4 -mmt1 | |
| MSI GE66 Raider 10SFS | |
| Ortalama Intel Core i7-10875H (5071 - 5780, n=31) | |
| Razer Blade Pro 17 RTX 2070 Max-Q 300 Hz | |
| Acer Nitro 5 AN517-52-77DS | |
| MSI GE75 9SG | |
| Asus TUF A17 FA706IU-AS76 | |
| MSI GF75 Thin 10SCXR | |
| Asus Zephyrus G14 GA401IV | |
| Acer Nitro 5 AN515-44-R5FT | |
| Geekbench 5.5 / Single-Core | |
| MSI GE66 Raider 10SFS | |
| Ortalama Intel Core i7-10875H (1233 - 1371, n=29) | |
| Razer Blade Pro 17 RTX 2070 Max-Q 300 Hz | |
| Acer Nitro 5 AN517-52-77DS | |
| Asus Zephyrus G14 GA401IV | |
| Asus TUF A17 FA706IU-AS76 | |
| MSI GF75 Thin 10SCXR | |
| Acer Nitro 5 AN515-44-R5FT | |
| Geekbench 5.5 / Multi-Core | |
| MSI GE66 Raider 10SFS | |
| Asus TUF A17 FA706IU-AS76 | |
| Ortalama Intel Core i7-10875H (5715 - 8620, n=29) | |
| Asus Zephyrus G14 GA401IV | |
| Razer Blade Pro 17 RTX 2070 Max-Q 300 Hz | |
| Acer Nitro 5 AN517-52-77DS | |
| Acer Nitro 5 AN515-44-R5FT | |
| MSI GF75 Thin 10SCXR | |
| HWBOT x265 Benchmark v2.2 / 4k Preset | |
| MSI GE66 Raider 10SFS | |
| Asus TUF A17 FA706IU-AS76 | |
| Asus Zephyrus G14 GA401IV | |
| MSI GE75 9SG | |
| Ortalama Intel Core i7-10875H (7.27 - 14.1, n=27) | |
| Acer Nitro 5 AN517-52-77DS | |
| Acer Nitro 5 AN515-44-R5FT | |
| MSI GF75 Thin 10SCXR | |
| LibreOffice / 20 Documents To PDF | |
| Acer Nitro 5 AN515-44-R5FT | |
| Asus TUF A17 FA706IU-AS76 | |
| MSI GF75 Thin 10SCXR | |
| Razer Blade Pro 17 RTX 2070 Max-Q 300 Hz | |
| MSI GE66 Raider 10SFS | |
| Ortalama Intel Core i7-10875H (30.2 - 84.3, n=30) | |
| Acer Nitro 5 AN517-52-77DS | |
| R Benchmark 2.5 / Overall mean | |
| MSI GF75 Thin 10SCXR | |
| Acer Nitro 5 AN517-52-77DS | |
| Acer Nitro 5 AN515-44-R5FT | |
| Asus TUF A17 FA706IU-AS76 | |
| Ortalama Intel Core i7-10875H (0.546 - 0.662, n=29) | |
| MSI GE66 Raider 10SFS | |
* ... daha küçük daha iyidir
| PCMark 10 | |
| Score | |
| Aorus 17G XB | |
| Razer Blade Pro 17 RTX 2070 Max-Q 300 Hz | |
| Razer Blade Pro 17 4K UHD 120 Hz | |
| Asus ROG Zephyrus S GX701GXR | |
| MSI GS75 Stealth 9SG | |
| Alienware m17 R2 P41E | |
| Essentials | |
| Aorus 17G XB | |
| Alienware m17 R2 P41E | |
| Razer Blade Pro 17 4K UHD 120 Hz | |
| Razer Blade Pro 17 RTX 2070 Max-Q 300 Hz | |
| MSI GS75 Stealth 9SG | |
| Asus ROG Zephyrus S GX701GXR | |
| Productivity | |
| Alienware m17 R2 P41E | |
| Aorus 17G XB | |
| Razer Blade Pro 17 RTX 2070 Max-Q 300 Hz | |
| Asus ROG Zephyrus S GX701GXR | |
| MSI GS75 Stealth 9SG | |
| Razer Blade Pro 17 4K UHD 120 Hz | |
| Digital Content Creation | |
| Aorus 17G XB | |
| Razer Blade Pro 17 4K UHD 120 Hz | |
| Razer Blade Pro 17 RTX 2070 Max-Q 300 Hz | |
| Asus ROG Zephyrus S GX701GXR | |
| MSI GS75 Stealth 9SG | |
| Alienware m17 R2 P41E | |
| PCMark 8 | |
| Home Score Accelerated v2 | |
| Asus ROG Zephyrus S GX701GXR | |
| Razer Blade Pro 17 RTX 2070 Max-Q 300 Hz | |
| MSI GS75 Stealth 9SG | |
| Alienware m17 R2 P41E | |
| Razer Blade Pro 17 4K UHD 120 Hz | |
| Work Score Accelerated v2 | |
| Asus ROG Zephyrus S GX701GXR | |
| Razer Blade Pro 17 RTX 2070 Max-Q 300 Hz | |
| Alienware m17 R2 P41E | |
| MSI GS75 Stealth 9SG | |
| Razer Blade Pro 17 4K UHD 120 Hz | |
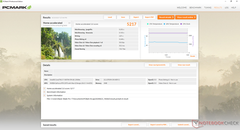
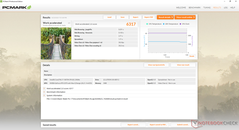
| PCMark 8 Home Score Accelerated v2 | 5217 puan | |
| PCMark 8 Work Score Accelerated v2 | 6317 puan | |
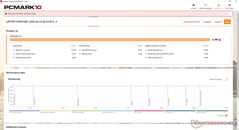
| PCMark 10 Score | 6290 puan | |
Yardım | ||
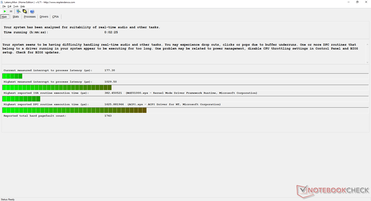
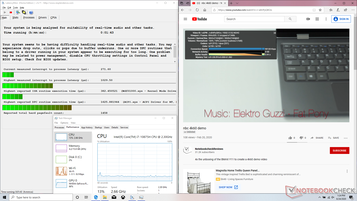
DPC Gecikmesi
| DPC Latencies / LatencyMon - interrupt to process latency (max), Web, Youtube, Prime95 | |
| Asus TUF A17 FA706IU-AS76 | |
| MSI GF75 Thin 10SCXR | |
| Asus Zephyrus G14 GA401IV | |
| Razer Blade Pro 17 RTX 2070 Max-Q 300 Hz | |
* ... daha küçük daha iyidir
Depolama aygıtları
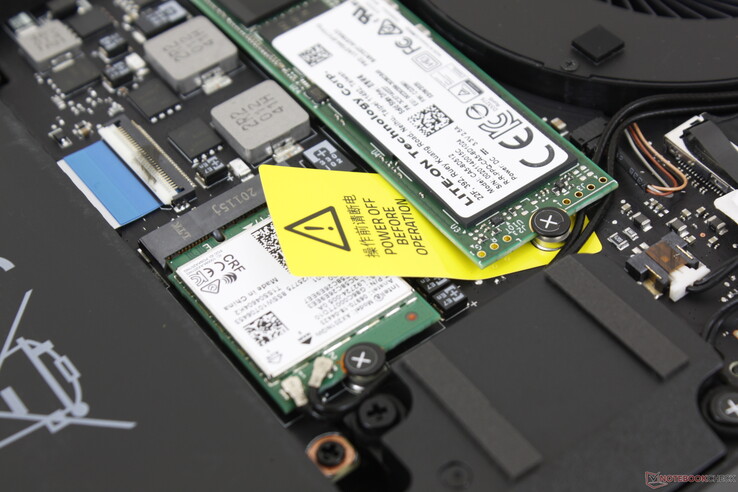
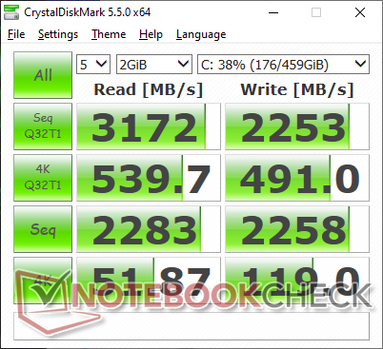
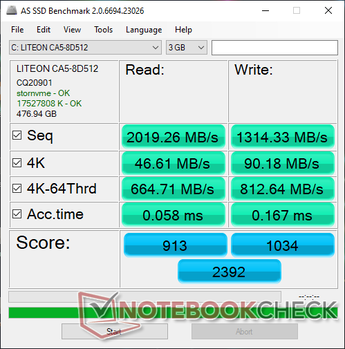
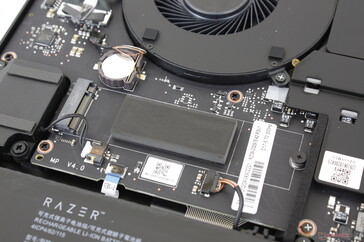
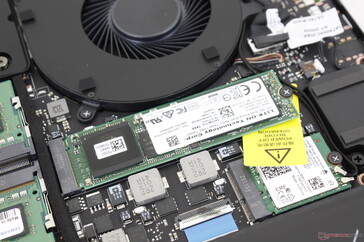
Hemen hemen tüm Razer dizüstü bilgisayarlar bir Samsung veya Lite-On SSD ile birlikte gelir, ancak ikisinden hangisini alabileceğinizi bilmek zordur. Özel ünitemiz, Samsung SSD PM981a'dan genellikle daha yavaş performans için 512 GB Lite-On CA5-8D512 NVMe sürücüyle donatılmıştır. Bununla birlikte, çok sayıda küçük dosyayla çalışan bir içerik oluşturucu değilseniz, muhtemelen farkı fark etmeyeceksiniz.
| Razer Blade Pro 17 RTX 2070 Max-Q 300 Hz Lite-On CA5-8D512 | MSI GS75 Stealth 9SG 2x Samsung SSD PM981 MZVLB1T0HALR (RAID 0) | Alienware m17 R2 P41E 2x SK Hynix PC601 NVMe 512 GB (RAID 0) | Aorus 17G XB Samsung SSD PM981a MZVLB512HBJQ | Razer Blade Pro 17 4K UHD 120 Hz Samsung SSD PM981 MZVLB1T0HALR | |
|---|---|---|---|---|---|
| AS SSD | 41% | 26% | 68% | 54% | |
| Seq Read (MB/s) | 2019 | 2855 41% | 1938 -4% | 1791 -11% | 1881 -7% |
| Seq Write (MB/s) | 1314 | 2687 104% | 2094 59% | 2193 67% | 2354 79% |
| 4K Read (MB/s) | 46.61 | 30.31 -35% | 25.88 -44% | 50.7 9% | 43.42 -7% |
| 4K Write (MB/s) | 90.2 | 96.3 7% | 100.8 12% | 116.8 29% | 104.1 15% |
| 4K-64 Read (MB/s) | 665 | 1460 120% | 1217 83% | 1525 129% | 1805 171% |
| 4K-64 Write (MB/s) | 813 | 1224 51% | 1137 40% | 1958 141% | 1775 118% |
| Access Time Read * (ms) | 0.058 | 0.054 7% | 0.051 12% | 0.07 -21% | 0.049 16% |
| Access Time Write * (ms) | 0.167 | 0.038 77% | 0.107 36% | 0.032 81% | 0.106 37% |
| Score Read (Points) | 913 | 1776 95% | 1437 57% | 1755 92% | 2037 123% |
| Score Write (Points) | 1034 | 1589 54% | 1447 40% | 2294 122% | 2115 105% |
| Score Total (Points) | 2392 | 4259 78% | 3624 52% | 4972 108% | 5215 118% |
| Copy ISO MB/s (MB/s) | 1715 | 2226 30% | 1926 12% | 1877 9% | |
| Copy Program MB/s (MB/s) | 622 | 426.4 -31% | 626 1% | 539 -13% | |
| Copy Game MB/s (MB/s) | 1506 | 1152 -24% | 1533 2% | 1368 -9% | |
| CrystalDiskMark 5.2 / 6 | 4% | -3% | 5% | -10% | |
| Write 4K (MB/s) | 119 | 95.5 -20% | 110.6 -7% | 123.4 4% | 121.7 2% |
| Read 4K (MB/s) | 51.9 | 42.59 -18% | 41.46 -20% | 45.02 -13% | 43.81 -16% |
| Write Seq (MB/s) | 2258 | 2851 26% | 2378 5% | 2526 12% | 1276 -43% |
| Read Seq (MB/s) | 2283 | 2696 18% | 2114 -7% | 2062 -10% | 1183 -48% |
| Write 4K Q32T1 (MB/s) | 491 | 402.6 -18% | 445.4 -9% | 497.9 1% | 527 7% |
| Read 4K Q32T1 (MB/s) | 540 | 443.9 -18% | 509 -6% | 579 7% | 592 10% |
| Write Seq Q32T1 (MB/s) | 2253 | 3420 52% | 2735 21% | 2982 32% | 2379 6% |
| Read Seq Q32T1 (MB/s) | 3172 | 3514 11% | 3206 1% | 3440 8% | 3213 1% |
| Toplam Ortalama (Program / Ayarlar) | 23% /
28% | 12% /
15% | 37% /
41% | 22% /
31% |
* ... daha küçük daha iyidir
Disk Throttling: DiskSpd Read Loop, Queue Depth 8
GPU Performansı
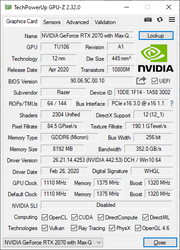
Geçmişte, eski Max-Q ve daha yeni Super Max-Q GeForce GPU'lar arasındaki performans farklarının o kadar dar olabileceğini, eski Max-Q GPU'larına sahip bazı dizüstü bilgisayarların bazen daha yeni Super Max-Q muadillerinden daha iyi performans gösterebileceğini kaydettik. Bu durumda, Razer'ımızdaki RTX 2070 Max-Q, Aorus 17G'deki yeni RTX 2070 Süper Max-Q'yu ve hatta MSI GS66'daki RTX 2080 Süper Max-Q'yu sürekli olarak geride bırakabilir. Razer bir RTX 2080 Super Max-Q seçeneği de sunuyor, ancak RTX 2070 Max-Q ile "yerleşmeye" karar verirseniz çok fazla kaybolacağınızı düşünmeyin. GeForce RTX 2070 Max'deki özel sayfamıza bakın. -Q daha teknik bilgi ve oyun kriterleri için.
| 3DMark 11 | |
| 1280x720 Performance GPU | |
| Eurocom Sky X4C i9-9900KS | |
| Razer Blade Pro 17 RTX 2080 Max-Q | |
| Aorus 17G XB | |
| Razer Blade Pro 17 RTX 2070 Max-Q 300 Hz | |
| MSI GS66 10SGS | |
| MSI RTX 2060 Gaming Z 6G | |
| Dell G5 15 SE 5505 P89F | |
| Asus ASUS ROG Strix SCAR III G731GW-XB74 | |
| Ortalama NVIDIA GeForce RTX 2070 Max-Q (14723 - 27694, n=31) | |
| Razer Blade 15 GTX 1660 Ti | |
| Asus Strix GL703VM-DB74 | |
| MSI GF75 Thin 10SCXR | |
| 1280x720 Performance Combined | |
| Eurocom Sky X4C i9-9900KS | |
| Aorus 17G XB | |
| Razer Blade Pro 17 RTX 2070 Max-Q 300 Hz | |
| MSI RTX 2060 Gaming Z 6G | |
| MSI GS66 10SGS | |
| Dell G5 15 SE 5505 P89F | |
| Ortalama NVIDIA GeForce RTX 2070 Max-Q (9107 - 17603, n=30) | |
| Razer Blade Pro 17 RTX 2080 Max-Q | |
| Razer Blade 15 GTX 1660 Ti | |
| Asus ASUS ROG Strix SCAR III G731GW-XB74 | |
| MSI GF75 Thin 10SCXR | |
| Asus Strix GL703VM-DB74 | |
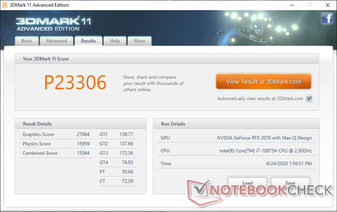
| 3DMark 11 Performance | 23306 puan | |
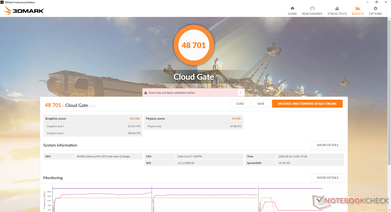
| 3DMark Cloud Gate Standard Score | 48701 puan | |
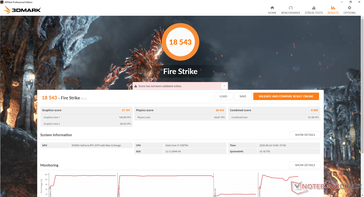
| 3DMark Fire Strike Score | 18543 puan | |
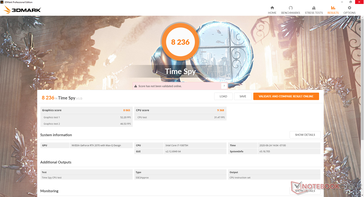
| 3DMark Time Spy Score | 8236 puan | |
Yardım | ||
| The Witcher 3 | |
| 1920x1080 Ultra Graphics & Postprocessing (HBAO+) | |
| Aorus 17 YA | |
| MSI GE66 Raider 10SFS | |
| Lenovo Legion Y740-17IRHg-81UJ001VGE | |
| Razer Blade Pro 17 RTX 2070 Max-Q 300 Hz | |
| MSI GS66 10SGS | |
| Aorus 17G XB | |
| Ortalama NVIDIA GeForce RTX 2070 Max-Q (56 - 83.8, n=31) | |
| Acer Nitro 5 AN517-52-77DS | |
| Asus TUF A17 FA706IU-AS76 | |
| EVGA SC15 | |
| Lenovo IdeaPad Gaming 3i 15IMH05 | |
| 1920x1080 High Graphics & Postprocessing (Nvidia HairWorks Off) | |
| MSI GE66 Raider 10SFS | |
| Razer Blade Pro 17 RTX 2070 Max-Q 300 Hz | |
| Lenovo Legion Y740-17IRHg-81UJ001VGE | |
| MSI GS66 10SGS | |
| Aorus 17G XB | |
| Ortalama NVIDIA GeForce RTX 2070 Max-Q (86.5 - 151.4, n=22) | |
| Acer Nitro 5 AN517-52-77DS | |
| Asus TUF A17 FA706IU-AS76 | |
| EVGA SC15 | |
| Lenovo IdeaPad Gaming 3i 15IMH05 | |
| düşük | orta | yüksek | ultra | |
|---|---|---|---|---|
| The Witcher 3 (2015) | 355.6 | 254.3 | 151.4 | 80.9 |
| Dota 2 Reborn (2015) | 143 | 138 | 135 | 126 |
| X-Plane 11.11 (2018) | 112 | 101 | 85.3 |
Emissions
System Noise
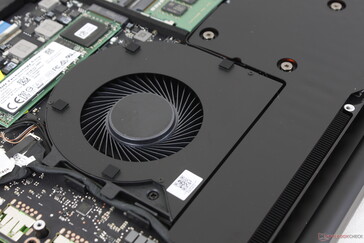
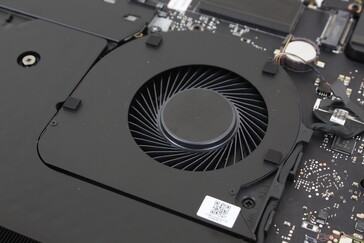
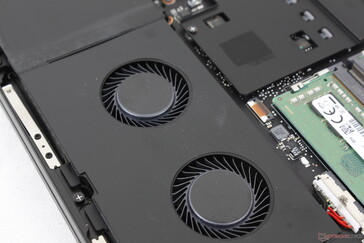
Fan noise and behavior are essentially the same as last year's model since the vapor chamber remains untouched. Fan noise is quiet at just 30.5 dB(A) if only browsing or video streaming on the Balanced profile. Meanwhile, gaming on High Performance mode can be as loud as 45 dB(A) to 53 dB(A) depending on CPU and GPU utilization. The Razer doesn't run all that much quieter or louder than its competitors despite its unique cooling solution.
| Razer Blade Pro 17 RTX 2070 Max-Q 300 Hz GeForce RTX 2070 Max-Q, i7-10875H, Lite-On CA5-8D512 | Asus ROG Zephyrus S GX701GXR GeForce RTX 2080 Max-Q, i7-9750H, Samsung SSD PM981 MZVLB1T0HALR | MSI GS75 Stealth 9SG GeForce RTX 2080 Max-Q, i7-9750H, 2x Samsung SSD PM981 MZVLB1T0HALR (RAID 0) | Alienware m17 R2 P41E GeForce RTX 2080 Max-Q, i9-9980HK, 2x SK Hynix PC601 NVMe 512 GB (RAID 0) | Aorus 17G XB GeForce RTX 2070 Super Max-Q, i7-10875H, Samsung SSD PM981a MZVLB512HBJQ | Razer Blade Pro 17 RTX 2080 Max-Q GeForce RTX 2080 Max-Q, i7-9750H, Samsung SSD PM981 MZVLB512HAJQ | |
|---|---|---|---|---|---|---|
| Noise | -3% | -6% | -3% | -12% | 1% | |
| kapalı / ortam * (dB) | 28.2 | 30 -6% | 30 -6% | 29.1 -3% | 30 -6% | 28.2 -0% |
| Idle Minimum * (dB) | 28.2 | 32 -13% | 31 -10% | 29.4 -4% | 35 -24% | 28.2 -0% |
| Idle Average * (dB) | 28.2 | 33 -17% | 32 -13% | 29.4 -4% | 36 -28% | 28.2 -0% |
| Idle Maximum * (dB) | 30.5 | 34 -11% | 38 -25% | 31.5 -3% | 41 -34% | 30.8 -1% |
| Load Average * (dB) | 42.2 | 40 5% | 47 -11% | 49.7 -18% | 47 -11% | 42 -0% |
| Witcher 3 ultra * (dB) | 53 | 49 8% | 48 9% | 49.5 7% | 48 9% | 51 4% |
| Load Maximum * (dB) | 55.5 | 50 10% | 49 12% | 53.3 4% | 49 12% | 53 5% |
* ... daha küçük daha iyidir
Ses yüksekliği
| Boşta |
| 28.2 / 28.2 / 30.5 dB |
| Çalışırken |
| 42.2 / 55.5 dB |
 | ||
30 dB sessiz 40 dB(A) duyulabilirlik 50 dB(A) gürültülü |
||
min: | ||
Temperature
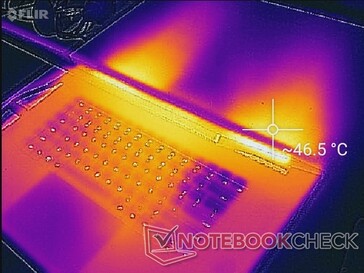
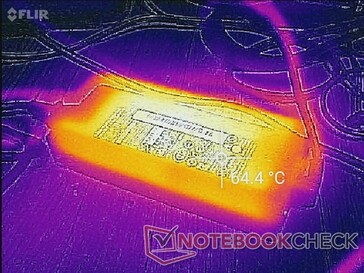
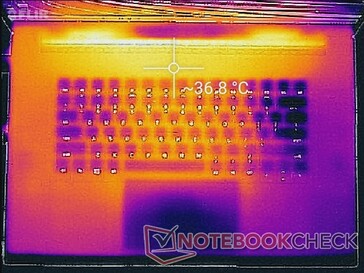
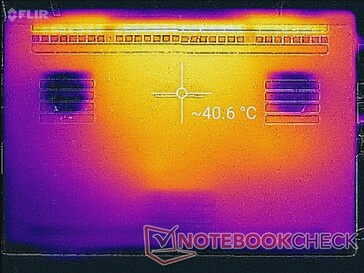
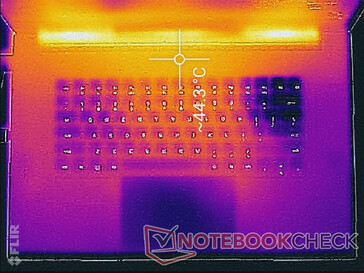
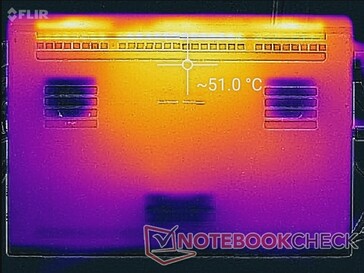
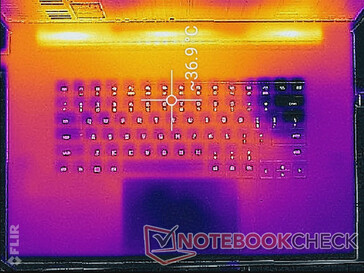
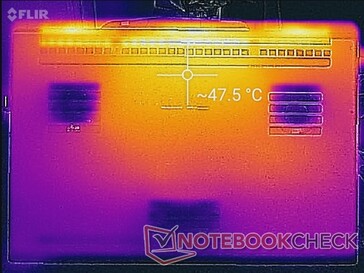
Surface temperatures are warm even when idling on desktop despite having four fans inside. The system is automatically set to run as quietly as possible when there is not much onscreen activity meaning that surface temperatures will be warmer than expected. Thankfully, it's not too warm to be uncomfortable when simply browsing or playing videos. It's possible to turn the fans on high manually during undemanding loads for cooler surface temperatures if desired.
When gaming, hot spots can become as warm as 45 C on both the top and bottom of the laptop. These areas are toward the rear of the chassis away from the palm rests and WASD keys. Interestingly, the larger form factor of the Blade Pro 17 doesn't mean that its hot spots are cooler than on the smaller Blade 15. Rather, its WASD keys and palm rests can be kept cooler instead since these areas are naturally further away from the processors.
Keep in mind that the AC adapter for the Blade series can run much hotter than most other AC adapters when gaming.
(±) Üst taraftaki maksimum sıcaklık, 40.4 °C / 105 F ortalamasına kıyasla 40.8 °C / 105 F'dir. , Gaming sınıfı için 21.2 ile 68.8 °C arasında değişir.
(-) Alt kısım, 43.3 °C / 110 F ortalamasına kıyasla maksimum 48.4 °C / 119 F'ye kadar ısınır
(±) Boşta kullanımda, üst tarafın ortalama sıcaklığı 33.3 °C / 92 F olup, cihazın 33.9 °C / 93 F.
(±) The Witcher 3 oynarken, üst tarafın ortalama sıcaklığı 35.4 °C / 96 F olup, cihazın 33.9 °C / 93 F.
(+) Avuç içi dayanakları ve dokunmatik yüzey maksimum (33.2 °C / 91.8 F) cilt sıcaklığına ulaşıyor ve bu nedenle sıcak değil.
(-) Benzer cihazların avuç içi dayanağı alanının ortalama sıcaklığı 28.8 °C / 83.8 F (-4.4 °C / -8 F) idi.
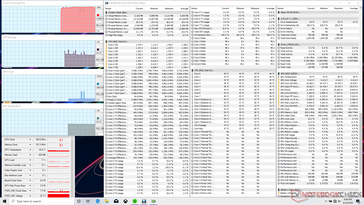
Stress Test
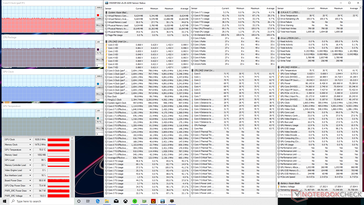
When running Prime95, clock rates would boost to 3.8 to 4 GHz for about 20 seconds until hitting a core temperature of 75 C. Afterwards, clock rates would drop to 3.2 GHz in order to maintain a cooler core temperature of 66 C.
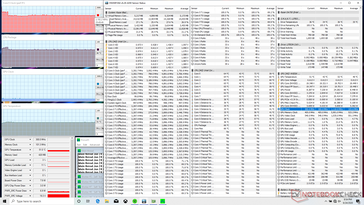
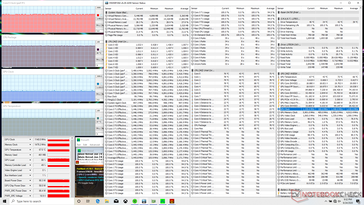
Both CPU and GPU temperatures stabilize at only 70 C each when running Witcher 3 to be close to what we recorded on last year's Blade Pro 17 with RTX 2080 Max-Q graphics.
Running on batteries will limit performance. A Fire Strike run on battery power returns Physics and Graphics scores of 10831 and 10128 points, respectively, compared to 20414 and 21191 points when on mains.
| CPU Clock (GHz) | GPU Clock (MHz) | Average CPU Temperature (°C) | Average GPU Temperature (°C) | |
| System Idle | -- | -- | 47 | 44 |
| Prime95 Stress | 3.2 - 3.3 | -- | 66 | 51 |
| Prime95 + FurMark Stress | 3.4 - 3.5 | 1140 | 80 | 67 |
| Witcher 3 Stress | 2.6 - 2.7 | 1635 | 71 | 70 |
Speakers
Energy Management
Power Consumption
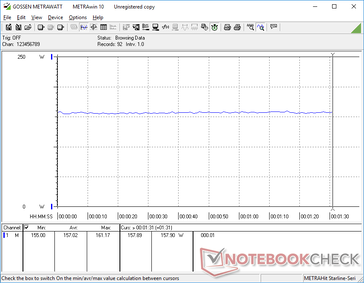
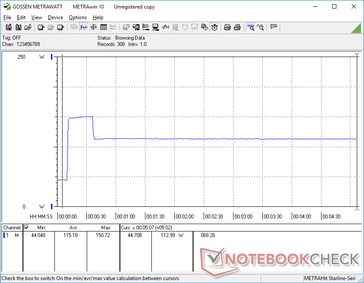
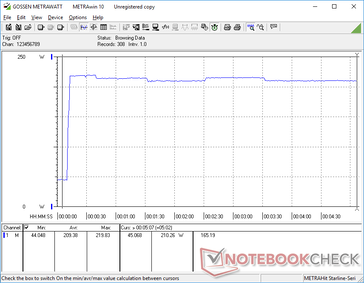
Idling on desktop will consume about 21.7 W when the integrated GPU is active or 38 W when the Nvidia GPU is active. Thus, it's worth manually switching to the iGPU if battery conservation is important.
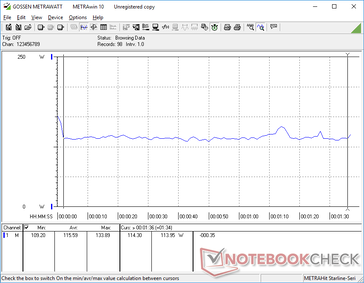
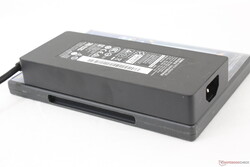
Power consumption when running Witcher 3 is lower than what we recorded on last year's Blade Pro 17 with the more demanding 4K UHD display, but it's otherwise in line with other GeForce RTX-powered 17.3-inch gaming laptops. We're able to measure a maximum draw of 219.9 W from the relatively compact (~17 x 7 x 2.5 cm) 230 W AC adapter.
| Kapalı / Bekleme modu | |
| Boşta | |
| Çalışırken |
|
Key:
min: | |
| Razer Blade Pro 17 RTX 2070 Max-Q 300 Hz i7-10875H, GeForce RTX 2070 Max-Q, Lite-On CA5-8D512, IPS, 1920x1080, 17.3" | Asus ROG Zephyrus S GX701GXR i7-9750H, GeForce RTX 2080 Max-Q, Samsung SSD PM981 MZVLB1T0HALR, IPS, 1920x1080, 17.3" | MSI GS75 Stealth 9SG i7-9750H, GeForce RTX 2080 Max-Q, 2x Samsung SSD PM981 MZVLB1T0HALR (RAID 0), IPS, 1920x1080, 17.3" | Alienware m17 R2 P41E i9-9980HK, GeForce RTX 2080 Max-Q, 2x SK Hynix PC601 NVMe 512 GB (RAID 0), IPS, 1920x1080, 17.3" | Aorus 17G XB i7-10875H, GeForce RTX 2070 Super Max-Q, Samsung SSD PM981a MZVLB512HBJQ, IPS, 1920x1080, 17.3" | Razer Blade Pro 17 4K UHD 120 Hz i7-9750H, GeForce RTX 2080 Max-Q, Samsung SSD PM981 MZVLB1T0HALR, IPS, 3840x2160, 17.3" | |
|---|---|---|---|---|---|---|
| Power Consumption | -14% | 16% | -39% | -3% | -32% | |
| Idle Minimum * (Watt) | 19.6 | 32 -63% | 13 34% | 24.7 -26% | 20 -2% | 34.2 -74% |
| Idle Average * (Watt) | 21.7 | 34 -57% | 17 22% | 35.9 -65% | 23 -6% | 37.2 -71% |
| Idle Maximum * (Watt) | 36.1 | 36 -0% | 25 31% | 69.6 -93% | 38 -5% | 50 -39% |
| Load Average * (Watt) | 115.6 | 95 18% | 96 17% | 141.8 -23% | 105 9% | 106.1 8% |
| Witcher 3 ultra * (Watt) | 157 | 155 1% | 156 1% | 185.8 -18% | 158 -1% | 178.7 -14% |
| Load Maximum * (Watt) | 219.9 | 187 15% | 239 -9% | 235.4 -7% | 243 -11% | 223.6 -2% |
* ... daha küçük daha iyidir
Battery Life
Runtimes are still average at just under 5 hours of real-world WLAN use when set to the Balanced profile with the integrated GPU active. Gaming laptops with larger batteries like the Aorus 17G or MSI GS66 are able to last for much longer.
The system can be recharged via a USB Type-C cable of at least 20 V much like on the Asus Zephyrus G14. Such a feature was not available on previous generation Blade models. Of course, charging this way will be much slower and gaming performance will be impacted.
| Razer Blade Pro 17 RTX 2070 Max-Q 300 Hz i7-10875H, GeForce RTX 2070 Max-Q, 70 Wh | Asus ROG Zephyrus S GX701GXR i7-9750H, GeForce RTX 2080 Max-Q, 76 Wh | MSI GS75 Stealth 9SG i7-9750H, GeForce RTX 2080 Max-Q, 80.25 Wh | Alienware m17 R2 P41E i9-9980HK, GeForce RTX 2080 Max-Q, 76 Wh | Aorus 17G XB i7-10875H, GeForce RTX 2070 Super Max-Q, 94 Wh | Razer Blade Pro 17 4K UHD 120 Hz i7-9750H, GeForce RTX 2080 Max-Q, 70 Wh | |
|---|---|---|---|---|---|---|
| Pil Çalışma Süresi | -39% | 22% | -2% | 53% | -24% | |
| WiFi v1.3 (h) | 4.9 | 3 -39% | 6 22% | 4.8 -2% | 7.5 53% | 3.7 -24% |
| Reader / Idle (h) | 4.1 | 7.7 | 7.1 | 10 | ||
| Load (h) | 1.2 | 1.2 | 0.5 | 2.2 |
Artılar
Eksiler
Verdict
Much like how the 2020 Blade 15 is just a relatively minor update to the 2019 Blade 15, the 2020 Blade Pro 17 is another minor update to the 2019 Blade Pro 17. The new 8-core CPU, Super Max-Q GPUs, and 300 Hz display are the main reasons to own a 2020 model over the 2019 model which comes with a 6-core CPU, Max-Q GPU, and 240 Hz display instead. The internal updates improve the gaming experience only marginally meaning that users won't be missing much by opting for last year's model. Keep in mind that you don't have to reach 300 FPS when gaming to exploit a 300 Hz monitor.
The more surprising aspect of the Blade Pro 17 isn't the 10th gen Core CPU or 300 Hz display, but it's how fast the system can run the GeForce RTX 2070 Max-Q GPU. 3DMark results are about 20 percent faster than the average GeForce RTX 2070 Max-Q in our database. Thus, the RTX 2070 Max-Q in the Blade Pro 17 is able to offer faster graphics performance than even the newer RTX 2070 Super Max-Q or RTX 2080 Super Max-Q on some other gaming laptops. If you're going with this 2020 Blade Pro 17 model, then you can at least rest easy knowing that it is one of the fastest options out there with the GeForce RTX 2070 Max-Q GPU.
The 300 Hz refresh rate is a luxury that only the most hardcore gamers will really want. For everyone else, even 240 Hz will be more than enough. The 2019 Blade Pro series appeals better to wider audiences for this reason especially since the pricier 2020 version doesn't offer that much of a performance advantage year-over-year.
Razer Blade Pro 17 RTX 2070 Max-Q 300 Hz
- 06/27/2020 v7 (old)
Allen Ngo


