Intel Iris Pro Graphics 5200

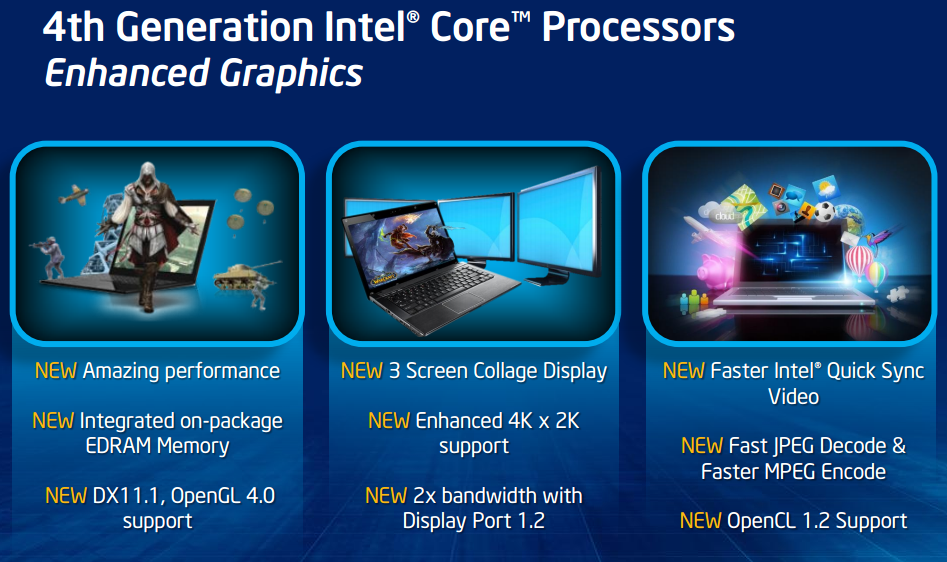
Intel Iris Pro Graphics 5200 (GT3 + eDRAM), ayný zamanda HD Graphics 5200 olarak da bilinir, 2013 yýlý itibariyle bazý Haswell iþlemcilerde bulunan grafik kartý. En yüksek iþleme ünitesine (40) sahip dahili grafik kartý olup, ayný zamanda ek olarak 128MBlik eDRAM tampon belleðe sahip. Temel saat hýzý Turbo Boost teknolojisi ile arttýrýlabilir. Ýþlemci modeline baðlý olarak turbo saat hýzý deðiþmekle beraber, performans farklýlýklarýna sebep olabilir.
HD 4000 grafik kartýna kýyasla grafik çekirdeði oldukça deðiþtirilmiþ. Iris Pro; DirectX 11.1, OpenCL 1.2 ve OpenGL 4.0 desteklemekte ve ayrýca geliþtirilmiþ 4K video desteði ve Quick Sync çözücü ile gelmekte.
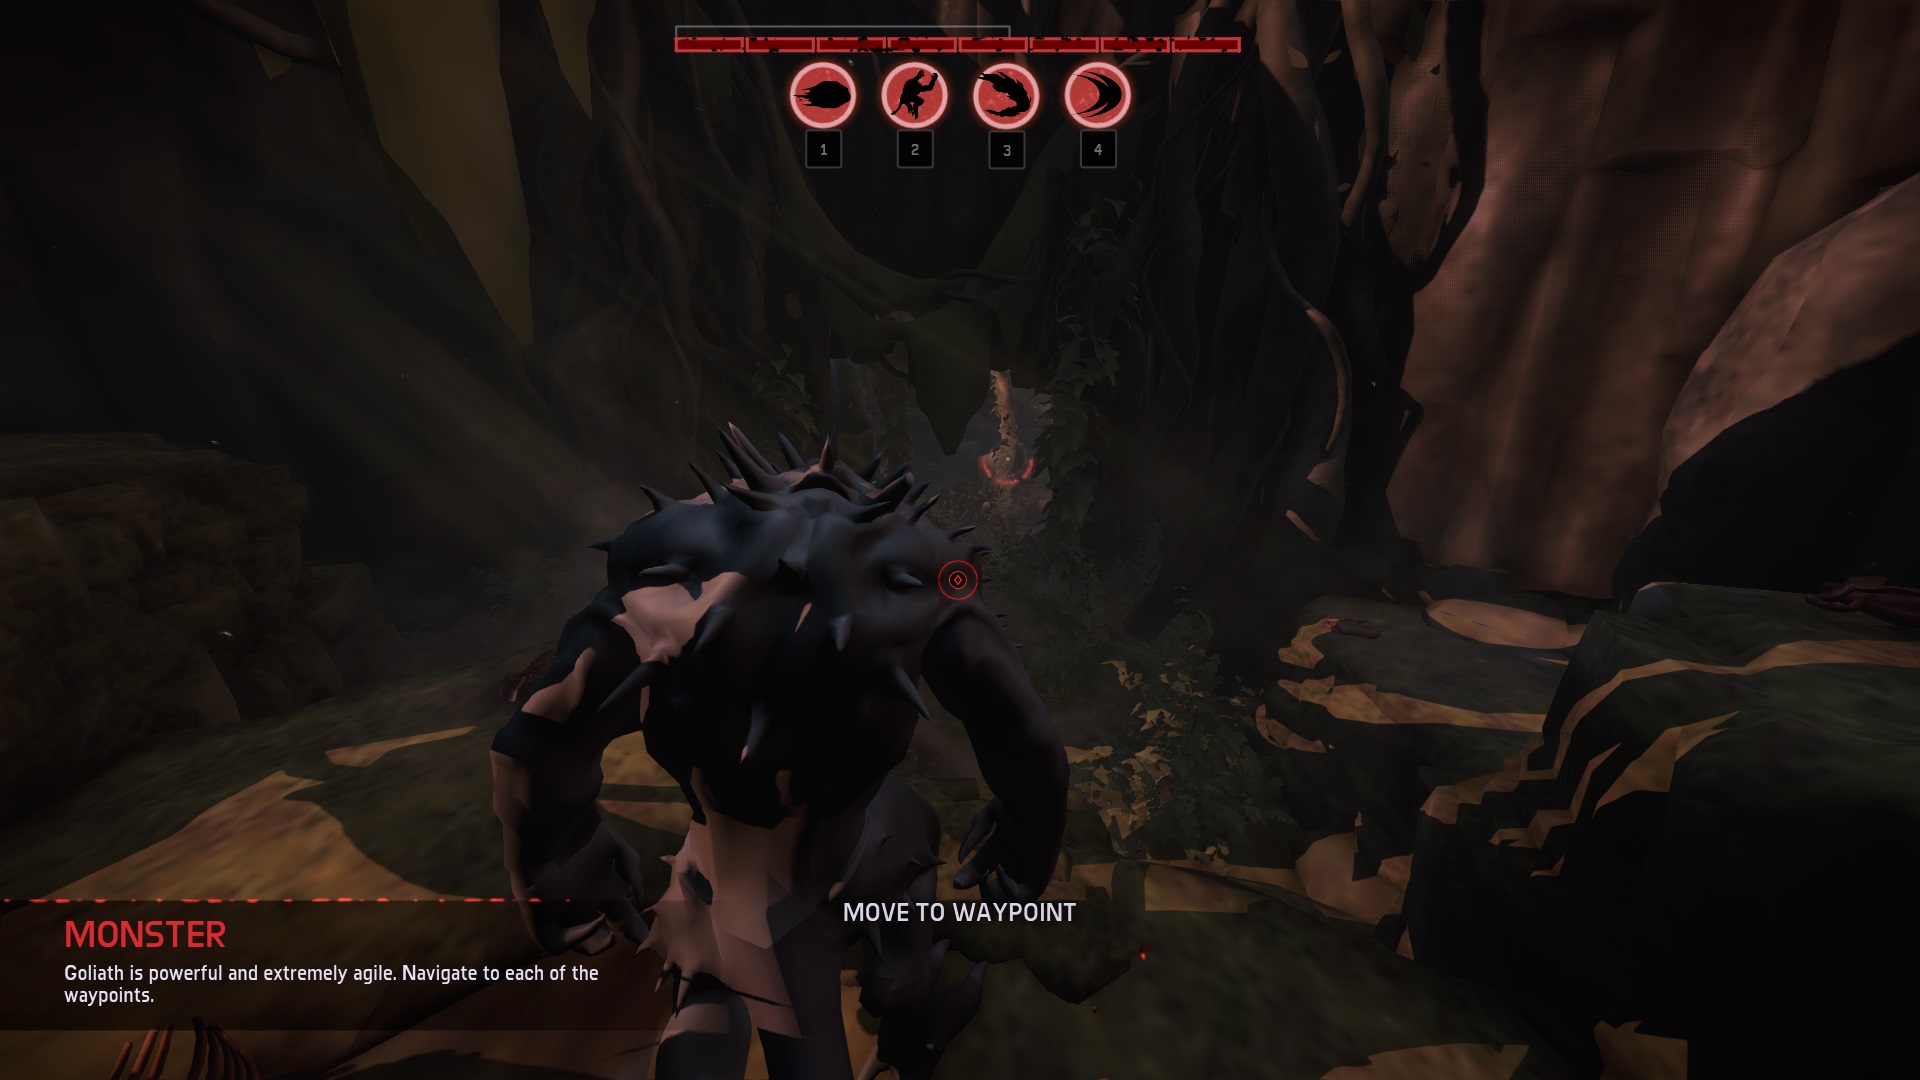
Hýzlý eDram belleði sayesinde ortalama performansý orta sýnýf GeForce GT 650M ve GT 750M kartlarýndan %15 kadar daha yavaþ. Bu durum grafik kartýný AMD Radeon HD 8650G grafik kartýndan bile daha hýzlý yapýp, 2013 yýlýnýn en hýzlý dahili grafik kartý konumuna getiriyor. Bu yüzden çoðu oyun orta ve yüksek detaylarda oynanabilir.
22nm 3D Tri-Gate üretim süreci sayesinde güç tüketimi oldukça düþük. Iris Pro belli baþlý 47 Watt güç tüketimi civarýna sahip Haswell iþlemcilerde bulunabilir.
Üretici | Intel |
Iris Seri | |
Kod adı | Haswell GT3e |
Mimari | Haswell |
Pipelines | 40 - birleştirilmiş |
Çekirdek Hızı | 200 - 1300 (Boost) MHz |
Memory Bus genişliği | eDRAM + 64/128 Bit |
Bellek türü | eDRAM |
Max. Belek Boyutu | 128 MB |
Paylaşımlı bellek | evet |
DirectX | DirectX 11.1, Shader 5.0 |
teknoloji | 22 nm |
Özellikler | QuickSync |
Notebook Boyutu | orta boyutlu |
Duyurulma Tarihi | 05.06.2013 |
benchmarklar
3DMark - Ice Storm Unlimited Graphics Score 1280x720 offscreen
110085 Points (21%)
Schenker S413 | 4750HQ | 8192 MB | 200 - 1200 / 800 MHz | 128 MB eDRAM 10.18.10.3345 | 110085 |
...


AMD Radeon R7 384 Cores (Kaveri Desktop) -18%


Intel HD Graphics 630 -14%


AMD Radeon R7 M260X -11%

Intel UHD Graphics 630 -5%


Intel Iris Pro Graphics 5200

NVIDIA GeForce 920MX 0%

Apple A10X Fusion GPU / PowerVR 0%

Apple A11 Bionic GPU 2%

AMD Radeon RX Vega 8 3%


...

3DMark - Cloud Gate Standard Score 1280x720

min: 9027 avg: 9915 median: 9877 (17%) max: 10879 Points
Schenker S413 | 4750HQ | 16384 MB | 200 - 1200 / 800 MHz | 128 MB eDRAM 9.18.10.3165 | 9027 |
MSI GS30 Shadow  | 4870HQ | 16384 MB | 200-1200 / MHz | + GamingDock mit Nvidia GeForce GTX 970 (Desktop), Kerntakt: 1064-1266 MHz, Speichertakt: 3500 MHz, 4 GB GDDR5, ForceWare 344.11 Intel 10.18.10.3977 | 9626 |
Sony Vaio Z Canvas  | 4770HQ | | | | 10128 |
Intel Customer Reference Board (CRB)  | 4950HQ | | | | 10879 |
...
AMD FirePro W4100 -10%

AMD Radeon R9 M385X -9%

Intel Iris Plus Graphics 650 -8%

Intel UHD Graphics 630 -7%

AMD Radeon RX Vega 8 -7%

NVIDIA Quadro P500 -6%


Intel Iris Pro Graphics 5200


NVIDIA GeForce GTS 450 3%


AMD FirePro W4170M 6%

AMD Radeon HD 7770 8%

...
NVIDIA GeForce RTX 2080 (Desktop) 453%

3DMark - Cloud Gate Standard Graphics 1280x720
min: 11338 avg: 11950.7 median: 11930 (6%) max: 12584 Points
Schenker S413 | 4750HQ | 16384 MB | 200 - 1200 / 800 MHz | 128 MB eDRAM 9.18.10.3165 | 11338 |
MSI GS30 Shadow  | 4870HQ | 16384 MB | 200-1200 / MHz | + GamingDock mit Nvidia GeForce GTX 970 (Desktop), Kerntakt: 1064-1266 MHz, Speichertakt: 3500 MHz, 4 GB GDDR5, ForceWare 344.11 Intel 10.18.10.3977 | 11930 |
Sony Vaio Z Canvas  | 4770HQ | | | | 12584 |
...
AMD Radeon R8 M365DX -7%

AMD Radeon RX Vega 10 -6%

ATI Radeon HD 4850 -6%


Intel Iris Pro Graphics 5200


AMD Radeon R7 M465 3%


NVIDIA GeForce GTS 450 4%

AMD FirePro W4170M 5%


AMD FirePro W4100 6%


...

3DMark - Fire Strike Score 1920x1080
min: 1281 avg: 1375.8 median: 1340 (5%) max: 1543 Points
MSI GS30 Shadow  | 4870HQ | 16384 MB | 200-1200 / MHz | + GamingDock mit Nvidia GeForce GTX 970 (Desktop), Kerntakt: 1064-1266 MHz, Speichertakt: 3500 MHz, 4 GB GDDR5, ForceWare 344.11 Intel 10.18.10.3977 | 1281 |
Terrans Force X411-47J1  | 4760HQ | 8192 MB | | | 1288 |
Sony Vaio Z Canvas  | 4770HQ | | | | 1340 |
Schenker S413 | 4750HQ | 16384 MB | 200 - 1200 / 800 MHz | 128 MB eDRAM 9.18.10.3165 | 1427 |
Intel Customer Reference Board (CRB)  | 4950HQ | | | | 1543 |
...
AMD Radeon R7 384 Cores (Kaveri Desktop) -5%

Intel Iris Plus Graphics 640 -5%


AMD Radeon R7 M260X -3%

NVIDIA GeForce 920MX -3%


Intel Iris Pro Graphics 5200


NVIDIA Quadro K620M 4%

NVIDIA GeForce 930MX 4%

AMD Radeon R7 M445 6%

NVIDIA GeForce GTS 450 6%


AMD Radeon R8 M365DX 9%

...

3DMark - Fire Strike Graphics 1920x1080
min: 1357 avg: 1413.5 median: 1380.5 (3%) max: 1536 Points
Terrans Force X411-47J1  | 4760HQ | 8192 MB | | | 1357 |
MSI GS30 Shadow  | 4870HQ | 16384 MB | 200-1200 / MHz | + GamingDock mit Nvidia GeForce GTX 970 (Desktop), Kerntakt: 1064-1266 MHz, Speichertakt: 3500 MHz, 4 GB GDDR5, ForceWare 344.11 Intel 10.18.10.3977 | 1361 |
Sony Vaio Z Canvas  | 4770HQ | | | | 1400 |
Schenker S413 | 4750HQ | 16384 MB | 200 - 1200 / 800 MHz | 128 MB eDRAM 9.18.10.3165 | 1536 |
...


AMD Radeon R7 M340 -2%


AMD Radeon R7 M260X -1%

AMD Radeon R7 384 Cores (Kaveri Desktop) -1%

Intel Iris Plus Graphics 640 0%

Intel Iris Pro Graphics 5200


NVIDIA GeForce 920MX 2%


AMD Radeon R6 M340DX 4%


NVIDIA GeForce GTS 450 9%


AMD Radeon R7 M445 12%

...

3DMark - Ice Storm Standard Graphics 1280x720

min: 86896 avg: 99804.5 median: 99804.5 (13%) max: 112713 Points
Schenker S413 | 4750HQ | 16384 MB | 200 - 1200 / 800 MHz | 128 MB eDRAM 9.18.10.3165 | 86896 |
MSI GS30 Shadow  | 4870HQ | 16384 MB | 200-1200 / MHz | + GamingDock mit Nvidia GeForce GTX 970 (Desktop), Kerntakt: 1064-1266 MHz, Speichertakt: 3500 MHz, 4 GB GDDR5, ForceWare 344.11 Intel 10.18.10.3977 | 112713 |
NVIDIA Tegra X1 Maxwell GPU
...
AMD Radeon R9 M385X -13%


AMD Radeon RX Vega 8 -10%


NVIDIA Quadro P3200 -6%

AMD FirePro W4170M -6%

AMD FirePro W2100 -6%

NVIDIA GeForce RTX 2070 Max-Q -6%


Intel Iris Pro Graphics 5200


Intel HD Graphics 630 1%


NVIDIA GeForce GTS 450 9%


...
NVIDIA GeForce RTX 2070 (Laptop) 333%

3DMark 11 - Performance 1280x720
min: 2112 avg: 2216.4 median: 2217 (7%) max: 2364 points
Terrans Force X411-47J1  | 4760HQ | 8192 MB | | | 2112 |
MSI GS30 Shadow  | 4870HQ | 16384 MB | 200-1200 / MHz | + GamingDock mit Nvidia GeForce GTX 970 (Desktop), Kerntakt: 1064-1266 MHz, Speichertakt: 3500 MHz, 4 GB GDDR5, ForceWare 344.11 Intel 10.18.10.3977 | 2156 |
Schenker S413 | 4750HQ | 16384 MB | 200 - 1200 / 800 MHz | 128 MB eDRAM 9.18.10.3165 | 2217 |
Sony Vaio Z Canvas  | 4770HQ | | | | 2233 |
Intel Customer Reference Board (CRB)  | 4950HQ | | | | 2364 |
...
AMD Radeon R7 M360 -6%

NVIDIA GeForce GTS 450 -5%

Intel UHD Graphics 630 -5%

AMD Radeon R7 M260X -5%


AMD Radeon R7 384 Cores (Kaveri Desktop) -3%


Intel Iris Pro Graphics 5200

AMD Radeon R6 M340DX 1%


NVIDIA GeForce 930MX 5%


...
NVIDIA Titan RTX 1220%

3DMark 11 - Performance GPU 1280x720
min: 1867 avg: 1915.7 median: 1923 (4%) max: 1957 points
Terrans Force X411-47J1  | 4760HQ | 8192 MB | | | 1867 |
MSI GS30 Shadow  | 4870HQ | 16384 MB | 200-1200 / MHz | + GamingDock mit Nvidia GeForce GTX 970 (Desktop), Kerntakt: 1064-1266 MHz, Speichertakt: 3500 MHz, 4 GB GDDR5, ForceWare 344.11 Intel 10.18.10.3977 | 1923 |
Schenker S413 | 4750HQ | 16384 MB | 200 - 1200 / 800 MHz | 128 MB eDRAM 9.18.10.3165 | 1957 |
...
Intel UHD Graphics 630 -4%


NVIDIA GeForce GTS 450 -1%

AMD Radeon R7 M260 -1%

AMD Radeon R7 M260X -1%


Intel Iris Pro Graphics 5200


AMD Radeon R7 384 Cores (Kaveri Desktop) 4%


...
NVIDIA Titan RTX 2169%
3DMark Vantage
P Result 1280x1024 +3DMark Vantage - P Result 1280x1024
8692 Points (12%)
Schenker S413 | 4750HQ | 16384 MB | 200 - 1200 / 800 MHz | 128 MB eDRAM 9.18.10.3165 | 8692 |
...
NVIDIA GeForce 930MX -7%


AMD Radeon R9 M375 -5%

AMD Radeon R7 M275DX -4%


Intel Iris Pro Graphics 5200


ATI Radeon HD 4850 3%


AMD Radeon R9 M280X 6%

...
NVIDIA Titan RTX 725%
P GPU no PhysX 1280x1024 +3DMark Vantage - P GPU no PhysX 1280x1024
7362 Points (9%)
Schenker S413 | 4750HQ | 16384 MB | 200 - 1200 / 800 MHz | 128 MB eDRAM 9.18.10.3165 | 7362 |
...
AMD Radeon R7 M260X -6%


NVIDIA GeForce 930MX -3%


AMD Radeon R8 M365DX -2%

NVIDIA Quadro K620M -1%

Intel Iris Pro Graphics 5200

ATI Radeon HD 4850 1%


...

3DMark 2001SE - Standard 1024x768
41727 Points (43%)
Schenker S413 | 4750HQ | 8192 MB | 200 - 1200 / 800 MHz | 128 MB eDRAM 9.18.10.3257 | 41727 |
...
AMD Radeon HD 6450 GDDR5 -8%


Intel Iris Pro Graphics 5200


AMD Radeon HD 6750M 4%

ATI Radeon HD 5570 6%


NVIDIA GeForce GTX 580 22%

NVIDIA GeForce GTS 450 24%


...

3DMark 03 - Standard 1024x768
32334 Points (17%)
Schenker S413 | 4750HQ | 8192 MB | 200 - 1200 / 800 MHz | 128 MB eDRAM 9.18.10.3257 | 32334 |
VIA S3 Graphics ProSavage8 -100%
...


NVIDIA GeForce 920MX -5%


Intel Iris Pro Graphics 5200


ATI Radeon HD 5670 5%


...

3DMark 05 - Standard 1024x768
16590 Points (36%)
Schenker S413 | 4750HQ | 8192 MB | 200 - 1200 / 800 MHz | 128 MB eDRAM 9.18.10.3257 | 16590 |
...


AMD Radeon R7 384 Cores (Kaveri Desktop) 0%


Intel Iris Pro Graphics 5200


...
NVIDIA GeForce GTX 1080 (Desktop) 182%
3DMark 06 Standard 1280x1024 +3DMark 06

min: 12578 avg: 13123 median: 13123 (28%) max: 13668 Points
Standard 1280x1024 |
Schenker S413 | 4750HQ | 16384 MB | 200 - 1200 / 800 MHz | 128 MB eDRAM 9.18.10.3165 | 12578 |
Intel Customer Reference Board (CRB)  | 4950HQ | | | | 13668 |
...


AMD FirePro W4190M -1%


Intel Iris Pro Graphics 5200


AMD FirePro W4170M 4%


...
NVIDIA GeForce RTX 2070 (Desktop) 255%

Unigine Heaven 3.0 - DX 11, Normal Tessellation, High Shaders 1920x1080

20.8 fps (8%)
Schenker S413 | 4750HQ | 16384 MB | 200 - 1200 / 800 MHz | 128 MB eDRAM 9.18.10.3165 | 20.8 |
...


AMD Radeon R7 384 Cores (Kaveri Desktop) -14%

AMD Radeon R6 M340DX -12%

Intel HD Graphics 630 -10%

Intel UHD Graphics 630 -9%


AMD FirePro W4100 -3%

Intel Iris Pro Graphics 5200

NVIDIA GeForce 920MX 2%


NVIDIA Quadro K620M 5%


AMD FirePro W4170M 8%


...
NVIDIA GeForce GTX 1080 (Desktop) 1193%

Unigine Heaven 3.0 - OpenGL, Normal Tessellation, High Shaders 1920x1080

21.9 fps (13%)
Schenker S413 | 4750HQ | 16384 MB | 200 - 1200 / 800 MHz | 128 MB eDRAM 9.18.10.3165 | 21.9 |
...
NVIDIA Quadro K620M -15%

AMD Radeon RX Vega 8 -15%


NVIDIA GeForce 920MX -7%

Intel HD Graphics 630 -5%


Intel Iris Pro Graphics 5200


...

Unigine Heaven 2.1 - high, Tesselation (normal), DirectX11 1280x1024
26.1 fps (12%)
Schenker S413 | 4750HQ | 8192 MB | 200 - 1200 / 800 MHz | 128 MB eDRAM 9.18.10.3257 | 26.1 |
...


AMD Radeon R7 384 Cores (Kaveri Desktop) -6%

AMD Radeon RX Vega 8 -4%


Intel Iris Pro Graphics 5200

Intel HD Graphics 630 2%


NVIDIA GeForce 920MX 7%

AMD Radeon R9 M375 7%


...
SPECviewperf 11
Siemens NX 1920x1080 +SPECviewperf 11 - Siemens NX 1920x1080
2.3 fps (2%)
Schenker S413 | 4750HQ | 16384 MB | 200 - 1200 / 800 MHz | 128 MB eDRAM 9.18.10.3165 | 2.26 |
...


NVIDIA GeForce GTX 580M -2%


Intel Iris Pro Graphics 5200


...
AMD Radeon Pro Vega 56 6109%
Tcvis 1920x1080 +SPECviewperf 11 - Tcvis 1920x1080
3.1 fps (5%)
Schenker S413 | 4750HQ | 16384 MB | 200 - 1200 / 800 MHz | 128 MB eDRAM 9.18.10.3165 | 3.06 |
...
AMD Radeon HD 6755G2 -8%


NVIDIA GeForce GTX 1050 Ti (Laptop) -7%


AMD Radeon R5 M330 -2%


Intel Iris Pro Graphics 5200


AMD Radeon R7 M260 8%


ATI Radeon HD 5850 17%


...
NVIDIA Quadro M4000M 1800%
SolidWorks 1920x1080 +SPECviewperf 11 - SolidWorks 1920x1080

15 fps (18%)
Schenker S413 | 4750HQ | 16384 MB | 200 - 1200 / 800 MHz | 128 MB eDRAM 9.18.10.3165 | 15 |

...


AMD Radeon R7 M260 -8%


Intel Iris Pro Graphics 5200


NVIDIA GeForce GTX 580 1%


...
AMD Radeon Pro Vega 56 451%
Pro/ENGINEER 1920x1080 +SPECviewperf 11 - Pro/ENGINEER 1920x1080

2.2 fps (9%)
Schenker S413 | 4750HQ | 16384 MB | 200 - 1200 / 800 MHz | 128 MB eDRAM 9.18.10.3165 | 2.23 |
...


Intel Iris Pro Graphics 5200

AMD Radeon HD 6730M 0%

NVIDIA GeForce 930MX 1%


...
Maya 1920x1080 +SPECviewperf 11 - Maya 1920x1080

19 fps (14%)
Schenker S413 | 4750HQ | 16384 MB | 200 - 1200 / 800 MHz | 128 MB eDRAM 9.18.10.3165 | 18.97 |
NVIDIA GeForce GTX 580 -92%

...


AMD FirePro W5130M -5%


Intel Iris Pro Graphics 5200


NVIDIA GeForce GTX 1050 Ti (Laptop) 6%


Intel HD Graphics 630 29%

...
AMD Radeon Pro Vega 56 599%
Lightwave 1920x1080 +SPECviewperf 11 - Lightwave 1920x1080

19.9 fps (21%)
Schenker S413 | 4750HQ | 16384 MB | 200 - 1200 / 800 MHz | 128 MB eDRAM 9.18.10.3165 | 19.9 |

...


AMD Radeon R7 M340 -3%


Intel Iris Pro Graphics 5200


NVIDIA GeForce 930MX 4%


...
AMD Radeon Pro Vega 56 368%
Ensight 1920x1080 +SPECviewperf 11 - Ensight 1920x1080
2.4 fps (1%)
Schenker S413 | 4750HQ | 16384 MB | 200 - 1200 / 800 MHz | 128 MB eDRAM 9.18.10.3165 | 2.39 |
...
NVIDIA GeForce GTX 580 -59%


Intel Iris Pro Graphics 5200


Intel HD Graphics 630 53%


...
SPECviewperf 12
Solidworks (sw-03) 1900x1060 +SPECviewperf 12 - Solidworks (sw-03) 1900x1060
16.7 fps (8%)
Schenker S413 | 4750HQ | 8192 MB | 200 - 1200 / 800 MHz | 128 MB eDRAM 10.18.10.3345 | 16.7 |
...


NVIDIA GeForce 930MX -6%


Intel Iris Pro Graphics 5200


...
NVIDIA Quadro P5200 1169%
Siemens NX (snx-02) 1900x1060 +SPECviewperf 12 - Siemens NX (snx-02) 1900x1060
2.8 fps (1%)
Schenker S413 | 4750HQ | 8192 MB | 200 - 1200 / 800 MHz | 128 MB eDRAM 10.18.10.3345 | 2.8 |
...


Intel Iris Pro Graphics 5200


...
NVIDIA Titan RTX 9055%
Showcase (showcase-01) 1900x1060 +SPECviewperf 12 - Showcase (showcase-01) 1900x1060

8.8 fps (5%)
Schenker S413 | 4750HQ | 8192 MB | 200 - 1200 / 800 MHz | 128 MB eDRAM 10.18.10.3345 | 8.8 |

...
NVIDIA Quadro K620M -28%


AMD Radeon R7 M275DX -15%

AMD FirePro W4190M -14%

AMD FirePro W2100 -5%


Intel Iris Pro Graphics 5200


NVIDIA Quadro P500 41%

AMD FirePro W4170M 45%

AMD FirePro W4100 46%

...
NVIDIA Titan RTX 2078%
Medical (medical-01) 1900x1060 +SPECviewperf 12 - Medical (medical-01) 1900x1060

2.6 fps (3%)
Schenker S413 | 4750HQ | 8192 MB | 200 - 1200 / 800 MHz | 128 MB eDRAM 10.18.10.3345 | 2.63 |
...


Intel Iris Pro Graphics 5200


AMD FirePro W2100 40%

AMD Radeon Pro WX 3100 Mobile 46%


...
NVIDIA Titan RTX 3208%
Energy (energy-01) 1900x1060 +SPECviewperf 12 - Energy (energy-01) 1900x1060
0.1 fps (0%)
Schenker S413 | 4750HQ | 8192 MB | 200 - 1200 / 800 MHz | 128 MB eDRAM 10.18.10.3345 | 0.11 |
...
AMD Radeon R7 M260X -45%
Intel Iris Pro Graphics 5200


AMD Radeon Pro 455 73%


AMD FirePro W2100 127%


...
NVIDIA Titan RTX 25464%
Creo (creo-01) 1900x1060 +SPECviewperf 12 - Creo (creo-01) 1900x1060

11.7 fps (7%)
Schenker S413 | 4750HQ | 8192 MB | 200 - 1200 / 800 MHz | 128 MB eDRAM 10.18.10.3345 | 11.7 |
...


Intel Iris Pro Graphics 5200


AMD Radeon R7 M275DX 9%


AMD Radeon R7 M260X 24%


...
NVIDIA Quadro P5200 1267%
Catia (catia-04) 1900x1060 +SPECviewperf 12 - Catia (catia-04) 1900x1060

15.4 fps (8%)
Schenker S413 | 4750HQ | 8192 MB | 200 - 1200 / 800 MHz | 128 MB eDRAM 10.18.10.3345 | 15.4 |
...


AMD FirePro W2100 -7%


AMD Radeon R7 M275DX -3%


Intel Iris Pro Graphics 5200


AMD Radeon Pro WX 3100 Mobile 4%


AMD Radeon R7 M260X 16%

...
NVIDIA Quadro P5200 1177%
Cinebench R10 Shading 32Bit +Cinebench R10 - Shading 32Bit
9744 Points (49%)
Schenker S413 | 4750HQ | 16384 MB | 200 - 1200 / 800 MHz | 128 MB eDRAM 9.18.10.3165 | 9744 |
...
AMD FirePro W4190M -3%


AMD FirePro W7170M -2%


AMD FirePro W4170M -1%

AMD FirePro W5130M -1%

AMD Radeon Pro WX Vega M GL -1%

Intel Iris Plus Graphics 640 -1%


Intel Iris Pro Graphics 5200


AMD Radeon Pro 560 0%

Intel UHD Graphics 630 1%


Intel HD Graphics 630 8%

ATI Radeon HD 5770 8%

...
Cinebench R11.5 OpenGL 64Bit +Cinebench R11.5 - OpenGL 64Bit

min: 37.77 avg: 46.5 median: 48 (28%) max: 53.63 Points
Schenker S413 | 4750HQ | 16384 MB | 200 - 1200 / 800 MHz | 128 MB eDRAM 9.18.10.3165 | 37.77 |
Sony Vaio Z Canvas  | 4770HQ | | | | 48 |
MSI GS30 Shadow  | 4870HQ | 16384 MB | 200-1200 / MHz | + GamingDock mit Nvidia GeForce GTX 970 (Desktop), Kerntakt: 1064-1266 MHz, Speichertakt: 3500 MHz, 4 GB GDDR5, ForceWare 344.11 Intel 10.18.10.3977 | 53.63 |
...


Intel Iris Plus Graphics 640 -1%

AMD Radeon RX Vega 10 0%

Intel Iris Pro Graphics 5200


NVIDIA GeForce GTX 1050 Max-Q 2%


...
NVIDIA Quadro P5200 267%
Cinebench R15
OpenGL 64Bit +Cinebench R15 - OpenGL 64Bit

min: 39.15 avg: 48.1 median: 52.3 (21%) max: 52.9 Points
Schenker S413 | 4750HQ | 8192 MB | 200 - 1200 / 800 MHz | 128 MB eDRAM 9.18.10.3257 | 39.15 |
MSI GS30 Shadow  | 4870HQ | 16384 MB | 200-1200 / MHz | + GamingDock mit Nvidia GeForce GTX 970 (Desktop), Kerntakt: 1064-1266 MHz, Speichertakt: 3500 MHz, 4 GB GDDR5, ForceWare 344.11 Intel 10.18.10.3977 | 52.31 |
Sony Vaio Z Canvas  | 4770HQ | | | | 52.9 |
...
AMD Radeon R9 M385X -7%


AMD Radeon R9 M375 -5%

AMD Radeon RX Vega 8 -5%

AMD Radeon R7 M445 -5%


NVIDIA GeForce 920MX -2%


Intel Iris Pro Graphics 5200


AMD FirePro W4190M 1%


NVIDIA GeForce 930MX 4%


AMD Radeon R9 M280X 5%

...
NVIDIA Quadro P5200 419%
Ref. Match 64Bit +Cinebench R15 - Ref. Match 64Bit

98 Points (98%)
Schenker S413 | 4750HQ | 8192 MB | 200 - 1200 / 800 MHz | 128 MB eDRAM 9.18.10.3257 | 98 |
Sony Vaio Z Canvas  | 4770HQ | | | | 98 |

...
Intel UHD Graphics 605 0%


Intel Iris Pro Graphics 580 0%

Intel UHD Graphics 600 0%


Intel Iris Pro Graphics 5200

AMD FirePro W7170M 0%


Intel HD Graphics (Cherry Trail) 0%


Intel Iris Plus Graphics 640 0%


...
GFXBench (DX / GLBenchmark) 2.7
T-Rex HD Offscreen C24Z16 1920x1080 +GFXBench (DX / GLBenchmark) 2.7 - T-Rex HD Offscreen C24Z16 1920x1080
min: 136 avg: 138 median: 136 (1%) max: 142 fps
Schenker S413 | 4750HQ | 16384 MB | 200 - 1200 / 800 MHz | 128 MB eDRAM 9.18.10.3165 | 136 |
Schenker S413 | 4750HQ | 8192 MB | 200 - 1200 / 800 MHz | 128 MB eDRAM 9.18.10.3257 | 136 |
Intel Customer Reference Board (CRB)  | 4950HQ | | | | 142 |
...


NVIDIA GeForce 930MX -10%


AMD Radeon R7 M260X -6%


Intel Iris Pro Graphics 5200

Intel HD Graphics 630 1%

Apple A9X / PowerVR Series 7XT 2%


AMD Radeon RX Vega 8 3%

ARM Mali-G72 MP18 6%

Qualcomm Adreno 640 21%

Apple A11 Bionic GPU 22%

Intel Iris Plus Graphics 640 24%

...
T-Rex HD Onscreen C24Z16 +GFXBench (DX / GLBenchmark) 2.7 - T-Rex HD Onscreen C24Z16

min: 49 avg: 51.5 median: 51.5 (2%) max: 54 fps
Schenker S413 | 4750HQ | 8192 MB | 200 - 1200 / 800 MHz | 128 MB eDRAM 9.18.10.3257 | 49 |
Schenker S413 | 4750HQ | 16384 MB | 200 - 1200 / 800 MHz | 128 MB eDRAM 9.18.10.3165 | 54 |
...

Qualcomm Adreno 430 -12%

PowerVR GX6450 -9%


Qualcomm Adreno 512 -7%


Intel HD Graphics (Broadwell) -2%

Intel Iris Pro Graphics 5200

ARM Mali-T880 MP12 1%

PowerVR GXA6850 1%

ARM Mali-G71 MP8 1%


NVIDIA Tegra K1 Kepler GPU 2%

NVIDIA Tegra X1 Maxwell GPU 3%


...

LuxMark v2.0 64Bit - Room GPUs-only
min: 307 avg: 324.7 median: 329 (6%) max: 338 Samples/s
Schenker S413 | 4750HQ | 16384 MB | 200 - 1200 / 800 MHz | 128 MB eDRAM 9.18.10.3165 | 307 |
Intel Customer Reference Board (CRB)  | 4950HQ | | | | 329 |
Schenker S413 | 4750HQ | 8192 MB | 200 - 1200 / 800 MHz | 128 MB eDRAM 9.18.10.3257 | 338 |
...
AMD Radeon R6 M340DX -12%

NVIDIA GeForce GTX 470 -11%

NVIDIA GeForce 930MX -11%


AMD Radeon R8 M365DX -10%

AMD Radeon R5 M330 -10%


Intel Iris Pro Graphics 5200

Intel Iris Plus Graphics 640 0%


Intel Iris Plus Graphics 650 3%


AMD Radeon RX Vega 8 5%

NVIDIA Quadro P500 6%


...

LuxMark v2.0 64Bit - Sala GPUs-only
min: 447 avg: 461 median: 461 (4%) max: 475 Samples/s
Schenker S413 | 4750HQ | 16384 MB | 200 - 1200 / 800 MHz | 128 MB eDRAM 9.18.10.3165 | 447 |
Schenker S413 | 4750HQ | 8192 MB | 200 - 1200 / 800 MHz | 128 MB eDRAM 9.18.10.3257 | 475 |
...
AMD Radeon R7 M260X -13%


AMD Radeon R5 M240 -11%


NVIDIA GeForce 920MX -7%


Intel Iris Pro Graphics 5200

AMD FirePro W4170M 0%


Intel UHD Graphics 615 3%


AMD FirePro W4100 4%

...
NVIDIA Titan RTX 2243%

ComputeMark v2.1 - Normal, Score 1024x600
1198 Points (4%)
Schenker S413 | 4750HQ | 16384 MB | 200 - 1200 / 800 MHz | 128 MB eDRAM 9.18.10.3165 | 1198 |
...


AMD Radeon R5 (Bristol Ridge) -6%

NVIDIA GeForce 920MX -5%

AMD Radeon R7 384 Cores (Kaveri Desktop) -5%

AMD Radeon R5 M240 -4%

Intel Iris Pro Graphics 5200


AMD Radeon R7 M260X 1%


AMD Radeon R7 M260 11%


...
NVIDIA Titan RTX 2229%

- Bu grafik kartı için benchmark aralıkları

- Bu grafik kartı için ortalama benchmark değerleri
* Smaller numbers mean a higher performance
Oyun Benchmarkları
Aşağıdaki testler laptop incelemelerimizden ortaya çıkmaktadır. Performans kullanılan grafik kartı belleğine, saat hızına, işlemci, sistem ayarları, sürücüler ve işletim sistemine göre değişir. Bu yüzden sonuçların bu grafik kartına sahip tüm laptopları karşılaması beklenmemelidir.
...
Intel HD Graphics 630 -11%


Intel Iris Plus Graphics 640 -7%

Intel UHD Graphics 630 -7%


AMD FirePro W4190M -4%


Intel Iris Plus Graphics 650 -3%

Intel Iris Pro Graphics 5200


AMD Radeon R7 M340 6%


AMD Radeon R7 M445 11%


Intel Iris Pro Graphics 580 14%


...
NVIDIA GeForce RTX 2080 (Desktop) 1002%
...


Intel HD Graphics 630 -2%

NVIDIA GeForce 920MX -1%

Intel Iris Pro Graphics 5200

AMD Radeon R7 M340 1%

AMD Radeon RX Vega 10 1%

AMD Radeon R7 M445 2%

AMD Radeon R8 M365DX 6%

AMD FirePro W4190M 6%


...
NVIDIA Titan X Pascal 1416%
...


AMD Radeon R7 M360 -9%


Intel Iris Pro Graphics 5200


NVIDIA GeForce 920MX 4%

AMD Radeon R7 M445 9%

AMD FirePro W4190M 15%

Intel Iris Plus Graphics 640 17%


...
NVIDIA Titan RTX 2323%

» test edilen laptopların çoğunda oynanamaz.
...


Intel Iris Pro Graphics 5200

AMD Radeon R5 (Bristol Ridge) 3%

AMD Radeon R7 (Carrizo) 3%

AMD Radeon R6 (Carrizo) 7%


NVIDIA GeForce 910M 10%

AMD Radeon R5 M335 12%


Intel HD Graphics 630 13%


...
NVIDIA Titan X Pascal 1056%
...


Intel Iris Pro Graphics 5200

AMD Radeon R5 M330 2%

AMD Radeon R6 (Carrizo) 5%

AMD Radeon R7 (Carrizo) 7%


AMD Radeon R5 (Bristol Ridge) 11%

AMD Radeon R5 M335 13%

Intel HD Graphics 630 13%


NVIDIA GeForce 910M 16%

...
NVIDIA Titan X Pascal 1419%
...
Intel Iris Pro Graphics 5200
AMD Radeon R5 M330
...
NVIDIA Titan RTX
» test edilen tüm laptoplarda düşük detaylarında oynanabilir.
...

AMD Radeon R9 M385X -20%

AMD Radeon R9 M280X -18%


AMD Radeon R5 M330 -14%

AMD Radeon R5 M335 -13%

Intel HD Graphics 630 -7%


Intel Iris Pro Graphics 5200


AMD Radeon R7 M360 17%

NVIDIA GeForce 920MX 18%


...
NVIDIA Titan X Pascal 563%
...
AMD Radeon R6 M340DX -26%


AMD Radeon R5 M330 -12%

AMD Radeon R5 M335 -12%


Intel Iris Pro Graphics 5200

Intel HD Graphics 630 0%

AMD Radeon R9 M385X 2%


NVIDIA GeForce 920MX 14%


AMD Radeon R7 M360 19%

...
NVIDIA GeForce GTX 1080 (Desktop) 664%
...


AMD Radeon R7 M360 -1%

Intel Iris Pro Graphics 5200


NVIDIA GeForce 930MX 24%


AMD Radeon R9 M280X 46%

...
NVIDIA GeForce GTX 1080 (Desktop) 947%
...
NVIDIA GeForce 910M -52%

AMD Radeon R6 M340DX -49%

AMD Radeon R5 M330 -49%

AMD Radeon R5 M335 -47%

AMD Radeon R7 (Carrizo) -31%


AMD Radeon R7 M360 -13%

Intel Iris Pro Graphics 5200


AMD Radeon R9 M385X 47%


...
NVIDIA Titan X Pascal 1008%

» test edilen laptopların çoğunda oynanamaz.
...


NVIDIA GeForce 920MX -16%

Intel Iris Plus Graphics 640 -12%


Intel Iris Pro Graphics 5200


NVIDIA GeForce 930MX 6%

AMD Radeon R9 M280X 7%


NVIDIA Quadro M600M 63%

...
Intel HD Graphics (Cherry Trail) -83%

...


NVIDIA GeForce 920MX -10%

Intel Iris Plus Graphics 640 -8%

Intel Iris Pro Graphics 5200


AMD Radeon R9 M280X 6%


AMD Radeon R9 M385X 11%

NVIDIA GeForce 930MX 14%


...
NVIDIA GeForce GTX 1080 (Desktop) 604%
...