Notebook incelemeleri ile Intel HD Graphics 615 grafik kartı
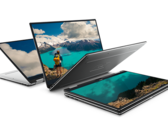
Kısa inceleme: Dell XPS 13 9365 2-in-1 dönüştürülebilir model
Nihayet InfinityEdge kullanan 2si1 arada. Dell başarılı bir şekilde ödüülü XPS 13 cihazını birçok orjinal özelliğini de koruyarak dönüştürülebilir bir model haline getirdi. Kullanıcılar biraz performans biraz da diğer özelliklerinden ödün vermek zorunda.
Intel Core i7-7Y75, HD Graphics 615, 13.3", 1.2 kgChuwi UBook XPro: Intel Core i7-7Y75, 13.00", 0.9 kg
Dış inceleme » Chuwi UBook XPro
Asus Chromebook C425TA-H50039: Intel Pentium Gold 4415Y, 14.00", 1.3 kg
Dış inceleme » Asus Chromebook C425TA-H50039
Acer Swift 7 SF714-51T-M4JV: Intel Core i7-7Y75, 14.00", 1.2 kg
Dış inceleme » Acer Swift 7 SF714-51T-M4JV
Acer Swift 7 SF714-51T-M3EW: Intel Core i7-7Y75, 14.00", 1.2 kg
Dış inceleme » Acer Swift 7 SF714-51T-M3EW
Microsoft Surface Pro (2017) m3: Intel Core m3-7Y30, 12.30", 1.1 kg
Dış inceleme » Microsoft Surface Pro (2017) m3
Acer Swift 7 SF714-51T-M16F: Intel Core i7-7Y75, 14.00", 1.2 kg
Dış inceleme » Acer Swift 7 SF714-51T-M16F
Asus VivoBook Flip 14 TP401CA-EC067T: Intel Core m3-7Y30, 14.00", 1.5 kg
Dış inceleme » Asus VivoBook Flip 14 TP401CA-EC067T
Asus VivoBook Flip 14 TP401CA-DHM4T: Intel Core m3-7Y30, 14.00", 1.5 kg
Dış inceleme » Asus VivoBook Flip 14 TP401CA-DHM4T
Acer Swift 7 Sf714-51t-m64v: Intel Core i7-7Y75, 14.00", 1.2 kg
Dış inceleme » Acer Swift 7 Sf714-51t-m64v
Lenovo Yoga Book C930 YB-J912F: Intel Core i5-7Y54, 10.80", 0.8 kg
Dış inceleme » Lenovo Yoga Book C930 YB-J912F
Samsung Chromebook Plus XE521QAB-K01US: Intel Celeron 3965Y, 12.20", 1.3 kg
Dış inceleme » Samsung Chromebook Plus XE521QAB-K01US
Microsoft Surface Go MCZ-00002: Intel Pentium Gold 4415Y, 10.00", 0.5 kg
Dış inceleme » Microsoft Surface Go MCZ-00002
HP Chromebook x2 12-f015nr: Intel Core m3-7Y30, 12.30", 1.4 kg
Dış inceleme » HP Chromebook x2 12-f015nr
Asus VivoBook Flip 14 TP401CA-EC011T: Intel Core m3-7Y30, 14.00", 1.6 kg
Dış inceleme » Asus VivoBook Flip 14 TP401CA-EC011T
Wortmann Terra Pad 1270: Intel Core i5-7Y54, 12.10", 0.8 kg
Dış inceleme » Wortmann Terra Pad 1270
Asus VivoBook Flip 14 TP401CA-DHM6T: Intel Core m3-7Y30, 14.00", 1.5 kg
Dış inceleme » Asus VivoBook Flip 14 TP401CA-DHM6T
Chuwi CoreBook 13: Intel Core m3-7Y30, 13.30", 1.1 kg
Dış inceleme » Chuwi CoreBook 13
Teclast F6 Pro: Intel Core m3-7Y30, 13.30", 1.4 kg
Dış inceleme » Teclast F6 Pro
Acer Swift 7 SF714-51T: Intel Core i7-7Y75, 14.00", 1.2 kg
Dış inceleme » Acer Swift 7 SF714-51T
Dell Latitude 7285-8718: Intel Core i5-7Y57, 12.30", 1.4 kg
Dış inceleme » Dell Latitude 7285-8718
Asus Zenbook UX330CA-FC106T: Intel Core m3-7Y30, 13.30", 1.2 kg
Dış inceleme » Asus Zenbook UX330CA-FC106T
Google Pixelbook: Intel Core i5-7Y57, 12.30", 1.3 kg
Dış inceleme » Google Pixelbook
Dell Latitude 7285: Intel Core i5-7Y57, 12.30", 1.4 kg
Dış inceleme » Dell Latitude 7285
Lenovo ThinkPad X1 Tablet 2017, Core i5-7Y57: unknown, 12.00", 1.1 kg
Dış inceleme » Lenovo ThinkPad X1 Tablet 2017, Core i5-7Y57
Acer Swift 7 SF713-51-M8MF: Intel Core i5-7Y54, 13.30", 1.1 kg
Dış inceleme » Acer Swift 7 SF713-51-M8MF
Cube i35 Thinker: Intel Core m3-7Y30, 13.50", 1.7 kg
Dış inceleme » Cube i35 Thinker
Samsung Galaxy Book 10.6 W627N LTE: Intel Core m3-7Y30, 10.60", 0.6 kg
Dış inceleme » Samsung Galaxy Book 10.6 W627N LTE
Lenovo ThinkPad X1 Tablet 2017, Core i7-7Y75: Intel Core i7-7Y75, 12.00", 1.1 kg
Dış inceleme » Lenovo ThinkPad X1 Tablet 2017, Core i7-7Y75
Apple MacBook 12 2017: Intel Core m3-7Y32, 12.00", 0.9 kg
Dış inceleme » Apple MacBook 12 2017
Huawei Matebook E: Intel Core i5-7Y54, 12.10", 1.1 kg
Dış inceleme » Huawei Matebook E
Microsoft Surface Pro (2017) m3: Intel Core m3-7Y32, 12.30", 0.8 kg
Dış inceleme » Microsoft Surface Pro (2017)
Dell XPS 13 9365-4537 2-in-1: Intel Core i5-7Y54, 13.30", 1.2 kg
Dış inceleme » Dell XPS 13 9365-4537
Acer Swift 7 SF713-51-M90J: Intel Core i5-7Y54, 13.30", 1.1 kg
Dış inceleme » Acer Swift 7 SF713-51-M90J
Lenovo Yoga 710-11IKB-80V6001RGE: Intel Core m3-7Y30, 11.60", 1 kg
Dış inceleme » Lenovo Yoga 710-11IKB-80V6001RGE
Dell Inspiron 11 3179: Intel Core m3-7Y30, 11.60", 1.4 kg
Dış inceleme » Dell Inspiron 11 3179
Acer Swift 7 SF713-51-M2SB: Intel Core i5-7Y54, 13.30", 1.1 kg
Dış inceleme » Acer Swift 7 SF713-51-M2SB
Asus Zenbook Flip UX360CA-C4171T: Intel Core m3-7Y30, 13.30", 1.3 kg
Dış inceleme » Asus Zenbook Flip UX360CA-C4171T
Cube Mix Plus: Intel Core m3-7Y30, 10.60", 0.7 kg
Dış inceleme » Cube Mix Plus
Dell XPS 13 9365-4544 2-in-1: Intel Core i7-7Y75, 13.30", 1.2 kg
Dış inceleme » Dell XPS 13 9365-4544 2-in-1
HP Pro x2 612 G2: Intel Core m3-7Y30, 12.10", 1.2 kg
Dış inceleme » HP Pro x2 612 G2
Lenovo ThinkPad X1 Tablet 2017: Intel Core m3-7Y30, 12.20", 1.1 kg
Dış inceleme » Lenovo ThinkPad X1 Tablet 2017
Dell XPS 13-9365 2-in-1: Intel Core i7-7Y75, 13.30", 1.2 kg
Dış inceleme » Dell XPS 13-9365
Acer Swift 7 SF713-51-M2LH: Intel Core i5-7Y54, 13.30", 1.1 kg
Dış inceleme » Acer Swift 7 SF713-51-M2LH
Acer Spin 7 SP714-51-M37P: Intel Core i7-7Y75, 14.00", 1.6 kg
Dış inceleme » Acer Spin 7 SP714-51-M37P
Asus Transformer 3 T305CA-GW019T: Intel Core m3-7Y30, 12.60", 0.7 kg
Dış inceleme » Asus Transformer 3 T305CA-GW019T
Acer Spin 7 SP714-51-M339: Intel Core i5-7Y54, 14.00", 1.3 kg
Dış inceleme » Acer Spin 7 SP714-51-M339
Dell XPS 13 2-in-1: Intel Core i5-7Y54, 13.30", 1.2 kg
Dış inceleme » Dell XPS 13 2-in-1
Acer Spin 7 SP714-51-M4YD: Intel Core i7-7Y75, 14.00", 1.3 kg
Dış inceleme » Acer Spin 7 SP714-51-M4YD
Asus Zenbook UX360CA-C4172T: Intel Core i5-7Y54, 13.30", 1.3 kg
Dış inceleme » Asus Zenbook UX360CA-C4172T
Acer Spin 7 SP714-51-M09D: Intel Core i5-7Y54, 14.00", 1.3 kg
Dış inceleme » Acer Spin 7 SP714-51-M09D
Acer Aspire R14 R7-471T-M613: Intel Core i7-7Y75, 14.00", 1.2 kg
Dış inceleme » Acer Aspire R14 R7-471T-M613
Asus Transformer 3 T305CA-GW015T: Intel Core m3-7Y30, 12.60", 0.7 kg
Dış inceleme » Asus Transformer 3 T305CA-GW015T
Acer Spin 7 SP714-51-M6LT: Intel Core i7-7Y75, 14.00", 1.6 kg
Dış inceleme » Acer Spin 7 SP714-51-M6LT
Acer Swift 7 SF713-51: Intel Core i5-7Y54, 13.30", 1.1 kg
Dış inceleme » Acer Swift 7 SF713-51